Content:
Presentation type:
HS – Hydrological Sciences

EGU24-9079 | Orals | MAL23-HS | Henry Darcy Medal Lecture

A view into the richness of processes in porous media 

Alberto Guadagnini

Flow and transport scenarios taking place in porous media are characterized by a staggering range of physical, chemical, and biological processes. The dynamics associated with these are distributed across an astonishingly wide range of (spatial and temporal) scales, thus contributing to the challenges related to their observation and description. Direct observation and attempts to a quantitative characterization of these processes indicate that they are prone to multiple interpretations, as rendered through various conceptual and mathematical formulations and their parameterization. Even the outcomes of apparently straightforward models of flow (or chemical transport) can surprise us! As complexity related to the formulation and parametrization of processes and their feedbacks increases, so does the need to establish approaches enabling us to quantify the effect of various types of uncertainty on target quantities of interest. For example, tackling the often strong (spatial) heterogeneity of parameters embedded in a model and coping with our limited ability to describe all of the relevant details of the porous medium hosting processes of interest poses significant challenges. In this broad context, I will initiate a discussion about uncertainties related to process formulation and parametrization and the way they can propagate to model outputs such as, e.g., water availability, solute concentrations, source protection regions, or reaction rates. The discussion is set in a framework encompassing experimental studies, characterization of porous media heterogeneity, sensitivity analysis for model diagnosis, and stochastic inverse modeling. Sensitivity analyses approaches are tackled with a focus on their ability to identify the relative importance of processes (and associated parameters) embedded in a model and driving system behavior. The ensuing results are then employed to inform model calibration under uncertainty. All of these aspects are exemplified through the analysis of settings related to three distinct scales. These comprise a regional scale complex aquifer system subject to diverse forcings, a laboratory scale scenario involving dynamics of pharmaceuticals in a porous medium, and direct observations of processes acting at nanoscales and governing material fluxes associated with chemical weathering related to rock dissolution. While these systems are associated with very different scales (and processes), their analysis is unified through the use of stochastic approaches sharing common traits and leading to similar workflows for uncertainty quantification.

How to cite: Guadagnini, A.: A view into the richness of processes in porous media, EGU General Assembly 2024, Vienna, Austria, 14–19 Apr 2024, EGU24-9079, https://doi.org/10.5194/egusphere-egu24-9079, 2024.

EGU24-6307 | Orals | MAL24-HS | John Dalton Medal Lecture

How far can we go in global flood inundation modelling? 

Paul Bates

Over the last fifteen years, hydrodynamic modelling has, like so many branches of hydrology, made the leap from local to global scales.  Where once we may have applied our models to single river reaches a few 10s of kilometres in length, we can now build and execute models at ~30m spatial resolution over the entire terrestrial land surface.  In turn, this has allowed us to address scientific and practical questions that were hitherto impossible to answer.  For example, global inundation modelling can help us understand and quantify large scale hydrological and biogeochemical cycles and many questions in flood risk management, for example decisions about future government spending on flood defences, analysing the solvency of flood insurance portfolios under extreme conditions, or determining climate change impacts, require predictions of flood risk at national, continental, or even global scales.

This paper therefore discusses the scientific developments that were needed to make this local-to-global transition possible and outlines what the latest generation of global inundation models now can (and cannot) do.  Finally, the paper looks at current limits to inundation modelling in terms of boundary conditions, flood defence data and model validation and considers the prospects for further improvements in model skill using the data from recently launched and forthcoming satellite missions such as SWOT and NISAR.

How to cite: Bates, P.: How far can we go in global flood inundation modelling?, EGU General Assembly 2024, Vienna, Austria, 14–19 Apr 2024, EGU24-6307, https://doi.org/10.5194/egusphere-egu24-6307, 2024.

Human-water feedbacks have been increasingly studied in the last decades, motivating the foundation of new disciplines such as socio-hydrology and, in general, enhanced interest toward conceptualization and modelling of the spatial and temporal dynamics of human-water systems. With anthropogenic activities being widely recognized as a major driver of global change and the human population being increasingly exposed to hydroclimatic extreme events, human systems are now at the forefront of the water cycle. Yet, human preferences, behaviors, and decisions in relation to water systems - including water usage dynamics, adoption of precautionary measures against climate extremes, and adaptation of urban landscapes - are often modelled based on behavioral or economic theories, or derived from small-scale samples. This often leads to heterogeneous results, which are often case-specific, or lack validation against real-world observations.

The availability of increasingly fine-resolution data from distributed sensors and databases (e.g., water consumption data from intelligent meters, flood insurance adoption records at the household level, and socio-demographic data) and earth observations (e.g., aerial and satellite imagery) provides us with an empirical basis to model heterogeneous individual and societal behavioral patterns, along with their determinants.

In my research, I strive to develop multi-disciplinary data-driven behavioral modelling approaches that bridge hydrologic/hydraulic sciences, informatics, economics, and systems engineering and harness information from multi-scale human data and earth observations and the power of data analytics and machine learning to better understand, model, and characterize human behaviors in coupled human-water systems. In this talk, I will first provide an overview of recent advances in descriptive behavioral modelling in human-water systems, with a focus on household-to-continental scale modelling of residential water consumption patterns and adoption of household flood insurance. Second, I will elaborate on modelling challenges that are motivating ongoing research related to machine learning-based behavioral models, including model explainability, data and computational requirements, generalization and scalability, and the influence of data resolution in time and space. Finally, I will discuss how developing descriptive models that learn human behaviors retrospectively can be used to inform forecasting tasks and formulate policy-relevant recommendations to shape future societal adaptation to climate change. Implications span from informing the design of feedback-based digital user engagement in pursuit of water conservation, to fostering proactive climate adaptation, addressing societal inequalities and heterogeneous water access and affordability conditions, or evaluating incentive programs and policies for sustainable urban development.

How to cite: Cominola, A.: Learning from the past to shape the future. Harnessing multi-scale human data and earth observations to foster sustainable water usage and societal adaptation to climate change, EGU General Assembly 2024, Vienna, Austria, 14–19 Apr 2024, EGU24-19445, https://doi.org/10.5194/egusphere-egu24-19445, 2024.

HS1.1 – Hydrology in Climate Change

EGU24-5377 | Orals | HS1.1.1

Modelling future water resources in interconnected water systems: are catchment scales relevant? 

Gemma Coxon, Anna Murgatroyd, Francesca Pianosi, Saskia Salwey, Doris Wendt, and Yanchen Zheng

Freshwater resources are increasingly under threat from climate change and increasing water demand. Catchment-scale hydrological models generate hydrological projections that underpin the management and sustainability of future water resources. Yet, water systems are increasingly interconnected across catchment boundaries through nationally strategic water supply schemes that aim to ensure a reliable supply of water in a changing climate.

In this presentation, we draw on a range of studies from across Great Britain to discuss the challenges and complexities of hydrological modelling for future water resources management from catchment to national scales. We focus on interconnected water systems including catchments impacted by (1) inter-catchment groundwater flows and (2) water transfers via reservoirs, abstractions and wastewater treatment plants. For the human-impacted catchments, we identify where and when representing human interactions are important for robust streamflow projections. As water systems become more interconnected in space and time, we highlight the need to move beyond the catchment scale for future water resources management.

How to cite: Coxon, G., Murgatroyd, A., Pianosi, F., Salwey, S., Wendt, D., and Zheng, Y.: Modelling future water resources in interconnected water systems: are catchment scales relevant?, EGU General Assembly 2024, Vienna, Austria, 14–19 Apr 2024, EGU24-5377, https://doi.org/10.5194/egusphere-egu24-5377, 2024.

EGU24-6684 | Orals | HS1.1.1 | Highlight

The (ir)relevance of plot- and hillslope scale processes for catchment runoff 

Ilja van Meerveld

Experimental field studies are crucial to understanding hydrological processes. Studies at the plot-, hillslope-, or small catchment-scales have helped us to understand how water flows toward the stream network of larger catchments. However, little of this detailed knowledge is used in hydrological models because the calibration of simple models already leads to good runoff simulations. Furthermore, not all hillslope locations contribute equally to catchment runoff and in some cases, hillslopes or specific hillslope locations may seem irrelevant for the catchment scale runoff response, at least until a certain threshold is crossed. It is essential to consider these thresholds because climate or land use change may cause them to be passed more frequently in the future, so models based on historic runoff data might no longer accurately predict the catchment runoff response. In this talk, I will provide examples of such thresholds and discuss the need to consider connectivity between landscape elements when interpreting the streamflow or stream chemistry response at the catchment scale. In doing so, I will highlight the need to understand hydrological processes at the plot and hillslope scales for predicting catchment-scale runoff, even if these processes may seem irrelevant at first.

How to cite: van Meerveld, I.: The (ir)relevance of plot- and hillslope scale processes for catchment runoff, EGU General Assembly 2024, Vienna, Austria, 14–19 Apr 2024, EGU24-6684, https://doi.org/10.5194/egusphere-egu24-6684, 2024.

Contrary to widespread belief, it is well known since ancient Greece that rivers flow most of the time because they receive groundwater discharge. However, it is less widely known that rivers are losing their base flow because of aquifer overexploitation and, even less, the intimate link between ground and surface water processes. I review the processes that control water quality, from pore scale biofilms to hyporheic exchange, and runoff generation. While there is a broad understanding of these processes, I argue that the way they are represented in models is poor. As a result, water management and regulations tend to ignore them. Specifically, managed aquifer recharge is currently hindered by EU regulations. Yet, it remains the only practical management strategy to reverse groundwater (and, thus, the loss of river base flow and ecosystem services). I find it paradoxical that, while a lot of effort is devoted to global "accounting", we are deemphasizing the river basin scale, within which most water management relevant processes occur (ironically, the only management relevant trans-basin processes, i.e., the recycling of moisture, is equally ignored). I conclude for a renewal od the old call for close interaction between surface and groundwater hydrologists.

How to cite: Carrera, J.: From the pore to the catchment-scale: a discussion of groundwater processes and modelling, EGU General Assembly 2024, Vienna, Austria, 14–19 Apr 2024, EGU24-20252, https://doi.org/10.5194/egusphere-egu24-20252, 2024.

Groundwater is the largest accessible freshwater resource on earth and is critical for people and the environment. In many regions around the world, sectoral water demands exceed the availability of surface water and groundwater is being pumped. Irrigation stands out as the largest groundwater user worldwide, with ca. 40% of current irrigated agriculture relying on groundwater. In many heavily irrigated regions, groundwater abstractions surpass replenishment, resulting in often severely declining groundwater levels. This leads to groundwater depletion, reduced streamflow, drying of wells and springs, land subsidence, saltwater intrusion, and deteriorating surface water quality due to reduced pollutant dilution.

In the coming decades, global food demands will increase, driven by a growing world population and socio-economic development. A major challenge lies ahead in how to sustainably ensure sufficient regionally and globally available food. It is inevitable that agriculture will increasingly rely on groundwater to support the required increase in crop production, but the extent to which this groundwater can be extracted sustainably from a quantity and quality perspective is still largely unknown.

In this talk, the latest advances in our model development will be presented, focussing specifically on linking groundwater dynamics, surface water interactions, and crop production at both global and regional scales. A specific focus lies on connecting global and regional scales and approaches to better understand the impacts and trade-offs related to global change. In addition, attention will be given to the development of regionally relevant adaptation strategies for sustainable groundwater use worldwide. 

How to cite: de Graaf, I.: Navigating global challenges: development and application of a coupled groundwater and crop growth model, EGU General Assembly 2024, Vienna, Austria, 14–19 Apr 2024, EGU24-20946, https://doi.org/10.5194/egusphere-egu24-20946, 2024.

EGU24-618 | ECS | PICO | HS1.1.2

Climate Change Impact Assessment on Hydrological response of Tawa Basin for Sustainable Water Management  

Pragya Badika, Akash Singh Raghuvanshi, and Ankit Agarwal

Sustainable water resources planning and management is critical in fulfilling the demands of present and future generation in limiting environment. River basins plays a crucial role in balanced and responsible management strategies, as they frequently serve vital role in freshwater supply, irrigation, hydropower generation, industrialization and to support a balance ecosystem. In the era of climate change and adverse environmental impacts, it is required to prioritize assessment for sustainable development and management of river basins to ensure a resilient water system. In this study, the Tawa Basin has been selected which is one of the important tributary of Narmada Basin and has a paramount importance in irrigation and hydropower generation. From a hydrological standpoint, basin response to climate change is critical for analysing hydrological extremes and developing long-term plans and strategies for water-related activities and policies. The basin experiences significant rainfall fluctuation throughout the year, particularly during the monsoon season (June to September) which adversely influence the runoff generation in the basin and consequently, the likelihood of catastrophic occurrences. However, the hydrological response of Tawa basin to climate change has been rarely investigated under socio-economic pathways. Present work sought to evaluate the hydrological response of Tawa basin under changing climate using Coupled Model Inter-comparison Project (CMIP6) scenarios. In this study, a comparative assessment has been done with the application of two conceptual lumped hydrological model to ensure the robustness of the Hydrological model. For this, the MIKE 11 NAM and GR4J model has been set up for period of 2009 to 2021. The model is calibrated at the downstream of the Tawa reservoir using the water balance at reservoir scale. For climate change assessment, the latest CMIP6 outputs has been incorporated for two shared socio-economic pathways; SSP2-45 and SSP5-85 for near (2040-2060) and far (2070-2100) future. In addition, evaluation was performed using the individual and ensemble output of climate models to ensure the uncertainty in hydrological responses. The findings of this study are critical for understanding how climate change will alter the hydrology of the Tawa River Basin. This research might lead to the adoption of a strategic strategy for sustainable water resources and improved societal resilience to climate change in the Tawa River Basin.

How to cite: Badika, P., Raghuvanshi, A. S., and Agarwal, A.: Climate Change Impact Assessment on Hydrological response of Tawa Basin for Sustainable Water Management , EGU General Assembly 2024, Vienna, Austria, 14–19 Apr 2024, EGU24-618, https://doi.org/10.5194/egusphere-egu24-618, 2024.

EGU24-858 | ECS | PICO | HS1.1.2

Addressing Nonstationarity in Extreme Rainfall Patterns: A Case Study on Indian Cities 

Ankush Ankush, Narendra Kumar Goel, and Vinnarasi Rajendran

The evolving landscape of extreme rainfall patterns, triggered by climate change and global warming, introduces nonstationary behavior, challenging conventional hydrologic design assumptions rooted in stationarity. This study addresses this paradigm shift by modeling distribution parameters with covariates, utilizing a 70-year high-resolution IMD gridded dataset to extract and model extreme annual rainfall across diverse Indian cities. Drawing on previous research and goodness-of-fit tests that favor the Generalized Extreme Value (GEV) distribution for modeling extremes, the study incorporates various indices, including Nino3.4, dipole mode index, global and local temperature and time, to characterize nonstationarity in extreme annual rainfall, leveraging climate cycles and global warming trends. Performance assessment utilizes the Akaike information criterion and Likelihood ratio test, while quantile reliability is scrutinized through confidence intervals (CIs). The findings uncover widespread nonstationary trends in most grid points, resulting in broader CIs for estimated quantiles, return periods, and covariates in fitted models. Despite the broader confidence bands associated with nonstationary conditions, indicating higher uncertainty, the results affirm a nonstationary pattern in rainfall extremes. Consequently, the study underscores the imperative to develop nonstationary models that effectively capture these dynamic trends with reduced uncertainty.

How to cite: Ankush, A., Goel, N. K., and Rajendran, V.: Addressing Nonstationarity in Extreme Rainfall Patterns: A Case Study on Indian Cities, EGU General Assembly 2024, Vienna, Austria, 14–19 Apr 2024, EGU24-858, https://doi.org/10.5194/egusphere-egu24-858, 2024.

In the Slovakia for assessment of climate change is used as references period hydrological years 1981 - 2010. Although the first observations in groundwater began in 1956, the monitoring network was not dense enough and the objects were not evenly distributed in Slovakia. Even the expansion of monitoring network in the 1970s was not enough to obtain longer, 30-year time series. Based on the new reference period 1991 - 2020 recommended by the World Meteorological Organization WMO, this period was also evaluated from the point of view of groundwater. The aim of the contribution was to compare reference periods 1981 – 2010 and 1991 - 2020 and their changes in the groundwater in Slovakia. These two reference periods were compared with each other based on the ratio values of long-term time series of minimum and average values of the groundwater level and springs yield. The new reference period 1991 - 2020 and period 1981 - 2010 were also evaluated by trend analysis using the non-parametric Mann-Kendall test. The Mann-Kendall statistical test was use to assess whether a set of data values is increasing or decreasing over time and whether the trend in either direction is statistically significant. The Mann-Kendall test does not assess the magnitude of change. The advantage of this test is, that it is not affected by the current distribution of the data and at the same time is less sensitive to extreme values in the time series.

                The long-term average values of the groundwater level and the springs yield for the period 1991 - 2020 compared to 1981 - 2010 were lower in the outer West and Northwest, in the Northern parts of Slovakia, in the region of central Slovakia, and in the Southeast and outer East. Based on the comparison of the long-term minimum values of the compared periods, the values were steady in compared to the previous period at most of the evaluated objects.

                When evaluating the trends of long-term averages for the period 1991 - 2022, significant decreases in the average groundwater level and springs yield were detected in the outer West and Northwest, in the strip from Northern to central Slovakia, in the North of Eastern Slovakia, and in the Southeast and outer east of the territory. When evaluating the trends of long-term minima for the period of hydrological years 1991 - 2022, the situation was similar to the evaluation of long-term averages.

                By comparing the period of 30 annual series 1991 - 2020 to the period 1981 - 2010 based on the evaluated ratio values, we did not notice significant deviations.


Keywords: groundwater, spring yield, references periods

How to cite: Kurejova Stojkovova, M. and Slivova, V.: Comparison of the reference periods of the hydrological years 1981 - 2010 and 1991 - 2020 in groundwater in Slovakia, EGU General Assembly 2024, Vienna, Austria, 14–19 Apr 2024, EGU24-1424, https://doi.org/10.5194/egusphere-egu24-1424, 2024.

EGU24-1920 | PICO | HS1.1.2 | Highlight

Future drought changes in Australia from multiple projections 

Anna Ukkola, Elisabeth Vogel, Steven Thomas, Ulrike Bende-Michl, Andy Pitman, and Gab Abramowitz

Australia suffers from frequent droughts but future drought changes have remained stubbornly uncertain over the continent, with CMIP projections indicating low model agreement across most regions. Here we constrain future changes in drought over Australia by combining a hierarchy of projections from coupled global and regional climate models and several offline hydrological models that are widely employed in Australia. We analyse changes across multiple types of droughts (meteorological, hydrological and agricultural) to understand robustness of trends across drought types. Using this multi-projections approach, we identify robust future increases in drought across key agricultural and densely populated regions that are consistent across different drought types. Our study demonstrates value in analysing multiple projections together to build confidence in future changes in other regions of the world where model uncertainty is high.

How to cite: Ukkola, A., Vogel, E., Thomas, S., Bende-Michl, U., Pitman, A., and Abramowitz, G.: Future drought changes in Australia from multiple projections, EGU General Assembly 2024, Vienna, Austria, 14–19 Apr 2024, EGU24-1920, https://doi.org/10.5194/egusphere-egu24-1920, 2024.

The change of groundwater storage (GWS) on the Tibetan Plateau (TP) is vital for water resources management and regional sustainability, but its estimation has large uncertainty due to insufficient hydrological measurements and diverse future climate scenarios. Here, we employ high-resolution land surface modeling, advanced satellite observations, global climate model data, and deep learning to estimate GWS changes in the past and future. We find a 3.51±2.40 Gt yr-1 increase in GWS from 2002–2018, especially in exorheic basins, attributed to glacier melting. The GWS will persistently increase in the future, but the growth rate is slowing down (0.14 Gt yr-1 for 2079–2100). Increasing GWS is projected over most endorheic basins, which is associated with increasing precipitation and decreasing shortwave radiation. In contrast, decreasing GWS is projected over the headwaters of Amu Darya, Yangtze, and Yellow river basins. These insights have implications for sustainable water resource management in a changing climate.

How to cite: Wang, L. and Jia, B.: The slowdown of increasing groundwater storage in response to climate warming in the Tibetan Plateau, EGU General Assembly 2024, Vienna, Austria, 14–19 Apr 2024, EGU24-2331, https://doi.org/10.5194/egusphere-egu24-2331, 2024.

Large-scale revegetation presents a new set of challenges by augmenting water consumption in arid regions, despite its positive impact on ecosystems. In water-stressed areas, where precipitation is the primary source of water, extensive afforestation may disrupt the balance between water supply and demand. Consequently, it is crucial to assess the maximum extent of vegetation coverage and productivity that can be sustained by rainwater resources. Our study characterizes the sustainability of revegetation by determining the upper limit of the leaf area index (LAI) supported by rainwater resources. The research focuses on the Loess Plateau (LP), a region known for both large-scale vegetation restoration and severe water shortages. The upper limit on LAI is computed based on evapotranspiration (ET) supported by rainwater resources, utilizing an optimized Shuttleworth-Wallace (S-W) model that incorporates dynamic vegetation and carbon dioxide components. Carbon sequestration capacity and efficiency are compared between the maximum and actual vegetation scenarios using an analytical water use efficiency (WUE) model. Both models exhibit good performance and align with empirical observations. Results indicate that under the maximum vegetation scenario, the LAI is 11.5% higher than the actual scenario when vegetation on the LP is restored to its maximum level. The average gross primary productivity under the maximum vegetation scenario surpasses the actual scenario by 25.0%, with a 17.9% increase in ecosystem WUE. It is important to note that the maximum scenario represents a theoretical upper limit based on ideal assumptions. The findings emphasize that enhancing rainwater utilization efficiency can unlock the potential for sustainable vegetation restoration, improving its efficiency. This study provides valuable guidance and theoretical support for planning vegetation restoration in water-scarce regions.

How to cite: Zhang, B., Tian, L., and Li, Y.: Estimating the maximum vegetation coverage and productivity capacity supported by rainwater resources on the Loess Plateau, EGU General Assembly 2024, Vienna, Austria, 14–19 Apr 2024, EGU24-2402, https://doi.org/10.5194/egusphere-egu24-2402, 2024.

EGU24-2953 | PICO | HS1.1.2

Intensified Structural Overshoot Aggravates Drought Impacts on Dryland Ecosystems 

Liu Liu, Yixuan Zhang, Yongming Cheng, Qiang An, and Shaozhong Kang

A favorable environment can induce vegetation overgrowth to exceed the ecosystem carrying capacity, exacerbating water resource depletion and increasing the risk of lagged effects on vegetation degradation. This phenomenon is defined as structural overshoot, which can lead to large-scale forest mortality and grassland deterioration. However, the current understanding of structural overshoot remains incomplete due to the complex time-varying interactions between vegetation and climate. Here, we used a dynamic learning algorithm to decompose the contributions of vegetation and climate to drought occurrence, trace the connection between antecedent and concurrent vegetation dynamics, thus effectively capturing structural overshoot. This study focused on the climate-sensitive hotspot in Northwest China drylands, where significant vegetation greening induced by a warming and wetting climate was detected during 1982–2015, leading to soil moisture deficit and aggravating vegetation degradation risks during droughts. We found that during this period, structural overshoot induced approximately 34.6% of the drought events, and lagged effects accounted for 16.7% of the vegetation degradation for these overshoot drought events. The occurrence of overshoot droughts exhibited an increasing trend over time, which was primarily driven by vegetation overgrowth followed by precipitation variation. Although the severity of overshoot and non-overshoot droughts were generally comparable in spatial distribution, the impact of overshoot droughts is still becoming increasingly obvious. Our results indicate that the expected intensified overshoot droughts cannot be ignored and emphasize the necessity of sustainable agroecosystem management strategies.

How to cite: Liu, L., Zhang, Y., Cheng, Y., An, Q., and Kang, S.: Intensified Structural Overshoot Aggravates Drought Impacts on Dryland Ecosystems, EGU General Assembly 2024, Vienna, Austria, 14–19 Apr 2024, EGU24-2953, https://doi.org/10.5194/egusphere-egu24-2953, 2024.

EGU24-3504 | ECS | PICO | HS1.1.2

Reversal of Precipitation Trend in Hothouse Climates 

Jiachen Liu, Jun Yang, Feng Ding, Gang Chen, and Yongyun Hu

Hydrologic cycle has wide impacts on the ecosystem, atmospheric circulation, ocean salinity and circulation, and carbon and nitrogen cycles. Under anthropogenic global warming, previous studies showed that the intensification of the hydrologic cycle is a robust feature. Whether this trend persists in hothouse climates, however, is unknown. Here we show that mean precipitation first increases with surface temperature, but it decreases with surface warming when the surface is hotter than ~320-330 K. This non-monotonic phenomenon is robust to the warming trigger, convection scheme, ocean dynamics, atmospheric mass, planetary rotation, gravity, and stellar spectrum. The weakening is because of the existence of an upper limitation of outgoing longwave emission and the continuously increasing shortwave absorption by H2O, and is consistent with the strong increase of atmospheric stratification and dramatic reduction of convective mass flux. Our results have wide implications for the climates and evolutions of Earth, Venus, and potentially habitable exoplanets.

How to cite: Liu, J., Yang, J., Ding, F., Chen, G., and Hu, Y.: Reversal of Precipitation Trend in Hothouse Climates, EGU General Assembly 2024, Vienna, Austria, 14–19 Apr 2024, EGU24-3504, https://doi.org/10.5194/egusphere-egu24-3504, 2024.

Changes in future climate are inevitable, strongly impacting water resources and their adaptation strategies. Northern Peru currently faces water scarcity issues, significantly limiting activities such as agriculture, a key economic and social pillar for the region. In addition, there are pronounced fluctuations in precipitation due to the effects of the El Niño phenomenon (ENSO), along with scarcity of information regarding various climatic variables in terms of quantity and quality, making it challenging to accurately account for the resources available for proper management.

Therefore, this research aims to, through cluster analysis, assess the importance of various variables such as elevation, precipitation, maximum and minimum temperature and stationarity index, for the period 1972-2015, in determining the hydrologically homogeneous regions currently present in the sub-basins of the northern region. Various multivariate cluster methods such as hierarchical clustering, partitioning around medoids (PAM), and K-means have been used for this purpose. To assess the validity of the analysis, Hopkins statistics and visual inspection methods were employed. Additionally, various validation tests, including internal and stability measures, were applied to evaluate the effectiveness of the cluster algorithm results. Alongside this analysis, a trend study of precipitation has been conducted, helping identify regions that may be experiencing changes in their rainfall patterns. This trend study was performed using the non-parametric Mann-Kendall test on the 49 stations located in the region. The same procedure was also applied to climate models with projections of precipitation and maximum and minimum temperatures up to the year of 2100 to understand the future behavior due to climate change.

Comparing hydrologically homogeneous regions and potential trend changes found between the current and future climate change situations would help identify potential areas where the analyzed climatic variables undergo significant changes. This would aid in identifying potential adaptation measures, since these variables are crucial for determining water availability.

How to cite: Chavez, A., Quevedo, V., Bravo, D., and Chapilliquen, D.: Evaluating the impact of climate change in Northern Peru by analyzing homogeneous regions based on different climate variables and precipitation trend changes., EGU General Assembly 2024, Vienna, Austria, 14–19 Apr 2024, EGU24-3690, https://doi.org/10.5194/egusphere-egu24-3690, 2024.

Reservoirs have made significant contributions to human access and management of surface water resources, as well as to the production of clean energy, thus playing a vital role in alleviating the water crisis and decarbonizing energy systems through hydropower generation. The rapid growth in reservoir construction has led to an increase in the surface water area, consequently escalating evaporative water losses. As a crucial component of water cycle, most estimation methods for evapotranspiration focus on the land surface, with a relatively rough estimate of the significant evaporation loss from open surface water. Meanwhile, limited by the availability of reservoir geographic information and monthly area series data, there is still a lack of comprehensive and accurate estimation of reservoir evaporation losses. As the country with the largest number of dams in the world, it is necessary to accurately estimate China's surface water evaporation losses associated with its prosperous and developing dam construction. Here, we used the China Reservoir Dataset and LandSAT based Global Surface Water Dataset to reconstruct the monthly area series of 4874 reservoirs in China from 1984 to 2020, and further considering the heat storage of water bodies, the monthly evaporation losses of these reservoirs from 1988 to 2018 were estimated. The results indicate that the average annual evaporation volume of these 4874 reservoirs is 18.55 × 10⁹ m3, equivalent to 31% of the total domestic water consumption of China (in 2021). During the research period, the evaporation rate shows a significant growth trend (p < 0.05, 0.15km3/year), attributed to the upward trend in evaporation rate (p < 0.05, 0.0046 mm/d/year) and total reservoir area (p < 0.05). The differences in economic development level and reservoir size result in significant spatial heterogeneity in the evaporation loss trend in different regions. The results can serve as a useful reference for water resources management and sustainable utilization.

How to cite: Zhu, Y. and Ye, A.: Estimation of Reservoir Evaporation Water Loss in Inland China over the Past 30 Years, EGU General Assembly 2024, Vienna, Austria, 14–19 Apr 2024, EGU24-3901, https://doi.org/10.5194/egusphere-egu24-3901, 2024.

EGU24-4014 | PICO | HS1.1.2 | Highlight

Mapping of climate to flood extremes in the European Alps: a multidisciplinary approach 

Alberto Viglione, Enrico Arnone, Susanna Corti, Olivia Ferguglia, Ignazio Giuntoli, Jost  von Hardenberg, Luca Lombardo, Paola Mazzoglio, and Elisa Palazzi

As our climate system climbs through its current warming path, temperature and precipitation are greatly affected also in their extremes and there is a general concern about the effects on river floods. While a wide body of literature on the detection of flood changes is available, the identification of their underlying causes (i.e. flood change attribution) is still debated. In this work, we aim at better understanding how floods of different kind are related to climate extremes (of precipitation and temperature) and how these extremes are related to large scale predictors (e.g. climate oscillations, teleconnections). The study area is the Greater Alpine Region, which is an ideal laboratory for analysing complex effects of climate on floods because of the interplay of heavy precipitation and snow processes in controlling flood generation, and also because the European Alps divide the Mediterranean and Continental Europe with different responses to climate oscillations. Through a novel integrated modeling chain, we aim at identifying the climate extreme indices that better relate to river floods, the large-scale climate phenomena controlling their dynamics, their expected modifications due to climate change and the associated uncertainties. The research plan of a multidisciplinary team of climatologists and hydrologists will be presented together with preliminary results. We believe that this research will strengthen our knowledge on flood risk in the future and contribute to improve existing methods for disaster risk assessment and management.

How to cite: Viglione, A., Arnone, E., Corti, S., Ferguglia, O., Giuntoli, I.,  von Hardenberg, J., Lombardo, L., Mazzoglio, P., and Palazzi, E.: Mapping of climate to flood extremes in the European Alps: a multidisciplinary approach, EGU General Assembly 2024, Vienna, Austria, 14–19 Apr 2024, EGU24-4014, https://doi.org/10.5194/egusphere-egu24-4014, 2024.

Long-term extending cultivation activities resulted in the world’s worst soil erosion on the Chinese Loess Plateau. By converting cropland into vegetated land, the Grain for Green Project (GfGP)—the world’s largest investment revegetation project—effectively alleviates the soil erosion on the  Loess Plateau. However, during the GfGP implementation, the positive effect of cropland to the revegetation and soil erosion control has been underestimated to date, hindering a comprehensive evaluation to the effect of cropland on ecological restoration. Here, we evaluated the effect of the GfGP on soil erosion control across the  Loess Plateau, analyzed the dominant driver of the  Loess Plateau vegetation greening, and further identified the contributions of croplands to this world’s largest revegetation project. We found that the vegetation of the  Loess Plateau was significantly improved and its leaf area increased by 1.23 × 10⁵ km2 after the implementation of the GfGP, which contributed 42% to the decrease of the  Loess Plateau soil loss. Among them, our results show that cropland contributed 39.3% to the increased leaf areas of the  Loess Plateau, higher than grassland (36.3%) and forestland (14.3%). With the reduction of agricultural area, the contribution of cropland to the increased leaf areas in the  Loess Plateau was still the largest, which was mainly due to the increase in cropland utilization intensity. This study highlights the significance of the GfGP in soil erosion control and revises our understanding of the role of cropland in ecological restoration and society development.

How to cite: Lan, X. and Liu, Z.: Land-use Intensity Reversed the Role of Cropland in Ecological Restoration over the World's Most Severe Soil Erosion Region, EGU General Assembly 2024, Vienna, Austria, 14–19 Apr 2024, EGU24-4397, https://doi.org/10.5194/egusphere-egu24-4397, 2024.

EGU24-5467 | ECS | PICO | HS1.1.2

The AAU Calibration and Data Assimilation (CDA) approach for improving large-scale hydrological models in a changing climate 

Maike Schumacher, Leire Retegui Schiettekatte, Fan Yang, and Ehsan Forootan

Extreme events such as floods and droughts are expected to become more frequent and intense due to the changing climate. However, it is still a challenge to monitor, understand, simulate, and anticipate the underlying hydrological processes. Large scale hydrological models and remote sensing observations (such as surface soil moisture from SMOS, SMAP and Sentinel, as well as total water storage changes (TWSC) from the GRACE and GRACE-FO gravity missions) provide a unique large-scale to global view on the changing hydrology. Sequential Calibration and Data Assimilation (CDA) provides opportunities to combine benefits from both, modelling and observing, and thus helps to improve our understanding of the impact of the climate change on water resources.

In this study, we present how the careful and consistent processing of GRACE/-FO data including a consistent estimation of the full error covariance matrix to represent the typical spatially correlated error structure supports the assimilation of satellite data into large-scale hydrological models. The first case study will tackle the question of selecting an appropriate multi-sensor data assimilation approach to combat the temporal and spatial resolution mismatch between data and model for high-dynamic frequencies. For this, daily GRACE data are assimilated for the Brahmaputra Basin that was subject to major floods, e.g., in 2004, 2007 and 2012. A reconstruction of these flood events allows a better understanding of the benefits and limitations of large-scale hydrological CDA in a changing climate. The second case study focuses on quantifying human-induced impacts on surface and groundwater storages under prolonged and intense droughts. Here, we assimilate two decades of monthly GRACE/-FO data for the Murray-Darling Basin, Australia, to better understand the impact of dry climatological conditions on our water resources.

How to cite: Schumacher, M., Retegui Schiettekatte, L., Yang, F., and Forootan, E.: The AAU Calibration and Data Assimilation (CDA) approach for improving large-scale hydrological models in a changing climate, EGU General Assembly 2024, Vienna, Austria, 14–19 Apr 2024, EGU24-5467, https://doi.org/10.5194/egusphere-egu24-5467, 2024.

The impact of climate change and human activities poses significant challenges in the tropical region of Southeast Asia, specifically within the Mun-Chi River Basin, the largest tributary of the Mekong River in Thailand. The bias-corrected MPI-ESM1-2-LR, the most appropriate Global Climate Model (GCM) under the Coupled Model Intercomparison Project Phase 6 (CMIP6) for projecting Mun-Chi River flow, represent future climate variations in the basin. The analysis reveals forthcoming transformations in future land use, with cropland areas transitioning into forests and urban areas. The projected annual streamflow contributing to the Lower Mekong River is expected to increase by 1.14% to 3.49% in 2023-2035 and 1.84% to 4.26% in 2036-2050, with 67.17% attributed to climate change and 32.83% to land-use change. Temporal variations in the future flow regime reveal a wetter wet season and a drier dry season in this catchment. During the wet season, streamflow is projected to rise by 4.97% to 17.67% in 2023-2035 and 9.97% to 24.08% in 2036-2050. In contrast, the dry season is expected to experience a decrease of -2.69% to -9.15% in 2023-2035 and -6.28% to -17.10% in 2036-2050. These seasonal contrasts suggest a potential increase in extreme hydrological events, presenting challenges for efficient water resource management in this watershed and downstream countries. Consequently, effective water regulation and land-use policies are deemed crucial for sustainable management in the Mun-Chi River Basin.

How to cite: Inseeyong, N. and Xu, M.: Impacts of Climate and Land use Changes on Streamflow in the Mun-Chi River Basin, the Largest Tributary of the Mekong River, EGU General Assembly 2024, Vienna, Austria, 14–19 Apr 2024, EGU24-6428, https://doi.org/10.5194/egusphere-egu24-6428, 2024.

The estimation of actual evapotranspiration (ET) using both rescaled and non-rescaled complementary relationship (CR) models has become a hotspot in the research on terrestrial ET. This study explores the relationship between these two CR models and improves the method for calculating xmin in rescaled CR models. The rescaled and non-rescaled CR models can be functionally interconvertible, i.e., the non-rescaled CR model enables the rescaled simulation of ET and the rescaled CR model can also conduct a non-rescaled simulation. The parameter b or c in the non-rescaled CR models plays a role similar to xmin in the rescaled models. Based on the data from 15 catchments in the Loess Plateau of China, we validate this relationship between the two CR models. Meanwhile, we evaluate the formulation for xmin proposed by Crago et al. (2016) (the Crago’s xmin values) and the results show that the range of variation for the Crago’s xmin values is smaller than that for the xmin values obtained by inverse method from the models (the inversed xmin values) in the interannual process. The inversed xmin values of RCR-C2016 are mostly larger than that of RCR-S2017, while the Crago’s xmin values are in between these two values. The empirical function for xmin is developed using the aridity index (AI) and normalized difference vegetation index (NDVI) as independent variables in the interannual fluctuations. On the mean annual scale, the empirical function for xmin is expressed only using the AI. Cross-validation results show that the rescaled CR models combined with xmin determined by the empirical functions can more accurately estimate ET and simulate its interannual and spatial changes. (Supported by Project 41971049 of NSFC)

How to cite: Mu, Z., Liu, W., Ma, N., Cheng, C., and Zhou, H.: Relations of rescaled to non-rescaled complementary models and improvement of evapotranspiration estimates by incorporating both climatic and land surface conditions, EGU General Assembly 2024, Vienna, Austria, 14–19 Apr 2024, EGU24-6983, https://doi.org/10.5194/egusphere-egu24-6983, 2024.

EGU24-7046 | PICO | HS1.1.2 | Highlight

Global models overestimate streamflow induced by rising CO2 

Haoshan Wei, Yongqiang Zhang, Changming Liu, and Qi Huang

The global streamflow plays a crucial role in the broader water cycle, intricately linked to human activities, ecology, and agriculture. The rise in atmospheric CO2 has complex effects on global streamflow. In addition to feedbacks to climate change, CO2 impacts on streamflow result from surface changes, including reduced streamflow induced by expanding vegetation and increased streamflow induced by reduced vegetation evapotranspiration due to stomatal closure. Global models, vital for policy planning, predict increased streamflow due to dominant positive impacts of elevated CO2. More than 10 out of 14 global dynamic vegetation models concluded that increased CO2 exacerbated runoff growth over the 1981-2020 period, especially in tropical and temperate regions. Yet, studying four decades of observed streamflow data, we find these models largely overestimate the increase in streamflow induced by elevated CO2, particularly in tropical forest (tropical) and cold forest (cold), pointing to an unexpectedly drier world.

How to cite: Wei, H., Zhang, Y., Liu, C., and Huang, Q.: Global models overestimate streamflow induced by rising CO2, EGU General Assembly 2024, Vienna, Austria, 14–19 Apr 2024, EGU24-7046, https://doi.org/10.5194/egusphere-egu24-7046, 2024.

In order to compare the impacts of the choice of land surface model (LSM) parameterization schemes, meteorological forcing, and land surface parameters on land surface hydrological simulations, and explore to what extent the quality can be improved, a series of experiments with different LSMs, forcing datasets, and parameter datasets concerning soil texture and land cover were conducted. Six simulations are run for mainland China on 0.1o×0.1o grids from 1979 to 2008, and the simulated monthly soil moisture (SM), evapotranspiration (ET), and snow depth (SD) are then compared and assessed against observations. The results show that the meteorological forcing is the most important factor governing output. Beyond that, SM seems to be also very sensitive to soil texture information; SD is also very sensitive to snow parameterization scheme in the LSM. The Community Land Model version 4.5 (CLM4.5), driven by newly developed observation-based regional meteorological forcing and land surface parameters (referred to as CMFD_CLM4.5_NEW), significantly improved the simulations in most cases over mainland China and its eight basins. It increased the correlation coefficient values from 0.46 to 0.54 for the SM modeling and from 0.54 to 0.67 for the SD simulations, and it decreased the root-mean-square error (RMSE) from 0.093 to 0.085 for the SM simulation and reduced the normalized RMSE from 1.277 to 0.201 for the SD simulations. This study indicates that the offline LSM simulation using a refined LSM driven by newly developed observation-based regional meteorological forcing and land surface parameters can better model reginal land surface hydrological processes.

How to cite: Liu, J., Jia, B., and Xie, Z.: Elucidating Dominant Factors Affecting Land Surface Hydrological Simulations of the Community Land Model over China, EGU General Assembly 2024, Vienna, Austria, 14–19 Apr 2024, EGU24-7416, https://doi.org/10.5194/egusphere-egu24-7416, 2024.

The elevated CO2 concentration in the atmosphere has warmed the planet and modified the global precipitation pattern. Typical impact studies that investigate the regional hydrological response to climate change is based on the hydrological models forced by climate model projections. However, the physiological CO2 effects of plants that manifests as reduced transpiration via partially closed leaf stomata and enhanced photosynthesis is often overlooked in these impact studies. 
 
Here, the potential impact of the physiological CO2 effects on hydrological trends in France over the 21st century is assesed using the validated high-resolution Organising Carbon and Hydrology in Dynamic Ecosystems (ORCHIDEE) land surface model (Huang et al., 2023). The ORCHIDEE land surface model is forced with 4 regionalized climate projections narrowed from the CMIP5 ensemble projection under the RCP 8.5 scenario, with which we test the effect of two atmospheric CO2 conditions: a constant CO2 level of year 2005 and an increasing CO2 concentration of the RCP 8.5. 
 
We find that the physiological CO2 effects result in a decrease of evapotranspiration and an increase of total runoff over France for the 4 projections. Therefore, the physiological CO2 effects enhance the increasing trend of river discharges in wet projections and alleviate the decreasing trend of river discharges in dry projections over the 21st century. Despite the model uncertainties, our study confirms the important physiological CO2 effects on French water availaibility in the future, and this result likely holds at a broader scale.

How to cite: Huang, P. and Ducharne, A.: The impact of increasing atmosphere CO2 concentration on hydrological trends in France over the 21st century, EGU General Assembly 2024, Vienna, Austria, 14–19 Apr 2024, EGU24-7788, https://doi.org/10.5194/egusphere-egu24-7788, 2024.

EGU24-7987 | ECS | PICO | HS1.1.2 | Highlight

Multi-decadal change in global rainfall interception and its drivers 

Feng Zhong, Shanhu Jiang, Akash Koppa, Liliang Ren, Yi Liu, Menghao Wang, and Diego G. Miralles

Rainfall interception loss (Ei) is one of the biggest unknowns in the global hydrological cycle. As a dynamic process, Ei depends on vegetation structure and canopy characteristics, but also on the precipitation and (micro)climatic conditions that determine the atmospheric demand for water. The spatial variability of these factors makes it difficult to reliably estimate Ei over large scales, and its sensitivity to non-stationary climate variability renders Ei trends highly uncertain. In this regard, process-based formulations accounting for key biophysical and climatic factors provide unique opportunities to examine the global patterns of Ei, as well as the driving mechanisms behind its variability.

Here we explore the estimates of Ei from the Global Land Evaporation Amsterdam Model (GLEAM v3; Martens et al., 2017), the Penman-Monteith-Leuning (PML v2; Zhang et al., 2019) model, and a recently proposed and validated global application constrained by a synthesis of global experimental data (Zhong et al., 2022). All three methods estimate long-term Ei based on Gash-type formulations (Valente et al., 1997; Van Dijk and Bruijnzeel, 2001). To reduce uncertainty, a multi-product approach is applied to examine the spatial-temporal trends in Ei. Moreover, we focus on a well-validated model (Zhong et al., 2022) to further isolate the relative contributions of precipitation, vegetation and evaporative demand to Ei variability. We find that Ei, described both in terms of the volume of evaporated water and as a percentage of precipitation, exhibits increasing trends globally. Contrasting regional changes are found, however, with a significant increase over Eurasia where the strongest vegetation greening occurs, and decreases over the Congo basin driven by a decline in precipitation. At decadal timescales, the increasing Ei is largely driven by global vegetation greening through an increase in the intercepting surface and storage capacity, while its inter-annual variations are mainly controlled by changes in precipitation. Moreover, the positive contribution of evaporative demand should not be overlooked, given the ubiquitous rise in global potential evaporation driven by atmospheric warming.


References

Martens, B., Miralles, D. G., Lievens, H., van der Schalie, R., de Jeu, R. A. M., Fernández-Prieto, D., Beck, H. E., Dorigo, W. A., and Verhoest, N. E. C.: GLEAM v3: satellite-based land evaporation and root-zone soil moisture, Geosci. Model Dev., 10, 1903– 1925, https://doi.org/10.5194/gmd-10-1903-2017, 2017.

Valente, F., David, J., and Gash, J.: Modelling interception loss for two sparse eucalypt and pine forests in central Portugal using reformulated Rutter and Gash analytical models, J. Hydrol., 190, 141–162, https://doi.org/10.1016/S0022-1694(96)03066-1, 1997.

Van Dijk, A. and Bruijnzeel, L.: Modelling rainfall interception by vegetation of variable density using an adapted analytical model. Part 1. Model description, J. Hydrol., 247, 230–238, https://doi.org/10.1016/S0022-1694(01)00392-4, 2001.

Zhang, Y., Kong, D., Gan, R., Chiew, F. H. S., McVicar, T. R., Zhang, Q., and Yang, Y.: Coupled estimation of 500m and 8day resolution global evapotranspiration and gross primary production in 2002–2017, Remote Sens. Environ., 222, 165–182, https://doi.org/10.1016/j.rse.2018.12.031, 2019.

Zhong, F., Jiang, S., van Dijk, A. I., Ren, L., Schellekens, J., and Miralles, D. G.: Revisiting large-scale interception patterns constrained by a synthesis of global experimental data, Hydrol. Earth Syst. Sci., 26(21), 5647-5667, https://doi.org/10.5194/hess-26-5647-2022, 2022.

How to cite: Zhong, F., Jiang, S., Koppa, A., Ren, L., Liu, Y., Wang, M., and Miralles, D. G.: Multi-decadal change in global rainfall interception and its drivers, EGU General Assembly 2024, Vienna, Austria, 14–19 Apr 2024, EGU24-7987, https://doi.org/10.5194/egusphere-egu24-7987, 2024.

EGU24-8134 | ECS | PICO | HS1.1.2 | Highlight

Predicting annual base flow index and its trends using a large sample of dataset across the globe 

Qi Huang, Jan Seibert, and Yongqiang Zhang

The Base-Flow Indices (BFI), indicating surface and groundwater interaction, play a significant role in the hydrological cycle. The values vary widely across the globe, and are expected to change in the context of a changing climate. Predicting global “natural” BFI is challenging due to limited observations reflecting natural impacts. This study aims to predict annual BFI and their trends for a compiled dataset of annual streamflow and meteorological data covering the period 1982-2020 for more than 2250 small unregulated catchments worldwide. BFI were derived using three digital filtering methods, resulting in a trend of -0.0009 ± 0.01 per decade over the last four decades. To predict annual BFI and their trends in ungauged catchments, a Random Forest Regression approach was employed, incorporating static attributes and meteorological time series data as model inputs. Five-fold cross-validation demonstrated the effectiveness of the Random Forest Regression in predicting both BFI and their trends. The Quantile Regression Forest method was utilized to quantify the uncertainty, achieving a relatively low range for both BFI and their trends. Soil conditions and maximum temperature emerged as the most crucial variables for predicting BFI, while temperature-related variables also proved essential for predicting the BFI trends. The goal is to extend the understanding of "natural" BFI and their trends in ungauged catchments, as the Random Forest Regression model was trained under unregulated conditions. This study offers the possibility to predict "natural" BFI and their trendsacross the globe. This could support water authorities in managing water resources, particularly concerning base flow.

How to cite: Huang, Q., Seibert, J., and Zhang, Y.: Predicting annual base flow index and its trends using a large sample of dataset across the globe, EGU General Assembly 2024, Vienna, Austria, 14–19 Apr 2024, EGU24-8134, https://doi.org/10.5194/egusphere-egu24-8134, 2024.

EGU24-9824 | ECS | PICO | HS1.1.2

The hydrometeorological ingredients needed to fill dry Saharan lakes 

Moshe Armon, Joëlle C. Rieder, Elad Dente, and Franziska Aemisegger

The Sahara desert was potentially much wetter and vegetated in the past during the warm African Humid Period. Although debated, this climatic shift is a possible scenario in a future warmer climate. The most prominent reported evidence for past green periods in the Sahara is the presence of paleo-lakes. Even today, Saharan desert lakes get filled from time to time. However, very little is known about these events due to the lack of available in-situ observations. In addition, the hydrometeorological conditions associated with these events have never been investigated in a dedicated climatological approach. This study proposes to fill this knowledge gap by investigating the meteorology of lake-filling episodes (LFEs) of Sebkha el Melah – a commonly dry lake in the northwestern Sahara. Heavy precipitation events (HPEs) and LFEs are identified using a combination of precipitation observations and lake volume estimates derived from remote sensing satellite imagery. Weather reanalysis data is used together with three-dimensional trajectory calculations to investigate the moisture sources and characteristics of weather systems that lead to HPEs and to assess the conditions necessary for producing LFEs. Results show that hundreds of HPEs occurred between 2000 and 2021, but only 6 LFEs eventuate. The runoff coefficient, i.e. the ratio between the increase in lake water volume during LFEs and precipitation volume during the HPEs that triggered the lake-filling, ranges five orders of magnitude and is much smaller than the figures often cited in the literature regarding this arid area. We find that LFEs are generated most frequently in autumn by the most intense HPEs, for which the key ingredients are (i) the formation of surface extratropical cyclones to the west of the Atlantic Sahara coastline in interplay with upper-level troughs and lows, (ii) moisture convergence from the tropics and the extratropical North Atlantic, (iii) a premoistening of the region upstream of the catchment over the Sahara through a recycling-domino-process, (iv) coupled or sequential lifting processes (e.g., orographic lifting and large-scale forcing), and (v) the stationarity of synoptic systems. Based on the insights gained into Saharan LFEs in the present-day climate, future studies will be able to better assess the mechanisms involved in the greening of the Sahara in the past and also in a warmer future.

How to cite: Armon, M., Rieder, J. C., Dente, E., and Aemisegger, F.: The hydrometeorological ingredients needed to fill dry Saharan lakes, EGU General Assembly 2024, Vienna, Austria, 14–19 Apr 2024, EGU24-9824, https://doi.org/10.5194/egusphere-egu24-9824, 2024.

EGU24-10051 | PICO | HS1.1.2 | Highlight

A survey of past and future changes in global river flow 

Lukas Gudmundsson, Manuela Brunner, Petra Döll, Etienne Fluet-Chouinard, Simon N. Gosling, Yukiko Hirabayashi, Hannes Müller Schmied, Louise Slater, Lina Stein, Conrad Wasko, Dai Yamazaki, and Xudong Zhou

River flow is an essential component of the global water cycle and arguably the best monitored variable in land hydrology. Both anthropogenic climate change as well as direct human influences on the terrestrial environment influence river flow at local to planetary scales. Here, we survey recent scientific advances in quantifying past trends and projecting future changes in global river flow, with focus on trends in flow volumes and seasonality. Previously published evidence of past changes is complemented by an analysis of changes in river flow using in-situ observations and river discharge estimates from a global re-analysis product. Available literature on future projections is accompanied by an analysis of Global Climate Model projections routed through the global river network.

Systematic patterns of past changes in river flow emerge at the regional to global scales, despite significant uncertainties and small-scale spatial variability. These uncertainties are related e.g. to differences in study periods, considered indicators of change, availability of in-situ observations, and uncertainties of model-based reconstructions. Some of the most pronounced changes in past river flow include increasing river flow in the northern high latitudes and robust decreasing trends in significant parts of central and south America, the Mediterranean region, the southern tip of Africa as well as central and southern Australia. In other world regions, available in-situ observations are sparse or there is conflicting evidence, meaning that trends are still uncertain. We further show systematic shifts in the river flow seasonality with a tendency for earlier streamflow and a dampened seasonal cycle in across many parts of the world likely to due to higher temperatures and earlier snowmelt, with later streamflow in the Mediterranean linked to changes in rainfall.

Climate model driven assessments of future changes in river flow suggest that total global discharge to the oceans may increase with global warming, albeit with large regional differences in the direction of change and substantial model uncertainty. Across several studies based on different model ensembles, there is consensus for increasing river flow in the northern high latitudes and some evidence for increasing river flow in tropical Africa, the Indian subcontinent and eastern and tropical Africa. Finally, we highlight regions in which past changes in river flow are consistent with future projections, which include but are not limited to increasing river flow in northern North America and northern Europe, as well as drying tendencies in the Mediterranean, the southern tip of Africa and Southern Australia. The consistency between model projections and historical trends in these regions gives confidence to future water management decisions, while disparities between historical trends and projections highlights regions where better understanding of the processes governing past and future change in river flow will be required moving forward.

How to cite: Gudmundsson, L., Brunner, M., Döll, P., Fluet-Chouinard, E., Gosling, S. N., Hirabayashi, Y., Müller Schmied, H., Slater, L., Stein, L., Wasko, C., Yamazaki, D., and Zhou, X.: A survey of past and future changes in global river flow, EGU General Assembly 2024, Vienna, Austria, 14–19 Apr 2024, EGU24-10051, https://doi.org/10.5194/egusphere-egu24-10051, 2024.

EGU24-10053 | ECS | PICO | HS1.1.2

Assessing impacts of vegetation changes on water availability in the upper Yellow River Basin, China 

Yan Wang, Guoqing Wang, Xiyuan Deng, and Yuli Ruan

Changes in vegetation are expected to influence terrestrial water and energy fluxes; however, the impacts of vegetation changes on water availability remain controversial. In this study, we applied the Community Land Model, version 4.5 (CLM4.5) coupled with the Variable Infiltration Capacity (VIC) hydrological parameterizations to the upper Yellow River Basin (UYRB), which is the most important water conservation area in the Yellow River Basin, to investigate the impacts of vegetation changes on water availability in the area. The results showed a pronounced greening trend in the UYRB from 1982 to 2018, resulting in increased evapotranspiration, decreased runoff, drier soil conditions, and decreased water yield. The water reduction effect of vegetation greening is more pronounced in water-limited areas than in energy-limited areas. This study highlights the diverse hydrological responses to vegetation changes under different climatic conditions and land cover types. It is crucial for ecological restoration policies in China to recognize these distinctions and their potential negative impacts on water availability, especially in water-limited regions.

How to cite: Wang, Y., Wang, G., Deng, X., and Ruan, Y.: Assessing impacts of vegetation changes on water availability in the upper Yellow River Basin, China, EGU General Assembly 2024, Vienna, Austria, 14–19 Apr 2024, EGU24-10053, https://doi.org/10.5194/egusphere-egu24-10053, 2024.

EGU24-10062 | ECS | PICO | HS1.1.2

Drivers of changes in catchment evapotranspiration in Central Europe over the past 40 years 

Doris Duethmann, Giulia Bruno, and Laurent Strohmenger

Understanding long-term changes in evapotranspiration and their drivers is crucial due to direct impacts on water availability. Increasing evapotranspiration rates can exacerbate droughts and jeopardise water availability, especially in the summer months with higher water demands. Uncertainties of multi-decadal variations in evapotranspiration at local to regional scale and their drivers are, however, still large. In this data-based study, we derive changes in evapotranspiration from the catchment water balance for a large number of catchments in Central Europe over 1982–2016. We further analyse changes in potential drivers including vegetation and land cover based on a remote-sensing derived vegetation index and a land cover product, water availability based on changes in seasonal precipitation and available energy and atmospheric demand based on changes in reference evapotranspiration. We find wide-spread increases in catchment evapotranspiration until about the year 2000 and only small changes with a decreasing tendency after 2000. The observed variations in regional evapotranspiration are significantly correlated with variations in precipitation, reference evapotranspiration and vegetation activity. High evapotranspiration around 2000 can be related to high values of reference evapotranspiration, precipitation and vegetation activity. Lower evapotranspiration in the early 1980s despite relatively high precipitation is linked to lower values of reference evapotranspiration and vegetation activity, while the halt of further evapotranspiration increases after 2000 despite high values of reference evapotranspiration may be explained by low precipitation. The study contributes to expand our knowledge on the drivers of changes in the water balance in Central Europe over recent decades, which is of great importance for water management in a changing climate.

How to cite: Duethmann, D., Bruno, G., and Strohmenger, L.: Drivers of changes in catchment evapotranspiration in Central Europe over the past 40 years, EGU General Assembly 2024, Vienna, Austria, 14–19 Apr 2024, EGU24-10062, https://doi.org/10.5194/egusphere-egu24-10062, 2024.

EGU24-11031 | PICO | HS1.1.2

Global Aridity Index and Potential Evapotranspiration Database: CIMP_6 Future Projections 

Antonio Trabucco, Donatella Spano, and Robert J Zomer

We present the recent release of the “Global Aridity Index and Potential Evapotranspiration Database: CIMP_6 Future Projections – v.1 (Future_Global_AI_PET)”, which provides very high-resolution (30 arc-seconds or about 1km at equator) global raster dataset of average monthly and annual potential evapotransipation (PET) and annual aridity index (AI) for two historical (1960-1990; 1970-2000) and two future (2021-2040; 2041-2060) time periods for each of 25 CIMP6 Earth System Models across four emission scenarios (SSP: 126, 245, 370, 585). Potential evapotranspiration (PET) characterizes the atmosphere's capacity to remove water through evapotranspiration (ET). Evaporation and transpiration processes collectively transfer water from the Earth's surface to the atmosphere with rates determined by solar radiation, air temperature, relative humidity (specifically, vapor pressure deficit), wind speed, as well as the distinctive traits of vegetation, or crops and the practices employed in their cultivation. Estimates of reference evapotranspiraton (ET0) have been widely used across diverse scientific fields and practical domains, with PET measurements and related indices playing a crucial role in agricultural and natural resource management with demonstrated utility on scales from individual farms to regional and global. The aridity index (AI), which describes the ratio of precipitation to PET provides an integrated measure to gauge moisture availability for plant growth, generally of specific reference crops or specific vegetation types, enabling both spatial and temporal comparisons. In an era of rapid environmental and climatic transformations, these metrics, along with their derived indices, assume a pivotal role as direct and critical measures, as well as predictive tools, for gauging the trajectory, direction, and extent of climatic variations and their ramifications for terrestrial, and particularly agricultural, ecosystems. This latest addition to the Global_AI_PET database also includes three averaged multi-model ensembles produced for each of the four emission scenarios: All Models:  includes all of the 25 ESM available; High Risk: includes 5 ESM which were identified as projecting the highest increases in temperature and significantly higher than the majority of estimates; Majority Consensus:  includes 20 ESM, that is, all of the available ESM minus the five ESM in the “High Risk” category.  Preliminary results based on CIMP6 ESM projections are provided showing significant change in global and regional trends for PET and aridity in the near- and medium-term, with implications for agriculture, biodiversity, watershed management, and water resources. The Future_Global_AI_PET Database is the latest and most recent addition to the Global PET_AI Database, which has provided PET and AI datasets using both the Hargreaves and Penman-Monteith equations, and has been available online since 2009, downloaded over 50,000 times, and with more than 2000 scholarly citations:

 https://figshare.com/articles/dataset/Global_Aridity_Index_and_Potential_Evapotranspiration_ET0_Climate_Database_v2/7504448/6)

How to cite: Trabucco, A., Spano, D., and Zomer, R. J.: Global Aridity Index and Potential Evapotranspiration Database: CIMP_6 Future Projections, EGU General Assembly 2024, Vienna, Austria, 14–19 Apr 2024, EGU24-11031, https://doi.org/10.5194/egusphere-egu24-11031, 2024.

Heatwaves – short-term periods of anomalous warmth – can play an outsized role in shaping downstream water resources as they impact the timing and magnitude of snow and glacier melt.  Melt-driven runoff enhanced during spring heatwaves is particularly important as it can cause downstream flooding and damage.  It is well understood that heatwaves will become more frequent and more severe in the future due to climate change; however, it is not well understood how the hydrological response to heatwaves will change in the future.

Here, we quantify the streamflow response to heatwaves over the past century across Western Canada.  We investigate how such streamflow responses vary in space, time, by streamflow regime, and by hydroclimate conditions, and we present a simple mathematical framework to partition the responses into seasonal and heatwave-driven components.  We use freshet timing and winter snowfall as metrics that are expected to change under climate change, and we compare how streamflow responses to heatwaves differ between baseline historical years (later freshet and more snowfall) and future proxy years (earlier freshet and less snowfall). 

We find that in future proxy years, the streamflow response to spring heatwaves is diminished when seasonal streamflow is enhanced, indicating that peak streamflow during heatwaves does not necessarily increase under climate warming.  We also find that the proportion of spring streamflow generated by heatwaves is lessened relative to seasonal streamflow, and this proportion is diminished as the freshet progresses.

Our results contextualize how the streamflow responses to heatwaves have varied over the past century, to better understand how they may change in the future.  Importantly, our findings have implications for future heatwave-driven flooding in nival and glacial basins at both regional and global scales, and we present novel observational signals of change in heatwave-driven streamflow that can be further investigated by future modelling studies.

How to cite: Anderson, S. and Chartrand, S.: Spatiotemporal variability of heatwave-driven streamflow in nival and glacial basins: Future insights from a century of observations, EGU General Assembly 2024, Vienna, Austria, 14–19 Apr 2024, EGU24-11575, https://doi.org/10.5194/egusphere-egu24-11575, 2024.

EGU24-13209 | ECS | PICO | HS1.1.2

Tree planting attenuates storm runoff response on the Chinese Loess Plateau 

Shaozhen Liu, Hansjörg Seybold, Ilja van Meerveld, Yunqiang Wang, and James W. Kirchner

Tree planting to mitigate climate change has become a popular topic in recent years. While it has been widely reported that tree planting reduces annual water yield, it is not clear how tree planting affects a catchment’s storm runoff response for events of different magnitudes. China’s “Grain for Green Program” almost doubled the vegetation cover on the Loess Plateau two decades ago, and thus represents a large-scale experiment revealing the impact of tree planting on hydrological processes. Here we show how the storm runoff response to rainfall has changed as a result of tree planting using five sub-catchments in a 26,000 km2 large basin that received different degrees of afforestation. Our dataset covers over 40 years of daily streamflows, allowing us to use new nonlinear Ensemble Rainfall-Runoff Analysis techniques to quantify the runoff response to rainfall events of different intensities. We find that after tree planting, the runoff response peak decreased up to 86%, proportional to the percentage increase in the Leaf Area Index (LAI). This attenuation of peak runoff is much larger than that of the decrease in average growing season runoff (59%). Surprisingly, the largest attenuation in peak runoff response occurs during high-intensity rainfall events rather than low-intensity rainfall events. This observation implies that the main mechanisms reducing runoff response cannot be increased canopy interception or soil moisture depletion, because these would be expected to have a larger effect on low-intensity events. Instead, we hypothesize that the main mechanisms are likely to be reductions in runoff-generating areas and increases in infiltration rates. Consistent with this hypothesis, low flows (i.e., Q95) do not decrease, but instead increase up to 25%, with the largest increases in low flows occurring in sub-catchments with the largest percentage increases in LAI. These findings highlight the positive effect of tree planting on reducing storm runoff peaks and increasing low flows, coincident with the reduction in annual water yield that has been widely reported in other studies. These substantial and persistent hydrological consequences of tree planting can inform future efforts at climate change mitigation through vegetation management.

How to cite: Liu, S., Seybold, H., van Meerveld, I., Wang, Y., and W. Kirchner, J.: Tree planting attenuates storm runoff response on the Chinese Loess Plateau, EGU General Assembly 2024, Vienna, Austria, 14–19 Apr 2024, EGU24-13209, https://doi.org/10.5194/egusphere-egu24-13209, 2024.

EGU24-13611 | PICO | HS1.1.2

Hydrologic responses to climate change and implications for reservoirs in the source region of the Yangtze River 

Hongmei Xu, Pengcheng Qin, Zhihong Xia, Lüliu Liu, Qiuling Wang, and Chan Xiao

Understanding the hydrological impacts of climate change is essential for robust and sustainable water management. This study assessed the hydrologic impacts of climate change in the Jinshajiang River basin, the source region of the Yangtze River, using the historical observations and the future hydrologic simulations under two Shared Socioeconomic Pathways (SSP2-4.5 and SSP5-8.5), deriving from a hydrological model. For the historical period, there is an increasing trend in precipitation, evapotranspiration, snowmelt, and consequently an increasing in streamflow in the upstream, whereas a decreased streamflow in the downstream catchment. For future scenarios, a warmer and wetter climate was projected for the basin throughout the 21st century, and correspondingly an overall increase in mean and extreme streamflow, with a larger magnitude in the far future than in the near future, and under SSP5-8.5 than SSP2-4.5. The projected remarkable increase in precipitation cause the transition in changing trend of streamflow compared with the historical period. The projected continuing decline in snowfall and snow water equivalent result in a significant advance and decrease in snowmelt, followed by an earlier and more concentrated peak streamflow in July, especially for the upstream catchment. Ultimately, reservoirs in the basin are expected to gain more inflows, however, with larger variability and more floods and hydrological droughts, which impose potential challenges on reservoir operations. These outcomes indicate the importance of adaptive water resources management in the melting water contributed basin to sustain and enhance its services under global warming.

How to cite: Xu, H., Qin, P., Xia, Z., Liu, L., Wang, Q., and Xiao, C.: Hydrologic responses to climate change and implications for reservoirs in the source region of the Yangtze River, EGU General Assembly 2024, Vienna, Austria, 14–19 Apr 2024, EGU24-13611, https://doi.org/10.5194/egusphere-egu24-13611, 2024.

EGU24-13740 | ECS | PICO | HS1.1.2 | Highlight

Assessment of Land Surface Model's Evapotranspiration Response 

Yaoting Cai, Xingjie Lu, Zhongwang Wei, and Nan Wei

Biotic factors have been identified as one of the most important controls on evapotranspiration (ET) variation in the scenario of future climate change. Land surface models have developed sophisticated canopy processes to emphasize the importance of vegetation. However, as the vegetation processes become more and more complicated, the relative importance of biotic impact in comparison with abiotic impact on ET has not been well quantified. Failing to understand the relative importance between abiotic and biotic impact may result model bias in water cycle prediction. We collected satellite-based

ET dataset (GLEAM, CRv1, P-LSH), climate data, biotic factor estimates, and apply the variance decomposition analysis to quantify the relative importance between biotic and abiotic impacts. Then, we compared with the model counterpart, i.e. the ensemble means of LS3MIP and CMIP6. Variance decomposition analysis on ET dataset show that about 70% of the ET inter-annual variation is contributed from abiotic factors, such as vapor pressure deficit (VPD), net radiation, and precipitation, whereas only 30% of ET variance is explained by biotic factors, such as stomata conductance and leaf area index (LAI). The abiotic contributions of the models show great uncertainties, which range from 36% to 60%. Overall, the abiotic factor contributions of most models are significantly higher than satellite-based ET dataset. ET variation of grassland is mostly explained by abiotic factors, which is consistent between models and ET dataset. VPD and precipitation explained most of the ET variation in ET dataset, especially in high latitude, whereas stomata conductance and LAI explained most of the ET variation in LS3MIP and CMIP6 models in boreal forest. The model overestimates of abiotic contribution indicate more complicated canopy processes require better constraints. Climate change leading to increase in VPD and more frequent extreme precipitation potentially play more important role in future ET changes. More efforts, such as model parameterization, calibration, new process development, still need to be made by modelers to improve model meteorological feedback.

How to cite: Cai, Y., Lu, X., Wei, Z., and Wei, N.: Assessment of Land Surface Model's Evapotranspiration Response, EGU General Assembly 2024, Vienna, Austria, 14–19 Apr 2024, EGU24-13740, https://doi.org/10.5194/egusphere-egu24-13740, 2024.

EGU24-13880 | ECS | PICO | HS1.1.2

Assessment of climate change impacts on Brazilian catchments using a regional deep learning approach 

André Almagro, Pedro Zamboni, and Paulo Tarso Oliveira

The potential impacts of climate change in catchment hydrology are still unknown in most of the world and it is not different in Brazil. Conducting an integrated analysis of catchments based on similarity groups allows us to extract conclusions and observations about the overall controls of hydrological behavior, but also considering the specific and distinctive characteristics of each of these groups. This approach enables us to identify and comprehend the primary features influencing hydrological behavior within each distinct group, increasing hydrologic predictability and knowledge of catchments’ functioning, which is essential to better understand the impacts of climate change. In this study, we investigate the possible shifts in Brazilian catchment hydrology behavior in response to a changing climate. Employing a regional approach of the Long Short-Term Memory (LSTM) to understand and predict streamflow across 735 catchments of six hydrologically similar groups in Brazil, we simulated streamflow throughout the 21st century. This simulation utilized a multi-model ensemble comprising 19 bias-corrected Global Climate Models (GCMs) from the sixth phase of the Coupled Model Intercomparison Project (CMIP6), driven by intermediate and high-emission scenarios (SSP245 and SSP585). Our results show that the regional LSTM outperforms the conventional hydrological modeling (NSE≈0.60), underscoring the reliability of deep learning to estimate streamflow with simplified input. Interestingly, we found that substantial variations in projected temperatures across scenarios do not necessarily correspond to significant differences in projected streamflow. Moreover, changes in precipitation and temperature may not exert proportional impacts on streamflow. Further, we will investigate the dynamics of transitions between catchment groups. This innovative approach to assess the impacts of climate change enhances the reliability of projected streamflow trajectories, a critical consideration given the uncertainties associated with CMIP6 models. Furthermore, this study holds potential utility in developing strategies to mitigate the impacts of climate change on Brazilian water resources.

How to cite: Almagro, A., Zamboni, P., and Oliveira, P. T.: Assessment of climate change impacts on Brazilian catchments using a regional deep learning approach, EGU General Assembly 2024, Vienna, Austria, 14–19 Apr 2024, EGU24-13880, https://doi.org/10.5194/egusphere-egu24-13880, 2024.

Background

Both blue water and green water contribute to agricultural water scarcity, which is subjected to impacts of escalating climate extremes, e.g., precipitation and temperature extremes. However, an explicit quantification of the possible effects of compound climate extremes on agricultural water scarcity index (AWSI) under historical and future climate is absent and current research often overlooks how different spatial scales influence agricultural water scarcity.

Methods

We applied an integrated AWSI, which incorporates blue water and green water, to estimate agricultural water scarcity in provincial and basin scales in China, and to determine the association of AWSI with compound climate extremes over the historical period 1971–2010 and for future period 2031–2070.

Conclusions
Our results indicate a marked escalation in AWSI during dry years and periods of elevated temperatures, and precipitation significantly impacts AWSI more than temperature variations. In secondary basins, AWSI was about 25.7% higher than the long-term average during dry years, increasing to nearly 49% in exceptionally dry conditions. Comparatively, in tertiary basins, the increases were 27.7% and 55%, respectively. In years characterized by high temperatures, AWSI rose by approximately 6.8% (7.3% for tertiary basins) from the average, surging to around 19.1% (15.5% for tertiary basins) during extremely hot periods. Future climate change would further intensify AWSI and amplify the effects of climate extremes, particularly in Inner Mongolia with changes of AWSI over 200%. Southwestern China could also experience expanding agricultural water scarcity under future climate scenarios. Improving irrigation efficiency has potential to alleviate water scarcity by up to 30%. Moreover, it illustrates that AWSI assessment at the tertiary basin level could better capture the influence of climate extremes on AWSI compared to assessments at the secondary basin level. As a whole, the investigation offers an in-depth evaluation of the influence of compound precipitation and temperature extremes and research scale on water scarcity.

How to cite: Liu, J. and Liu, W.: Impacts of climate extremes on agricultural water scarcity under historical and future periods and the spatial scale effect, EGU General Assembly 2024, Vienna, Austria, 14–19 Apr 2024, EGU24-14467, https://doi.org/10.5194/egusphere-egu24-14467, 2024.

EGU24-14546 | ECS | PICO | HS1.1.2

Intensified floods after mega forest fires in southeast Australia  

Zhenwu Xu, Yongqiang Zhang, and Günter Blöschl

Forest fires are commonly expected to exacerbate local flood hazards. Yet, it's not well-established if such an effect is evident across broader geographic regions concurrently, particularly when considering the compounded influences of forest fires and climate variability on floods. Here, we show that recent 2019–2020 mega forest fires in southeast Australia, characterized by unprecedented burned areas, have significantly increased the flood peak discharges in the ensuing two years. The impact varied regionally, being more pronounced in areas with winter-dominated and uniform rainfall patterns, while it was insignificant in regions with summer-dominated rainfall. This regional divergence in fire impacts can be attributed to the differences in burned areas and dominant flood generating mechanisms. Given the increasing influence of climate change on fire activities, people living in these fire-prone regions might face escalating risks of cascading flood hazards following fires in the future.

How to cite: Xu, Z., Zhang, Y., and Blöschl, G.: Intensified floods after mega forest fires in southeast Australia , EGU General Assembly 2024, Vienna, Austria, 14–19 Apr 2024, EGU24-14546, https://doi.org/10.5194/egusphere-egu24-14546, 2024.

Affected by global climate change, the variations of snow cover and snowmelt runoff in the high cold region has raised an increasing concern. Snowmelt water is an important component of spring runoff in the Lancang River basin, and it is of great significance for the scientific operation of cascade hydropower stations in the Lancang River basin to master the variation law of snow cover in the upper reaches of the Lancang River and accurately simulate the snowmelt runoff process. Based on the remotely sensed snow cover data from 2000 to 2019, the Mann-Kendall trend test method was used to analyze the spatio-temporal variation of snow cover in the upper reaches of Lancang River. An snowmelt runoff model was established, and the PSO algorithm was introduced to determine the model parameters to simulate the snowmelt runoff process. The results show that the snow cover in the upper reaches of Lancang River showed no significant increase in spring, autumn and winter, and no significant decrease in summer. The average annual snow cover in spring, summer, autumn and winter was 0.16, 0.06, 0.13 and 0.17, respectively. The snow cover in the southwest and north of the Lancang River source area increased in all seasons, while the snow cover in the southeast area decreased. Among them, the increase of snow cover in the northwest reaches the largest in winter, up to 3%/a. The SRM model has good applicability in the upper reaches of the Lancang River, and the certainty coefficients of calibration period and verification period are 0.87 and 0.78, respectively, and the results have a certain implication for the simulation of snowmelt runoff in the alpine region.

How to cite: Zhang, J.: Evolution trend of snow cover and simulation of snowmelt runoff in upper reaches of Lancang River, EGU General Assembly 2024, Vienna, Austria, 14–19 Apr 2024, EGU24-14558, https://doi.org/10.5194/egusphere-egu24-14558, 2024.

Detailed changes in land surface water fluxes under vegetation greening is unclear especially in different patterns of climate change and land-use change. A typical vegetation greening region located in Loess Plateau was selected as a studying area. Because of high spatial heterogeneous site conditions, similar spectral reflectance and shapes of different vegetation types, there is a low accuracy of land cover mapping in mixed regions of multiple vegetation types, thereby leading to a pronounced underestimate of land use change, such as grain for green project. Besides spectrum, topography, and some usually used features, a novel land cover mapping framework is constructed with evapotranspiration which vary dramatically in vegetation types. Generally, the classification accuracy of all kinds of land cover is above 90%, and improved by 5.4-15.3%, 0-15.7%, 3.0-20.4%, of cropland, forest and grassland, respectively. Then water fluxes including precipitation, evapotranspiration, soil moisture, and runoff were analyzed in nine different vegetation types, considering the three types of vegetation found in cropland, forest and grassland along with respective stable, loss, and gain states. The result indicated that the cropland returning and afforestation has successfully facilitated a positive regional water cycle. This finding is useful for supporting ecological restoration and future water resources management, and enhancing the carrying capacity and resilience of the region.

How to cite: Bao, Z., Wang, J., and Ruan, Y.: Characterization of land surface water flux under vegetation greening introduced by changes in climate and land-use, EGU General Assembly 2024, Vienna, Austria, 14–19 Apr 2024, EGU24-14579, https://doi.org/10.5194/egusphere-egu24-14579, 2024.

In recent times, climate change leads to the occurrence of extreme weather phenomena such as heavy rainfall, severe drought, heatwaves, and cold spells. From the perspective of the watershed hydrologic cycle, these changes have resulted in adverse effects, including an increase in surface runoff, evapotranspiration, and a decrease in groundwater recharge. Coastal areas, in particular, have a greater reliance on groundwater compared to inland watershed, making water resources vulnerable to climate change. Therefore, in this study, the Soil and Water Assessment Tool (SWAT) was implemented for the An-Seong-cheon watershed (1,627 km2), which is adjacent to the coastal region in South Korea. The SWAT was calibrated and validated for runoff and evapotranspiration. The estimation of groundwater recharge was conducted based on the calibrated water balance components, the average recharge was calculated to be 21.2% for the study area. Subsequently, extreme climate change scenarios were selected, by examining the Shared Socioeconomic Pathway (SSP) scenarios derived from the Intergovernmental Panel on Climate Change's Assessment Report 6 (AR6). The extreme climate change scenarios will be applied to the SWAT model to project future changes in groundwater recharge. Ultimately, the purpose of study is to evaluate the climate change vulnerability of groundwater recharge based on land cover characteristics within the coastal watershed.

Key words: Coastal area, Climate Change, Groundwater recharge, Vulnerability Assessment, SWAT

Acknowledge

Research for this paper was carried out under the KICT Research Program (project no.20230166-001, Development of coastal groundwater management solution) funded by the Ministry of Science and ICT.

How to cite: Woo, S. Y., Chang, S. W., and Kim, M.: Vulnerability assessment of groundwater recharge under extreme climate change in coastal area watershed of South Korea, EGU General Assembly 2024, Vienna, Austria, 14–19 Apr 2024, EGU24-14589, https://doi.org/10.5194/egusphere-egu24-14589, 2024.

EGU24-15132 | ECS | PICO | HS1.1.2 | Highlight

Development of an integrated suite for estimating Intensity Duration Frequency curves in a climate change perspective  

Lisa Napolitano, Guido Rianna, Roberta Padulano, and Valentina Francalanci

This study introduces a comprehensive suite of methodologies for estimating Intensity Duration Frequency (IDF) curves, critical for engineering planning in the face of expected variations in extreme precipitations induced by climate change. Indeed, in recent years the climate proofing design of hydraulic infrastructures (e.g. sewage systems) arose increasing interest but, at the moment, there is a lack of clear understanding of the differences between approaches and the relative weight of the individual phases of the process on the final estimates (approaches to fit the statistical parameters, differences between simulation chains, variations induced by socio-economic scenarios driving climate models). To investigate such issue, four consolidated approaches to assess the potential variations induced by CC in IDF curves are compared: Padulano et al., 2018 [doi.org/10.1002/hyp.13449, QDM-CMCC], Hassanzadeh et al., 2019 [doi.org/10.1016/j.advwatres.2019.07.001; QQD], Alzahrani et al., 2022 [doi.org/10.1007/s11269-022-03265-3; EQM], Hassanzadeh et al., 2019 [doi.org/10.1016/j.advwatres.2019.07.001; SIM]. More specifically: QDM-CMCC combines a simple delta change with quantile delta mapping; the Quantile-Quantile downscaling (QQD) spatiotemporally downscales extreme rainfall quantiles through a parametric relationship; Equidistant Quantile Mapping (EQM) spatiotemporally downscales extreme rainfall quantiles using a two-step parametric procedure; Scale-Invariance Method (SIM) derives the distributions of short-duration local extreme rainfalls based on those of longer duration using the scaling relationships between non-central moments over different rainfall durations.

Precipitation values are provided by 14 climate simulation chains made available in the framework of the EURO‐CORDEX initiative; 1981-2010 is adopted as the current period while, as the future time horizon, 2036-2065 is adopted under three different Representative Concentration Pathways, RCP2.6, RCP4.5 and RCP8.5. As pilot case, the reference IDF curve adopted to design hydraulic infrastructures in the Ischia Island (30 km from Naples, Southern Italy) is used.

The investigation is aimed at exploring not only the spread among the findings returned by exploiting the different approaches in a real-world scenario but also to improve the understanding about how the theorical differences in the approaches can lead to very different estimates. Results show that the three main sources of uncertainty (statistical parameter fitting, climate modelling and RCP scenarios) play a comparable role inducing an increasingly evident spread as the return times increase.

Finally, it is worth noting that two libraries in R and Python for the four approaches, available upon request, have been developed to permit assessments over test cases in different precipitation regimes and by exploiting different climate simulation chains to replicate the findings achieved in the present investigation.


How to cite: Napolitano, L., Rianna, G., Padulano, R., and Francalanci, V.: Development of an integrated suite for estimating Intensity Duration Frequency curves in a climate change perspective , EGU General Assembly 2024, Vienna, Austria, 14–19 Apr 2024, EGU24-15132, https://doi.org/10.5194/egusphere-egu24-15132, 2024.

This research focuses on the estimation of extreme precipitation quantiles using climate change scenario data from the 6th Assessment Report (AR6) of the Intergovernmental Panel on Climate Change (IPCC). The study involved the analysis of precipitation data from 23 global climate models (GCMs), with a final selection of 10 models that best represented the characteristics of extreme precipitation in South Korea, based on statistical measures against observed rainfall data. Particularly, precipitation data from 71 observation points within the Chungju-Dam basin, a region of hydrological significance and susceptibility to extreme weather events, were collected for analyzing climate change impacts.

Furthermore, the study conducted the regional frequency analysis (index-flood method) to estimate rainfall quantiles, employing the Generalized Extreme Value (GEV) distribution and L-moment method for parameter estimation. The analysis resulted in the development of a multi-model ensemble (MME) incorporating the 10 selected GCMs and 4 Shared Socioeconomic Pathways (SSP) scenarios. This approach facilitated a comprehensive understanding of potential future climate changes, considering emission trajectories and socio-economic changes. Additionally, the study quantitatively evaluated the impact of climate change and associated uncertainties in the region, which is essential for devising adaptation and mitigation strategies in response to climate change conditions, particularly in areas susceptible to extreme weather events. This research provides valuable insights into the understanding of climate-induced extreme weather events and offers guidance for policymakers and environmental planners in preparing for the impacts of global climate change.

How to cite: Kim, S. and Heo, J.-H.: Assessment of extreme precipitation risks using multi-model climate projections: focusing on the Chungju-Dam basin in South Korea, EGU General Assembly 2024, Vienna, Austria, 14–19 Apr 2024, EGU24-16120, https://doi.org/10.5194/egusphere-egu24-16120, 2024.

EGU24-16155 | ECS | PICO | HS1.1.2 | Highlight

Effect of irrigation on joint evolution of water resources and hydroclimate variables under climate change 

Pedro Arboleda, Agnès Ducharne, Pierre Tiengou, and Frédérique Cheruy

Irrigation is one of the main human landscape management activity, and has seen a dramatic increase during the XXth century, with a direct local increasing effect on soil moisture (SM) and evapotranspiration (ET). To sustain the increase of ET, irrigation withdraws water from rivers and groundwater reservoirs. As a result, irrigation activities have a direct impact on water and energy balance, and drive the evolution of ET under the ongoing climate change in intensively irrigated regions. On the other hand, irrigation induces feedbacks from the atmosphere, that includes changes in precipitation patterns, air temperature cooling and changes in energy-related variables. Moreover, future climate change will complexify these interactions, and it is not clear what would be the future implications of irrigation activities in water resources management and key hydroclimate variables.

To assess the joint evolution of irrigation, water resources and hydroclimate variables, we use an irrigation scheme that was recently evaluated in ORCHIDEE, the land surface component of the IPSL climate model. This scheme calculates water demand based on a soil moisture deficit approach, and restrains water supply to water available in small and large rivers and in groundwater, considering the facility to access the water source and an environmental volume for ecosystems. To assess the effect of irrigation on water resources and climate, we use two transient coupled simulations at global scale, for the period 1950-2100, under SSP5-RCP8.5 scenario to have a strong climate change signal during the future period. One of the simulations runs with the irrigation scheme activated, while the second one runs without irrigation.

Preliminary results at global scale show that irrigation will increase under the chosen scenario, due to the prescribed increase of the irrigated surface from scenario SSP5-RCP8.5 and a warmer climate. This increase will counteract part of the increasing trend of groundwater storage and will complexify the evolution of river storage in irrigated areas. On the other hand, it will enhance the increase of ET at global scale. We will extend our analysis to water and energy-related variables, including key climate variables like precipitation and air temperature, at different seasons and regions. We will also focus our analysis in some intensively irrigated areas, to assess the causes of possible water supply shortages in irrigation activities. These results should help to understand future implications of irrigation in water resources management in irrigated areas, and also effects in non-irrigated zones via remote land-atmosphere feedbacks.

How to cite: Arboleda, P., Ducharne, A., Tiengou, P., and Cheruy, F.: Effect of irrigation on joint evolution of water resources and hydroclimate variables under climate change, EGU General Assembly 2024, Vienna, Austria, 14–19 Apr 2024, EGU24-16155, https://doi.org/10.5194/egusphere-egu24-16155, 2024.

EGU24-16654 | ECS | PICO | HS1.1.2

Understanding Changes in Iceland’s Streamflow Dynamics in Response to Climate Change 

Hörður Bragi Helgason, Andri Gunnarsson, Óli Grétar B. Sveinsson, and Bart Nijssen

Anthropogenic climate change is profoundly altering the hydrological cycle in high-latitude regions. Iceland, with its abundant hydrological and glaciological data, provides a unique opportunity to study the effects of climate change on streamflow in snow- and glacier melt dominated catchments. The country's reliance on hydropower, as the top electricity producer per capita globally, highlights the critical need for understanding these changes.

In Iceland, the average temperature has risen significantly in recent decades, outpacing the global warming trend. Despite this warming, increased precipitation has led to more extensive snow cover and depth in some regions. Glaciers have experienced a loss in area and mass, soil temperatures have risen, and vegetation has increased. However, the impacts of these environmental shifts on streamflow remain largely unexplored.

Our study utilizes the newly released LamaH-Ice dataset, encompassing streamflow observations from mainly undisturbed watersheds, atmospheric forcings from climate reanalyses and catchment characteristics, to investigate Iceland's streamflow dynamics changes over recent decades. We analyze annual, seasonal, and monthly streamflow volumes, spring freshet timing, and extreme flow events, correlating these changes with environmental conditions and catchment attributes.

The results suggest that streamflow regime alterations are influenced by multiple factors, including geographic location, topography, and river type. The findings offer crucial insights into Iceland's hydrological changes amid rapid climatic shifts, with broader implications for reservoir operations and water resource management. This study not only enhances our understanding of Icelandic hydrology but also contributes to global knowledge on climate-induced hydrological changes.

How to cite: Helgason, H. B., Gunnarsson, A., Sveinsson, Ó. G. B., and Nijssen, B.: Understanding Changes in Iceland’s Streamflow Dynamics in Response to Climate Change, EGU General Assembly 2024, Vienna, Austria, 14–19 Apr 2024, EGU24-16654, https://doi.org/10.5194/egusphere-egu24-16654, 2024.

In order to alleviate the problem of water scarcity, adapt to and mitigate the negative impact of climate change on water resources, large-scale infrastructure projects have been built worldwide. In addition to bringing huge social benefits, reservoirs may also affect meteorological conditions near the surface and mesoscale or weather scale processes. A high-quality meteorological dataset is an important foundation for understanding climate change. Considering the complexity of the underlying surface in the Three Gorges Reservoir region, this study uses CLDAS multi-source fusion grid meteorological data to study the characteristics of changes in the Three Gorges Reservoir before and after water storage. Select four elements: temperature, precipitation, wind speed, and relative humidity, and analyze the climate effects before and after the Three Gorges Reservoir from different time scales such as year, season, and day. Based on the analysis of CLDAS multi-source fusion data, it is shown that for the average temperature, after the water storage, except for the areas along the southern side of the Yangtze River where the temperature is lower than before the water storage, most other areas are higher. On an annual scale, there is not much difference in average temperature before and after water storage. The average temperature effect in the Three Gorges region after water storage varies at different time periods. During the subsidence period and high water level period, it shows an overall warming effect, with an average temperature increase of 0.1 ℃ and 0.3 ℃, respectively. However, during the flood season and water storage period, it shows a cooling effect, with an average temperature decrease of 0.2 ℃ and 0.9 ℃, respectively. The cooling effect is more pronounced during the water storage period. After water storage, it shows an increase in temperature during the day and a decrease in temperature at night. For annual precipitation, except for some areas in the east, northwest, and central regions where precipitation has decreased, most of the remaining areas of the Three Gorges generally have more precipitation than before the water storage. At the annual scale and different time periods, the precipitation in the Three Gorges area is higher after the water storage than before, and on the annual scale, the precipitation after the water storage increases by 8.8% compared to before the water storage; During the subsidence period, flood season, storage period, and high water level period, the precipitation after storage increased by 10.2%, 1.3%, 21.7%, and 32.2% respectively compared to before storage. The precipitation during the high water level period after storage changed the most, while the precipitation during the flood season changed the least.

How to cite: Wang, Q., Chen, X., and Li, W.: Assessment of Climate Effects in the Three Gorges Reservoir Based on Multi-source Fusion Data CLDAS, EGU General Assembly 2024, Vienna, Austria, 14–19 Apr 2024, EGU24-17866, https://doi.org/10.5194/egusphere-egu24-17866, 2024.

The intensification of the water cycle over recent decades has produced changes in hydrologic extremes (floods and droughts) unevenly across the globe and the U.S. is not an exception. This has led to increased interest in coordination amongst federal agencies within the U.S. to improve readiness to respond to and mitigate the effects of these extreme events as well as for the U.S. to increase coordination with our international partners, as evidenced by a recent Quadrilateral Security Dialogue between the U.S., Japan, Australia, and India on extreme precipitation and its effects on water quality, inundation, and flooding. As the nation’s unbiased resource for land-surface information, the U.S. Geological Survey has responded by developing a set of interpretative studies and related datasets to understand changes in floods and droughts, the potential drivers of these changes, and strategies for updating frequency-based statistics for hydrological extremes. This presentation and discussion will highlight recent advancements in data and interpretation on hydrologic extremes as well as the detection of changes in, attribution of, and adjustment for observed changes.

How to cite: Archfield, S.:  U.S. Geological Survey datasets of hydrological extremes and their drivers to enhance security and improve understanding, EGU General Assembly 2024, Vienna, Austria, 14–19 Apr 2024, EGU24-21007, https://doi.org/10.5194/egusphere-egu24-21007, 2024.

EGU24-21009 | ECS | PICO | HS1.1.2

Can Trend Tests Detect Changes in Design-Flood Quantiles under Changing Climate? 

Chandramauli Awasthi, Stacey A. Archfield, Brian J. Reich, and Sankarasubramanian Arumugam

To estimate design-flood quantiles, such as the 100-year flood, the observed annual maximum flood (AMF) series is fitted to a probability distribution and then the design flood quantile is estimated from the fitted distribution. This is because, in most cases, historical records are not long enough to observe rare, design-flood events. Changes in the AMF series, which are usually detected using simple trend tests (e.g., Mann-Kendall test (MKT)), are hypothesized to result in changes in  design-flood estimates. This hypothesis is tested by using an alternate framework to detect significant changes in design-flood between two periods – rather than changes in the AMF series – and then evaluated using synthetically generated AMF series from the Log-Pearson Type-3 (LP3) distribution due to changes in moments associated with flood distribution. Synthetic experiments show that the MKT does not consider changes in all three moments of the LP3 distribution and incorrectly detects changes in design-flood. We applied the framework on 31 river basins spread across the United States. Statistically significant changes in design-flood quantiles were observed even without a significant trend in the AMF series and basins with statistically significant trends did not necessarily exhibit statistically significant changes in design-flood. If changes to design-flood quantiles are of interest, this framework can be useful rather than simple trend tests on the AMF series which may or may not indicate changes in the design-flood quantiles have occurred. We are now extending the application of the developed framework to mixed population scenarios where floods are generated from more than one causal mechanism under the hypothesis that two more causal mechanisms result in statistically different design-flood quantile estimates at the same river.

How to cite: Awasthi, C., Archfield, S. A., Reich, B. J., and Arumugam, S.: Can Trend Tests Detect Changes in Design-Flood Quantiles under Changing Climate?, EGU General Assembly 2024, Vienna, Austria, 14–19 Apr 2024, EGU24-21009, https://doi.org/10.5194/egusphere-egu24-21009, 2024.

A representative example of how extreme rainfall events caused by climate change can be directly recognized is the increase of property damage due to urban flood. This surge in urban flood damage is not merely corresponding to an augmentation in probable rainfall depth but rather a result of urbanization with densely populated and concentrated flooding. Despite this circumstance, we have mostly revolved around increasing the return period, primarily focusing on the augmentation of probable rainfall depth to mitigate the flood damage by climate change. In terms of the temporal distribution of design rainfall, conventional methods such as the Huff method and alternating blocking method are still in use; however, they cannot accurately capture the real rainfall distribution. In this context, we investigate the viability of enhancing design standards by adjusting the temporal distribution of design rainfall without artificially inflating a return period for design. To achieve that, it is necessary to understand the impact of temporal rainfall distribution on the design flood.

We generate 449 dimensionless time-rainfall distributions for short-term(less than 6 hours) and 5,789 for long-term(6 hours or more) durations considering rainfall data from both meteorological observations by the Korea Meteorological Administration and d4PDF(Data for Policy Decision Making for Future) scenarios. Based on these distributions, total 25,860 hyetographs are synthesized for five rainfall durations. We repeatedly estimated the design flood using a rainfall-runoff model, revealing that the peak discharges varied up to 10 times depending on the time-rainfall distribution. Considering that increasing the return period from 50 years to 100 years generally results in only a 10% rise in probable rainfall depths, adjusting the temporal distribution of design rainfall provides a more adaptable approach to increasing design floods. These outcomes have the potential to broaden the perspective for applications of rainfall scenarios in data-based model or establishing the design flood standards.


Acknowledgement: This research was supported by a grant(2022-MOIS61-002(RS-2022-ND 634021)) of ‘Development Risk Prediction Technology of Storm and Flood for Climate Change based on Artificial Intelligence’ funded by Ministry of Interior and Safety(MOIS, Korea).

How to cite: Kim, J. and Hwang, S.: Considering temporal distribution of design rainfall for enhancing urban flood resilience in response to climate change, EGU General Assembly 2024, Vienna, Austria, 14–19 Apr 2024, EGU24-45, https://doi.org/10.5194/egusphere-egu24-45, 2024.

EGU24-1677 | ECS | Orals | HS1.1.3

Evaluating the performance of Blue and Green Infrastructures in an urban area through a fine-scale water balance model 

Xuan Wu, Sotirios Moustakas, Nejc Bezak, Matej Radinja, Mark Bryan Alivio, Matjaž Mikoš, Michal Dohnal, Vojtech Bares, and Patrick Willems

Due to climate change and urbanization, increased extreme weather events and impervious urban surfaces have increased flood and drought risks. Blue and Green Infrastructures (BGIs) that can enhance stormwater management can help mitigate these negative effects. Nevertheless, the long-term performance of BGIs in an urban environment still requires further investigation. For this purpose, a fine-scale hydrological model and long-term water balance analysis are necessary. Accordingly, the first objective of this study is to develop a fine-scale water balance model that simulates runoff formation and propagation and incorporates BGIs. The second objective is to perform a long-term water balance analysis to determine the effectiveness of BGIs in mitigating urban floods and droughts.

The proposed water balance model is developed in Python. Model inputs include meteorological data such as rainfall and evapotranspiration, and catchment characteristics such as land use and pipe networks. This model divides the catchment into underground pipe reservoirs and surface reservoirs based on land use. All reservoirs are then connected by upstream and downstream relationships according to topological information. BGIs can be implemented by altering the properties of the reservoirs where they are proposed. To calculate the generated runoff, the continuous Soil Conservation Service Curve Number (SCS-CN) method is used in permeable reservoirs with infiltration capability, whereas the single-bucket approach is employed in impermeable reservoirs. The continuous CN method utilizes a dynamic CN and accounts for the recovery of initial abstraction between storms. In the single-bucket approach, all impermeable reservoirs are assumed to have inputs, outputs, and a certain amount of storage capacity. Rainfall and inflow from upstream reservoirs can be considered inputs, while discharge to downstream reservoirs and reuse for rain tanks can be considered outputs. These two rainfall-runoff calculation methods are validated by using monitoring data provided by the Czech Technical University in Prague and the University of Ljubljana, respectively, on green roofs and an urban park. After calculating runoff, the linear reservoir function is used as the runoff routing approach to simulate stormwater propagation according to reservoir connection relationships. Following the above processes, the water balance for the catchment can be analyzed, accounting for evapotranspiration, infiltration, reuse, overflow, and discharge at the catchment outlet.

The case study is done for the campus “Arenberg III” at the University of Leuven (KU Leuven) in Belgium. Three BGIs are proposed: permeable pavements, rain tanks and green roofs. Then five BGI scenarios are developed to evaluate the effectiveness of both single BGIs and combined BGIs: (1) campus without new BGIs, (2) every building has a green roof, (3) each building has a rain tank, (4) replacing impermeable parking lots with permeable pavements, and (5) all the BGIs listed above are implemented. The long-term water balance analysis is performed for the period 2010-2019. Initial results show that the combined BGIs scenario (5) yields the best results, as it can significantly reduce runoff and overflow, as well as provide substantial rainwater reuse and infiltration. Therefore, combining BGIs with different functions can be effective in mitigating both urban floods and droughts.

How to cite: Wu, X., Moustakas, S., Bezak, N., Radinja, M., Alivio, M. B., Mikoš, M., Dohnal, M., Bares, V., and Willems, P.: Evaluating the performance of Blue and Green Infrastructures in an urban area through a fine-scale water balance model, EGU General Assembly 2024, Vienna, Austria, 14–19 Apr 2024, EGU24-1677, https://doi.org/10.5194/egusphere-egu24-1677, 2024.

EGU24-2114 | ECS | Orals | HS1.1.3

Development of a water storage toolbox for surface-induced near-nature managed groundwater recharge 

Jan Stautzebach, Jörg Steidl, and Christoph Merz

Water stress is increasing in Northeast Germany due to climate change. New approaches for water management are needed to mitigate the impacts on the water resources. Therefore, our study deals with the development of a web-based toolbox to manage subsurface water storage by artificial groundwater recharge with focus on the lower catchment of the river Spree in the federal state of Brandenburg.

Our approach is based on a systematic combination of site selection criteria and spatial data on land use, soil, groundwater and potential water sources. The aim is to provide relevant information for the preliminary planning of managed groundwater recharge measures by authorities and water suppliers. This includes a wide range of project scales that can be covered by the tool. However, as necessary volumes for large scale recharge projects are unlikely to be found in concentrated form, small scale projects with low demand of infrastructure and energy, are of main concern. Considering surpluses from runoff and surface waters, also caused by extreme weather events, suitable locations for surface-induced recharge will be identified. Thereby, solutions with low environmental impact, like the use of natural depressions for recharge, are highlighted to the user. This will allow for a stabilization of the local water balance, induced by a large number of low impact measures.

Supported by additional modelling-based indications for implementation, efficiency and costs, as well as simplified site selection through a query system, the toolbox will offer an initial knowledge for such planning considerations.

How to cite: Stautzebach, J., Steidl, J., and Merz, C.: Development of a water storage toolbox for surface-induced near-nature managed groundwater recharge, EGU General Assembly 2024, Vienna, Austria, 14–19 Apr 2024, EGU24-2114, https://doi.org/10.5194/egusphere-egu24-2114, 2024.

EGU24-2557 | ECS | Posters on site | HS1.1.3

Advancing water resource resilience through agroforestry 

Siham El Garroussi, Fredrik Wetterhall, Christopher Barnard, Francesca Di Giuseppe, and Cinzia Mazzetti

Future climate change is expected to exacerbate hydrological drought in many parts of Europe, making effective management of water resources more imperative to ensure groundwater sustainability. The EU biodiversity strategy for 2030 suggests a strategic target to turn at least 10% of the EU’s agricultural areas into high-diversity landscape features like hedges and trees. 
In this study, we investigate how afforestation would affect hydrological conditions in Europe under climate change, focusing on three scenarios: (1) an hypothetical extreme scenario transforming all agricultural land into forests under current climate, (2) a more realistic scenario aligning with the EU biodiversity strategy which envisages converting 10% of the land under current climate, and (3) a scenario involving the conversion of 10% of agricultural land into forests, but under a climate that is 2°C warmer. 
We use the LISFLOOD hydrological model setup across Europe at a spatial resolution of ~2km forced by gridded observed precipitation and temperature over a time period of 1991-2020 under the current climate scenario. The results were evaluated as changes in evapotranspiration, groundwater levels, and river discharge peaks. The findings from the afforestation scenario indicated a rise in evapotranspiration, higher groundwater levels, and diminished river flow peaks, suggesting an improvement in water sustainability as well as an increased resilience to flooding. This study highlights the hydrological benefits of strategic land use changes, offering key insights for European water resource management and policy formulation in the face of climate change.

How to cite: El Garroussi, S., Wetterhall, F., Barnard, C., Di Giuseppe, F., and Mazzetti, C.: Advancing water resource resilience through agroforestry, EGU General Assembly 2024, Vienna, Austria, 14–19 Apr 2024, EGU24-2557, https://doi.org/10.5194/egusphere-egu24-2557, 2024.

EGU24-4675 | ECS | Orals | HS1.1.3

Modelling the impact of beaver dams on hydrological extremes following the re-introduction of beavers in England  

Benjamin Jackson, Alan Puttock, Diego Panici, and Richard Brazier

The Eurasian beaver (Castor fiber) is being reintroduced to Great Britain after an absence of ~400 years. Beavers are well known for their considerable engineering capabilities. Given the right conditions, beavers construct dams, excavate channels and maintain wetlands. These changes have been demonstrated to have a significant impact upon hydrological extremes in the English environment. There is the potential for beaver re-introduction to have a transformative impact as a widespread nature-based solution (NBS). However, there is a need for policy and management relevant understanding at a national level.

Funded by the Environment Agency in England, the aim of this study was to use a modelling approach to be able to estimate how catchments in England may respond to extreme events following the re-introduction of beavers. To accomplish this, we have applied the 2D version of the hydraulic model HEC-RAS to sites across England. Sites were selected that had the potential for beavers to construct dams.

Beaver dams are represented within HEC-RAS by digitising a series of weirs intersected by culverts, allowing water to leak through the dam as well as overtopping the weir. To account for uncertainty in dam properties, we configured the model to simulate different configurations of dam height, as well as the “leakiness” of each dam.

Using the approach described, HEC-RAS was used to simulate the impact of hypothetical beaver dams on storm events of different magnitudes in addition to low flow scenarios. Results suggest that the impact of beaver dam sequences on hydrology is highly dependent on channel and floodplain topography.

We were then able to apply these results to produce an estimation of the impact of beavers on flow regimes at any river stretch in England. This was estimated for three scenarios with high, moderate and low presence of beavers across England. It is hoped that these modelling tools can be used to strategically determine where and how beavers may be able to provide a hydrological NBS and where supporting their wetland creation could be most valuable.

How to cite: Jackson, B., Puttock, A., Panici, D., and Brazier, R.: Modelling the impact of beaver dams on hydrological extremes following the re-introduction of beavers in England , EGU General Assembly 2024, Vienna, Austria, 14–19 Apr 2024, EGU24-4675, https://doi.org/10.5194/egusphere-egu24-4675, 2024.

EGU24-5054 | Orals | HS1.1.3

Coupling stormwater protection and aquifer recharge 

Thomas Baumann and Lea Augustin

Stormwater in small catchments is a threat to agricultural land use and civilization. Increasing ambient temperatures increase the risks for severe rainfall and surface runoff and reduce the amount of groundwater recharge. At the same time, the demand for irrigation water is rising. This development calls for integrated strategies for stormwater protection and aquifer recharge.

In this contribution, we present a case study for a technical solution to infiltrate stormwater into the local aquifer. The site is located in an area well known for hop cultivation. The aquifers are located in tertiary sediments, which are covered with loess and are sometimes semi-confined. Hydraulic conductivities are in the 10-4 m/s range, and specific storage coefficients are between 10-6 (confined) and 0.2 (unconfined). Current stormwater protection plans include retention basins with a capacity of 5500 m³, not all of them fully functional, and flooding events were recorded two times per year. Demand for irrigation was 64 mm for the past five years, with peaks of 118 mm in 2022. Even if only the extreme rainfall events would be recharged into the aquifer, an area of 5-10 ha could be irrigated from the infiltrated water, assuming one extreme event. This is a significant amount of the area (15%) used for hop cultivation around the storage site.

Specific challenges at this site are the flood dynamics, the uncontrolled surface runoff, which brings a lot of fines, and the water quality with regard to fertilizers and pesticides. This requires small settling ponds or intermediate storage facilities and adsorbers. Most of the used products, however, have a medium to strong tendency to adsorb on organic carbon and even inorganic materials. The hydrogeological model indicates that the flood water can be infiltrated at high volumetric flow rates without risking upwelling groundwater tables. A detailed site investigation will be completed by mid-2024.

How to cite: Baumann, T. and Augustin, L.: Coupling stormwater protection and aquifer recharge, EGU General Assembly 2024, Vienna, Austria, 14–19 Apr 2024, EGU24-5054, https://doi.org/10.5194/egusphere-egu24-5054, 2024.

EGU24-5105 | ECS | Orals | HS1.1.3

Revealing the role of Nature-based Solutions as drought adaptation strategies 

Claudia Bertini, Muhammad Haris Ali, Andreja Jonoski, Ioana Popescu, and Schalk Jan van Andel

Climate change has caused an increase in the frequency of hydrometeorological extremes world-wide, opening new challenges for decision makers and stakeholders in managing and regulating water. Among the adaptation strategies available, Nature-based Solutions (NBSs) gained increasing attention in recent years, because of their efficiency in reducing hydrometeorological risks while also providing additional benefits for biodiversity, landscape and society. Despite the ever-increasing interest for NBSs, many stakeholders still doubt their potential, as the quantitative effects of NBSs over long periods of time are still to be assessed.

In this research, we show how several types of NBSs, such as wetlands restoration, infiltration ponds, ditch blocking and others, can be used to adapt to drought conditions under the future climate projections. We use as a pilot case the transboundary Aa of Weerijs catchment, shared between Belgium and the Netherlands, which recently became drought-prone. We develop a fully distributed coupled MIKE SHE-MIKE 11 model to mimic the hydrological behaviour of the catchment in present (2010-2019) and future climate conditions (2050-2059, scenario KNMI ‘23). The same hydrological model is then used to test the effectiveness of different drought adaptation measures, based on single type or combinations of NBSs. To quantify the impacts of the chosen strategies to adapt to drought conditions and in consultation with some local stakeholders, we define a set of Key Performance Indicators (KPIs) that provide tangible results for stakeholders and decision makers. Finally, we show the results of the different adaptation strategies implemented on a web-app, which can be accessed and used by decision makers and stakeholders as an aid tool to select the best adaption strategy.

This research has been developed within the project EIFFEL (Revealing the role of GEOSS as the default digital portal for building climate change adaptation and mitigation applications, https://www.eiffel4climate.eu/), funded by European Union’s Horizon 2020 research and innovation programme under Grant Agreement Νο 101003518.

How to cite: Bertini, C., Ali, M. H., Jonoski, A., Popescu, I., and van Andel, S. J.: Revealing the role of Nature-based Solutions as drought adaptation strategies, EGU General Assembly 2024, Vienna, Austria, 14–19 Apr 2024, EGU24-5105, https://doi.org/10.5194/egusphere-egu24-5105, 2024.

EGU24-5423 | Posters on site | HS1.1.3

Enhancing groundwater recharge in face of hydrological extremes: assessment of stormwater managed aquifer recharge potential in Flemish drinking water protection zones (Belgium) 

Lara Speijer, Simon Six, Bas van der Grift, Gijsbert Cirkel, Goedele Verreydt, Jef Dams, and Marijke Huysmans

Flanders (Belgium) is expected to experience more severe drought and flooding events in face of climate change. Infiltration to increase groundwater recharge is therefore adopted as policy strategy to deal with both hydrological extremes. Stormwater provides an interesting water source for managed aquifer recharge, given the high urbanization and imperviousness level of the region. Furthermore, the historical ban on infiltration in groundwater protection zones for drinking water production has been removed to encourage infiltration practices. This could potentially enhance groundwater recharge in the groundwater abstraction zones, but concerns remain regarding the impacts on groundwater quality due to the potential contamination of stormwater with a wide range of pollutants originating from traffic, building materials, weed control and other more diffuse sources.

Therefore, tools need to be developed to weigh out benefits of groundwater replenishment relative to potential groundwater quality risks. This research aims to contribute to the knowledge on the hydrological aspects of this quantity-quality balancing exercise by investigating the potential of stormwater managed aquifer recharge to replenish the groundwater system in Flemish groundwater protection zones. For this, potential stormwater volumes that could supply managed aquifer recharge are calculated and compared to the actual groundwater recharge and pumping volumes for drinking water production to assess the significance of this practice in protection zones.

Results indicate a variable, but high stormwater infiltration potential in Flemish protection zones, providing up to 29% extra groundwater recharge in all protection zones combined. Furthermore, this practice could compensate up to 32% of abstracted phreatic drinking water volumes. Locally, the potential can be higher, reaching 100% in protection zones located in highly urbanized areas, including zones around the city of Leuven. Stormwater infiltration can therefore be considered as an important drought adaptation measure in Flemish protection zones, given the same order of magnitude of stormwater and pumping volumes in these areas. However, recent studies raise concern on the occurrence of organic micropollutants in stormwater and data in the Dutch and Flemish setting is insufficient. Therefore, additional research on occurrence and fate of these substances is needed.

How to cite: Speijer, L., Six, S., van der Grift, B., Cirkel, G., Verreydt, G., Dams, J., and Huysmans, M.: Enhancing groundwater recharge in face of hydrological extremes: assessment of stormwater managed aquifer recharge potential in Flemish drinking water protection zones (Belgium), EGU General Assembly 2024, Vienna, Austria, 14–19 Apr 2024, EGU24-5423, https://doi.org/10.5194/egusphere-egu24-5423, 2024.

EGU24-5542 | ECS | Orals | HS1.1.3

Is drought protection possible without compromising flood protection? Estimating the maximum dual-use benefit of flood reservoirs in Southwest Germany 

Sarah Ho, Chantal Kipp, Hans Goeppert, Johannes Hoefer, Frank Seidel, and Uwe Ehret

As climate change drives intensification and increased frequency of hydrological extremes, the need to balance drought resilience and flood protection becomes critical for proper water resources management. Recent extreme droughts in the last decade in Germany have caused significant damages to ecosystems and human society, prompting renewed interest in sustainable water resources management. At the same time, protection from floods such as the catastrophic 2021 event in the Ahr Valley remain heavy in the public conscience. In the state of Baden-Württemberg in Southwestern Germany alone, over 600 small (< 1 million m3) to medium-sized (1-10 million m3) reservoirs are currently operated for flood protection. In this study, we investigate optimal reservoir operating (storage and release) rules in a dual flood-drought protection scheme for selected modeled flood reservoirs in Baden-Württemberg. Daily target releases for drought protection are proposed based on modeled inflows from the calibrated hydrological model LARSIM. In a first step, the reservoir operation is optimized in a scenario of perfect knowledge of the future by using  meteorological observations as artificial weather forecasts in LARSM. The results of different operating rules are then evaluated based on their adherence to the target releases and flood protection performance. Rulesets that result in worsened flood protection relative to the current (flood-only) operation were eliminated as potential operation schemes. Based on provisional results, we will present and discuss the maximum potential benefit of adapting and retrofitting existing flood reservoirs for drought water storage.

How to cite: Ho, S., Kipp, C., Goeppert, H., Hoefer, J., Seidel, F., and Ehret, U.: Is drought protection possible without compromising flood protection? Estimating the maximum dual-use benefit of flood reservoirs in Southwest Germany, EGU General Assembly 2024, Vienna, Austria, 14–19 Apr 2024, EGU24-5542, https://doi.org/10.5194/egusphere-egu24-5542, 2024.

EGU24-6391 | Orals | HS1.1.3

Enhancing Flood Resilience: Geomorphological Insights into Lowland Riverscapes for Nature-Based Solutions 

Inci Güneralp, Mahbub Hasan, Rakibul Ahasan, Billy Hales, and Anthony Filippi

Aimed at achieving environmentally and economically smart growth in lowland riverscapes in the face of exacerbating flood threats, the elements of natural riverscapes, such as floodplain landforms, riparian forests, and wetlands can provide solutions to flood risk reduction. Geomorphological knowledge is crucial to working effectively with river processes and landforms in addressing flood hazards. In addition to unique landforms and habitats that can support flood mitigation, landscape-level geomorphological characteristics, such as geomorphological heterogeneity and connectivity, can also impact the attenuation and retention of downstream fluxes of water, sediment, and other materials, and thus resistance and resilience to floods. In this study, we employ a geomorphological approach to delineate the natural elements of lowland riverscapes as geomorphological habitats to assess their susceptibility to floods and erosion/sedimentation as well as their capacity to alleviate the negative impacts of floods. To delineate geomorphological habitats, we utilize a range of classification approaches and geospatial data including LiDAR-derived digital terrain models, airborne and satellite images, raster/vector data on vegetation, soils, and land-cover land-use. We then quantify the diversity, heterogeneity, and connectivity of delineated habitats using landscape ecological approaches and in the context of flood impacts and mitigation. Our geomorphological approach to riverscape characterization provides new insights on fundamental knowledge of natural elements as geomorphological habitats and their interconnections and interdependencies. This new knowledge has a high potential for developing geomorphologically derived nature-based solutions to flood management and enhancing flood resilience of lowland riverscapes.

How to cite: Güneralp, I., Hasan, M., Ahasan, R., Hales, B., and Filippi, A.: Enhancing Flood Resilience: Geomorphological Insights into Lowland Riverscapes for Nature-Based Solutions, EGU General Assembly 2024, Vienna, Austria, 14–19 Apr 2024, EGU24-6391, https://doi.org/10.5194/egusphere-egu24-6391, 2024.

Water is an essential natural resource for human survival and development. In recent years, global climate change has led to noticeable shifts in rainfall patterns. In Taiwan, the gap between wet and dry years has gradually widened, and rainfall has become shorter in duration but more intense. This has increased the frequency of spring droughts in Taiwan. Hence, there is an urgent need to propose a new water utilization model.

The bucket model is employed to estimate parameters that are challenging to measure, while Bayesian networks are utilized to establish causal relationships among environmental factors. In addition, Bayesian Network is a systematic network based on conditional probability for constructing relationships between factors. It has been shown to capture crucial groundwater flow properties and uncertainties in groundwater systems. This study seeks to alter the previous management strategy, which prioritized the use of surface water during the rainy season. Consequently, two distinct theoretical models were established for comparison. Model 1 gives precedence to surface water usage, whereas Model 2 prioritizes groundwater usage. Compare the remaining water in surface and groundwater before the next rainy season. The results indicate that, under 'high' conditions, the capacity of groundwater and surface water in Model 2 will be 18% greater than in Model 1. This is attributed to groundwater resources flowing to the surface or serving as a source of submarine groundwater discharge due to saturated aquifers. Additionally, Bayesian networks were employed to conduct a sensitivity analysis of factors. The two most influential factors on the target node are rainfall and groundwater inflow and outflow from the outside area.

How to cite: Lai, C. C. and Lin, Y. C.: Conjunctive management strategies of groundwater and surface Water: a case study of meinong reservoir in Taiwan, EGU General Assembly 2024, Vienna, Austria, 14–19 Apr 2024, EGU24-7123, https://doi.org/10.5194/egusphere-egu24-7123, 2024.

EGU24-7837 | ECS | Orals | HS1.1.3

Study of Nature-Based Solutions for the Huang River Watershed 

Guan-Yu Lin, Kuo-Wei Liao, Pohsaun Lin, Kai-Lun Wei, and Tsungyu Hsieh

In response to the increasingly complex challenges faced by our environment and society, there's a paradigm shift in flood management practices within the field of hydraulic engineering. Traditional approaches using gray infrastructure are giving way to Nature-based Solutions (NbS), which prioritize sustainability and ecosystem-based approaches. Despite widespread discussions about NbS potential, there's a lack of a clear framework for its application and evaluation. This paper aims to apply Nature-based Solutions (NbS) measures for the Huang River Watershed, located in northern Taiwan. A clear process for planning and assessing the benefits of NbS is established while providing relevant case studies as demonstrations. The planning process thoroughly considers the opinions of stakeholders. To evaluate the effectiveness of the implemented measures, several methods such as hydraulic modeling using HEC-RAS 2D, ecosystem service assessment via Integrate Valuation of Ecosystem Services and Tradeoffs (InVEST), and flood risk analysis through reliability analysis are adopted. Results shown that the designed wetland can reduce the flooded area downstream of the Huang River by 9.86% for a 50-year flood and by 3.95% for a 2-year flood; the designed wetland will increase carbon storage by 75.74% and reduce soil erosion by 50.77%, while habitat quality will be maintained at a similar level and the probability of flooding reduces to 3%. By leveraging the above assessment methods, this study can bridge the gap between engineering and ecological conservation fields via demonstrating the benefits of NbS implementation. The outcomes of this research are intended to serve as a valuable reference for future studies and inform decision-making processes related to similar projects.

How to cite: Lin, G.-Y., Liao, K.-W., Lin, P., Wei, K.-L., and Hsieh, T.: Study of Nature-Based Solutions for the Huang River Watershed, EGU General Assembly 2024, Vienna, Austria, 14–19 Apr 2024, EGU24-7837, https://doi.org/10.5194/egusphere-egu24-7837, 2024.

EGU24-9875 | ECS | Posters on site | HS1.1.3

Dewatering and Treatment of Domestic Sewage Sludge Using Constructed Reed Bed  

Tahra Al-Rashdi

Sultanate of Oman produces a high volume of wastewater on a daily basis. Since conventional / mechanical wastewater treatment methods are mostly used in the country, a respectively high volume of sludge by-product is also generated daily. Sludge is defined as a mixture of water, organic matter and inorganic matter resulting from the biological treatment of wastewater. Oman manages the generation of sludge by discharging about 84% of it in the landfills, especially the Sewage Treatment Plants (STPs) located outside the capital city of the country (Muscat Governorate), while about 16% of produced sludge is collected by Oman Water and Wastewater Services company and is further processed through composting to produce a fertilizer (‘Kala’ brand name).

For these reasons, revolutionary and cost-effective means and ways are needed to manage the sludge for environmentally friendly sound disposal and reuse. One of the promising and state-of-the-art sustainable technologies is the constructed wetland technology for dewatering and stabilization of sludge. The Sludge Treatment Wetland (STW) system depends on the type of substrate, type of plants and microbial communities that play an important role in the treatment and dewatering of the sludge. In addition, it contributes to the decentralized management of sludge, a parameter that is crucial for small and medium STPs.

This study focuses on the construction of STWs, i.e., vertical flow constructed wetland designed for sludge dewatering, using local common reed plants (Phragmites Australis) to treat activated sludge from Alseeb STP. A pilot scale experiment was conducted in an agricultural experiment station. This study is the first one in Oman and across the Arabic peninsula that tests the STW technology. The study consisted of 18 mesocosms tanks. Each tank has dimensions of 89 cm in height and 0.5 m² surface area. The freeboard in each tank was 54 cm above the top gravel layer. The units are filled with substrate media from top to bottom: 15 cm fine gravel (2-6 mm), 15 cm medium gravel (15-25 mm) 5 cm and drainage layer of cobbles (40-60mm). Two plastic tubes extending vertically with an open top are embedded in the bottom of each unit. The various units have different construction and operation parameters such as planted and unplanted beds (i.e., presence and absence of plants) and three different sludge loading rates (SLR; 75, 100, 125 kg/m²/year).

The results showed the dewatering efficiency reached 97% for the planted STWs compared to 91% for the unplanted beds. The total solids content in the dewatered sludge for the three SLRs (75, 100 and 125 m²/kg/year) were between 23 -56%, 16-57% and 11-42%, respectively. These first results demonstrate that a high total solid content in the dewatered sludge can be achieved even at a relatively high SLR of 100 m²/kg/year after almost 2 years of operation. This means that the dry content can be further increased in the final resting phase that is going to be applied before the emptying of the biosolids from the units.

How to cite: Al-Rashdi, T.: Dewatering and Treatment of Domestic Sewage Sludge Using Constructed Reed Bed , EGU General Assembly 2024, Vienna, Austria, 14–19 Apr 2024, EGU24-9875, https://doi.org/10.5194/egusphere-egu24-9875, 2024.

Droughts are classified as the most expensive climate disasters as they leave long-term and chronic impacts on the ecosystem, agriculture, and human society. The frequency, intensity, and duration of drought events have shown a historical increase and are projected to escalate globally, continentally, and regionally in the future. Nature-based solutions (NBS) are highlighted as effective solutions to cope with the future impacts of these events. Until now, there has been a lack of a comprehensive suitability mapping framework that considers drought-specific criteria. To address this gap, a novel framework is introduced, targeting the identification of suitable areas for two drought-mitigating NBS types—detention basins and managed aquifer recharge—on a regional scale. 

This new framework incorporates diverse criteria to specifically address drought conditions. For example, by incorporating climate change scenarios for both surface and groundwater, it identifies suitable and sustainable locations capable of managing extreme drought events. Executed through Boolean logic at a regional scale in Flanders (Belgium), the framework's strict approach yields significant potential areas for detention basins (298.7 km²) and managed aquifer recharge (867.5 km²). Incorporating multi-criteria decision-making (MCDM) with the same criteria introduces a higher degree of flexibility for decision-makers. This approach shows a notable expansion across Flanders, varying with the level of suitability. The results underscore the highly suitable potential for detention basins (2840.2 km²) and managed aquifer recharge (2538,7 km²), emphasizing the adaptability and scalability of the framework for addressing drought in the region.

How to cite: De Trift, L. and Yimer, E. A.: Framework for identifying large-scale Nature-Based Solutions for drought mitigation: regional application in Flanders , EGU General Assembly 2024, Vienna, Austria, 14–19 Apr 2024, EGU24-10085, https://doi.org/10.5194/egusphere-egu24-10085, 2024.

Combining flood dams with aquifer recharge may enhance water resource sustainability, flood protection and drought prevention. In an off-stream reservoir with a high seepage rate, some of the stored surface water can infiltrate into the aquifer. The recharged water can later supplement the water released from the reservoir to fulfill the requested water demand. In such cases, optimal reservoir management requires consideration of the leakage losses (aquifer recharge rate). In this study, a methodology, based on the combination of a calibrated numerical groundwater flow model (MODFLOW, Harbaugh et al., 2017) for simulating reservoir-aquifer interaction, and an optimization model, for the reservoir operation management considering surface/groundwater interactions is presented. The groundwater flow model was developed by means of the FREEWAT platform (Rossetto et al., 2018) and used to obtain a leakage function representing the reservoir's leakage loss to the aquifer in response to different water levels in the reservoir. The leakage function is embedded to the reservoir mass balance equation in the optimization model. The optimal policy was derived based on maximizing the reservoir's water yield while considering different constraints such as the water demand and storage constraints. The modeling method proposed in this study was applied to an off-stream artificial lake located atop an alluvial aquifer in the north-east of Iran. The reservoir was built to store the flood flows of the Bar river for water supply for domestic and industrial needs and with the secondary objective to intentionally recharge the aquifer. Based on the results, the distance between the total demand (12 Mm3/year) and optimal release from the reservoir (5.7 Mm3/year) could be largely supplied by groundwater via pumping wells while the aquifer recharge provided by the leakage is 7.26 Mm3/year. This study demonstrates that the possibility to move surface water to aquifers offers an opportunity to better manage water resources, increase water supply reliability and resiliency (Joodavi et al., 2020). Furthermore, the methodology presented can be tailored for application to any reservoir (artificial lake) system, enhancing its operational, planning, and management aspects. This allows for a precise evaluation of the impact of operational policies on lakebed seepage.

References

  • Rossetto, R., De Filippis, G., Borsi, I., Foglia, L., Cannata, M., Criollo, R., Vázquez-Suñé, E., 2018. Integrating free and open source tools and distributed modelling codes in GIS environment for data-based groundwater management. Environ. Model. Software 107. https://doi.org/10.1016/j.envsoft.2018.06.007
  • Harbaugh AW, Langevin CD, Hughes JD, Niswonger RN, Konikow LF, 2017. MODFLOW-2005 version 1.12.00, the U.S. Geological Survey modular groundwater model: U.S. Geological Survey Software Release, 03 February 2017, http://dx.doi.org/10.5066/F7RF5S7G
  • Joodavi A, Izady A, Karbasi Maroof MT, Majidi M, Rossetto R, 2020. Deriving optimal operational policies for off-stream man-made reservoir considering conjunctive use of surface- and groundwater at the Bar dam reservoir (Iran), Journal of Hydrology: Regional Studies. 31, 100725, https://doi.org/10.1016/j.ejrh.2020.100725

How to cite: Joodavi, A. and Rossetto, R.: Study on operation strategy for a multi-objective off-stream reservoir with large lakebed seepage to enhance climate resilience , EGU General Assembly 2024, Vienna, Austria, 14–19 Apr 2024, EGU24-10272, https://doi.org/10.5194/egusphere-egu24-10272, 2024.

EGU24-11325 | ECS | Posters on site | HS1.1.3

Indicators for anthropogenic and natural water contributions to a small river 

Malina Ruck, Lea Augustin, and Thomas Baumann

River quality is expected to change significantly as a consequence of climate change. Extended drought periods and decreasing groundwater levels will lower the contribution of groundwater to receiving streams and heavy rain will cause excessive surface runoff effects. Constant sources, like discharge from wastewater treatment plants or industrial installations, will be diluted in largely different ratios. The overall hydrochemical dynamics will, therefore, likely increase. This affects flood management schemes and other potential uses of river water.


This study links trace substances (hydrochemistry, colloids) to the hydrological dynamics in the catchment. From this data the feasibility of infiltrating excess river water into a nearby aquifer (Flood-MAR) is assessed. The upper part of the study area is characterized by forests and meadows. There is a small village with one sewage treatment plant (1000 inhabitant equivalents) and a few hamlets. Additional emissions can be expected from surface runoff of one national road (deicing, tire abrasion, etc.).


The hydrochemical characteristics show a decrease in the main cations and anions during a flooding event. Nitrate concentrations were low in both cases. Although particle concentrations were increasing during the flooding event, the overall concentrations were still below our expectations. This indicates that the meadows behind the retention dam, which were partly flooded, served as a settling ponds and filters. During low water conditions, organic material and algae were dominant. Few calcite particles and silicates are indicative of the composition of the quaternary gravels that make up the aquifer.


The results confirm the risk assessment of the study area. The water quality during a flooding event met the legal thresholds set in the German Soil Protection Act, so infiltration into the downstream aquifer should be feasible.

How to cite: Ruck, M., Augustin, L., and Baumann, T.: Indicators for anthropogenic and natural water contributions to a small river, EGU General Assembly 2024, Vienna, Austria, 14–19 Apr 2024, EGU24-11325, https://doi.org/10.5194/egusphere-egu24-11325, 2024.

EGU24-11339 | Orals | HS1.1.3

Co-benefit valuation of urban and peri-urban nature in high resolution on continental scale 

Roland Löwe, Martina Viti, Karsten Arnbjerg-Nielsen, and Jacob Ladenburg

Space is a highly valued asset in cities. This is a key reason why nature-based solutions (NBS) for water management are often perceived to be more expensive than traditional grey
solutions. Promoting NBS implementation requires methods for quantifying their non-market benefits that are widely accepted and easy-to-apply in early planning and brainstorming stages.

In this work, we develop a predictive metamodel for the total economic value of urban and peri-urban nature, based on 114 stated-preference valuation studies of nature in (peri-)urban areas and openly available geographic data from across the world. The dataset covers the entire range of NBS types with sizes from 0.5 to 900.000 ha. We employ a mixed-effects modelling approach and use a cross-validation procedure to determine which factors affect the willingness to pay for (peri-)urban nature. We consider the predictive performance of 8.4 million model permutations that consider different combinations of site properties and topographic and socio-economic characteristics of the surroundings as input.

We find that the total economic value is determined by the size of the nature areas and population densities in their surroundings. There is clear evidence for substitution effects where available nature areas reduce the willingness to pay for new nature. Beyond the dependency on area, there is little evidence for making distinctions between nature types. Economic values do depend on the average income at a site, but these variations are entirely captured by purchase power corrections. Our value estimates are aligned with related literature and range between 150 and 400,000 USD/ha/year. We have implemented our metamodel into a freely available Python program, which generates maps of the predicted values for any location in Europe in a spatial resolution of 100m.

How to cite: Löwe, R., Viti, M., Arnbjerg-Nielsen, K., and Ladenburg, J.: Co-benefit valuation of urban and peri-urban nature in high resolution on continental scale, EGU General Assembly 2024, Vienna, Austria, 14–19 Apr 2024, EGU24-11339, https://doi.org/10.5194/egusphere-egu24-11339, 2024.

The implementation of Natural Flood Management (NFM) measures theoretically provides an opportunity to build resilience into flood risk management systems in a way that incorporates sustainable practices and holistic management of the landscape. However, there remains a lack of clear understanding of these solutions, and in practice this can hinder the uptake of NFM;  there is a need to expand the emerging evidence base in order to quantify and demonstrate their effectiveness in a range of catchment and storm event scenarios.

This study focuses on an NFM scheme implemented across a 22km2 rural, lowland catchment in Lincolnshire, UK. An additional 46,000m3 of storage has been created through the construction of five offline attenuation ponds and a number of field-edge swales alongside the channel network. Land management practices in this catchment have resulted in significant modifications to the hydrological processes through historical realignment and modification of the channel network, intensive agricultural practices and the installation of tile drainage beneath arable fields. The Swaton Eau catchment is located in a lowland area with an elevation range of less than 50m across the catchment. It is important to investigate how NFM features are expected to perform in catchments that are characterised by hydro-modifications and low gradients as there currently is a lack of research of this.

An array of monitoring has been installed across the catchment in a nested structure to gather empirical evidence on the performance of the NFM scheme both at a feature scale and at a wider sub-catchment and catchment scale. Water level sensors are located throughout the channel network to track the propagation of the peak flood level. Transects of soil moisture sensors are buried in the shallow sub-surface in chosen swales to monitor short time-scale movement of water through these features.

The first major test of the features occurred in October 2023 during Storm Babet and Storm Ciaran. Field evidence indicates that the flood wave was attenuated through the catchment with a less flashy catchment response observed compared to a pre-NFM event in 2012. Soil moisture data collected within the swales indicates that they are intercepting pathways of water through the catchment and preventing runoff entering the surface water drainage network.

How to cite: Lewis, C. and Pattison, I.: Understanding the role of natural flood management in a ‘not-so-natural’ catchment: field observations of an NFM scheme in rural, lowland Lincolnshire, EGU General Assembly 2024, Vienna, Austria, 14–19 Apr 2024, EGU24-11525, https://doi.org/10.5194/egusphere-egu24-11525, 2024.

Groundwater is considered worldwide an important and resilient reserve of freshwater for human needs. The increasing demand, combined with climate change impacts, is leading to a remarkable quali-quantitative decay of water resource, especially in many megacities of the Global South, where the rapid urban growing pushed to environmental critical issues as the case of seawater intrusion for coastal aquifers. At the same time, the uncontrolled urbanization without a territorial planning favors the runoff and places ever greater areas in hydraulic danger, increasing the risk of flooding in currently inhabited areas. Dar es Salaam, in Sub-Saharan Africa, is one of these cases: a city of more than 4 million of inhabitants, with a population growth rate of about 5 per cent per year. A high dependence on natural resources ecosystems is mainly due to hybrid rural-urban livelihoods. The urban pressure on the aquifer caused a serious threat on water quality and quantity due to saline intrusion along the coastline, with depletion of groundwater levels and contamination of pumping wells. Moreover, the increasing risk of water scarcity and flooding due to climate change is threatening the local community, with an increasing need for adaptation measures. Catchment imperviousness of Mbezi River basin increased by 41% (2003-16), causing floods, erosion, land and marine pollution.

A new vision needs to integrate the groundwater management strategies, already proposed in the context of the “Adapting to Climate Change in Coastal Dar es Salaam” (ACC-DAR) project, with surface water management too. Aim of this feasibility study is to outline a strategy for a sustainable water management in the Dar Es Salaam territory, through the planning of MAR (Managed Aquifer Recharge) solutions in specific areas. This approach could be helpful to solve or, at least, mitigate the impact of both flooding and groundwater overexploitation in the area, allowing to support stakeholders and public government in implementing local policies and proposing a more sustainable use of the resource.


How to cite: De Filippi, F. M. and Sappa, G.: A new planning strategy for integrating surface water and groundwater management to face climate change impacts in the Dar Es Salaam Plain, Tanzania (Africa)., EGU General Assembly 2024, Vienna, Austria, 14–19 Apr 2024, EGU24-11760, https://doi.org/10.5194/egusphere-egu24-11760, 2024.

In Canada’s Western Boreal Plain, catchment runoff is typically low but spatially variable. Localized landscape soil and vegetation cover types, along with the hydrophysical properties of underlying glacial deposits and regional slopes, are important controls for the partitioning of precipitation into runoff, evapotranspiration, and soil water storage. Wetlands are abundant, covering up to 50% of the landscape, despite a regional sub-humid climate. Local topographic highs, including Stony Mountain, have been identified as water generation hotspots, with the goal of this research to evaluate the hydrology and importance of small headwater catchments on a local topographic high for water generation and availability in downgradient systems.

Hydrologic interactions between forestlands and adjacent wetlands were characterized and related to observations of small-scale (headwater) catchment runoff dynamics within the Stony Mountain Headwater Catchment Observatory (SMHCO) in northern Alberta, Canada. Catchment runoff efficiency, or runoff coefficients (i.e., the proportion of rainfall the is produced as runoff), were evaluated for 40 events across six wetland-dominated catchments ranging in size from <0.5 km2 to ~ 200 km2. Water table configurations indicated varying exchanges among forested hillslopes and adjacent wetland systems, with the magnitude of runoff response to rainfall events controlled largely by antecedent water table configurations. Small (<10 km2) headwater catchments demonstrated highly variable runoff efficiencies, ranging from 10 to 90% (average 35%). Larger meso-scale catchments (up to 200 km2) demonstrated lower runoff efficiency (average = 25%; range 10 to 40%). The higher catchment runoff efficiencies observed in smaller headwater catchments identifies these regions as highly productive regions for water generation on a per-unit area basis. Accordingly, the findings of this research demonstrates that smaller sub-catchments within headwater regions of larger catchments represent an important area for water supply and availability for down-gradient ecosystems and water courses.   

How to cite: Ketcheson, S. and Attema, J.: The importance of headwater catchments for water availability in the lower Athabasca River Basin, Canada., EGU General Assembly 2024, Vienna, Austria, 14–19 Apr 2024, EGU24-11839, https://doi.org/10.5194/egusphere-egu24-11839, 2024.

EGU24-12100 | Posters virtual | HS1.1.3

Nature-based solutions for hydro-meteorological extremes in South Asian countries: Current practices, gaps, and opportunities  

Md Humayain Kabir, Md Arif Chowdhury, Md Nazmul Hossen, Shahpara Nawaz, Syed Labib Ul Islam, and Md Lokman Hossain

South Asian countries are highly susceptible to different forms of hydro-meteorological extremes (HMEs) like cyclones, storm surges, floods, erosion, sea level rise, etc., while changing patterns of climate variability also make the situations worse. Nature-based Solutions (NbS) in different forms, like mangrove forests, coral reefs, salt marshes, beach nourishment, reforestation and afforestation, wetland restoration, etc., can help to reduce the magnitude of impacts. This study was conducted in South Asia countries to understand the existing practices, challenges, and potentiality of NbS regarding HMEs. The findings of sea level rise-induced extreme events are summarized as follows: (a) Significance of coastal ecosystems in mitigating impacts of HMEs, (b) NbS approaches for coastal protection and restoration, (c) Co-benefits of NbS for coastal protection and restoration, (d) Coastal Protection and NbS: South Asia Perspective- (i) Current practices of NbS to protect the coastal region, (ii) Challenges to ensure NbS regarding coastal protection, and (iii) Potentiality of NbS to protect the coastal region.

Unusual rainfall patterns and their connection to landslides, along with the environmental and socioeconomic consequences and threats to vulnerable groups, are examined. We also delve into NbS interventions that stabilize slopes and prevent erosion-related events, emphasizing the significance of early warning systems, community-based strategies, and disaster preparedness measures to enhance resistance and resilience. Case studies from Chittagong Hill Tracts and Rohingya Camps in Bangladesh demonstrate the customization of NbS approaches to meet particular needs.

An in-depth analysis of diverse NbS approaches, including forest and floodplain restoration, construction of wetlands and green infrastructure, and several other solutions for urban flood prevention, is presented. The extent of their effectiveness and barriers to expanding NbS practices are discussed, encompassing a range of contexts from high-income urban areas to medium and low-income regions. The focus lies on the adaptability and potential impact of NbS in various contexts, providing valuable insights into their applicability. Barriers to large-scale implementation of NbS for urban flood prevention are elucidated, encompassing legislative, financial, and societal challenges that impede the integration of NbS in practice and policies, which hinder employing initiatives for a long-term national plan for NbS. Strategies to surmount these barriers are discussed, offering insights for stakeholders seeking to navigate the complexities of NbS integration. We conclude that although NbS can be considered a cost-effective and sustainable way to protect natural ecosystems and human properties, it needs more concentration to integrate into decision-making aspects from policy to practice perspectives.

How to cite: Kabir, M. H., Chowdhury, M. A., Hossen, M. N., Nawaz, S., Islam, S. L. U., and Hossain, M. L.: Nature-based solutions for hydro-meteorological extremes in South Asian countries: Current practices, gaps, and opportunities , EGU General Assembly 2024, Vienna, Austria, 14–19 Apr 2024, EGU24-12100, https://doi.org/10.5194/egusphere-egu24-12100, 2024.

EGU24-14321 | ECS | Posters on site | HS1.1.3

Assessing habitat area changes from large-scale nature-based solutions 

Yared Abayneh Abebe, Samikshya Chhetri, Laddaporn Ruangpan, and Zoran Vojinovic

One of the benefits of nature-based solutions (NBS) is providing environmental benefits, which regulate and maintain ecosystem services and foster positive impacts on ecosystems. Environmental benefits of NBS include enhancing water quality, habitat changes, improving biodiversity and carbon sequestration and storage. In this research, we developed a method to assess changes in habitat areas using remote sensing data.

Since mapping habitats is a harder task, our method is based on mapping and detecting changes in land cover over a region and translating that to changes in habitat area. We employed the CORINE Land Cover (CLC) classes and EUNIS habitat classes, two commonly used classification systems for land cover and habitat types, respectively. To assess the change in habitat type and area before and after implementing NBS, the CLC Level III classes were transformed into EUNIS Level I habitat types. The CLC datasets of 2000 and 2018 were used as the land covers before and after implementing an NBS. We applied the method in Aarhus, Denmark, in two study areas called Egå Engsø and Lystrup. An artificial lake and wetland that covers an area of 115 hectares was implemented in 2006 in Egå, surrounded by 35 hectares of grazed meadows. The NBS in Lystrup includes basins, gullies and rainbeds. The purposes of the NBS are to reduce the flood risk from the river Egå and isolated storms, reduce the nitrogen supply to Aarhus Bay and improve the natural conditions in the area.

Results showed the conversion of a cultivated habitat to an inland surface water habitat. A bogs, mires and fens habitat had also emerged west of the wetland. In the southwest of the wetland, an agricultural habitat had changed to a complex habitat, and the south of the region was surrounded by an artificially dominated habitat. Finally, a complex habitat had changed to a constructed habitat in the southeast of the wetland. On the other hand, habitat changes had not altered significantly in Lystrup despite the implementations of NBS projects. It is also possible that NBS-induced modifications could not be recorded by the method as the area was a complex habitat characterized by a heterogeneous blend of different habitats. One limitation of this method could be that it is difficult to delineate changes within complex habitats. Additionally, the limitation arises from the translation of the land cover classes to habitat classification. However, the research offers a method to quantify one of the environmental benefits NBS generate to encourage decision-makers to implement and scale them up further.

How to cite: Abebe, Y. A., Chhetri, S., Ruangpan, L., and Vojinovic, Z.: Assessing habitat area changes from large-scale nature-based solutions, EGU General Assembly 2024, Vienna, Austria, 14–19 Apr 2024, EGU24-14321, https://doi.org/10.5194/egusphere-egu24-14321, 2024.

EGU24-16242 | Orals | HS1.1.3

Preliminary Assessment of Nature-Based Solutions Performance for Improving Irrigation Water Management Using the SWAT Model 

Vassilios Pisinaras, Konstantinos Babakos, Anna Chatzi, Dimitrios Malamataris, Vassiliki Kinigopoulou, Evangelos Hatzigiannakis, and Andreas Panagopoulos

Nature-based solutions (NBS) offer innovative and sustainable approaches to address irrigation water management challenges, since they can contribute significantly to enhancing water retention, reducing soil erosion, and optimizing water use efficiency. Within this framework, the Soil & Water Assessment Tool (SWAT) model was applied in the Pinios Hydrologic Observatory (PHO) in central Greece to quantify the impact of two NBSs on irrigation water use: a) effective soil water management through irrigation scheduling and b) increased soil water holding capacity through mulching and mowing. Encompassing an area of approximately 55 km2, PHO comprises forested and agricultural lands, predominantly cultivated with apples, followed by cherries and other orchards.

The SWAT model was applied in the PHO watershed for the period 2018-2022 and calibrated against soil water content with daily observed data obtained from soil moisture sensors installed both in forested and agricultural areas. A hybrid land use map, compiled by combining CORINE land cover and field-scale crop distribution, was utilized and the watershed was subdivided into 15 sub-watersheds and 696 Hydrologic Response Units (HRUs). Monitoring of actual irrigation water consumption in 10 orchards revealed an average of 670 mm per cultivation period. Simulation of irrigation scheduling using the SWAT model indicated a potential reduction of more than 20% in irrigation water consumption in the apple orchards.

Continuous cultivation for several decades, irrational irrigation and the excessive use of herbicides practiced in PHO affect soil health, potentially leading to soil organic content (SOC) depletion, microbial activity disruption, and overall soil fertility compromise. Augmenting SOC enhances soil water holding capacity, fostering improved moisture retention and resilience against drought conditions. Analysis of over 500 soil samples collected from orchards implementing mulching/mowing practices compared to those predominantly using herbicides revealed an average SOC 1.2% higher for soil depths of 0-10 cm and 0.6% higher for depths of 10-30 cm. This increase in SOC is estimated to potentially raise soil available water content by 2%, contributing to 3% more irrigation water savings when coupled with effective soil water management through irrigation scheduling. While this water-saving potential may not be high, it can contribute significantly to mitigating water scarcity during drought periods, whilst should SOC increase is achieved by mulching/mowing and no use of herbicides, soil erosion is prevented, soil aeriation is improved, natural pollinator population is increased and agrochemicals’ runoff potential is reduced.


Acknowledgements

This research was funded by PRIMA program supported by the European Union, grant number 2041 (LENSES—Leaning and Action Alliances for Nexus Environments in an Uncertain Future) (Call 2020 Section 1 Nexus IA).

How to cite: Pisinaras, V., Babakos, K., Chatzi, A., Malamataris, D., Kinigopoulou, V., Hatzigiannakis, E., and Panagopoulos, A.: Preliminary Assessment of Nature-Based Solutions Performance for Improving Irrigation Water Management Using the SWAT Model, EGU General Assembly 2024, Vienna, Austria, 14–19 Apr 2024, EGU24-16242, https://doi.org/10.5194/egusphere-egu24-16242, 2024.

EGU24-17611 | Orals | HS1.1.3

When can rewetting of forested peatlands reduce extreme flows? 

Maria Elenius, Charlotta Pers, Sara Schützer, and Berit Arheimer

Historical drainage to improve agricultural and forestry practices has resulted in almost 1 million km of artificial channels in Sweden. This has reduced the storage of water in the landscape, and there are concerns related to the potential impacts on extreme flows, biodiversity, greenhouse gas emissions and nutrient outputs. A large national restoration program aims to rewet 100 000 hectares forested peatland. However, there is limited evidence in what the impacts will be.

Here, we implemented national information on ditches to the hydrological model HYPE and investigated the conditions at which removal of ditches in forested peatland could mitigate extreme flows under various conditions of the climate and local hydrology. We found that the impact on discharge at the level of 10 km2 sub-catchments or larger was small, mostly because only small fractions of the catchments consist of drained forested peatlands, meaning there is considerable mixing with other runoff. However, smaller streams with runoff primarily from the restored peatlands could have substantial impacts of restoration, which may be important for local biodiversity.

For instance, a modelling sensitivity study showed the minimum runoff per year from forested peatlands increased by up to about 15 % after removing ditches and the maximum runoff was reduced by up to about 25 %. Importantly, an increase in the minimum runoff was only obtained if the minimum groundwater level was low enough in relation to the depth of ditches. Similarly, a reduction of the largest yearly runoff required that ditches were not too deep.

If conditions were not favorable to mitigate extreme runoff, the opposite situation often occurred instead, with worse extremes. Therefore, although the impact on extreme flows was negligible at the level of 10 km2 catchments or larger, it is crucial to choose appropriate sites for restoration with respect to runoff extremes if there are sensitive smaller streams with runoff deriving mostly from the peatlands. The work presented here shows how this can be performed with the use of indicators for groundwater levels and ditch drainage prior to rewetting. Specifically, the minimum runoff is expected to increase only if the minimum groundwater level prior to rewetting is below the depth of ditches, or close to that depth. Reductions in the maximum runoff require ditches are not too deep, and large reductions cannot be expected if the groundwater level was already temporarily above the soil surface prior to rewetting, for example due to lateral inflow.

How to cite: Elenius, M., Pers, C., Schützer, S., and Arheimer, B.: When can rewetting of forested peatlands reduce extreme flows?, EGU General Assembly 2024, Vienna, Austria, 14–19 Apr 2024, EGU24-17611, https://doi.org/10.5194/egusphere-egu24-17611, 2024.

EGU24-17780 | Posters on site | HS1.1.3

High Enthalpy Shallow Geothermal Energy: The Anomaly 

Alejandro Gil, Juan Carlos Santamarta, Carlos Baquedano, Jorge Martínez León, Miguel Ángel Marazuela, Samanta Gasco Cavero, Jon Jimenez, Teresa Alonso Sánchez, Miguel Ángel Rey Ronco, José Ángel Sánchez-Navarro, Alicia Andreu Gallego, and Juan Miguel Tiscar Cervera

The SAGE4CAN project focuses on investigating the shallow geothermal potential of the Canary Islands. During the project execution in 2021, the Tajogaite volcanic eruption took place. This eruption resulted in the deposition of lava flows, totaling approximately 200 million cubic meters, with temperatures ranging between 400 and 900°C. Remarkably, these materials represent a shallow geothermal reservoir of exceptionally high enthalpy, deviating from conventional shallow geothermal reservoirs that typically maintain temperatures close to the annual atmospheric average.

This study presents the calculated results of harnessing geothermal energy from these deposits during the cooling period of the lava flows. The goal is to extract heat from the reservoir to generate both electricity and domestic hot water. The unique nature of this geothermal reservoir, characterized by its elevated temperatures, challenges the conventional understanding of shallow geothermal systems, offering an exceptional opportunity for sustainable energy utilization in the Canary Islands. Moreover, these findings provide a framework for redefining shallow geothermal potential, traditionally associated only with depth. While depth remains a crucial factor, our study highlights the exception that proves the rule, demonstrating that geothermal anomalies, such as the one observed here, contribute valuable insights to the broader understanding of shallow geothermal resources in the Canary Islands.

How to cite: Gil, A., Santamarta, J. C., Baquedano, C., Martínez León, J., Marazuela, M. Á., Gasco Cavero, S., Jimenez, J., Alonso Sánchez, T., Rey Ronco, M. Á., Sánchez-Navarro, J. Á., Andreu Gallego, A., and Tiscar Cervera, J. M.: High Enthalpy Shallow Geothermal Energy: The Anomaly, EGU General Assembly 2024, Vienna, Austria, 14–19 Apr 2024, EGU24-17780, https://doi.org/10.5194/egusphere-egu24-17780, 2024.

Nature-based solutions have the capability to slow and store water during storm events, leading to the attenuation of flood peaks and the capturing of sediments and associated nutrients. These features can also provide important habitats for wildlife and pollinators. However, these features do take land that may be agriculturally productive and require maintenance, both factors mean that they have potentially significant ongoing costs. Therefore, it is important to ensure that they are effective and correctly located within the landscape. For all pressures, the location needs to be in a location where the problems are likely to originate. However, for flood waters, it is important to target locations that are likely to contribute to moving water out of the flood peak and into the receding limb of the hydrograph, rather than moving water from the rising limb into the peak. It is also important not to move water from the peak discharge of one community into the peak discharge of another. Therefore, careful analysis and planning are needed to ensure that the benefits from the nature-based solutions are maximised for all in the catchment.


The SCIMAP Toolkit provide an approach to assess the potential source area of flood waters, sediments, nutrients and FIOs and to ensure that the multiple benefits of the nature-based solution are realised. The toolkit uses a reduced complexity approach to map the generational of rapid runoff, the mobilisation of material and connectivity to the receiving waters. The SCIMAP-Flood module then considers the travel times to the impact points within the catchment, such as a community or key infrastructure.  This analysis is undertaken in a time-integrated way such that the potential benefits of a nature-based solution are optimised over a range of storms rather than fitting to the unique dynamics of a past event. The analysis is undertaken at landscape extent with sub-field detail, normally at a ground resolution of 1m with the catchment extent covering 1000s of km2.  This presentation shows the application of the SCIMAP approach to the spatial targeting of flood mitigation features and how these locations can co-deliver water quality benefits.

How to cite: Reaney, S.: Opportunity mapping for nature-based solutions for flood hazard reduction and water quality improvements with the SCIMAP toolkit, EGU General Assembly 2024, Vienna, Austria, 14–19 Apr 2024, EGU24-18566, https://doi.org/10.5194/egusphere-egu24-18566, 2024.

EGU24-19873 | ECS | Orals | HS1.1.3

Advancing Climate Resilience in the Canary Islands: Insights from the NATALIE Project on Nature-Based Solutions 

Jorge Martínez León, Miguel Ángel Marazuela Calvo, Carlos Baquedano, Jon Jimenez, Samanta Gasco Cervero, Jesica Rodríguez-Martín, Juan Carlos Santamarta, and Alejandro García-Gil

Advancing Climate Resilience in the Canary Islands: Insights from the NATALIE Project on Nature-Based Solutions


Jorge Martínez León1, Carlos Baquedano1, Miguel Ángel Marazuela1, Jon Jimenez2, Samanta Gasco Cervero3 Jesica Rodríguez-Martín4, Juan Carlos Santamarta5 and Alejandro García-Gil1,


1Geological and Mining Institute of Spain (IGME), Spanish National Research Council (CSIC), Madrid, Spain (a.garcia@igme.es)

2Department of Earth Sciences, University of Zaragoza, Zaragoza, Spain

3Madrid Health Department, Madrid City Council, Spain.

4 Department of Techniques and Projects in Engineering and Architecture, University of La Laguna (ULL), Tenerife, Spain.

5Department of Agricultural and Environmental Engineering. University of La Laguna, Tenerife (Canary Islands), Spain


This communication outlines the research framework of the NATALIE project, emphasizing the application of Nature-Based Solutions (NBS) to address pressing climate change challenges across three distinct case studies in the Canary Islands—Gran Canaria, Tenerife, and Fuerteventura. The primary focus is on utilizing NBS as transformative measures to bolster resilience throughout the archipelago. Identified challenges encompass escalating extreme rainfall intensities leading to floods, uncontrolled runoff, water quality degradation from sewer overflows, desertification, and the management of groundwater bodies under future climate change scenarios.


The showcased activities include a series of NBS and Sustainable Urban Drainage Systems (SUDS) in Gran Canaria, with specific attention given to the Maspalomas lagoon. Tenerife's La Laguna case study highlights innovative NBS aimed at preventing flooding, presenting cost-effective alternatives for the construction of new drainage systems. Fuerteventura's initiative involves implementing natural treatment systems to combat nitrogen and pollutants, coupled with the utilization of regenerated water for restoring degraded wetlands. Furthermore, the research explores the monitoring of retention and infiltration capacities of traditional agricultural and rainwater storage systems.


The overarching goal of this research is to advocate for a comprehensive and diverse implementation of NBS, thereby contributing significantly to the resilience of the Canary Islands against the multifaceted impacts of climate change.


How to cite: Martínez León, J., Marazuela Calvo, M. Á., Baquedano, C., Jimenez, J., Gasco Cervero, S., Rodríguez-Martín, J., Carlos Santamarta, J., and García-Gil, A.: Advancing Climate Resilience in the Canary Islands: Insights from the NATALIE Project on Nature-Based Solutions, EGU General Assembly 2024, Vienna, Austria, 14–19 Apr 2024, EGU24-19873, https://doi.org/10.5194/egusphere-egu24-19873, 2024.

EGU24-21269 | Orals | HS1.1.3

Integrated and conjunctive Reservoir and Aquifer Management to improve water security in the Elqui Basin, Chile 

Marta Faneca Sànchez, Corine ten Velden, Felipe García Grez, Bernhard Becker, and Hans van Duijne

Reservoir operation and groundwater management, and specifically Managed Aquifer Recharge (MAR) are often tackled separately despite the common objective to store water when it is available and provide water when needed. Few studies focus on the conjunctive management of reservoirs and aquifers to optimize IWRM in basins. This work takes into consideration the combined management of reservoir operation and MAR for the Elqui Basin in the Coquimbo region, Chile and proposes a conceptual model for integrated modelling. The conceptual model captures the complexity of integrated management in terms of contributing processes, time and spatial scales, risks, data and models and proposes approaches for an integrated tool. The Elqui Basin is located in the northern part of Chile. The last decade it has been exposed to prolonged and severe droughts. This has posed enormous pressure on the already scarce water resources, causing overexploitation of groundwater resulting in drastic lowering of the groundwater table. To analyse optimization of water allocation in the basin (including reservoir management and MAR), in addition to the conceptual model, a real time control model (RTC-tools) is developed by coupling a hydrological model (WFLOW) and a groundwater model (iMODFLOW) to RTC-tools. The RTC-tools exercise shows when and how much water would be available to infiltrate through MAR, whilst also considering the water demand of the many different users in the basin. Preliminary results show that while infrastructure should be adapted to conduct and infiltrate water in the region, reservoir operation and water allocation could be optimized to make MAR possible.

How to cite: Faneca Sànchez, M., ten Velden, C., García Grez, F., Becker, B., and van Duijne, H.: Integrated and conjunctive Reservoir and Aquifer Management to improve water security in the Elqui Basin, Chile, EGU General Assembly 2024, Vienna, Austria, 14–19 Apr 2024, EGU24-21269, https://doi.org/10.5194/egusphere-egu24-21269, 2024.

EGU24-21660 | ECS | Posters virtual | HS1.1.3

Stormwater trees in urban runoff management: Water balance of the SenseCity Experimental Device  

Hayath Zime Yerima, Martin Seidl, Marie-Christine Gromaire, Abdelkader Bensaoud, and Emmanuel Berthier

Faced with high levels of soil sealing combined with the effects of climate change, stormwater trees offer an adaptive solution for stormwater management. A stormwater tree is a street tree that has been designed to manage runoff from the adjacent pavement, while enhancing its development and various ecosystem services. It's a natured based solution for sustainable source control of runoff that's developing more and more, but whose operation is not yet completely mastered. The aim of the present study is to analyze and better understand the hydrologic functioning of such a device for a better application in the city, based on an experimental prototype, implemented in SenseCity, in Paris conurbation. SenseCity is a mini-city made up of a roadway and walls simulating a Canyon Street, with ball maples (Acer platanoide Globosum) planted on either side, one side of which is fed by runoff from 88m2 of pavement - these are the stormwater trees. The three stormwater trees are planted in a 1.6m-diameter reservoir with two main substrate layers, the first consisting of 20cm of Rainclean, a depollution filter providing temporary storage before infiltration into the deeper 60cm layer of topsoil. The runoff infiltrates through these two layers before reaching the clayey natural underground, where it can be exfiltrated to the soil and excess water can be collected in an underdrain. Various sensors were installed to study this system. These include inflow (Krohne Optiflux electromagnetic flowmeter), soil water content (Campbell SoilVue TDR probe), sap flow (Edaphic Implexx sensor) which allows to assess the evapotranspiration flux from the trees, outflow from the underdrain (Précis Mécanique 2x1-liter auger) and meteorological parameters. Most parameters are measured at 15-minute time steps.
The results obtained over one year (April 2022-March 2023) show exfiltration and transpiration rates on the system to represent respectively 53% and 27% of the inflow. Annual drainage accounts for around 19%. Exfiltration and transpiration are the main means of reducing runoff volumes. These different processes are not evenly distributed over the months. Transpiration rates are highest in summer, helping to cool the urban microclimate, while drainage and exfiltration is highest in winter. In summer, for example, transpiration rates were 41% and drainage 11%, while in winter transpiration was reduced to 5% and drainage increased to 32%.

How to cite: Zime Yerima, H., Seidl, M., Gromaire, M.-C., Bensaoud, A., and Berthier, E.: Stormwater trees in urban runoff management: Water balance of the SenseCity Experimental Device , EGU General Assembly 2024, Vienna, Austria, 14–19 Apr 2024, EGU24-21660, https://doi.org/10.5194/egusphere-egu24-21660, 2024.

EGU24-1444 | ECS | Posters on site | HS1.1.7

Urban green space: global assessment of potential energy demand reduction in buildings 

Giacomo Falchetta and Enrica De Cian

Climate change impacts are increasingly felt, and a key hazard for human health is exposure to chronic and acute heat. Air conditioning is an effective indoor adaptation technology. However, it is widely regarded as a form of “maladaptation” due to its high energy intensity and the detrimental impact it has on urban outdoor temperatures and global greenhouse gas emissions. On the other hand, urban green space (UGS) is widely regarded as an effective green infrastructure with potential to mitigate the urban heat island effect. In this context, here we built on a global validated model based on street-level vegetation density, satellite imagery, and ancillary covariates to track UGS in a large sample of cities worldwide (Falchetta and Hammad, forthcoming) and derive a context-aware but generalized statistical linkage with buildings electricity consumption statistics. Based on the modelled relations, we derive future projection of the potential contribution of UGS expansions to energy demand reduction in buildings in different regions of the world. Our study advances the quantitative, globally relevant understanding of the intersection between climate change adaptation and mitigation, and the role of nature-based solutions to reduce the feedback impacts of adaptation while providing ecosystem service co-benefits.

How to cite: Falchetta, G. and De Cian, E.: Urban green space: global assessment of potential energy demand reduction in buildings, EGU General Assembly 2024, Vienna, Austria, 14–19 Apr 2024, EGU24-1444, https://doi.org/10.5194/egusphere-egu24-1444, 2024.

EGU24-6337 | Posters on site | HS1.1.7 | Highlight

Simulating the impact of ground-based façade greenery design on indoor heat stress reduction 

Yannick Dahm, Karin Hoffmann, Oliver Schinke, and Thomas Nehls

Vertical greenery (VG) reduces the indoor heat hazard. To take advantage of their cooling effects, the underlying key design factors have to be understood. However, the influence of plant species, building type, and VG design on the thermal advantages has received limited attention in current literature.
Therefore, heat fluxes and temperature profiles for different ground based VG designs in the temperate climate of Berlin, Germany, were analysed using a process-based model. Indoor temperature profiles were integrated, assuming that air conditioning (AC) had been installed. Cooling effects have been simulated for six parameterised plant species of varying ages, across three different building types, and alternated air gap and crop thickness.
The results were compared, quantifying the cooling potential and the possible energy savings. They differ between plant species and building types. The diurnal variation of the indoor temperature resulted in maximum savings during the night. Fallopia baldschuanica showed the highest energy savings of approximately 23%. Thereby, it was multiple times more energy efficient than a Humulus lupulus.
This illustrates the significance of selecting the appropriate VG plant species. Considering factors such as growth rates and potential harm to buildings, VG can be strategically optimzed.

How to cite: Dahm, Y., Hoffmann, K., Schinke, O., and Nehls, T.: Simulating the impact of ground-based façade greenery design on indoor heat stress reduction, EGU General Assembly 2024, Vienna, Austria, 14–19 Apr 2024, EGU24-6337, https://doi.org/10.5194/egusphere-egu24-6337, 2024.

EGU24-7729 | Posters on site | HS1.1.7

Evaluating Green Roof Heat Mitigation Potential in a Changing Climate 

Giovan Battista Cavadini and Lauren Cook

As the impacts of climate change intensify, bringing an increase in the frequency and magnitude of heat waves, the interest around urban heat mitigation strategies is rapidly growing worldwide. Green roofs, defined as roofing systems that incorporate a vegetated layer, have been proved to reduce urban heat, thanks to their evaporative cooling and lower heat storage than conventional roofs. Thus, they are expected to become increasingly important in the future, given their potential to counteract the projected temperature increases associated with climate change.

Numerous studies emphasize the urban heat mitigation potential of green roofs, yet accurate quantifications of their temperature reductions under future climate are currently lacking. For instance, under climate change, higher temperatures and longer dry periods are expected in central Europe, conditions that can negatively affect green roofs. Recently, microclimate models are gaining traction in evaluating the efficacy of heat mitigation strategies, facilitating the quantification of urban heat reductions under various climate conditions. However, despite their increasing use in the literature, microclimate models are rarely combined with climate projections, due to the complexity of downscaling interdependent weather variables such as precipitation, air temperature and global horizontal radiation. Consequently, the heat reduction potential of green roofs under future climates is largely unexplored, particularly in comparison to their observed performance under current climate. Additionally, it is unknown whether specific roof parameters could contribute to further enhancing heat mitigation, such as plant characteristics, irrigation schemes, or substrate depth.

This study aims to investigate the heat mitigation potential under climate change on a green roof in Mendrisio, Switzerland (characterized by hot, dry summers) using an open source microclimate model developed by Meili et al. (2020), Urban Tethys-Chloris (UT&C). This model was selected because of the fully coupled energy and water balance, and the incorporation of plant-specific characteristics. Continuous year-long monitoring of the green roof enabled to collect surface temperature using infrared sensors. These measurements were used to calibrate and validate the microclimate model. To account for climate change, coupled, sub-hourly, future projections of precipitation, air temperature, solar radiation, relative humidity, and wind speed were used as input to the validated microclimate model. These projections were derived from a convection resolving climate model (COSMO forced by MPI-M-MPI-ESM-LR at RCP 8.5, worst-case emissions scenario) run over the European domain at a 2.2-km, 6-minute resolution for a 10-year period that was bias corrected through quantile mapping. Lastly, variations in key parameters like substrate depth, vegetation type, and green roof irrigation schemes were explored to analyze their impact on urban heat mitigation under climate change.

Preliminary, manual calibration of the microclimate model resulted in a good predictive ability (r2 = 0.71), which will be further improved with automatic calibration. In a current climate, the green roof was able to reduce maximum surface temperatures in Summer by approximately 15°C, with respect to an adjacent concrete roof. Further expected results will evaluate potential temperatures reductions in a future climate and determine whether green roofs can counteract increasing temperatures by exploring a range of alternative designs.

How to cite: Cavadini, G. B. and Cook, L.: Evaluating Green Roof Heat Mitigation Potential in a Changing Climate, EGU General Assembly 2024, Vienna, Austria, 14–19 Apr 2024, EGU24-7729, https://doi.org/10.5194/egusphere-egu24-7729, 2024.

EGU24-12889 | ECS | Posters on site | HS1.1.7 | Highlight

Rainfall temporal variability and rainwater harvesting efficiency: an analysis over the Italian territory.  

Matteo Carollo and Ilaria Butera

Rainwater harvesting for indoor uses could be a useful practice for a sustainable management of urban water. The realization of a rainwater harvesting system strictly depends on the costs and the required space so that an accurate design is necessary, especially in the tank sizing step. The volume of the tank is an important element of the system which impacts not only important environmental issues such as the volumes of saved potable water and the reduction of rainwater volumes to the sewerage system, but also the costs and the practical realization of the rainwater harvesting system. Nevertheless, while the professional world seeks solutions that are easy to apply (e.g. simplified sizing methods), from a scientific point of view several aspects are still to be clarified, among these the role of the temporal variability of rainfall in the tank sizing step, that is the object of the present study.

Rainfall temporal variability is quantified by the Coefficient of Variation (CV) of rainfall datasets. This analysis is carried out through numerical simulations and it is focused on the national Italian territory. Daily rainfall data of 3436 rainfall gauge stations located on the national Italian territory are considered and buildings with different catchment area and number of persons are taken into account. Our computations show that the majority of rainfall gauges in Italy has a rainfall CV in the 2.5-3.5 range, with higher values in the South and in the main islands. The role of the temporal variability of rainfall is clear: the same building in locations with the same mean annual rainfall depth, can require different tank sizes according to the rainfall coefficient of variation of the specific location. As an example, to reach the same water saving, a medium rise building located in Ascoli Satriano (CV=2.42) should be equipped with a tank size of 2700 litres, while in other locations which have the same mean annual rainfall depth but different CV, like Casale Monferrato (CV=3.41) and Muravera (CV=4.83), the required capacity is 3400 litres and 6800 litres, respectively. This underline the importance of taking into account the rainfall temporal variability in the tank sizing.

The analysis made use of non dimensional parameters, i.e. the storage fraction and the demand fraction, so that the results, obtained from different buildings over the Italian territory, are comparable, allowing in this way to build a unique graph that contains all information: the water demand, the mean annual rainfall depth and the rainfall coefficient of variation, as well as the number of inhabitants and the roof area of the building.

How to cite: Carollo, M. and Butera, I.: Rainfall temporal variability and rainwater harvesting efficiency: an analysis over the Italian territory. , EGU General Assembly 2024, Vienna, Austria, 14–19 Apr 2024, EGU24-12889, https://doi.org/10.5194/egusphere-egu24-12889, 2024.

EGU24-15912 | ECS | Posters on site | HS1.1.7

Modelling reference evapotranspiration of green walls (ET0vert) 

Karin A. Hoffmann, Rabea Saad, Björn Kluge, and Thomas Nehls

Green walls, facade greenery, living walls – vertical building greening as part of urban green infrastructure are measures for climate sensitive urban design, for water management and microclimate regulation. Strategic integration of green walls into local water and energy cycles requires prediction of evapotranspiration, considering the individual design, plant species, and building characteristics. Available models address horizontal surfaces but disregard vertical particularities and urban conditions, e.g., reduced direct radiation, spatial patterns of radiation on the wall due to building orientation and shading obstacles, and very heterogeneous wind fields that are influenced by rough surfaces, canyons, and adjacent wind barriers. We present a verticalization model, ET0vert, for the reference crop evapotranspiration ET0 (FAO) based on a sensitivity analysis. It comprises the adaptation of solar radiation and wind to the individual situations in front of a wall or facade. The accuracies of the model predictions are evaluated for (i) remote climate station data (horizontal reference plane), (ii) interpolated climate data (both horizontal and vertical reference plane) and (iii) on-site measured climate data (vertical reference plane, both not height-adapted and height-adapted) as input. We validate the model with data for a one-month reference period (25/07/2014 – 29/08/2014) from a weighable lysimeter with Fallopia baldschuanica greening of a 12 m high wall in Berlin, Germany.

Regarding individual meteorological input parameters, we found high relevance of both vapor pressure deficit (VPD) and solar radiation (RS) for the study area. Using VPD and RS, respectively, a linear model could explain 90 % and 85 % of daily ET0 variances. No such relationship could be detected for wind speed, but for maximum and minimum wind speed.

Compared to remote horizontal input data, verticalization of input data (RS and wind) reduced overestimations of ET from about 90 % to 14 % and 27 % for the daily and hourly resolution, respectively. If onsite climate data is available, deviations are reduced to 9 % and 5 % for the daily and hourly resolution. Height-adaptation of input data resulted in further improvements of the prediction accuracies (1 % and 2 % deviation for hourly and daily resolution).

We conclude that simply using remote horizontal climate data for calculating ET of green walls is not advisable. Instead, any input data, onsite measured or remote climate station data, should be verticalized and preferably height-adapted. The verticalized model predicts the hourly and daily evapotranspiration of green walls necessary for e.g., irrigation planning, building energy simulations or local climate modeling.

For more information: https://doi.org/10.5194/hess-2023-22

How to cite: Hoffmann, K. A., Saad, R., Kluge, B., and Nehls, T.: Modelling reference evapotranspiration of green walls (ET0vert), EGU General Assembly 2024, Vienna, Austria, 14–19 Apr 2024, EGU24-15912, https://doi.org/10.5194/egusphere-egu24-15912, 2024.

EGU24-16430 | ECS | Posters on site | HS1.1.7

Assessing the microclimate conditions in urban green spaces and the effects of underlying driving factors in Switzerland 

Yuxin Yin, Gabriele Manoli, and Lauren Cook

Urbanization and climate change are leading to an increase in urban heat, posing a threat to human health and well-being. Urban green spaces (UGS), such as parks and gardens, have been recognized as an effective strategy for heat mitigation because they dissipate heat within their boundaries and in the surrounding areas. The magnitude of the cooling effect of UGS varies across locations and is affected by various factors, such as background climate, urban fabric, and vegetation properties. However, previous research studying the effect of UGS typically focused on specific case study areas and particular aspects of driving factors.

To do so, we integrate modeling, remote sensing datasets, and on-site measurements to assess the microclimate conditions of five different UGS (allotment gardens, public parks, private gardens, real estate yards, and ruderal sites.) in three Swiss cities with different biophysical conditions (Zurich, Geneva, and Lugano). Urban Tethys-Chloris (UT&C) model, a novel urban ecohydrological model with an explicit representation of urban canyon and vegetation properties, is applied to simulate the microclimate for each UGS and city. The models are validated using on-site measurements for air temperature, relative humidity, and surface temperature from July to October 2023. Preliminary results for Zurich show a good fit between simulation results and on-site measurements for both three variables, especially for air temperature and surface temperature with both R-squares larger than 0.8.

During the simulation period from June 21 to October 3, results will identify diurnal and daily patterns of microclimate conditions, including how different vegetation properties (i.e., height, canopy width, leaf area index, stomatal conductance) affect the microclimate. Subsequently, statistical regression will be employed to explore how the cooling effect of UGS is related to the distinct urban fabric and background conditions. Overall, the study will explain how various factors influence urban microclimate and provide insights on which factors will help to enhance the cooling effect in urban green space design.

How to cite: Yin, Y., Manoli, G., and Cook, L.: Assessing the microclimate conditions in urban green spaces and the effects of underlying driving factors in Switzerland, EGU General Assembly 2024, Vienna, Austria, 14–19 Apr 2024, EGU24-16430, https://doi.org/10.5194/egusphere-egu24-16430, 2024.

EGU24-17003 | Posters on site | HS1.1.7

Sustainable Water Consumption Strategies in a Changing Climate 

Christina Tsai, Yu-Kai Chiu, Ching-Hao Fu, and Yao-Wen Hsu

Water consumption is a fundamental global need.  Water production consumes lots of energy and emits plenty of greenhouse gases.  Determining the carbon footprint of water can offer various benefits. Reducing water use and conserving water can lead to lower energy consumption, lower carbon emissions, lower monthly water and energy costs, and less demand for water.  As carbon neutrality gradually prevails, low carbon emissions have become the future global trend and goal.  Therefore, it is crucial to understand the relationship between water consumption and carbon emissions.

As most countries struggle to reduce their carbon emissions in response to global warming, investments in water conservation, efficiency, and reuse are among the most cost-effective energy and carbon reduction strategies.  Urban water infrastructures have been demonstrated to contribute to global CO2 emissions significantly, and buildings account for a large portion of most urban water consumption.  Notably, while there is abundant rainfall in Taiwan, there appears to be a frequent water shortage crisis.  Such a crisis is aggravated by climate change because of the more unpredictable seasonal changes.  Climate change is linked to excessive anthropogenic carbon emissions. 

This study focuses on five types of buildings with various missions and usage on the National Taiwan University campus.  These infrastructures are typically deemed as having significant water consumption at National Taiwan University: (1) Residential buildings, (2) Experimental buildings, (3) Experimental farms, (4) the Department of Animal Science and (5) Lecture halls.  The specific objectives of this project are to uncover the nexus between thermal comfort and water consumption and the relationship between water consumption and hydro-meteorological and anthropogenic factors.


How to cite: Tsai, C., Chiu, Y.-K., Fu, C.-H., and Hsu, Y.-W.: Sustainable Water Consumption Strategies in a Changing Climate, EGU General Assembly 2024, Vienna, Austria, 14–19 Apr 2024, EGU24-17003, https://doi.org/10.5194/egusphere-egu24-17003, 2024.

EGU24-376 | ECS | Posters virtual | HS1.1.10

Examining Landscape Ecological Dynamics Amid Climate Change in the GBM Delta Region of the Indian Sundarbans 

Anirban Mukhopadhyay, Indrajit Pal, Mashfiqus Salehin, Ahmed Ishtiaque Amin Chowdhury, Nilay Pramanick, Jyoti Prakash Hati, Subhajit Ghosh, Ayush Baskota, Subha Chakraborty, and Manas Sanyal

The GBM delta stands as one of the world's most densely populated areas, where human activities have profoundly reshaped the landscape amid the challenges posed by recurring climatic disasters. The region, prone to tropical cyclones and flooding, faces a future where these natural hazards are expected to intensify, making the understanding of landscape ecological dynamics imperative for effective environmental management. This study scrutinizes the transformations in land use and land cover (LULC) dynamics within the GBM delta spanning three decades through integrating remote sensing and geographic information systems (GIS). Leveraging Landsat TM and OLI data, the research aims to discern anthropogenic alterations in land use patterns over the study period. Grey-level co-occurrence matrix (GLCM) analysis on Landsat datasets facilitates the identification of land use changes, employing the Support Vector Machine (SVM) as the classifying algorithm. In tandem, the study will document the influence of climatic disasters, assessing the impacts of tropical cyclones and floods in the delta. Rainfall and temperature anomalies will be calculated, while flooded areas will be delineated using Sentinel-1 Synthetic Aperture Radar (SAR) data. Climatic anomalies will be detected by analyzing TRMM, PERSIAN, and MODIS datasets. This research aims to unveil the intricate dynamics of the GBM delta's landscape over time by comprehensively understanding the interplay between anthropogenic activities and climatic events. The insights garnered, including the interests and livelihood operations of local communities, will be instrumental in informing government policies geared towards mitigating the escalating impacts of climatic disasters in the GBM delta.

Key Words: Sundarbans, LULC, livelihood, GBM Delta, Policies.

How to cite: Mukhopadhyay, A., Pal, I., Salehin, M., Chowdhury, A. I. A., Pramanick, N., Hati, J. P., Ghosh, S., Baskota, A., Chakraborty, S., and Sanyal, M.: Examining Landscape Ecological Dynamics Amid Climate Change in the GBM Delta Region of the Indian Sundarbans, EGU General Assembly 2024, Vienna, Austria, 14–19 Apr 2024, EGU24-376, https://doi.org/10.5194/egusphere-egu24-376, 2024.

EGU24-512 | ECS | Orals | HS1.1.10 | Highlight

Policy implications to encourage the adoption of Nature-based Solutions in Vietnamese Mekong Delta (VMD). 

Sreejita Banerjee, Loc Huu Ho, and Indrajit Pal

Deltas are often densely populated and support much of the world’s fishes, forest products and agriculture. Protecting livelihoods and ecosystem services in deltas is therefore of global importance. The environmental degradation and the climate change are one of the multiple pressures experienced by deltas affecting the ecosystem services that pose risk in the livelihoods of the locals as well as the global population living in these areas. There is a need for new strategies for sustainable development to help deltas mitigate the effects of climate change as well as adapt to the changing conditions in a context of increasing uncertainty of hazards. Coastal areas of the Vietnamese Mekong Delta (VMD) are highly vulnerable due to land use changes and extreme climate hazards. This study will explore the specific aspects of deltas from a complexity-based approach, and analyse Nature-based Solutions as alternatives towards sustainable development in these areas. This examines Nature-based solutions (NbS) as a complementary or alternative approach to managing hazards in the Vietnamese Mekong Delta. We investigated the potential NbS as a complementary and sustainable method for mitigating the impacts of coastal disaster risks, mainly cyclones and floods. Finally, we address this gap by conducting a systematic literature review to assess the existence of policy instruments such as the Law on Natural Disaster Prevention and Mitigation (2009), Flood and Storm Prevention and Control (2000), Law on Dykes (2006), that adopt NbS and to evaluate the existence of specific examples of NbS.

How to cite: Banerjee, S., Ho, L. H., and Pal, I.: Policy implications to encourage the adoption of Nature-based Solutions in Vietnamese Mekong Delta (VMD)., EGU General Assembly 2024, Vienna, Austria, 14–19 Apr 2024, EGU24-512, https://doi.org/10.5194/egusphere-egu24-512, 2024.

EGU24-684 | ECS | Orals | HS1.1.10

A Comprehensive Indicator Based Vulnerability Assessment Method for School Education System: A Case Study of Sundarban Delta, India 

Anushree Pal, Takuji W. Tsusaka, Mohana Sundaram, Mokbul Morshed Ahmad, and Thi Phuoc Lai Nguyen

ABSTRACT

Natural hazards significantly impact school education, particularly in developing countries owing to their low coping capacity to hazards. The world’s 10 percent of tropical cyclones are experienced by Indian coastlines, together with the high probability of extreme rainfall events often leading to flood hazards. A comprehensive literature review highlighted the needs for thorough research on the differential impacts of climatic hazards on Sundarbans school education system and its societal linkages for adaptation strategies, hence promoting the resilient community.

This research aims to explore the impacts of multiple hazards and associated disruptions in school education, and attempts to identify determinants of resilience of school education to multiple hazards. The study aims to formulate an indicator library for vulnerability assessment of school education in the deltaic region. The research comprises of the conceptual background of vulnerability assessment, the indicators for education systems in the delta, the methodology for indicator library, and the indicator library table for school education systems in a comprehensive way. The study aims at developing a comprehensive library of school vulnerability indicators that will academically contribute as a reference for future researchers in the field of school vulnerability assessment.

How to cite: Pal, A., Tsusaka, T. W., Sundaram, M., Ahmad, M. M., and Nguyen, T. P. L.: A Comprehensive Indicator Based Vulnerability Assessment Method for School Education System: A Case Study of Sundarban Delta, India, EGU General Assembly 2024, Vienna, Austria, 14–19 Apr 2024, EGU24-684, https://doi.org/10.5194/egusphere-egu24-684, 2024.

Climate change dominates the nexus between water resources management needed for farm farmland irrigation and food security insurance. The challenge increases when the population proliferates and the demand for food and water rises. This study will explore how climate change may affect food production and water use in the Nile Delta, Egypt, through higher temperatures and sea level rise. It also aims to investigate the best management practices (BMPs) that can be used to tackle these issues. In the Delta, where irrigated agriculture is practiced, sea level rise is a major potential impact of climate change since it significantly impacts the salinity of the water and soil. Furthermore, higher temperatures directly influence evapotranspiration, a crucial component of crop yields and water balance. To determine this interdisciplinary nexus between climate, water, and food, integrated hydro/hydrogeological and crop models will be created by calibrating and simulating the current baseline situation. For that purpose, a basic crop model will be merged with the coupled SWAT_MODFLOW hydro(geo)logical simulation software. Additionally, a range of forecasting scenarios will be run to represent the impact of multiple climate change scenarios. The outcomes of operated scenarios will be evaluated regarding socioeconomic and environmental aspects to support the decision-making process and define how far the BMPs can be implemented on ground in this study area.

How to cite: Gomaa, S., Fleskens, L., Carvalho Nunes, J., and Badr, M.: An Integrated Modelling Approach to Support Sustainable Water Resources Management and Climate Change Adaptation for Irrigated Agriculture in the Nile Delta, Egypt., EGU General Assembly 2024, Vienna, Austria, 14–19 Apr 2024, EGU24-693, https://doi.org/10.5194/egusphere-egu24-693, 2024.

Nutrient delivery and water yield are key ecosystem functions that impact food security. Climate and Land use Land cover (LULC) changes are the main driving factors that affect these water related ecosystem services. By recognizing the value of ecosystem services, the efforts to manage ecosystem services have increased. One such tool to help manage ecosystem services is the Integrated Valuation of Ecosystem Services and Tradeoffs (InVEST) model, a new but powerful ecosystem service model. However, the InVEST model still requires testing in various geographic regions. This study assessed the performance of the InVEST water yield and nutrient delivery models in Siem Reap Province, Cambodia. The climate scenarios were projected using CMIP6 for two pathways namely SSP2-4.5 and SSP5-8.5. Past, Present, and future scenarios were developed for two InVEST models including Annual water yield (AWY) and Nutrient delivery ratio (NDR) to evaluate the impacts of Climate change and LULC. In the past and present, water yield dropped by 52-69% from 2018 to 2022, with nitrogen and phosphorus exports rising by 627 and 186 tons, respectively. In future scenarios, from SSP2-4.5 to SSP5-8.5, water yield in Near Future (NF) decreased by 6-8%, while in Mid Future (MF), it increased by 10-12%, and in Far Future (FF), it decreased by 1-2%. Future nutrient delivery showed minor changes, nitrogen exports dropped by 0.42 tons for NF and increased slightly by 3 tons for MF, also increasing by 2.4 tons for FF. Phosphorus exports decreased by 0.07 tons for NF and increased slightly by 0.8 tons for MF, with a 0.7-ton increase for FF in Siem Reap province. Climate change primarily impacts water yield, with LULC governing nutrient delivery. Expanding croplands and urban areas heighten pollutants and threaten food security, while diminishing forests and vegetation reduce water yield, intensifying challenges in securing a stable food supply in Siem reap province of Cambodia.

How to cite: Ahmed, F. and Loc, H. H.: Evaluation of Climate and Land Use Change impacts on ecosystem services that support Food Security in Siem Reap Province, Cambodia, EGU General Assembly 2024, Vienna, Austria, 14–19 Apr 2024, EGU24-3631, https://doi.org/10.5194/egusphere-egu24-3631, 2024.

EGU24-4213 | Orals | HS1.1.10 | Highlight

Preserving coastal agriculture: Nature-based solutions for the mitigation of soil salinization  

Paolo Tarolli, Edward Park, Jian Luo, and Roberta Masin

Soil salinization significantly threatens agriculture and food security, leading to profound soil degradation and desertification, negatively impacting ecosystems. The accumulation of excessive salts has negative effects on soil structure, fertility, plant growth, crop yield, and microorganisms. This phenomenon is attributed to natural factors, such as dry climates and high evaporation rates, and human-induced factors, including not optimal irrigation practices, inadequate drainage systems, and excessive fertilizer use. The increased frequency of weather extremes driven by climate change exacerbates this global issue, especially along coastal areas where millions of people live. Here, the sea-level rise, and recently also drought, are causing, especially in river deltas, a progressive land degradation, which negatively impacts the sustainable development of coastal agriculture. The lack of rainfall leads to scarce river discharge and consequently favours marine water inland flow intrusion. Anthropogenic activities (e.g., dams, mining) are exacerbating the phenomenon. Urgent mitigation strategies are therefore necessary. This study explores the potential of Nature-based Solutions (NbS) as sustainable and resilient response to soil salinization, offering benefits to agriculture through revitalizing ecosystem services. In detail, we addressed the challenges and limitations of implementing natural barriers, wetlands, buffer zones, conversion to aquaculture, straw incorporation, microbial-based solutions, organic fertilizers, and low impact water storage facilities. In detail, we should start re-introducing, where possible, wetlands through renaturalisation strategies, aiming to create a virtuous ecological equilibrium in agricultural landscapes. Indeed, wetlands can offer a natural barrier to saltwater intrusion. Soil remediation of degraded areas, especially for those interested in sand mining or oil refineries, is necessary to make soils more resilient and reestablish missed ecosystems. Agriculture must be sustainable and adopt conservation practices to keep and improve soil organic carbon content (SOC). Soils rich in SOC can retain more water and are more resilient; thus, they are more prepared for prolonged pressure given by water scarcity and soil salinization.

How to cite: Tarolli, P., Park, E., Luo, J., and Masin, R.: Preserving coastal agriculture: Nature-based solutions for the mitigation of soil salinization , EGU General Assembly 2024, Vienna, Austria, 14–19 Apr 2024, EGU24-4213, https://doi.org/10.5194/egusphere-egu24-4213, 2024.

EGU24-5550 | Posters virtual | HS1.1.10

Salt intrusion monitoring in the Po River Delta branches (Italy)  

Mauro Del Longo, Elisa Comune, Alessandro Allodi, Giuseppe Ricciardi, Enrica Zenoni, Anna Gloria Angonese, Silvia Pigozzi, and Saverio Turolla

The Po River Delta is the outlet of the Po basin, the biggest catchment in Italy; it is composed of the  branches of Goro, Gnocca, Maistra, Tolle and Pila, spanning over a 700 km2 area, nowadays  inhabited by around 50.000.

Modeled by the human presence through channels, levees and other hydraulic infrastructures, this is a “young territory”, originated from the “Taglio di Porto Viro” done by the Republic of Venice, around 1600, in order to divert the Po river mouth southward and avoid silting of lagoon harbors.

Beyond its high natural, economic and cultural value, this area is exposed to multiple hazards related to floods and  storm surges, droughts, erosion, subsidence, water pollution and loss of biodiversity, exacerbated by soil consumption and climate change; one of the highest threats is the salinization of surface,  groundwater and soils, due to the increasing of duration and extension of salt intrusion from the Adriatic Sea (Enhance, 2016; Allodi, 2022).

Particularly during low flows, as in Summer 2022 (GDO, 2022), salt intrusion reduces fresh water availability  for drinking supply, agriculture and industry, as also for balancing habitat salinity and guaranteeing  ecological benefits.

For many years this fragile and dynamic context has been under systematic observation, related to salt intrusion as also to liquid discharges, solid transport, topography, hydrodynamics, tides and beach morphology (Visentini, 1940; Cati, 1981).

Within the current multi level-multi actor governance system, since 1995 the Emilia-Romagna Regional Agency for Prevention, Environment and Energy (Arpae) is involved in the integrated monitoring  of the Po River Delta, supporting  water protection and use, flood management and the general sustainability of human activities.

Through the Idro Meteo Climate  (SIMC) and the "Daphne" Oceanographic Structures, Arpae  collects river, delta and sea water level observations from telemetry networks and discharge measurements and salinity observations from field campaigns.

From these monitoring activities it is first possible to maintain stage-discharge equations, particularly at the Pontelagoscuro Station upstream the delta, and consequently to maintain the discharge repartition equations in the delta, depending not only on upstream discharge but also on  hydraulics of each branch and sea level conditions (Settin, 2012); secondly it is possible to support salt intrusion length assessment and estimation in each delta branch, mainly depending on river discharges, their repartition in each delta branch and sea levels conditions (Comune, Turolla, 2023).

Territorial knowledge and conservation, based on the integration of in situ monitoring and control, historical data,  other data sources (topography, groundwater, water quality), satellite products, models (including digital twins), artificial intelligence, uncertainties management and high computing capacities, may help better understand earth systems and better simulate future scenarios depending on climate, land use and  social changes.

Monitoring of the Po River Delta, is therefore indispensable for theoretical assessment, supporting from-short-to-long-term awareness, decision making and action by public institutions, private enterprises, associations and local community, in order to assuring sustainable and fair water uses and ecosystem services  in a vulnerable area exposed to increasing threats and at the same time rich in opportunities and beauty.

How to cite: Del Longo, M., Comune, E., Allodi, A., Ricciardi, G., Zenoni, E., Angonese, A. G., Pigozzi, S., and Turolla, S.: Salt intrusion monitoring in the Po River Delta branches (Italy) , EGU General Assembly 2024, Vienna, Austria, 14–19 Apr 2024, EGU24-5550, https://doi.org/10.5194/egusphere-egu24-5550, 2024.

EGU24-6453 | ECS | Posters on site | HS1.1.10 | Highlight

Seawater intrusion in coastal agricultural regions: a global review 

Aurora Ghiardelli, Eugenio Straffelini, Edward Park, Vincenzo D'Agostino, Roberta Masin, and Paolo Tarolli

Coastal agriculture is key in sustaining food production for the growing global population. Due to highly fertile soils and water availability, lowlands located in the proximity of river mouths often represent the backbone of coastal agricultural activities. However, over the past decades, anthropogenic-related processes are reducing yield increases. Climate change has rapidly become a major threat, with sea-level rise (SLR) and extreme weather events such as prolonged droughts and record-breaking temperatures. In addition, deltaic areas are often densely populated, and intense human activities undermine the resilience of coastal agro-environments. In this context, seawater intrusion (SWI) is one of the most damaging processes affecting agriculture through soil salinization and the depletion of irrigation water resources. This leads to crop damage, huge yield losses and permanent harm to soil fertility. Despite the relevance of the topic worldwide, to this date, there is a lack of global synthesis on the impact of SWI on coastal agriculture and an insufficient consideration of the phenomenon in local surveys. To fill this research gap, we present a systematic review of the global distribution and impact of SWI in coastal agriculture of river deltas, focusing on the main hotspots and prevalent drivers, related to climate change, natural processes, and local human activities such as dam construction, dredging or groundwater overexploitation. Moreover, the global study helps to highlight the areas where data is insufficient and compares patterns of SWI across different regions. Additionally, the study assesses the global distribution of rural regions potentially impacted by SWI and the main crops characterizing the economies of river deltas. Finally, we delve into the future implications of demographic growth and SLR projections in deltaic regions, discussing the possible scenarios of coastal agriculture regarding water management, agronomic practices, and relative sustainability.

How to cite: Ghiardelli, A., Straffelini, E., Park, E., D'Agostino, V., Masin, R., and Tarolli, P.: Seawater intrusion in coastal agricultural regions: a global review, EGU General Assembly 2024, Vienna, Austria, 14–19 Apr 2024, EGU24-6453, https://doi.org/10.5194/egusphere-egu24-6453, 2024.

Concern for climate change impacts to the Vietnamese Mekong Delta is rapidly increasing due to the compound risks of a changing climate, environmental change and sensitivity and social-economic transformation. The Delta, located in the downstream section of the Mekong River is considered globally as one of the three most vulnerable deltas to climate change. Variations in precipitation, temperature changes, sea-level rise, progressive saline instructions, riverbank erosion, flooding and extreme weather events all aggravate the risk to the existing socio-ecological system.

Using Ben Tre Province as an in-depth case study, this paper develops a social vulnerability index (SVI) to understand the water hazards-modified by climate change in terms of their association between vulnerability, existing infrastructures and socio-economic patterns. A mix-method of qualitative and quantitative approaches was framed to procure and analyse data. This consisted of group discussions, individual surveys and key informant panel interview. Spatially mapped results of cluster analysis showed a strong spatial trend of SVI increasing from upstream to the downstream areas The multivariate regression model found linear correlations between the SVI and the proximity to the dike system and waterways. Additionally, the Moran’s I autocorrelation indicated the statistically significant difference between the SVI spatially of various household clusters. These findings contribute y to the understanding of the array of biophysical and socio-ecological impacts, their variability and their interlinkages.

How to cite: Phan, T., Van, T., Downes, N., and Thai, T.: Understanding Social Vulnerability to Climate Change-Modified Water Hazards in the Vietnamese Mekong Delta Coastal Zone, EGU General Assembly 2024, Vienna, Austria, 14–19 Apr 2024, EGU24-8332, https://doi.org/10.5194/egusphere-egu24-8332, 2024.

EGU24-9307 | ECS | Orals | HS1.1.10

Combining Remote Sensing and On-site Observations to Explore Salinization Dynamics in the Po River Delta  

Aurora Ghiardelli, Eugenio Straffelini, Sara Cucchiaro, and Paolo Tarolli

Seawater intrusion (SWI) is an escalating concern in coastal regions globally, with alterations in weather patterns and sea-level rise emerging as pivotal factors contributing to the occurrence of SWI in both surface waters and groundwater. This phenomenon poses a significant risk to low-lying agricultural areas, leading to soil salinization with substantial adverse effects on soil quality and crop yields. In the Po River Delta, Italy's broadest agricultural region impacted by SWI, summer droughts play a pivotal role in driving SWI dynamics. Within this extensive lowland area, the deficiency in rainfall during the summer months reduces river flow, facilitating the inland movement of seawater. The escalating frequency of drought events and exceptionally high temperatures in recent summers, has highlighted the necessity for a thorough understanding of the impact of SWI on cropland, both on vegetation and soil, to detect any possible correlations between SWI, accumulation of salts and plant stress. The objective of this study is to combine multi-temporal remote sensing from satellite imagery, to monitor plant greening, with on-site observations of soil electrical conductivity (EC). Normalized Difference Vegetation Index (NDVI) maps for the summer period 2023 were elaborated from satellite data, classifying cropland with a machine-learning algorithm to filter bare soil and surface water from green vegetation. In the same time period, two experimental sites located in the delta region were periodically sampled with a Time Domain Reflectometry (TDR) probe to monitor soil temperature, moisture and EC. Soil samples were also collected and analyzed to measure EC of the water extracts. Although summer 2023 was not characterized by extreme drought, the combined results offered a quick method for identifying salinization trends within the delta cropland area, pinpointing the most susceptible areas both on a regional scale and on a local scale.

How to cite: Ghiardelli, A., Straffelini, E., Cucchiaro, S., and Tarolli, P.: Combining Remote Sensing and On-site Observations to Explore Salinization Dynamics in the Po River Delta , EGU General Assembly 2024, Vienna, Austria, 14–19 Apr 2024, EGU24-9307, https://doi.org/10.5194/egusphere-egu24-9307, 2024.

EGU24-9392 | ECS | Orals | HS1.1.10 | Highlight

Identification of global hotspots for salinity vulnerability 

Md Feroz Islam, Judit Snethlage, Hester Biemans, Catharien Terwisscha van Scheltinga, and Ángel de Miguel García

Global food security is challenged by lack of fresh water availability and increasing salinity. Water and soil salinity have increased during the last few decades and are projected to increase in the future which will adversely effect the food security. Effect of climate change will exacerbate the situation. Previous researches have predominantly focused on the impact of either soil or water salinity on agriculture and food security. An assessment of combined impact of soil and water salinity at global scale is required. We have considered global datasets on soil and water salinity to locate areas with higher impact of salinity and combined indicators on climate, water availability, source of irrigation, cropping pattern, soil characteristics and level of salinity to identify regions with higher vulnerability to salinization. The impact of salinity on crop (wheat, rice and maize) yield was considered to produce a primary estimate of potential loss of food production. Combining soil and water salinity data indicate that currently the southeast and southwest coast of USA, southern part of Africa, southeast regions of Australia and coastal regions of Bangladesh are mostly impacted by salinity.  The MENA region, sub-saharan regions, large parts of Australia, southern Europe, southwestern coast of USA, eastern China, as well as the coast of Vietnam, GCC states, the eastern part of Indonesia, northern parts of India, coastal regions of Bangladesh and southeastern regions of Africa are identified as vulnerable regions for increasing salinity. The potential crop yield loss due to salinity is highest for Maize and lowest for Wheat.  Global cropping pattern shows that rice and maize are being cultivated more in salinity vulnerable areas than wheat, even though wheat is the most saline tolerant of the three. Identification of saline hotspot areas and regions vulnerable to increasing salinity will assist in development location specific of policies, regulation and adaptation strategies to counter the adverse impact of salinity in the future. More in depth analysis on Ganges-Brahmaputra-Meghna (GBM), Mekong and Nile delta will be carried out for regional verification of salinity hotspot and vulnerable location identification.

How to cite: Islam, M. F., Snethlage, J., Biemans, H., Terwisscha van Scheltinga, C., and de Miguel García, Á.: Identification of global hotspots for salinity vulnerability, EGU General Assembly 2024, Vienna, Austria, 14–19 Apr 2024, EGU24-9392, https://doi.org/10.5194/egusphere-egu24-9392, 2024.

EGU24-14750 | ECS | Posters virtual | HS1.1.10

Exploring disaster impacts on livelihoods in the Ganga Brahmaputra Meghna Delta communities in India 

Ayush Baskota, Indrajit Pal, and Anirban Mukhopadhyay

The Ganga Brahmaputra Meghna (GBM) delta, situated in India and Bangladesh, represents a densely populated and precarious area. Over 200 million residents face significant environmental threats, such as tropical cyclones, land subsidence, riverine flooding, coastal inundation, rising sea levels and storm surges, particularly affecting socio-economically marginalized communities with vulnerable livelihoods.

This paper investigates disaster impacts on local livelihoods in the GBM delta communities in West Bengal, India through a comprehensive household survey of 1236 respondents across Sandeshkali, Sagar, Hingalgunj, and Gosaba community blocks. The survey revealed a diverse distribution of hazard severity across the region; residents in Sagar and Hingalgunj blocks were primarily impacted by cyclones whereas Gosaba and Sandeshkali blocks were also impacted by flooding, inundation and land erosion. Furthermore, disasters have tremendous impact on the local economy, with respondents reporting a 50% decrease in income from their primary livelihood in the aftermath of a disaster. These impacts were found to be more profound in Sagar and Gosaba blocks, where people were more reliant on agriculture and farming, as compared to Sandeshkali where families were involved in diverse livelihoods. A significant proportion of disaster damages were attributed to salt-water intrusion in agricultural land and aquacultural ponds, followed by damages to critical infrastructure such as roads and power network and health-related issues in the aftermath of cyclonic events. The findings of this study demonstrate the diverse socio-economic scenario in the GBM delta, highlighting the importance of block and community specific risk management and livelihood strengthening programs.

How to cite: Baskota, A., Pal, I., and Mukhopadhyay, A.: Exploring disaster impacts on livelihoods in the Ganga Brahmaputra Meghna Delta communities in India, EGU General Assembly 2024, Vienna, Austria, 14–19 Apr 2024, EGU24-14750, https://doi.org/10.5194/egusphere-egu24-14750, 2024.

EGU24-17963 | Orals | HS1.1.10

Bridging Perspectives: Lessons from the Water Custodian approach 

Willem Van Deursen, Syeda Khushnuma Wasim, and Myisha Ahmad

Water management decision-making typically adopts either a top-down or a bottom-up approach. Presently, Bangladesh is exploring participatory planning, emphasizing consultations with local communities. This paper presents a framework for linking the top-down with the bottom-up approaches and discusses three case studies. The first one is about Tidal River Management in the South West Delta Bangladesh, and subsequently the framework is applied to Haor and Dhaka.

The livelihoods of communities in the South-West Delta face challenges due to environmental changes and socio-economic dynamics. Traditional approaches, inspired by Dutch polder development, have led to adverse effects such as increased salinity and drainage congestion. Local dissatisfaction with these solutions has manifested in events where farmers breach embankments to address these issues, while others turn to shrimp farming. A top-down approach to water management hampers effective communication and collaboration between experts and local communities.

The key challenge lies in managing the complex interactions among diverse stakeholders within the heterogeneous community. The Water Custodian framework aims to address this challenge by incorporating local community mapping into decision-making processes. The framework recognizes the diversity of stakeholders, including large landowners, subsistence farmers, and landless laborers, each with unique perspectives and incentives.

The primary objective of the framework is to enhance decision-making processes by incorporating humane elements, focusing on the inclusion of local communities and their vulnerability profiles. This involves developing a decision support process and tool to facilitate the inclusion of local knowledge and expertise in water management decision-making.

The approach is based on 'mental models' and 'life stories,' aiming to bridge geo-physical criteria with socio-economic and livelihood criteria. The Water Custodian framework uses fictional archetypal characters called Local Families, akin to personas in marketing and user interaction development, to represent different user groups. These personas help experts and decision-makers understand the diverse needs, experiences, behaviors, and goals of local communities. A serious board game is developed in which participants roleplay the various life-stories and have to prioritize the interventions based on their perspectives. The process is supported by a non-complex rapid impact assessment software, to provide rapid assessment of the scores obtained on the defined indicators.

The Water Custodian approach's adaptability to various contexts has been demonstrated by its application in the South-West Delta, the Haor region for integrated flood management, and for urban sustainability in Dhaka and Mumbai.  By using serious gaming for mapping and understanding the local context, the framework remains effective in addressing the unique challenges of each region.

Beyond its application in Bangladesh, the Water Custodian framework holds potential for various contexts worldwide. In natural resource management, it can be adapted to scenarios involving water resources, forests, or agricultural lands. The framework's inclusive approach can also find application in urban planning and development, disaster management, and educational initiatives.

In conclusion, the Water Custodian concept transcends geographic boundaries and application domains, serving as an anchor for inclusive and participatory approaches in decision-making.

How to cite: Van Deursen, W., Wasim, S. K., and Ahmad, M.: Bridging Perspectives: Lessons from the Water Custodian approach, EGU General Assembly 2024, Vienna, Austria, 14–19 Apr 2024, EGU24-17963, https://doi.org/10.5194/egusphere-egu24-17963, 2024.

Riverbank erosion is one of the world’s major hazards in delta areas. The Mekong Delta of Asia is one among them which is facing many sediment-related issues, particularly riverbank erosion. Extreme flood events and sea level rise due to climate change increase the risk of riverbank and coastal erosion in the Mekong Delta. This study aims to assess riverbank stability using the BSTEM model, investigate the level of vulnerability of local communities to riverbank erosion and understand their adaptive strategies to cope with riverbank erosion problems. The study focuses on Kaoh Soutin (KS) and Ruessei Srok (RS) communes which are next to the Mekong River in the delta area of Cambodia. Linking with flow velocity and water level from the HEC-RAS  2D model, the BSTEM model was set up to examine riverbank stability at two locations in KS and two locations in RS. The study used soil samplings and the laboratory test to investigate critical shear stress and erodibility coefficient for the BSTEM model. The results indicate that river water level and groundwater level are crucial factors influencing the overall stability of the riverbank. Higher water levels result in increased confining pressure on the riverbank, leading to a higher factor of safety. Soil erosion also has significantly impacted the riverbank at the study location. The level of vulnerability in two communities was determined based on IPCC’s livelihood vulnerability index (LVI) and coping strategies were determined based on field survey questionnaires and focus groups interviewed. It is found that KS is slightly more vulnerable to riverbank erosion than RS, as indicated by LVI values of 0.49 and 0.46 for KS and RS, respectively. The Chi-square test was carried out to identify vulnerability indicators that are statistically different between KS and RS. The current adaptive strategies based on interviews include reducing expenses, resettlement, diversifying income sources, and seeking support from various entities, including local authorities, NGOs, and government interventions during riverbank erosion. Large-scale monitoring and modeling systems are necessary for developing early warning systems and identifying hotspots. Riverbank protections both infrastructure-and nature-based solutions and migration plans are required to support livelihood adaptation.

How to cite: Piman, T., Tha, T., and Ruangrassamee, P.: Modeling riverbank stability and assessing vulnerability and adaptive strategies on riverbank erosion in the Mekong Delta, Cambodia , EGU General Assembly 2024, Vienna, Austria, 14–19 Apr 2024, EGU24-20488, https://doi.org/10.5194/egusphere-egu24-20488, 2024.

EGU24-21205 | ECS | Orals | HS1.1.10

Statistical associations of basin streamflow on sea surface salinity variability across major global deltas. 

Fahad Khan Khadim, Augusto Getirana, Rajat Bindlish, and Sujay Kumar

Sea surface salinity ( ) is a key parameter for the thermohaline circulation of global oceans, as well as the global hydrologic cycle. Near the deltas, inland streamflow through large catchments plays a crucial role in mediating salinity, which is vital for maintaining an agro-hydrological balance in the deltas. With recent remote sensing data sources providing both   and streamflow at global scales, we calculated the statistical associations of   with simulated basin streamflow ( ) at a monthly scale in 48 major deltas across the globe. The monthly   data was downloaded globally at   intervals from the SMAP RSS L3 products. The hourly streamflow data was extracted from HYMAP streamflow routing simulations (available at   spatial grids) within NASA’s LIS modeling framework. The streamflow data was spatiotemporally aggregated before performing the statistical analyses. We calculated the associations over different monthly-lags and plume distances and obtained the optimal correlations. The optimal correlation coefficients ( ) reveal strong anticorrelation phenomenon between   and   (  for seasonal data at 28 deltas, and   for de-seasoned data at 21 deltas). In addition to basin streamflow, we considered a number of sea surface climate forcings (precipitation, sea surface temperature, and wind speed) to perform similar statistical comparisons with  . The results revealed that   near the deltas are more influenced by basin streamflow in general. From a physical science perspective, we found consistent outcomes in the majority of deltas, with some irregularities in deltas with strong anthropogenic and management influences (e.g., deltas containing low forest cover and high reservoir areas). The anticorrelation phenomenon was more prominent in large deltas, specifically located near the tropical climates, which experience high streamflow and no ice-melting. We also found that the anticorrelations are more profound in river dominated deltas (e.g., deltas where the fluvial dominance ratio is greater than 1). The findings of this research will be useful for delta researchers aiming to devise global scale strategies amidst the rising threats of salinity intrusion.

How to cite: Khadim, F. K., Getirana, A., Bindlish, R., and Kumar, S.: Statistical associations of basin streamflow on sea surface salinity variability across major global deltas., EGU General Assembly 2024, Vienna, Austria, 14–19 Apr 2024, EGU24-21205, https://doi.org/10.5194/egusphere-egu24-21205, 2024.

EGU24-482 | ECS | Posters on site | HS1.1.11

Predicting Global Change impacts on streamflow dynamics using distributed hydrological modeling in a data-scarce nested tropical catchment in West Africa. 

Albert Elikplim Agbenorhevi, Julian Klaus, Leonard Kofitse Amekudzi, Nelly Carine Kelome, Ernest Biney, and Ernestina Annan

Currently, the global water cycle is experiencing radical shifts and the associated global water crisis requires rapid action by stakeholders to mitigate adverse impacts on both human populations and ecosystems. This urgency in action is driven by the combined effect of Climate Change and Land-use land cover change (LULCC) and the associated challenges in securing clean water sources. The Global Change from climate change is making water scarcity worse in places that are water-stressed, causing more competition and even conflicts over water resources. Addressing the global water crisis is especially challenging in the data-scarce region of the Global South where the status of hydrological processes and water availability is poorly constrained. Here, progress in hydrological predictions through robust hydrological models remains on top of the research agenda. General for the Global South, and particularly for West Africa, is the limited hydrological process understanding of tropical catchments with accelerating land cover change. The focus of the research study seeks to address the following research questions:
•    How does climate change alter hydrological processes in tropical catchments and does this alter streamflow regimes across nested catchments? 
•    How does and what are the contribution of LULCC in spatial-temporal changes of streamflow in a nested catchment in addition to the alterations driven by climate change within a given West African region?
To address the questions above, we will rely on data from the Pra River Basin in West Africa. In the present study, we employed Google Earth Engine (GEE) and Random Forest Classifier (RFC) to assess a time-series spatio-temporal land-use/cover change and change detection of the Pra River Basin for the period 2007 to 2023. Focusing on five (5) LULCC classifications has become crucial to the region's unregulated large and small-scale mining activities. The use of the Normalised Difference Water Index (NDWI), and Modified NDWI (MNDWI), was effective in extracting water surface areas for the change detection and pressure on the Pra River Basin and dealing with the overestimation phenomenon. We next integrate the processed LULCC into an eco-hydrological model that is validated against observed and reanalysed streamflow at different stations, soil moisture, and groundwater data. Future work will consist of estimating the impact analysis of Global Change on streamflow using an ecohydrological model that will be driven with the downscaled climate scenarios from CMIP6 and time-series land use change scenarios. This multifaceted approach is novel to the scientific understanding of water resource dynamics in the face of Global Change in tropical systems.

How to cite: Agbenorhevi, A. E., Klaus, J., Amekudzi, L. K., Kelome, N. C., Biney, E., and Annan, E.: Predicting Global Change impacts on streamflow dynamics using distributed hydrological modeling in a data-scarce nested tropical catchment in West Africa., EGU General Assembly 2024, Vienna, Austria, 14–19 Apr 2024, EGU24-482, https://doi.org/10.5194/egusphere-egu24-482, 2024.

Food security is a major concern in the Lower Mekong River Basin, especially under the projected climate change conditions. The areas suitable for rice cultivation, the most important agricultural product in the basin, are expected to change drastically, with the most severe reduction in northeast Thailand. This study investigated the variations in the past ten years of three ecosystem services directly related to agricultural production in Nakhon Phanom, a mostly rural province in northeast Thailand. Using the Integrated Valuation of Ecosystem Services and Tradeoffs (InVEST) program, and historical and projected climate data up to 2050, we discovered significant variations in water yield, and nutrient and sediment delivery to streams that were strongly correlated with changes in local land use. Further variations can be expected in the future with significant differences observed between and rainy seasons. Sustainable adaptation strategies, such as nature-based solutions, are therefore highly recommended to safeguard and enhance food security within this region.

How to cite: Nguyen, H. M. and Ho, H. L.: Assessment and projection of food security related ecosystem services in Nakhon Phanom, northeastern Thailand, EGU General Assembly 2024, Vienna, Austria, 14–19 Apr 2024, EGU24-612, https://doi.org/10.5194/egusphere-egu24-612, 2024.

EGU24-1478 | Posters on site | HS1.1.11

Assessment of drought prone areas in Slovakia according to the changes in the long-term mean discharges 

Katarina Jeneiova, Lotta Blaskovicova, Katarina Kotrikova, Zuzana Danacova, and Jana Poorova

The assessment of changes in the hydrological regime under the climate change uncertainty is especially important for the decision making processes as the hydrological design values, derived for a reference period, are directly used for decision making in many areas of water management, including drought management. Recent local studies confirmed that there are changes in hydrological regime of the last decades in comparison to the currently used reference period 1961-2000 in Slovakia. Therefore, the selection of the reference period for the design values is under revision. In the first step, long-term mean discharge observations from the state hydrological network with near natural regime were analysed. The newly proposed period 1991-2020 was compared to the reference period 1961-2000 and the deviations of long-term discharges in selected water-gauging stations were assessed. The newly proposed reference period was selected for the analysis, as it is recommended by the World Meteorological Organisation for the purpose of climate change monitoring and better comparability of climatological and hydrological characteristics. As the second step, maps of the drought prone areas were drawn according to the spatial distribution of the results. We hope that this analysis will serve as supporting material to help the decision makers in policy making process and toward more effective drought management in Slovakia.

How to cite: Jeneiova, K., Blaskovicova, L., Kotrikova, K., Danacova, Z., and Poorova, J.: Assessment of drought prone areas in Slovakia according to the changes in the long-term mean discharges, EGU General Assembly 2024, Vienna, Austria, 14–19 Apr 2024, EGU24-1478, https://doi.org/10.5194/egusphere-egu24-1478, 2024.

EGU24-1628 | Orals | HS1.1.11

The potential impact of climate tipping points on drinking water supply planning and management in Europe 

Peter van Thienen, Herbert ter Maat, and Sija Stofberg

In recent decades, substantial advancements have been achieved in state-of-the-art climate models, signifying commendable progress by the scientific community. These models have proven invaluable in comprehending and forecasting anthropogenic climate change. Nevertheless, their efficacy is limited when examining the intricate dynamics of tipping elements and their potential ramifications for overall climate stability. This limitation results in the absence of these tipping elements in widely adopted climate projections utilized by the drinking water industry to assess system resilience.

Despite the prevailing insufficiencies, there is a growing body of evidence indicating the existence and, conceivably, the imminent activation of certain tipping elements. The drinking water sector, characterized by its inherently slow-paced nature due to infrastructure designed for extended operational lifespans, faces a critical challenge. The rapid timescales associated with potential changes resulting from tipping element activations surpass the typical lifespan of drinking water infrastructure. Consequently, the water sector cannot afford to wait for scientific consensus to emerge.

This contribution asserts that climate tipping points pose a latent, underexplored, and potentially underestimated risk for the water sector. To address this concern, we introduce a straightforward model that explores potential magnitudes and timescales of abrupt climate changes linked to tipping element activations. Our investigation focuses on Europe, aiming to scrutinize the effects and consequences on drinking water supply. Specifically, we incorporate an assessment of the potential collapse of the Atlantic Meridional Overturning Circulation, deemed most pertinent for Europe based on projected effects, associated timescales, and implications for the water sector.

Our findings underscore the necessity of integrating tipping scenarios into the decision-making processes within the drinking water sector, given the profound uncertainty and far-reaching consequences associated with these events.

How to cite: van Thienen, P., ter Maat, H., and Stofberg, S.: The potential impact of climate tipping points on drinking water supply planning and management in Europe, EGU General Assembly 2024, Vienna, Austria, 14–19 Apr 2024, EGU24-1628, https://doi.org/10.5194/egusphere-egu24-1628, 2024.

EGU24-2135 | ECS | Posters on site | HS1.1.11

Assessment of Climate Change on Water Availability in Central Himalayas, Nepal 

Bipin Dahal, Insaf Aryal, Naba Raj Dhakal, and Suresh Marahatta

The Kaligandaki River Basin (KRB) in Nepal, as one of the Himalayan River Basins, is experiencing severe impacts of climate change on its water resources. In this study, future climate projections from downscaled CMIP6 GCM models were used to evaluate the potential effects of climate change on the hydrological regime of the KRB by developing a hydrological model soil and water assessment tool (SWAT). Multi-site validation approaches were used to address the high spatial heterogeneity of the basin. The performance of the model was excellent, achieving a consistently very good ranking throughout the study, as evidenced by calibration and validation results. Under the intermediate emission pathways SSP245 scenario, the average annual temperature in the basin is projected to increase by 1.5°C, with a maximum rise of 2.8°C during the pre-monsoon season in the far future. In the high emission pathways SSP585 scenario, the average annual temperature is projected to increase by 2.2°C, with a maximum rise of 4.3°C expected during the winter season in the far future. Precipitation is anticipated to increase across all future time windows, with higher magnitudes under the SSP585 scenario. The combined effect of temperature and precipitation increases is expected to increase the discharge of the river. Specifically, discharge is projected to increase by 6% (under SSP245) and 12% (under SSP585) for 2025-49, 14% (under SSP245) and 24% (under SSP585) for the 2050-74, and 23% (under SSP245) and 40% (under SSP585) for the 2075-99 timeframes. The projected changes indicate an overall increase in average annual discharge, with greater increases expected under the high-emission scenario. These findings highlight the significant influence of climate change on the water balance components and hydrological regime of the KRB.

 
Keywords: SWAT, Climate Change, Water Availability, Kaligandaki

How to cite: Dahal, B., Aryal, I., Dhakal, N. R., and Marahatta, S.: Assessment of Climate Change on Water Availability in Central Himalayas, Nepal, EGU General Assembly 2024, Vienna, Austria, 14–19 Apr 2024, EGU24-2135, https://doi.org/10.5194/egusphere-egu24-2135, 2024.

EGU24-2241 | ECS | Posters on site | HS1.1.11

Global vulnerable basins suffering social-ecological impacts of water scarcity 

Fubo Zhao and Yiping Wu

The UN water conference, convened in March 2023, calls for governing water and addressing climate change in tandem to co-achieve related sustainable development goals. However, the actual (water scarcity under current climate conditions) and potential (potential water scarcity under climate change) impacts of water scarcity on social-ecological impacts are rarely assessed. Herein, we developed a framework that integrates water scarcity and climate sensitivity to assess the socio-ecological vulnerability of global basins. We found that basins that already experience water scarcity are exhibit a disproportionate magnitude of climate sensitivity, which exacerbated the challenges associated with water resources management. We identified the vulnerable basins by integrating socio-ecological vulnerability and found that the most vulnerable basins are mainly located in developing countries. Therefore, the urgent international cooperation for reducing vulnerabilities of water scarcity is required. Measures involved in current Integrated Water Resources Management and Climate Change Adaptation may not be enough to alleviate the water crisis and to adapt to climate change in these vulnerable basins. We thus urge policy makers in regions suffering vulnerable water scarcity to integrate both approaches to manage water and climate in tandem and synergistically achieve related sustainable goals.

How to cite: Zhao, F. and Wu, Y.: Global vulnerable basins suffering social-ecological impacts of water scarcity, EGU General Assembly 2024, Vienna, Austria, 14–19 Apr 2024, EGU24-2241, https://doi.org/10.5194/egusphere-egu24-2241, 2024.

EGU24-2873 | ECS | Posters on site | HS1.1.11

Potential assessment of flood resource utilization based on the inflow flood identification model 

Jing Huang, Chao Tan, Xiaohong Chen, and Jiqing Li

The potential assessment of flood resource utilization is a prerequisite for the rational allocation of water resources and storage capacity in a watershed. In response to the increasingly uneven distribution of water resources in the context of climate change, an inflow flood identification model was established based on the Kolmogorov-Smirnov test, improved peak-over threshold method, and time-varying parameters with Poisson distribution model. A potential assessment method of flood resources utilization in reservoir groups was proposed based on constraints such as the comprehensive regulation and storage capacity of the watershed and water demand. The four cascaded reservoirs in the lower Jinsha River (Jinxia Four Reservoirs), namely Wudongde, Baihetan, Xiangjiaba, and Xiluodu, was used as a case study. The results show that: 1998 and 2002 are the consistency change points of the runoff seies from June to November at Xiangjiaba Hydrological Station. The main type of inflow flood is short-fat, and the 3-day flood volume is a key indicator of balanced comprehensive utilization benefits except for the flood peak. Jinxia Four Reservoirs are constrained by storage capacity, when encountering floods with a design standard of once-in-a-century or below, the potential utilization of flood resources is 37.27×10⁸m3. It is recommended to continuously optimize the storage capacity by raising the water level to 952.26m, 806.77m, 576.31m, and 373.99m in sequence of Jinxia Four Reservoirs. This work aims to provide reference for the optimal allocation of water resources and storage capacity in the watershed.

How to cite: Huang, J., Tan, C., Chen, X., and Li, J.: Potential assessment of flood resource utilization based on the inflow flood identification model, EGU General Assembly 2024, Vienna, Austria, 14–19 Apr 2024, EGU24-2873, https://doi.org/10.5194/egusphere-egu24-2873, 2024.

EGU24-3204 | ECS | Orals | HS1.1.11

Sustainable water management in Southern Ecuador: water availability under climate change and adaptation strategies. 

Ana Ochoa-Sánchez, Patricio Crespo, Patrick Willems, Rolando Célleri, Pablo Guzmán, María Alvarado-Carrión, Johanna Ochoa, Jorge García, Santiago Núñez, Verónica Rodas, Rigoberto Guerrero, María Augusta Marín, and Gabriela Sánchez

Anthropogenic climate change together with non-climate drivers (e.g land use change) have affected natural and human systems in the Andean Mountain region. There is more evidence of changes in water systems, with decreasing water availability and increasing frequency and magnitude of extreme events (i.e. flooding and droughts). This region is especially vulnerable to climate change and faces challenges towards adaptation due to limited resources and policies. Therefore, we present an integrated water management (IWM) approach to secure water availability in a middle-size city in Southern Ecuador - Cuenca. The Andean city of Cuenca (~ 600 000 inhabitants, located at 2600 m a.s.l.) depends highly on precipitation and surface water from the highlands to ensure drinking water. Due to its complex orography, climate change projections are not yet available at an adequate resolution for local decision making and limited actions and plans towards adaptation are undertaken. Our IWM approach, then, involves two phases:

(1) Quantifying water availability projections. Statistical and dynamical downscaling techniques are used to quantify climate change projections at 1 km resolution for the study area, together with indicators useful for decision-makers. Discharge projections are quantified by using conceptual and distributed hydrological models. In parallel, water consumption is monitored and projected. Finally, we find water availability projections towards 2100.

(2) Constructing adaptation strategies. On the provision side, water management improvements are co-constructed with the local drinking water company (ETAPA EP), such as: evaluating old infrastructure (e.g. leaks control), proposing new green-blue and gray infrastructure. On the demand side, strategies to reduce water consumption are co-constructed and implemented within a pilot project that involves citizens from three neighbourhoods in Cuenca.

Our study involves a variety of actors and sectors (i.e. Ecuadorian and Belgian Universities, decision- and policy makers and citizens), enhancing capacity building of local governments and transferring knowledge among Universities and institutions, to plan and implement adaptation strategies through bottom-up approaches. We expect that our approach can be used in other middle-size cities, with similar challenges or complex orography conditions.

How to cite: Ochoa-Sánchez, A., Crespo, P., Willems, P., Célleri, R., Guzmán, P., Alvarado-Carrión, M., Ochoa, J., García, J., Núñez, S., Rodas, V., Guerrero, R., Marín, M. A., and Sánchez, G.: Sustainable water management in Southern Ecuador: water availability under climate change and adaptation strategies., EGU General Assembly 2024, Vienna, Austria, 14–19 Apr 2024, EGU24-3204, https://doi.org/10.5194/egusphere-egu24-3204, 2024.

EGU24-4454 | ECS | Posters on site | HS1.1.11

Evaluating climate change impacts on the hydrology of Kamp catchment, Austria, under different shared social pathways (SSPs) 

Zryab Babker, Tim G. Reichenau, Morteza Zagar, and Karl Schneider

Climate change can severely affect water fluxes at the land surface and thereby water availability as well as floods and droughts leading to increased risks for man-environment systems. Understanding the impacts of climate change on future water resources at a catchment scale is essential for strategic planning and efficient integrated water resources management. In the frame of the DISTENDER project (EU Horizon-ID 101056836), climate change impacts upon several catchments in Europe are analyzed. A key goal of DISTENDER is to develop robust strategies for climate change adaptation. For the simulation of climate change impacts on water resources, the Soil and Water Assessment Tool (SWAT+) was selected for its accessibility, robustness, and transferability. Here we address the issue of effects of different climate models vs. shared socioeconomic pathways (SSPs) by driving SWAT with results of three models (CanESM5, EC-EARTH3, MPI-ESM1-2-HR) run of the updated Coupled Model Intercomparison Project Phase 6 (CMIP6) with four SSPs (SSPs 1-2.6, 2-4.5, 3-7.0, 5-8.5), respectively. The Kamp River in Lower Austria was selected as an example catchment because it is the longest river in the “Waldviertel” region, which has significant ecological, societal, and economic importance. The SWAT+ model was calibrated and validated at different locations in the catchment. Future climate change projections for the period 2021 to 2050 were obtained from CMIP6 and were statistically downscaled. Annual 3-day high runoff was used as a proxy for the extreme high runoff characteristics. Trends and variations of the water balance components were compared.

All climate models show an increase in average annual precipitation ranging from 5 % (MPI-ESM1-2-HR) to 17 % (CanESM5). In all climate models and SSPs, the 3-day high runoff at Stiefern gauge (near the catchment outlet) for 10, 50, and 100-year return periods is projected to increase. CanESM5 and EC-EARTH3 show the highest (54 %) and the lowest (13 %) increase in the 3-day high runoff for 10, and 100-year return periods respectively, variations across the SSPs range from 12 % (SSP1-2.6) to 77 % (SSP 5-8.5) for 100-year return periods. Changes in the average annual evapotranspiration across the different models range from 12 % to 18 %, and variations across the SSPs range from 14 % to 16 %. For all models, the average annual soil moisture in the catchment decreases significantly (5 % to 18 %), across SSPs the decrease ranges from 9 % to 13 %.

Our results indicate that the effects of choosing different models to reflect the changes in the runoff and average annual water balance components exceed the effects of different SSPs. Thus, decision-makers and planners should select a model according to their planning goal (i.e. use a model with extreme change to reflect the maximum potential risk). This research is intended to develop adaptation and mitigation strategies to reduce risks and vulnerabilities and to contribute to effective management of water resources in the catchment within the framework of the DISTENDER project.


Keywords: Climate change, CIMP6 Climate Model, SWAT+ model, Kamp catchment, Austria

How to cite: Babker, Z., G. Reichenau, T., Zagar, M., and Schneider, K.: Evaluating climate change impacts on the hydrology of Kamp catchment, Austria, under different shared social pathways (SSPs), EGU General Assembly 2024, Vienna, Austria, 14–19 Apr 2024, EGU24-4454, https://doi.org/10.5194/egusphere-egu24-4454, 2024.

EGU24-5789 | ECS | Posters on site | HS1.1.11

Understanding the uncertainty in the climate and water resource availability interplay: a distributed analysis of the Italian territory 

Alessandro Amaranto, Leonardo Mancusi, and Giovanni Braca

As the tangible impacts of climate change continue to unfold, the imperative to assess and prepare for its repercussions on water resources becomes increasingly evident. This study addresses the urgent necessity to foresee future scenarios of surface water availability in Italy, recognizing the crucial role of water in sustaining ecosystems, agriculture, and human life. To unravel the intricate interplay between climate change and water availability, our methodology integrates the three representative concentration pathways (RCPs) from the Intergovernmental Panel on Climate Change with six regional circulation models. This combination projects future trajectories of temperature and precipitation. Utilizing the time-varying quantile mapping downscaling technique, we refine these trajectories for enhanced spatial and temporal resolution (1 km). These downscaled data feed into the water balance model BIGBANG, developed by the Italian Institute for Environmental Protection and Research (ISPRA), facilitating the generation of the spatiotemporal distributions of surface water availability across Italy. A probabilistic analysis offers a nuanced understanding of potential future water scenarios. Our findings highlight the profound influence of emission scenarios on water availability's future trajectory. Under maximum adaptation conditions (RCP 2.6), a relatively stable water availability pattern is projected through the century. Conversely, the business-as-usual scenario predicts a significant decrease of up to 50% in surface water availability, particularly in historically drought-prone southern regions of the country. These results underscore the critical importance of proactive adaptation measures to mitigate the potential impacts of climate change on Italy's water resources.

How to cite: Amaranto, A., Mancusi, L., and Braca, G.: Understanding the uncertainty in the climate and water resource availability interplay: a distributed analysis of the Italian territory, EGU General Assembly 2024, Vienna, Austria, 14–19 Apr 2024, EGU24-5789, https://doi.org/10.5194/egusphere-egu24-5789, 2024.

The Murray-Darling Basin in south-eastern Australia is one of the world’s largest rivers, draining an area of just over 1 million square kilometres. The basin drains about one-seventh of the Australian land mass and is the 16th longest river in the world. However, being located on the driest continent on Earth, its discharge is relatively small, averaging just 767 m3/s, far smaller than the discharge from any other similarly sized river worldwide.

Despite the relative lack of water, the Murray-Darling Basin is one of the most significant agricultural areas in Australia. In 2008, the Murray-Darling Basin Authority was formed with a mandate to manage the basin in an integrated and sustainable manner. Water reform in the basin has been a world-first in terms of the scale of intervention, but it has led to numerous conflicts in terms of access to water. The ability to manage the basin adequately relies on appropriate research being carried out in order to determine how much water is currently available, where it is currently being used, and how water availability and use are likely to change into the future.

Climate change projections for the Murray-Darling Basin indicate a future that is likely to be hotter, with more frequent and intense droughts, accompanied by a reduction in cool season rainfall, particularly in the south of the Basin. As this is where the majority of runoff is generated, this is likely to lead to reductions in water availability, with a median reduction of around 20%.

The Murray-Darling Basin Plan was brought into force in 2012 and is due for review in 2026. CSIRO is carrying out hydroclimate research to assist policy makers to better understand the likely changes in water availability, and consequent adaptation options available to them. This presentation will summarise the likely climate change impacts on water availability and assess how best to deal with the uncertainties associated with these projections.

How to cite: Post, D.: Research informing policy to adapt to climate change: a case study from the Murray-Darling Basin, Australia, EGU General Assembly 2024, Vienna, Austria, 14–19 Apr 2024, EGU24-7034, https://doi.org/10.5194/egusphere-egu24-7034, 2024.

EGU24-7932 | ECS | Posters on site | HS1.1.11

Vegetation restoration potential in the drylands of China under water constraint 

Huiqing Lin and Yan Li

As an essential pathway for nature-based solutions, vegetation restoration can effectively absorb carbon sequestration and mitigate global warming. However, the excessive water consumption by vegetation expansion may create potential water conflicts between natural ecosystems and human systems, and even exacerbate local water shortages, especially in water-limited dryland regions. By evaluating water availability using multiple datasets, this study explored the vegetation restoration potential and the allowable vegetation conversion in China’s drylands under the constraint of water availability. We found that the additional water resources available for vegetation restoration in China’s drylands were 12 ± 114 mm (median ± SD) from 2003 to 2018 but it decreased over the period (-1.18mm/year). 43.3% of the dryland area had water deficits, after considering current vegetation and human water consumption. Under current water constraints, additional Gross primary productivity (GPP) that could be restored ranged from 8% to 12% depending on vegetation types (10.5% for forests, 11.6% for grasslands, 7.8% for irrigated crops, and 8.9% for rain-fed crops). In water surplus areas, primarily in the south and east of China’s drylands, most vegetation conversions toward higher-water-consumption types were allowed to occur. In water deficit areas, the west of drylands, even converting all the existing vegetation to less water-intensive types would not compensate for the water deficit in most regions, suggesting local vegetation may have exceeded the water-carrying capacity. Our research highlights the importance of the potential water constraint of vegetation restoration in drylands and provide a guidance for decision-making vegetation restoration while ensuring water sustainability. Next, we will explore the potential for vegetation restoration under different climate change scenarios (e.g., ssp126, ssp370, and ssp585).


How to cite: Lin, H. and Li, Y.: Vegetation restoration potential in the drylands of China under water constraint, EGU General Assembly 2024, Vienna, Austria, 14–19 Apr 2024, EGU24-7932, https://doi.org/10.5194/egusphere-egu24-7932, 2024.

EGU24-8932 | ECS | Posters on site | HS1.1.11

Model Calibration and discharge simulations during extreme drought events for the Rhine River Basin using WRF-Hydro. 

MSc. Andrea Campoverde, PD. Dr.Uwe Ehret, Dr.Patrick Ludwig, and Prof. Dr. Joaquim Pinto

Recent drought events, leading to low water levels, have significantly affected navigation through the Rhine River and the transportation of goods. It has become imperative to analyze the conditions in which these events occurs to establish actions to prevent monetary losses. The main focus of this study is to test how well the hydrological model WRF-Hydro can capture extremely low water levels in the Rhine River basin. Using the meteorological reanalysis dataset ERA5 as forcing data for the model, we simulate the streamflow from January 2016 to December 2018, which includes the recent drought event in the Summer of 2018. Within the model, the calibration of various parameters allows the evaluation of the streamflow from WRF-Hydro to be contrasted with the daily observed values. The parameters influencing the amount of water routed across the basin are generally constant throughout the domain. Land use cover and terrain slope were used to create spatially distributed parameter values, avoiding the calibration process of testing a range of values and, therefore, reducing computational time. These promising results enables us to analyze recent and future drought events under different climate conditions.

How to cite: Campoverde, MSc. A., Ehret, PD. Dr. U., Ludwig, Dr. P., and Pinto, P. Dr. J.: Model Calibration and discharge simulations during extreme drought events for the Rhine River Basin using WRF-Hydro., EGU General Assembly 2024, Vienna, Austria, 14–19 Apr 2024, EGU24-8932, https://doi.org/10.5194/egusphere-egu24-8932, 2024.

EGU24-9237 | ECS | Posters on site | HS1.1.11

A Graphical Representation of Climate Change Impacts with Associated Uncertainties 

Jose George and Athira Pavizham

Recent decades have seen increased occurrence of extreme climatic events, which have had devastating consequences, both in terms of loss of life and property. Proper understanding of the possible variations in climatic extremes is important in developing mitigation and adaptation plans. Climate change impact prediction employs a series of numerical models, each with their own limitations that contribute towards the overall uncertainty. Climate change impact prediction results are often not intuitive to a decision maker and the added complexities from uncertainties can complicate the policy making exercise. A clear and concise representation of the possible risks of climate change and the associated uncertainties needs to be developed to bridge the gap between the climate scientist and the policy maker. Here, a framework for graphical representation of regional climate risks in terms of hazards and vulnerabilities is developed. The uncertainties are quantified in terms of level of confidence as the result of an ensemble exercise. To help regional stakeholders relate to the prediction results, analysis of extremes is performed with respect to historical hazards in the region. Risk factors for climate extremes that happened in the past in the region are studied and the future risk for an event of same return period is compared to the historical risk. The methodology is validated in the Bharathapuzha catchment in Kerala, India, a catchment which is identified to be climate change hotspot. In terms of flood events, the risk of low intensity flood events is seen to be increasing in the catchment with high confidence, while high intensity flood events are seen to be predicted at low levels of confidence. The catchment is seen to be drying up with high intensity drought events being predicted at high confidence.  

How to cite: George, J. and Pavizham, A.: A Graphical Representation of Climate Change Impacts with Associated Uncertainties, EGU General Assembly 2024, Vienna, Austria, 14–19 Apr 2024, EGU24-9237, https://doi.org/10.5194/egusphere-egu24-9237, 2024.

Louisiana is a state in the United States of America that is experiencing the multiple challenges of climate change, extreme weather events (such as hurricanes), and human intervention impacts for flood protection. The marshland regions of lower Louisiana have been heavily impacted by human influence, since the state was originally formed and maintained by deposition of sediment carried from the Mississippi River. Not only has impact of human intervention impacted the sediment transport processes, but there has also been significant human development of levee systems and other flood protection structures in Louisiana’s coastal environment. Specifically after Hurricane Katrina, additional levee systems, environmental control structures, and floodgates were built in this marshland region. A few different design criteria are important to analyze for these systems, some of the more notable design criteria are flood protection, navigational safety for ships passing through floodgates, marshland protection, water quality, and system biology. In addition to monitoring human impacts, the US Army also seeks to understand how the system behaves under long-term climate change impacts.

While flood protection is a primary motivator for building these systems, it is important to ensure that structures built do not have adverse effects on the local wildlife or commercial/recreational opportunities for the locals in these areas. Adaptive Hydraulics (AdH) is a finite element based 2D shallow water equation solver that can be used to numerically evaluate these impacts. Another focus of this study is to analyze the indirect impacts of structures built since 2004. To ensure that everything built since then has not had major impacts on the local wildlife or commercial/recreation opportunities, AdH and PTM can also be used to gain insight into that impact. The numerical modelling portion is the author’s direct contribution to the project, though the overall project of developing Lower Louisiana, and its impact of that and climate change on the natural environment and local people will be discussed.

How to cite: Barreca, D.: Environmental Impacts of Developing Flood Protection Systems throughout a Marshland Ecosystem in Lower Louisiana: a Numerical Case Study, EGU General Assembly 2024, Vienna, Austria, 14–19 Apr 2024, EGU24-10709, https://doi.org/10.5194/egusphere-egu24-10709, 2024.

Climate change can pose a significant threat to water fluxes on terrestrial surfaces, impacting water availability, and increasing the risk for human-environment systems to floods and droughts. Understanding the repercussions of climate change on future water resources is imperative for effective integrated water resources management. As part of the DISTENDER project (EU Horizon-ID 101056836), we scrutinize the effects of climate change on diverse watersheds in Europe to develop strategies for climate change adaptation.
To simulate the impacts of climate change on water resources, we chose MIKE SHE for its spatially distributed and physically based modeling concept. Here we present the results of different climate models vs. SSPs on water balance components and runoff for the Ave River Basin in Northern Portugal.  MIKE SHE was calibrated and validated utilizing measured gauge runoff data from 1980 to 1986 and 1986 to 1990, respectively. For the various gauges, Nash-Sutcliffe efficiencies between 0.59 and 0.81 were achieved.
Statistically downscaled climate change projections for the period (2021-2050) from the Coupled Model Intercomparison Project Phase 6 (CMIP6) were used as input to MIKE SHE. We used three different climate models (CanESM5, EC-EARTH3, MPI-ESM1-2-HR) and four shared socioeconomic pathways (SSPs 1-2.6, 2-4.5, 3-7.0, 5-8.5) each. Hydrological variables were evaluated for each of the twelve-climate model runs in comparison to the reference period (1980-2010).  
All climate simulations show an increase in annual precipitation, except for CanESM5 SSP 3-7.0, MPI-ESM1-2-HR SSP 2-4.5, and MPI-ESM1-2-HR SSP 3-7.0. The precipitation increases range from 1 % to 24 %. This underscores the impacts of different SSPs and climate models on projected regional precipitation patterns and emphasizes their importance in comprehensive climate change assessments. 
In all scenarios, the projections indicate an increase in flood for different durations (1-day, 3-days) at all gauges across different return periods. The flood increase calculated for the three different climate models exhibits greater differences than the flood increase calculated for different SSPs across climate models. For example, in the Ave River, the range of the 100-year flood across SSPs varies from 81 m³/s (Min: 432m³/s, Max: 513 m³/s) for MPI-ESM1-2-HR to 225 m³/s (Min: 496 m³/s, Max: 721 m³/s) for EC-EARTH3. The corresponding range across models spans from 71 m³/s (Min: 425 m³/s, Max: 496 m³/s) for SSPs 3-7.0 to 213 m³/s (Min: 508 m³/s, Max: 721 m³/s) for SSPs 5-8.5. The 100-year flood (1-day duration) in the reference period value is 372 m³/s. In addition, the duration of low-flow events increases significantly for most climate scenarios. This increase in extreme events, which includes both, an increase in the volume of floods and an increase in the duration of droughts, emphasizes the need for proactive measures to address and adapt to the anticipated changes in hydrological patterns due to climate change.
However, our findings show that the selection of the climate model has a great impact on the hydrological variables. Decision-makers should carefully choose a climate model aligned with their planning objectives, considering the potential risk for robust planning.

Keywords: Climate change, CIMP6 Climate Model, MIKE-SHE, Ave catchment 

How to cite: Zargar, M., Reichenau, T. G., Babker, Z., and Schneider, K.: Assessing Climate Change Effects on Hydrology in the Ave catchment, Portugal: A Comparative Analysis of Various Shared Socioeconomic Pathways (SSPs), EGU General Assembly 2024, Vienna, Austria, 14–19 Apr 2024, EGU24-11231, https://doi.org/10.5194/egusphere-egu24-11231, 2024.

EGU24-11834 | ECS | Posters on site | HS1.1.11

Climate change impact on the hydrological processes over an alpine basin: the Adige River 

Martin Morlot, Alison L. Kay, and Giuseppe Formetta

Hydrological extremes (drought and floods) have undeniable financial implications and are predicted to grow in the next years. Yet to understand their future local impacts it is necessary to understand the evolution of the governing hydrological processes. Such is the case for the Adige basin, an important basin in Italy, where understanding changing patterns of hydrological processes is crucial to optimally plan competing water uses, such as hydroelectric production and agricultural water allocation.

Euro-CORDEX models provide future climate projections throughout the region, for different emissions scenarios (RCP 2.6, 4.5, 8.5) and climate models (13). Upon the application of a downscaling and bias correction methodology against observed climate variables (i.e. air temperature and precipitation), a process-based semi-distributed digital twin of the Adige River basin is implemented. Hydrological process variables (snow, actual evapotranspiration, soil moisture and discharge) are obtained for the entire basin and the timespans of the different Euro-CORDEX models (1980-2005 for the historical baselines, 2005-2100 for the projections) at daily temporal scale and 5 km2 spatial resolution. The temporal and spatial patterns for discharges are evaluated through the average monthly values for 6 sub-catchments. Other process variables such as snow, actual-evapotranspiration (AET) and soil moisture (SM) are assessed against remote sensing datasets. The resulting climate and hydrological end of the century projections (2075-2100) are compared to historical baselines (1980-2005), to assess projected changes.

The digital-twin model is found to reproduce discharge patterns accurately, with an average KGE of 0.8, and provides a good fit for snow and AET, with average correlations of 0.95 and 0.96 respectively. A reasonable fit is found for SM, with an average correlation of 0.5. Careful assessment of the digital twin model through these variables ensures that it reproduces accurately historical local hydrological processes and increases confidence in the quantification of these variables under future projections.

The results of our study give regional policymakers insights into possible future scenarios and how these affect water resources and their potential impacts and adaptations on several economic sectors.

How to cite: Morlot, M., Kay, A. L., and Formetta, G.: Climate change impact on the hydrological processes over an alpine basin: the Adige River, EGU General Assembly 2024, Vienna, Austria, 14–19 Apr 2024, EGU24-11834, https://doi.org/10.5194/egusphere-egu24-11834, 2024.

EGU24-11923 | ECS | Orals | HS1.1.11

Using water use models to project long-term trends of water supply and demand equilibriums under climate change: application to the French Loire River basin. 

Camille Debein, Victor Vermeil, Raphaël Lamouroux, Céline Monteil, Frédéric Hendrickx, Fabrice Zaoui, and René Samie

The French Loire River basin (81,000 km²) is characterized by a wide range of water uses (energy production, irrigation, drinking water supply, industrial processes, navigation, etc.). Recurring droughts and periods of low flow in the basin have emphasized the vulnerability of certain ecosystems and water uses in relation to the available resources. In addition, the prospect of global and local changes (climate change, changes in uses and territorial dynamics, etc.) added to evolutive environmental policies are expected to impact the availability of water resources in the upcoming years.

Within this evolving context of resource availability, we propose a quantified projection of future changes in the water supply-demand balance within the Loire River basin for two future timeframes, 2035-2065 (mid-term) and 2070-2099 (long-term), relative to the current climate (1976-2005). To achieve this, a modeling framework encompassing catchment-scale representations of climate, natural resource distribution, and primary water uses (energy, irrigation, drinking water supply, and industry) has been developed. Spatial and temporal heterogeneities are accounted for with a semi-distributed hydrological model [1] (using sub-catchment meshes of nearly 100 km2) and a daily time-step. This framework builds upon previous hydrological studies [2] and enables the representation of impacts on resource availability resulting from both natural and anthropogenic forcing variables.

Initially validated over the historical period (1976-2005) through comparison with national discharge monitoring networks and water use databases, this modeling chain was fed with data from four climate evolution trajectories taken from the Explore2 project that outline contrasting storylines of climate changes over the Loire basin. Simulation results reveal a decrease in water resources and an increase in global water demand, particularly in summer, correlating with increasing average air temperature and the relative reduction of precipitation. Evaluation of water stress indicators [3] suggests that tensions between water supply and demand will become increasingly frequent and more intense, particularly in summer.

This work emphasizes the interest of coupling water use modeling with hydrological simulations and advocates for evaluating the impact of changes in the territory (such as socio-economic or land use dynamics) on the resource.

Figure 1. Schematic representation of the modeling chain involved in quantifying the supply-demand balance.

(A) (B)

Figure 2. Spatial heterogeneity of the Blue Water Stress (A) and the Blue Water Scarcity (B) indicators [3] evaluated over the considered catchment area of the Loire River (august 2070-2099 for the “hot and humid” Explore2 climate trajectory, RCP 8.5).


References:

[1] Rouhier, L., Le Lay, M., Garavaglia, F., and Le Moine (2017). Impact of mesoscale spatial variability of climatic inputs and parameters on the hydrological response. Journal of Hydrology, 553, 13-25.

[2] Samie, R., Monteil, C., Arama, Y., Bouscasse, H., and Sauquet, E. (2014). La prospective territoriale, un outil de réflexion sur la gestion de l’eau du bassin de la Durance en 2050. Hydrology in a Changing World: Environmental and Human Dimensions, 221.

[3] Wang, Dan, Klaus Hubacek, Yuli Shan, Winnie Gerbens-Leenes, and Junguo Liu. (2021). "A Review of Water Stress and Water Footprint Accounting" Water 13, no. 2: 201.

How to cite: Debein, C., Vermeil, V., Lamouroux, R., Monteil, C., Hendrickx, F., Zaoui, F., and Samie, R.: Using water use models to project long-term trends of water supply and demand equilibriums under climate change: application to the French Loire River basin., EGU General Assembly 2024, Vienna, Austria, 14–19 Apr 2024, EGU24-11923, https://doi.org/10.5194/egusphere-egu24-11923, 2024.

The rising costs and safety concerns associated with flood-induced infrastructure damages in Canada underscores the critical need for adapting design flood magnitudes to future climate change. Creager flood envelope curves, which serve as the upper bound/limit of observed extreme flows for different drainage areas within a specific region, are widely employed by practitioners to estimate design flood magnitudes, which in the case of most river-crossing highway bridges is considered as 75-year flood magnitude. A framework for adapting Creager curves to future changes in streamflow is proposed in this study. To this end, Creager curves, for the current 1951–2020 period, are developed using regional frequency analysis (RFA) on annual maximum daily mean streamflow, considering 417 observation stations, located in seven major Canadian river basins (i.e., Fraser, Nelson, Mackenzie, Yukon, Churchill, St Lawrence and St John). The Creager coefficient C, which is the main parameter that defines flood envelope curves for different regions, under the current climate, exhibits considerable variability, ranging from 1 to 45, across the studied river basins.

To adapt Creager curves for future changes, a correction factor, RC, defined as the ratio of future to current period C values is proposed. Two RFA approaches were employed to calculate the ratio using simulated streamflow data, derived using a cell-to-cell routing scheme, applied to an ensemble of five-member Regional Climate Model (RCM) GEM (Global Environmental Multiscale) simulated runoff for the current reference 1951–2020 and future 2021–2099 periods for the observation sites. The first RFA approach, considering only the GEM grid cells where the stations are located, suggests RC in the 0.3 to 1.6 range, with St John and St Lawrence River basins showing  values less than 1. The second approach, considering all GEM cells for a given region, produces comparable results but yields a wider range for RC and adds useful information in that RC values can also be established at ungauged locations, with RC values higher than 1.6 in various regions especially over western Canada. An evaluation of the level of confidence for RC , based on the GEM ensemble, reveal a higher level of confidence for most parts of the study domain. The second approach is likely to be a better choice for longer return periods considering the larger pooling of data. From a practical viewpoint, the proposed method for estimating future design floods is robust and transferrable to other basins but can benefit from using streamflow projections from other models for better quantification of uncertainty.

How to cite: Maria, D. and Sushama, L.: Flood envelope curves for the estimation of design flood magnitudes for highway bridges, EGU General Assembly 2024, Vienna, Austria, 14–19 Apr 2024, EGU24-12009, https://doi.org/10.5194/egusphere-egu24-12009, 2024.

EGU24-14169 | ECS | Orals | HS1.1.11

Hydrokinetic resource assessment for the Canadian Arctic 

Koyena Bhattacharjee, Laxmi Sushama, and Julien Cousineau

Increasing renewable energy development has rekindled interest in hydrokinetic or in-stream river potential for power production using zero head turbines. This is also of interest for remote regions such as the Canadian Arctic where decentralized power production from renewable energy sources is an economically viable option in offsetting the high cost of diesel power production. However, one of the major obstacles is the absence of streamflow data at necessary spatial and temporal scales for these regions. This study estimates the hydrokinetic power potential for current-based systems in the rivers of the Canadian Arctic region, primarily Nunavut and adjoining regions, for the current and near-future periods, based on streamflow estimated using a routing scheme applied to runoff generated by ultra-high-resolution simulations of the Global Environmental Multiscale (GEM) model, for a high emission scenario. GEM simulation for current climate, validated against gridded and station observation data, suggest reasonable performance of the model, particularly streamflow-relevant variables such as precipitation, snow water equivalent, soil and air temperatures given improved representation of processes and surface heterogeneity due to the higher resolution. This is also reflected in the comparison of simulated streamflow characteristics with available observations from HYDAT.

Hydrokinetic power estimates over the study region show patterns similar to those of flow velocity as expected, with maximum hydropower being noted during the summer season for the central regions of Nunavut. Since the near-future period spans only till 2040, the changes in flow velocity and hydrokinetic power are minimal with an overall decrease of 2.5% for the southern and western regions of Nunavut and an increase of 2.5 to 5 % for some of the northernmost regions of Nunavut. The study further identifies ideal locations for the installation of hydrokinetic turbines for energy extraction, which require daily flow velocities above pre-defined thresholds, by considering indirectly also the impact of river ice on flow velocities. The results of this study provide useful information on hydrokinetic resources for the high-altitude regions of Canada by introducing a science-based approach and serve as a foundation for additional detailed investigations for site-specific studies to support the implementation of hydrokinetic energy conversion systems.

How to cite: Bhattacharjee, K., Sushama, L., and Cousineau, J.: Hydrokinetic resource assessment for the Canadian Arctic, EGU General Assembly 2024, Vienna, Austria, 14–19 Apr 2024, EGU24-14169, https://doi.org/10.5194/egusphere-egu24-14169, 2024.

EGU24-14318 | Orals | HS1.1.11

Balancing uncertainty when assessing climate change risk in large river basins: the case of the Murray Darling basin, Australia 

Andrew John, Avril Horne, Keirnan Fowler, Ranju Chapagain, and Rory Nathan

Climate change threatens water resources from local to global scales. However, there are significant challenges in assessing climate risk for large river basins, especially those with multiple jurisdictions and competing management objectives. Traditional methods follow a top-down approach, where the impacts of climate projections by climate models are simulated using hydrological and water resource models. While these methods can provide a detailed snapshot of how rivers are impacted under a small number of projected future climates, their computational burden, and challenges in linking water resource models owned by different jurisdictions mean it is difficult to robustly explore the implications of aleatory (from hydroclimate variability) and epistemic (from hydroclimate change) uncertainty. Unlike top-down approaches, bottom-up approaches can be used to better understand vulnerability under a range of possible future climate. Bottom-up approaches begin with a sensitivity analysis of important management objectives to multiple hydroclimate stressors. Unfortunately, bottom-up approaches are constrained when using complex system models in large river basins, as their methodologies typically require many times more simulations than top-down approaches.

The Murray Darling basin (MDB) is Australia’s most significant river basin. Irrigation in the basin supports over $30 billion (AUD) in agriculture and livelihoods for the 2.4 million residents. The MDB has significant environmental values, with RAMSAR wetlands, many endemic and threatened species, and it is the traditional land of over 50 first nations groups. We assessed the impacts of climate change on basin-wide inflows and key indicator sites using both top-down and bottom-up approaches. We stochastically generated multiple sequences of future hydroclimate conditions, which helps separate the influence of climate variability from climate change. We deliberately traded-off detail in our assessment by deriving simple functional relationships between sub-basin inflows and 21 key indicator sites using existing scenarios from the complex jurisdictional water resource models. This allowed us to assess far more replicates of stochastic data, more climate scenarios, and conduct a more rigorous stress test within the bottom-up framework than would normally be permitted using complex models.

The top-down approach provides a scenario-based assessment of likely conditions for water resources in the MDB, and spatially coherent projections of future inflows and river management metrics. The bottom-up approach provides more insight into spatial differences in sensitivity across the river catchments that make up the MDB, and can be used to both augment and help interpret outcomes from the top-down approach. The bottom-up approach also yields important thresholds in hydroclimate conditions which compromise basin-wide objectives (assessed through flow at the Murray River mouth which prevents the important lower lake system from becoming too saline). We consider top-down and bottom-up approaches to be complementary in assessing and adapting river systems to the impacts of climate change.

The simple methods used here are complementary with other more detailed impact models. The ease of undertaking simulations and computational efficiency means simple methods can filter down the range of possible conditions or stressors that contribute to uncertainty, allowing a more targeted set of simulations to be undertaken using detailed, but costly, water resource models.

How to cite: John, A., Horne, A., Fowler, K., Chapagain, R., and Nathan, R.: Balancing uncertainty when assessing climate change risk in large river basins: the case of the Murray Darling basin, Australia, EGU General Assembly 2024, Vienna, Austria, 14–19 Apr 2024, EGU24-14318, https://doi.org/10.5194/egusphere-egu24-14318, 2024.

EGU24-16678 | Posters on site | HS1.1.11

Using a detailed abstraction database to plan assessing current and future water resources availability in Scotland. 

David Haro Monteagudo, Shaini Naha, and Miriam Glendell

Scotland’s land and water resources are increasingly vulnerable to periods of droughts, impacting water users and the water environment. Abstractions from sectors with high water demands are forecasted to exacerbate the direct impacts of climate change by amplifying both the frequency and the duration of drought events. Previous studies that have assessed the potential future water scarcity in Scotland were limited by the lack of available data on actual abstractions. These studies assumed that all abstraction licences were used at their maximum (i.e., were based on worst case scenario); and did not account for public water supply abstractions. Therefore, there is a need for accessible data on timely, open, and detailed abstraction return values for all sectors to overcome these limitations to allow a more accurate assessment of the current state of Scotland’s water resources and their vulnerability to climate extremes. We have collated a database that comprises of abstracted daily volumes from different locations within the water bodies, for various sectors from Scottish Environmental Protection Agency and abstracted daily volumes for public water supply aggregated at the catchment level from Scottish Water. We then use these daily abstraction time series available for the common time 2018-2022, in conjunction with available daily river flow historical and future projections, to determine the available volume of water, per catchment, per day. This enables extracting the drought events, and drought characteristics such as frequency, duration, and intensity of droughts. This research will inform future water resources management in Scotland by identifying which regions and sectors may be subject to increased water scarcity pressures in the future.

How to cite: Haro Monteagudo, D., Naha, S., and Glendell, M.: Using a detailed abstraction database to plan assessing current and future water resources availability in Scotland., EGU General Assembly 2024, Vienna, Austria, 14–19 Apr 2024, EGU24-16678, https://doi.org/10.5194/egusphere-egu24-16678, 2024.

EGU24-19003 | ECS | Posters on site | HS1.1.11

Land cover planning strategies and Water Use Optimization of a Mediterranean Basin Under Climate Change  

Serena Sirigu, Roberto Corona, Adriano Ruiu, Riccardo Zucca, and Nicola Montaldo

Over the past century, climate change has been affecting precipitation regimes across the world, and in the Mediterranean regions there is a persistent declining trend of precipitation and runoff decreases contributing to a desertification process with dramatic consequences for agricultural and water resources sustainability. Climate change projections point to an amplification of changes in global precipitation patterns and trends, with further drier trends for the Mediterranean area. These trends will have dramatic consequences on water resources for both managed (e.g., agricultural) and natural systems. In Mediterranean climates during the winter months much of the precipitation recharges sub-surface and surface reservoirs. In particular, in Mediterranean regions a strong decreasing trend of winter precipitation and an evident shift in how the precipitation is distributed across the winter and spring months is estimated. Considering that most of the runoff to surface reservoirs occurs in the winter months and that spring hydrologic response is likely to be influenced strongly by vegetation, these precipitation changes can be considered hydrologically important. Case study is the Flumendosa basin (Sardinia), which is one of the case studies of the ALTOS European project, characterized by a reservoir system that supplies water to the main city of Sardinia, Cagliari. Data are from 42 rain gauges stations (1922-2023 period) over the entire basin and data of runoff are available for the same period. In the Flumendosa reservoir system the average annual input from stream discharge in the latter part of the 20th century was less than half the historic average rate, while the precipitation over the Flumendosa basin decreased, but not at such a drastic rate as the discharge, suggesting a marked non-linear response of discharge to precipitation changes. We developed and calibrated a distributed hydrological model at basin scale which predicts runoff, soil water storage, evapotranspiration and grass and tree leaf area index (LAI). Hydrometeorological variables provided by the future climate scenarios predicted by Global Climate Model (CMPI-6 MPI-ESM1-2-LR downscaled) have been used as input in the model to predict soil water balance and vegetation dynamics under the future hydrometeorological landcover scenarios. The historical observations highlighted strong negative trends in precipitation series and number of wet days (examined using the Mann-Kendall trend test). The results from model application showed that tree dynamics are strongly influenced by the inter-annual variability of atmospheric forcing, with tree density changing according to seasonal rainfall. At the same time the tree dynamics affected the soil water balance. We demonstrated that future warmer scenarios would impact forest, which could be not able to adapt to the increasing droughts. In the Flumendosa basin future scenarios predict a reduction of the runoff, which is crucial for the dam reservoir recharge. The water resources system planning needs to carefully takes into account the effect of future climate change on water resources and vegetation dynamics.

How to cite: Sirigu, S., Corona, R., Ruiu, A., Zucca, R., and Montaldo, N.: Land cover planning strategies and Water Use Optimization of a Mediterranean Basin Under Climate Change , EGU General Assembly 2024, Vienna, Austria, 14–19 Apr 2024, EGU24-19003, https://doi.org/10.5194/egusphere-egu24-19003, 2024.

HS1.2 – Innovative sensors and monitoring in hydrology

EGU24-7295 | ECS | Posters on site | HS1.2.1

Developing gravimetric water level meter 

YooSik Jeong, Ho Jeong Jo, Soo Jeong Park, and Oh Yoon Kong

According to Korean Statistical Information Service(KOSIS)’s data, the area of the Republic of Korea is 100,444 km2 and the area of Seoul, the capital city of Korea, is 605 km2, which is only 0.6 % of the area of Korea. However, the population of the Korea is 51.75 million, and that of Seoul is 9.39 million, accounting for a large 18 % of Korea. A large number of these densely populated cities are located in river basins. In most of time, water resources stored upstream are used as various purposes(drinking, industrial, and agricultural use) and drained downstream. During summer monsoon, however, rain that falls in the basin is discharged downstream as quickly as possible to prevent flooding. But heavy, concentrated rain caused by recent climate change often leads to capacity to exceed designed capacity. Moreover, inundation occurred due to neglect of neglect of drain pipe and street inlet and is becoming a serious social problem.

This study was conducted to observe the ‘flood level’ in the city, which is basic data for flood management. We already have the ability to accurately and conveniently measure the water level and transmit the data when flooding occurs at multiple point in the city. To monitor water levels in underpasses and areas where poor drainage is expected, rods on the centerline of roadway or border of the sidewalk are used. The prototype has been completed, and additional work is underway to miniaturize the built-in equipment(board, communication, and battery) and to extend battery duration. To maintain accuracy of measurement in the process of the miniaturization, it is important to secure enough distance between weight and outer case to minimize the surface tension effect. So it is necessary to understand the relationship between the weight-outer case distance and water level observation measurements. This relationship was confirmed through various weights and outer cases. As a result, the accuracy was found to be sufficient when a weight-outer case distance is about 9 mm or longer.

Acknowledgement : This research was support by a (2022-MOIS63-002) of Cooperative Research Method and Safety Management Technology in National Disaster funded by Ministry of Interior and Safety(MOIS, Korea).

How to cite: Jeong, Y., Jo, H. J., Park, S. J., and Kong, O. Y.: Developing gravimetric water level meter, EGU General Assembly 2024, Vienna, Austria, 14–19 Apr 2024, EGU24-7295, https://doi.org/10.5194/egusphere-egu24-7295, 2024.

EGU24-7444 | Posters on site | HS1.2.1

Development of Portable Weather Observation System 

Mi Eun Park and Yong Hee Lee

In the event of a large-scale forest fire, the Korea Meteorological Administration (KMA)’s weather observation vehicles are deployed to obtain weather information necessary for extinguishing the fire. However, due to the limited number of vehicles and the environment to enter the field, it is difficult to observe the point where the information is actually needed. Therefore, there is an urgent need to develop a weather observation system that is easy to transport and install in the field.

We developed a 'portable weather observation system' that can be easily utilized by anyone, even if the KMA does not support weather observation vehicles and their operators at the disaster site.

 - [Transport] Weight and size that can be easily carried by one adult in a suitcase (or backpack).
 - [Installation] Attached to a steel plate, such as the top of a vehicle without any additional components. If this is not possible, a tripod can be utilized for installation.
 - [Operation] Real-time storage, display, and transmission of observation data
 - [Information] Location of the observation site (latitude, longitude and altitude) and weather variables (temperature, humidity, atmospheric pressure, and wind direction*∙wind speed) of the observation site.
  * Corrected regardless of the system's installation orientation

The prototype consists of a weather observation sensor, two GPS antennas, a tripod, a data processing/storage/display unit, and a power supply unit, and the total weight of the components including the suitcase (10 kg) is 20 kg. The weather observation sensor used is the Vaisala WXT-536, which can observe weather variables. Two GPS antennas were used to determine the location of the sites and correct the wind direction observed by the sensor. The system can be directly utilized by the Korea Forest Service (KFS) and the National Fire Agency (NFA) for initial extinguishment of wildfires.

By applying weather observation data transmitted in real-time from the field to numerical forecasting models, the KMA can provide more accurate weather forecasts back to the field. In the future, we plan to improve the prototype by utilizing an inexpensive sensor and lightweight and long-lasting batteries to reduce the cost and weight as well as increase the operating time.

How to cite: Park, M. E. and Lee, Y. H.: Development of Portable Weather Observation System, EGU General Assembly 2024, Vienna, Austria, 14–19 Apr 2024, EGU24-7444, https://doi.org/10.5194/egusphere-egu24-7444, 2024.

EGU24-11069 | ECS | Posters on site | HS1.2.1

Lake SkyWater - a portable optical buoy for easily measuring water-leaving radiance in lakes based on the skylight-blocked approach (SBA) 

Arthur Coqué, Tiphaine Peroux, Guillaume Morin, and Thierry Tormos

Spaceborne optical sensors are a useful tool for monitoring water quality in oceans, lakes and rivers on a large scale, at high frequency and at relatively low costs. Based on water colour algorithms, many key biogeochemical parameters are operationally estimated from satellite data (e.g. chlorophyll-a concentration). Calibrating and validating these algorithms requires a huge collection of high-quality in situ radiometric data, such as the water-leaving radiance Lw (or the remote sensing reflectance Rrs), necessitating high-level expertise and expensive material.

One of the most robust methods to measure Lw is the skylight-blocked approach (SBA), which allows Lw to be measured directly at the air-water interface. Compared with the conventionnal “above-water” method, the measurement is not contaminated by light reflected from the surface (including both sky- and sun-glint), thanks to the use of a cone-shaped screen attached to the downward-facing radiance sensor (which measures Lw) that fully blocks all downward radiance at the air-water interface.

Our open-source system “Lake SkyWater” was designed around the idea of making in situ radiometry measurements in lakes user-friendly and affordable, while retaining the accuracy and robustness required for scientific and operational purposes. We have created a semi-autonomous buoy that implements the SBA method. Lake SkyWater is low-cost (<1 k€, excluding the cost of the two radiometers), lightweight, and easy to transport and deploy. Our new device addresses one of the main ongoing issues with the SBA protocol: the issue with the radiance sensor measuring water being in the direct sun shadow of the deployment platform.

Our device consists of two commercially available radiometers that use the MODBUS RTU protocol (e.g., TriOS RAMSES G2) controlled by open-source TinkerForge modules and mounted to a rotating platform attached on top of an inner-tube (the buoy). Everything has been optimised for maximal portability (allowing it to be taken on a commercial flight): 1) the buoy is inflatable and 2) the structure is made of lightweight anodised aluminium profiles and PETG 3D-printed parts, and can be disassembled and transported in a suitcase/bag (the longest part measures 745x40x20 mm). The buoy’s position, its absolute orientation as well as its tilt are recorded (thanks to the embedded GNSS receiver and the 9-DOF IMU), and the solar azimuth angle is derived from the buoy’s positioning data. This enables the system to calculate the motor adjustments needed to keep the radiance sensor on the sunny side of the instrument. Our device hosts its own WiFi network and can be controlled wirelessly over a mobile phone, tablet or PC. Additionally, the radiometric buoy can be transformed into a fully autonomous monitoring system by plugging in a Raspberry Pi to act as a data logger.

Lake SkyWater was designed in the context of my PhD thesis dedicated to the calibration and validation of water colour algorithms for Petit-Saut Reservoir in French Guyana.

How to cite: Coqué, A., Peroux, T., Morin, G., and Tormos, T.: Lake SkyWater - a portable optical buoy for easily measuring water-leaving radiance in lakes based on the skylight-blocked approach (SBA), EGU General Assembly 2024, Vienna, Austria, 14–19 Apr 2024, EGU24-11069, https://doi.org/10.5194/egusphere-egu24-11069, 2024.

EGU24-11187 | ECS | Posters on site | HS1.2.1 | Highlight

DISCO: a low-cost Device-Instrumented Secchi disk for water Clarity Observations 

Gaia Donini and Sebastiano Piccolroaz

Water clarity regulates light penetration in aquatic environments, influencing both physical and biological dynamics. Its influence extends to heat transfer within the water column, shaping the thermal structure of lakes. Photosynthetically Active Radiation (PAR) in the euphotic zone is the source of energy for light-dependent organisms, which are crucial for ecological balance. The ability to accurately assess water clarity is therefore important in several aquatic science contexts, ranging from data analysis and process interpretation to modelling. Common metrics used to quantify water quality include the vertical attenuation coefficient Kd,PAR, a measure of light penetration, and the Secchi depth (ZSD), a measure of water visibility. The enduring simplicity and cost effectiveness of the Secchi disk has made it a global standard for measuring water clarity for almost two centuries. In contrast, Kd,PAR is typically determined using expensive instruments designed to measure light in the PAR range. This discrepancy highlights the need for innovative yet cost-effective methods that integrate both types of measurements. In this contribution, we present DISCO, a low-cost instrument that combines the standard and globally used Secchi disk with light attenuation measurement supported by light sensors. DISCO retains the traditional shape of a Secchi disk but is equipped with light-dependent resistors (LDRs), which are used as light sensors both looking up and down. In addition to the LDRs, the disk is also equipped with low-cost temperature and pressure sensors, all connected to an ArduinoUNO board. After calibrating the sensors against commercial instruments, DISCO was tested in two mountain lakes together with high-resolution PAR, temperature and pressure sensors used as a benchmark. The results show that the proposed low-cost instrument is able to reproduce the shape of the light profiles with proper quantification of the light attenuation coefficients. Its affordable cost and ease of construction and use is expected to increase the ability to make measurements in locations where expensive instruments are not available, thereby extending the coverage of water clarity monitoring sites. This in turn has potential implications for wider in-situ calibration of remote sensing products. The prototype of DISCO will be shown at the poster session.

How to cite: Donini, G. and Piccolroaz, S.: DISCO: a low-cost Device-Instrumented Secchi disk for water Clarity Observations, EGU General Assembly 2024, Vienna, Austria, 14–19 Apr 2024, EGU24-11187, https://doi.org/10.5194/egusphere-egu24-11187, 2024.

EGU24-15584 | Posters on site | HS1.2.1

Leveraging inland radar altimetry over rivers with low cost GNSS reflectometry 

Roelof Rietbroek, Zeleke K. Challa, Michael Kizza, Modathir Zaroug, Tom Kanyike, and Calvince Wara

The monitoring of surface water levels in lakes and rivers is essential for adequate water resource management and timely responding to extreme events. Monitoring an entity as large as the Nile river comes with significant challenges. The cross-boundary nature of the Nile, complicates its management due to different jurisdictions and interests, furthermore there are logistical challenges related to accessibility and site safety.

Radar altimetry has the potential to offer remotely sensed water heights, but still requires expert knowledge and site-specific trial and error. Generating in-situ records of water level heights is therefore invaluable activity both for monitoring and validation purposes.

Low-cost Global Navigations Satellite Systems (GNSS) interferometric reflectometry promises a low-cost solution for monitoring water heights, and devices can be locally constructed using off the shelf components which are now widely available. Furthermore, the development of internet of things (IoT) networks in Africa is moving forward and creates opportunities for remotely controlled measurement stations.

Here, we present our activities on designing and deploying low-cost GNSS-R receivers on the shores of Lake Victoria. We show several designs based on raspberry Pi’s and a low-power version based on the Actinius Icarus platform (zephyr based). We further explore possibilities to apply on-board processing of GNSS signal to noise ratio series, which will pave the way for using low bandwidth networks.

How to cite: Rietbroek, R., K. Challa, Z., Kizza, M., Zaroug, M., Kanyike, T., and Wara, C.: Leveraging inland radar altimetry over rivers with low cost GNSS reflectometry, EGU General Assembly 2024, Vienna, Austria, 14–19 Apr 2024, EGU24-15584, https://doi.org/10.5194/egusphere-egu24-15584, 2024.

EGU24-16629 | Posters on site | HS1.2.1

SETIER Project: An open source flowmeter for monitoring flow rates output of waste water treatment 

Arnold Imig, Hélène Guyard, Stephanie Prost-boucle, Valerie Quatela, Sylvain Moreau, Julien Sudre, and Rémi Clément

Different types of sensors are used continuously or intermittently in urban water management systems. They are primarily useful for monitoring and controlling medium to large treatment plants, allowing the recording of physical parameters such as inflow and/or outflow rates or the temperature of the facilities (Murphy et al., 2015). Additionally, continuously measured parameters include those specifically used to monitor physico-chemical processes throughout the treatment: electrical conductivity, pH, turbidity, redox potential, or dissolved oxygen in the basins, as well as insufflated air flow rates. For smaller-scale stations (< 2,000 EH), water quality monitoring is often more limited, frequently confined to batch counting or using malfunction sensors (for instance, effluent overflow).Furthermore, taking the example of reed bed filters (RBF), which are primarily advantageous for operators due to their operational simplicity, the use of sensors could be seen as complicating this system primarily intended for rural areas (Rao et al., 2013). The costs of purchasing and maintaining measurement chains may appear excessively high depending on the parameters used, an opinion shared by municipalities and operators whose financial resources are increasingly constrained (Prost-Boucle et al., 2022). The issue of sensor costs is particularly significant for smaller stations, significantly impacting operational budgets. It is also worth noting the difficulty in repairing and maintaining these solutions, often regarded as black boxes for users, requiring complete upgrades at regular intervals. As part of the Setier project, we have developed a series of Open-hardware tools for the management and monitoring of wastewater treatment plants. The objective of our presentation will be to showcase an open-source ultrasonic flowmeter. This flowmeter allows monitoring variations in Venturi channels, encompassing heights from 0 to 1 meter. It offers a 1mm resolution, and all design elements are shared online. The uniqueness of our system lies in its requirement for no component soldering like “Lego”. The flowmeter is programmable via the Arduino IDE. As for data collection, it is done using a smartphone through a web server embedded in the Arduino MKR1010 Wifi board. Our presentation will highlight the first measurement results from a 6-month wastewater treatment plant.


Murphy, K., Heery, B., Sullivan, T., Zhang, D., Paludetti, L., Lau, K.T., Diamond, D., Costa, E., O׳Connor, N., Regan, F., 2015. A low-cost autonomous optical sensor for water quality monitoring. Talanta 132, 520–527. https://doi.org/10.1016/J.TALANTA.2014.09.045

Prost-Boucle, S., Kamgan Nzeufo, H., Bardo, T., Moreau, S., Guyard, H., Duwig, C., Kim, B., Dubois, V., Gillot, S., Clement, R., 2022. Capteurs bon marché et centrales d’acquisition DIY pour les eaux usées : le projet Setier: Low-cost sensors and datalogger open hardware for wastewaters: Setier project. TSM 35–44. https://doi.org/10.36904/tsm/202201035

Rao, A.S., Marshall, S., Gubbi, J., Palaniswami, M., Sinnott, R., Pettigrovet, V., 2013. Design of low-cost autonomous water quality monitoring system. Presented at the 2013 International Conference on Advances in Computing, Communications and Informatics (ICACCI), pp. 14–19. https://doi.org/10.1109/ICACCI.2013.6637139

How to cite: Imig, A., Guyard, H., Prost-boucle, S., Quatela, V., Moreau, S., Sudre, J., and Clément, R.: SETIER Project: An open source flowmeter for monitoring flow rates output of waste water treatment, EGU General Assembly 2024, Vienna, Austria, 14–19 Apr 2024, EGU24-16629, https://doi.org/10.5194/egusphere-egu24-16629, 2024.

EGU24-18913 | ECS | Posters on site | HS1.2.1

A low-cost multi-sensor platform for monitoring real-time hydrological and biogeochemical dynamics across land-stream interfaces 

Lluís Gómez Gener, Antoine Wiedmer, and Lluís Camarero Galindo

The recognition of global change impacts on catchments and the waters they drain emphasizes the need to better understand and predict both hydrological and biogeochemical dynamics at the terrestrial-aquatic interface. To achieve this great endeavor, a key priority is to substantially increase the number of multi-annual time series, covering a broad range of river types and filling existing geographical gaps (e.g., low-income regions in/and remote areas). However, commercial multi-sensor solutions are not affordable to everyone. The multi-sensor platform consists of a STM32 micro-controller board combined with a data logger module, and a set of sensors to measure hydro-chemical properties both at different depths in soils (adjacent to the streams) as well as within streams: temperature, water level, moisture, electrical conductivity, turbidity, dissolved O2 and CO2. The monitoring system is also equipped with a wireless communication capability using LoRa network technologies. To make our project as accessible as possible, we have designed, built, and programmed the multi-sensor adopting the Open Source Hardware and Software philosophy. Through the complete processes of pre-calibration and in situ measurement, the preliminary results illustrate that the proposed multi-sensor system can provide long-term, high-frequency hydrological and biogeochemical data across land-stream interfaces while keeping the balance of costs and accuracy.

How to cite: Gómez Gener, L., Wiedmer, A., and Camarero Galindo, L.: A low-cost multi-sensor platform for monitoring real-time hydrological and biogeochemical dynamics across land-stream interfaces, EGU General Assembly 2024, Vienna, Austria, 14–19 Apr 2024, EGU24-18913, https://doi.org/10.5194/egusphere-egu24-18913, 2024.

EGU24-19085 | ECS | Posters on site | HS1.2.1

Rainfall Intensity Estimation Based on Raindrops Sound: Leveraging the Convolutional Neural Network for Analyzing Spectrogram 

Seunghyun Hwang, Jinwook Lee, Jongyun Byun, Kihong Park, and Changhyun Jun

In this study, we propose a novel approach for precipitation measurement based on rainfall acoustics, utilizing an effective rainfall acoustic collection device with low-cost IoT sensors housed in waterproof enclosure. Here, rainfall acoustics refer to the sound generated when raindrops fall and collide with surfaces such as the ground or canopy. Even at the same rainfall intensity, depending on the medium with which raindrops collide, acoustics with different frequency characteristics may occur. In this research, an acoustic collection device, combining a Raspberry Pi and a condenser microphone, was inserted into a waterproof enclosure and deployed in a rainfall environment to collect rainfall acoustics. This approach not only controls the medium of rainfall acoustics but also effectively blocks ambient noise and water, ensuring consistent characteristics of rainfall acoustics regardless of the installation environment. The collected rainfall acoustics were segmented into 10-second intervals, and spectrograms in the frequency domain were extracted by applying Short-Time Fourier Transform for each segment. Finally, using the extracted spectrogram as input data, a rainfall intensity estimation model based on a convolutional neural network was developed and other precision rainfall observation instruments (e.g., PARSIVEL, Pluvio², etc.) were considered collectively for the validation of the developed rainfall intensity estimation model. Acoustic-based rainfall observation enables the establishment of a dense observation network using low-cost devices. Leveraging the high temporal resolution of acoustic data, extremely short observation periods for rainfall can be achieved. This methodology presents an opportunity for cost-effective and high-spatiotemporal-resolution rainfall observation, overcoming the limitations of traditional methods.

Keywords: Acoustic Sensing, Rainfall Acoustics, Precipitation, Convolutional Neural Network

Acknowledgement

This work was supported by the National Research Foundation of Korea(NRF) grant funded by the Korea government(MSIT) (No. RS-2023-00250239) and in part by the Korea Meteorological Administration Research and Development Program under Grant RS-2023-00243008.

This work was supported by the National Research Foundation of Korea(NRF) grant funded by the Korea government(MSIT) (No.NRF-2022R1A4A3032838).

How to cite: Hwang, S., Lee, J., Byun, J., Park, K., and Jun, C.: Rainfall Intensity Estimation Based on Raindrops Sound: Leveraging the Convolutional Neural Network for Analyzing Spectrogram, EGU General Assembly 2024, Vienna, Austria, 14–19 Apr 2024, EGU24-19085, https://doi.org/10.5194/egusphere-egu24-19085, 2024.

EGU24-19610 | ECS | Posters on site | HS1.2.1

Open-hardware-based data logger platform for independently operating outdoor instrumentation 

Jannis Weimar and Markus Köhli

Open hardware-based microcontrollers, especially the Arduino platform, have become a comparably easy-to-use tool for rapid prototyping, stand-alone systems and implementing creative solutions. Such devices in combination with dedicated frontend electronics, external sensors and modems can offer low cost alternatives for student projects and independently operating small scale instrumentation. The capabilities of sensor-to-sensor communication can be extended to data taking and signal analysis at decent rates. Low-cost approaches to environmental monitoring will be critical for developing the evidence base needed to better understand the climate system, specifically in our case for understanding the water cycle. Off-the-shelf-components-based, internet-connected devices are easy to monitor and maintain, low risk and capable of extensive deployment to address the challenge of geographical variability and can address user- and site-specific demands. We present our project of a data logger platform "nCollector" based on an Arduino DUE, including data storage on SD cards, serial data transmission via USB, RS485, SDI-12, telemetry via GSM (4G), Nb-IoT and LoRa including its power supply and a minimal user interface. For outdoor instrumentation we specifically designed a solution with a low power demand of 0.2 W in order to realize 24/7 operation under harsh conditions with medium sized PV panels and batteries. With our presentation we want to provide a model case for other researchers to take inspiration from, share our experience with building and deploying over 100 systems all over Europe and help engaging the community to enhance their own instrumentation and data taking. 

How to cite: Weimar, J. and Köhli, M.: Open-hardware-based data logger platform for independently operating outdoor instrumentation, EGU General Assembly 2024, Vienna, Austria, 14–19 Apr 2024, EGU24-19610, https://doi.org/10.5194/egusphere-egu24-19610, 2024.

EGU24-2305 | Posters on site | HS1.2.5

Pedotransfer functions and their impact on water dynamics simulation and yield prediction 

Pablo Rosso, Kurt-Christian Kersebaum, Janis Groh, Horst Gerke, Kurt Heil, and Robin Gebbers

The dynamics of water availability for plant growth is particularly important for crop productivity simulation. Critical for the prediction of crop growth and development is the accurate simulation of soil moisture variation time. Soil capacity-based models assume that the vertical movement of water in the soil is mostly controlled by the intrinsic soil water retention capacities (WRCs), mainly field capacity (FC) and wilting point (WP). However, FC and WP are difficult to measure directly. Pedotransfer functions (PTFs) have been developed to determine these parameters from basic, more readily available soil attributes such as texture and soil organic carbon content. Functional evaluation, a procedure to assess the appropriateness of a PTF, entails testing the sensitivity of the different PTFs to model’s target simulation outcomes. This study constitutes an attempt to quantify and understand the impact of different PTFs on crop yield in a soil capacity-based model.

Six PTFs were used in the crop model HERMES to test their ability to simulate soil water dynamics and to determine their effect on yield simulation. This study, carried out in Germany, included three sandy soil sites in Brandenburg and a silty soil site in Bavaria. Five lysimeters at a site in Brandenburg provided a complete record for assessing the performance of PTFs. Measured soil texture and organic carbon were used as inputs in HERMES, which by applying the PTFs under study, produced the corresponding estimates of WRPs used for soil water dynamic simulations and yield predictions. Soil water records were statistically compared with model outputs to assess the accuracy of each PTF-based simulation. Differences in yield predictions were measured to estimate the sensitivity of the crop model to the PTFs tested.

Not a single PTF performed best in all sites. PTFs by Batjes and Rosetta were the best performers at the three Brandenburg sites. At Duernast, Bavaria, all PTFs resulted in higher errors than at the other sites. At this site, the measured soil water content maxima during the rainy months appeared very variable from year to year, which was unexpected if assumed that the maxima should stay around FC and be fairly constant. In general, HERMES simulations followed the trends in measured soil water dynamics regardless of the PTF applied, whereas differences between PTFs appear on the magnitude of the water maxima during the winter months. This shows that the accuracy of PTFs largely depended on their ability to correctly estimate FC. The highest variability in yield prediction for the different PTFs was observed in the three Brandenburg sites, which also corresponded with higher differences in FC estimation. A closer look at the sandy sites, and simulations with a synthetic soil database showed that differences in yield simulation between PTFs increased proportionally with soil sand percent. This points out at the empirical nature of PTFs and the care that needs to be taken when applied in new situations.

How to cite: Rosso, P., Kersebaum, K.-C., Groh, J., Gerke, H., Heil, K., and Gebbers, R.: Pedotransfer functions and their impact on water dynamics simulation and yield prediction, EGU General Assembly 2024, Vienna, Austria, 14–19 Apr 2024, EGU24-2305, https://doi.org/10.5194/egusphere-egu24-2305, 2024.

Nitrate pollution of groundwater is still an issue of concern at many drinking water wells located in the Swiss lowlands, where agricultural areas are the main pollution source. Extensification measures (e.g. conversion of arable land to extensive grassland, reduction of vegetable/potato areas in favor of cereals) are generally considered to be effective to reduce nitrate leaching to groundwater. However, these measures are also associated with large losses in agricultural productivity and can thus only be implemented on small focused areas within contribution zones of drinking water wells. It is hypothesized here that the trade-offs between agricultural production and groundwater protection can better be managed if more nuanced mitigation strategies are implemented at a broader scale. Such strategies would target at an improved synchrony between plant nitrogen demands and soil nutrient availabilities (e.g. by inclusion of cover crops and optimizing crop rotations, through reduced soil management and demand-driven fertilization practices). Since evaluating the effects of such strategies is anything but trivial given the high complexity of the process interactions and the strong influence of climatic variability, it is the aim of this work to train a mechanistic field scale model that simulates soil water and nutrient dynamics at a field scale in response to soil, climate and management drivers (DAISY model). The calibration builds on an extensive dataset from the lysimeter station Zurich Reckenholz including detailed data since 2009 on nitrate leaching, seepage water generation, soil moisture, water tension, soil temperature, and crop yields for a series of different experiments including non-inversion tillage, cover cropping as well as different fertilization types and amounts. The calibration strategy and selected calibration/validation results will be presented and discussed in context with implications for model applications.

How to cite: Holzkämper, A.: Managing the trade-off between agricultural productivity and groundwater protection in Switzerland – a model-approach based on long-term lysimeter data, EGU General Assembly 2024, Vienna, Austria, 14–19 Apr 2024, EGU24-2703, https://doi.org/10.5194/egusphere-egu24-2703, 2024.

EGU24-2783 | ECS | Posters on site | HS1.2.5

Critical Soil Moisture Content Estimated from Lysimeter Time Series for Different Soil, Vegetation and Weather conditions 

Xiao Lu, Jannis Groh, Thomas Pütz, Alexander Graf, Mathieu Javaux, Harry Vereecken, and Harrie-Jan Hendricks Franssen

Evapotranspiration (ET) is a crucial terrestrial ecosystem process that links water, energy, and carbon cycles. ET can be limited by either energy or water availability. The transition between water- and energy-limited regimes is associated with the soil moisture content, and can be postulated as the soil moisture content reaching a threshold, denoted as critical soil moisture (θcrit). Knowledge of θcrit is important for improving land surface, hydrological and crop models and predicting hydroclimate extremes such as droughts and heatwaves. However, the quantification of θcrit and the factors that impact θcrit are still not well understood. Here we used precise lysimeter observations to quantify θcrit by analyzing the relationship between soil moisture content and evaporative fraction (EF), as well as the relationship between soil moisture content and the actual ET/ potential ET ratio during drydowns. We estimated θcrit not only at the surface layer using in situ soil moisture measurements at 10 cm depth, but also for the root zone using vertically integrated in situ soil moisture (0–50 cm) observations. We estimated θcrit across various soil textures (e.g., sandy loam, silty loam, clay loam), vegetation types (grass, crop), as well as weather conditions from western and eastern Germany (spatial distances: 10 ~ 600 km). Especially, with some lysimeters that were taken from their original environment and translocated to other regions, we can identify the shift of θcrit with the same soil and vegetation but under different weather conditions, which can provide implication on changes of θcrit under global warming. We would expect a dependence of θcrit on soil texture and weather condition. We found for example that at the same site with the same crop rotation on the lysimeters but different soils, the sandy loamy soil experienced a lower θcrit (approximate 0.15 m3/m3) than the silty loamy soil (approximate 0.17 m3/m3), indicating that the higher content of sand would lead to the lower θcrit. In addition, an increase in θcrit was observed when the lysimeter was translocated from a site with a lower potential ET to a site with a higher potential ET.

How to cite: Lu, X., Groh, J., Pütz, T., Graf, A., Javaux, M., Vereecken, H., and Hendricks Franssen, H.-J.: Critical Soil Moisture Content Estimated from Lysimeter Time Series for Different Soil, Vegetation and Weather conditions, EGU General Assembly 2024, Vienna, Austria, 14–19 Apr 2024, EGU24-2783, https://doi.org/10.5194/egusphere-egu24-2783, 2024.

EGU24-3404 | ECS | Orals | HS1.2.5

Effects of changes in climatic conditions on soil water storage patterns 

Annelie Ehrhardt, Jannis Groh, and Horst H. Gerke

The soil water storage (SWS) defines crop productivity of a soil and varies under differing climatic conditions. Pattern identification and quantification of these variations remains difficult due to the non-linear behaviour of SWS changes over time.

We hypothesize that these patterns can be revealed by applying wavelet analysis to an eight-year time series of SWS, precipitation (P) and actual evapotranspiration (ETa) in similar soils of lysimeters in a colder and drier location and a warmer and wetter location within Germany. Correlations between SWS, P and ETa at these sites might reveal the influence of altered climatic conditions but also from subsequent wet and dry years on SWS changes.

We found that wet and dry years exerted influence on SWS changes by leading to faster or slower response times of SWS changes to precipitation in respect to normal years. This might be explained by a higher soil water content and the related higher soil hydraulic conductivity. Time shifts in correlations between ETa and SWS became smaller at the wetter and warmer site over time in comparison to the cooler and drier site where they stayed constant. This could be attributed to an earlier onset of the vegetation period over the years and thus to an earlier ETa peak every year and reflects the direct impact of changing climate on soil water budget parameters. 

How to cite: Ehrhardt, A., Groh, J., and Gerke, H. H.: Effects of changes in climatic conditions on soil water storage patterns, EGU General Assembly 2024, Vienna, Austria, 14–19 Apr 2024, EGU24-3404, https://doi.org/10.5194/egusphere-egu24-3404, 2024.

EGU24-9112 | Posters on site | HS1.2.5

Investigating herbicide transport and fate in vegetated lysimeters with numerical modeling and stable carbon isotopes 

Arno Rein, Anne Imig, Lea Augustin, Jannis Groh, Thomas Pütz, Martin Elsner, and Florian Einsiedl

The application of pesticides can induce severe impacts to the vadose zone, groundwater, and their ecosystems. A study was carried out on two lysimeters located in Wielenbach, Germany. Different soil textures were considered within the soil cores, consisting of sandy gravel and clayey sandy silt. The lysimeters were vegetated with maize, and four different herbicides were applied according to common agricultural practice. Over a period of 4.5 years, concentrations of the herbicides and selected metabolites were monitored in the lysimeter drainage. In addition, stable carbon isotopes (δ13C) were analyzed for investigating biodegradation influences of two of the applied herbicides.

In a first step, we characterized unsaturated flow in the lysimeters based on stable water isotope measurements (δ2H and δ18O) combined with modeling. Different setups within the numerical model HYDRUS-1D were compared, including single and dual porosity approaches. Then, the unsaturated flow models were extended for describing reactive transport of the herbicides, and simulations were interpreted in combination with measured δ13C values. 

At the end of the observations, 0.9 to 15.9% of the applied herbicides (up to 20.9% for herbicides plus metabolites) were recovered in lysimeter drainage. Some metabolites were observed to accumulate in drainage, and biodegradation was indicated by small isotopic shifts in δ13C to less negative values in the leached herbicides. In the later sampling campaign (7.5 months after herbicide application), a higher increase in δ13C (less negative values) compared to earlier sampling (19 days after application) points towards stronger biodegradation. This can be explained by a higher biodegradation potential when the infiltrated water and the herbicides were affected by longer mean transit times in the unsaturated zone.

Observations were reproduced by modeling, where the overall dynamics of herbicide concentration in the lysimeter drainage could be covered well by the model setups. The concentration peaks were partly associated with heavy precipitation, which in turn indicates that the transport was influenced by preferential flow. Limitations were found for describing preferential flow events by using single and dual porosity models, as some concentration peaks were over- or underestimated. The use of δ13C for compound-specific isotope analysis allowed obtaining some evidence on biodegradation of the two herbicides in the unsaturated zone, which was also validated with the model results. 

How to cite: Rein, A., Imig, A., Augustin, L., Groh, J., Pütz, T., Elsner, M., and Einsiedl, F.: Investigating herbicide transport and fate in vegetated lysimeters with numerical modeling and stable carbon isotopes, EGU General Assembly 2024, Vienna, Austria, 14–19 Apr 2024, EGU24-9112, https://doi.org/10.5194/egusphere-egu24-9112, 2024.

The ongoing global concern regarding climate change necessitates innovative approaches to understand its complex dynamics. This presentation outlines the evolution of lysimeters and ecotrons, culminating in the development of a cutting-edge platform designed for comprehensive research on climate change parameters in both laboratory and field environments.

Lysimeters, traditionally employed to measure water movement and nutrient transport in soil, have undergone significant advancements. Enhanced instrumentation and sensor integration now allow for precise monitoring of multiple environmental factors, including soil moisture, temperature, and gas exchange. These improvements enable researchers to simulate and analyze various climate change scenarios in a controlled laboratory setting.

Simultaneously, ecotrons, specialized chambers designed to replicate natural ecosystems, have evolved to provide a more realistic representation of climate interactions. By incorporating advanced technologies such as remote sensing, automated data acquisition, and controlled environmental conditions, ecotrons now offer a holistic approach to studying the impact of climate change on ecosystems.

The integration of lysimeters under natural conditions and ecotrons into a unified platform represents a paradigm shift in climate change research. This new platform facilitates a seamless transition between controlled laboratory experiments and real-world field studies, allowing for a more comprehensive understanding of the intricate relationships between climate change parameters.

Researchers can now explore the effects of elevated temperatures, altered precipitation patterns, and increased greenhouse gas concentrations on soil health, plant growth, and ecosystem dynamics with unprecedented precision. The platform's adaptability and versatility make it a valuable tool for addressing urgent questions related to climate change impact mitigation and adaptation strategies.

In conclusion, the fusion of outdoor lysimeters and indoor ecotrons into a unified platform signifies a milestone in climate change research. This innovative approach provides researchers with a powerful tool to investigate and address the complex challenges posed by climate change, fostering a more sustainable and resilient future.

How to cite: Reth, S.: Advancements in Lysimeters and Ecotrons: A Novel Platform for Investigating Climate Change Parameters in Laboratory and Field Settings, EGU General Assembly 2024, Vienna, Austria, 14–19 Apr 2024, EGU24-9489, https://doi.org/10.5194/egusphere-egu24-9489, 2024.

EGU24-9685 | ECS | Orals | HS1.2.5 | Highlight

The need for realistic experimental setups in controlled environments: insights from a two-year ecotron experiment on earthworms’ impact on ecosystem H2O, CO2 and N2O dynamics 

Joana Sauze, Oswaldo Forey, Clément Piel, Emmanuel S. Gritti, Sébastien Devidal, Abdelaziz Faez, Olivier Ravel, Yvan Capowiez, Damien Landais, Jacques Roy, and Alexandru Milcu

Recent studies have highlighted the potential role of earthworms in modulating soil greenhouse gas (GHG) emissions, yet the complexity of natural ecosystems and the lack of high-resolution temporal data have limited our understanding. To bridge this gap, a two-year experiment was undertaken in a controlled ecotron setting, utilizing large-scale lysimeters (5 square meters in area and 1.5 meters in soil depth) in the Macrocosms experimental platform of the Montpellier European Ecotron (CNRS). This study aimed to provide an understanding of the impact of earthworms (specifically endogeic and anecic ecotypes) on water and greenhouse gas emissions in a realistically simulated agricultural ecosystem undergoing a three-crop rotation.

We employed continuous, high-frequency monitoring to measure ecosystem-level exchanges of CO2, N2O, and H2O. While temporary increases in CO2 fluxes were noted in earthworm-inhabited replicates, the cumulative data over the entire study period did not demonstrate a significant increase in CO2 emissions. Interestingly, the presence of endogeic earthworms was correlated with a notable reduction in N2O emissions during wheat cultivation (by 44.6%), although this effect did not persist throughout the entire experimental timeline. Additionally, while earthworms had an impact on water infiltration along the soil profile, no consistent patterns were observed in terms of ecosystem evapotranspiration or water use efficiency (WUE) changes attributable to earthworm activity.

Our findings provide critical insights into the role of earthworms in terrestrial GHG dynamics, particularly in agricultural settings. Contrary to prevailing assumptions, this study suggests that earthworm activity does not lead to a significant increase in greenhouse gas emissions over a period of two years under conditions that closely emulate agricultural environments. These results underscore the importance of conducting long-term, high-resolution studies in realistically simulated ecosystems to better comprehend the intricate relationships between soil biota and greenhouse gas emissions.

How to cite: Sauze, J., Forey, O., Piel, C., Gritti, E. S., Devidal, S., Faez, A., Ravel, O., Capowiez, Y., Landais, D., Roy, J., and Milcu, A.: The need for realistic experimental setups in controlled environments: insights from a two-year ecotron experiment on earthworms’ impact on ecosystem H2O, CO2 and N2O dynamics, EGU General Assembly 2024, Vienna, Austria, 14–19 Apr 2024, EGU24-9685, https://doi.org/10.5194/egusphere-egu24-9685, 2024.

EGU24-11233 | Orals | HS1.2.5 | Highlight

Influence of climate and land management on water, carbon and nitrogen cycling in grasslands of the pre-alpine region of southern Germany 

Ralf Kiese, Marcus Schlingmann, Katrin Schneider, Sophie Reinermann, Anne Schucknecht, Jincheng Han, Thomas Koellner, Carolin Boos, and Michael Dannenmann

Pre-alpine grasslands provide important economic value through forage for milk and meat production. Grassland soils also support ecosystem services such as carbon and nitrogen storage, water retention, erosion control and biodiversity. These functions are currently threatened by climate change, which is likely to accelerate in the coming decades. In addition to climate change, management decisions such as mowing and fertilisation frequency have a major impact on grassland yields, biodiversity and soil C and N dynamics. In this presentation we will summarise results from long-term monitoring of control and translocated grassland soil monoliths (1m2; 1.4m height) as operated in TERENO and studied in detail in the SUSALPS project.

From 2012, moderate climate change (plus 2°C) has increased grassland productivity, unless water stress has reversed the temperature stimulating effect. However, this increase in plant growth is only possible because increased N mineralisation rates under climate change allow increased N demand to be met. As plant N uptake is already in the range of total N fertilisation rates under current climate conditions, N losses to the environment, such as microbial N2O emissions and nitrate leaching from montane grassland soils, are comparatively low. If other ecosystem N losses such as NH3 and N2 emissions are considered, it becomes clear that even under the present climatic conditions substantial N has to be provided by mineralisation of soil organic N, indicating soil N (and C) mining. As the latter is associated with negative effects on soil fertility/productivity, C sequestration and GHG exchange, as well as filtering functions to protect water bodies, this trend poses risks to key soil functions in the long term. The detailed investigations from long-term monitoring sites were essential for testing a process-based model (LandscapeDNDC), which was used together with remote sensing information for spatial and temporal upscaling of the results.

How to cite: Kiese, R., Schlingmann, M., Schneider, K., Reinermann, S., Schucknecht, A., Han, J., Koellner, T., Boos, C., and Dannenmann, M.: Influence of climate and land management on water, carbon and nitrogen cycling in grasslands of the pre-alpine region of southern Germany, EGU General Assembly 2024, Vienna, Austria, 14–19 Apr 2024, EGU24-11233, https://doi.org/10.5194/egusphere-egu24-11233, 2024.

EGU24-11711 | Orals | HS1.2.5

The Deep Soil Ecotron – A Facility to Explore, Model, and Sense Deep Soil 

Zachary Kayler, Michael Strickland, David Williams, Rodrigo Vargas, Zeli Tan, Caley Gasch, Susan Crow, and Noah Fierer

The Deep Soil Ecotron will give researchers the unparalleled ability to investigate and experiment with deep soils while complementing established ecotrons across the globe. This facility, composed of twenty-four, highly instrumented ecounits, will allow for soil profiles up to three meters in depth to be repeatedly sampled and continuously monitored. This facility will be the first modern ecotron facility in the United States and as such will provide research infrastructure that this country currently lacks. The Deep Soil Ecotron will enable researchers to address the following four broad research needs using approaches and instrumentation that have been unattainable under more common field and laboratory experiments. First, the Deep Soil Ecotron will reveal how deep soil communities and processes affect and interact with surface soils to influence whole ecosystems. Second, the Deep Soil Ecotron will allow researchers to determine how deep soils and associated vegetation respond to global and land-use change, such as increasing soil temperature and agricultural management practices. Third, information gained from the Deep Soil Ecotron will be integrated into earth system models to improve model representation of soil carbon cycling. Fourth, the Deep Soil Ecotron will provide a testbed for the development of sensors for the in-situ monitoring of deep soils. This presentation will provide an overview of the Deep Soil Ecotron's design, capacity, and preliminary research agenda.

How to cite: Kayler, Z., Strickland, M., Williams, D., Vargas, R., Tan, Z., Gasch, C., Crow, S., and Fierer, N.: The Deep Soil Ecotron – A Facility to Explore, Model, and Sense Deep Soil, EGU General Assembly 2024, Vienna, Austria, 14–19 Apr 2024, EGU24-11711, https://doi.org/10.5194/egusphere-egu24-11711, 2024.

EGU24-12759 | Orals | HS1.2.5

Enhanced understanding of water cycling processes of dwarf shrubs using high-precision lysimeters and climate manipulations 

Georg Leitinger, Elena Tello-García, Lucía Laorden-Camacho, Lisa Ambrosi, Karl Grigulis, Bello Mouhamadou, Christiane Gallet, Ursula Peintner, Ulrike Tappeiner, and Sandra Lavorel

Throughout European mountains, changes in livestock production systems since the 1950s have resulted in the gradual segregation between more accessible, flatter, and productive grasslands with intensified fodder production, and more remote, steeper, and less productive meadows used for extensive grazing, and some abandoned. After cessation of grazing in subalpine grasslands, secondary succession promotes the gradual colonization of species and functionally diverse herbaceous communities by shrubs. Although shrub encroachment is considered a ‘Plant Functional Type transformation’, our knowledge about the impact of climate change on shrub encroached ecosystems is still limited. Mechanistic analyses of alpine grassland responses to drought have focused on carbon fluxes, and a few studies have targeted components of the ecosystem water budget or nutrient cycling. However, these studies are focused on herbaceous functional groups, and shrubs are usually neglected. Moreover, despite the prevalence of this original climate change driver in mountains, snow manipulations are still rare.

To improve understanding of nitrogen and water cycling processes of shrubs with expected increased drought and advanced snowmelt, small high-precision lysimeters (SFL®, Meter Group AG, Munich, Germany) were used to analyze the effects and mechanisms of climate change on shrub species. In a garden experiment in the LTSER-site Stubai Valley (970 m a.s.l.), Tyrol Austria, two congeneric shrubs contrasting a deciduous (Vaccinium myrtillus) and evergreen (Vaccinium vitis-idaea) were planted into 16 lysimeters. In a split-plot design of 3.5m x 3.5m each, two plots were subject to either (1) control, (2) earlier snowmelt, or (3) summer drought treatments.

The manipulative experiments indicate that a shortening of the period with snow cover at the end of winter affects soil freezing and hence, soil nitrogen (N) and carbon (C) availability. Results further highlight the interacting effects of climate manipulations on key plant traits, and their consequences for N- and water availability. Furthermore, summer drought seems to additionally affect biogeochemical cycling and evapotranspiration for both investigated shrub types. This study's results reveal the importance of addressing the impact of shrub encroachment not only from a land management perspective but also to increasingly raise awareness about climate change effects on shrubs. Moreover, it provides valuable insights into challenges and chances of growing shrubs in lysimeters, being a promising approach for future climate impact studies. The study was conducted as part of the LUCSES project, ANR-FWF (ANR-20-CE91-0009 and FWF-I 4969-B).

How to cite: Leitinger, G., Tello-García, E., Laorden-Camacho, L., Ambrosi, L., Grigulis, K., Mouhamadou, B., Gallet, C., Peintner, U., Tappeiner, U., and Lavorel, S.: Enhanced understanding of water cycling processes of dwarf shrubs using high-precision lysimeters and climate manipulations, EGU General Assembly 2024, Vienna, Austria, 14–19 Apr 2024, EGU24-12759, https://doi.org/10.5194/egusphere-egu24-12759, 2024.

EGU24-14816 | ECS | Posters on site | HS1.2.5

Can we bring alpine climate into ecotrons? 

Harald Crepaz, Johannes Klotz, Marco Cavalli, Ulrike Tappeiner, and Georg Niedrist

Climate change is advancing at an unprecedented pace, impacting terrestrial ecosystems, particularly those in alpine regions. Consequently, there is a growing need to comprehend the associated impacts, underlying mechanisms, and implications. Long-term monitoring may face challenges in capturing the effects of accelerated climate change, and in-situ experiments in remote alpine areas often grapple with logistical constraints. Furthermore, attributing vegetative responses to specific manipulated variables proves challenging, especially under extreme alpine conditions such as low atmospheric pressure, low temperatures, or high radiation levels.

Using a specially designed ecotron called 'TerraXcube' (Bozen, Italy), we investigated the feasibility of realistically reproducing harsh alpine conditions and explored the interactions among various parameters. For our measurements, we equipped the chamber with temperature and relative humidity probes, a spectrometer, barometer, and anemometer positioned at different heights within the chamber. We tested the spatial and temporal homogeneity of the variables— atmospheric pressure, temperature, relative humidity (RH), and radiation—independently, as well as their interactions over time and in space, by simulating various realistic alpine climatic scenarios.

The measurements, conducted between -20°C and +25°C with relative humidity ranging from 10% to 95%, yielded satisfactory results. Over several hours, the largest difference at a specific position was 0.6°C and 4.3% RH, while the maximum difference between two sensors simultaneously was 1°C and 7% RH. At a height of 170 cm, the LED system emitted radiation at an intensity of 1,002 W/m² within the wavelength range of 280 to 900 nm; however, with a sharp decrease in intensity from the light source. The photosynthetically active radiation (PAR) at the chamber's center reached 1,883 μmol·m−2·s−1, achieving 77% of the potential annual maximum measured at 2,400 m a.s.l. This enables us to replicate the PAR level for 97% of the days throughout the year. Despite the high light intensity, the heating effect of the LED system was limited to a maximum of 2°C in the upper 40cm of the chamber. Pressure manipulation, with the highest technical demand, nonetheless resulted in high temporal homogeneity up to 4,000m a.s.l., corresponding to 618.9 mbar.

In conclusion, the results emphasize the potential and utility of ecotrons in simulating a suitable climate for alpine ecological experiments. However, as in many ecotrons, it is crucial to acknowledge that minor island effects and irregularities are inevitable. Even more sophisticated parameters such as wind effects or pollinator function are currently not sufficiently addressed. A combined in- and outdoor usage of mobile field lysimeters might be a further step to bridge this gap between experimental results obtained in ecotrons and in the field.

How to cite: Crepaz, H., Klotz, J., Cavalli, M., Tappeiner, U., and Niedrist, G.: Can we bring alpine climate into ecotrons?, EGU General Assembly 2024, Vienna, Austria, 14–19 Apr 2024, EGU24-14816, https://doi.org/10.5194/egusphere-egu24-14816, 2024.

EGU24-15212 | ECS | Posters on site | HS1.2.5

Effects of land use change on dry heathland soil moisture in a changing climate 

René Shaeffer, Francois Rineau, and Nadia Soudzilovskaia

Conversion of natural and semi-natural systems to agricultural use is one of the largest conservation
challenges of our time. As the world’s population continue to grow at unprecedented rates,
multinational organizations like the United Nations and its subsidiary the Food and Agriculture
Organization call for higher crop production and the expansion of existing agriculture to ensure future
food security, especially in the face of changing climate. However, these efforts will most likely endanger
numerous landscapes of historical and cultural value, including those found in northwest Europe. How
these possible changes in land use may alter the functions of these ecosystems and the associated
services they provide are questions that need to be answered before any policy decisions can be made.


Using a state-of-the-art ecotron facility, we compared soil moisture profiles between an intact dry
heathland system and heathland soils that had been cleared for cereal agriculture, both of which were
subjected to climate conditions projected for the year 2070, in line with the IPCC RCP8.5. After
continuously monitoring moisture changes in the top 1.5 meters of soil for three years, we found that
there are significant differences between the two modes of land use. Soils used for cereal crops were
significantly drier (up to >60%) in the upper 10-20cm than intact heathland soils, and significantly wetter
(up to >500%) at the lowest soil levels (140cm). This redistribution of moisture within the soil column
under different land use schemes can have serious implications for overall ecosystem functioning,
particularly with regard to potentially mitigating heathland soils’ ability to store and capture carbon and
exacerbating detrimental soil-climate feedbacks under agricultural use.

How to cite: Shaeffer, R., Rineau, F., and Soudzilovskaia, N.: Effects of land use change on dry heathland soil moisture in a changing climate, EGU General Assembly 2024, Vienna, Austria, 14–19 Apr 2024, EGU24-15212, https://doi.org/10.5194/egusphere-egu24-15212, 2024.

EGU24-15321 | ECS | Posters on site | HS1.2.5

A practical approach to link lysimeter and large-scale measurement systems. 

Gunther Liebhard, Peter Strauss, Peter Cepuder, and Reinhard Nolz

An accurate and reliable measurement system is essential for analysing transport processes within the soil-plant-atmosphere continuum and for calibrating and validating ecosystem or hydrological models. Weighing lysimeters are very suitable tools for these purposes, as they are the most direct tools to reliably and precisely measure water mass balance components such as rainfall and non-rainfall water inputs, evapotranspiration, and percolation at the system boundaries. Investigating the ecosystem by use of lysimeters is more or less limited to point measurements, though. Approaches are therefore required to link lysimeter mesurements to the landscape scale. We present our experimental approach to link point and large-scale parameter assessment at an experimental station in Groß-Enzersdorf, Austria. In particular, we use soil water content data across the soil profiles from capacitance sensors and t-test statistics to check the representativeness of the conditions in the lysimeter body with the surrounding field and to assess soil hydraulic properties for numerical modeling of water fluxes. Based on this, we transfer measurement data with high measurement accuracy and temporal resolution from the lysimeter scale to the large-scale measurement systems such as eddy covariance, scintillometry, or isotope hydrology. On the other hand, we are able to incorporate parameters from areal measurements and from measurements using disturbed and undisturbed soil samples into the lysimeter measurement system.

How to cite: Liebhard, G., Strauss, P., Cepuder, P., and Nolz, R.: A practical approach to link lysimeter and large-scale measurement systems., EGU General Assembly 2024, Vienna, Austria, 14–19 Apr 2024, EGU24-15321, https://doi.org/10.5194/egusphere-egu24-15321, 2024.

EGU24-15370 | Posters on site | HS1.2.5

What you do not know, and what you should know about lysimeter experiments 

Thomas Puetz, Horst H. Gerke, Nicolas Brueggemann, Harry Vereecken, and Jannis Groh

For many studies in the fields of soil, hydrology, agriculture, ecology, meteorology, and environmental sciences and across disciplines, conventional field experiments are inadequate because the variables cannot be measured properly or controlled experimentally. In the soil-plant-atmosphere continuum, lysimeters can be used as an integrative experimental approach that enables precise measurements of water and matter fluxes in combination with field crops. The term lysimeter basically refers to two different types of experimental equipment. Porous suction cups, as well as containers/vessels filled with soil substrates or other materials, are termed lysimeters. Lysimeters are vessels of various sizes filled with ecosystem compartments, taking a holistic approach as each compartment interacts dynamically within the biosphere.

Lysimeter experiments are carried out in a wide variety of designs. To optimize the scientific exploitation of lysimeter data, various prerequisites should be met. The complexity of lysimeter experiments will be explained in more detail, the advantages of lysimeters, but also the restrictions and limitations will be examined in more detail. We would like to suggest some hints, norms, and rules for conducting lysimeter experiments that can optimize and increase the benefit and profit of lysimeter experiments. Special attention is paid to the important technical details that can significantly influence the quality of lysimeter measurements. The latest technical developments are also briefly presented.

How to cite: Puetz, T., Gerke, H. H., Brueggemann, N., Vereecken, H., and Groh, J.: What you do not know, and what you should know about lysimeter experiments, EGU General Assembly 2024, Vienna, Austria, 14–19 Apr 2024, EGU24-15370, https://doi.org/10.5194/egusphere-egu24-15370, 2024.

EGU24-16315 | Posters on site | HS1.2.5

Aluminum fate in forest soils developed from magmatic and metamorphic rock of mid-mountain areas in Germany 

Roukaya Eid, Katharina Lehmann, Karin Eusterhues, and Kai Totsche

Climate and land use change affect weathering and pedogenesis with potential consequences for the fate of Al-bearing minerals and the potential export of Aluminum to groundwater resources. These changes might result in strong acidification, originally known for “acid rain” affecting these areas until the second but last decade of the past century. To explore the fate of Al in areas now affected by climate and land use change, we investigated two sites of different geology in North-Bavaria. Site 1 is located on granitic rocks under a reforested 6-year-old Norway spruce forest. Site 2 is a hilltop site located on metamorphic rocks under a 60-80-year-old spruce forest. Soil samples (< 2mm) and clay fractions were analyzed by hydrochemical and spectroscopic techniques. Zero tension controlled lysimeter and automated tension controlled lysimeters were installed for monitoring the soil solution volume and composition at the topsoil-subsoil and the subsoil-regolith boundary. Monitoring started in June 2018. Since then, 85 sampling campaigns have been completed that amounted to 1500 individual lysimeter samples. Analysis comprised among others EC, pH, elemental composition major anions and cations, and carbon sum parameters (DOC, TOC, DIC, TIC).

Recent climate at the sites differs markedly from the 1961-1990 period, indicating a transient climate at the sites. Mean soil pH ranged from 3.2 to 4.7 at both sites and was comparable to values published in 1995 by Franken et al. (3.4 to 4.2). Thus, recent soil pH is as low as used to be under the conditions of strong acid precipitation of the last century. Soils developed from magmatic rock showed higher contents of variable Al phases than those developed from metamorphic rocks.

At both sites pyrophosphate extractable Al is the dominant Al pool accounting 19.4% of total Al in site 1(14.1 g/kg in Bs horizon), and 6.9% of total Al in site 2 (4.9 g/kg in Bs horizon).

Noteworthy, hydrological summer was more important for seepage generation than the hydrologic winter: Roughly 68% of the total annual seepage volume was found in the hydrological summer. As a result, the TOC flux from the subsoil in summer is 35.66 ± 20 mg/year, and only 13.88 ± 13.8 mg/year in winter. Similarly, the Al flux in summer is 1.02 ± 0.7 mg/year and only 0.43 ± 0.4 mg/year in winter.

Variation partitioning analysis showed that the seasonal variation and the difference between topsoil and subsoil combined explained less than 5 % of the particle-related soil solution properties ((pH, ∑LMWO, TOC, Al and Si(mg/L)) and less than 1% of the hydrochemical properties (TIC, Cl, SO42−, Ca, Mg, Na (mg/L)). Difference between the two sites explained 13.84% and 6.48% of the two sets, respectively and the sampling year explained 4.52% and 4.74%. We conclude that the Al system at our sites is controlled by climatic conditions and site properties (lithology, slope, vegetation..). There are no indications that the released Al is immobilized in any secondary immobile Al-phase in the subsoil or downstream, pointing to the potential transport of Al and other unwanted substances to the aquifers.

How to cite: Eid, R., Lehmann, K., Eusterhues, K., and Totsche, K.: Aluminum fate in forest soils developed from magmatic and metamorphic rock of mid-mountain areas in Germany, EGU General Assembly 2024, Vienna, Austria, 14–19 Apr 2024, EGU24-16315, https://doi.org/10.5194/egusphere-egu24-16315, 2024.

EGU24-20671 | Posters on site | HS1.2.5 | Highlight

Effect of climate change on functioning of natural and agricultural ecosystems: an ecotron study 

Francois Rineau and Nadejda Soudzilovskaia and the Ecotron consortium team

Ecotrons represent enclosed systems in which macrocosms are subjected to controlled environmental conditions, and their responses are closely monitored at a high frequency. This makes them particularly well-suited for investigating the impact of climate change on ecosystem functioning. In this presentation, we demonstrate the utilization of the UHasselt ecotron to examine the effects of climate change on two distinct ecosystems: a natural heathland and an agricultural pear orchard.

We delve into the results obtained thus far, covering aspects such as carbon balance, water balance, greenhouse gas emissions, soil water nutrients, plant biomass, phenology, soil microbial communities, and soil fauna. Additionally, we explore the strengths and limitations associated with ecotron-based approaches. The presentation concludes by identifying future challenges in this field.

How to cite: Rineau, F. and Soudzilovskaia, N. and the Ecotron consortium team: Effect of climate change on functioning of natural and agricultural ecosystems: an ecotron study, EGU General Assembly 2024, Vienna, Austria, 14–19 Apr 2024, EGU24-20671, https://doi.org/10.5194/egusphere-egu24-20671, 2024.

EGU24-20967 | Orals | HS1.2.5

Determining the soil water balance at a large-scale lysimetric facility with 60 years of uninterrupted data comprising a grassland basin, oak/beech and a pine basin 

Marcel Gaj, Stephan Costabel, Michèle Erlach, Julia Frank, Viktoriya Tarasyuk, Stephan Peth, and Vera Schimetzek

The research facility St. Arnold presented here consists of three individual lysimeters with an area of 400m² and 3.5m depth each. They are similar in soil types but differ in vegetation cover. This unique setup allows the direct comparison of the water balance of grassland, oak/beech forest and pine forest under the same climatic and topographic boundary conditions. The later site were cut after a significant storm occurred in 2007. Since a pioneer forest developed. 

The data collection of precipitation, groundwater recharge, temperature, humidity and sunshine duration started in 1964. In addition, stem diameter at certain trees has been determined once a year.  All data until 1997 were collected manually. After that automated collection of hydro climatic data were established and transmitted directly into the database of LANUV. From the data, evaporation rates were calculated with Penman-Montheith. More recently in October 2023 undisturbed soil cores where collected and analyses for their saturated and unsaturated hydraulic conductivity. In addition, the investigation of the water balance has been done with HYDRUS 3D.

The data shows significant trends. Further, it can be observed how storm damage and/ or clear-cut of forested areas impact the soil water balance.  The long-term average of the period 1965 to 2007 showed, the grassland basin turns more than half of its annual incoming precipitation into leachate and only 36% into evaporation while the deciduous forest exhibits a ratio of 36% leachate and 56% for evapotranspiration. The evergreen coniferous forest shows the highest evaporation rate 65% and the lowest leachate rate with 26%. (Harsch et al., 2009)

An upgrade of the entire facility with state of the art measurements devices is in progress. This will initiated with a geophysical survey in the beginning of 2024 along with the installation of soil moisture and tensiometer sensors. Depending on funding permanent and long term geophysical measurements and stable isotope analysis will be conducted all data will be available open source. We welcome collaborators for joint research at the facility.

 Harsch, N., Brandenburg, M., & Klemm, O. (2009). Large-scale lysimeter site St. Arnold, Germany: analysis of 40 years of precipitation, leachate and evapotranspiration. Hydrology and earth system sciences13(3), 305-317.

How to cite: Gaj, M., Costabel, S., Erlach, M., Frank, J., Tarasyuk, V., Peth, S., and Schimetzek, V.: Determining the soil water balance at a large-scale lysimetric facility with 60 years of uninterrupted data comprising a grassland basin, oak/beech and a pine basin, EGU General Assembly 2024, Vienna, Austria, 14–19 Apr 2024, EGU24-20967, https://doi.org/10.5194/egusphere-egu24-20967, 2024.

EGU24-21932 | Orals | HS1.2.5

Heat transport model simulations of Lysimeter/Ecotron systems 

Gernot Klammler, Janja Vrzel, and Hans Kupfersberger

Soil temperature plays a central role in the complex processes in the vadose zone, particularly in connection with water and solute transport. As a major thermal factor, soil temperature influences not only the physical properties of the soil, but also the biochemical reactions responsible for the transport of water and solutes. The variation of soil temperature can have significant effects on the mobility of nutrients and pollutants and thus plays a key role in understanding and controlling important soil processes.

Ecotrons in combination with weighable lysimeters are generally able to investigate complex ecological processes (e.g. evapotranspiration, nutrient dynamics) under controlled conditions. However, the requirement for this is that the temperature control of the soil column can be simulated with sufficient accuracy over the entire height and cross-section. Furthermore, it must also be ensured that the required rates of temperature change in the soil column, which can vary depending on the scientific question, can be simulated.

In the course of the abstract submitted here, we would like to present the results of 3D heat transport model simulation for selected examples, which contribute to the optimization of the technical design of Lysimeter/Ecotron systems (e.g. with regard to insulation thickness, heat exchanger area, required inlet temperature in the heat exchanger, etc.).

How to cite: Klammler, G., Vrzel, J., and Kupfersberger, H.: Heat transport model simulations of Lysimeter/Ecotron systems, EGU General Assembly 2024, Vienna, Austria, 14–19 Apr 2024, EGU24-21932, https://doi.org/10.5194/egusphere-egu24-21932, 2024.

HS1.3 – Cross-cutting hydrological sessions

EGU24-1500 | ECS | Posters on site | HS1.3.1

Reclaimed wastewater or surface water use in irrigation: Delineating potential fate and impacts of pharmaceuticals  

Anwesha Mukhopadhyay, Sonali Banerjee, Sonam Jha, Saibal Ghosh, Pradip Bhattacharyya, and Abhijit Mukherjee

The depletion of groundwater storage is being acknowledged as a progressively severe global issue. Around 69% of the total groundwater abstracted is used in the agricultural sector. Hence, it is imperative that we refrain from excessive abstraction of groundwater for irrigation and instead focus on utilizing surface water or reclaimed wastewater. However, these alternate sources can be contaminated with certain emerging contaminants (EOCs) that might raise concern in the future. Hence, this study aims to investigate the effect of surface water or reclaimed wastewater irrigation on rice (Oryza sativa), a water-intensive staple grain in the Asian region. A field experiment was carried out on rice, in which they were subjected to irrigation with water spiked with three commonly detected pharmaceuticals in the environment, namely sulfamethoxazole (SMX), carbamazepine (CBZ), and ibuprofen (IBP). The crops were irrigated at regular intervals for ten times throughout the growing period with three different pharmaceutical doses (0.5g), medium (1g), and high (5g). The control set was irrigated with uncontaminated water. Post-harvest agronomical analysis suggests that the grain yield remained unaffected by contaminant addition, whereas the straw yield was increased by up to 25%, 29% and 33% for SMX, CBZ, and IBP, respectively. The contaminant concentration in the rice grains was found to be greater than the limit of detection (LOD) for all the contaminants at different doses but was not > LOQ for some of them. The health quotient (HQ) for SMX and IBRU was <0.1, signifying lower risk, while for CAR, it ranged from 0.1 to 1, indicating medium risk. Overall, irrigation with reclaimed wastewater or surface water can be detrimental only if higher concentrations of certain pharmaceuticals, like CAR, are present. However, further studies are required as far as metabolites are concerned. Hence, this study will help in determining appropriate concentration thresholds for pharmaceuticals present in surface water or reclaimed wastewater that are considered safe for agricultural purposes.

How to cite: Mukhopadhyay, A., Banerjee, S., Jha, S., Ghosh, S., Bhattacharyya, P., and Mukherjee, A.: Reclaimed wastewater or surface water use in irrigation: Delineating potential fate and impacts of pharmaceuticals , EGU General Assembly 2024, Vienna, Austria, 14–19 Apr 2024, EGU24-1500, https://doi.org/10.5194/egusphere-egu24-1500, 2024.

Comprehending runoff generation processes remains a formidable challenge for hydrologists. This study advocates for a comparative examination of these processes across global experimental watersheds. As part of the HELPING decadal initiative, a dedicated working group has been established. Embracing a Darwinian methodology, our objective is to synthesize information through comparative studies across a diverse array of local ecosystems, with the aim of cultivating a global perspective and formulating overarching theories.

We warmly welcome and invite research groups managing experimental watersheds worldwide to actively participate in this collaborative effort. The working group is designed to achieve the following objectives:

1) Compile datasets for experimental watersheds globally, maximizing the utilization of available information.

2) Identify both similarities and differences in watershed characteristics and processes across diverse experimental sites.

3) Develop a more quantitative framework to discern dominant processes within specific watersheds, thereby contributing to a profound understanding of hydrological dynamics.

By bringing together researchers and research groups from across the globe, this collaborative initiative seeks to transcend geographical boundaries and foster a holistic understanding of runoff generation processes.

How to cite: Tian, F. and Cui, Z.: Exploring Runoff Generation Processes: A Global Comparative Study of Experimental Watersheds, EGU General Assembly 2024, Vienna, Austria, 14–19 Apr 2024, EGU24-2274, https://doi.org/10.5194/egusphere-egu24-2274, 2024.

EGU24-2412 | Posters on site | HS1.3.1

Development of Watershed Simulator and Its Application in China 

Jun Xia, Junguo Liu, Dunxian She, Liangsheng Shi, Sidong Zeng, Lei Zou, Yanjun Zhang, and Chen Hu

The river basin is a fundamental natural unit interlinked with water, soil, air, ecology, and society, serving as a water management system for local communities. The River Basin Simulator (RBS) operates as a simulation system driven by datasets and hydrological knowledge, utilizing the technology of a digital twin basin. This paper addresses the initiative of WG1.14, specifically the Development & Application of River Basin Simulators, under Theme 1 of the HELPING program for IAHS, encompassing the goals and work plan of WG1.14. The development and applications of RBS in China, including the Yangtze River Simulator and its practical applications, are presented.

Through RBS development, it can play a pivotal role in supporting the integration of natural hydrology with socio-hydrology, thereby fostering sustainable development. The initiative of WG1.14 has the potential to promote the development of tools for the digital twin basin, building a bridge from Change (Panta Rhei) to Solution (HELPING). This includes understanding hydrological processes, utilizing advanced hydrological models, and the practical application of socio-hydrology insights, supporting Theme 1 of HELPING with global and local interaction.

How to cite: Xia, J., Liu, J., She, D., Shi, L., Zeng, S., Zou, L., Zhang, Y., and Hu, C.: Development of Watershed Simulator and Its Application in China, EGU General Assembly 2024, Vienna, Austria, 14–19 Apr 2024, EGU24-2412, https://doi.org/10.5194/egusphere-egu24-2412, 2024.

EGU24-3020 | Posters on site | HS1.3.1

Obtaining holistic solutions for wet extremes and flooding in the Awash basin, Ethiopia   

Meron Teferi Taye, Ellen Dyer, Mengistu Dessalegn, and Katrina Charles

The Awash basin of Ethiopia experiences frequent climate extremes-related disasters. Climate change is contributing to frequent flooding in different parts of the basin. This study explores the drivers of extreme rainfall, the multi-causality and consequences of flooding, governance, and policy implications using a combination of interdisciplinary approaches. The multi-dimensional perspective includes analysis of hydroclimatic variables at the basin level including global drivers, flood characterization, and understanding of affected communities at different parts of the basin through examining the experiences of different water and land users. The study covered urban and rural areas, small-scale agricultural, and pastoral or agropastoral catchments. To obtain diversified perspectives consultation with various basin stakeholders was conducted. By considering the 2020 extreme wet season the study aims to contribute to future management practices that might adapt to extremes and associated floods. The results show that recent rainfall extreme during the summer of 2020 occurred in unusual parts of the basin. Compared to the 1981-2010 baseline the lower part of the basin had a rainfall anomaly of more than 50%. Moreover, antecedent rainfall conditions during April-June contributed to saturating the soils as the months before July were wetter than the base period on average by 62%. The soil moisture content conditions were wetter than average from 10 to 40% in these antecedent months. Unusual rainfall in terms of location, magnitude, and timing is the major cause of flooding in the cases of 2020.  First, the western part of the lower basin received higher rainfall than normal earlier in the season. Then, in the later part of the season, the upper basin received high rainfall that increased the amount of water in upstream rivers which contributed to the massive flooding in the lower basin. This characterizes the 2020 flood occurrences by early onset and delayed recession. The extreme rainfall collided with weak La Nina and positive Western Indian Ocean as global drivers. There are other contributing factors that exacerbate the cause and impacts of flooding on communities. This includes challenges in river morphology, flood forecasting, reservoir management, and differences between private investors and local vulnerable communities in managing extreme cases. For instance, the Awash River broke off its normal course during 2020 extreme rainfall. Uncontrolled water diversion by farmers for irrigation created new water pathways. Low quality of engineering structures e.g., dikes failed to prevent extreme floods. Land use changes, such as urbanization and deforestation increased erosion and blocked drainage ways. Lack of coordination among institutions, weak collective action and governance aspects are exacerbating factors of climate extreme impacts on vulnerable communities. A holistic approach to solving the devastating impact of climate extremes provides better understanding of the multi-causality and multi-dimensionality of water-related risks, to support implementation of adaptive management and coordination approaches in monitoring human-physical systems interactions across sectors.

How to cite: Taye, M. T., Dyer, E., Dessalegn, M., and Charles, K.: Obtaining holistic solutions for wet extremes and flooding in the Awash basin, Ethiopia  , EGU General Assembly 2024, Vienna, Austria, 14–19 Apr 2024, EGU24-3020, https://doi.org/10.5194/egusphere-egu24-3020, 2024.

EGU24-4773 | ECS | Orals | HS1.3.1 | Highlight

HELPING: Co-creating and communicating water solutions in a globally changing world 

Adeyemi Olusola, Giulio Castelli, and Natalie Ceperley

The current IAHS decade is dedicated to "Hydrology Engaging Local People IN one Global world" (HELPING). One of the core mandates of HELPING, as captured under Theme 3, emphasizes the co-creation of water knowledge and communication. Even though co-creation is not novel, especially within a participatory framework, defining and providing boundaries has been challenging when viewed through a hydrological lens. Our ongoing discussions and meetings have focused on understanding the uniqueness of this Theme and how best we can HELP to utilize diverse communication instruments IN one Global world. For Theme 3, we intend to answer questions such as: (a) How best can we co-create hydrological knowledge (indigenous/traditional and evidence-based) between people and disciplines? (b) How can we improve and increase the visibility of the hydrological decade? (c) How can we provide water solutions through the active engagement of Local People? Some answers to these questions lie in focusing on bottom-up approaches to solve the water crisis in a globally changing world. We acknowledge the fluidities in HELPING regarding the co-creation of water knowledge, which underscores the recognition of variability and complexity within this endeavour. As such, we intend to be diverse in our approach by amplifying silent voices that may have been overlooked, also with a decolonial perspective, and engaging other perspectives from other disciplines, such as but not limited to social sciences and humanities, specifically those whose work intersects sociohydrology, hydro-sociology, hydropolitics and hydronarratives. 


How to cite: Olusola, A., Castelli, G., and Ceperley, N.: HELPING: Co-creating and communicating water solutions in a globally changing world, EGU General Assembly 2024, Vienna, Austria, 14–19 Apr 2024, EGU24-4773, https://doi.org/10.5194/egusphere-egu24-4773, 2024.

EGU24-5911 | ECS | Orals | HS1.3.1 | Highlight

REHYDRATE - an international HELPING working group to REtrieve historical HYDRologic dATa and Estimates 

Miriam Bertola and Paola Mazzoglio and the HELPING REHYDRATE working group

Historical hydrological observations are often stored in printed documents and volumes of archives worldwide. This makes them practically inaccessible and unusable for modern hydrological studies as well as puts them at risk of permanent loss due to the deterioration of their medium. In addition to the intrinsic value of rescuing past observations, having access to historical data is essential for understanding better the complexity and changes in the hydrological cycle and its extremes.

Several data rescue initiatives exist, but the efforts are highly fragmented in space and time. Current tools for data digitization include optical character recognition (OCR) software and manual transcription. The latter is often carried out through participatory citizen science projects. The use of OCR software is cheap and fast, but it still requires a considerable amount of manual work due to the diversity of the documents, and its accuracy is, to date, not always acceptable. Manual transcription is more accurate, but extremely resource-intensive. For these reasons, there is a general need for better and less costly methods for hydrological data rescue. New tools are becoming available, and new technologies are developing rapidly. 

In response to these challenges, the REHYDRATE Working Group has been proposed as part of the IAHS HELPING Science for Water Solutions decade in summer 2023 (https://iahs.info/uploads/HELPING/WG%20Proposal%20REHYDRATE.pdf). The Working Group aims to connect scientists engaged in data rescue, fostering a collaborative community to exchange knowledge, experiences, and best practices in hydrological data rescue and digitization. The ultimate objective is to promote and facilitate hydrologic data digitization initiatives and to ensure their accessibility through open-access repositories.

Approximately 80 scientists from diverse geographical regions have joined the Working Group at the time of writing this abstract. Initial meetings were organized in late 2023, and the group is currently working towards its first short-term objective: conducting a comprehensive state-of-the-art assessment of methods, initiatives, and articles related to the digitization of historical hydrological data.

How to cite: Bertola, M. and Mazzoglio, P. and the HELPING REHYDRATE working group: REHYDRATE - an international HELPING working group to REtrieve historical HYDRologic dATa and Estimates, EGU General Assembly 2024, Vienna, Austria, 14–19 Apr 2024, EGU24-5911, https://doi.org/10.5194/egusphere-egu24-5911, 2024.

EGU24-13108 | Orals | HS1.3.1

Building a community of practice to produce hydrological evidence: the iMHEA example 

Wouter Buytaert and the iMHEA network

The IAHS HELPING decade aims to foster a stronger connection and interaction between scientists, practitioners, policy makers, and end-users towards the goal of global water security. This is a formidable challenge. Despite increasing and highly valuable efforts of scientists to reach out beyond their own discipline and working environment, the ultimate goal of co-creating actionable knowledge is still a long way off in most contexts. Establishing communities of practice has been posited as an approach to creating inter- and transdisciplinary environments that enable cross-learning, pooling of expertise, and collaborative working towards a common goal. However, establishing such communities of practice is very hard, and the conditions and driving factors that allow them to emerge and be productive are poorly understood. It is therefore informative to analyse existing case studies to gain a better understanding of how they can be created and made sustainable. Here I analyse the case of the Initiative for the Hydrological Monitoring of Andean Ecosystems (iMHEA), which is a grassroots initiative that emerged 15 years ago as a collaborative attempt to generate a solid scientific evidence base to support water management in the upper Andes.

It started as a small network of 4 partners operating 6 catchments in Ecuador and Peru, using a common monitoring protocol. Since then, it has grown into a network of 22 partners, monitoring 51 catchments at 24 sites along the Andes. Partners represent academia, civil society, and local, regional, and national governments. Originally focused on sharing technical expertise, iMHEA has evolved into a more holistic knowledge co-creation community with a strong focus on community involvement, knowledge exchange, and supporting decision making at various levels.

We attribute the success of iMHEA to several factors, of which we believe the following are key. The members’ ability to raise funding, both at the start and at various stages of its development has certainly been a major factor. At the same time, its nature as an informal network has allowed it grow organically and bridge periods of very limited resource availability. Another identified factor is the clear common goal and mission statement, which gave it a clear sense of purpose, direction, and transparency for existing and future members. Lastly, the active approach to multidirectional knowledge exchange, allowed it to create value for all its members, creating a strong motivation to participate and contribute actively.

How to cite: Buytaert, W. and the iMHEA network: Building a community of practice to produce hydrological evidence: the iMHEA example, EGU General Assembly 2024, Vienna, Austria, 14–19 Apr 2024, EGU24-13108, https://doi.org/10.5194/egusphere-egu24-13108, 2024.

EGU24-13368 | ECS | Orals | HS1.3.1

From Local Success to Global Solutions: Tenets for Effective Groundwater Governance 

Maria Elena Orduna Alegria, Sam Zipper, James J. Butler Jr, Bill Golden, Blake B. Wilson, Burke W. Griggs, Chung-Yi Lin, David J. Yu, Donald O. Whittemore, Geoffrey C. Bohling, Hoon C. Shin, Jillian M. Deines, Jonah J. Allen, Landon T. Marston, Matthew R. Sanderson, Nathan P. Hendricks, Qiuyun Yu, Stephen Lauer, and Steven M. Smith

Groundwater depletion driven by intensive pumping for irrigated agriculture poses a global threat to economies, food security, and ecosystems. Addressing this issue requires pumping reductions, but their implementation is a wicked problem due to interlinked hydrological, social, and economic factors. Our study inspired the working group "Effective Aquifer Governance for Agriculture," aiming to contribute to the HELPING decade's goals by understanding local socio-hydrological processes and promoting recognition in the implementation of general policies at the local level.

This interdisciplinary study explores the success of the Sheridan 6 Local Enhanced Management Area (SD-6 LEMA) in the US High Plains Aquifer—a rare example of effective collective action in agricultural-groundwater systems. In its first decade, SD-6 LEMA exceeded reduction goals, reducing depletion rates by over 50% without significantly impacting net income. By analyzing hydrologic, climatic, economic, and social data from the SD-6 LEMA and the presence of Ostrom Design Principles in the SD-6 LEMA conservation program, we identified transferable governance tenets applicable to groundwater-dependent regions. These include multi-year allocations for flexibility, regulatory oversight to support irrigators' plans, and a strong scientific foundation for monitoring the agricultural-groundwater system. Furthermore, we identified key actors (government, scientific community, resource users) responsible for each tenet and emphasized interdisciplinary collaboration (hydrologic, economic, social) and data availability necessary for each tenet. The success of the SD-6 LEMA underscores the pivotal role played by collaborative institutional crafting and evidence-based decision-making in legitimizing groundwater governance rules, enhancing rule compliance, and promoting overall effectiveness.

Our presented tenets provide a framework for groundwater conservation efforts worldwide, addressing the global challenge of groundwater depletion while minimizing economic and social impacts. Addressing the scale mismatch between global drivers of depletion and local communities requires future studies and socio-hydrological modeling approaches. Our working group will utilize these approaches to bridge the gap, linking hydrological, agricultural, and socio-economic modeling tools into a comprehensive framework. By doing so, we aim to help achieve sustainable groundwater management, mitigating the global challenge of depletion while promoting economic and social resilience.

How to cite: Orduna Alegria, M. E., Zipper, S., Butler Jr, J. J., Golden, B., Wilson, B. B., Griggs, B. W., Lin, C.-Y., Yu, D. J., Whittemore, D. O., Bohling, G. C., Shin, H. C., Deines, J. M., Allen, J. J., Marston, L. T., Sanderson, M. R., Hendricks, N. P., Yu, Q., Lauer, S., and Smith, S. M.: From Local Success to Global Solutions: Tenets for Effective Groundwater Governance, EGU General Assembly 2024, Vienna, Austria, 14–19 Apr 2024, EGU24-13368, https://doi.org/10.5194/egusphere-egu24-13368, 2024.

EGU24-14824 | Posters on site | HS1.3.1 | Highlight

Setting up the new Scientific Decade of IAHS: Science for Solutions with HELPING 

Berit Arheimer, Christophe Cudennec, Salvatore Grimaldi, and Günter Blöschl

IAHS has proudly and successfully coordinated two subsequent Scientific Decades, which, amongst other things, set a research agenda worldwide through collaborative forces; and IAHS now set up the third one. The overall aim with a Scientific Decade is to accumulate knowledge and streamline the efforts so that coherent engagement, sharing and focus accelerate scientific methodologies and synthesise understanding of a specific hydrological problem or phenomenon. It stimulates vivid discussions between young and senior scientists globally.

The first IAHS Scientific Decade (2003–2012), entitled Prediction in Ungauged Basins (PUB), was implemented with the primary aim of reducing uncertainty in hydrological predictions.

The second IAHS Scientific Decade (2013–2022) of IAHS, entitled “Panta Rhei – Everything Flows”, was dedicated to research activities on change in hydrology and society, investigating their co-evolution.

The third IAHS Scientific Decade (2023-2032) is and will be dedicated to local solutions under the global water crisis. The short name is HELPING, which stands for Hydrology Engaging Local People IN one Global world. The vision is to solve fundamental water-related environmental and societal problems by engaging with other disciplines and local stakeholders. We envisage that this will contribute in realising the sustainable development goals of Agenda 2030 of the United Nations. Hence, HELPING has the ambition and great potential to become a vehicle for putting science in action, with strong co-creation and open science dimensions, in local contexts and through the epistemic added value of networking.

This presentation will describe the first year of the decade and the collaborative process in the IAHS community, which lead to the HELPING vision and set-up in 25 working groups under 3 Themes.

Read more and join the working groups:

https://iahs.info/Initiatives/Topic-for-the-Next-IAHS-decade/Forms-and-forums/ 

How to cite: Arheimer, B., Cudennec, C., Grimaldi, S., and Blöschl, G.: Setting up the new Scientific Decade of IAHS: Science for Solutions with HELPING, EGU General Assembly 2024, Vienna, Austria, 14–19 Apr 2024, EGU24-14824, https://doi.org/10.5194/egusphere-egu24-14824, 2024.

Currently, to explore spatial and temporal pattern of hydrological elements is not a difficult job as there are so many easy-use models and more and more open-source datasets ready to be downloaded. However, most research so far pays more attention to providing what it looks like. Less is for why. For those for why, there have been lots of attribution studies, but more mathematical results, few for guiding the practice. Deep explanation and evaluation for practices in hydrological Changes (DEEPHY) is yet the weak links in hydrological study. In the following decade, DEEPHY becomes one of the important foci of International Association of Hydrological Sciences (IAHS) with DEEPHY as the name of one of its HELPING decadal program’s working groups from 2023 to 2033, initiated at IUGG2023 in Berlin in July, 2023 (https://iahs.info/Initiatives/Topic-for-the-Next-IAHS-decade/helping-working-groups/). The main approaches of DEEPHY include working hard to monitor hydrological system long-termly, fully making use of large-sample data from multiple sources, careful designing the evaluation tools and focusing more on the practical applications. Short term result of DEPPHY will explain out more mechanisms and explore out deeper drivers behind the spatial and temporal pattern of hydrological elements. In the long-term, DEEPHY will acquire deeper understanding of hydrological changes evaluated based on the casual relationship with mechanisms and drivers being well explained. Ultimately, a better decision on how to administrate the hydrological change will be given to guide people to better adapt to the hydrological changes and be more resilient to the hydrological changes. This study will display how these possible approaches can help us to achieve the goal(s) of DEEPHY, and finally establish balances between science and practice and serve the people at different conditions worldwide to be collaborated better.


How to cite: Liu, S. and Mo, X.: Why we need DEEPHY (Deep Explanation & Evaluation for Practices in Hydrological Changes)  ?, EGU General Assembly 2024, Vienna, Austria, 14–19 Apr 2024, EGU24-14832, https://doi.org/10.5194/egusphere-egu24-14832, 2024.

EGU24-15283 | Posters on site | HS1.3.1

HydroSOS: Knitting local and global hydrological status and outlooks systems together for seamless water resources assessment  

Katie Facer-Childs, Lucy Barker, Harry Dixon, Alan Jenkins, Sulagna Mishra, Luis Roberto Silva Vara, Dominique Berod, Hwirin Kim, Jim Nelson, Riley Hales, Rachel Huber, and Angelica Gutierrez

Many hydroclimate services exist across the world at different scales. However, these services all use different categorisation schemes, different presentation styles, and are hosted across countless different websites. The Hydrological Status and Outlook System (HydroSOS) is a World Meteorological Organization initiative uniting, or “knitting”, hydrological status and sub-seasonal to seasonal outlooks products across scales in a consistent framework, weaving seamless services for water resources assessment.

HydroSOS extends beyond uniting existing services, also building capacity where services do not currently exist. It provides essential guidance and frameworks enabling the assessment of hydrological status for different variables. Additionally, HydroSOS is reviewing methods of producing useful hydrological forecasts in data sparse regions using statistical methods, or hydrological models, with and without real-time meteorological forecast inputs. Working in collaboration with the GEOGloWS initiative, global scale services are being improved with bias correction using machine learning and local scale data.

This fiber-art poster presents the HydroSOS initiative, its progress, and calls for ideas and collaborations on how we can knit hydroclimate services together to make the best fabric for water resources management.

How to cite: Facer-Childs, K., Barker, L., Dixon, H., Jenkins, A., Mishra, S., Silva Vara, L. R., Berod, D., Kim, H., Nelson, J., Hales, R., Huber, R., and Gutierrez, A.: HydroSOS: Knitting local and global hydrological status and outlooks systems together for seamless water resources assessment , EGU General Assembly 2024, Vienna, Austria, 14–19 Apr 2024, EGU24-15283, https://doi.org/10.5194/egusphere-egu24-15283, 2024.

The new scientific decade (2023-2032) of the International Association of Hydrological Sciences (IAHS) aims at searching for sustainable solutions to undesired water conditions - may it be too little, too much or too polluted. Theme 1 of the decade “Global and local interactions” is focused on the science to accelerate hydrological understanding of hydrological processes at local and global scales, how they interact, and how they and their interactions affect water resources in the local context. It recognizes the interconnectedness of processes across scales and the need to understand local variability in the context of large-scale processes and changes. This theme is being implemented via 14 Working Groups (WG) which span a range of topics including retrieving historical data, urban water issues, water quality under global change, soil moisture variability across scales, aquifer governance for agriculture, and drought in mountain regions. As such there are significant opportunities to make progress on a wide range of scientific questions over the next decade. This talk summarizes the overarching objectives of Theme 1, including the goals for advances in scientific understanding, the potential outcomes and products (e.g. datasets, methods, case studies) and goals for community activities (e.g. synthesis, collaboration, recognition of local context). We also highlight the opportunities for the Theme, including the potential to develop generalized frameworks and approaches for understanding cross-scale interactions and identifying emergent properties, as well as challenges in driving forward a diverse set of WG activities globally to provide more than the sum of the parts.

How to cite: Sheffield, J.: Global and local interactions of hydrological processes – challenges and opportunities for Theme 1 of the IAHS Science for Solutions scientific decade, EGU General Assembly 2024, Vienna, Austria, 14–19 Apr 2024, EGU24-18611, https://doi.org/10.5194/egusphere-egu24-18611, 2024.

The IAHS’ scientific decades are unique as international scientific initiatives in the hydrological community, linking researchers from around the globe, from different professional backgrounds, and at different career stages. The current HELPING - Science for Solutions decade in particular aims to address the current water crises by synthesising hydrological knowledge, establishing links between local and global processes, applying cross-cutting methods, and providing science-based decision support. This approach aims to involve not just hydrologists worldwide, but also practitioners, decision-makers, and a broader general public. Given these objectives, (science) communication is paramount. It is also the main focus of a dedicated HELPING Working Group. 

This study aims to analyse which internal and external communication approaches can be harnessed to support the success of an international scientific initiative like HELPING, both through streamlining internal workflows between participants, and through providing a coherent, easily digestible message to an external public. It strives to assess communication lessons learned from previous IAHS scientific decades - Predictions in Ungauged Basins (PUB) and Panta Rhei - while also taking into account the changes in communication technology since the launch of the first decade in 2003. Subsequently, it casts the net wider and analyses successful communication and diffusion approaches used by similar scientific initiatives launched recently at different scales. 

On a meta level, the different approaches needed for internal and external HELPING communication are assessed. What strategies can be leveraged to raise awareness for the scientific decade within the hydrological community, especially among researchers in locations and at career stages where they would typically not be highly involved? What tools can be harnessed to communicate the aims and achievements of HELPING to a wider public and to encourage interactions and participation? And, ultimately, what workflows are needed to assess the progress and impact of the HELPING decade itself, and to track all the initiatives and research by individual hydrologists carried out under its banner? 

Keywords: science communication, IAHS, scientific decades

How to cite: Payne, T. and Orieschnig, C.: (Science) Communication is Key - Analysing and Adapting Outreach Approaches and Internal Workflows to Support HELPING as a Major International Scientific Initiative., EGU General Assembly 2024, Vienna, Austria, 14–19 Apr 2024, EGU24-19045, https://doi.org/10.5194/egusphere-egu24-19045, 2024.

EGU24-20150 | Orals | HS1.3.1

Hydrologic Design: Solutions and Communication 

Elena Volpi, Svenja Fischer, Eleonora Dallan, Salvatore Grimaldi, Aldo Fiori, Krzysztof Kochanek, and Cristina Prieto

Hydrologic design is one of the key tasks of hydrologists and most important for the majority of stakeholders, authorities and practitioners. Generally, hydrologic design consists of the dimensioning of hydro-structures in order to fulfill a pre-specified purpose related to water, e.g. flood protection or water supply. Hydrologic design, therefore, is a key element also for engineering activities beyond the hydrological application, and therefore must be communicated to the interested parties in an appropriate and comprehensive way.

In this context, the “Hydrologic Design: Solutions and Communications” working group aims at:

1- development of novel, goal-oriented procedures for the design of hydrologic solutions for the societal problems (e.g. extremes like floods and droughts, water management, control of water contamination etc.), bringing the best of the available methods;

2- development of novel methods to improve the understanding, characterization, quantification and reduction of uncertainty in hydrology, which will be able to extrapolate the results to data-scarce regions, ungauged catchments or beyond the observation range. The usage of available information from local sources will be improved, by combining different sources of information;

3- advances towards more reliable predictions by innovating the combination of the knowledge from deterministic models, probabilistic models and artificial intelligence methods, as well as, analyzing the predicted problem from different angles.

We plan to involve the stakeholders into the whole process of acquisition, modeling and/or concluding. Altogether, this will result in a simplified communication of hydrological design and the corresponding uncertainty to stakeholders, local people and authorities and, hence, strengthen the connection between science and practice.

How to cite: Volpi, E., Fischer, S., Dallan, E., Grimaldi, S., Fiori, A., Kochanek, K., and Prieto, C.: Hydrologic Design: Solutions and Communication, EGU General Assembly 2024, Vienna, Austria, 14–19 Apr 2024, EGU24-20150, https://doi.org/10.5194/egusphere-egu24-20150, 2024.

EGU24-21088 | ECS | Orals | HS1.3.1 | Highlight

On promoting education and community adaptation in Global South’s studies populating the Digital Water Globe: the DREAMS project for the HELPING Science Decade 

Denise Taffarello, Danielle Bressiani, Adelaide Nardocci, Susana Dias, Dirce Maria Lobo Marchioni, Suzana Gico Montenegro, Marcos Roberto Benso, Gabriel Marinho e Silva, Veber Afonso Figueiredo Costa, Nilo Nascimento, Wilson dos Santos Fernandes, Jose Antonio Marengo, Jamil Anache, and Eduardo Mario Mendiondo

We present a contribution to promote education and community adaptation from a Global South’s case-study to populate the Digital Water Globe. From a NSFC-FAPESP project ‘Flash DRought Event evolution chAracteristics and the response Mechanism to climate change considering the Spatial correlations (DREAMS)', we discuss lessons for the IAHS HELPING Decade. DREAMS aims to respond to “science-for-policy" and “education-for-action” questions around Sustainable Development Goals of what adaptation pathways are feasible to cope with human-water impacts under change. DREAMS is organized into Research Methods of Drought resilience through Community-based Adaptation (CbA), Ecosystem-based Adaptation (EbA), Nature-based Solutions (NbS) and Participatory Action Research (PAR). DREAMS seeks for enhancing local case studies for the IAHS/Digital Water Globe with the multidimensional impacts of flash droughts addressed to SDGs nexuses of poverty, health, education, sanitation, economy and climate action. Here we discuss a DREAMS-CbA initiative in the headwaters of the Corumbataí river basin (PCJ River Basin Committee, MG-SP, Brazil) for building community knowledge of climate change and pro-environmental behaviours adapted into both new climate activism and teachers’ curriculum. In 2023, DREAMS started CbA strategies in different education levels for tradeoffs for drought’s duration, namely: in the primary schools, with teachers and pupils of local schools at the headwaters of selected river basins; in higher education, through the community-adapted curricula.  In primary schools, with a CbA strategy based on educational methods of Science, Technology, Society and Environment (“CTSA, Ciência, Tecnologia, Sociedade, Ambiente” , in Portuguese), the DREAMS’  researchers conducted the local project “Árvores da Amizade e Água: Preservar para não faltar!” (Friendship Trees and Water: Preservation and Conservation) with environmental education and climate-adaptation in the PCJ river basins’ headwaters with teachers, staff and pupils of the public school EMEF Profa Zezé Salles, Analândia-SP (Taffarello, 2023). DREAMS’ communication and open science literacy are expanded by:  a new UNESCO Chair; the USP Center for Education and Research on Disasters (http://www.ceped.eesc.usp.br/); the Braz. Water Resources Assoc. Technical Commission on Education, and three Braz. Inst. of Sci. & Tech., INCTs, of “Climate Change-Phase 2”(CEMADEN), “Food Insecurity (FSP/USP)” and “Nat. Observatory for Water Security & Adaptive Mgmt”, ONSEAdapta (UFPE, https://onseadapta.org). With Panta Rhei groups, and during the 100-year drought of Amazon river, DREAMS promotes archetypes of the Coevolution of the Amazon-Sanitation-Hygiene Paradox. DREAMS’ future work envisages more local examples for DWG, i.e. river basins of Yangtze (China), São Francisco (Brazil), Amazon and Parana (transboundary). References: Mendiondo, E M (2023) Flash DRought Event evolution chAracteristics and response Mechanism to climate change considering Spatial correlations, FAPESP 2022/08468-0, https://bv.fapesp.br/en/auxilios/111385/flash-drought-event-evolution-characteristics-and-the-response-mechanism-to-climate-change-consideri/; Taffarello, D (2023) “Árvores da amizade e Água: preservar para não faltar!”, CTSA Adaptation to Climate Change Impacts in Analândia-SP, EMEF Profa Zezé Salles, Environmental Education Project, Report.

How to cite: Taffarello, D., Bressiani, D., Nardocci, A., Dias, S., Marchioni, D. M. L., Montenegro, S. G., Benso, M. R., Marinho e Silva, G., Costa, V. A. F., Nascimento, N., dos Santos Fernandes, W., Marengo, J. A., Anache, J., and Mendiondo, E. M.: On promoting education and community adaptation in Global South’s studies populating the Digital Water Globe: the DREAMS project for the HELPING Science Decade, EGU General Assembly 2024, Vienna, Austria, 14–19 Apr 2024, EGU24-21088, https://doi.org/10.5194/egusphere-egu24-21088, 2024.

Water security is impacted by complex inter-related drivers from within and beyond the hydrological system. The demands to address challenges to energy security, food security, climate security, and biodiversity security through various just-transitions all have implications for water security but this dimension is rarely considered in the different solution spaces. Increasing water risks from many drivers including climate change are also challenging the possibilities of these transitions to deliver safe, sustainable and just solutions. 

There is thus a critical need for water research to support insight, innovations, and tradeoffs, that include variables and drivers beyond those of hydrological systems. To bring impact on the ground, researchers need to develop framings, methods, and models that work across traditional siloes to deliver evidence, technical innovations and policy solutions that deliver in the local environmental, social, economic, and political contexts. 

Following this framing, a case study from the Middle East North Africa will be given on joined up research across many disciplinary boundaries to deliver insight and solutions to manage drought risk in Morocco and Jordan. Global and local interactions playing out in these locations demand new water thinking and ideas are put forward on how to achieve this. The approaches used draw on a plethora of methods, data and approaches from development in agricultural water management, through seasonal precipitation forecasting, and policy and planning through to understand the drivers to internal displacement of people through the threat multiplier effects of droughts. 

How to cite: McDonnell, R.: Multiple competing securities and transitions impact future water resource solutions: the importance of integrated approaches to frame, investigate and build resilient water futures, EGU General Assembly 2024, Vienna, Austria, 14–19 Apr 2024, EGU24-21346, https://doi.org/10.5194/egusphere-egu24-21346, 2024.

EGU24-22254 | Orals | HS1.3.1

Overview of the Theme 2 of IAHS HELPING: Holistic Solutions for Water Security  

Ana Mijic, Claudia Teutschbein, David Finger, Junguo Liu, Kristian Foerster, Marthe Wens, Nejc Bezak, Santosh Palmate, Shiv Nishad, and Stefan Krause

The term "water security" denotes the sustainable availability and access to clean and safe water for diverse purposes, ensuring the well-being of individuals, communities, and ecosystems. Despite numerous proposed solutions from the scientific community to address water security challenges, a genuinely holistic, systems-level approach is still lacking. The research conducted under Theme 2 of the new IAHS HELPING decade is grounded in the premise that holistic solutions for water security necessitate an integrated approach. This involves understanding the potential and challenges associated with mitigation methods for floods, droughts, and water quality/pollution, as well as being aware of the sectorial nexus of problems and solutions. Nature-based solutions (NBS) are also considered for sustainable water management. The theme brings together seven working groups (WGs) focusing on methods and applications for characterising droughts in the Anthropocene, providing near-term water availability forecasts, and conducting water systems analysis using integrated tools and participatory engagement. Additionally, these WGs address interactions between water, energy, health, and ecological systems, with the aim of advancing ecological restoration and the implementation of NBS. This talk will present a high-level overview of the WGs, showcase preliminary findings, and discuss the potential for integrating insights and methods from multiple work streams into a comprehensive framework for water security solutions.

How to cite: Mijic, A., Teutschbein, C., Finger, D., Liu, J., Foerster, K., Wens, M., Bezak, N., Palmate, S., Nishad, S., and Krause, S.: Overview of the Theme 2 of IAHS HELPING: Holistic Solutions for Water Security , EGU General Assembly 2024, Vienna, Austria, 14–19 Apr 2024, EGU24-22254, https://doi.org/10.5194/egusphere-egu24-22254, 2024.

For hydrological modeling in snow-free catchments, precipitation (P) and potential evapotranspiration (Epot) are the two key input time series. There are different methods to observe, calculate and interpolate these time series. In the Australian large sample data set for hydrological modeling (CAMELS-AUS, Catchment Attributes and Meteorology for Large-sample Studies)  with data for 222 catchments, two different time series for P and seven different time series for Epot are provided. Here, we address the open question of which data should be used as input to an hydrological model.

Our basic assumption is that the most suitable combination of P and Epot is the one that results in the best model performances in terms of runoff simulations. For this we first tested the differences between the different input time series. Secondly, we conducted a thorough comparison of the 14 possible combinations of P and Epot time series. First analyses show that the differences between the two P time series are relatively minor, whereas the seven Epot time series differ more substantially from each other, especially in terms of seasonality and magnitude. Despite these differences, preliminary modeling results show that for the majority of the catchments there is no significant difference in model performance between the model calibrations carried out for each of the 14 different P/Epot combinations, suggesting that the model has a certain capability to compensate for differences in the input data by adapting its (soil) parameters. However, for some of the catchments there is a clear trend between the mean Epot and the corresponding model performance. Characterizing and further investigating these catchments can help to gain insight in the impact of different input data on the model performance, as well as to provide general recommendations that can help the user of a hydrological model to make an informed choice when it comes to the selection of the input data.

How to cite: Niu, J., Vis, M., and Seibert, J.: Evaluation of different precipitation and potential evapotranspiration time series for hydrological modeling in Australian catchments , EGU General Assembly 2024, Vienna, Austria, 14–19 Apr 2024, EGU24-1022, https://doi.org/10.5194/egusphere-egu24-1022, 2024.

EGU24-1038 | ECS | Orals | HS1.3.3

How to avoid unreliable formulas for time of concentration in ungauged basins 

Giulia Evangelista, Ross Woods, and Pierluigi Claps

Estimating design flood hydrographs in ungauged basins requires the determination of hydrological response parameters. These parameters are derived from relationships that often lack a solid foundation in the specific physical characteristics of the basin. Among the parameters subject to greater uncertainty, the characteristic time of the IUH function certainly stands out. Indirect methods for estimating this parameter involve the use of empirical or analytical formulas and, in the engineering practice, the use of one or more formulas is often justified on heuristic grounds, lacking solid scientific considerations to guide the choice towards the most appropriate formulation.

Here, we propose a methodological approach to provide support in choosing a robust formulation for estimating basin flood response time. We have selected 35 formulas from the literature, all containing parameters related to the basin's length and slope. After verifying the real meaning of the input parameters and units required by the formulations in the original articles where they were published, the structure of the formulas considered has been analyzed in dimensional terms, using a reasoning scheme consistent with the hydraulic relations of resistance formulas. In this way, 17 hydraulically consistent formulas have been identified.

At this stage, we point out the advantage of comparing the formulas in terms of equivalent average flow velocity rather than in terms of observed travel times. Starting from the celerities obtained as the ratio between the length of the basin's drainage path and the response times provided by each formula and using the morphology of the river network of 135 basins in northwestern Italy, we compared the variability of estimated mean travel velocities. In line with literature observations, which highlight a slight increase in mean velocities with basin size, some formulas are deemed physically inconsistent, while 5 of them were identified as hydraulically robust and consistent with empirical observations. These formulas are Chow (1962), NERC (1975), SCS (1954), McEnroe and Zhao (1999), and Watt and Chow (1985).

The results obtained analytically identify the relationships between the exponents of length and slope in each formula and those governing empirical relationships between lengths and slopes of main river reaches in the basins. These relationships allow us to identify the range of values for the exponents of length and slope in the formulas for the characteristic time for which velocity estimates increase with the basin area. Based on these relationships, it is also possible to provide a guideline for the calibration of new formulations.

How to cite: Evangelista, G., Woods, R., and Claps, P.: How to avoid unreliable formulas for time of concentration in ungauged basins, EGU General Assembly 2024, Vienna, Austria, 14–19 Apr 2024, EGU24-1038, https://doi.org/10.5194/egusphere-egu24-1038, 2024.

EGU24-3415 | ECS | Orals | HS1.3.3

Event-type-based Multi-dimensional Diagnostics of Process Limitations in Hydrological Models 

Zhenyu Wang, Larisa Tarasova, and Ralf Merz

Shifts in generation processes of streamflow events driven by advancing climate change are raising concerns about the adaptability of conceptual hydrological models to changing hydrological systems. Using 30-year streamflow data across 395 German catchments, we evaluate the performance of a conceptual rainfall-runoff model for three distinct streamflow event types: events associated with snow and icy conditions (Snow-or-Ice), rainfall on dry soils (Rain-on-Dry), or wet soils (Rain-on-Wet). We focus on a two-dimensional evaluation of the timing and magnitude of streamflow events using the Series-Distance approach (Seibert et al., 2016) while also diagnosing the impact of inherent process limitations on model performance using random forest. The results reveal that the modelled streamflow consistently exhibits time delays and underestimations of magnitude for all types of events. Specifically, the Rain-on-Dry are associated with the most considerable delays, while underestimation of streamflow is the largest for Snow-or-Ice events. Given the statistically significant increasing trends in the occurrence of Rain-on-Dry events across 78.8% of catchments (Mann-Kendall test, p < 0.05), it can be assumed that the timing errors might further deteriorate in the future, compromising the reliability of the model-based early-warning systems for future flood events. Additionally, the errors vary across different hydrograph components (rising limbs, peaks, and recessions) for each type of streamflow event. Peaks are the most underestimated component in all events. Further diagnostics of the links between errors and drivers identifies the pre-event errors are the most important factors of timing and magnitude errors during the events. The process limitation in the model (e.g., groundwater recharge and fast runoff process) and properties of the events themselves (e.g., duration and peak discharge of events) cause the error heterogeneity among the events and exacerbate the errors in peaks of the events. Therefore, our study highlights the critical need for further improvement of process representation in hydrological models and more accurate simulation of pre-event conditions in order to address emerging challenges posed by changing hydrological systems.

Seibert, S. P., Ehret, U., & Zehe, E. (2016). Disentangling timing and amplitude errors in streamflow simulations. Hydrology and Earth System Sciences, 20(9), 3745-3763.

How to cite: Wang, Z., Tarasova, L., and Merz, R.: Event-type-based Multi-dimensional Diagnostics of Process Limitations in Hydrological Models, EGU General Assembly 2024, Vienna, Austria, 14–19 Apr 2024, EGU24-3415, https://doi.org/10.5194/egusphere-egu24-3415, 2024.

EGU24-3454 | ECS | Posters on site | HS1.3.3

Benchmarking model performance in complex human-water systems. 

Saskia Salwey, Francesca Pianosi, Gemma Coxon, and Hannah Bloomfield

Human activities must now be considered as an integral part of the water cycle. Consequently, the integration of human-water interactions into hydrological modelling is essential for the large-scale simulation of flow. However, whilst the last decade has seen substantial advancements in the guidance available for modelers on how best to benchmark and evaluate flow simulations in natural catchments, there is little discussion surrounding how these practices may differ in more complex, human-impacted catchments.

Here we discuss some of the key issues in benchmarking model performance in human-impacted catchments and demonstrate these using a large-sample of reservoir-impacted catchments across Great Britain. We find that evaluation metrics designed for natural systems do not always translate to those impacted by human activity, where reservoir-impacted flow timeseries can have a substantially different distribution. In light of the new parameters and model assumptions associated with representing human activities within the natural water cycle, we suggest that the integration of uncertainty quantification and sensitivity analysis (UQ and SA) for robust model evaluation is particularly important. We discuss the need for clear accessible workflows for the application of UQ and SA in the evaluation of complex and large-scale water resource system modelling.

How to cite: Salwey, S., Pianosi, F., Coxon, G., and Bloomfield, H.: Benchmarking model performance in complex human-water systems., EGU General Assembly 2024, Vienna, Austria, 14–19 Apr 2024, EGU24-3454, https://doi.org/10.5194/egusphere-egu24-3454, 2024.

EGU24-3940 | ECS | Orals | HS1.3.3

Effects of Conceptual Model Structure Uncertainties on Actual Evapotranspiration Simulation 

Shuyue Wu, Yuting Yang, and Jianshi Zhao

Understanding the structural uncertainties within current conceptual hydrological models is crucial, as an appropriate model structure is essential for achieving accurate and reliable hydrological simulations. The development and evaluation of conceptual models have primarily focused on replicating streamflow dynamics, with less attention given to other important processes, such as the conversion from potential evapotranspiration (PET) to actual evapotranspiration (AET). This study assesses the performance of 33 existing conceptual model structures in simulating 8-day-scale AET across 671 catchments in the United States. These models are calibrated using both daily streamflow data and 8-day remote-sensing AET data. While most models demonstrate comparable performance in streamflow simulations, significant differences are observed in their performance in AET simulations. None of these models can consistently performs well in AET simulations across all 671 catchments, indicating that the “one-model-fits-all” assumption is not applicable. The performance of most models is found to be related to one or more catchment attributes. The most relevant catchment features are climatic, vegetation and topographical characteristics, including climatic aridity, precipitation seasonality, fraction of precipitation falling as snow, green vegetation fraction and catchment mean slope. In contrast to the “one-model-fits-all” assumption, catchments with distinct climatic, vegetation and/or topographical conditions require different ways to represent the AET process. Specifically, most models tend to underestimate AET in humid catchments where the majority of rainfall occurs in winter, except those account for interception evaporation. Additionally, models that explicitly include a vegetation transpiration component tend to perform better in catchments with denser vegetation cover. This work highlights the structure uncertainties related to AET simulations and may help model structure selections in a way to reasonably represent AET process.

How to cite: Wu, S., Yang, Y., and Zhao, J.: Effects of Conceptual Model Structure Uncertainties on Actual Evapotranspiration Simulation, EGU General Assembly 2024, Vienna, Austria, 14–19 Apr 2024, EGU24-3940, https://doi.org/10.5194/egusphere-egu24-3940, 2024.

EGU24-7238 | Orals | HS1.3.3

Neglecting hydrological errors can severely impact predictions of water resource system performance  

Mark Thyer, David McInerney, Dmitri Kavetski, Seth Westra, Holger Maier, Margaret Shanafield, Barry Croke, Hoshin Gupta, Bree Bennett, and Michael Leonard

Risk-based decision making for water resource systems often relies on streamflow predictions from hydrological models. These predictions are integral for estimating the frequency of high consequence extreme events, such as floods and droughts. However, streamflow predictions are known to have errors due to various factors such as incomplete hydrological understanding, parameter misspecification, and uncertain data. Despite these errors being well known, they are frequently neglected when undertaking risk-based decision-making. This paper demonstrates that neglecting hydrological errors can impact on drought risk estimation for high stakes decisions with potentially severe consequences for water resource system performance. A generic framework is introduced to evaluate the impact of hydrological errors for a wide range of water resource system properties. This framework is applied in two Australian case study catchments, where we use a stochastic rainfall model, the GR4J hydrological model, a residual error model, and a simplified reservoir storage model to estimate water resource performance metrics (risk and yield). The results underscore the impact of neglecting hydrological errors on decision-making. In one case study catchment, the yield was over-estimated by ~15%-55%, resulting in the (actual) risk of running out of water being ~2-30 times larger than reservoir design. The magnitude of these errors in water resource performance metrics is striking, especially considering that the streamflow predictions appear reasonable based on typical performance metrics (e.g., NSE of ~0.7). The errors in performance metrics stem from the complex propagation of hydrological errors through the water resource system modelling chain. By accounting for critically important hydrological errors we can mitigate highly erroneous risk estimates and improve decision-making related to water resource management

How to cite: Thyer, M., McInerney, D., Kavetski, D., Westra, S., Maier, H., Shanafield, M., Croke, B., Gupta, H., Bennett, B., and Leonard, M.: Neglecting hydrological errors can severely impact predictions of water resource system performance , EGU General Assembly 2024, Vienna, Austria, 14–19 Apr 2024, EGU24-7238, https://doi.org/10.5194/egusphere-egu24-7238, 2024.

EGU24-10546 | ECS | Orals | HS1.3.3

Towards a better understanding of the hybrid modelling methodology for streamflow prediction 

Antoine Degenne, François Bourgin, Charles Perrin, and Vazken Andréassian

The use of machine learning (ML) methods in rainfall-runoff modelling has apparently led to better prediction, but there are some concerns about the interpretability of these models. The emergence of hybrid modelling, which couples the data driven approach with the classical physics-based conceptual approach, has shown promise in enhancing both interpretability and accuracy. ML models and conceptual models each come with their own modelling practices and habits. To develop a hybrid approach, it is necessary to consider them.

While some of the steps in these modelling chains are similar (for instance the selection of the right metric during the calibration or learning step), others are more specifics, such as the optimization of the hyper-parameters of ML models. Furthermore, the hybrid approach comes with specific methodological challenges that emerge when coupling the two different types of models. For instance, depending on the choice made by the modeller, the parameters of the conceptual model are either trained with the ML model parameters or calibrated separately by a non-ML method.

There is a need to better understand the variety of hybrid approaches and to estimate the impact of their methodological choices. This work is based on a literature review and on large-sample modelling experiments with hybridizations of two classical models running at different time steps: the monthly GR2M model and the daily GR4J model. 

How to cite: Degenne, A., Bourgin, F., Perrin, C., and Andréassian, V.: Towards a better understanding of the hybrid modelling methodology for streamflow prediction, EGU General Assembly 2024, Vienna, Austria, 14–19 Apr 2024, EGU24-10546, https://doi.org/10.5194/egusphere-egu24-10546, 2024.

EGU24-10629 | ECS | Posters on site | HS1.3.3

Quality Assurance in Conceptual Hydrologic Models: Developing functional validation tests for ensuring model quality and robustness 

Florian Bucher, Corina Hauffe, Diana Spieler, and Niels Schuetze

Currently, the quality assurance of conceptual hydrological models is primarily based on calibration and validation procedures, such as the validation tests proposed by Klemeš [1986]. These procedures provide insufficient testing of the underlying assumptions of a model structure and their correctness and credibility for specific purposes. While we assume the models we use are implemented physically correct, actual “crash tests” (Andréassian et al. [2009]) or quality assurance procedures do not exist.

This study therefore focuses on the development of a standardized quality assurance procedure for conceptual hydrologic models. A so called functional test scheme is proposed that complements existing calibration and validation procedures. Hereby, expected and unexpected model setups and parameterizations are tested and the model response is evaluated. The applied functional approach involves self-generated time series with synthetic climate data and a synthetic catchment to systematically test individual processes and procedures. We developed a line of test series for the modular modelling framework RAVEN, where several iterative test runs with changing model setups and parameterizations have been conducted in order to gain further insights into the correctness and plausibility of the implemented approaches and equations. We developed an R package that enables the almost automated execution of the repetitive processes in the test application for the RAVEN-based models.

Preliminary results revealed some minor and major problems of model functioning, sometimes related to simple reasons like unclear information in the model documentation. For example, showed the testing that the slope correction for different slope angles is not applied on manually entered PET data, while the documentation does not explicitly mention that slope angles are only affecting internally generated PET data. The conducted experiments prove the potential of readily developed functional tests and provide a basis for further developments in this regard.

How to cite: Bucher, F., Hauffe, C., Spieler, D., and Schuetze, N.: Quality Assurance in Conceptual Hydrologic Models: Developing functional validation tests for ensuring model quality and robustness, EGU General Assembly 2024, Vienna, Austria, 14–19 Apr 2024, EGU24-10629, https://doi.org/10.5194/egusphere-egu24-10629, 2024.

EGU24-13157 | Orals | HS1.3.3

10 years of eWaterCycle: from prototype-forecast to platform for Open and FAIR hydrology 

Rolf Hut, Niels Drost, Nick van de Giesen, Peter Kalverla, Stefan Verhoeven, Bart Schilperoort, and Jerom Aerts

Over the last decade our answer to the question: “but what is eWaterCycle?” has changed considerably. In 2014 we presented the first iteration of eWaterCycle: we showed that it was feasible to build a real time hydrological forecasting system that ran an ensemble of global models, forced with weather forecasts, assimilating satellite observations at every timestep, all from pre-existing openly available components.

In the light of the discussion in the hydrological community on reproducible science [Hutton, 2016] we build the next iteration of eWaterCycle: a platform that allows everyone to use commonly available hydrological models. Years (and a pandemic) later this platform is now openly available [Hut, 2022]. The vision behind the platform is to take as much as possible the computer-related headaches of running other people’s models away to let hydrologists focus on the hydrology. Furthermore, eWaterCycle is ‘FAIR by Design’: it should be easy to make any analysis done by eWaterCycle adhere to the FAIR principals. Using eWaterCycle MSc students have been able to do the type of research that previously was done by a PhD and PhDs have done the type of research that previously would require a whole team of people. Large Sample hydrology studies, Model coupling and climate change impact studies have all been done using eWaterCycle.

Adding one’s own model to the platform, however, still required considerable effort which limited the uptake by the broader hydrological community. That’s why recently we released v2.0 of eWaterCycle which fixes this: it is now significantly easier to add models to eWaterCycle!

Looking forward, among other things we will be:

  • Making teaching material on hydrological modelling available as Open Educational Resources through eWaterCycle [funded project]
  • Adding data assimilation as a module to eWaterCycle [funded project]
  • Add easy access to Large Sample Hydrology datasets (camels / caravan) [looking for students]
  • Study the impact of climate change on all catchments of the world, using many different hydrological models [looking for students]
  • Connect or host eWaterCycle on the infrastructure currently being developed for Destination Earth (DestinE) [looking for funds and collaborations]

In this presentation I will reflect on the achievements of the last decade, highlight the scientific results generated with eWaterCycle and look forward to the next decade.


Hutton, C., T. Wagener, J. Freer, D. Han, C. Duffy, and B. Arheimer (2016), Most computational hydrology is not reproducible, so is it really science?, Water Resour. Res., 52, 7548–7555, doi:10.1002/2016WR019285.

Hut, R., Drost, N., van de Giesen, N., van Werkhoven, B., Abdollahi, B., Aerts, J., Albers, T., Alidoost, F., Andela, B., Camphuijsen, J., Dzigan, Y., van Haren, R., Hutton, E., Kalverla, P., van Meersbergen, M., van den Oord, G., Pelupessy, I., Smeets, S., Verhoeven, S., de Vos, M., and Weel, B.: The eWaterCycle platform for open and FAIR hydrological collaboration, Geosci. Model Dev., 15, 5371–5390, https://doi.org/10.5194/gmd-15-5371-2022, 2022.

How to cite: Hut, R., Drost, N., van de Giesen, N., Kalverla, P., Verhoeven, S., Schilperoort, B., and Aerts, J.: 10 years of eWaterCycle: from prototype-forecast to platform for Open and FAIR hydrology, EGU General Assembly 2024, Vienna, Austria, 14–19 Apr 2024, EGU24-13157, https://doi.org/10.5194/egusphere-egu24-13157, 2024.

EGU24-14444 | Orals | HS1.3.3

Land surface hydrological modeling: do we really need complex model formulations? 

Philippe Ackerer, David Luttenauer, Aronne Dell'Oca, Alberto Guadagnini, and Sylvain Weill

Land Surface Models (LSM) grounded on physically-based mathematical models for energy and water balance can be characterized by various levels of complexity, especially when they integrate numerous processes. Diverse mathematical models (i.e., sub-models) can sometimes be formulated for some processes, due to different assumptions made during the system conceptualization stage. Therefore, running LSMs require (i) selection of a set of processes and related mathematical formulations that will be used and (ii) estimation of the corresponding parameters. A convenient way to guide model (and parameter) choice is to rely on global sensitivity analysis. In this work, we analyze sensitivity of 3 common hydrological outputs (evaporation, transpiration, and groundwater recharge fluxes) to models and parameters involved in typical LSMs. The global sensitivity analysis relies on random (Monte Carlo) sampling of values of parameters associated with each of the different formulations considered for the sub-models embedded in the LSM. This enables us to quantify the relative importance of process formulation and ensuing parameters. Three diverse indices based on (i) the whole (sample) probability density function (pdf) of the model output (Borgonovo et al., 2011) and (ii) the first and second moment of the pdf (corresponding to the moment-based sensitivity indices introduced by Dell’Oca et al. (2017)) are used. The joint use of these metrics is exemplified upon relying on realistic field conditions (in terms of, e.g., climate, vegetation, and soil type) associated with two watersheds in the Vosges region (France). Results show that sensitivity analysis plays a crucial role in identifying sub-models and parameters that contribute significantly to the uncertainty of model outputs. It is found that the main characteristics of the soil comprising the litter layer and root zone play an important role in the evaluation of the evaporation and groundwater recharge fluxes. As such, our results strengthen the need for targeted studies on the characterization of flow in these layers.


Borgonovo et al., https://doi.org/10.1111/j.1539-6924.2010.01519.x, 2011.

Dell’Oca et al., https://doi.org/10.5194/hess-21-6219-2017.


How to cite: Ackerer, P., Luttenauer, D., Dell'Oca, A., Guadagnini, A., and Weill, S.: Land surface hydrological modeling: do we really need complex model formulations?, EGU General Assembly 2024, Vienna, Austria, 14–19 Apr 2024, EGU24-14444, https://doi.org/10.5194/egusphere-egu24-14444, 2024.

EGU24-14555 | Orals | HS1.3.3

Innovating the calibration of a national-scale integrated hydrological model 

Raphael Schneider, Lars Troldborg, Anker Lajer Højberg, Maria Ondracek, David Terpager Christiansen, and Simon Stisen

The National Hydrological Model for Denmark (DK-model) is a distributed, integrated hydrological model coupling 3D groundwater flow to descriptions of root zone processes, overland flow and river routing, including anthropogenic interference with the hydrological cycle. It covers all of Denmark (~43,000km2) at 500m and 100m grid scale. Its constant development over the last three decades has both been driven by research projects and projects for public authorities. It is being used for various tasks such as water resource assessments, climate change impact assessments, hydrological real-time monitoring and nutrient transport studies.

Recently, we endeavored novel ways to calibrate and parameterize the DK-model. The model is placed on the edge between research interest and practical applications, with a demand for adequately representing various aspects of the hydrological cycle across the entirety of the model domain. In combination with its large-scale distributed nature and high computational demand, conventional (groundwater) model optimization techniques are challenged: The complex nature and versatile applications of the DK-model require suitable parametrization schemes and inclusion of diverse calibration and evaluation data, beyond conventional groundwater head observations and streamflow. This also leads to trade-offs between the multiple objective functions. Hence, we moved beyond previously used single solution, gradient-based optimization algorithms.

The Pareto Archived Dynamically Dimensioned Search (PADDS) algorithm allows us to use a global parameter optimization, effective even at a few hundred model runs. Another major advantage of PADDS is that it does not require the a-priori weighting of objective function groups – instead, it explores the tradeoffs (pareto front) between the different objective function groups, allowing weighting after gaining knowledge about tradeoffs during the optimization process. Also, all solutions explored during the optimization are stored and remain open to analysis after finished optimization. This not only sheds light on tradeoffs between different objective functions in a unique manner, but also supports understanding of parameter sensitivity and uncertainty in a manner which otherwise is hard to achieve due to computational constraints.

Moreover, we included evapotranspiration patterns from satellite products as well as a machine learning based estimate of artificial drain flow as novel spatial data in the model evaluation. This helps us constraining some of the model processes crucial for e.g. nutrient transport, but otherwise poorly constrained by conventional data such as streamflow (305 stations) and groundwater heads (24,000 wells) covering practically the entire model domain.

We explored the benefits of this optimization setup applied to the DK-model, advancing not only the calibration process itself, but also our understanding of model process representation and performance.

How to cite: Schneider, R., Troldborg, L., Højberg, A. L., Ondracek, M., Christiansen, D. T., and Stisen, S.: Innovating the calibration of a national-scale integrated hydrological model, EGU General Assembly 2024, Vienna, Austria, 14–19 Apr 2024, EGU24-14555, https://doi.org/10.5194/egusphere-egu24-14555, 2024.

EGU24-15352 | ECS | Posters on site | HS1.3.3

eWaterCycle V2: enabling Hydrology as a Service (HaaS)  

Peter Kalverla, Bart Schilperoort, Stefan Verhoeven, Niels Drost, and Rolf Hut

2024 marks the 10th anniversary of presenting eWaterCycle at EGU [i]. Over the past decade, we've been building a platform capable of running global hydrological simulations, that democratizes research, and fosters reproducibility [ii]. We've built various libraries, added models, and glued them together. Our efforts culminated in the release of eWaterCycle V1 in 2021[iii].  

For eWaterCycle V1 we initially targeted users of hydrological models, enabling researchers and students to do experiments that they would not have been able to do before. While this narrow focus was great for designing the core functionality of the platform, the process for adding or upgrading supported models was still tedious. Model developers had to make changes to the core of eWaterCycle whenever they updated their model.  

To address this, we have recently released a new version of the eWaterCycle Python package that connects all components of the platform. In V2, compatibility with existing models is facilitated through a plugin structure. In contrast to eWaterCycle V1, plugins are small, simple, and self-contained, and can easily be maintained by the model owners. This structure also facilitates gradual adoption of standards until the compatibility layer becomes obsolete.

Another improvement in eWaterCycle V2 is that it is now possible to run certain BMI models without containers. The use without containers, on the other hand, enables new use cases for purposes like education. While we recognize that this facilitates the development process, we still emphasize the use of containers for sharing and reproducibility.

The changes in V2 make eWaterCycle simpler and more robust and facilitate a better governance structure for developing and maintaining the platform and contributed models, enabling what we envision for “Hydrology as a Service”: infrastructure providers host instances of the eWaterCycle platform, model developers can register their model to make it available on these platforms, and researchers can access and use them. 

[i] https://ui.adsabs.harvard.edu/abs/2014EGUGA..16.6291V
[ii] https://doi.org/10.1002/2017WR020665

[iii] https://doi.org/10.5194/gmd-15-5371-2022
 

How to cite: Kalverla, P., Schilperoort, B., Verhoeven, S., Drost, N., and Hut, R.: eWaterCycle V2: enabling Hydrology as a Service (HaaS) , EGU General Assembly 2024, Vienna, Austria, 14–19 Apr 2024, EGU24-15352, https://doi.org/10.5194/egusphere-egu24-15352, 2024.

EGU24-15853 | ECS | Posters on site | HS1.3.3

Can we quantify the impact of the modeler on the model? 

Leon Frederik De Vos, Karan Mahajan, and Nils Rüther

Hydrological and hydraulic models are historically different disciplines and work on different scales.   The recent increase in computational resources allows for the two models to be combined into one model having one holistic approach. This removes the bottleneck of the data linkage between the two disciplines.

In this study, we apply the two-dimensional module of the open-source software openTELEMAC-MASCARET with the included SCS-CN method on an ungauged catchment in central Germany with an area of around 58 km². The catchment is part of the Main River tributary. We describe the excessive data preprocessing of the building and land use data, and the topography to sufficiently represent the small-scale stream geometry. This preprocessing is subjective in selecting different thresholds, such as the degree of mesh refinement in the streams and the foreland, or a minimum size for buildings to be represented in the model. Additionally, the SCS-CN method is highly sensitive to the model results, as small changes in the CN-values already significantly alter the total volume of water in the model. We collect the different sources of subjectivity and uncertainty and rank them based on the impact on the model results. The results will lead to a better view of the potential of combined hydrological-hydraulic models.

How to cite: De Vos, L. F., Mahajan, K., and Rüther, N.: Can we quantify the impact of the modeler on the model?, EGU General Assembly 2024, Vienna, Austria, 14–19 Apr 2024, EGU24-15853, https://doi.org/10.5194/egusphere-egu24-15853, 2024.

EGU24-16172 | Orals | HS1.3.3

What are the best strategies for managing a single extreme flood event in hydrological model evaluation? – Insights from the extreme flood 2021 in Western Germany 

Li Han, Björn Guse, Viet Dung Nguyen, Oldrich Rakovec, Husain Najafi, Xiaoxiang Guan, Sergiy Vorogushyn, Luis Samaniego, and Bruno Merz

Extraordinary floods like the one in July 2021 have induced catastrophic consequences on both societal and economic domains. Robust model simulations are crucial for mitigating the adverse effects of such extreme events on human life. However, accurately reproducing and predicting exceptional floods remain a challenge in particular when only one such flood extreme is available in the reference record period. This single flood could be included either in calibration and evaluation period. In both cases, extreme events are missing in the other period. To analyze how to best handle a single extreme flood, we present a framework for calibrating and evaluating the mesoscale Hydrologic Model (mHM) using the July 2021 flood in western Germany as a case study. Hereby, we tested the effect of including the extreme 2021 flood in calibration or evaluation periods.

Our study shows that including the exceptional 2021 flood event in model calibration proves crucial for accurately reproducing high streamflow. Without including the 2021 flood in the calibration period, the model cannot learn how to reproduce extreme floods. Our findings reveal that employing the modified weighted Nash-Sutcliffe Efficiency (wNSE) as the objective function significantly improves mHM's performance in capturing flood peaks. This leads to a notable reduction from -35% to -7.8% in the difference between the simulated and observed/reconstructed peaks as demonstrated for the catchment outlet. The hydrological model performance was validated spatially for an independent set of gauges. Spatial validation is necessary for assessing model performance when only one exceptional historical event is available. In conclusion, our framework provides valuable insights into improving hydrologic modeling accuracy, emphasizing the importance of specific calibration strategies and spatial validation in capturing exceptional flood events.

How to cite: Han, L., Guse, B., Nguyen, V. D., Rakovec, O., Najafi, H., Guan, X., Vorogushyn, S., Samaniego, L., and Merz, B.: What are the best strategies for managing a single extreme flood event in hydrological model evaluation? – Insights from the extreme flood 2021 in Western Germany, EGU General Assembly 2024, Vienna, Austria, 14–19 Apr 2024, EGU24-16172, https://doi.org/10.5194/egusphere-egu24-16172, 2024.

EGU24-16542 | Posters on site | HS1.3.3

Promoting Open and Transparent Hydrologic Modeling: Workflows, Tools and Self-Contained Modules 

Wouter Knoben, Martyn Clark, Louise Arnal, Shervan Gharari, Kasra Keshavarz, Hongli Liu, Alain Pietroniro, Kevin Shook, Ray Spiteri, Tricia Stadnyk, and Andy Wood

Configuring process-based hydrologic models can be a cumbersome task, especially for larger domains. In the past model inputs (data), configuration and analysis code, as well as the source code of the models themselves were only rarely openly available. More recently, the hydrology community is moving toward a more open culture, focused on shareable data, tools and code. Here we present various recent open-source advances along the entire modeling chain. These include:

  • Workflows for model configuration of large-domain hydrologic models, data-driven seasonal streamflow forecasting and forcing data processing;
  • Tools for the remapping of forcing variables from one set of spatial elements to another;
  • Tools for adjusting and correcting baseline geofabrics for internal consistency and efficient routing;
  • Computationally frugal sensitivity analysis methods;
  • Independent hydrologic process modules for specific geographic landscape features and routing through reservoirs;
  • Improved numerical methods for model solving and parallelization.

These tools are publicly available with the specific aim to make them useful to others. During this PICO, we welcome discussion about the tools, as well as general discussion about the opportunities and pitfalls surrounding open-source science.

How to cite: Knoben, W., Clark, M., Arnal, L., Gharari, S., Keshavarz, K., Liu, H., Pietroniro, A., Shook, K., Spiteri, R., Stadnyk, T., and Wood, A.: Promoting Open and Transparent Hydrologic Modeling: Workflows, Tools and Self-Contained Modules, EGU General Assembly 2024, Vienna, Austria, 14–19 Apr 2024, EGU24-16542, https://doi.org/10.5194/egusphere-egu24-16542, 2024.

EGU24-16855 | Posters on site | HS1.3.3

Improving process understanding using multi-criteria model comparison for different catchments 

Björn Guse, Anna Herzog, Tobias Houska, Diana Spieler, Stephan Thober, Maria Staudinger, Paul Wagner, Doris Düthmann, Ralf Loritz, Uwe Ehret, Jens Kiesel, Sebastian Müller, Lieke Melsen, Sandra Pool, Larisa Tarasova, Juliane Mai, Thorsten Wagener, Doerthe Tetzlaff, and Nicola Fohrer and the other members of the DFG scientific network IMPRO

Hydrological models differ in the way how hydrological processes are implemented. A rigorous comparison of different hydrological model structures is needed to disentangle the link between similarities and differences in process representations and simulated hydrological processes, states and fluxes. A major challenge in model comparison is to identify effects of individual processes. To move a step in this direction, we developed controlled experiments and compared three hydrological models (HBV, mHM, SWAT+) in nine German catchments (400-3000 km²) along an elevation gradient. We aim at presenting a framework for a consistent comparison of process representations in model structures consisting of three steps:

(1) A model comparison protocol was developed for a detailed comparison of process representations in model structures. Consistency was achieved by using the same input data for all models. By grouping the processes in a standardized way, differences and similarities between the models were identified.

(2) To investigate the dominant model components, a daily parameter sensitivity analysis was carried out for the three models with different hydrological variables as target variables (e.g. actual evapotranspiration, soil moisture, snow and discharge). The dominant model parameters and associated processes vary more between the models than between the catchments. This also applies to the temporal variability of the parameter sensitivity.

(3) The model performance was analysed for a set of different performance criteria. The optimal parameter values differ greatly depending on which performance criteria were selected. This is in particular true for soil and evapotranspiration parameters. Typical patterns can be derived between catchments of different landscapes.

The joint analysis of these three methodological steps demonstrates the benefit of a detailed process analysis in model structures for a better understanding of suitable process representations. Therefore, it shows the potentials for improving model structures.

How to cite: Guse, B., Herzog, A., Houska, T., Spieler, D., Thober, S., Staudinger, M., Wagner, P., Düthmann, D., Loritz, R., Ehret, U., Kiesel, J., Müller, S., Melsen, L., Pool, S., Tarasova, L., Mai, J., Wagener, T., Tetzlaff, D., and Fohrer, N. and the other members of the DFG scientific network IMPRO: Improving process understanding using multi-criteria model comparison for different catchments, EGU General Assembly 2024, Vienna, Austria, 14–19 Apr 2024, EGU24-16855, https://doi.org/10.5194/egusphere-egu24-16855, 2024.

EGU24-17094 | ECS | Posters on site | HS1.3.3

How can we improve the correctness and plausibility of our hydrological models? 

Corina Hauffe, Diana Spieler, Clara Brandes, Sofie Pahner, and Niels Schütze

Using hydrological models is a common task for almost all hydrologists. Sometimes there is enough time to conduct a comparison study before selecting a model or we use the model we already know. But do we really know “our” model? Do we test all processes and approaches implemented prior to the model application? Usually we assume that the models are working correctly and by doing so we strongly rely on the developers willingness and capability to provide a mathematically and physically well tested hydrological model.

We believe that more effort is needed to ensure the quality assurance of models. This topic is yet underdeveloped in hydrology. We argue that our models should pass a standardized quality test in which they proof physical robustness and hydrologic plausibility. The commonly used split-sample test (Klemes, 1986) for an area of interest during the model validation may not be the best option to test for model quality. Attempts to increase standardization, transparency, and model quality have already been made e.g. by introducing the good modelling practice (van Waveren et al., 1999) and the FAIR principles (Wilkinson et al., 2016).

Nevertheless, there is still much potential to improve the quality assurance of models. We suggest a framework consisting of (1) the usage of synthetic input data and catchment properties, (2) a standardized test scheme, and (3) a set of diagnostics to evaluate the model results. The current study focuses on the development of the test scheme, which includes global behaviour tests, robustness tests, and additional tests.

Applying these tests serves different purposes: (1) detecting model limitations, (2) finding unintended feedback processes, (3) wrong or hydrological implausible responses, and (4) hidden or fixed parameters of a model. This kind of functional validation already proofed to be useful. A case study for the model ArcEGMO revealed several findings, e.g. fixed parameters, undocumented process implementations for lake evaporation and an unintended model response in the calculation of the groundwater recharge. Therefore, we believe that standardized tests would improve our model understanding, model usage and the trust in the model results.


Klemeš: Operational testing of hydrological simulation models, Hydrological Sciences Journal, 31, 13–24, https://doi.org/10.1080/02626668609491024, 1986.

van Waveren et al.: Good Modelling Practice Handbook, Tech. report, Dutch Dept. of Public Works, Institute for Inland Water Management and Waste Water Treatment, https://www.researchgate.net/publication/233864541_Good_Modelling_Practice_Handbook, 1999.

Wilkinson et al.: The FAIR Guiding Principles for scientific data management and stewardship, Scientific Data, https://doi.org/10.1038/sdata.2016.18, 2016.

How to cite: Hauffe, C., Spieler, D., Brandes, C., Pahner, S., and Schütze, N.: How can we improve the correctness and plausibility of our hydrological models?, EGU General Assembly 2024, Vienna, Austria, 14–19 Apr 2024, EGU24-17094, https://doi.org/10.5194/egusphere-egu24-17094, 2024.

EGU24-18765 | ECS | Posters on site | HS1.3.3

A questionnaire-based review on the role of hydrological models in operational drought management: Insights from the Netherlands 

Marleen Lam, Liduin Bos-Burgering, Lieke Melsen, Pieter van Oel, Miriam Coenders, Ruud Bartholomeus, Petra Hellegers, and Ryan Teuling

The recent report from the Joint Research Centre (JRC) of the European Commission emphasizes a growing impact of drought on the whole of Europe, worsened by climate change. Even in temperate climates such as the Netherlands, the impact of droughts is on the rise. Drought can be divided into three stages: meteorological drought, soil moisture drought, and hydrological drought. These stages often coincide with specific policy phases that require different approaches. In the Netherlands, these policy phases are Phase 0 (focused on drought adaptation), Phase 1 (addressing impending water scarcity), Phase 2 (managing actual water shortages), and Phase 3 (dealing with an area-wide crisis). Each phase involves a shift in organizational management. Phase 0 and, to some extent, Phase 1 focus on strategic development for drought, while operational management is important from Phase 1 through Phase 3 as the drought progresses. Decision-making in these phases is often supported by specialized tools, with hydrological numerical models often playing a key role, either embedded in monitoring dashboards or directly used by water managers. This research aims to uncover the role of hydrological models as decision-support tools across different drought phases. In this way, this study wants to contribute to the development of effective decision-support tools for drought management as drought is expected to increase in frequency and intensity. The Netherlands is chosen as a case study because of the novelty of drought events, the prevalence of model-based water management systems, and regional variations in water management practices. The primary research methods include a survey and interviews. 

How to cite: Lam, M., Bos-Burgering, L., Melsen, L., van Oel, P., Coenders, M., Bartholomeus, R., Hellegers, P., and Teuling, R.: A questionnaire-based review on the role of hydrological models in operational drought management: Insights from the Netherlands, EGU General Assembly 2024, Vienna, Austria, 14–19 Apr 2024, EGU24-18765, https://doi.org/10.5194/egusphere-egu24-18765, 2024.

EGU24-19142 | ECS | Posters on site | HS1.3.3

A flexible modelling framework for model creation based on perceptual understanding in integrated human-water systems 

Robin Maes-Prior, Barnaby Dobson, and Ana Mijic

Perceptual and conceptual modelling has been used historically by hydrologists to develop models rooted in a physical reality. As human activity increases and intertwines with the natural world, hydrological systems cannot be treated in isolation, particularly in urbanised areas. We argue that expanding our models and modelling approaches to consider interactions with water infrastructure can help us to identify the dominant processes and interactions within coupled human-water systems (CHWS) and guide our modelling processes towards models that produce results for the right reasons. We develop a three-level perceptual modelling approach that maps CHWS complexity in a systemic way. Perceptual models are representations of a system of interest based on stakeholder’s understandings and rooted in reality (e.g. visualised as a cross-section of the system with processes mapped on). Conceptual models are representations that break down the perceptual model to a component and state level (e.g. visualised as buckets and flows). From these definitions the framework was created to construct a computational model from an initial understanding of the region of interest. This framework prioritises engagement of different stakeholders at key junctions in the model making process, as well as providing a clear roadmap of modelling decisions. We applied this modelling approach for the Mogden Wastewater Catchment in North West London. The Mogden case study captures the interaction between surface water, groundwater and the sewer network, giving insight into the understudied field of sewer infiltration/exfiltration, highlighting the framework’s ability to better understand impact and behaviour of complicated flow paths. The case study highlights how this framework allows for the identification of interactions between human activity and the urban water system, producing models which are rooted in reality. The case study further revealed the benefit of flexible models, such as the implemented WSIMOD, for this framework, capturing diverse system perceptions and adaptability to include dominant processes.

How to cite: Maes-Prior, R., Dobson, B., and Mijic, A.: A flexible modelling framework for model creation based on perceptual understanding in integrated human-water systems, EGU General Assembly 2024, Vienna, Austria, 14–19 Apr 2024, EGU24-19142, https://doi.org/10.5194/egusphere-egu24-19142, 2024.

EGU24-131 | ECS | Orals | HS1.3.5

A plastic tipping point: The influence of biofouling on the settling orientation of plastics. 

James Lofty, Pablo Ouro, and Catherine Wilson

The settling velocity of a plastic particle is a crucial descriptor for plastic transport in rivers. When a plastic particle is introduced into the riverine environment, the plastic’ surface provides a medium that enables the attachment, accumulation and growth of microorganisms, known as biofouling. While the settling velocity has been extensively studied for pristine plastics, the influence of biofouling on settling velocity and transport dynamics of plastics needs to be fully understood. Biofouling can alter a plastic particle's size, shape, weight, and buoyancy, potentially leading to an increase in settling velocity of up to 130% compared to the same pristine plastic. However, the effect of an uneven particle weight distribution, caused by heterogeneous biofilm growth, on the plastic’s settling orientation, vertical trajectory and subsequent settling velocity has yet to be investigated.


This study aims to quantify the impact of biofouling on the settling orientation of a plastic particle and describe its subsequent effect on settling velocity and pattern. To achieve this, we conducted experiments using a synchronised multi-camera setup and a three-dimensional particle reconstruction to characterise particle trajectories and settling orientations. Two sets of the same negatively buoyant PTFE plastic fragments and spheres were tested, namely: i) pristine plastics, and ii) plastics subjected to biofilm colonisation in laboratory conditions. The tested plastics were fragments in sizes 1 x 10 x 10 mm and 1 x 20 x 10 mm, as well as spheres with a diameter of 5 mm. These experiments will have significant implications for the description of the settling velocity of plastics which will aid in informing future field campaigns aimed at quantifying riverine plastic transport.

How to cite: Lofty, J., Ouro, P., and Wilson, C.: A plastic tipping point: The influence of biofouling on the settling orientation of plastics., EGU General Assembly 2024, Vienna, Austria, 14–19 Apr 2024, EGU24-131, https://doi.org/10.5194/egusphere-egu24-131, 2024.

EGU24-494 | Orals | HS1.3.5

In-situ and real-time detection of micro/nanoplastics in water: Combining laboratory experiments and modelling studies for plastic life cycle analysis 

Zi Wang, Devendra Pal, Abolghasem Pilechi, Maïline Fok Cheung, and Parisa Ariya

Maritime micro/nanoplastic research provides valuable insights into oceanic plastic waste remediation. Yet, there is a notable disparity, with micro/nanoplastic research in freshwater being ~ 85% less extensive than that in seawater. Observational studies suggest that over 1000 rivers contribute to ~ 80% of the global riverine plastic input into the oceans. Understanding the presence of micro/nanoplastics in freshwater systems is essential for unraveling the global micro/nanoplastic cycle.

In our laboratory, a cutting-edge nano-digital inline holographic microscope (nano-DIHM) was developed for real-time and in-situ micro- and nanoplastic research, including physicochemical characteristics, coatings, and dynamic behaviours in freshwater systems. The nano-DIHM data revealed distinct intensity and optical phase patterns of various types of single particles and clusters of micro/nanoplastics (PE, PP, PS, PET, PVC, and PUR), along with other organics (oleic acid), inorganics (magnetite), and biological materials (phytoplankton). We further incorporated a deep neural network functionality to nano-DIHM for rapid micro/nanoplastic detection in real-environmental waters. With its 4D (3D + time) tracking capability, we utilized nano-DIHM to measure the sedimentation (settling and floating) velocity of plastics in two size categories in water. The experimental results were subsequently integrated into a numerical model (CaMPSim-3D) developed at the National Research Council Canada to simulate the transport of plastic particles in Canadian rivers. Complementary modelling results demonstrated distinct distribution and accumulation patterns of macro-, micro-, and nanoplastic particles in aquatic systems, establishing nano-DIHM a powerful approach for plastic life-cycle analysis.

How to cite: Wang, Z., Pal, D., Pilechi, A., Fok Cheung, M., and Ariya, P.: In-situ and real-time detection of micro/nanoplastics in water: Combining laboratory experiments and modelling studies for plastic life cycle analysis, EGU General Assembly 2024, Vienna, Austria, 14–19 Apr 2024, EGU24-494, https://doi.org/10.5194/egusphere-egu24-494, 2024.

EGU24-850 | ECS | Posters on site | HS1.3.5

Review and analysis of atrazine adsorption on different microplastics in aqueous solution.  

Bishwatma Biswas and Sudha Goel

Microplastics (MPs) are ubiquitous in all kinds of water matrices. The different properties of MPs facilitate their role as carriers of emerging contaminants like pesticides, pharmaceuticals, PFAS and surfactants. Hydrophobic pesticides have a high tendency to be adsorbed on non-polar substances such as MPs. The widespread use of atrazine has caused it to be omnipresent in the environment, leading to their concurrent presence with MPs. The partitioning and fate of atrazine sorbed MPs are governed by various environmental conditions and physicochemical characteristics of different matrices. The interaction of MPs with pesticides enables MPs to serve as vectors for the transport of pesticides in aquatic media. In this work, the sorption of atrazine on polyethylene MPs was investigated in batch adsorption studies. The characterization of MPs was conducted using FTIR, SEM and XRD. By examining the characteristics of MPs and atrazine, an adsorption mechanism is proposed. The sorption of atrazine on PS was mainly governed by van der Waals forces and pore-filling mechanism. The effect of contact time on the adsorption of ATZ on PS was examined. Contact time was used to compare the results of different experiments as it is necessary to establish an equilibrium time that can be used in all the experiments. It was found that the pseudo-second order model was a better fit than pseudo first order-model based on the highest R2 values obtained. Finally, the effects of salinity and pH were also measured and found to be relatively limited. The results of this study prove that MPs can act as carriers of pesticides like atrazine in aqueous medium.

How to cite: Biswas, B. and Goel, S.: Review and analysis of atrazine adsorption on different microplastics in aqueous solution. , EGU General Assembly 2024, Vienna, Austria, 14–19 Apr 2024, EGU24-850, https://doi.org/10.5194/egusphere-egu24-850, 2024.

EGU24-1077 | ECS | Posters on site | HS1.3.5

Microplastics from surgical masks: A piggy-back ride for sulfamethoxazole in the sea 

Anuja Joseph, Bishwatma Biswas, and Sudha Goel

Microplastics can act as carriers for several organic pollutants like poly aromatic hydrocarbons, pesticides, polychlorinated biphenyls, and other persistent pharmaceutical pollutants. It is important to be noted that pharmaceuticals are bio-active substances, structurally modified to induce pharmacological changes in living organisms. These pharmaceuticals pose a threat to the ecosystem and the organisms living in it when not treated effectively. Antibiotic residues may enter the aquatic environment through effluents from sewage treatment plants, application in aquaculture, and other riverine inputs. The transport of one such antibiotic, Sulfamethoxazole (SMX), with the aid of microplastics was investigated in this study.

Surgical masks are made up of polypropylene fibers and they tend to degrade faster in the air as compared to sea-water when exposed to sunlight. Surgical masks are used for medical and personal care purposes and are often disposed of irresponsibly. In this study, the sorption mechanism of SMX onto the mask fibers was observed. The optimum adsorption capacity was analyzed for the microplastics. The effects of pH, salinity, microplastic dose, and SMX concentration were observed. Kinetic models were used to identify the sorption behavior and mechanism. The sorption pattern was then fitted onto linear and Freundlich isotherms. The van Der Waal interactions were probably responsible for the interaction between SMX (hydrophilic) and microplastics (hydrophobic). The results indicate that the microplastics can adsorb up to 15 % of the SMX concentration, when in seawater. The adsorption and desorption of SMX aided by the microplastics from the surgical masks can be interpreted into a transport model for SMX. Thus, this study confirms that aged microplastics when left near the seashore, gradually enter the aquatic ecosystem and act as carriers for pharmaceuticals like SMX. The ability of microplastics to desorb a certain amount of adsorbed contaminant can lead to major health concerns, as the organisms may consume the same, causing complications to health.

How to cite: Joseph, A., Biswas, B., and Goel, S.: Microplastics from surgical masks: A piggy-back ride for sulfamethoxazole in the sea, EGU General Assembly 2024, Vienna, Austria, 14–19 Apr 2024, EGU24-1077, https://doi.org/10.5194/egusphere-egu24-1077, 2024.

In the environment, plastics are exposed to weathering processes such as mechanical cutting and abrasion, chemical and biological degradation, as well as UV radiation and heat. These processes breakdown larger plastics into smaller pieces and alter the physical and chemical properties of plastics. Most environment micro- and nano-plastics are generated via weathering of larger plastics. Micro- and nano-plastics are often more mobile, bioavailable, and toxic than their larger counterparts due to their smaller size. As a result, contamination of micro- and nano-plastics has become an increasing concern. Although many laboratory studies have been conducted on micro- and nano-plastics to understand their behavior in the environment, most studies were conducted using synthesized, mono-dispersed, polystyrene micro-spheres as surrogate for micro- and nano-plastics in the environment. The polystyrene micro-spheres, however, do not represent well the complex and diverse composition, size, shape, and other physiochemical properties of real-world micro- and nano-plastics. The objective of our research is to fill the gap by studying the micro- and nano-plastics released from macro-plastics including polystyrene (PS), high-density and low-density polyethylene (HDPE and LDPE), polypropylene (PP), and nylon under laboratory-controlled conditions. Plastic sheets or pellets were cut into small pieces, mixed with nano-pure water, heated, and filtered through 1 um membrane to collect fine plastics. Some macro-plastics were also “weathered” using UV radiation or high temperature. Particle concentration measurement showed that substantial quantities of fine plastics (~ 5*10^9 particles/mL) were released from PP and LDPE macro-plastics, moderate quantities were released from PS macro-plastics (~5*10^8 particles/mL), and practically no fine plastics were released from nylon or HDPE. SEM results indicated the fine plastic particles were of irregular shape and poly-dispersed with a size-range of ~100 to 400 nm, while the polystyrene micro-spheres were of spherical shape with a uniform diameter of 100 nm. Zeta-potential of LDPE fine plastics in 3 mM NaCl solution at pH 5 was ~-42 mV, more negative than those of polystyrene micro-spheres (~-25 mV). This study highlights the distinct properties of manufactured polystyrene micro-spheres and fine plastics released from macro-plastics. Results from our study suggest fine plastics released from macro-plastics may better represents the properties of micro- and nano-plastics in the environment.

How to cite: Cheng, T. and Saliminasab, S.: Release and characterization of micro- and nano-plastic particles from different types of macro-plastics, EGU General Assembly 2024, Vienna, Austria, 14–19 Apr 2024, EGU24-1433, https://doi.org/10.5194/egusphere-egu24-1433, 2024.

EGU24-1720 | Orals | HS1.3.5

Quantifying microplastic residence times in lakes using mesocosm experiments and 1D random walk model 

Hassan Elagami, Sven Frei, Jan-Pascal Boos, Gabriele Trommer, and Benjamin S. Gilfedder

Microplastic residence time in lakes is governed by complex and interrelated processes. In this work, we have used a series of in-lake mesocosm experiments combined with random walk modeling to understand microplastic residence times in the lake water column. Three size ranges of green fluorescent microplastic (1-5, 28-48, and 53-63 µm) were added to a 12m deep mesocosm and detected using fluorescence detectors. Experiments were conducted over one year capturing thermal stratification in summer as well as lake turnover in autumn. The measured residence times in summer ranged between ~1 and 24 days and depended mainly on particle size. The modeled residence time for the smallest particles (>200d) was considerably longer than the measured residence times in the mesocosm (~24d). This could be due to interactions between the small microplastic particles and existing particles in the lake. In contrast, during lake turnover large Rayleigh numbers showed that instabilities in the water column likely led to turbulent convective mixing and rapid sinking within the mesocosm.

How to cite: Elagami, H., Frei, S., Boos, J.-P., Trommer, G., and Gilfedder, B. S.: Quantifying microplastic residence times in lakes using mesocosm experiments and 1D random walk model, EGU General Assembly 2024, Vienna, Austria, 14–19 Apr 2024, EGU24-1720, https://doi.org/10.5194/egusphere-egu24-1720, 2024.

EGU24-3025 | ECS | Posters on site | HS1.3.5

The effects of streambed movement and particle size on microplastic deposition 

Verena Levy Sturm, Silvia Gobrecht, and Shai Arnon

Microplastic (MP) is ubiquitously found in aquatic environments and poses a significant environmental challenge. However, what controls MP deposition and burial in river networks is unclear, especially when sediments are in motion. This study addresses this gap by examining the impact of streambed motion and particle size on microplastic deposition in sandy streambeds. Experiments were conducted in a stainless-steel flume (650 cm x 20 cm) filled with 25 cm of silica sand (D50 = 0.6 mm) and water (depth = 12 cm). A centrifugal pump circulated the water and maintained a stream water velocity of 0.53 m/s. Polypropylene (PP) fibers at lengths of 25 μm, 100 μm, 200 μm, and 2000 μm, and carboxylated Polystyrene (PS) microspheres (diameter of 0.5 μm, 1 μm, and 5 μm) were added to the stream water and their concentration in the water was measured over three days. The deposition of the MP was inferred from the decline of MP in the streamwater. A control experiment was conducted by repeating the same experiments but without sediments. The flow in the flume generated ripples, which move at a speed of approximately 4 m/h. Bed motion dominated the exchange flux of streamwater and particles with the sediments. MP concentrations declined rapidly in the first two hours after the addition due to the exchange that led to a mixing of streamwater with particle-free pore water. After the relatively fast initial decline in MP, further reduction in MP concentrations in the water occurred due to deposition. Different deposition dynamics were observed for fibers and microspheres. Buried MP particles were partly resuspended during the scouring of the ripples during their movement. It was found that  PP fibers 25 μm and 0.5 μm spheres were more mobile in the sediment than longer fibers and larger spheres, respectively. We explain their higher deposition than larger particles by a potential advective movement through the porous media, leading to their transport below the scour zone. PP fibers ≥ 100 μm were immobile within the sediment, and thus, their deposition was only due to burial by the ripple motion. Our results highlight the significant influence of moving sediments on MP and the importance of considering MP size for catchment-scale modeling to predict MP fluxes to oceans. Deposition locations are also likely to be affected by bed motions and thus should be considered when developing effective sampling strategies.

How to cite: Levy Sturm, V., Gobrecht, S., and Arnon, S.: The effects of streambed movement and particle size on microplastic deposition, EGU General Assembly 2024, Vienna, Austria, 14–19 Apr 2024, EGU24-3025, https://doi.org/10.5194/egusphere-egu24-3025, 2024.

MP of all sizes and densities have been found deposited in streambeds. Several delivery processes were proposed to explain these observations, especially their dynamics, because most information was based on discrete sampling. Only a few studies have attempted to use a wide range of particle sizes to understand how MP moves in streams and rivers. At the same time, no experiments were conducted during bed motion due to the complexity of running such experiments. This study aimed to quantify the effect of streambed motion on the deposition and accumulation of MP in streambed sediments. We used a numerical model that predicts the flow and transport of particles in a moving streambed to quantify MP deposition. The model was run for streamwater velocities of 0.1- 0.5 m s-1 and median grain sizes of 0.15, 0.3, 0.45, and 0.6 mm. Streambed morphodynamics were estimated from empirical relationships. The flow conditions and sediment types resulted in ripple formation with celerities between 0-2000 cm hr-1. MP propensity to become trapped in porous media was simulated using a filtration coefficient. Various filtration coefficients (0.1-1 [1/cm]) were used in the simulations to predict the fate of particles in the sediment. The maximum deposition efficiency and deposition depth were found for sediment with high hydraulic conductivity and slow-moving stream water velocity conditions. Also, we found that the exchange of water and particles due to sediment motion leads to burial and potentially long-term deposition of MPs that initially were not expected to enter the bed due to size exclusion. However, increasing celerity reduces the depth of MP deposition in the streambed and reduces deposition efficiency due to resuspension. The burial of MP beneath the moving fraction of the bed provides a mechanism for long-term accumulation and may explain resuspension events characterized by high MP loads during floods. The modeling results could also assist in developing strategies for streambed sampling since a horizontal layer of particle deposit is expected to form below the moving fraction of the bed.

How to cite: Peleg, E., Teitelbaum, Y., and Arnon, S.: Understanding how sediment movement affects microplastic deposition in sandy streambeds: A modeling study., EGU General Assembly 2024, Vienna, Austria, 14–19 Apr 2024, EGU24-3545, https://doi.org/10.5194/egusphere-egu24-3545, 2024.

Microplastics (MPs) are a major pollutant of the modern world, being dubbed “the lead of our generation”. Even though their potential danger to life on Earth is understood, their transport in water bodies remains an area with open questions, specifically their transport in rivers and streams. Such contaminants can be divided into three categories: spherical, irregular and fiber MPs. While research has been done on the fluvial transport of spherical MPs and their interaction with the hyporheic zone, the transport mechanisms that govern Microplastic Fibers (MPFs) are still unknown. State of the art models suggest a marked difference between the transport and settling of MPFs compared to spherical and irregular MPs, thus the need to confirm these models in a laboratory setting. The difference between the fluvial transport of spherical MPs, irregular MPs and MPFs is thereby researched here. Similarly sized fluorescent MPs and MPFs will be compared in an experimental flume, continuously logging the concentration in the water head and that in the hyporheic zone at the flume interface.

How to cite: La Capra, M. and Frei, S.: Comparing the interaction of differently shaped Microplastics with the Hyporheic zone, EGU General Assembly 2024, Vienna, Austria, 14–19 Apr 2024, EGU24-3779, https://doi.org/10.5194/egusphere-egu24-3779, 2024.

EGU24-6625 | ECS | Orals | HS1.3.5

Bedforms effect on microplastics deposits erosion  

Arianna Varrani, Massimo Guerrero, Magdalena Mrokowska, and Paweł M. Rowiński

Transport processes involving both microplastics (MPs) and natural sediments are being marginally studied, for the high complexity of the system and the many factors requiring attention. Still, it is of high importance to understand the interactions between natural sediments and MPs transport, especially at the water-bed interface, a critical area for rivers’ ecology and biodiversity. To bridge this gap, we carried out flume (15-m long, 1.0-m wide and with 0.27 m water depth) experiments to study the interactions of a small bedform and a deposit of compact MPs. The compact-shaped MPs, consisting of Polyamide 6 particles with equivalent sphere diameter around 2.9 mm, were released at a low flow rate (around 20 l/s corresponding to a mean velocity of 0.1 m/s), for which deposit formed at the lee side of a 2-cm high and approximately 0.7-m long sand dune. A sudden increase of flow rate was then applied (up to 60 l/s corresponding to a mean velocity of 0.3 m/s), forcing erosion of the MPs. Measurements included velocity profiles and turbulent measurements via Acoustic Doppler instrumentation, videos and underwater photos of the small bedform. From Doppler measurements the mean flow characteristics were derived, as well as fluctuating terms of the velocity components up to 50Hz. Using Structure from Motion, a 3D model of the bedform and the MPs deposit was constructed. The erosional behaviour of deposited MPs was derived by estimating the total volume mobilised from the deposit by difference (prior and post erosion) via DEM. The MPs’ removal efficiency was then estimated, in three cases of MPs’ deposit initial volumes.  

How to cite: Varrani, A., Guerrero, M., Mrokowska, M., and Rowiński, P. M.: Bedforms effect on microplastics deposits erosion , EGU General Assembly 2024, Vienna, Austria, 14–19 Apr 2024, EGU24-6625, https://doi.org/10.5194/egusphere-egu24-6625, 2024.

EGU24-6714 | ECS | Posters on site | HS1.3.5

Integrating Numerical Modeling and Fieldwork for Understanding Land-to-Ocean Litter Transport: A Comprehensive Review 

Nazife Oruc Baci, Félix Santiago-Collazo, and Jenna R Jambeck

The global issue of marine litter pollution, mainly from land-based sources, has gained significant attention in recent years due to its profound environmental and socio-economic impacts. Environmental impacts pose a significant threat to marine ecosystems, harming marine life through ingestion and entanglement, disrupting habitats, and even introducing harmful chemicals into the food chain. Socio-economically, it affects coastal communities and industries by reducing tourism revenues, damaging fisheries, and increasing cleanup costs, thereby undermining livelihoods and the overall well-being of communities. Furthermore, long-term consequences include potential economic burdens related to public health issues and the need for more extensive waste management systems. This review is a comprehensive overview of the state-of-the-art numerical modeling of land-to-ocean litter transport. It underscores the significance of an integrated approach in addressing this pressing environmental challenge. The focus of this study is exploring the evolving landscape of numerical modeling techniques in the context of hydrodynamics and the significance of fieldwork in enhancing their accuracy in litter transport. Numerical modeling techniques have emerged as powerful tools for simulating complex hydrodynamic processes responsible for litter movement in aquatic environments. For example, Particle Tracing Models (PTMs) have gained prominence in recent years as an effective approach for simulating the trajectory of individual litter particles in aquatic systems by considering various environmental factors, such as currents, tides, and winds. These models enable researchers to assess various scenarios, identify key drivers of litter transport, and develop targeted strategies for litter management and remediation by aiding in predicting their dispersion patterns and arrival locations. However, their effectiveness is significantly enhanced when informed and validated by real-world field data. Fieldwork complements numerical models by providing crucial data for model validation and calibration. It also offers a unique perspective on the real-world challenges and dynamics of land-to-ocean litter transport. Moreover, fieldwork helps identify hotspots of litter accumulation, assess the composition and sources of litter, and understand the influence of local conditions on transport pathways. By combining these approaches, researchers can accurately represent litter transport processes, ultimately aiding in effective litter management and policy development.

How to cite: Oruc Baci, N., Santiago-Collazo, F., and Jambeck, J. R.: Integrating Numerical Modeling and Fieldwork for Understanding Land-to-Ocean Litter Transport: A Comprehensive Review, EGU General Assembly 2024, Vienna, Austria, 14–19 Apr 2024, EGU24-6714, https://doi.org/10.5194/egusphere-egu24-6714, 2024.

EGU24-8159 | ECS | Posters on site | HS1.3.5

Low-intrusive colour-enhanced pattern coating of plastics for fluid-mechanics laboratory experiments 

Daniel Valero, Stefan Felder, Frank Seidel, Antonio Moreno-Rodenas, and Mário J. Franca

Plastic transport experiments have been conducted under laboratory conditions over the past five-year period. The primary objective of these experiments is to obtain physical insights into the interactions among fluids, plastics, and solids. These insights aim to facilitate the upscaling of findings to riverine or maritime environments for predictive purposes. Despite the significant progress, challenges persist, notably in tracking plastic particles, potentially employing multi-camera setups. Traditional imaging methods, such as contrast-based detection or moving-object algorithms (based on selected computer vision or background differentiation techniques), can encounter several limitations. For instance, samples with low contrast relative to the background are more susceptible to errors, and the slow movement of samples can yield weaker signals compared to fluctuating light reflections in the area of interest. Additionally, 3D tracking can introduce compounded errors across multiple cameras, leading to amplified errors.

In response to these difficulties, our research introduces a novel colour-based contrast enhancement technique, based on a multi-colour water-proof coating for plastic samples. Our protocol leads to coating added masses remaining below 1%, while facilitating the precise detection of transparent and deformable plastics. We present the current limitations in detectability, including light dependency, and discuss the potential advancements enabled by our proposed methodology.

How to cite: Valero, D., Felder, S., Seidel, F., Moreno-Rodenas, A., and Franca, M. J.: Low-intrusive colour-enhanced pattern coating of plastics for fluid-mechanics laboratory experiments, EGU General Assembly 2024, Vienna, Austria, 14–19 Apr 2024, EGU24-8159, https://doi.org/10.5194/egusphere-egu24-8159, 2024.

EGU24-8538 | ECS | Posters on site | HS1.3.5

Modelling the transport of microplastics in the Gironde estuary: Sensitivity to physical processes and their parameterizations 

Betty John Kaimathuruthy, Isabel Jalon Rojas, and Damien Sous

Studying microplastic transport in estuaries is challenging due to the dynamic interplay between river and ocean, compounded by the diverse properties exhibited by these particles. Lagrangian particle-tracking numerical modelling is a relevant tool for investigating microplastic transport dynamics, dispersion patterns, and vertical distribution. However, these models oversimplify the parametrizations of crucial estuarine processes by ignoring the effect of varying water density or vertical diffusion coefficients. In this study, we implement a hydrodynamic and improved particle tracking model in the macrotidal Gironde estuary (SW France) to explore the relative importance of different physical processes (time-space varying vertical diffusivity and water density, beaching-refloating, bottom resuspension) and provide a better understanding of microplastic dispersion and potential trapping. The simulated particle trajectories and density distributions from our findings indicate a limited influence of the spatio-temporal variability of vertical turbulence on floating particles, with a notable impact observed for settling particles, showing its significance in particle resuspension. Despite the time-space-varying water density, the effect on the transport patterns of both floating and settling microplastics is relatively lower, while the phenomenon of beaching-refloating increases the particle's residence time within the upper estuary. The higher river discharge during the spring season flushes floating particles downstream, with a portion reaching the open sea, while settling particles persist within the estuary during both seasons. Notably, denser microplastic particles tend to accumulate in the upper estuary region during summer, where the estuarine turbidity maxima have been identified.

How to cite: Kaimathuruthy, B. J., Jalon Rojas, I., and Sous, D.: Modelling the transport of microplastics in the Gironde estuary: Sensitivity to physical processes and their parameterizations, EGU General Assembly 2024, Vienna, Austria, 14–19 Apr 2024, EGU24-8538, https://doi.org/10.5194/egusphere-egu24-8538, 2024.

In the last decade mismanaged plastic waste, specifically microplastics (1-5000 µm) have gained significant scientific and public interest with research from numerous disciplines highlighting the ubiquitous nature and potential harm microplastics can exert on both human and ecosystem health. Microplastics can now be found in all of Earth’s environmental compartments. Although a large level of knowledge has been obtained highlighting the sources (wastewater treatment plants, urban areas, agricultural fields etc), sinks (oceans, lakes, rivers, ground water, etc) and transport routes (rivers, air currents, ground water etc) of microplastics in the environment, our understanding of the processes that drive flux between systems is still limited. This is especially true in systems where environmental loading and activation events are less predictable, such as those found in diffuse source dominated catchments. Previous studies have highlighted storm events as significant drivers of microplastic flux in such catchments. However, little research has been conducted examining how microplastic concentrations, loading and characteristics change over the course of a storm hydrograph and also how the hydrometeorological conditions before and during an event interact with the microplastic supply dynamics.

This study aims to address this gap. In June 2022 a single light storm event (<2.5 mm/day) was sampled after a 10-day dry period (<0.2 mm/day) within a peri urban, headwater catchment located within Birmingham, UK. In total 34 surface water samples were collected covering discharge before, during and after the captured event. For each sample 100 L of surface water was collected from the main flow path of the Bourne Brook river and filtered through a 64 µm sieve. Collected particles were treated with H2O2 (30%) and Fenton to remove organics and stained with Nile red to aid quantification and characterisation of potential microplastics using fluorescent microscopy. Furthermore, >20% of the potential microplastics identified were analysed using Raman spectroscopy for polymer classification. Additionally, in-situ loggers collected level (to infer discharge, concentration and loading) and turbidity data. During baseflow (discharge = 58 to 99 L/s) immediately before the event, microplastic concentrations ranged from 0.01 to 0.17 MP/L (n = 7). In contrast, during the event microplastic concentrations ranged from 0.13 MP/L (discharge = 91 L/s) the statistically defined start of the storm hydrograph to 1.69 MP/L (discharge = 401 L/s), with microplastic concentrations being significantly higher in the ascending limb of the storm hydrograph than the descending limb. Hysteresis analysis indicated source limitation (Clockwise hysteric loop and hysteresis index >1 (2.05)) with microplastic concentration peaking before peak discharge suggesting microplastic supply depletion. Furthermore, it was estimated that during the sampled portion of the storm event (around 8 hours) about six million microplastic particles were exported from the catchment. In contrast, microplastic export during baseflow ranged from around 28,000 to around 368,000 particles for the same time frame, indicating the significance of such events when calculating annual MP flux. This study demonstrates how microplastic concentrations and characteristics change over the course of a single storm event, providing a mechanistic understanding of how hydrometeorological conditions interact with microplastic supply dynamics.

How to cite: Haverson, L., Mignanelli, L., Schneidewind, U., and Krause, S.: High frequency sampling during a storm hydrograph offers insights into the possible transport and source activation dynamics of microplastics within a peri urban stream. , EGU General Assembly 2024, Vienna, Austria, 14–19 Apr 2024, EGU24-8895, https://doi.org/10.5194/egusphere-egu24-8895, 2024.

EGU24-8953 | ECS | Posters on site | HS1.3.5

Subsurface transport of microplastics in riverine sediment: Impacts of different rain events and particle density 

Jaswant Singh, Reza Dehbandi, Neeraj Chauhan, Uwe Schneidewind, Lee Haverson, Brijesh K Yadav, and Stefan Krause

Microplastics (MPs) have emerged as a growing concern, posing potential risks to both marine and terrestrial environments. While surface soils are recognised as a primary sink for these particles, the vertical mobility of MPs in the subsurface remains uncertain due to a lack of comprehensive scientific data. Here, we conducted column experiments to study the transport behaviour of MPs through and retention in subsurface sediment. Two types of pre-stained MPs (median size 50.4 µm) with densities greater than (polystyrene) and smaller than (polyethylene) water were added to the top of large (110 cm) wet-packed fine gravel columns - the most common gravel found in the subsurface zone of the riverine environment. The concentration of deposited MPs was 50,000 particles per kilogram of sediment, derived from an extensive literature survey of polluted sites. Various scenarios, including continuous rain, wet-dry cycles, and dry conditions (characterised by a single rain event followed by a subsequent drying period), were implemented to simulate diverse rain events. 20 mL of water samples were systematically collected at specified intervals from different ports of the column at depths of 30, 50 and 70 cm. Additionally, continuous effluent collection took place at the bottom port (90 cm), which was connected to a pump that maintained a controlled flux at around 4.6 mL/min. At the end of the experiment, gravel samples were methodically collected from discrete sediment layers within the columns (0–5 cm (top of the source layer), 5–10 cm (source layer), 10–30 cm, 30–50 cm, 50–70 cm, 70–90 cm) to quantify the MP mass retained in the column. Results showed that the smallest PS-MPs with a continuous flow system exhibit the highest potential for transport due to higher density and less hydrophobicity compared to PE. With increasing rain events, MPs in the source sediment layer decreased, while MPs concentrations in deeper column layers increased significantly. Furthermore, an intriguing observation indicates that as these MPs undergo more wet-dry cycles, their penetration depth substantially increases. The results indicate that sediment may not only act as a sink for MPs but also as a possible entry point to subsurface receptors such as subterranean fauna and aquifers. This research underscores the intricate dynamics of MPs in sediment and raises awareness regarding the potential environmental consequences.


Keywords: Microplastics, Transport, Raining events, Density, Hydrophobicity


How to cite: Singh, J., Dehbandi, R., Chauhan, N., Schneidewind, U., Haverson, L., Yadav, B. K., and Krause, S.: Subsurface transport of microplastics in riverine sediment: Impacts of different rain events and particle density, EGU General Assembly 2024, Vienna, Austria, 14–19 Apr 2024, EGU24-8953, https://doi.org/10.5194/egusphere-egu24-8953, 2024.

EGU24-9356 | Posters on site | HS1.3.5

Controls on microplastic breakdown due to abrasion in gravel bed rivers 

Annie Ockelford, Xuxu Wu, and Daniel Parsons

Microplastic contamination of river sediments has been found to be pervasive at the global scale however, the physical controls governing the storage, remobilization and pathways of transfer in fluvial sediments remain largely unknown. The properties that make plastics useful - strength, flexibility, durability and resistance to degradation - also make their transport through the environment difficult to predict. Specifically, the risk profile associated with microplastic transfer is dynamic because their physical and chemical properties change over time as they persist in, or move through, the environment. For example, mechanical breakdown, due to abrasion, likely decreases the size of microplastic particles, increases their surface roughness and surface area to volume ratio, and influences the diversity and abundance of the microbial taxa that colonise them. However, the processes controlling the mechanical breakdown of plastic particles rivers by abrasion is poorly understood, particularly in gravel bed rivers where there are a range of grain sizes present with the bed sediment. Here we report a series of experiments designed to explicitly quantify the influence of sediment grain size on microplastic degradation and understand how this varies by microplastic type.

Four sediment beds ((i) 0.8mm uniform sand; (ii)10mm uniform gravel; (iii) 20mm uniform gravel and (iv) bimodal sand gravel mix D50 14mm)) were seeded with either Nylon pellets (d= 1.2 g/cm3), Polycarbonate fragments (d=1.2 g/cm3) or Nylon fibres (d = 1.15g/cm3) at 0.005% concentration by mass. The sediment and plastic were placed into a cement mixer with 20L of water and tumbled for 100 hours. During each experiment, the cement mixer was periodically stopped and a sample removed to assess microplastic abrasion.

Results indicate that fibres are abraded to the greatest degree in comparison to beads and fragments.  Results also indicate a clear relationship with sediment size where microplastic fragmentation rates increase with river sediment grain size. In all plastic types surface complexity increases with time which has implications for the ability of the plastics to potentially host microbial taxa.   

How to cite: Ockelford, A., Wu, X., and Parsons, D.: Controls on microplastic breakdown due to abrasion in gravel bed rivers, EGU General Assembly 2024, Vienna, Austria, 14–19 Apr 2024, EGU24-9356, https://doi.org/10.5194/egusphere-egu24-9356, 2024.

EGU24-10148 | ECS | Posters on site | HS1.3.5

A simple model for beaching and resuspension of plastic debris 

Jenny Margareta Mørk, Tor Nordam, and Øyvind Breivik

When modelling the transport of plastics in the marine environment it is common to use a Lagrangian modelling framework. The movement of the particles is governed primarily by advective and diffusive transport, but the plastics are also subjected to a number of other physical, chemical, and biological processes that affect their fate. For transport in coastal regions, one of the more important processes is the interaction between particles and the shoreline.

Currently, there is no consensus on how to handle shoreline interactions in particle tracking models, and many resort to over-simplified descriptions such as considering a particle to be permanently beached at the position where it first hits land, or not allowing for beaching of debris at all. However, it is well-known that a lot of floating marine litter ends up on beaches, and mark-recapture studies of plastic on beaches around the world show that there can be considerable turnover in the litter on a beach. Furthermore, these studies show that both beaching and resuspension rates vary both over different beaches, and over different seasons at the same beach, indicating that these processes depend on several different factors, such as wind and wave conditions, beach morphology, and likely also the shape, size, and density of the object. Thus, in order to accurately predict the accumulation sites for floating plastic debris in coastal regions, more care should be put into modelling shoreline interactions.

Here we investigate a toy model for beaching of floating plastic debris, implemented in an idealised Lagrangian framework with analytically defined current, spatially constant wind and diffusivity, and a domain bounded on one edge by a straight, homogeneous shoreline. We implement different strategies for handling the beaching and resuspension of debris and compare the resulting distribution of particles. There is currently insufficient experimental data on the extent to which the different factors affect the beaching and resuspension processes for different kinds of plastic objects, so the purpose of this work is not to reproduce actual conditions, but rather to investigate the effect of the choice of beaching and resuspension strategies on the simulation results. We investigate e.g. a simple resuspension model where particles have an average lifetime on the beach, as well as a wave-based model where the beaching and resuspension is affected by randomly generated wave heights. 

How to cite: Mørk, J. M., Nordam, T., and Breivik, Ø.: A simple model for beaching and resuspension of plastic debris, EGU General Assembly 2024, Vienna, Austria, 14–19 Apr 2024, EGU24-10148, https://doi.org/10.5194/egusphere-egu24-10148, 2024.

EGU24-10392 | ECS | Orals | HS1.3.5

Green barriers to plastic transport in rivers: an indoor study 

Giovanni Di Lollo, Luca Gallitelli, Claudia Adduce, Maria Rita Maggi, Beatrice Trombetta, and Massimiliano Scalici

Every day, millions of tons of plastic debris are poured into rivers from industrial and civil waste or due to social carelessness and transported to the ocean. Here they decompose into small fragments, compromising the health and growth of fauna and flora that ingest or absorb them. In recent years the idea of using vegetation to trap and extract plastic waste has developed to limit this phenomenon. The aim of this work is to experimentally quantify the ability of aquatic vegetation in trap plastic and understand whether different biotic factors, hydraulic conditions or debris type influence it. Three of the most abundant macrophytes in European and Asian rivers are tested in this study, Myriophyllum spicatum, Potamogeton crispus and Phragmites australis. Natural samples of vegetation, taken along the Tiber, Ninfa-Sisto and Aniene rivers, are positioned into a recirculating flume, where the flow rate and the water depth can be varied. Once stationary flow conditions are reached, a known quantity of polystyrene fragments of different sizes (macroplastics, mesoplastics and microplastics) is added in the upstream part of the channel. The ratio between the fragments retained in the green barrier and the total added during the experiment defines the species' capacity to retain plastics. A change in seasonality, simulated by changing the water depth and the number of stolons inserted into the flume, is tested and its effects on the trapping efficiency is analysed. Three plant’s densities and two water depths are tested for each species. All three plant species show to effectively retain large and medium-sized plastic debris. Only the Myriophyllum spicatum, whose needle-like leaves form a denser network than the other two species, is also found to be efficient in retaining microplastics. The density of the area occupied by vegetation affects the number of trapped fragments, which increases for all species as the number of inserted stolons increases. The change in water depth has no significant impact on the results obtained. In conclusion, the three macrophyte species analyzed in this work can be used to create a barrier to the transport of plastics from rivers to oceans. A more complex structure of the vegetation allows the trapping of microplastics. A larger density of the area occupied by vegetation induces larger trapping efficiency, while hydraulic conditions appear to have no significant influence for the values tested in this study.

How to cite: Di Lollo, G., Gallitelli, L., Adduce, C., Maggi, M. R., Trombetta, B., and Scalici, M.: Green barriers to plastic transport in rivers: an indoor study, EGU General Assembly 2024, Vienna, Austria, 14–19 Apr 2024, EGU24-10392, https://doi.org/10.5194/egusphere-egu24-10392, 2024.

EGU24-10484 | Orals | HS1.3.5

Measurements of spinning and tumbling rates of micro-plastic fibres 

Vlad Giurgiu, Giuseppe Carlo Alp Caridi, Marco De Paoli, and Alfredo Soldati

We perform measurements to assess the influence of the wall-normal position of micro-
plastic fibres on their spinning and tumbling rates in wall-bounded turbulence. The exper-
iments are carried out in a turbulent water channel at a Shear Reynolds number of 720.
The used fibres are curved, 1.2mm long, and 10μm in diameter (aspect ratio 120). Their
length ranges between 4 and 12 Kolmogorov length scales. In the generated flow condi-
tions they are inertial-less, neutrally buoyant, and undeformable. We observe their motion
with six high-speed cameras focused in the near-wall region and channel centre. We employ
and improve upon an established methodology involving the tomographic reconstruction of
each fibre and subsequent tracking. Leveraging their curved shape, we uniquely identify the
temporal evolution of their orientation, enabling measurements of spinning and tumbling
rates. We discuss the uncertainty on the rotation rates based on their shape and angular
displacement between time-steps. Analysis of converged statistics revealed that the mean
and mean square spinning are higher than tumbling rates at both channel centre and near-
wall region. These results are novel, considering that previous experiments are restricted to
measurements of rotation rates of longer straight fibres in homogeneous isotropic turbulence
or to tumbling rates only.

How to cite: Giurgiu, V., Caridi, G. C. A., De Paoli, M., and Soldati, A.: Measurements of spinning and tumbling rates of micro-plastic fibres, EGU General Assembly 2024, Vienna, Austria, 14–19 Apr 2024, EGU24-10484, https://doi.org/10.5194/egusphere-egu24-10484, 2024.

EGU24-12122 | Orals | HS1.3.5

Bioswales as potential sinks for tyre wear particle pollution 

Sophie Comer-Warner, John Scott, Jim Best, Keith Carr, and Stefan Krause

Microplastics are known to be ubiquitous throughout the Earth’s ecosystems, with plastics found everywhere from terrestrial soils to deep ocean trenches. Much of the research to date has focussed on microplastics typically found in, for example, plastics bags, disposable utensils and food containers, with a large focus on marine microplastics. Recently, tyres have been identified as major sources of microplastics to the environment, due to the synthetic rubber they contain. Currently, estimates of the tyre microplastic burden in the environment suggest up to a third of marine microplastics and a third of terrestrial microplastics are tyre wear particles. Despite an increase in tyre wear research we still lack knowledge and understanding of the fate, transport and dynamics of tyre wear particles in the environment. Here, we investigate the role of green infrastructure, specifically bioswales, on the fate of tyre wear from road runoff. We present data from bioswales constructed in 2010, which were subsequently sampled in 2011, 2015 and 2023, providing a temporal record of tyre wear in the bioswales. We analysed samples from two bioswales (wet versus dry) to determine if there is an advantage of different bioswale designs to act as a sink of tyre wear particles. Samples were taken within the bioswale from upstream of the culvert inflow pipe, at various points down the bioswale and upstream of the bioswale outflow. These sampling sites were selected to provide information on potential transport through the bioswale, including whether bioswales are acting as sinks for tyre wear particles and if areas of preferential settling upstream of check dams produce increased rates of settling and trapping of tyre wear particles compared to other areas. The total mass of styrene-butadiene rubber and natural rubber in the samples was analysed using pyrolysis-gas chromatography-mass spectrometry, particle count, size and morphology were determined using optical microscopy. This study aims to determine whether bioswales can be used to effectively remediate tyre wear pollution from road runoff and the best design for this potential storage.

How to cite: Comer-Warner, S., Scott, J., Best, J., Carr, K., and Krause, S.: Bioswales as potential sinks for tyre wear particle pollution, EGU General Assembly 2024, Vienna, Austria, 14–19 Apr 2024, EGU24-12122, https://doi.org/10.5194/egusphere-egu24-12122, 2024.

EGU24-12168 | ECS | Orals | HS1.3.5

Investigating the deposition behavior of different polystyrene nanoplastics onto mineral surfaces using QCM-D 

Sascha Müller, Edith Hammer, Tommy Cedervall, and Nathalie Tufenkji

Nanoplastic, as primary or secondary plastics, emerges as a contaminant across all environmental compartments. In terrestrial settings, the vadose zone is considered a plastic sink. Yet, leaching into deeper saturated subsurface areas and groundwater may occur via preferential flow paths, changing hydro-chemical conditions, or direct infiltration in low lying or recharge areas. Understanding transport and deposition behavior of nanoplastics in aquifer settings is crucial as it i) is expected to deviate from that of engineered nanoparticles (ENPs) due to its more complex physical and chemical properties, and ii) to be able to develop and inform numerical models to upscale nanoplastic contaminant transport when e.g., exploring groundwater resources.  Quartz-crystal microbalance with dissipation monitoring (QCM-D) was used to investigate the deposition behavior of various model polystyrene nanoparticles onto two of the most abundant mineral species on Earth: quartz and kaolinite under various chemical settings.Three types of polystyrene of ~ 100 nm were used herein: A non-functionalized spherical polystyrene (PLAIN), a spherical carboxyl functionalized polystyrene (CARBO) and a hexagonal secondary polystyrene (GRIND) produced by mechanical grinding of larger polystyrene beads. Furthermore, divalent ion concentrations in terrestrial environments are inducing larger effects on nanoplastic processes than monovalent ions and therefore only the effect of increasing Ca2+ concentration in solution was tested. Moreover, natural organic matter (NOM) in terrestrial environments is usually degraded with depth, thus its presence in saturated groundwater can be negligible, yet to consider even low concentrations, we also tested the effect of technical grade humic acid as a model NOM.   We found that deposition behavior differs between various particles and mineral surfaces as well as with Ca2+ concentration. For quartz surfaces, non-spherical particles showed the highest deposition rates, while with the increasing mineral complexity (kaolinite), this effect diminished, and other factors gained more importance. Kaolinite surfaces showed the highest deposition rates among all particle types. This suggests the involvement of surface charge driven processes, where positive Al-OH sites of the kaolinite more effectively attract negatively charged nanoplastics as compared to negatively charged quartz. Increasing the ionic strength increased the deposition behavior until a peak deposition observed at 15 mM Ca2+ due to a gradual charge decrease of particles and minerals. Beyond 15 mM, deposition decreases as a result of reduced particle stability, and consequently lowered convective-diffusive transport to the mineral surface. Surprisingly, highly carboxylated CARBO particles showed a large increase in deposition on kaolinite irrespective of Ca2+ concentration. This may be explained by the importance of Al-OH sites, which bind -COOH groups more effectively than Si-O sites.  Adding 1mg/L humic acid at 15 mM Ca2+ reduced the deposition behavior significantly at both mineral surfaces. Our results highlight important processes between nanoplastics and mineral surfaces and thereby also important impacts in understanding nanoplastic transport in subsurface terrestrial environments. Charge driven processes dominate in simple mineral settings (quartz), while with increasing mineral complexity, chemical processes and specific ion binding interactions will dominate nanoplastic deposition and transport.

How to cite: Müller, S., Hammer, E., Cedervall, T., and Tufenkji, N.: Investigating the deposition behavior of different polystyrene nanoplastics onto mineral surfaces using QCM-D, EGU General Assembly 2024, Vienna, Austria, 14–19 Apr 2024, EGU24-12168, https://doi.org/10.5194/egusphere-egu24-12168, 2024.

Microplastics (MPs) and nanoplastics (NPs) have gained considerable attention as emerging contaminants that can pose potential risks to subsurface environments due to their widespread presence and persistence in the environment. They can act as carriers for other contaminants, such as heavy metals, by adsorbing onto their surfaces, potentially increasing their mobility and consequently causing toxicity to organisms and human health. MPs and NPs can enter groundwater through landfill leachate, agricultural mulches, and wastewater effluent. However, MPs’ and NPs’ behavior in porous media with complicated components has not been thoroughly examined. Therefore, further research is essential to identify the key factors such as aggregation (particles attaching to each other) and deposition (particles attaching to a transport medium), that may influence MPs' and NPs' behavior, fate, and transport mechanisms in soils and groundwater.

The purpose of our research is to investigate how plastic particle properties, pore water chemistry, as well as characteristics of the medium would influence the aggregation and deposition of MPs and NPs.

This study focuses on the attachment of low-density polyethylene micro- and nano-plastics (LDPE) released from macro-plastic pellets and synthesized polystyrene micro-spheres to quartz sand under controlled laboratory conditions. Batch experiments were performed to study the aggregation and deposition of LDPE and synthesized polystyrene micro-spheres onto quartz sand that allow for precise control over environmental variables, facilitating the observation of microplastic-sand interactions in varying background solutions. The influence of two common salts, sodium chloride (NaCl) and calcium chloride (CaCl2), on the attachment process is systematically investigated. The results from our experiments indicated that similar to polystyrene micro-spheres, the LDPE particles did not adsorb to quartz sand at pH 5 in 3 mM NaCl solution, while a substantial amount of LDPE adsorbed to quartz sand in 1 mM CaCl2 at pH 5. This could be attributed to the less negative zeta potential of LDPE (~-25 mV) and polystyrene micro-spheres (~-17 mV) in 1mM CaCl2 background solution as a result of lower electrostatic repulsion between particles.

Results from these experiments provide insights into the complex mechanisms governing MPs' and NPs' behavior in aquatic environments, aiding in the development of strategies to mitigate their impact on ecosystems.

How to cite: Saliminasab, S. and Cheng, T.: Deposition of synthetic polystyrene and low-density polyethylene to quartz sand in different background solutions, EGU General Assembly 2024, Vienna, Austria, 14–19 Apr 2024, EGU24-13565, https://doi.org/10.5194/egusphere-egu24-13565, 2024.

EGU24-17435 | ECS | Orals | HS1.3.5

UV-weathering affects heteroaggregation and subsequent sedimentation of polystyrene microplastic particles with ferrihydrite 

Johanna Schmidtmann, Hannah Weishäupl, Luisa Hopp, and Stefan Peiffer

Microplastic (MP) particles are ubiquitous in aquatic environments. There they interact with naturally occurring particles and colloids. Processes like aggregation affect not only MP surface properties but also removal from the water column. Additionally, MP particles are exposed to UV radiation, which alters their surface properties and thus their interactions with environmental particles. We studied heteroaggregation and subsequent sedimentation of 1 µm polystyrene (PS) (pristine and UV-weathered) with ferrihydrite, an iron (oxy)hydroxide commonly found in nature. Pristine PS particles were highly negatively charged at pH 3-11. After reaction with ferrihydrite, at neutral pH values, strong heteroaggregation with ferrihydrite caused sedimentation of almost all PS particles. At acidic pH, negatively charged PS particles were coated with positively charged ferrihydrite leading to charge reversal. UV-weathering of PS led to lower negative surface charge, and particle size decreased with increasing weathering time. These changes in surface properties and particle size resulted in differences in aggregation behavior with ferrihydrite. With increasing weathering time, the isoelectric point (pHIEP) of samples with PS and ferrihydrite shifted from slightly alkaline pH to pH 3-4. Furthermore, we observed aggregation and subsequent sedimentation of weathered PS and ferrihydrite for larger pH ranges (3-7) compared to pristine PS. We attribute this to the fact that zeta potential values of the mixture of weathered PS and ferrihydrite were rather low in this pH range. Thus, particle repulsion was low, leading to aggregation. Overall, UV-weathering but also interactions of MP with environmental particles cause changes of MP surface properties, which influence its environmental behavior in water and contribute to removal from the water column.

How to cite: Schmidtmann, J., Weishäupl, H., Hopp, L., and Peiffer, S.: UV-weathering affects heteroaggregation and subsequent sedimentation of polystyrene microplastic particles with ferrihydrite, EGU General Assembly 2024, Vienna, Austria, 14–19 Apr 2024, EGU24-17435, https://doi.org/10.5194/egusphere-egu24-17435, 2024.

EGU24-18284 | ECS | Posters on site | HS1.3.5

SWAT (Shoreline plastics in Waves and Tides) 

Ralph Stevenson-Jones, Tor Nordam, Raymond Nepstad, Frode Leirvik, Jenny Margareta Mørk, Shraddha Mehta, and Arsalan Mostaani

The understanding of processes governing the distribution of plastics pollution on beaches is currently an underdeveloped field of study but one with huge potential impact. Current models for plastics transport in the marine environment tend to use very simplified descriptions of the plastics-shoreline interaction. However, the stranding process is clearly a very important component of a model, both due to the direct interest in plastics on beaches and because of the impact on the overall transport due to beaching and resuspension.  Hence, experimental lab data and comparisons with observed beach litter is necessary for further understanding and model development for processes governing the distribution of plastics accumulation.

Here we investigate the mechanisms controlling the accumulation of plastic pollution upon an artificial beach.  Weakly buoyant plastic “nurdles” are placed within a linear wave flume with a sloping sandy beach. The water level is changed to emulate tides, and randomly generated waves are sent towards the beach. The distribution of particulates is imaged using a downward facing camera above the beach.  Image analysis is then used to determine the varying concentration of plastics, as a function of time, over varying wave and tide conditions.

How to cite: Stevenson-Jones, R., Nordam, T., Nepstad, R., Leirvik, F., Mørk, J. M., Mehta, S., and Mostaani, A.: SWAT (Shoreline plastics in Waves and Tides), EGU General Assembly 2024, Vienna, Austria, 14–19 Apr 2024, EGU24-18284, https://doi.org/10.5194/egusphere-egu24-18284, 2024.

EGU24-20181 | Orals | HS1.3.5

Microplastic transport in rivers and their hyporheic zone – combining modeling and experiment 

Jan Fleckenstein, Franz Dichgans, Jan-Pascal Boos, Ben Gilfedder, and Sven Frei

Microplastic (MP) pollution in the aquatic environment has become a problem of growing concern due to potential adverse effects on aquatic organisms and ecosystems. While MP transport and fate in marine systems has been researched to quite some extent relatively little is known about the transport mechanisms of MP particles in terrestrial surface waters and in saturated porous media like in groundwater or the hyporheic zone (HZ).

We investigated the transport and fate of small (1, 3 and 10 μm diameter) polystyrene MP particles in a rippled, sandy stream bed (D50 = 1.04 mm) using CFD simulations calibrated to a set of flume experiments. A novel detection system for fluorescent MP particles (Boos et al. 2021) was used to track and quantify particle movement in the turbulent open water and in the hyporheic sediments in the laboratory flume following a pulse injection of MP particles into the surface water compartment. A new, integrated CFD simulation scheme within the OpenFOAM suite of CFD solvers was implemented for the flume system for a seamless simulation of water flow and particle transport in the open water and in the hyporheic sediments (Dichgans et al. 2023). Additionally we simulated the transport and fate of a range of “virtual” particles in the open water for different channel geometries using a Lagrangian approach.

Simulations show that 1 μm MP particles are transported through the HZ like a solute, following the typical hyporheic flow cells below the bedforms. Transport and particle progression through the HZ could be adequately described with an advection-dispersion equation. Larger 10 µm MP particles instead showed retarded transport through the HZ, while retardation increased with travel distance in the sediments. Our results indicate that advective pumping across the streambed interface can transport very small MP particles through the HZ, while larger particles are increasingly retained. Distinct flow structures in the open water are found to be decisive for the fate of MP particles in the river channel.

References:

Dichgans, F., Boos, J.P., Ahmadi, P., Frei, S., Fleckenstein, J.H. (2023), Integrated numerical modeling to quantify transport and fate of microplastics in the hyporheic zone, Water Research, 243, https://doi.org/10.1016/j.watres.2023.120349

Boos, J.-P., Gilfedder, B. S., & Frei, S. (2021), Tracking microplastics across the streambed interface: Using laserinduced-fluorescence to quantitatively analyze microplastic transport in an experimental flume. Water Resources Research, 57, e2021WR031064.
https://doi.org/10.1029/2021WR031064

Boos, J.-P., Dichgans, F., Fleckenstein, J.H., Gilfedder, B. S., Frei, S. (2024) Assessing the Behavior of Microplastics in Fluvial Systems: Infiltration and Retention Dynamics in Streambed Sediments. Water Resources Research, accepted

How to cite: Fleckenstein, J., Dichgans, F., Boos, J.-P., Gilfedder, B., and Frei, S.: Microplastic transport in rivers and their hyporheic zone – combining modeling and experiment, EGU General Assembly 2024, Vienna, Austria, 14–19 Apr 2024, EGU24-20181, https://doi.org/10.5194/egusphere-egu24-20181, 2024.

EGU24-20316 | ECS | Orals | HS1.3.5

Experimental Study on the Erodability of Microplastics in Muddy Environments 

Isabel Jalon-Rojas, Adeline Lemaire-Coqueugniot, Guillaume Gomit, Alicia Romero-Ramírez, and Sébastien Jarny

This study aims to elucidate the erodability behavior of microplastics in muddy environments like lakes, rivers, estuaries, and deltas, quantifying their critical shear stress on muddy sediment beds. Microplastics of diverse compositions, densities, shapes, and sizes were tested in a hydraulic flume with smooth and synthetic cohesive sediment beds. As flow intensity gradually increased, leading to particle mobilization, friction velocities and critical shear stresses were calculated. Initial results on smooth beds reveal that particle shape was a dominant factor in mobilization (sphere > pellet > fiber > sheet), followed by density: for equivalent shapes, denser particles required higher friction velocities for mobilization. Results from tests with different particle sizes and orientations relative to the flow highlight the influence of the exposed surface area: larger surface areas facilitate easier particle mobilization. Comparative experiments on smooth and muddy surfaces revealed higher shear stresses on cohesive sediment beds, attributed to particles sinking. Particle Image Velocimetry (P.I.V.) analysis showcased roughness-induced turbulence, marked by acceleration peaks and depressions, as the primary mechanism facilitating particle detachment from sediment.

How to cite: Jalon-Rojas, I., Lemaire-Coqueugniot, A., Gomit, G., Romero-Ramírez, A., and Jarny, S.: Experimental Study on the Erodability of Microplastics in Muddy Environments, EGU General Assembly 2024, Vienna, Austria, 14–19 Apr 2024, EGU24-20316, https://doi.org/10.5194/egusphere-egu24-20316, 2024.

EGU24-20585 | ECS | Orals | HS1.3.5

The impact of plastic pollution in sandy riverbeds 

Catherine Russell, Roberto Fernandez, Daniel Parsons, and Florian Pohl

Plastic is ubiquitous in the landscape and rivers are increasingly important vectors for its transport. Some riverbeds exhibit bedforms including ripples and dunes, which are well understood, but understanding of plastic in bedforms is in its infancy. In this study, flume tank experiments show that when plastic particles are introduced to sandy riverbeds, bedforms change character and behaviour. We detail i) mechanisms of plastic incorporation and transport in riverbed dunes, ii) the topographic changes that occur on the riverbed, and iii) quantify plastic-induced changes in sand transport downstream. We find that plastic directly affects bed topography and locally increases the proportion of sand suspended in the water column, even at very low concentrations in the sand. In the wider environment, such changes have the potential to impact river ecosystems and wider landscapes. Different plastic types and shapes have different impacts, therefore the classification of plastic ought to be consistent and comparable to sediment. Considering plastic as a sediment, we present a classification scheme, to enable better comparison of plastic to sediment such that we can better understand their interaction with sediment as a sedimentary particle, and therefore why plastics accumulate where they do. This is importantly not just another classification scheme, but a philosophically grounded solution to a long-standing challenge that is set to be of increasing significance in increasingly contaminated contemporary settings. We set the framework to a suite of questions that will aid understanding of plastic routing and accumulation in the rivers and the wider landscape.

How to cite: Russell, C., Fernandez, R., Parsons, D., and Pohl, F.: The impact of plastic pollution in sandy riverbeds, EGU General Assembly 2024, Vienna, Austria, 14–19 Apr 2024, EGU24-20585, https://doi.org/10.5194/egusphere-egu24-20585, 2024.

HS2.1 – Catchment hydrology in diverse climates and environments

EGU24-55 | PICO | HS2.1.1

Identification and mapping the surface water bodies that are sensitive to groundwater drought in the Godavari basin, India  

Thallam Prashanth, Sayantan Ganguly, Manoj Gummadi, and Dharmaraj Teppala

In recent times, several countries all around the world are experiencing groundwater droughts that are drying up surface water bodies (SWBs), such as rivers, marshes, lakes, etc. For implementing proper water management strategies, it is important to identify the SWBs that are continuously dependent upon the local groundwater reserve to feed them. SWBs that have some reserve throughout the year are fed by the local groundwater during the dry seasons. The rivers, lakes, and wetlands that exhibit these characteristics are referred to as perennial SWBs. Losing SWBs refers to the rivers, lakes, and wetlands for which the groundwater table is lower than the surface water elevation, and thus do not possess perennial characteristics. The water spread areas of SWBs in the Godavari basin are mapped by utilizing Normalized Difference Water Index (NDWI) or Automatic Water Extraction Index (AWEI). The NDWI or AWEI were obtained by using multi-temporal Landsat or Sentinel Satellite datasets in the Google Earth Engine (GEE) platform. Due to the limited spatial resolution of the satellite data, this analysis only considers water bodies with a surface area greater than 3,600 m2. The standardized water spread area index (SWSAI) is used to calculate the magnitude of the surface water drought of different water bodies with respect to space and time. The SWSAI is determined by using the water spread area from NDWI or AWEI by assuming that the water spread area increases due to increase in water surface elevation.  The standardized groundwater table index (SGWTI) is used here to compute the magnitude of groundwater table drought by using the depth of the water table in different observation wells obtained from various central and state government agencies in India. The primary goal of this study is to identify and map the drought sensitive zones responsible for river aridity by plotting correlation matrix for SGWTI of different observation wells. The second objective of this study is to map the spatio-temporal variation of SWSAI of different surface water bodies like ponds, lakes, and wetlands, etc. in the Godavari River Basin, India. The third aim is to determine the correlation between the SGWTI and SWSAI as well as identify the surface water bodies that are influenced by groundwater drought. By this procedure, it would be feasible to determine whether or not there is a connection between the travel time for the groundwater drought propagating from minor surface water bodies (wetlands, lakes, ponds, etc.) to major ones (rivers). It can thus be proved that the surface water dryness in wetlands, lakes progresses towards the rivers due to presence of groundwater drought in the river basin. A correlation (ranging from 0.81 to 0.9) between the depth of connectivity of surface water-groundwater with the SGWTI is computed in this study to demonstrate that the upper Godavari River is highly affected by the groundwater drought, whereas, the middle Godavari river is moderately influenced and the lower Godavari river is less influenced by it.

How to cite: Prashanth, T., Ganguly, S., Gummadi, M., and Teppala, D.: Identification and mapping the surface water bodies that are sensitive to groundwater drought in the Godavari basin, India , EGU General Assembly 2024, Vienna, Austria, 14–19 Apr 2024, EGU24-55, https://doi.org/10.5194/egusphere-egu24-55, 2024.

This study investigates the spatio-temporal dynamics of water quality in a 70 km2 mixed land use, lowland catchment in NE Germany over a four-year period (2018-2022). During this period with a consistent negative rainfall anomaly compared to the long-term average, the intermittent stream network exhibited three distinct hydrological phases each year, with important implications for water quality. Autumn and early winter featured a connecting phase, where spatially variable stream flows responded to rising water tables following increased rainfall and reduced evapotranspiration. The winter and early spring saw a fully connected phase, marked by increased stream flows throughput the catchment. Late spring and early summer experienced a disconnecting phase as flow gradually reduced and stopped in various parts of the catchment before ceasing altogether. A peat wetland in the centre of the catchment exhibited both the earliest and latest stream flows.

Water quality was characteristic of a eutrophic lowland catchment and displayed spatial variations linked to catchment soils and land use. During the connecting phase, stream water quality mirrored that of groundwater and saw mobilization of dissolved organic carbon from wetland areas. In the fully connected phase, stream water became enriched with contributions from soil water and a higher nitrate load from agricultural areas. The disconnecting phase was characterized by lower flows and higher temperatures, contributing to increasingly anoxic conditions which saw nitrate reduction, mobilization of redox elements (Fe and Mn) and release of P. Intermittency caused a transition in stream water quality from hydrological process control in the connecting phase to joint control of hydrological and biogeochemical processes in the fully connected phase and then to biogeochemical process control in the disconnecting phase.

Inter-annual water quality variation was associated with hydroclimate and catchment wetness dynamics, involving flushing and accumulation. Considering intermittency as an influencing variable changed the inter-annual characteristics of flow-concentration relationships compared with the previous perennial river stage, especially for nitrate. These findings have significant implications for the ecology and management strategies in similar catchments, highlighting the need to consider the seasonal hydrological phases for effective water quality management and ecological preservation.

How to cite: Wang, F., Tetzlaff, D., Freymueller, J., and Soulsby, C.: Hydrological connectivity dynamics in a mixed land use lowland catchment drive intra- and inter-annual variation in water quality in an intermittent stream network under drought conditions, EGU General Assembly 2024, Vienna, Austria, 14–19 Apr 2024, EGU24-153, https://doi.org/10.5194/egusphere-egu24-153, 2024.

EGU24-9748 | ECS | PICO | HS2.1.1

The shape of the active length vs streamflow relation in temporary streams 

Nicola Durighetto and Gianluca Botter

River networks are not static entities, as they dynamically respond to the time-variant climatic conditions in the surrounding landscape. Over time, rivers change in both the streamflow Q, as the hydrograph continuously peaks and recedes, and active length L, as the temporary (i.e. non perennial) reaches wet up and dry down. As such, a correlation between L and Q has long been recognized in literature, starting with the first empirical studies dating back to 1968. More recently, a few conceptual frameworks have attempted to explain the physical processes that relate L with Q, showing how the shape of the L(Q) relation is determined by the spatial distribution of the subsurface transport capacity along the network (i.e. the maximum specific flow by unit contributing area delivered downstream in the hyporheic region). Knowing the functional form of the L(Q) relation can be useful in a number of ways, including the following: a) it creates a link between the temporal dynamics of L and Q, allowing one to exploit widely available streamflow datasets to study temporary streams; b) it gives information on invisible subsurface properties of the hyporheic zone; and c) it may provide more reliable predictions of the configuration of the active portion of the network during hydrological conditions that have not been observed yet.

In this contribution, we studied the shape of the L(Q) relation in 45 different catchments around the world, spanning a wide range of climates, geology, morphology, and catchment area. We found that L(Q) relations can be split in 3 main categories: a) generally increasing relations, b) relations showing a plateau for the higher values of Q due to the presence of a maximum potential network that can't be exceeded, and c) relations with a sigmoid shape, when the network length is constant for the driest hydrological conditions e.g. because it is fed by a local perennial source. We speculate that, in most cases, the presence of a plateau or sigmoid shape might not be visible in the data due to the limited number of observations for the relevant high and low flow conditions. For each catchment we also tested different functional forms for the L(Q) relation and selected 3 analytical forms that are best suited to fit the available data (exponential, gamma, power-law). The power law generally performed reasonably well, even though it overestimated L for the largest values of Q in those cases in which a maximum potential wet network is observed. In most cases, the exponential distribution described the plateau quite well but has a reduced performance for the lower flowrates. The gamma distribution, instead, shows the best performance in describing L(Q) relations in all categories. The proposed contribution aims at identifying new general patterns common to all temporary streams, creating new modelling tools that enable large scale studies and giving new tools for the effective monitoring of dynamic river networks.

How to cite: Durighetto, N. and Botter, G.: The shape of the active length vs streamflow relation in temporary streams, EGU General Assembly 2024, Vienna, Austria, 14–19 Apr 2024, EGU24-9748, https://doi.org/10.5194/egusphere-egu24-9748, 2024.

Funded by the French Ministry of Ecology, the French Biodiversity Agency (OFB) and project partners, Explore2 aims to update knowledge about the impact of climate change on hydrology in France, and to support stakeholders in adapting their water management strategies. A multi-scenario and multi-model approach is uniformly applied across the country to encompass a wide range of possible futures for the entire 21st century and to assess uncertainties at each step of the climate and hydrology modelling.

This study aims to extend the results of Explore2 towards the prediction of flow intermittence in headwaters streams, which is initially impeded by the coarse resolution of Explore2 simulations. A statistical approach is necessary to link Explore2 hydrological projections on main rivers to the daily probability of flow intermittence in headstreams (PFI). PFI observations on historical period are derived from data of the French Observatoire National des Etiages (ONDE), which carries monthly visual assessments since 2012, from May to September, at more than 3300 upstream river sites prone to drying  [1]. PFI is then considered as the proportion of ONDE sites observed under drying conditions on partitions of France (76 second-level hydroecoregions (HER2) with median size of 4690 km² paving France).

To predict PFI, logistic regressions are adapted from previous studies [2, 3] and are first calibrated in each HER2 using time series of daily discharge provided by the French hydrometric monitoring network, HYDRO [4]. A diagnosis analysis between 2012 and 2022 consistently demonstrates good performance, with a median Kling-Gupta Efficiency (KGE) around 0.83 across all HER2. Logistic regressions are then re-calibrated considering daily discharge time series simulated by five hydrological models (HMs) of Explore2 driven by SAFRAN meteorological reanalysis [5]. Performance varies according to the HM (KGE medians ranging from 0.60 to 0.82).

Finally, the logistic regressions are applied to simulate daily PFI values at each HER2 for the entire 21st century  with future discharge simulated by the five HMs driven by 17 climate projections under RCP8.5 scenario. Results suggest an increased probability of intermittence in most of the hydrological ensemble runs and under most scenarios. This presentation will focus on the spatial variability of PFI response to climate change projected at different time leads.


References

[1] Nowak and Durozoi. Guide de dimensionnement et de mise en œuvre du suivi national des étiages estivaux. ONEMA, 2012.

[2] Beaufort et al. Extrapolating regional probability of drying of headwater streams using discrete observations and gauging networks. Hydrology and Earth System Sciences, 2018. doi:10.5194/hess-22-3033-2018.

[3] Sauquet et al. Predicting flow intermittence in france under climate change. Hydrological Sciences Journal, 2021. doi:10.1080/02626667.2021.1963444Y.

[4] Leleu et al. La refonte du système d’information national pour la gestion et la mise à disposition des données hydrométriques. Houille Blanche, 2014. doi:10.1051/lhb/2014004.

[5] Durand et al. A meteorological estimation of relevant parameters for snow models. Annals of Glaciology, 1993. doi:10.3189/s0260305500011277.

How to cite: Jaouen, T., Benoit, L., and Sauquet, E.: Predicting the evolution of intermittencies under climate change in France: exploitation of flow projections driven by CMIP5 climate models for Explore2 project, EGU General Assembly 2024, Vienna, Austria, 14–19 Apr 2024, EGU24-9841, https://doi.org/10.5194/egusphere-egu24-9841, 2024.

EGU24-9917 | ECS | PICO | HS2.1.1

Spatial variability in C-N-P concentrations during the fragmentation of an intermittent stream in a temperate agricultural catchment 

Andrés Casanova, Rémi Dupas, Anne Jaffrezic, and Ophélie Fovet

Intermittent rivers and ephemeral streams (IRES) are watercourses that stop flowing at some point during the year. IRES are found in all climates and biomes and their occurrence is predicted to increase with climate change and increasing demand for freshwater. Knowledge of biogeochemical cycles in IRES is mainly based on research in the Mediterranean region. The region of Brittany in western France, characterised by a temperate oceanic climate and intensive agriculture, offers research opportunities to understand C-N-P dynamics in temperate IRES with high nutrient loadings.

In this work, we analyse the spatial variability of C-N-P concentrations in the intermittent stream network of the Kervidy-Naizin catchment (7 km²) during the different phases of intermittency. We hypothesise that the spatial variability of C-N-P concentrations increases during the stream fragmentation, as the formation of isolated pools leads to different physico-chemical conditions due to variable solar radiation, temperature, and nutrient availability. To investigate this, we conducted repeated synoptic sampling campaigns at a high spatial resolution (every 100 to 200 m) along the stream network during the spring-summer of 2023. We sampled forty sites and analysed, among others, DOC, DIN and TP and physico-chemical parameters (conductivity, redox potential, temperature and pH) during four field campaigns spanning from stream recession to the rewetting phase after the summer dry period.

The results showed an increasing spatial variability of concentrations with stream fragmentation, with spatial coefficients of variation increasing from 27% to 49% for DOC, from 15% to 64% for DIN and from 44% to 74% for TP. During the stream fragmentation, mean DOC concentrations increased from 2.43 to 4.76 mg.L-1, mean DIN concentrations decreased from 15.1 to 8.47 mg.L-1 and mean TP concentrations increased from 0.023 to 0.071 mg.L-1. Spatial patterns of concentrations observed during the flowing phase tended to be disrupted by the stream fragmentation, with isolated pools exhibiting extremely high or low concentration values. We interpret these changes in spatial patterns as a consequence of redox processes and nutrient assimilation.

How to cite: Casanova, A., Dupas, R., Jaffrezic, A., and Fovet, O.: Spatial variability in C-N-P concentrations during the fragmentation of an intermittent stream in a temperate agricultural catchment, EGU General Assembly 2024, Vienna, Austria, 14–19 Apr 2024, EGU24-9917, https://doi.org/10.5194/egusphere-egu24-9917, 2024.

EGU24-11267 | ECS | PICO | HS2.1.1

Increasing intermittence of the UK’s chalk streams into the future  

Eugene Magee, Catherine Sefton, Simon Parry, Stuart Allen, and Judy England

The chalk streams of the UK are globally rare, strongly intermittent in their upper reaches, and highly valued for their biodiversity and historical provision of water resources. Recent projections of river flows and groundwater levels under climate change in the UK, coupled to existing statistical models of hydrological state, enable the projection of spatiotemporal intermittence patterns into the near- and far-future.  

Catchments were selected for the study based on the availability of data and the performance of statistical models in the historical period.  Cumulative logit models, previously trained on historical data, were used in conjunction with state-of-the-art ensemble projections of future river flows and groundwater levels to simulate future hydrological state at multiple sites along chalk streams in the south-east of England.  Heatmaps visualise spatiotemporal variations in state, and intermittence metrics quantify the variability.   

The results show projected increases in drying into the future, both temporally, with greater duration of drying, and spatially, with intermittence extending downstream.  Some sites are likely to alter substantially, for example, on the river Chess with notable decreases in modelled flow permanence projected, from 75% in the baseline period (2005-2020) to 25% in the far future (2065-2080). 

This research provides quantifiable spatiotemporal dynamics of intermittence, informing water resource decisions, drought management and engagement activities on these high-profile streams.  The methods developed are adaptable for transfer to other catchments for which spatiotemporal mapping of intermittence patterns and future projections of driving variables exist. 

How to cite: Magee, E., Sefton, C., Parry, S., Allen, S., and England, J.: Increasing intermittence of the UK’s chalk streams into the future , EGU General Assembly 2024, Vienna, Austria, 14–19 Apr 2024, EGU24-11267, https://doi.org/10.5194/egusphere-egu24-11267, 2024.

EGU24-12388 | PICO | HS2.1.1

Exploring tracer dynamics at different spatial scales in a pre-Alpine catchment with a temporary stream network 

Chiara Marchina, Amponsah William, Gelmini Ylenia, Borga Marco, and Zuecco Giulia

Hydrological studies on temporary streams are crucial for understanding their activation and response during wet and dry conditions. Additionally, the use of geochemical tracers (e.g., electrical conductivity, water stable isotopes, major ions) can help assess the impact of climate change on these ephemeral water bodies. This study aims to i) investigate the relation between discharge and tracer concentration at different spatial scales and at the seasonal and event scales; ii) analyze the effect of antecedent conditions on tracer temporal variability at different spatial scales; iii) compare the contribution of rainwater to stream runoff at three scales during selected rainfall-runoff events. The work relies on an integrated database of isotopic and geochemical compositions of water samples coupled with hydrometeorological data from the Regional Environmental Agency (ARPAV) in the 116 km2 Posina catchment in the Italian pre-Alps. The lithology consists mainly of carbonate rocks, and the typical fracturing of dolomites and limestones facilitates water infiltration, thus favoring the presence of temporary streams during dry periods. Conversely, the limited presence of volcanic rocks in some sub-catchments tends to favor perennial streams characterized by a rapid response to rainfall events. In this work, water samples were collected from the Posina river and its main tributaries between September 2015 and March 2019. Temperature and electrical conductivity were measured in the field by portable probes, whereas major ions and water stable isotopes were analyzed by ion chromatography and laser spectroscopy, respectively. Preliminary results show that relationships between discharge and tracer concentration reveal significant associations: δ18O increases with discharge, whereas electrical conductivity (EC) shows a decreasing trend with discharge, better represented by logarithmic and polynomial functions for different selected sections of the main streams and tributaries. Similar trends are observed for sulphates and sodium.  Discharge data at Ressi (a tributary flowing on volcanic rocks) and Posina at catchment outlet have also been compared with selected tracer data from water samples from these two sections. Positive correlations are found between average tracer concentration (δ2H, δ18O, and nitrates) and peak antecedent discharge, while negative correlations exist for δ2H, EC, chloride, sulphates, bicarbonate ions, sodium, magnesium, and calcium. Antecedent precipitation positively correlates with δ2H and nitrates but negatively with sulphates and sodium. EC shows positive (negative) correlations with δ2H and nitrates (sulphates and sodium), respectively, with varying patterns along different sections and tributaries. The 5-day antecedent rainfall exhibits the highest correlations with tracer compositions, particularly for EC, δ2H, and nitrates. The obtained results suggest the importance of an interdisciplinary approach in the analysis of the hydrological and geochemical connectivity of temporary stream networks.

How to cite: Marchina, C., William, A., Ylenia, G., Marco, B., and Giulia, Z.: Exploring tracer dynamics at different spatial scales in a pre-Alpine catchment with a temporary stream network, EGU General Assembly 2024, Vienna, Austria, 14–19 Apr 2024, EGU24-12388, https://doi.org/10.5194/egusphere-egu24-12388, 2024.

EGU24-12911 | PICO | HS2.1.1 | Highlight

Flow intermittence patterns in European river networks under climate change: Assessing temporal and spatial changes 

Annika Künne, Louise Mimeau, Alexandre Devers, Sven Kralisch, Flora Branger, and Jean-Philippe Vidal

Climate change is driving a global shift in river hydrology. Future climate projections estimate that global warming will result in more frequent and intense hydrological droughts in certain regions of the world, including Europe. However, there are currently very few studies investigating the impact of climate change in non-perennial rivers, which are home to a rich aquatic biodiversity and may be particularly vulnerable to an increase in droughts. To comprehend the impact of climate change on drying river networks and its consequences on biodiversity, functional integrity and ecosystem services, it is paramount to model and project flow intermittence under climate change.

In this study, we assess flow intermittence patterns and transitions in six distinct European River Networks from the DRYvER project case studies (Datry et al. 2021), situated in diverse biogeographic regions including Spain, France, Croatia, Hungary, Czech Republic, and Finland. Encompassing watershed areas ranging from 150 km² to 350 km², we employed a hybrid modeling technique to predict spatio-temporal patterns of flow intermittence (Mimeau et al. 2023). Climate projection data were used to force the hybrid models, enabling an evaluation of future changes. Additionally, flow intermittence indicators reflecting impacts on ecological processes were jointly developed in the DRYvER project and computed to assess changes and trends in recent years from 1960 to 2021 and for projected periods up to 2100.

Results indicate that projected drying patterns expand temporally and spatially. Temporally, the increase is related to a higher frequency of ceasing streamflow, but also to prolonged individual drying events. Shifts in the seasonality of flow cessation were also observed, with flow intermittence occurring in atypical seasons, such as winter, and typical drying maxima in summer transitioning to an earlier onset in spring with later ends or second maxima in autumn. Spatially, the increase is related to both, the overall river length affected by flow intermittence and the increase of connected reaches affected by flow cessation, which in turn increases the patchiness of the river network. All streamflow intermittence indicators simulated for the six case studies in the past and future projections can be explored on the interactive web application DRYvER-Hydro (https://dryver-hydro.sk8.inrae.fr/). Besides, the calculated indicators can be utilized by other DRYvER partners for further ecological analysis and modeling. For instance Vilmi et al. (2023) used these indicators, among other data, to assess algal, fungal, bacterial, macroinvertebrate, and fish metacommunities.

This research provides valuable insights into the dynamic interactions between climate change and river hydrology, emphasizing the urgent need for adaptive strategies to mitigate the consequences on water resources, biodiversity, and ecosystem services in European river systems.

References:

Datry et al (2021) Securing Biodiversity, Functional Integrity, and Ecosystem Services in Drying River Networks (DRYvER). Res Ideas Outcomes 7:. https://doi.org/10.3897/rio.7.e77750

Mimeau et al (2023) Flow intermittence prediction using a hybrid hydrological modelling approach : influence of observed intermittence data on the training of a random forest model. 1–30. https://doi.org/10.5194/egusphere-2023-1322

Vilmi et al (2023) D2 . 6 : A report on meta-community spatio-temporal models and meta-community patterns across the six focal DRNs in Europe. https://www.dryver.eu/results/reports-and-documents

How to cite: Künne, A., Mimeau, L., Devers, A., Kralisch, S., Branger, F., and Vidal, J.-P.: Flow intermittence patterns in European river networks under climate change: Assessing temporal and spatial changes, EGU General Assembly 2024, Vienna, Austria, 14–19 Apr 2024, EGU24-12911, https://doi.org/10.5194/egusphere-egu24-12911, 2024.

EGU24-15164 | ECS | PICO | HS2.1.1

Development of low-cost soil moisture sensor to capture the response of headwater streams in lower Himalayan region 

Deependra Choudhary, Sumit Sen, and Rahul Kulkarni

A comprehensive exploration of streamflow dynamics at the watershed scale in non-perennial rivers is an arduous task. In the lower Himalayan region, the presence of numerous intermittent and ephemeral streams contributes to high volume of water for small duration and transports significant amount of sediment to downstream. Fluvial alterations reshape stream geomorphology, triggering flash floods. To map those head water streams, a comprehensive study within the lower Himalayan watershed of area 56.61 km2 has been done by developing the low-cost capacitive soil moisture sensors. This real time monitoring sensor is a microcontroller-based system and an indirect method for indicating the soil moisture content. These sensors have been strategically deployed across three distinct sub-watersheds within the headwater watershed to capture the continuous soil moisture response during the monsoon period in 2023. For analyzing this study, on-field data was collected from automated weather stations (AWS) to obtain rainfall data, which was complemented by the utilization of stage-discharge curves for a more thorough understanding of discharge fluctuation. During 2023 monsoon period 9 rainfall events were recorded and identified as small, medium, and high to get the rainfall- runoff relationship with antecedent moisture condition (AMC). From the analysis different signatures in capacitance value are found to be affected by several factors which include slope, % area, stream order and land cover. These thresholds will aid in accurately mapping streams, and by quantifying discharge capacity, sediment transportation analyses can be facilitated in future. This study will enhance management strategies for sediment transport and ecological health within the high-gradient headwater watersheds. 

How to cite: Choudhary, D., Sen, S., and Kulkarni, R.: Development of low-cost soil moisture sensor to capture the response of headwater streams in lower Himalayan region, EGU General Assembly 2024, Vienna, Austria, 14–19 Apr 2024, EGU24-15164, https://doi.org/10.5194/egusphere-egu24-15164, 2024.

EGU24-15302 | ECS | PICO | HS2.1.1

Combining citizen science data and the hierarchical structuring of temporary streams to reconstruct the patterns of channel wetting and drying 

Mirjam Scheller, Nicola Durighetto, Ilja van Meerveld, Jan Seibert, and Gianluca Botter

Temporary streams (i.e., non-perennial streams) cover more than half of the global stream network. They are highly dynamic systems and important habitats. Still, they have so far not been thoroughly monitored because gauging stations are expensive, not well suited for measuring zero flows, and provide only data for a single location in the stream network. An alternative way to monitor temporary streams is by visual assessment. However, on-the-ground surveys of stream networks tend to be highly time-consuming. Hence, visual observations by citizen scientists provide a great opportunity to collect high spatial- and temporal resolution data, even though there are challenges regarding the accuracy and irregularity of the observations.

To assess the potential of citizen science data to obtain temporal resolved information on the state of temporary streams, we used the observations submitted by citizen scientists using the CrowdWater app for 63 locations on a 5 km2 forested hill in Zurich, Switzerland. The number of observations per location during the last three years varied from 1 to 257 (median: 40). There was at least one stream state observation for 402 days, with a maximum of 42 observations per day and a median of 10 observations per day. In addition, trained staff monitored 59 streams (30 overlap with the citizen science data set) at an almost bi-weekly resolution during six months (24 days of observations at all 59 points).

The hierarchical structure of channel network dynamics postulates the existence of a fixed, unique order according to which stream segments are activated during network expansion (from the most to the least persistent). To understand the hierarchical structure of stream wetting and drying at the study site, we applied the graph-based method developed by Durighetto et al. (2023) on the available data. This data-driven method would allow us to fill the gaps of the irregular citizen science data (leading to 25,728 reconstructed observations compared to the 4,354 original observations). The hierarchical structures for the two datasets differed, even if only locations that were part of both data sets and the same period were used to determine the hierarchical structure. In the citizen science dataset, the order of activation of the observed stream locations is less clearly identifiable (i.e., more uncertain). This is likely due to the non-systematic and sporadic nature of the data, i.e., only a few stream observations on the same date, as well as errors in the data. Nonetheless, this information can be used to give guidance to the citizen scientists on which streams to observe more frequently because they provide the most crucial information about the wetting and drying patterns of the network.


Reference: Durighetto, N., Noto, S., Tauro, F., Grimaldi, S., & Botter, G. (2023). Integrating spatially-and temporally-heterogeneous data on river network dynamics using graph theory. Iscience, 26(8).

How to cite: Scheller, M., Durighetto, N., van Meerveld, I., Seibert, J., and Botter, G.: Combining citizen science data and the hierarchical structuring of temporary streams to reconstruct the patterns of channel wetting and drying, EGU General Assembly 2024, Vienna, Austria, 14–19 Apr 2024, EGU24-15302, https://doi.org/10.5194/egusphere-egu24-15302, 2024.

EGU24-16251 | ECS | PICO | HS2.1.1

Using a hybrid hydrological modelling approach to simulate drying patterns in 3 non-perennial European river networks 

Louise Mimeau, Annika Künne, Flora Branger, Sven Kralisch, Alexandre Devers, and Jean-Philippe Vidal

Intermittent and ephemeral streams account for more than half of the world’s river channels, yet their hydrological functioning remains understudied. Modelling non-perennial river systems can help understanding the spatio-temporal patterns of drying and rewetting, but is challenging due to limited monitoring in intermittent river networks.

This study is part of the EU-funded project DRYvER, which aims to understand the repercussions of drying river networks for biodiversity, functional integrity, and ecosystem services (Datry et al. 2021). Here we propose a novel hydrological modelling approach using the J2000 distributed hydrological model (Krause et al. 2006), coupled with a Random Forest classification model, to predict daily and spatially distributed flow conditions (flowing or dry). The hybrid flow intermittence model is trained using observed flow condition data from diverse sources, such as water level measurements, photo traps, remote sensing, and citizen science applications (Mimeau et al, 2023). We evaluate the model's performance in three European River Networks in Finland, France, and Spain.

Results show that the hybrid flow intermittence model accurately predicts the drying events, with a probability of prediction of a drying event above 0.9 for the French and Finnish study cases. The spatio-temporal patterns of flow intermittence are contrasted among the 3 study cases: while the model simulates a few drying episodes during the summer season in the Finnish case study, mainly in the small upstream tributaries, it also simulates more complex drying patterns in the French and Spanish case studies, with drying episodes occurring throughout the year and drying events in the main river sections.

Additionally, we provide insights on the role of the observed data used to train the model on the simulated flow intermittence patterns. Results indicate that the quantity of observed data, as well as their temporal distribution, their spatial location in the river network, and the representativeness of the observed flow condition can have a significant impact on the simulation performance of flow intermittence. This study shows that combining different sources of observed flow condition data can help to reduce the uncertainty in predicting flow intermittence.


Datry et al. (2021) Securing Biodiversity, Functional Integrity, and Ecosystem Services in Drying River Networks (DRYvER). Research Ideas and Outcomes. https://doi.org/10.3897/rio.7.e77750.

Krause et al. (2006) Multiscale investigations in a mesoscale catchment: hydrological modelling in the Gera catchment. Advances in Geosciences. https://doi.org/10.5194/adgeo-9-53-2006.

Mimeau et al. (2023) Flow intermittence prediction using a hybrid hydrological modelling approach: influence of observed intermittence data on the training of a random forest model, EGUsphere [preprint], https://doi.org/10.5194/egusphere-2023-1322.

How to cite: Mimeau, L., Künne, A., Branger, F., Kralisch, S., Devers, A., and Vidal, J.-P.: Using a hybrid hydrological modelling approach to simulate drying patterns in 3 non-perennial European river networks, EGU General Assembly 2024, Vienna, Austria, 14–19 Apr 2024, EGU24-16251, https://doi.org/10.5194/egusphere-egu24-16251, 2024.

EGU24-16283 | ECS | PICO | HS2.1.1

How drought can affect river network dynamics in a central Germany lowland river catchment 

Yao Li, Seifeddine Jomaa, Gunnar Lischeid, and Michael Rode

River network is usually not a static item. More than half of global river exhibit an intermittent pattern, ceasing to flow during drought and rewetting again as the environment getting wetter seasonally. Recently, climate change has led to intensified droughts in central and southern Europe, causing even perennial streams to transition to intermittent flow patterns. Understanding and estimating to what extent drought can affect river network expansion and contraction is important and remains challenging.

This study aims to link river network dynamics and subsurface flow and to identify the potential influence of prolonged drought periods on the groundwater-river connection, and concomitant river network dynamics changes. To this end, we have coupled a fully-distributed hydrological model (mHM) with a groundwater model (Modflow) to investigate how prolonged droughts affect river network dynamics at the meso-catchment scale. The model was implemented in the Bode catchment, spanning 3200 km² in central Germany, from 2000 to 2022, in which the period 2018-2022 is considered as drought. We calibrated the model using discharge and groundwater table depth data from 2004 to 2008. Subsequently, we validated it using observations of discharge, groundwater table depth, and river dryness and wetness from 2009 to 2022.

The results demonstrate that the model could reproduce the dryness and wetness of river networks. For the groundwater-river exchange, the length of streams with net water loss increased by 6% in the period 2018-2022 compared to 2004-2017. For the river network dynamics, temporally, total river network length shows an apparent decline. The mean and minimum river network length during recent drought years (2018-2022) decreased by 10.4% and 10.9% compared to 2004-2017, respectively. While the maximum river network of each year was reduced only by 4.37%.  Spatially, the decline of river network length mainly occurs in first and second order streams (60.2% and 25.8%). Further analysis of stream persistence shows that approximately 3% of stream reaches shift from perennial to intermittent pattern and around 8% of stream reaches transfer from intermittent pattern to permanently dry due to the drought from 2018 to 2022. This is likely not only to harm aquatic biota but to have a major impact on stream biochemistry as well.

How to cite: Li, Y., Jomaa, S., Lischeid, G., and Rode, M.: How drought can affect river network dynamics in a central Germany lowland river catchment, EGU General Assembly 2024, Vienna, Austria, 14–19 Apr 2024, EGU24-16283, https://doi.org/10.5194/egusphere-egu24-16283, 2024.

EGU24-17373 | ECS | PICO | HS2.1.1

Estimating the duration of flow status along non perennial rivers by satellite data 

Carmela Cavallo, Maria Nicolina Papa, Giovanni Negro, Massimiliano Gargiulo, Giuseppe Ruello, and Paolo Vezza

At present there is a great lack of hydrological information on non-perennial rivers. In many cases, there is no knowledge of which river reaches are subject to non-flow periods, and the duration of non-flow and dry periods remains unknown. Few hydrometric stations are present along non-perennial rivers, and these stations provide point information, limiting the ability to describe the flow conditions across a river reach. For example, they do not allow to distinguish a continuous line of flow from an isolated pools condition. In contrast, approaches based on field surveys or citizen science can provide information on flow condition over entire river reaches but their temporal resolution is generally poor. Within this framework, satellite remote sensing provides significant opportunities due to the possibility of monitoring large areas with high temporal resolution. However, the use of satellite images for monitoring non-perennial river regimes has so far been limited by the availability of images with adequate spatial resolution and their accessibility in terms of cost. Multispectral satellite data freely distributed by the European Space Agency's Copernicus Sentinel-2 mission, with a spatial resolution of 10 m and an acquisition frequency of approximately five days, represent an appropriate trade-off point for monitoring non-perennial rivers with active channels not covered by vegetation and larger than about 40 m.

In this study, we investigated the capability of Sentinel-2 data to differentiate among three flowing states of non-perennial rivers: "flowing" (F), "ponding" (P), and "dry" (D). The analysis was performed for 5 reaches of the streams Sciarapotamo, Mingardo and Lambro (Campania region, Italy). By analyzing the spectral signatures of land cover within river corridor, we identified the bands in which land cover classes are most differentiated. Utilizing these specific bands, we created a false-color image in which the pixels covered by water stand out from the background. The comparison between false color images and field acquired ground truth showed very good agreement. For all the archive data (since 2015) we identified one of the three possible flowing status: F, P and D. The acquired dataset was utilized to train a Random Forest model capable of predicting the daily occurrence of specific flowing statuses (F, P, D), using spatially interpolated rainfall and air temperature data as predictors. The model demonstrated strong performance in terms of accuracy (ranging from 82% to 97%) and true skill statistic (ranging from 0.65 to 0.95). In each of the five years of the observation period, all the reaches underwent no-flow condition for at least a few days and in some cases up to four months. Three of the five reaches were completely dry each year while the other two never dried completely. With its ability to monitor the presence of water in a cost-effective manner, this method has the potential to significantly improve the knowledge on non-perennial rivers regimes.

How to cite: Cavallo, C., Papa, M. N., Negro, G., Gargiulo, M., Ruello, G., and Vezza, P.: Estimating the duration of flow status along non perennial rivers by satellite data, EGU General Assembly 2024, Vienna, Austria, 14–19 Apr 2024, EGU24-17373, https://doi.org/10.5194/egusphere-egu24-17373, 2024.

EGU24-17603 | PICO | HS2.1.1

Process-based 3D groundwater flow model to simulate current and future stream intermittence in headwaters 

Ronan Abhervé, Clément Roques, Jean-Raynald de Dreuzy, Thibault Datry, Philip Brunner, Laurent Longuevergne, and Luc Aquilina

While the role of climate conditions in controlling streamflow intermittence is well recognised, the assessment and modelling of the role of groundwater remains a challenge. In this study, we use process-based 3D groundwater flow models to simulate stream intermittency in groundwater-fed headwaters. Streamflow measurements and stream network maps are considered together to constrain the effective hydraulic properties of the aquifers. The modelling framework has been applied and validated in pilot catchments with unconfined crystalline aquifers (France) with contrasting geomorphological settings. We present the calibration framework, the analysis of uncertainties and discuss the underlying mechanisms governing the different dynamics of streamflow intermittency. The models are then used to predict streamflow intermittence under future climate scenarios. Intuitively, with decreasing recharge rates, systems with lower storage capacities lead to higher water table fluctuations, increasing the proportion of intermittent streams and reducing future perennial flows. However, the pilot sites reveal nuanced feedback mechanisms among future climate variations, groundwater recharge dynamics, and stream intermittence, where the geomorphic characteristics of the landscapes are key to regulating these feedbacks.

How to cite: Abhervé, R., Roques, C., de Dreuzy, J.-R., Datry, T., Brunner, P., Longuevergne, L., and Aquilina, L.: Process-based 3D groundwater flow model to simulate current and future stream intermittence in headwaters, EGU General Assembly 2024, Vienna, Austria, 14–19 Apr 2024, EGU24-17603, https://doi.org/10.5194/egusphere-egu24-17603, 2024.

EGU24-2269 | ECS | Orals | HS2.1.4

Role of groundwater during hydrological extremes in the glaciated and snow-fed high Alpine catchment under climate change 

Xinyang Fan, Florentin Hofmeister, Bettina Schaefli, and Gabriele Chiogna

Groundwater plays a pivotal role in the water cycle but its interplay with hydrological processes has often been neglected or overly simplified in hydrological models of high-elevation catchments. This may increase uncertainties in future projections and impede a holistic understanding of the hydrological changes. High Alpine catchments, in fact, display complex surface and subsurface processes and lack of observations. Here, we investigate the role of alpine groundwater in the hydrologic response by partitioning the observed streamflow variations to glacier recessions, snowmelt, rainfall, and for the first time - groundwater fluxes at the Martell valley in Italy since the 2000s. To examine the dynamic interactions of these components in detail, we adopt a modeling framework that combines the physics-based model WaSiM (with an integrated groundwater module) with meteorological inputs obtained from the weather model WRF. Extensive field observations (meteorology, hydrology, geomorphology, piezometric levels, stable water isotopes) are collected to constrain the hydrological model parameters and for model evaluation. This study quantifies the contribution of groundwater in moderating the intensity and timing of hydrological extremes (high and low flows) in the selected high-elevation catchment and emphasizes the significance of groundwater in sustaining water availability in this sensitive environment subject to climate change.

How to cite: Fan, X., Hofmeister, F., Schaefli, B., and Chiogna, G.: Role of groundwater during hydrological extremes in the glaciated and snow-fed high Alpine catchment under climate change, EGU General Assembly 2024, Vienna, Austria, 14–19 Apr 2024, EGU24-2269, https://doi.org/10.5194/egusphere-egu24-2269, 2024.

EGU24-3373 | ECS | Orals | HS2.1.4

Spatio-temporal evolution of glacial lakes in the Upper Ganga basin, Central Himalayas 

Atul Kumar, Suraj Mal, and Udo Schickhoff

The rise in annual mean temperature due to anthropogenic climate change is causing faster melting and thinning of glaciers leading to the formation of new glacial lakes and the expansion of existing ones in the Himalayan region. This exponential growth of glacial lakes increases the availability of freshwater resources and escalates the risk of future Glacial Lake Outburst Floods (GLOFs).
In the present study, Glacial lake inventories for the Upper Ganga basin were generated at the sub-basin level for 1990, 2000, 2010 and 2020 using Landsat (TM and OLI) images and semi-automated methods to understand the evolution of glacial lakes, altitudinal, orientational and typology changes. We were able to map 2,554 (area: 170.15 sq. km) glacial lakes in 1990, 2,783 (area: 191.03 sq. km) in 2000, 2,834 (area: 201.44 sq. km) in 2010, and 3,118 (area: 210.87 sq. km) in 2020. Between 1990 and 2020, the total number of glacial lakes increased by 564 (22.08%) and the total area increased by 40.72 sq. km (23.93%). In the year 2020, glacial lakes were found in 31 sub-basins of the Upper Ganga basin, out of 31 sub-basins, Arun sub-basin had the maximum number of glacial lakes (n: 734 & area: 61.66 sq. km).
The mean elevation of glacial lakes increased from 5,044.81 m asl (1990) to 5,052.30 m asl (2020), showing an increase of 7.49 m asl. In 2020, the majority of the glacial lakes were distributed in the elevation zone of 5,000-5,500 m asl (n:1,404 & area: 113.79 sq. km). In the upper Ganga basin, majority of the glacial lakes were south-facing (491) in 2020.
End moraine-dammed (M(e)) lakes dominate among differnt types of glacial lakes. In 1990, there were 2,081 (M(e)) lakes, which increased to 2,413 in 2020, indicating towards increasing risk of future Glacial Lake Outburst Floods (GLOFs) in the Upper Ganga basin. 
Therefore, the present study provides vital insights into the glacial lake dynamics of the Upper Ganga basin at the sub-basin level and will help in identifying potentially dangerous glacial lakes and developing robust policies to mitigate the impact of future GLOF events.

How to cite: Kumar, A., Mal, S., and Schickhoff, U.: Spatio-temporal evolution of glacial lakes in the Upper Ganga basin, Central Himalayas, EGU General Assembly 2024, Vienna, Austria, 14–19 Apr 2024, EGU24-3373, https://doi.org/10.5194/egusphere-egu24-3373, 2024.

Runoff from the Tibetan Plateau (TP), known as the Asian water tower, is crucial to regional hydrological processes and the availability of water for large population living downstream. Climate change, especially marked atmospheric warming and altered precipitation patterns, have significantly affected the cryospheric hydrological process in the TP, particularly runoff. However, it is still unclear to what extent precipitation and temperature contribute to runoff change on the TP and the regional variability is not well understood. In this study, a large-scale, high-resolution, and well-calibrated distributed hydrological model was employed to simulate the long-term runoff of the TP over the past six decades (1961-2019). Then, spatiotemporal characteristics of runoff were analyzed. Furthermore, the impacts of precipitation and temperature on runoff variation were quantitatively estimated. The results found that the annual runoff decreased from southeast to northwest, and has been increasing over the past six decades. Notably, precipitation is a more important contributor than temperature across the plateau, contributing 72.08 % and 27.92 % to the runoff change, respectively. Besides, the influence of precipitation and temperature on runoff varies among basins, with the Daduhe Basin and the Inner Basin being the most and least influenced by precipitation, respectively. This research analyses historical runoff changes and provides insights into the contributions of climate change to runoff on the TP, which helps understand the hydrological response to climate change in mountain regions.

How to cite: Wang, Y. and Ye, A.: The quantitative attribution of climate change to runoff increase over the Tibetan Plateau, EGU General Assembly 2024, Vienna, Austria, 14–19 Apr 2024, EGU24-3551, https://doi.org/10.5194/egusphere-egu24-3551, 2024.

EGU24-3824 | Posters on site | HS2.1.4

Characterizing the environmental and geochemical landscape of rock glacier outflows in the Intermountain West, USA 

Jeffrey Munroe, Matthew Morriss, Greg Carling, Debra Finn, Lusha Tronstad, and Scott Hotaling

The global cryosphere is rapidly changing in response to climate warming.  Rock glaciers may be more resilient to climate change than their surface ice and snow counterparts.  However, unlike surface ice features, rock glaciers are comprised of complex mixtures of ice and locally sourced rock, which may be tightly connected to local hydrologic conditions.  This close hydrogeologic connection appears to underlie substantial variability in the environmental conditions of streams associated with rock glaciers, even within the same geographic region.  Here, we analyze 13 years of field data (2011-2023) from 10 rock glaciers and 13 related ice features from four mountain ranges in Wyoming and Utah, USA, to characterize the environmental and geochemical landscape of their outflows.  Specifically, we compare water temperature, geochemistry, conductivity, and isotopic signatures (δ18O and δD) across mountain ranges and ice features.  We find an average surface water temperature of 0.97 ± 1.1 °C across all 10 rock glacier sites from all 13 years; -0.80 ± 0.82 °C at five glacier fed sites, and 1.21 ± 1.88 °C at six snowmelt fed sites.  Preliminary data from two summers of observations also reveal a consistent positive trend in specific conductivity of two rock glacier-fed streams, typical of water transitioning from snowmelt-dominated to ice-melt dominated sources.  Our results highlight the considerable variability in these ecosystems, even within mountain ranges, and underscore the need for wider sampling to better contextualize and monitor them in the future.  This context is critical when considering whether rock glaciers will promote resiliency of coldwater habitat under climate change, and the degree to which their contribution to alpine hydrologic systems may affect biodiversity and drinking water quality as contributions from snow and glacier ice decrease.

How to cite: Munroe, J., Morriss, M., Carling, G., Finn, D., Tronstad, L., and Hotaling, S.: Characterizing the environmental and geochemical landscape of rock glacier outflows in the Intermountain West, USA, EGU General Assembly 2024, Vienna, Austria, 14–19 Apr 2024, EGU24-3824, https://doi.org/10.5194/egusphere-egu24-3824, 2024.

EGU24-3961 | ECS | Posters on site | HS2.1.4

Open questions regarding the influence of topography on the terrestrial water cycle 

Sebastian Gnann, Jane Baldwin, Mark Cuthbert, Tom Gleeson, Wolfgang Schwanghart, and Thorsten Wagener

Topography affects the distribution and movement of water on Earth, but exciting puzzles remain and new discoveries regarding topographic controls continue to surprise us. In this contribution, we discuss some open questions regarding the influence of topography on the terrestrial water cycle based on a combination of literature review and data synthesis. How will changes in water and energy supply along elevation gradients translate into changes in actual evaporation, and how will this be modulated by plant physiological responses and topographically driven moisture redistribution? What role does groundwater play in sourcing the world's water towers, and how will this role change with melting of snowpacks and glaciers? What is the relative importance of topography (vs. climate and geology) in driving groundwater flow dynamics across scales, and how does topography influence inter-catchment groundwater flow or mountain block recharge? A key feature emerging from these questions is the presence of numerous interacting gradients and contrasts that explain many of the patterns we observe. Studying these interactions, and thus answering at least some of the questions posed above, has the potential to improve our understanding of hydrological systems and how they may evolve in the wake of global change.

How to cite: Gnann, S., Baldwin, J., Cuthbert, M., Gleeson, T., Schwanghart, W., and Wagener, T.: Open questions regarding the influence of topography on the terrestrial water cycle, EGU General Assembly 2024, Vienna, Austria, 14–19 Apr 2024, EGU24-3961, https://doi.org/10.5194/egusphere-egu24-3961, 2024.

EGU24-4092 | ECS | Posters on site | HS2.1.4

Cryosphere-groundwater connectivity in the mountain water cycle - where does meltwater go? 

Marit Van Tiel, Caroline Aubry-Wake, and Lauren Somers and the Mountain cryosphere-groundwater interactions working group

Both the mountain cryosphere -- comprising glaciers, snow, and permafrost -- and groundwater play crucial roles in shaping the hydrological cycle. However, their connectivity is not well understood. Understanding the importance of sub-surface meltwater flowpaths and the role of groundwater in mountain regions is critical to untangle 1) the fate of meltwater in the hydrological cycle and 2) the sensitivity of groundwater to a changing meltwater supply due to climate change.

Here, we synthesize studies which investigated the dynamics of meltwater flow through mountain aquifers. In general, snow-groundwater connectivity is better described than glacier-groundwater connectivity. However, estimations of meltwater recharge fluxes vary considerably across studies, which is not only a function of inherent catchment characteristics but also of the different methods used for the assessments. Estimates of the source contributions of mountain groundwater range between 2-60% for glacier melt and between 40-80% for snowmelt. These large numbers suggest that cryosphere-groundwater connectivity and the consequent delay in meltwater flow needs to be part of our conceptual understanding of the mountain water cycle. Still, there is a clear lack of understanding at which spatio-temporal scales this connection operates.

As glaciers retreat and snowpack diminishes, the relative importance of groundwater as catchment storage is expected to increase. This increase may however be partly compromised by declining recharge from the mountain cryosphere and changed recharge dynamics, with yet unknown effects on catchment-scale hydrological processes. We suggest a roadmap for future work to better quantify mountain cryosphere-groundwater connectivity and to predict climate change impacts on mountain water supplies.

How to cite: Van Tiel, M., Aubry-Wake, C., and Somers, L. and the Mountain cryosphere-groundwater interactions working group: Cryosphere-groundwater connectivity in the mountain water cycle - where does meltwater go?, EGU General Assembly 2024, Vienna, Austria, 14–19 Apr 2024, EGU24-4092, https://doi.org/10.5194/egusphere-egu24-4092, 2024.

In alpine catchments, evapotranspiration (ET) is regularly considered a minor component of the hydrological system and is therefore only rudimentarily regarded in modelling studies and climate change projections. The focus is usually on snow and glacier related processes, projecting a rapid retreat of glaciers in central Europe within the next few years and decreasing snow volumes at lower elevations due to climate warming. This leads to a reduction in the dominance of snow and glacier related processes. Changes in vegetation characteristics due to climate- and/or land use change will presumably lead to a relative increase in the importance of other processes such as ET, interception and soil moisture, which will affect spatial and temporal variations in discharge generation.

To identify spatial and temporal patterns of changing process importance, a case study of the Fundusbach catchment in Tyrol, Austria is conducted using the fully distributed and physically based model WaSiM-ETH. As the process representation within all hydrological models is affected by parameter equifinality, substantially different parameter combinations and therefore process representations can lead to similar values of performance criteria when looking at discharge only. To address this issue, elevation dependent, spatial and temporal parameter sensitivity analysis is coupled with a multi-objective calibration. This approach aims to improve the spatial and elevation dependent process representation within the model domain. Instead of calibrating on different output variables, additional field and remote sensing data are used to constrain the parameter space of individual submodels and thus the process behaviour. In a final step, the constrained model is calibrated against discharge. Based on this reference model, scenario analyses are carried out to investigate individual process responses to changes in climate and land use.

The results show, that integrating additional field data and constraining the calibration parameter space considerably improves the process representation within the model. Furthermore, first results show, that changes of the land cover do not influence the overall discharge regime, but ET and soil moisture. Increasing amounts of shrub cover limit infiltration and evaporation, while interception and soil moisture increase. Most process responses intensify with increasing elevation and reflect the spatial patterns of land cover.

How to cite: Herzog, A., Vormoor, K., and Bronstert, A.: Shifting hydrological process importance in alpine catchments: Combined effects of climate and land cover change on alpine evapotranspiration, EGU General Assembly 2024, Vienna, Austria, 14–19 Apr 2024, EGU24-4133, https://doi.org/10.5194/egusphere-egu24-4133, 2024.

EGU24-4160 | Orals | HS2.1.4

Water Availability Assessment in the Upper Colorado River Basin 

Matthew Miller, Natalie Day, Jesse Dickinson, John Engott, Casey Jones, Jacob Knight, Patrick Longley, Samuel Lopez, Melissa Masbruch, Morgan McDonnell, Olivia Miller, Noah Schmadel, Fred Tillman, and Daniel Wise

The lack of comprehensive water supply prediction capacity in most areas of the U.S. poses challenges in evaluating water availability. In order to improve water availability prediction and assessment, in 2019, the U.S. Geological Survey initiated planning efforts to intensively study five medium-sized basins throughout the U.S. over the next decade, including the Upper Colorado River Basin (UCOL). Research in the UCOL aims to provide insight into how past, present, and future snow conditions – including amount, timing, melt, and transitions from snow- to rain-dominated systems – impact water supply (quantity and quality) and the ability to meet demand. A specific emphasis is placed on how these processes affect water budget components and dissolved solids concentration and loading in the UCOL. A fully integrated groundwater-surface water hydrologic model (GSFLOW), and temporally dynamic dissolved solids models (SPARROW) that explicitly represent the groundwater contribution to dissolved solids loading to streams are being applied to meet the study objective. Comprehensive information on water diversion and groundwater pumping has been compiled and is being explicitly represented in the models to better represent human demand.  Temporal and spatial patterns in predicted water quantity and quality conditions are being evaluated in the context of past and projected future changes, summarized over 30-year time periods, in snow metrics.  Historical trends in multiple snow metrics, water budget components, groundwater levels, and dissolved solids provide context for evaluations of current conditions and motivation for further investigation and modeling. The tools and concepts developed in the UCOL will contribute to ongoing work in the other regional study basins as well as a forthcoming national water availability assessment. 

How to cite: Miller, M., Day, N., Dickinson, J., Engott, J., Jones, C., Knight, J., Longley, P., Lopez, S., Masbruch, M., McDonnell, M., Miller, O., Schmadel, N., Tillman, F., and Wise, D.: Water Availability Assessment in the Upper Colorado River Basin, EGU General Assembly 2024, Vienna, Austria, 14–19 Apr 2024, EGU24-4160, https://doi.org/10.5194/egusphere-egu24-4160, 2024.

EGU24-5085 | ECS | Posters virtual | HS2.1.4

Reservoir lakes in the Upper Harz Mountains (Germany): GIS Implementation and hydrochemical development 

Tanja Schäfer, Elke Bozau, and Alexander Hutwalker

Dam reservoirs were used for the continuous water supply to the ore mines in the Upper Harz Mountains. The first reservoirs were built in the 16th century. The dam heights reach up to 15 m and the stored water volumes are between 10,000 and 600,000 m3. There are about 70 of such lakes around Clausthal-Zellerfeld now. Hydrogeochemical data of the lakes have been investigated for about ten years (Bozau et al., 2015). A data management system combining GIS and hydrochemical data is prepared to facilitate data collection and interpretation.

The specific electrical conductivity (SEC) of the lake water ranges between approx. 30 and 280 µS/cm and can be used for the classification of these lakes. SEC lower than 50 µS/cm are typical for lakes mainly filled by rain water. SEC higher than 200 µS/cm are found in lakes near urban and anthropogenic influences. Due to the long dry periods of the last years an increase of the SEC is seen in the majority of lakes especially between spring 2015 and 2023. Because of extraordinary high precipitation in autumn 2023 this trend stagnates or even decreases in some lakes, but is still observable in the comparison between autumn 2015 and autumn 2023.

Especially those lakes with catchment areas strongly changed by forest decline are expected to show higher values of the SEC. In order to investigate this, spatial comparison with forest damage maps is planned. Furthermore, the concentrations of main ions will be investigated in addition to SEC values. Nitrate and potassium concentrations of the lake water should be the most sensitive indicators for forest decline and anthropogenic influences. A first evaluation of organic trace components (Bozau et al., 2022) did not confirm the classification based on the SEC.


Bozau, E., Licha, T., Stärk, H.-J., Strauch, G., Voss, I., Wiegand, B. (2015): Hydrogeochemische Studien im Harzer Einzugsgebiet der Innerste. Clausthaler Geowissenschaften, 10, 35-46.

Bozau, E., Licha, T., Warner, W. (2022): Natürliche und anthropogene hydrochemische Parameter der Oberharzer Bergbauteiche. FH-DGGV-Tagung, Jena, März 2022.

How to cite: Schäfer, T., Bozau, E., and Hutwalker, A.: Reservoir lakes in the Upper Harz Mountains (Germany): GIS Implementation and hydrochemical development, EGU General Assembly 2024, Vienna, Austria, 14–19 Apr 2024, EGU24-5085, https://doi.org/10.5194/egusphere-egu24-5085, 2024.

EGU24-5178 | ECS | Posters on site | HS2.1.4

Water Resources Assessment of the Mountainous Upper Syr Darya Catchment 

Lucas Alcamo, Timo Schaffhauser, Jingshui Huang, and Markus Disse

Water is a strategic and highly contested resource in Central Asia. This is exasperated by a highly uneven distribution of this resource within the region as most of the water originates from the high-mountainous regions. In this study we evaluate the current water resources of the highly mountainous headwaters of the Syr Darya River. Trends in hydrometeorological data are investigated and the dominant hydrological processes are studied using hydrologic modeling. The Syr Darya is one of the two tributaries of the Aral Sea, which has been of high interest due to its drastic decrease. The headwaters investigated in this study include the Naryn and Karadarya Rivers, which originate in the mountainous regions of Kyrgyzstan and flow into the Ferghana Valley where they form the Syr Darya River. The discharge regime is dominated by nivo-glacial processes and therefore highly susceptible to climate change.

Streamflow and climatological data spanning from 1889 until 2018 is statistically analyzed and evaluated with regard to trends and change points. For example, at the gauge in Naryn City, an increase in streamflow can be observed, while precipitation peaks tend to shift to earlier months. The observed temperature increase is above the global average.

For a more comprehensive understanding of the water resources of the region the fully revised version of the Soil Water Assessment Tool (SWAT+) is used to represent the hydrological cycle of the catchments. The model is calibrated using daily streamflow gauges at several locations. In addition, evapotranspiration is calibrated using remotely sensed data from the Global Land Evaporation Amsterdam Model (GLEAM). The model is driven by three different sets of reference data from three ensembles of General & Regional Circulation Models (GCM and RCM, respectively). In detail, we used one RCM, (REMO) and the two sets of GCMs from ISIMIP2 (Inter-Sectoral Impact Model Intercomparison Project) and ISIMIP3. The ISIMIP data is based on the 5th and 6th phase of the Coupled Model Intercomparison Project (CMIP5 and CMIP6), respectively. The different driving climatological data sets are investigated with respect to multiple variables essential for an understanding of the water resources, such as streamflow, evapotranspiration, snow and soil moisture. Besides, observed trends and signals are investigated with respect to their dominant physical controls.

How to cite: Alcamo, L., Schaffhauser, T., Huang, J., and Disse, M.: Water Resources Assessment of the Mountainous Upper Syr Darya Catchment, EGU General Assembly 2024, Vienna, Austria, 14–19 Apr 2024, EGU24-5178, https://doi.org/10.5194/egusphere-egu24-5178, 2024.

EGU24-6458 | ECS | Posters on site | HS2.1.4

A distributed rainfall-runoff model for the investigation of climate change effects on river floods in the European Alps 

Luca Lombardo, Juraj Parajka, Peter Valent, and Alberto Viglione

The worsening of global climate change has increased both the frequency and intensity of extreme weather events, significantly impacting the dynamics of flooding. This convergence of factors results in intensified and prolonged precipitation, leading to river overflow and catastrophic floods. Elevated temperatures and rapid snowpack melting further contribute to the increase of flood risk. These impacts are particularly pronounced in mountainous regions, where the combination of steep terrain and increased precipitation amplifies the risk of flash and snowmelt generated floods.

The CLIM2FLEX project aligns with this intricate and evolving context, aiming to assess, under potential climate scenarios, the variations in the frequency and intensity of river floods generated by various mechanisms. Within the project framework, a crucial aspect involves constructing a modeling chain, complete with a hydrological module. This component is dedicated to translating climate inputs into continuous discharge time series, enhancing the project's capacity for in-depth analysis and dynamic modeling.

To do so, the main idea is to use a "new version" of the "TUWmodel" conceptual hydrological model to account for the inter-basin transfer of water and flood waves propagation (from upstream catchments to downstream catchments) through the implementation of a new routing routine based on the introduction of a Nash-Cascade module. Different calibration strategies are used at gauged sites to estimate the best model parameters. A machine learning based regionalization approach (HydroPASS) is then applied to infer model parameters at ungauged sites for hydrological streamflow predictions. 

The focus of this study encompasses the entire Great Alpine Region (GAR), posing significant modeling challenges. The region is predominantly characterized by mountainous terrain, consisting mainly of small catchments. Here, the effects of snow accumulation-melting cycles, as well as the presence of glaciers and other small-scale features, play a particularly crucial role.

The presentation at EGU will delve into preliminary findings concerning the applicability and reliability of the proposed hydrological modeling chain structure, along with the anticipated future steps in the research.

How to cite: Lombardo, L., Parajka, J., Valent, P., and Viglione, A.: A distributed rainfall-runoff model for the investigation of climate change effects on river floods in the European Alps, EGU General Assembly 2024, Vienna, Austria, 14–19 Apr 2024, EGU24-6458, https://doi.org/10.5194/egusphere-egu24-6458, 2024.

EGU24-6606 | ECS | Orals | HS2.1.4

Exploring the connectivity between glacier melt, groundwater and climate change in the Cordillera Blanca, Peru 

Gavin McNamara, Caroline Aubry-Wake, Lauren Somers, Jeffrey McKenzie, John W. Pomeroy, and Robert Hellström

Glacier melt is known to provide an important source of water to streamflow in glacierized tropical regions, especially during the dry season. Groundwater also contributes a significant amount to streamflow. However, the linkage between the two is often unclear: How much groundwater originates from glacier melt? More broadly, how will groundwater and surface water contributions to streamflow change as glaciers retreat and climate changes? We developed a glacio-hydrological model in the Cold Region Hydrological Modelling platform to explore the complex interactions among the cryosphere, surface water, and groundwater in Peru's Cordillera Blanca, specifically in the Quilcayhuanca valley. The model uses meteorological observations from the valley and is parameterized using numerous data sources and process-based studies in the valley. Our findings reveal that during the dry season, 24 % of streamflow is routed through the groundwater reservoir, increasing to 40 % during the lowest flows. In a simulation without glaciers, streamflow discharge decreases by 34 % during the wet season and by 54 % during the dry season, with the groundwater contribution to streamflow decreasing by 55 % and 52 % for the wet and dry seasons, respectively. This simplified approach suggests that approximately half of the annual groundwater contribution to the stream originates from glacier wastage. We conducted sensitivity scenarios to evaluate the basin's resilience to the range of possible changes in precipitation, temperature and glacier cover expected by 2100. In a nearly deglaciated basin, the sensitivity to the range of tested temperature (+0 to 5 °C) produced a streamflow ranging from -60 to -49 % of current conditions in the dry season, and the range of tested precipitation (-20 % to +20 %) produced a streamflow ranging between -78 to -35 % of current conditions, indicating a larger sensitivity to potential changes in precipitation. Expected ratio changes were smaller during the wet season but followed a similar pattern. In the most likely scenarios by 2100, under RCP 8.5, wet season streamflow is predicted to decrease by 17 to 27 %, and dry season streamflow by 28 to 52 %. Despite a substantial decline in snow and ice contributions under climate change and deglaciation, the groundwater zone's contribution to streamflow shows relatively minor changes, demonstrating the low sensitivity of the groundwater system to climate shifts and glacier variations.

How to cite: McNamara, G., Aubry-Wake, C., Somers, L., McKenzie, J., Pomeroy, J. W., and Hellström, R.: Exploring the connectivity between glacier melt, groundwater and climate change in the Cordillera Blanca, Peru, EGU General Assembly 2024, Vienna, Austria, 14–19 Apr 2024, EGU24-6606, https://doi.org/10.5194/egusphere-egu24-6606, 2024.

EGU24-7718 | Orals | HS2.1.4

The peak water myth 

Walter Immerzeel and Francesca Pellicciotti

The peak water concept has emerged to represent the trajectory of future water resources from glacierised basins, and has been widely adopted by the glaciology community. This is based on the notion that runoff from glaciers will increase up to a point in the near future and then decrease, because the melt rates of glaciers per unit area increase due to higher temperatures, while glaciers shrink. There is a point in the future that the glacier area becomes so small that the increase in melt rate per unit area cannot compensate for the area loss, and the absolute amount of glacier melt water starts to decrease. This peak water concept has been featured by several prominent papers and by the IPCC. However, we hypothesize that this peak water concept is an oversimplification of reality and can mask the real trajectory of changes in water resources from mountain catchments. It is only a valid concept for a single glacier, and the effect largely disappears when a mountainous catchment consists of multiple glaciers with different size, thickness, and mass balance sensitivity as result of extensive debris cover, for example. Moreover, and more importantly, it ignores climate change impacts on the non-glacierised part of the mountainous catchment, such as the buffering by snow and groundwater storages and the role of vegetation, and shifts in the partitioning between “green” (evapotranspiration) and “blue” (river runoff) water in particular. In this talk, we show a few examples of such oversimplifications, and argue for a broader and holistic perspective on the impacts of climate change on mountain water resources.

How to cite: Immerzeel, W. and Pellicciotti, F.: The peak water myth, EGU General Assembly 2024, Vienna, Austria, 14–19 Apr 2024, EGU24-7718, https://doi.org/10.5194/egusphere-egu24-7718, 2024.

EGU24-9575 | Orals | HS2.1.4

Future glacier mass loss in the Tien Shan strongly impacts summer water availability  

Lander Van Tricht, Harry Zekollari, Matthias Huss, Inne Vanderkelen, Marit van Tiel, Loris Compagno, Philippe Huybrechts, and Daniel Farinotti

Glaciers in the Tien Shan act as natural reservoirs, storing freshwater in the form of snow and ice and releasing it during dry periods. This water source serves various purposes and is particularly crucial during dry periods, where it serves agriculture, hydropower, industry, and human consumption. Here, we use GloGEMflow to simulate the future evolution of all glaciers in the Tien Shan under CMIP6 SSP climate scenarios. In all climate scenarios, our results reveal an exceptionally pronounced retreat of the glaciers, surpassing the projected glacier loss for most regions of the world. By 2040, we project a loss of 30% of the glacier mass from 2020, which increases to 60% by 2100 under low emission scenarios (SSP1-1.9, SSP1-2.6) up to 90% under moderate to high emission scenarios (SSP3-7.0 and SSP5-8.5). This drastic retreat is driven by the unique climate of the Tien Shan, with most precipitation occurring during spring and early summer. Rising temperatures not only accelerate glacier melt but also reduce snow accumulation. Regardless of the scenario, we project that peak water from the glacier runoff will occur before 2050. By 2100, total annual glacier runoff decreases by 35% compared to the 2015-2020 mean level. The annual glacier runoff peak shifts from summer, when water demand is highest, to spring, presenting challenges for both agricultural and industrial sectors. We also examine and combine the simulated glacial runoff with information on water availability and demand from the ISIMIP framework. This helps to grasp and evaluate how important glacial meltwater is in the Tien Shan region. Our research provides essential insights for creating adaptive policies to handle water resources effectively at both local and regional level.

How to cite: Van Tricht, L., Zekollari, H., Huss, M., Vanderkelen, I., van Tiel, M., Compagno, L., Huybrechts, P., and Farinotti, D.: Future glacier mass loss in the Tien Shan strongly impacts summer water availability , EGU General Assembly 2024, Vienna, Austria, 14–19 Apr 2024, EGU24-9575, https://doi.org/10.5194/egusphere-egu24-9575, 2024.

EGU24-10041 | ECS | Orals | HS2.1.4

Control processes of diurnal streamflow cycles along the longitudinal profile of an alpine river 

Klaus Vormoor, Till Francke, Anna Herzog, and Axel Bronstert

Snowmelt or ice melt typically control diurnal streamflow cycles during rain-free periods in high-altitude alpine catchments. Evapotranspiration-controlled streamflow cycles are less prominent, but can occur simultaneously (Mutzner et al., 2015). In general, the importance of evapotranspiration for the water balance of alpine catchments is likely to increase due to changing atmospheric boundary conditions and (related) changes in land cover. In this study, we focus on controls of diurnal streamflow cycles in the Fundusbach catchment (13 km²) in the Ötztal Alps (Austria). In addition to the official gauge at the catchment outlet, we have installed three further gauges along the longitudinal river profile. Here, we are recording the variability in water level/discharge at high temporal resolution (15 min) since June 2022. We have also adapted the deterministic spatially distributed hydrological model WaSiM with hourly and high spatial resolution (25 x 25 m²) for the Fundusbach catchment. Based on this model and the observation data, we are able to

  • determine the diurnal streamflow dynamics and their change along the longitudinal profile,
  • analyze the seasonal dynamics of diurnal streamflow patterns, and thus,
  • draw conclusions about the spatially and temporally changing control variables of the diurnal streamflow cycles (data- and model-attributed) for rain-free periods outside winter.

Results show that (i) the diurnal streamflow variability decreases along the longitudinal profile, (ii) the amplitude of meltwater driven runoff cycles decreases exponentially over the year, whereby (iii) evapotranspiration-driven cycles always seem to attenuate meltwater-driven cycles. At later points in the snow-free season, the signal of the evapotranspiration-induced streamflow cycles can occasionally be inferred directly from the measurement data. For these days, catchment evapotranspiration amounts can be determined from runoff data as the integral between the daily maximum (during nighttime) and minimum (during daytime). The results also indicate an altitude-dependency of the control processes along the longitudinal profile, which needs to be further investigated.

Reference:

Mutzner, R., Weijs, S.V., Tarolli, P., Calaf, M.C., Oldroyd, H.J., Parlange, M.B. (2015): Controls on the diurnal streamflow cycles in two subbasins of an alpine headwater catchment. Water Resour. Res., 51, 3403-3418. doi.org/10.1002/2014WR016581.

How to cite: Vormoor, K., Francke, T., Herzog, A., and Bronstert, A.: Control processes of diurnal streamflow cycles along the longitudinal profile of an alpine river, EGU General Assembly 2024, Vienna, Austria, 14–19 Apr 2024, EGU24-10041, https://doi.org/10.5194/egusphere-egu24-10041, 2024.

EGU24-10334 | ECS | Orals | HS2.1.4

What is the monthly share of mountain water in lowland water abstractions? 

Sarah Hanus, Peter Burek, Mikhail Smilovic, Jan Seibert, and Daniel Viviroli

Mountainous areas play a crucial role in global water resources. Orographic precipitation provides mountains with disproportionately high precipitation, which can be stored seasonally or over many years as snow and ice. Therefore, mountains are often referred to as ‘water towers’, emphasising their vital contribution to water provision for human use. Nevertheless, on a global scale, knowledge about their relevance for lowlands is limited, especially beyond long-term annual averages (Viviroli et al., 2020). Therefore, this study aimed to first assess differences in the water supply of mountains and lowlands in large river basins globally. Second, the share of mountain runoff in lowland water abstractions was evaluated with a focus on monthly averages and intra- and interannual variability to identify hotspots of mountain importance.

Our study is based on global simulations of the large-scale hydrological model CWatM (Burek et al., 2020) at a resolution of 5arcmin (~10km) from 1990 to 2019. The model simulates water availability, water demand and water use. A glacier representation was added to depict mountain water resources more realistically (Hanus et al., submitted). We compared water availability and demand in mountain and lowland areas within each river basin to identify the distinct patterns regarding water quantity, seasonality and interannual variability in mountains. Additionally, we derived the share of mountain runoff in lowland surface water abstractions to explore the relevance of mountains for human water use.

The analysis of around 600 river basins globally confirmed that precipitation and runoff are disproportionally higher in mountain areas in most river basins, whereas water demand is comparatively low. Additionally, we found mostly a larger intra-annual variability and lower interannual variability in mountain runoff compared to lowland runoff.

The estimated share of mountain runoff in lowland surface water abstractions is largest in High Mountain Asia, western North America, parts of South America and Southern Europe. In 250 basins, the maximum monthly relative mountain runoff share in lowland surface water abstractions exceeds 10%, and 25% of the world population lives in the lowlands of these basins. In comparison, only 7% of the world's population lives in lowlands of basins where the long-term mean annual share of mountain runoff in lowland surface water abstractions exceeds 10%. Thus, the relevance of mountains for lowland water supply becomes more apparent when distinguishing between different months compared to long-term annual averages.

Burek, P., Satoh, Y., Kahil, T., Tang, T., Greve, P., Smilovic, M., Guillaumot, L., Zhao, F., and Wada, Y.: Development of the Community Water Model (CWatM v1.04) – a high-resolution hydrological model for global and regional assessment of integrated water resources management, Geosci. Model Dev., 13, 3267–3298, https://doi.org/10.5194/gmd-13-3267-2020, 2020.

Viviroli, D., Kummu, M., Meybeck, M., Kallio, M., & Wada, Y.: Increasing dependence of lowland populations on mountain water resources. Nature Sustainability3(11), 917-928, https://doi.org/10.1038/s41893-020-0559-9, 2020.

How to cite: Hanus, S., Burek, P., Smilovic, M., Seibert, J., and Viviroli, D.: What is the monthly share of mountain water in lowland water abstractions?, EGU General Assembly 2024, Vienna, Austria, 14–19 Apr 2024, EGU24-10334, https://doi.org/10.5194/egusphere-egu24-10334, 2024.

EGU24-11313 | Posters on site | HS2.1.4

Spatially distributed streamflow buffering by glaciers during recent droughts in Switzerland 

Pascal Buri, Michael McCarthy, Simone Fatichi, Philipp Brun, Dirk Karger, Liangzhi Chen, Massimiliano Zappa, Evan S. Miles, Thomas E. Shaw, and Francesca Pellicciotti

During dry and hot years in the Swiss Alps, melt water from glaciers can moderate streamflow deficits caused by reduced precipitation and enhanced evapotranspiration rates. However, little is known about how glacier melt water contribution to streamflow varies sub-seasonally and in space, especially further downstream from glacierized catchments, where additional streamflow contributions are modulated primarily by rainfall and the biosphere (vegetation, soils).

We study distributed catchment hydrology in Switzerland using a land surface model that constrains energy and mass fluxes using advanced physical representations of both cryospheric and biospheric processes at a 250 m spatial resolution. We simulate catchment runoff in Switzerland during the past 6 years, including two recent severe drought years (2018 and 2022), characterized by particularly warm summers and reduced precipitation. The model is forced with hourly observed meteorological data based on the weather station network SwissMetNet and the precipitation product RhiresD, and uses state-of-the-art land cover, soil characteristics, glacier area and debris thickness as initial conditions.

The spatially explicit simulations allow, when temporally aggregated, to trace upstream contributions of individual water balance components for any downstream point in the catchment. We use the model to quantify the amount and timing of glacier melt and how it affects downstream runoff composition, especially during drought conditions, along the river network. We do this across regions from the Swiss Alps’ headwaters to the lowlands in a spatially continuous way.

When comparing runoff composition during moderate summer months to periods of drought conditions in the Swiss Alps, our simulations show both an increase in intensity and downstream propagation of ice melt contribution to total runoff. During extreme drought periods, ice melt makes up >70% of streamflow (~doubling the contributions during more moderate periods) in some of the Alps’ headwater regions (>1500 m a.s.l.), and still exceeds 10% of streamflow contribution downstream of the pre-alpine region.

Quantifying the timing and amount of glacier melt contributions to downstream water resources under recent drought conditions improves our understanding of potential cryosphere-biosphere interactions and their impacts under future extreme scenarios, when cryospheric runoff contributions may be reduced or completely lost.

How to cite: Buri, P., McCarthy, M., Fatichi, S., Brun, P., Karger, D., Chen, L., Zappa, M., Miles, E. S., Shaw, T. E., and Pellicciotti, F.: Spatially distributed streamflow buffering by glaciers during recent droughts in Switzerland, EGU General Assembly 2024, Vienna, Austria, 14–19 Apr 2024, EGU24-11313, https://doi.org/10.5194/egusphere-egu24-11313, 2024.

EGU24-11621 | ECS | Orals | HS2.1.4

Exploring Neural Network Performance in Hydrological Modeling in a Mountainous Region of Morocco: A Case Study on LSTM and GRU Architectures for Runoff Prediction 

Karima Nifa, Abdelghani Boudhar, Haytam Elyoussfi, Youssra Eljabiri, Mostafa Bousbaa, Bouchra Bargam, and Abdelghani Chehbouni

This study thoroughly compared two types of neural networks, namely Long Short-Term Memory (LSTM) and Gated Recurrent Unit (GRU) recurrent neural networks (RNNs), within the context of hydrological modeling for predicting runoff in the Oum Er Rabia sub-basins. By assessing their performance on both daily and monthly scales, we aimed to understand the dynamics of runoff, which is crucial in water resources management. The combined analysis of predictions at both time scales provides a comprehensive perspective, using daily outputs for short-term decisions and monthly predictions for longer-term planning.

Using a hydroclimatic time series dataset from 2000 to 2019, incorporating key factors such as snow cover area, temperature, and rainfall that influence hydrological processes and significantly impact flow patterns, the research evaluates the predictive accuracy of the models at both scales. The results reveal nuanced differences in predictive accuracy, with average Kling-Gupta Efficiency (KGE) values for LSTM and GRU at daily and monthly scales, respectively, being 0.64, 0.52, and 0.46, 0.54. These findings provide insights into the strengths and limitations of each architecture in the mountainous region of Morocco.

The study enhances our understanding of the applicability of LSTM and GRU architectures in hydrological modeling, aiding practitioners in selecting models tailored to specific needs. By establishing a robust framework for short-term decision-making and long-term planning in water resource management, this research contributes to advancing predictive modeling and promoting sustainable water use while mitigating flood risks. The knowledge acquired paves the way for improved decision support in the critical area of water resource management.

How to cite: Nifa, K., Boudhar, A., Elyoussfi, H., Eljabiri, Y., Bousbaa, M., Bargam, B., and Chehbouni, A.: Exploring Neural Network Performance in Hydrological Modeling in a Mountainous Region of Morocco: A Case Study on LSTM and GRU Architectures for Runoff Prediction, EGU General Assembly 2024, Vienna, Austria, 14–19 Apr 2024, EGU24-11621, https://doi.org/10.5194/egusphere-egu24-11621, 2024.

EGU24-13616 | Orals | HS2.1.4

Hydrological implications of the Chile Megadrought in high mountain basins and lessons for climate adaptation. 

James McPhee, Diego Hernandez, Maria Courard, Alonso Mejías, Zelalem Tesemma, Alain Pietroniro, and John Pomeroy

La Niña years are historically associated with precipitation deficits in central Chile. However, since the onset of the so-called Chile Megadrought in 2010, the teleconnection between the El Niño-Southern Oscillation phases and the hydroclimate in central Chile has either weakened or disappeared. This study investigates the hydrological response of high mountain watersheds to La Niña (LN) and megadrought conditions (MD) in the Andes of central Chile (30°S – 35°S) through physically-based simulation of processes at the watershed scale. It is shown that during LN years, winters and summers are colder, but spring seasons are warmer, while in MD years the summers are warmer. In addition, the hydrologic response to LN and MD is distinct and amplified during MD in terms of flow deficit.  Simulation results for five snow-dominated basins within the central Andes suggest lower efficiency in the transformation of precipitation to snowmelt flow (-3.7% and 1.6% with respect to the long-term average, for MD and LN, respectively), accompanied by higher evaporation (8.7% and 6.1%) and lower flow (-9.3% and -3.4%) relative to annual precipitation. Also, snow accumulation deficits at the end of winter propagate (-36.2% and -17.7%) with respect to the deficit of solid precipitation (-29.7% and -17.5%) and total precipitation (-26% and -19.3%), and during the MD the duration of snow is shorter compared to LN (-16.3 and -10.6 days). Thus, the key role played by snow processes and their variability in the hydrological response to droughts in central Chile is highlighted. The findings presented here are expected to inform ongoing discussion on adaptation strategies to climate change, as the observed climate during the megadrought (2010-?) is strikingly similar, on average, to GCM projections for this region toward the end of the 21st century.

How to cite: McPhee, J., Hernandez, D., Courard, M., Mejías, A., Tesemma, Z., Pietroniro, A., and Pomeroy, J.: Hydrological implications of the Chile Megadrought in high mountain basins and lessons for climate adaptation., EGU General Assembly 2024, Vienna, Austria, 14–19 Apr 2024, EGU24-13616, https://doi.org/10.5194/egusphere-egu24-13616, 2024.

EGU24-13828 | ECS | Posters on site | HS2.1.4

Geological controls on groundwater chemistry in the Himalayan Indus River basin aquifers, India 

Poulomee Coomar, Suhail Lone Ahmed, Gh Jeelani, Saibal Gupta, and Abhijit Mukherjee

The upper Indus River basin aquifers spanning over the Himalayan, Karakoram, Hindu Kush ranges is a vast water scares region, which have escaped the notice of the groundwater scientists until recently. The work presented here aims to decipher the processes of groundwater-rock interactions in the shallow Trans-Himalayan Indus River basin aquifers of India. Located on the Indus-Tsangpo suture zone, the area provides a unique opportunity to study water-rock interaction processes in one of the coldest and highest inhabited regions of the world.

Alkaline to circumneutral groundwater are collected from wells mostly located in the meta basics and associated volcanoclastic of the Dras Volcanics (DV) and the granitoids and their extrusive equivalents of the Ladakh Plutonic Complex (LPC). Waters mostly belong to Ca-HCO3 and Ca-Mg-HCO3 facies. Ca-Na-HCO3 occurs as minor facies. Among bivalent cations Ca and Mg shows high degree of correlation, with a low Ca/Mg ratio. Ca-Mg-HCO3 relations suggest bivalents come from Ca-Mg pyroxenes and calcite of the meta-basalts, and calcic plagioclase. Ca-Mg pyroxenes are sourced from the DV, while Ca-feldspars only from the LPC, given the ones in DV are albitised. Decreasing trends of calcite saturation with Ca/Mg ratio hints secondary calcite precipitation. Among monovalent ions, Na + K versus SO42- + Cl- relations suggests, waters owe their Na content to silicates or cation exchange reactions when the ratio >1, and to inputs from saline springs or compounds when the ratio falls below unity. Nearly 60% of samples have Na in excess of Cl- (Na*), but only a minority of them correlates well with dissolved silica. However, thermodynamic calculations suggest waters are mostly in equilibrium with kaolinite, along with some Ca -, Na – smectites and in disequilibrium with all sorts of feldspars suggesting both Na- and K-feldspar weathering from both meta-basics and felsic lithologies. The absence of Na*-Si correlativity indicates simultaneous Na addition through ion-exchange processes or dissolution of non-halite hydrothermal precipitates; borax, trona, burkeite, being the most common. Lack of co-relation between Cl- and SO42- suggest dissimilarity in their provenance.  High Ca/ SO42- ratio precludes inputs from gypsum or anhydrite, so SO42- can only stem from sulphide oxidation or dissolution of sulphates like thenardite or jarosite, which are known to occur in vicinity of local hot springs.


How to cite: Coomar, P., Ahmed, S. L., Jeelani, G., Gupta, S., and Mukherjee, A.: Geological controls on groundwater chemistry in the Himalayan Indus River basin aquifers, India, EGU General Assembly 2024, Vienna, Austria, 14–19 Apr 2024, EGU24-13828, https://doi.org/10.5194/egusphere-egu24-13828, 2024.

EGU24-14340 | ECS | Posters on site | HS2.1.4

Hydrological response to droughts in the Karnali basin of Nepal 

Pranisha Pokhrel, Sonu Khanal, Jasper Griffioen, Thom A. Bogaard, and Walter Immerzeel

The Karnali basin (40,000 sq km) in western Nepal is a pristine river basin with large potential for the development of hydropower and irrigation. The Karnali river sustains the biodiversity in the national parks downstream and supports the livelihoods of thousands of people. Any changes in the flow regime of the Karnali may therefore have far reaching consequences. This study focuses on analyzing the hydrological response of the Karnali to (multi-year) droughts. The objective is to understand how long the storages in the hydrological system, e.g. glaciers, snow, ground and soil water can buffer prolonged droughts. The hydrological model SPHY, calibrated with long-term river flow observations, is used for this purpose. We created synthetic drought time series by sampling from a 30-year historical forcing dataset based on ERA5. We then used these time series to force the SPHY model and we analyzed the change in streamflow composition as a function of drought duration. This study provides important insights in the buffering capacity of the river basin in a changing climate.

How to cite: Pokhrel, P., Khanal, S., Griffioen, J., Bogaard, T. A., and Immerzeel, W.: Hydrological response to droughts in the Karnali basin of Nepal, EGU General Assembly 2024, Vienna, Austria, 14–19 Apr 2024, EGU24-14340, https://doi.org/10.5194/egusphere-egu24-14340, 2024.

EGU24-14594 | ECS | Orals | HS2.1.4

HBV Performance under complex and poorly gauged context 

Mohamed El Garnaoui, Abdelghani Boudhar, Ismail Karaoui, and Abdelghani Chehbouni

In North African countries where water scarcity and limited data prevail, employing predictive hydrological modeling is crucial to gain accurate insights into current and future water reserves. Hence, these models parameters exhibit instability in this context due to the climate variability observed through basins. Therefore, our efforts focus on using a combination of measured data, remote sensing information, and reanalysis data for calibration and validation, to check the improvement in the result accuracy. Through this study, we simultaneously investigate the spatiotemporal stability of the HBV model in several sub-catchments of Oum Er-Rbia Basin, by improving the performance of a bucket-type conceptual model. We created a Nested Cross-Validation (NCV) framework to assess spatiotemporal stability. The framework uses optimal parameters from a donor catchment of the Hydrologiska Byråns Vattenbalansavdelning (HBV) model as inputs for target catchment parameter ranges. In particular, we evaluated HBV's capacity for prediction over time and space, as well as its impact on model parametrization throughout the regionalization process in the setting of sparse data catchments. As results, the HBV model is spatially transferable from one basin to another, with NSE ranging from  0.5 to 0.8 and KGE values between 0.1 to 0.9, meaning a moderate to high performance. The HBV optimum parameter sets exhibit unpredictable behavior over space. On the contrary, their inter-annual behavior is nearly identical. It also detected a decrease in the model's predictive skills over time, which can be explained by the research area's tendency to dry out year after year. Furthermore, employing KGE for calibration rather than NSE improves model predictive performance significantly. The model  calibration process with the KGE outperformed those with the NSE metric, especially when simulating high flows. Furthermore, the findings demonstrate a significant relationship between high model performance and high values of several optimal parameter sets throughout the calibration and validation periods.

Keywords: HBV model, poorly gauged basin, arid and semi-arid region, KGE, NSE.

How to cite: El Garnaoui, M., Boudhar, A., Karaoui, I., and Chehbouni, A.: HBV Performance under complex and poorly gauged context, EGU General Assembly 2024, Vienna, Austria, 14–19 Apr 2024, EGU24-14594, https://doi.org/10.5194/egusphere-egu24-14594, 2024.

EGU24-14840 | ECS | Posters on site | HS2.1.4

Increased Precipitation Yet Decreased Runoff: Unveiling Hydrological Shifts in the Yellow River Source Region Through Permafrost, Snow, and Vegetation Dynamics 

Jiayong Shi, Juraj Parajka, Jianyun Zhang, Guoqing Wang, and Zhenxin Bao

This study presents a comprehensive analysis of the hydrological changes in the Yellow River source region, a key component of the Qinghai-Tibet Plateau's Three-River Source Region. During the period 1960-2020, we observed a significant increase in precipitation but paradoxically, a slight decrease in runoff. The region, characterized by its critical positioning at the boundary of permanent and seasonal permafrost, has undergone substantial environmental changes due to global warming. By integrating historical data and multi-source remote sensing, our research dissects the complex interactions between the altered permafrost, snow cover, and vegetation dynamics. We specifically examine how these changes influence the regional hydrological cycle, particularly focusing on the mechanisms leading to reduced runoff despite increased precipitation. Our findings provide novel insights into the impacts of climate change on high-altitude hydrological systems. They hold significant implications for water resource management and ecological conservation in the face of ongoing climatic shifts. This study contributes to the broader understanding of hydrological responses to environmental changes in sensitive mountainous regions.

How to cite: Shi, J., Parajka, J., Zhang, J., Wang, G., and Bao, Z.: Increased Precipitation Yet Decreased Runoff: Unveiling Hydrological Shifts in the Yellow River Source Region Through Permafrost, Snow, and Vegetation Dynamics, EGU General Assembly 2024, Vienna, Austria, 14–19 Apr 2024, EGU24-14840, https://doi.org/10.5194/egusphere-egu24-14840, 2024.

EGU24-15204 | ECS | Posters virtual | HS2.1.4

Uncertainties Analysis of the Hydrological Modelling in Himalayan Region: A Case Study of Alaknanda River Basin 

Sagar Gupta, Nikunj K. Mangukiya, Ashutosh Sharma, Sumit Sen, Ankit Agrawal, Domenico De Santis, Christian Massari, and Silvia Barbetta

Understanding natural processes, particularly the water cycle, is inherently challenging due to their unpredictable and complex nature. This complexity is especially pronounced when employing hydrological models, where simplifications introduce various uncertainties. Failing to acknowledge and address these uncertainties can introduce biases into the model outcomes, potentially influencing subsequent decision-making processes. This issue is particularly pertinent in the Indian Himalayan Regions, where significant contributions come from melting of snow and glaciers.  The uncertainties in both model inputs and structures are exacerbated in this region, which is further compounded by the scarcity of reliable data. Consequently, there is a critical need to systematically quantify the diverse sources of uncertainty to ensure accurate and reliable hydrological predictions. This study focuses on the snow-dominant Alaknanda basin within the Indian Himalayan Region (IHR), encompassing three gauging stations. The SWAT+ hydrological model and Modular Assessment of Rainfall-Runoff Models Toolbox (MARRMoT) framework (Trotter et al., 2022) are employed to assess parameter and model structure uncertainties, respectively. The SWAT+ model, calibrated with the Latin Hypercube Sampling (LHS) algorithm, achieved Nash-Sutcliffe Efficiency (NSE) values of 0.56, 0.79, and 0.61. Parameter uncertainty is further examined using diverse parameter sets generated through the LHS algorithm. Furthermore, with the application of 47 lumped conceptual models within MARRMoT framework, assessment of model structure uncertainty underscores the varying importance of processes, particularly snow storage, soil moisture, and routing storage in the study region. The findings reveal that the inclusion of additional storage components in the model leads to a decline in performance, accompanied by an increase in complexity and uncertainties. Notably, the study concludes that, for the investigated region, the contribution of parameter uncertainty surpasses that of model structure uncertainty. These insights emphasize the need for a nuanced understanding of both parameter and structural uncertainties to enhance the reliability of hydrological predictions in data-scarce and complex regions like the IHR.

References:

Trotter, L., Knoben, W. J. M., Fowler, K. J. A., Saft, M., & Peel, M. C. (2022). Modular Assessment of Rainfall–Runoff Models Toolbox (MARRMoT) v2. 1: an object-oriented implementation of 47 established hydrological models for improved speed and readability. Geoscientific Model Development, 15(16), 6359–6369.


How to cite: Gupta, S., Mangukiya, N. K., Sharma, A., Sen, S., Agrawal, A., Santis, D. D., Massari, C., and Barbetta, S.: Uncertainties Analysis of the Hydrological Modelling in Himalayan Region: A Case Study of Alaknanda River Basin, EGU General Assembly 2024, Vienna, Austria, 14–19 Apr 2024, EGU24-15204, https://doi.org/10.5194/egusphere-egu24-15204, 2024.

EGU24-16220 | ECS | Posters on site | HS2.1.4

Changes in predictive skills through coupling a hydrological modelling framework with a glacier model  

Justine Berg, Pascal Horton, Martina Kauzlaric, Alexandra von der Esch, and Bettina Schaefli

The Himalayan Mountain range has a substantial glacier cover, supplying melt water to local communities in the drier season for irrigation and human consumption. Effects of climate change on glacier retreat and therefore melt water availability are expected to be severe. An accurate representation of glacier processes is thus of great importance to predict water availability under future climate projections. Hydrological models focus mostly on processes occurring in non-glacierised areas with often overly simplified glacier parametrization. This can lead to uncertainties in streamflow predictions, especially in highly glacierized catchments. Coupling a glacier model to a hydrological model can resolve some of these uncertainties by a more accurate description of glacier-related processes including ice melt, and providing the extent of glacier retreat, which is essential to quantify changes under a transient climate. In this study, we test the hypothesis that coupling the glacier model GloGEM with the hydrological modelling framework Raven can lead to an increase in predictive skills through a better glacier parametrization. The chosen hydrological modelling framework Raven allows for testing multiple hydrological model structures, accounting for uncertainties along the full modelling chain. The relevance of coupling a glacier model with a hydrological model is analysed in a test basin with in-situ measurements of glacier mass balance and streamflow. Modelling results from coupled and non-coupled model runs are evaluated with the available streamflow data.

How to cite: Berg, J., Horton, P., Kauzlaric, M., von der Esch, A., and Schaefli, B.: Changes in predictive skills through coupling a hydrological modelling framework with a glacier model , EGU General Assembly 2024, Vienna, Austria, 14–19 Apr 2024, EGU24-16220, https://doi.org/10.5194/egusphere-egu24-16220, 2024.

EGU24-17796 | ECS | Posters on site | HS2.1.4

A model-based methodology for the delineation of complex alpine spring catchments 

Magdalena Seelig, Simon Seelig, Matevž Vremec, Thomas Wagner, and Gerfried Winkler

Spring catchments in Austria are frequently located in alpine regions that are strongly exposed to the effects of global warming. To predict their impact on spring flow, the delineation of hydrological catchments establishes the link between atmospheric input, catchment characteristics, and aquifer properties. This study proposes a delineation methodology that combines a lumped-parameter model with the analysis of stable isotope data. The model includes a semi-distributed snow module (CemaNeige) and a rainfall-runoff model (GR4J), which were applied iteratively to a set of potential catchments of varying extent and location to simulate spring flow. Constraining the models by spring flow data and remote sensing of snow cover distribution allowed us to differentiate plausible catchments from implausible ones. The mean catchment elevation was estimated based on stable hydrogen and oxygen data collected monthly at the springs. The proposed methodology was tested at two karst springs draining geologically complex catchments in different mountain ranges of the Northern Calcareous Alps, where the hydrological catchments deviate strongly from the orographic ones. The catchments lie mainly in mountainous plateau regions that are characterized by high altitudes and long-lasting snow cover. The model results and isotope analysis are in line with additional, independent information based on tracer experiments, structural geology, and speleology. The proposed methodology provides a quantitative, model-based approach to delineate plausible spring catchments in high alpine and complex hydrogeological settings. It thus forms the knowledge base for sustainable management of alpine freshwater resources under a changing climate.

How to cite: Seelig, M., Seelig, S., Vremec, M., Wagner, T., and Winkler, G.: A model-based methodology for the delineation of complex alpine spring catchments, EGU General Assembly 2024, Vienna, Austria, 14–19 Apr 2024, EGU24-17796, https://doi.org/10.5194/egusphere-egu24-17796, 2024.

EGU24-17858 | ECS | Orals | HS2.1.4

Temporal dynamics of water quality and microbial community composition in alpine springs 

Filip Paul Boanca, Magdalena Seelig, Clemens Karwautz, Winkler Gerfried, and Christian Griebler

Springs are vital water sources, and their vulnerability to environmental changes, particularly climate change, is of growing concern. The collaborative research project ECOSPRING, funded by the Austrian Academy of Sciences, focuses on the assessment of microbial communities and water quality patterns in selected springs all over Austria. Here, we will focus on understanding the response and vulnerability to hydrological events and climate change.

The first aim of the project is to characterize the springs based on their temporal dynamics in terms of physical-chemical characteristics. A detailed analysis of the dynamics in discharge, temperature, pH, EC, stable isotopes, essential nutrients, and major ions will provide valuable insights into the geological imprint and prevailing hydrological conditions, as well as on catchment areas.

Microbes are an integral component of aquatic ecosystems and can serve as sensitive indicators for environmental conditions. We will compare the microbial community composition in relation to the hydrogeological and physicochemical conditions.

Our research activities target two spatial scales, from a local perspective, with 14 springs in the province of Styria studied monthly, to a regional approach by sampling around 100 springs distributed all over Austria twice, in winter/spring and summer/autumn marking the expected hydrological extremes.

In the initial stages of our research, we gathered data from 15 selected springs of Styria. These springs exhibit a wide and dynamic spectrum in their physical-chemical properties. Together with records of discharge, springs could be categorized into stable, intermediate, and highly dynamic systems. Our preliminary results indicate a connection between these fluctuating physical-chemical conditions and the composition of the spring water microbiome. The underlying mechanisms driving these observed patterns are yet not fully understood and await further investigations.

In summary, this research project seeks to enhance our understanding of the vulnerability of spring waters to anthropogenic pressures such as climate change. The findings will provide a knowledge base for future water resources management and contribute to the sustainable use of these vital resources.

How to cite: Boanca, F. P., Seelig, M., Karwautz, C., Gerfried, W., and Griebler, C.: Temporal dynamics of water quality and microbial community composition in alpine springs, EGU General Assembly 2024, Vienna, Austria, 14–19 Apr 2024, EGU24-17858, https://doi.org/10.5194/egusphere-egu24-17858, 2024.

EGU24-18462 | Orals | HS2.1.4

Impacts of melting glaciers and snowpacks in High Mountain Asia on downstream water and food security  

Hester Biemans, Arthur Lutz, Wouter Smolenaars, Khalid Jamil, Fulco Ludwig, Sanita Dhaubanjar, and Walter Immerzeel

The high mountains of Asia store large volumes of water in their glaciers and snowpacks. Twelve large river basins, fed with meltwater from these mountains, are home to almost 2 billion people. In their floodplains, a significant fraction of the global food is produced (34% and 23% of the global rice and wheat production respectively). This makes the snow and ice in the High Mountains of Asia a very important water reserve on which both water- and food security for a huge population depend.However, the water supply from the mountains faces many threats. Glaciers and snowpacks are melting at unprecedented rates, and large parts of these reserves are likely to disappear by the end of the 21st century. At the same time, the dependence of downstream populations on mountain water resources is increasing, mainly due to increasing water needs, continuing groundwater depletion and changes in (monsoon) precipitation.Agriculture in the predominantly irrigated floodplains in Asia is very intensive, with often 2 or even 3 crops grown per year. In some of these agricultural areas, irrigation water supply is largely depending on the seasonal availability of meltwater. Any changes in meltwater supply could therefore have large impacts on the crop production, but science has only just started understanding the impacts of melting glaciers and snowpacks on food and water security of downstream populations.In this presentation we will look back on our recent work in which we quantified the current en future dependence of downstream crop production on water from the mountains in the Indus and Ganges basins. We also describe remaining challenges, and look ahead to the upcoming (ERC) 3POLE2SEA project,  that aims to quantify these upstream-downstream linkages in all twelve river basins river basins originating from the High Mountains of Asia. We expect that the 12 river basins have very different upstream-downstream dependencies, resulting in different current and future risks for water and food security, and therefore need different responses for effective adaptation. We explain how our research can contribute to making agriculture in one of the largest food producing areas in the world more resilient to changes in the mountains.

How to cite: Biemans, H., Lutz, A., Smolenaars, W., Jamil, K., Ludwig, F., Dhaubanjar, S., and Immerzeel, W.: Impacts of melting glaciers and snowpacks in High Mountain Asia on downstream water and food security , EGU General Assembly 2024, Vienna, Austria, 14–19 Apr 2024, EGU24-18462, https://doi.org/10.5194/egusphere-egu24-18462, 2024.

EGU24-18725 | ECS | Posters virtual | HS2.1.4

Towards developing a streamflow forecasting system for data-poor mountainous watershed: an approach using parameter transfer 

Kavya Mammali, Sanjeev Kumar Jha, and Nicholas Kouwen

Studying the hydrological responses of the Indian Himalayan Region (IHR) is crucial given the rise in the frequency of floods and other natural disasters. The hydrological processes in this area are more complicated due to the extreme weather pattern and varied topography. Streamflow forecasting is made more difficult by the extremely low number of stream gauge stations and the absence of accurate stream flow data. The problem of lack of observational data in ungauged watersheds can be resolved by transferring model parameters from similar gauged basins (Regionalisation). According to the traditional regionalization procedures using rainfall-runoff models, donor and recipient catchments must be similar in a variety of ways, including slope, size, drainage pattern, area, etc. It is extremely difficult to locate a catchment with all those similarities. In this study, we use a fully distributed hydrological model WATFLOOD for developing a streamflow forecast of the Alakananda River basin where the stream flow observation is very limited for the calibration of the hydrological model. WATFLOOD is working based on Grouped Response Unit (GRU). The requirement that has to be satisfied for regionalization using the WATFLOOD model is that land cover classes of the ungauged watershed should be represented in the gauged watershed irrespective of their spatial distribution. Also, there should be as many as possible gauged sub-watersheds that represent each land cover class. We identified a similar watershed that has similar land cover classes and sufficient stream flow gauges to represent each of the land cover classes. The three-step calibration process of the WATFLOOD model for both river basins is carried out to transfer the parameters. The results of ongoing work will be presented at the conference.

How to cite: Mammali, K., Jha, S. K., and Kouwen, N.: Towards developing a streamflow forecasting system for data-poor mountainous watershed: an approach using parameter transfer, EGU General Assembly 2024, Vienna, Austria, 14–19 Apr 2024, EGU24-18725, https://doi.org/10.5194/egusphere-egu24-18725, 2024.

EGU24-18832 | Posters on site | HS2.1.4

Changing discharge patterns of springs characterized by nival flow regimes in the Austrian Alps 

Matevž Vremec, Magdalena Seelig, Simon Seelig, Raoul Collenteur, Thomas Wagner, Jutta Eybl, and Gerfried Winkler

Alpine spring runoff patterns recorded at gauging stations offer a unique observational window into the hydrological state of Alpine water systems. These systems play a crucial role in supplying water to downstream areas and are particularly sensitive to changes in temperature and precipitation. Using a dataset of spring discharge monitored at 29 stations by the Austrian Hydrographic Service, spanning 24 years, we conducted a trend analysis on both the quantity and timing of mean and extreme flows. The springs, which were clustered into groups based on the Pardé coefficient and autocorrelation analysis, are distributed over the whole area of the Austrian Alps with mean catchment elevation reaching up to 2500 m above sea level. The trend analysis was performed using the Mann-Kendall test and the Theil-Sen slope on seasonally and annually computed statistics describing the quantity and timing of the occurrence of mean and extreme flows. The results indicate that at springs with a nival flow regime (i.e., flow dominated by snow melt), winter discharge increased. However, during the summer period, differences emerged between two characteristic spring groups: (i) springs at higher-elevation catchments, mainly distributed in the west of the Austrian Alps, with a positive trend in summer, and (ii) springs in the eastern part of the Northern Alps, that displayed a decrease in summer discharge. Notably, differences in the trends for timing of maximum and minimum flows were also evident between these two groups. Furthermore, we compared the hydrological trends to precipitation trends in the spring areas to assess relationships between meteorological and hydrological patterns. These findings provide valuable insights into how the spring runoff patterns have evolved in the Austrian Alps over the past 24 years.

How to cite: Vremec, M., Seelig, M., Seelig, S., Collenteur, R., Wagner, T., Eybl, J., and Winkler, G.: Changing discharge patterns of springs characterized by nival flow regimes in the Austrian Alps, EGU General Assembly 2024, Vienna, Austria, 14–19 Apr 2024, EGU24-18832, https://doi.org/10.5194/egusphere-egu24-18832, 2024.

EGU24-19825 | ECS | Orals | HS2.1.4

Assessing Climate Change Impacts on Glacierized Catchments in Central Asia Using an Open Source Toolkit 

Phillip Schuster, Alexander Georgi, Azamat Osmonov, and Tobias Sauter

The impacts of climate change and the retreat of mountain glaciers will significantly affect the headwaters of high mountain river systems. Accurate predictions of future water availability are essential to mitigate local impacts. Despite the availability of various glacio-hydrological modeling tools and high-quality input datasets, their effective application in less developed countries facing severe climate change impacts remains limited. Accessible and cost-effective tools are particularly scarce, hindering engagement with water management stakeholders, especially at the local level.

We present MATILDA, an open-source toolkit for glacierized catchments that allows users to acquire and process public data, apply well-established glacio-hydrological modeling routines, and estimate climate change impacts on the catchment of their choice. The workflow integrates Google Earth Engine, several state-of-the-art online data sources, and calibration algorithms. Published as a Jupyter book, it can be executed in an online Python environment, allowing users to generate scenario-based hydrological projections and analyze trends in runoff contributions, requiring only runoff observations.

The workflow is outlined and discussed in terms of practical application, sensitivity and uncertainty, limitations, and possible improvements. With a view to two regional studies in the Tian Shan Mountains, we evaluate MATILDA’s practical potential to support water management decisions in high mountain areas. The first study assesses the impacts of glacier change on lake levels and local agriculture in the endorheic Issyk-Kul basin in Kyrgyzstan. The second study focuses on the Chirchik River Basin in Uzbekistan and it's crucial role for hydropower production and fresh water supply for the Tashkent metropolitan area.

How to cite: Schuster, P., Georgi, A., Osmonov, A., and Sauter, T.: Assessing Climate Change Impacts on Glacierized Catchments in Central Asia Using an Open Source Toolkit, EGU General Assembly 2024, Vienna, Austria, 14–19 Apr 2024, EGU24-19825, https://doi.org/10.5194/egusphere-egu24-19825, 2024.

EGU24-20504 | Posters on site | HS2.1.4

Detecting Climate Change Impacts on Socio-Hydrological Systems in the Rocky Mountains, USA 

David Williams, Corrine Knapp, Bryan Shuman, Bart Geerts, Melissa Bukovsky, Brent Ewers, Shannon Albeke, Sarah Collins, Jeff Hamerlinck, Martha Inouye, Jewell Lund, Fabian Nippgen, and Ginger Paige

Observation networks established in complex mountain landscapes promise to address critical gaps in understanding of socio-hydrological systems and their process interactions operating at local to regional scales. Knowledge of vulnerabilities and risks founded on observed biophysical and socioeconomic conditions and responses is required to represent realistic scenarios in model simulations of climate change impacts on managed water resources. Socio-hydrological observatories often lack design coordination that consequently constrains the ability to link processes and detect feedbacks across scales and domain boundaries. The goal of the 5-year (2022-2027) project WyACT (Wyoming Anticipating Climate Transitions) is to build adaptive capacity in headwater mountain communities in the Greater Yellowstone Area of of the Rocky Mountains founded on observations, simulation modeling, and driven stakeholder needs and participation. A key feature of WyACT is the development, from the ground up, of a regional observatory network that explicitly coordinates observations of socioeconomic, hydrological, and ecological responses to climate-driven stressors. WY-SEaSON (Wyoming Socio-Environmental Systems Observatory Network) will quantify and monitor the range of responses of snowpack and soil moisture, streamflow, aquatic ecosystems, vegetation stress and fire risk, economic risk perception, and preferred adaptation pathways to a changing climate in a key headwaters region that feeds three major river drainages in western North America. This presentation highlights the structure of WY-SEaSON including the operating principles, goals, mission, and design with examples of emerging and integrated observations.

How to cite: Williams, D., Knapp, C., Shuman, B., Geerts, B., Bukovsky, M., Ewers, B., Albeke, S., Collins, S., Hamerlinck, J., Inouye, M., Lund, J., Nippgen, F., and Paige, G.: Detecting Climate Change Impacts on Socio-Hydrological Systems in the Rocky Mountains, USA, EGU General Assembly 2024, Vienna, Austria, 14–19 Apr 2024, EGU24-20504, https://doi.org/10.5194/egusphere-egu24-20504, 2024.

EGU24-118 | Posters on site | HS2.1.5

Precipitation, temperature, and vegetation indices analysis for Saudi Arabia region: Feasibility of Google Earth Engine 

Zaher Mundher Yaseen, Bijay Halder, Mohamed A. Yassin, and Sani I. Abba

Climatic disaster is continuously triggering environmental degradation and thermal diversification over the earth's surface. Global warming and anthropogenic activities are the triggering factors for thermal variation and ecological diversification. Saudi Arabia has also recorded precipitation, temperature, and vegetation dynamics over the past decades. Therefore, monitoring past precipitation, temperature, and vegetation condition information can help to prepare future disaster management plans and awareness strategies. The Precipitation Estimation from Remotely Sensed Information using Artificial Neural Networks - Climate Data Record (PERSIANN-CDR) from the Center for Hydrometeorology and Remote Sensing (CHRS) data portal and Moderate Resolution Imaging Spectroradiometer (MODIS) are applied for precipitation, Land Surface Temperature (LST), Enhance Vegetation Index (EVI), and Normalized Difference Vegetation Index (NDVI) from 2003 to 2021 respectively. Yearly mean LST, EVI, NDVI, and precipitation values are calculated through the Google Earth Engine (GEE) cloud computing platform. MODIS-based LST datasets recorded the highest temperatures is 43.02 °C (2003), 45.56 °C (2009), 47.83 °C (2015), and 49.24 °C (2021) respectively. In between nineteen years, the average mean LST increased by 6.22 °C and the most affected areas are Riyadh, Jeddah, Abha, Dammam, and Al Bahah. The mean Precipitation is recorded around 776 mm, 842 mm, 1239 mm, and 1555 mm for the four study periods, while the high precipitation area is Jazan, Asir, Baha, and Makkah provinces. In between nineteen years, 779 mm of precipitation is increasing in Saudi Arabia.  Similarly, the NDVI vegetation indices observed 0.885 (2003), 0.871 (2009), 0.891 (2015), and 0.943 (2021), while EVI observed 0.775 (2003), 0.776 (2009), 0.744 (2015), and 0.847 (2021). The R2 values of the LST and EVI correlation is 0.0239 (2003), 0.0336 (2009), 0.0136 (2015) and 0.0175 (2021) similarly correlation between LST and NDVI is 0.0352 (2003), 0.0265 (2009), 0.0183 (2015) and 0.0161 (2021) respectively. The vegetation indices indicate that the green space is gradually increasing in Saudi Arabia and the highly vegetated lands are Meegowa, An Nibaj, Tabuk, Wadi Al Dawasir, Al Hofuf, and part of Qaryat Al Ulya. This analysis indicates that the temperature is increasing but precipitation and green spaces are increasing because of the groundwater recharge through dam construction, precision agriculture, and planned build-up is helps to prepare Saudi Arabia as a green country. Therefore, more attention to preparing the strategic agricultural plants as well as other vegetation and artificial groundwater recharge can improve the country as a green nation. This analysis might help to prepare future planning, awareness, and disaster management teams to prepare for future disasters and strategic steps for sustainable development.

How to cite: Yaseen, Z. M., Halder, B., Yassin, M. A., and Abba, S. I.: Precipitation, temperature, and vegetation indices analysis for Saudi Arabia region: Feasibility of Google Earth Engine, EGU General Assembly 2024, Vienna, Austria, 14–19 Apr 2024, EGU24-118, https://doi.org/10.5194/egusphere-egu24-118, 2024.

Water is scarce in the northern Chihuahuan Desert, with ~350 mm/yr precipitation, potential evapotranspiration at 1800mm/yr, and rising mean annual temperatures by >2°C since 1960. The main water resources are the Ogallala, Pecos Valley, Dockum, and Edwards-Trinity Plateau aquifers, with depletion rates of ~1 m/yr. Despite the arid climate, the Monahans and Kermit dune fields host perched water tables 1-10 m below the surface, in up to 40 m of aeolian sand spanning the past ca. 2.6 ma, and isolated from the underlying Pecos Valley Aquifer by a Pliocene/Pleistocene fluvial gravel-rich clay. A 3D model based on borehole lithology shows a topographic inversion with a southwest-trending paleo-slope infilled with aeolian sand. The aeolian stratigraphy and basin modeling indicate progressive infilling by aeolian sand with periods of pluvial lake formation and soil development, with groundwater providing dune field stability for vertical accretion and limiting aeolian erosion. Cores of sediments retrieved from the Monahans and Kermit dune fields were sampled for OSL ages and yielded ages up to 500 ka 20 m below the surface of the dunes, with identified deposition periods between 545-470 ka, 300-260 ka, 70-45 ka and post 16 ka. A set of three monitoring wells equipped with data loggers revealed aquifer recharge of 35-40 cm in the Spring and Fall consistent with regional precipitation variability, and a daily recharge cycle of 3-8 mm potentially linked to plant uptake or gravitational forces. Deuterium and 18O isotopic ratios for the dune field aquifers indicate an evaporative enriched water source compared to the Pecos Valley Aquifer, Pecos River, and Chihuahuan Desert precipitation, consistent with local precipitation. Apparent 14C ages <1360 yr for aquifer waters from the upper 1 m indicate recent meteoric recharge. Older 14C ages of > 1.3 to 2.2 ka for waters ~30 m deep and at the western edge of the aquifer indicate mixing with Holocene recharge waters in a southwest flowing aquifer. In contrast, the Pecos Valley Aquifer yields 14C ages of ca. 0.9 to 40 ka with the youngest ages near the dune fields, which suggests recharge from these perched aquifers.

How to cite: Fournier, A. and Forman, S.: Origin, gradient, and recharge processes of perched aquifers of the Monahans and Kermit dune fields, northern Chihuahuan Desert, Texas, USA , EGU General Assembly 2024, Vienna, Austria, 14–19 Apr 2024, EGU24-765, https://doi.org/10.5194/egusphere-egu24-765, 2024.

EGU24-1165 | ECS | Orals | HS2.1.5

Agrohydrological modelling approach for assessing the impact of climate change on water resources and land management in the Messinian region, Greece. 

ismail bouizrou, Giulio Castelli, Gonzalo Cabrera, Lorenzo Villani, and Elena Bresci

The Mediterranean region is highly susceptible to the consequences of warming, leading to an increasing of extreme events such as droughts, severe heat waves, and precipitation events. The Messinia watershed (MW) is predominantly characterized by olive cultivation, encompassing approximately 70% of the landscape. These olive orchards constitute a vital component of the Mediterranean ecosystem, playing a crucial role in regional agriculture. The MW is a perfect illustration of a Mediterranean watershed significantly impacted by climate change, as well as soil degradation and a lack of effective land management practices.

In this context, agro-hydrological modelling emerges as a potent tool to address soil degradation and enhance water resource retention within the olive orchards at the watershed scale. To achieve this objective, the SWAT+ agrohydrological model was chosen for a comprehensive assessment of the potential impacts of climate change on water resources and ecosystems in the Messinia region. The adopted modelling approach involved both hard and soft calibration techniques, simulating four sub-watersheds of Messinia by incorporating remote sensing data, including evaporation and soil moisture, for multi-criteria model calibration.

The calibrated model was subsequently employed to assess the potential impacts of climate change on water resources and ecosystems in the Messinia region, utilizing various RCM climate scenarios. Our findings are valuable for addressing soil degradation, as well as for guiding land and water management practices in the Messinian watershed.


This research was carried out within the SALAM-MED project, funded by the Partnership for Research and Innovation in the Mediterranean Area Programme (PRIMA).

The content of this abstract reflects the views only of the author, and the Commission cannot be held responsible for any use that may be made of the information contained therein.


How to cite: bouizrou, I., Castelli, G., Cabrera, G., Villani, L., and Bresci, E.: Agrohydrological modelling approach for assessing the impact of climate change on water resources and land management in the Messinian region, Greece., EGU General Assembly 2024, Vienna, Austria, 14–19 Apr 2024, EGU24-1165, https://doi.org/10.5194/egusphere-egu24-1165, 2024.

Desertification on the Mongolian Plateau is deepening, and sand and dust have great negative impacts on many countries in East Asia. Based on meteorological and socio-economic data in the context of climate change, this study analyzed the driving mechanisms and impacts of desertification and water body area response on the Mongolian Plateau using, among others, the GTWR model. The following conclusions were drawn: the area of the Mongolian Plateau showed a decreasing trend from 1990 to 2019, and the number of lakes larger than 1 km2 decreased by 173 or 537.3 km2 in Inner Mongolia, and by 737 or 2875.1 km2 in Mongolia, and all of them were dominated by lakes of 1-10 km2; and the analysis of the correlation between the area of the water bodies showed that the The reasons driving the change of water body area in Inner Mongolia Autonomous Region and Mongolia are similar and different, soil moisture and precipitation have obvious promotion effects, economic development and livestock numbers have different degrees of negative impacts on different countries; The GTWR model is used to represent the impacts of different influencing factors on the water body area in time and space, and the evaporation and GDP are shifted from slight inhibition to promotion, and the population and temperature are both inhibited. Soil moisture and livestock numbers are contributing; Surface water resource monitoring is important to deepen the desertification of the Mongolian Plateau and to provide better water resource recommendations and protection measures for the Mongolian Plateau.

How to cite: Yan, Y. and Cheng, Y.: Study of water body area changes in the desertification process of the Mongolian Plateau and analysis of driving factors, EGU General Assembly 2024, Vienna, Austria, 14–19 Apr 2024, EGU24-1185, https://doi.org/10.5194/egusphere-egu24-1185, 2024.

EGU24-2567 | ECS | Orals | HS2.1.5 | Highlight

GIRHAF (Gridded hIgh-resolution Rainfall for the Horn of AFrica): a new rainfall product for detailed applications in a region beset by climate hazards 

Manuel F. Rios Gaona, Katerina Michaelides, and Michael Bliss Singer

Rainfall is one of the most important inputs for applications such as hydrological modelling, water resource allocation, flood/drought analysis, and climatic risk assessments. Currently, there exist numerous (global) products offering rainfall estimates at various spatio-temporal resolutions. Nevertheless, there are still places on Earth where the coverage and/or quality of such products is limited due to sparse ground-control data, thus constraining the robustness of input rainfall for hydrological and climate applications. Located in Eastern Africa, the Horn of Africa (HOA) is a place where climate impacts like droughts and floods frequently inflict a huge toll on the lives and livelihoods of millions residing in subsistence rural communities. For places like this, high resolution rainfall data are fundamental to understanding the availability of water resources, flood hazard, and soil moisture dynamics relevant to crop yields and pasture availability.

Here we introduce GIRHAF (Gridded hIgh-resolution Rainfall for the Horn of AFrica), which is a 20-year rainfall product, with a spatio-temporal resolution of 0.05°×0.05°, every 30 minutes. GIRHAF is based on downscaling CHIMES (Climate Hazards center IMErg with Stations) a pentad operational rainfall product which corrects microwave signals in IMERG (Integrated Multi-satellitE Retrievals for GPM -Global Precipitation Measurement mission-) by in situ rain gauging networks. The goal of this product is to offer the HOA region high-resolution rainfall fields that can support more detailed mechanistic analyses of historical rainfall and can also provide the base dataset required to develop stochastic rainfall models capable of simulating forecasted or projected climate scenarios. It is our aspiration that GIRHAF will enable improved responses to climatic hazards as well as better water resources management in the HOA region, and perhaps to allow people of this region to better prepare to future climate scenarios.

How to cite: Rios Gaona, M. F., Michaelides, K., and Singer, M. B.: GIRHAF (Gridded hIgh-resolution Rainfall for the Horn of AFrica): a new rainfall product for detailed applications in a region beset by climate hazards, EGU General Assembly 2024, Vienna, Austria, 14–19 Apr 2024, EGU24-2567, https://doi.org/10.5194/egusphere-egu24-2567, 2024.

EGU24-4462 | ECS | Posters on site | HS2.1.5

Modeling the impact of climate and land use changes on future water resources dynamics in central Sicily, Italy 

Shewandagn Lemma Tekle and Brunella Bonaccorso

Drought events, worsened by climate change, produce detrimental impacts on freshwater availability especially in arid and semi-arid regions. The situation becomes more critical when these hydrologic extremes combine with land use change mainly caused by anthropogenic factors, such as urbanization, intensive farming, and industrial activities. The present study is designed to investigate the combined impacts of climate and land use changes on the future freshwater  stored in the artificial reservoirs of three adjacent river basins located in the central Sicily (Italy), i.e: Verdura (2 active reservoirs with capacities 9.2 Mmc and 4.19 Mmc), Imera Meridionale (one active reservoir with capacity 15 Mmc), and Platani (one active reservoir with capacity 20.7Mmc), using the Soil and Water Assessment Tool (SWAT) model. The reservoirs are used for irrigation, drinking water supply, and electric power generation. Future climate variables such as rainfall, minimum and maximum temperatures were derived from an ensemble Regional Climate Models for two main representative concentration pathway (RCP) scenarios, such as an intermediate emission scenario (RCP4.5) and a severe emission scenario (RCP8.5). A coupled multi-layer perceptron neural networks and cellular automata (MLP-CA) model was implemented to simulate future land use of the region considering the CORINE land cover in 2000, 2006, 2012, and 2018 as a reference dataset. The future land use is then projected until the mid-century (2048) in a six-year interval using the validated MLP-CA model. The soil data from the European soil data center (EUSDAC) was used as input for the SWAT model. The result indicated that the basins could experience a decrease in inflows to the reservoirs. The separate evaluation of climate change and land use changes indicated that the effect of climate change on streamflow variation is more pronounced than the effect of land use change only. In this study, we introduced new hydrological insights into the region by analyzing the attributions of climate change, land use change, and coupled climate and land use changes on the future freshwater availability which were overlooked in the previous studies. The implementation of the proposed approach can contribute to design environmentally sustainable and climate resilient river basin management strategies.


Keywords: MLP-CA, Land use change, Climate change, SWAT, Hydrological modeling, Water availability

How to cite: Tekle, S. L. and Bonaccorso, B.: Modeling the impact of climate and land use changes on future water resources dynamics in central Sicily, Italy, EGU General Assembly 2024, Vienna, Austria, 14–19 Apr 2024, EGU24-4462, https://doi.org/10.5194/egusphere-egu24-4462, 2024.

EGU24-5604 | Orals | HS2.1.5

An integrated hydrological modeling approach to assess the natural groundwater recharge trends in a Mediterranean coastal aquifer 

Anis Chekirbane, Khaoula Khemiri, Constantinos Panagiotou, and Catalin Stefan

Integrating physical models with socio-economic considerations is essential to sufficiently analyze complex hydrological systems and design effective strategies for groundwater management. This integrated approach offers an effective means of detecting links between aquifer properties and groundwater processes. This study aims to assess the impact of human activities and climate changes on groundwater resources. In particular, the final goal is to quantify the spatial distribution of natural groundwater recharge, which is needed to assess the impact of anthropogenic factors on sustainable groundwater management in the Chiba watershed, NE of Tunisia as an example of a stressed hydrosystem.

The proposed methodology is based on the estimation of natural groundwater recharge through hydrological modeling with the use of the SWAT model while considering land use/land cover changes occurring within the study area, coupled with the DPSIR (Drivers-Pressures-States-Impacts-Responses) socio-economic approach for time period 1985-2021. The surveys were constructed and processed based on the probability of occurrence for the degree of satisfaction with arguments related to the DPSIR parameter within the category of the 5-point Likert scale (ranging from level 1 - very low to level 5 - very high), including mean, standard deviation, and the consensus (CnS).
Chiba watershed was selected as a case study since its climate is representative of the Tunisian semi-arid context, and due to the high vulnerability of the existing groundwater systems with respect to human activities.

The hydrological simulations suggest a gradual decrease of 33% in the aquifer's natural recharge over the entire time period. The long-term average value of the annual recharge rate per sub-basin does not exceed 3 mm/year, keeping groundwater recharge levels in the basin relatively low. This observation is mainly attributed to climate change with CnS of 0.6 and over-exploitation of the water sources for irrigation purposes (CnS = 0.62), leading to aquifer depletion and degradation of groundwater-dependent ecosystems (CnS = 0.73). These results suggest that different management practices, such as more conservative water use (CnS = 0.6), long-term monitoring and Managed Aquifer Recharge (MAR) with wastewater (CnS = 0.76), can help rural residents to diversify their economies while preserving these water resources. However, although attempts of MAR have been undertaken, they remain insufficient to counter the pressure on the coastal aquifer, underlining the importance of preserving the fragile semi-arid landscape.

The proposed approach is applicable to other regions having similar climatic and socio-economic conditions. It also demonstrates that pure modeling solutions need to be coupled to the socio-economic approaches to be able to constitute a solid asset for sustainable water resources management of stressed hydro-systems.


Acknowledgments

This work is funded by National Funding Agencies from Germany,  Cyprus, Portugal, Spain, and Tunisia under the Partnership for Research and Innovation in the Mediterranean Area (PRIMA) and supported under Horizon 2020 by the European Union’s Framework for Research and Innovation.

How to cite: Chekirbane, A., Khemiri, K., Panagiotou, C., and Stefan, C.: An integrated hydrological modeling approach to assess the natural groundwater recharge trends in a Mediterranean coastal aquifer, EGU General Assembly 2024, Vienna, Austria, 14–19 Apr 2024, EGU24-5604, https://doi.org/10.5194/egusphere-egu24-5604, 2024.

EGU24-6984 | ECS | Posters on site | HS2.1.5

Westerly aridity in the western Tarim Basin driven by global cooling since the mid-Pleistocene transition 

Hongye Liu, Rui Zhang, Gaowen Dai, and Yansheng Gu

To explore the relationship between the global change, westerlies, and central Asian aridity, we report ~1.1 Ma local sedimentary environment changes according to high-resolution gamma ray (GR) from downhole logging, Grain size, magnetic susceptibility (MS), rubidium/strontium (Rb/Sr) ratios and total organic carbon (TOC) of an 800-m core (KT11) from the Kashgar region in the western Tarim Basin, arid zone of China. Four dominant sedimentation types, including lacustrine facies, delta facies, fluvial facies, and aeolian dunes, were identified through lithology and grain size frequency curves. The 1.1 Ma sedimentary successions experienced delta deposits with fluvial and aeolian deposits and lacustrines (1.1-0.6 Ma), alternating fluvial and aeolian facies with the occurrence of deltas and lacustrines (0.6-0.15 Ma), and aeolian facies interbedded with deltas and fluvial facies (0.15 Ma-present). Spectral analyses of the GR, MS, and Rb/Sr data reveal cycles with ~70 m, ~30 m and ~14 m wavelengths. These cycles represent ~100-kyr short-eccentricity, ~40-kyr obliquity and ~20-kyr precession frequencies, respectively and mainly are driven by orbitally forced climate change.

Stepwise drying sedimentary conditions and enhanced desertification indicated by increasing Rb/Sr ratios and proportion of aeolian sands, and decreasing TOC since the past 1.1 Ma, implied intensified westerlies, likely resulted from ice volume expansion and ongoing global cooling according to geological record comparison and simulations during the Last Glacial Maximum compared to preindustrial conditions, which may have controlled the expansion of the permanent deserts in inland Asia. These persistent drying trends and intensified westerly circulation in arid regions during glacial periods after the mid-Pleistocene Transition indicated by larger amplitudes of aeolian sand proportion than prior to 0.6 Ma are similar to those in the interior monsoonal Asia, where the larger-amplitude of median grain size indicated enhanced East Asian Winter monsoon intensity and drier glacials.

How to cite: Liu, H., Zhang, R., Dai, G., and Gu, Y.: Westerly aridity in the western Tarim Basin driven by global cooling since the mid-Pleistocene transition, EGU General Assembly 2024, Vienna, Austria, 14–19 Apr 2024, EGU24-6984, https://doi.org/10.5194/egusphere-egu24-6984, 2024.

EGU24-7068 | ECS | Orals | HS2.1.5

Exploring Drought Patterns in the Headwaters of the Tarim River Basin through an Integrated Surface-Groundwater Drought Index 

Xiaohan Yu, Xiankui Zeng, Dongwei Gui, Dong Wang, and Jichun Wu

The Tarim River Basin, China's largest inland river, has been grappling with persistent drought challenges. Over 90% of its water resources originate from the headwaters, heavily relying on groundwater. Existing drought indices often compartmentalize considerations of surface water and groundwater variables. Consequently, there is a necessity for a comprehensive drought index that accounts for the interplay between surface water and groundwater. This study employs the Copula function to formulate the Standardized Precipitation Evapotranspiration Groundwater Index (SPEGI), incorporating surface water (precipitation minus evaporation) and groundwater (changes in total water storage observed by GRACE satellite minus changes in output from the VIC model). SPEGI is computed using a moving average approach across various time scales (1, 3, 6, 12 months) and is juxtaposed with traditional indices such as Standardized Precipitation Evapotranspiration Index (SPEI), Standardized Soil Moisture Index (SSMI), and Standardized Groundwater Index (SGI). The findings underscore that SPEGI, grounded in the integrated consideration of surface and groundwater variables, provides a more comprehensive depiction of drought conditions in the study area. In contrast to traditional indices, SPEGI not only accounts for short-term precipitation and evaporation changes but also effectively reveals the characteristics of groundwater fluctuations. Additionally, by comparing SPEGI with NDVI data, the study delves into the desertification process in the region. The research discerns that SPEGI's assessment of drought resilience is more sensitive, manifesting an increasing trend in the desertification process with the enlargement of SPEGI's sliding window. Overall, this research contributes novel methodologies and empirical evidence for fostering sustainable water resource utilization and informing climate change adaptation decisions within the basin.

How to cite: Yu, X., Zeng, X., Gui, D., Wang, D., and Wu, J.: Exploring Drought Patterns in the Headwaters of the Tarim River Basin through an Integrated Surface-Groundwater Drought Index, EGU General Assembly 2024, Vienna, Austria, 14–19 Apr 2024, EGU24-7068, https://doi.org/10.5194/egusphere-egu24-7068, 2024.

EGU24-7611 | ECS | Orals | HS2.1.5

Locating unsustainable water supplies for supporting ecological restoration in China's drylands 

Fengyu Fu, Shuai Wang, and Xutong Wu

China, with vast dryland areas, has undertaken extensive ecological restoration (ER) projects since the late 1970s. While ER is a crucial means against desertification and land degradation, it must be implemented in a water-sustainable manner to avoid exacerbating the carbon–water trade-off, especially in water-limited drylands. However, there is still limited research on accurately identifying water unsustainable ER regions in China's drylands. Here, we developed a water supply–demand indicator, namely, the water self-sufficiency (WSS), defined as the ratio of water availability to precipitation. With the use of remote sensing and multisource synthesis datasets combined with trend analysis and time series detection, we conducted a spatially explicit assessment of the water sustainability risk of ER in China's drylands over the period from 1987 to 2015. The results showed that 17.15% (6.36 Mha) of ER areas face a negative shift in the WSS (indicating a risk of unsustainability), mainly in Inner Mongolia, Shanxi, and Xinjiang provinces, driven by evapotranspiration. Moreover, 29.34% (10.9 Mha) of the total ER areas, whose area is roughly double that of water unsustainable ER areas, exhibit a potential water shortage with a significant WSS decline (-0.014 yr-1), concentrated in Inner Mongolia, Shaanxi, and Gansu provinces. The reliability of our findings was demonstrated through previous studies at the local scale and an analysis of soil moisture changes. Our findings offer precise identification of water unsustainable ER regions at the grid scale, providing more specific spatial guidance for ER implementation and adaptation in China's drylands.

How to cite: Fu, F., Wang, S., and Wu, X.: Locating unsustainable water supplies for supporting ecological restoration in China's drylands, EGU General Assembly 2024, Vienna, Austria, 14–19 Apr 2024, EGU24-7611, https://doi.org/10.5194/egusphere-egu24-7611, 2024.

EGU24-8825 | ECS | Orals | HS2.1.5

Assessing stream water scarcity and groundwater roles under global change in a Mediterranean watershed: the Onyar River basin (NE Catalonia, Spain) 

Paula Gabriela Cordoba Ariza, Ramon J. Batalla, Sergi Sabater, and Josep Mas-Pla

Mediterranean basins face significant water scarcity which requires examining long-term data to evaluate their trends in water availability and quality and assess management options. In this presentation, we explore the historical streamflow changes, the influencing climatic —streamflow, precipitation, temperature, and evapotranspiration (PET and AET)— and land-use factors, and the evolution of surface water quality in the Onyar River (Inner Catalan basins, NE Spain; 295 km2) during the last decades (1960-2020).

Results highlight a consistent decline in streamflow, most pronounced over the last two decades, accompanied by an increase in PET, and a probable decrease in groundwater recharge. These changes co-occurred with higher concentrations of river water ammonium and nitrate. We attribute these patterns to changes in land use such as afforestation and intensive fertilization, as well as increased groundwater withdrawal, particularly during irrigation seasons. Additional factors include growing urban water demand and the discharges of treated wastewater back into the river system. Evaluation of the relationship between groundwater and surface water using end-member mixing analysis of hydrochemical data points out an interesting scale-dependence behaviour: groundwater baseflow from alluvial formations was relevant in the smallest subbasins, whereas regional groundwater flow involving deeper aquifers could significantly contribute to stream discharge in the lowest zones of the basin. Since water balance alteration in the future climate scenarios will reduce the contribution of the headwater flow as well as groundwater storage and baseflow generation, reclaimed wastewater shows up as a relevant source to maintain stream runoff, yet its quality is low and might not be properly diluted by rainfall originated runoff.

These observations provide a comprehensive overview of the declining water quantity and quality in the Onyar River network, attributing these trends to an interplay of climatic and anthropogenic factors. They urge for integrated water resources management strategies to mitigate the implications of these environmental changes, such as protecting baseflow generating areas as well as controlling reclaimed wastewater quality.

Funding: G. Córdoba-Ariza acknowledges funding from Secretariat of Universities and Research from Generalitat de Catalunya and European Social Fund for her FI fellowship (2022 FI_B1 00105). 

How to cite: Cordoba Ariza, P. G., Batalla, R. J., Sabater, S., and Mas-Pla, J.: Assessing stream water scarcity and groundwater roles under global change in a Mediterranean watershed: the Onyar River basin (NE Catalonia, Spain), EGU General Assembly 2024, Vienna, Austria, 14–19 Apr 2024, EGU24-8825, https://doi.org/10.5194/egusphere-egu24-8825, 2024.

Intermittent rivers and ephemeral streams represent half of the global river network and span all climates. The intermittent rivers and ephemeral streams is a short-hand term for all flowing water that ceases to flow or that dries up completely at some point in time and/or space They are more frequent in arid and semi-arid areas but are also present in temperate, tropical humid, boreal, and alpine areas, where they are mainly located in headwaters. Their abundance is increasing due to climate change and water withdrawals for human activities.

The objective of this study is to represent the spatio-temporal dynamics of flow intermittence at the reach level in river of the seven sub-catchments of the Maures massif (between 1.5 km² and 70 km²).

First, two hydrological continuous models of varying complexities are performed: GR6J (lumped and conceptual), and SMASH (spatially distributed and conceptual) in terms of temporal calibration/validation, by dissociating dry and wet years, to asses the models’ability to simulate observed drying event over time. The metrics are based on daily flow records observed in the 7 catchments since 1968 to 2023.

In the second part, a regionalization method is tested on the spatially distributed model (SMASH). The HDA-PR approach (Hybrid Data Assimilation and Parameter Regionalization) incorporating learnable regionalization mappings, based on multivariate regressions is used. This approach consist to search for a transfer function that quantitatively relates physical descriptors to conceptual model parameters from multi-gauge discharge in order to produce a regional model.

Flow condition observed from multiple data sources (daily flow time series from gauging stations, phototrap installed along the river network taking daily pictures from 2021-04-01 to 2023-31-12, daily conductivity measurements series from 2021-01-01) are used to validate the ability of the regional model to simulate flow intermittence (prediction of dry events) at river section level.

The distributed modelling approach, with a high-resolution conceptual hydrological modeling at 0.250 km² and coupled with Hybrid Data Assimilation and Parameter Regionalization descriptors shows results highlight the effectiveness of HDA-PR surpassing the performance of a uniform regionalization method with lumped model parameters. However, the results on smallest catchments area are lowest.

The study shows the interest of using daily photos which are a good indication of the hydrogical state of the streams to obtain intermittence data and increasing the spatial coverage of observations in order to validate regional model.

How to cite: Folton, N., De Fournas, T., Colléoni, F., and Tolsa, M.: Modelling the intermittence of watercourses in the small French Mediterranean catchments of the Maures massif (Réal Collobrier ) with the SMASH platform (Spatially distributed Modelling and ASsimilation for Hydrology) , EGU General Assembly 2024, Vienna, Austria, 14–19 Apr 2024, EGU24-9681, https://doi.org/10.5194/egusphere-egu24-9681, 2024.

EGU24-9899 | Orals | HS2.1.5

60,000 years of hydrologic connectivity on the Australian dryland margins: the case of the Willandra Lakes World Heritage Area 

Kathryn Fitzsimmons, Markus Fischer, Colin Murray-Wallace, Edward Rhodes, Tobias Lauer, Maike Nowatzki, Kanchan Mishra, and Nicola Stern

Australia is big, flat, old and arid: it is the driest inhabited continent on Earth. The catastrophic flooding of recent years has demonstrated not only the potential for extreme conditions at both ends of the hydroclimatic scale, but also how little we understand of the interplay between climatic, hydrological, and surface-process mechanisms affecting this part of the world. We know still less about long-term hydrological dynamics, particularly for the dry inland where water resources are scarce and land surfaces are susceptible to erosion, requiring careful management.

Records of past hydrological variability can help inform us about changing hydroclimate states and their impact on the land surface. The Willandra lakes system, located on the desert margins of southeastern Australia, is one of the few dryland areas which preserves long-term sedimentary records of hydrologic change. The headwaters of these lakes lie in the temperate highlands hundreds of kilometres to the east; as a result, lake filling and drying reflects the interaction between rainfall in the watershed and hydrologic connectivity across the catchment and between the lakes. Environmental change in the Willandra is recorded in the sediments of the lake shoreline dunes, preserved as semi-continuous deposition of different lake facies over 60,000 years.

Here we investigate long-term hydrologic connectivity across the Willandra lakes and their catchment. Our approach uses a novel integration of lake-level reconstruction based on lunette sedimentology, stratigraphy and luminescence geochronology, with hydrologic and palaeoclimatic modelling of key event time slices over the last 60 ky. We characterize the land-surface response to various hydroclimate states, so improving our understanding of dryland atmosphere-hydrosphere interactions.

How to cite: Fitzsimmons, K., Fischer, M., Murray-Wallace, C., Rhodes, E., Lauer, T., Nowatzki, M., Mishra, K., and Stern, N.: 60,000 years of hydrologic connectivity on the Australian dryland margins: the case of the Willandra Lakes World Heritage Area, EGU General Assembly 2024, Vienna, Austria, 14–19 Apr 2024, EGU24-9899, https://doi.org/10.5194/egusphere-egu24-9899, 2024.

EGU24-10078 | ECS | Orals | HS2.1.5 | Highlight

Wheat irrigation in Marrakech conditions: A Simulation Study using SALTMED 

El Houcine El Moussaoui, Aicha Moumni, Said Khabba, and Abderrahman Lahrouni

In Morocco, agriculture accounts for 80-90% of water resources. Available data show that the performance of current irrigation systems remains low to medium, with water losses at plots ranging from 30 to 40%, divided between percolation and evaporation. Gravity irrigation is almost total in the study area, resulting in significant percolation losses. In principle, this percolation contributes mainly to the recharge of the aquifer.

The purpose of this study was to evaluate, by simulation, the impact of irrigation techniques on wheat yield and growth using the generic agro-environmental model SALTMED under the climatic and soil conditions of zone R3, which is an irrigation area located in the region of Sidi Rahal about 40 km east of the city of Marrakech in the plain of Haouz. We started the study by calibrating the model based on two parameters: photosynthetic efficiency and harvest index. After calibration, we compared different irrigation techniques implemented in the model (surface irrigation, sprinkler irrigation, and drip irrigation). Simulation results showed that the drip irrigation technique is the most economical, exhibiting the lowest losses attributed to percolation and soil evaporation. Notably, percolation, a significant contributor to groundwater recharge, measured approximately 255.5 mm/season. In addition, the irrigation practice in the study area appears to be overestimated during the observed season and could be reduced by half, according to SALTMED. When the irrigation dose is halved, the simulated yield (grain and total biomass) decreases by only 1.33%.

How to cite: El Moussaoui, E. H., Moumni, A., Khabba, S., and Lahrouni, A.: Wheat irrigation in Marrakech conditions: A Simulation Study using SALTMED, EGU General Assembly 2024, Vienna, Austria, 14–19 Apr 2024, EGU24-10078, https://doi.org/10.5194/egusphere-egu24-10078, 2024.

EGU24-10387 | ECS | Orals | HS2.1.5

Nitrogen modeling and performance of Multi-Soil-Layering (MSL)bioreactor treating domestic wastewater in rural community 

Sofyan Sbahi, Naaila Ouazzani, Abdessamed Hejjaj, Abderrahman Lahrouni, and Laila Mandi

The multi-soil-layering (MSL) bioreactor has been considered in the latest research as an
innovative bioreactor for reducing the level of pollutants in wastewater. The efficiency of the
MSL bioreactor towards nitrogen pollution is due to the mineralization of organic nitrogen in
aerobic layers to ammonia, and reactivity of ammonia nitrogen with soil and gravel by its
adsorption into soil layers followed by nitrification and denitrification processes when the
alternating phases of oxygenated/anoxic conditions occurs in the filter. In this study, we have
examined the performance of the MSL bioreactor at different hydraulic loading rates (HLRs)
and predicted the removal rate of nitrogen. To improve the prediction accuracy of the models,
the feature selection technique was performed before conducting the Neural Network model.
The results showed a significant removal (p <0.05) efficiency for five-day biochemical
oxygen demand (BOD 5,  86%), ammonium (NH 4 + , 83%), nitrates (NO 3 − , 81%), total kjeldahl
nitrogen (TKN, 84%), total nitrogen (TN, 84%), orthophosphates (PO 4 3− , 91%), and total
coliforms (TC, 1.62 Log units). However, no significant change was observed in the nitrite
(NO 2 − ) concentration as it is an intermediate nitrogen form. The MSL treatment efficiency
demonstrated a good capacity even when HLR increased from 250 to 4000 L/m 2 /day,
respectively (e.g., between 64% and 86% for BOD 5 ). The HLR was selected as the most
significant (p < 0.05) input variable that contribute to predict the removal rates of nitrogen.
The developed models predict accurately the output variables (R 2  > 0.93) and could help to
investigate the MSL behavior.

How to cite: Sbahi, S., Ouazzani, N., Hejjaj, A., Lahrouni, A., and Mandi, L.: Nitrogen modeling and performance of Multi-Soil-Layering (MSL)bioreactor treating domestic wastewater in rural community, EGU General Assembly 2024, Vienna, Austria, 14–19 Apr 2024, EGU24-10387, https://doi.org/10.5194/egusphere-egu24-10387, 2024.

EGU24-11799 | ECS | Orals | HS2.1.5 | Highlight

Exploring the mechanisms controlling dryland hydroclimate in past 'warmer worlds' 

Monika Markowska, Hubert B. Vonhof, Huw S. Groucutt, Michael D. Petraglia, Denis Scholz, Michael Weber, Axel Gerdes, Richard Albert, Julian Schroeder, Yves S. Krüger, Anna Nele Meckler, Jens Fiebig, Matthew Stewart, Nicole Boivin, Samuel L. Nicholson, Paul S. Breeze, Nicholas Drake, Julia C. Tindall, Alan M. Haywood, and Gerald Haug

Drylands cover almost half of Earth’s land surfaces, supporting ~30% of the world’s population. The International Panel on Climate Change predicts increasing aridification and expansion of drylands over the course of this century. As we approach new climate states without societal precedent, Earth’s geological past may offer the best tool to understand hydroclimate change under previously, allowing us to elucidate responses to external forcing. Paleo-records from previously warm and high-CO2 periods in Earth’s past, such as the mid-Pliocene (~3 Ma), point towards higher humidity in many dryland regions. 

Here, we examine desert speleothems from the hyper-arid desert in central Arabia, part of the largest near-continuous chain of drylands in the world, stretching from north-western Africa to the northern China, to elucidate substantial and recurrent humid phases over the past 8 million years. Independent quantitative paleo-thermometers suggest that mean annual air temperatures in central Arabia were approximately between 1 to 5 °C warmer than today. The analyses of the isotopic composition (δ18O and δ2H) of speleothem fluid inclusion waters, representing ‘fossil rainwater’, reveal an aridification trend in Arabia from the Late Miocene to Late Pleistocene during Earth’s transition from a largely ‘ice-free’ northern hemisphere to an ‘ice-age’ world. Together, our data provide evidence for recurrent discrete wetter intervals during past warmer periods, such as the Pliocene. Data-model comparisons allow us to assess the agreement between our paleoclimate data and climate model output using the HadCM3 isotope-enabled model simulations during past ‘warmer worlds’ – namely the mid-Piacenzian warm period (3.264 to 3.025 Ma). To assess the hydroclimate response to external forcing, we examine model output from a series of sensitivity experiments with different orbital configurations allowing us to postulate the mechanisms responsible for the occurrence of humid episodes in the Arabian desert, with potential implications for other dryland regions at similar latitudes. Together, our approach unveils the long-term controls on Arabian hydroclimate and may provide crucial insights into the future variability.

How to cite: Markowska, M., Vonhof, H. B., Groucutt, H. S., Petraglia, M. D., Scholz, D., Weber, M., Gerdes, A., Albert, R., Schroeder, J., Krüger, Y. S., Meckler, A. N., Fiebig, J., Stewart, M., Boivin, N., Nicholson, S. L., Breeze, P. S., Drake, N., Tindall, J. C., Haywood, A. M., and Haug, G.: Exploring the mechanisms controlling dryland hydroclimate in past 'warmer worlds', EGU General Assembly 2024, Vienna, Austria, 14–19 Apr 2024, EGU24-11799, https://doi.org/10.5194/egusphere-egu24-11799, 2024.

EGU24-12194 | ECS | Orals | HS2.1.5

High resolution surface soil moisture microwave products: intercomparison and evaluation over Spain 

Nadia Ouaadi, Lionel Jarlan, Michel Le Page, Mehrez Zribi, Giovani Paolini, Bouchra Ait Hssaine, Maria Jose Escorihuela, Pascal Fanise, Olivier Merlin, Nicolas Baghdadi, and Aaron Boone

Surface soil moisture (SSM) products at high spatial resolution are increasingly available, either from the disaggregation of coarse-resolution products such as SMAP and SMOS, or from high-resolution radar data such as Sentinel-1. In contrast to coarse resolution products, there is a lack of intercomparison studies of high spatial resolution products, which are more relevant for applications requiring the plot scale. In this context, the objective of this work is the evaluation and intercomparison of three high spatial resolution SSM products on a large database of in situ SSM measurements collected on two different sites in the Urgell region (Catalonia, Spain) in 2021. The satellite SSM products are: i) SSMTheia product at the plot scale derived from a synergy of Sentinel-1 and Sentinel-2 using a machine learning algorithm; ii) SSMρ product at 14 m resolution derived from the Sentinel-1 backscattering coefficient and interferometric coherence using a brute-force algorithm; and iii) SSMSMAP20m product at 20 m resolution obtained from the disaggregation of SMAP using Sentinel-3 and Sentinel-2 data. Evaluation of the three products over the entire database showed that SSMTheia and SSMρ yielded a better estimate than SSMSMAP20m, and SSMρ is slightly better than SSMTheia. In particular, the correlation coefficient is higher than 0.4 for 72%, 40% and 27% of the fields using SSMρ, SSMTheia and SSMSMAP20m, respectively. The lower performance of SSMTheia compared to SSMρ is due to the saturation of SSMTheia at 0.3 m3/m3. The time series analysis shows that SSMSMAP20m is able to detect rainfall events occurring at large scale while irrigation at the plot scale are not caught. This is explained by the use of Sentinel-2 reflectances, which are not linked to surface water status, for the disaggregation of Sentinel-3 land surface temperature. The approach can therefore be improved by using high spatial and temporal resolution thermal data in the perspective of new missions such as TRISHNA and LSTM. Finally, the results show that although reasonable estimates are obtained for annual crops using SSMTheia and SSMρ, poor performance is observed for trees, suggesting the need for better representation of canopy components for tree crops in SSM inversion approaches.

How to cite: Ouaadi, N., Jarlan, L., Le Page, M., Zribi, M., Paolini, G., Ait Hssaine, B., Escorihuela, M. J., Fanise, P., Merlin, O., Baghdadi, N., and Boone, A.: High resolution surface soil moisture microwave products: intercomparison and evaluation over Spain, EGU General Assembly 2024, Vienna, Austria, 14–19 Apr 2024, EGU24-12194, https://doi.org/10.5194/egusphere-egu24-12194, 2024.

    The Yellow River (YR) is 5464 km long and the cradle of Chinese civilization. It is also well known for being the most sediment-laden river and having the largest vertical drop over its course. Although the YR accounts for only 3% of China’s water resources, it irrigates 13% of its cropland. Exceptional historical documents have recorded frequent occurrence of YR flooding events that resulted in huge losses of lives and property.
    The earliest observational record of YR runoff, beginning in 1919 at the Shanxian gauge station, is too short to study centennial-scale variability. Since the start of the Anthropocene in the 1960s, frequent human activities have resulted in large deviation between observed streamflow. The reconstruction of annual historical natural runoff of the YR is necessary to quantify the amount of anthropogenic YR water consumption in recent decades. Tree rings, with the merits of accurate dating and annual resolution, have been widely used in runoff reconstruction worldwide. In this study, 31 moisture-sensitive tree-ring width chronologies, including 860 trees and 1707 cores, collected within the upper-middle YR basins were used to reconstruct natural runoff for the middle YR course over the period 1492–2013 CE.
    The reconstruction provides a record of natural YR runoff variability prior to large-scale human interference. Most of the extreme high/low runoff events in the reconstruction can be verified with historical documents. The lowest YR flow since 1492 CE occurred during 1926–1932 CE and the YR runoff in 1781 is the highest. These two extreme values could be regarded as a benchmark for future judicious planning of water allocation. Since the late 1980s, observed YR runoff has fallen out of its natural range of variability, and there was even no water flow for several months each year in the lower YR course during 1995 to 1998. Especially concerning was that the inherent 11-year and 24-year cycles of YR became disordered following the severe drought event in late 1920s, and eventually disappeared after the 1960s.
    Year-to-year variability in YR water consumption by human activities (WCHA) was quantified, which showed good association between crop yields and acreage in Ningxia and Inner Mongolia irrigation regions. Meanwhile, WCHA was strongly negatively correlated with sediment load at Toudaoguai and Shanxian stations, which led to a 58% reduction of sediment load in Toudaoguai (upper reach) and 29% in Shanxian (middle reach). 
    If human activities continue to intensify, future YR runoff will be further reduced, and this will negatively impact agriculture, human lives, and socioeconomic development in the middle and lower basins of the YR. To reduce the risk of recurring cutoff of streamflow in the YR lower basin, water should be allocated judiciously. Our reconstructed YR natural runoff series are important for future YR water resource management. In addition, our results also provide an important model of how to distinguish and quantify anthropogenic influence from natural variability in global change studies.

How to cite: Liu, Y.: Changes and attribution of natural runoff in the Yellow River over the past 500 years, EGU General Assembly 2024, Vienna, Austria, 14–19 Apr 2024, EGU24-13979, https://doi.org/10.5194/egusphere-egu24-13979, 2024.

EGU24-14057 | ECS | Posters on site | HS2.1.5

Turbulent fluxes at kilometer scale determined by optical-microwave scintillometry in a heterogeneous oasis cropland of the Heihe River Basin 

Feinan Xu, Weizhen Wang, Chunlin Huang, Jiaojiao Feng, and Jiemin Wang

Observations of kilometer-scale turbulent fluxes of sensible (H) and latent heat (LE) are required for the validation of flux estimate algorithms from satellite remote-sensing data and the development of parameterization schemes in the hydro-meteorological models. Since 2019, two sets of Optical and Microwave scintillometer (OMS) systems have been operated in the Heihe River Basin of northwestern China, one on an alpine grassland of upper reaches, another on an oasis cropland of middle reaches, to measure both the areal H and LE. Combined with the observations of eddy-covariance (EC) and meteorological tower systems in both sites, an improved procedure for OMS data processing is proposed. The newly proposed procedure especially improves the preprocessing of raw scintillation data, properly uses the current probably better Lüdi et al. (2005) method in deriving meteorological structure parameters, and chooses the coefficients of similarity functions by Kooijmans and Hartogensis (2016) in calculating fluxes. Evaluated with the results of rather homogeneous grassland, the area-averaged H and LE over the heterogeneous oasis are then determined. Estimates of H and LE agree reasonably well with those obtained from EC in most cases. However, the most interesting is that LE over the oasis during the early crop growing stages is clearly larger than that of EC; while both agree well during the longer crop grown periods. Footprint analysis shows that, compared with EC, the OMS has clearly larger source area that contains a slight area of orchard and shelterbelts distributed near the light path, leading to larger LE during the early stages of crop growth. The area-averaged evapotranspiration (ET) over the oasis is then analyzed more acceptably, which varies from 3 to 5 mm day-1 depending on meteorological conditions during the 39 days of the crop growing period. These results are used to validate the Penman-Menteith-Leuning Version 2 (PML-V2) scheme.

How to cite: Xu, F., Wang, W., Huang, C., Feng, J., and Wang, J.: Turbulent fluxes at kilometer scale determined by optical-microwave scintillometry in a heterogeneous oasis cropland of the Heihe River Basin, EGU General Assembly 2024, Vienna, Austria, 14–19 Apr 2024, EGU24-14057, https://doi.org/10.5194/egusphere-egu24-14057, 2024.

    Recurrent droughts in history, especially climatic aridity since the mid-20th century have aroused great social anxiety about the water resources in the Chinese Loess Plateau (CLP). Given lacking of extended instrumental-like records, new precipitation reconstructions in the CLP are badly needed for objectively evaluating the current precipitation situation, understanding the spatial-temporal differences, and serving for predicting the future. Here we present a tree-ring-based 248-year regional precipitation reconstruction (P8–7) in the Heichashan Mountain, which can significantly represent the past dry-wet variations in the eastern CLP (ECLP). P8–7 explains 48.72% of the instrumental record, reveals a wetting trend since the early 2000s and attains the second wettest period over the past 248 years in 2014–2020 AD. The 1920s/2010s is recorded as the driest/wettest decade. 1910–1932 AD ranks as the driest period over the past centuries. The 19th century is comparatively wet while the 20th century is dry. Precipitation in the ECLP and western CLP (WCLP) has changed synchronously over most time of the past two centuries. However, regional difference exists in the 1890s–1920s when a gradually drying occurred in the ECLP, while not evident in the WCLP, although the 1920s megadrought occurred in the CLP. Moreover, the 20th-century drying in the ECLP begins in the 1950s, later than the WCLP. It reveals that P8–7 variability is primarily influenced by the Asian Summer Monsoon and related large-scale circulations. The seismic phase shift of the contemporaneous Northern Hemispheric temperature may also be responsible for the 1920s megadrought.

How to cite: Cai, Q. and Liu, Y.: Hydroclimatic characteristics on the Chinese Loess Plateau over the past 250 years inferred from tree rings, EGU General Assembly 2024, Vienna, Austria, 14–19 Apr 2024, EGU24-14189, https://doi.org/10.5194/egusphere-egu24-14189, 2024.

EGU24-16291 | ECS | Orals | HS2.1.5

A New Perspective on Agricultural Drought Periods: A Mediterranean Semi-Arid Context 

Kaoutar Oukaddour, Michel Le Page, and Younes Fakir

Extreme weather events have an increasing repercussions on ecosystems in recent years. By comprehending how vegetation responds to climatic extremes, their effects may be mitigated. In a semi-arid Mediterranean region, this study examines the temporal connections of the main triggers of agricultural drought, low precipitation, vegetation growth, thermal stress, and soil water deficit. Drought periods and their characteristics were determined using a revised run theory approach. The Pearson correlations across various spatial scales revealed a moderate to low degree of concordance among the drought indices. This discrepancy can be attributed to the geographical heterogeneity and climatic variations observed among the agrosystems within the basin.

The cross-correlation analysis demonstrated the cascading impacts resulting from reduced precipitation. During drought events, the significant connection between precipitation deficits and vegetation persists for at least one month across most index pairs. This suggests that agricultural drought occurrences can be temporally linked through the selected drought indices. The study unveiled short-, mid-, and long-term effects of precipitation deficiencies on soil moisture, vegetation, and temperature. As anticipated, variables like soil moisture and surface temperature, being more instantaneous, exhibited no lag in response to precipitation. Notably, vegetation anomalies at the monthly time step displayed a two-month lag, indicating a preceding impact of vegetation on precipitation.

Employing the run theory to identify drought events and stages with different thresholds revealed substantial variability in drought characteristics namely the duration, the magnitude magnitude, and the intensity. This variability was notably influenced by the selection of both normality and drought thresholds.

How to cite: Oukaddour, K., Le Page, M., and Fakir, Y.: A New Perspective on Agricultural Drought Periods: A Mediterranean Semi-Arid Context, EGU General Assembly 2024, Vienna, Austria, 14–19 Apr 2024, EGU24-16291, https://doi.org/10.5194/egusphere-egu24-16291, 2024.

EGU24-17049 | ECS | Orals | HS2.1.5

Potential of the Photochemical Reflectance Index in Understanding Photoinhibition and Improving Irrigation Water Efficiency in the Mediterranean Zone 

Zoubair Rafi, Saïd Khabba, Valérie Le Dantec, Patrick Mordelet, Salah Er-Raki, Abdelghani Chehbouni, and Olivier Merlin

Morocco's semi-arid region faces challenges due to limited water resources, necessitating efficient irrigation practices for sustainable agriculture. Precision agriculture, coupled with advanced technologies like the Photochemical Reflectance Index (PRI), holds great potential for optimizing irrigation water usage and enhancing crop productivity in this environment. This abstract provides a comprehensive overview of integrating precision agriculture techniques, PRI, and Net Radiation (Rn) to improve irrigation water efficiency and maximize crop productivity in Morocco's semi-arid zone. The study presents and analyzes an experimental investigation of the PRI signal in a winter wheat field throughout an agricultural season to comprehend its dependence on agro-environmental parameters such as global radiation (Rg) and Rn. Rn directly impacts the energy absorbed by plants, a crucial factor for photosynthesis. Elevated Rn levels generally increase energy availability for photosynthetic processes, resulting in higher chlorophyll fluorescence and PRI values. However, excessive Rn can lead to photoinhibition, damaging the photosynthetic apparatus and reducing photosynthetic efficiency. Understanding the interplay between net radiation, PRI, and photoinhibition is crucial for optimizing agricultural practices. Monitoring and managing net radiation levels allow farmers to ensure that the energy available for photosynthesis remains within the optimal range, minimizing the risk of photoinhibition while maximizing crop productivity. Additionally, the daily water stress index based on PRI (PRIj), developed independently of structural effects related to leaf area index (LAI), showed a coefficient of determination (R2) of 0.74 between PRIj and Rn. This reflects the extent of excessive light stress experienced by the wheat field throughout the experiment. In conclusion, the integration of precision agriculture techniques, specifically PRI, offers a promising approach to enhance irrigation water efficiency in Morocco's semi-arid zone. By employing this innovative tool, farmers can optimize water usage, reduce environmental impacts, and ensure the long-term sustainability of agriculture.

How to cite: Rafi, Z., Khabba, S., Le Dantec, V., Mordelet, P., Er-Raki, S., Chehbouni, A., and Merlin, O.: Potential of the Photochemical Reflectance Index in Understanding Photoinhibition and Improving Irrigation Water Efficiency in the Mediterranean Zone, EGU General Assembly 2024, Vienna, Austria, 14–19 Apr 2024, EGU24-17049, https://doi.org/10.5194/egusphere-egu24-17049, 2024.

EGU24-17321 | ECS | Orals | HS2.1.5

Quantifying Olive Tree Evapotranspiration in Semi-Arid Regions through Remote Sensing-Based SEBAL Model: Validation with Optical-Microwave Scintillometer 

Hamza Barguache, Jamal Ezzahar, Mohamed Hakim Kharrou, Said Khabba, Jamal Elfarkh, Abderrahim Laalyej, Salah Er-Raki, and Abdelghani Chehbouni

Accurately assessing sensible (H) and latent (LE) heat fluxes, along with evapotranspiration, is crucial for comprehending the energy balance at the biosphere-atmosphere interface and enhancing agricultural water management. Although the eddy covariance (EC) method is commonly employed for these measurements, it has limitations in providing spatial representativeness beyond a few hundred meters. Addressing this challenge, optical-microwave scintillometers (OMS) have emerged as a valuable tool, directly measuring kilometer-scale H and LE fluxes. These measurements serve to validate satellite remote sensing products and model simulations, such as the Surface Energy Balance Algorithm for Land (SEBAL). In this study, OMS measurements were utilized to assess the fluxes simulated by the SEBAL model at the Agdal olive orchard near Marrakech city. The results revealed that SEBAL's estimated sensible heat fluxes were 3% higher than those measured by OMS, while latent heat fluxes were approximately 15% lower. Based on these findings, we infer that OMS can effectively validate satellite-driven surface energy balance models, thereby supporting agricultural water management.

How to cite: Barguache, H., Ezzahar, J., Kharrou, M. H., Khabba, S., Elfarkh, J., Laalyej, A., Er-Raki, S., and Chehbouni, A.: Quantifying Olive Tree Evapotranspiration in Semi-Arid Regions through Remote Sensing-Based SEBAL Model: Validation with Optical-Microwave Scintillometer, EGU General Assembly 2024, Vienna, Austria, 14–19 Apr 2024, EGU24-17321, https://doi.org/10.5194/egusphere-egu24-17321, 2024.

EGU24-17560 | ECS | Posters virtual | HS2.1.5

Estimation of Irrigation Water Demand in the Southern Mediterranean Region through Explicit Integration of Irrigation Processes in a Land Surface Model: A Case Study of the Tensift Catchment (Morocco). 

Ahmed Moucha, Lionel Jarlan, Pére Quintana-Segui, Anais Barella-Ortiz, Michel Le Page, Simon Munier, Adnane Chakir, Aaron Boone, Fathallah Sghrer, Jean-christophe Calvet, and Lahoucine Hanich

The utilization of water by various socio-economic sectors has made this resource highly sought after, especially in arid to semi-arid zones where water is already scarce and limited. In this context, effective management of this resource proves to be crucial. Our study aims to: evaluate the performance of the new irrigation module in ISBA, quantify the water balance, and assess the impact of climate change and anthropogenic factors on this resource by the horizon of 2041-2060, utilizing high-resolution futuristic forcings from the study (Moucha et al., 2021). To assess the ISBA model with its new irrigation module, we initially compared observed and predicted fluxes with and without activation of the irrigation module. Subsequently, we compared irrigation water inputs at the ORMVAH-defined irrigated perimeters within the Tensift basin. The results of this evaluation showed that the predictions of latent heat flux (LE) considering all available stations in the basin shifted from -60 W/m² for the model without irrigation to -15 W/m². This indicates that the integration of the new irrigation system into ISBA significantly improves the predictions of latent heat flux (LE) over the period 2004-2014 compared to the regular model. Considering the irrigated perimeters, the study results demonstrated that the model with the integration of the irrigation module was capable of replicating the overall magnitude and seasonality of water quantities provided by ORMVAH despite a positive bias. Exploration of the water balance at the Tensift basin level revealed the ISBA model's ability, equipped with its irrigation module, to describe complex relationships among precipitation, irrigation, evapotranspiration, and drainage. Finally, the assessment of the impact of climate change and vegetation cover for the period 2041-2060, utilizing high-resolution SAFRAN forcings projected to the same horizon (Moucha et al., 2021), revealed an increase in irrigation water needs. These results are of paramount importance in the context of sustainable water resource management in arid and semi-arid regions.

How to cite: Moucha, A., Jarlan, L., Quintana-Segui, P., Barella-Ortiz, A., Le Page, M., Munier, S., Chakir, A., Boone, A., Sghrer, F., Calvet, J., and Hanich, L.: Estimation of Irrigation Water Demand in the Southern Mediterranean Region through Explicit Integration of Irrigation Processes in a Land Surface Model: A Case Study of the Tensift Catchment (Morocco)., EGU General Assembly 2024, Vienna, Austria, 14–19 Apr 2024, EGU24-17560, https://doi.org/10.5194/egusphere-egu24-17560, 2024.

EGU24-17649 | ECS | Orals | HS2.1.5

Comprehensive Analysis of Hydrological Dynamics and Uncertainties in the Moroccan High Atlas: A Focus on Seasonal Precipitation, Runoff, and Flood Events 

Myriam Benkirane, Abdelhakim Amazirh, El Houssaine Bouras, Adnane Chakir, and Said Khabba

The Mediterranean regions, particularly the Moroccan High Atlas, is exposed to natural risks associated with the hydrological cycle, notably intense precipitation events that trigger sudden floods. This research delves into the subtleties of hydrological dynamics in the High Atlas watersheds, specifically in the Zat watershed, to comprehend the seasonality of precipitation and runoff and elucidate the origins of floods.

The results reveal a strong correlation between observed and simulated hydrographs, affirming the model's capability to capture complex hydrological processes. Evaluation metrics, particularly the Nash coefficient, demonstrate a robust model performance during the calibration phase, ranging from 61.9% to 90%. This attests to the model's ability to reproduce the dynamic nature of hydrological systems in the Moroccan High Atlas.

It is noteworthy that the study identifies the snowmelt process as a significant factor of uncertainty in runoff flooding parameters. The complexities associated with snowmelt, especially in the context of spring precipitation, emerge as a crucial factor influencing uncertainties in the simulated results. This finding underscores the importance of accurately representing snowmelt dynamics in hydrological simulations for regions prone to natural risks.

Moreover, the integration of Probability Distribution Functions and Monte Carlo simulations, coupled with rigorous evaluation metrics, enhances our understanding of calibration parameter uncertainties and validates the model's performance. The identified influence of snowmelt on runoff flooding parameters provides crucial insights for future model improvements and the development of effective mitigation strategies in regions vulnerable to natural risks. This research contributes to advancing hydrological modeling practices in complex terrain.


Keywords: Seasonality, Rainfall-Runoff, Floods, Calibration, Monte Carlo simulation, Parameter Uncertainty, Hydrological Modeling, Snowmelt Dynamics, Natural Risks.

How to cite: Benkirane, M., Amazirh, A., Bouras, E. H., Chakir, A., and Khabba, S.: Comprehensive Analysis of Hydrological Dynamics and Uncertainties in the Moroccan High Atlas: A Focus on Seasonal Precipitation, Runoff, and Flood Events, EGU General Assembly 2024, Vienna, Austria, 14–19 Apr 2024, EGU24-17649, https://doi.org/10.5194/egusphere-egu24-17649, 2024.

The Mediterranean area is recognized as a hotspot for climate change challenges, with noticeable patterns of rising temperatures and dryness. Olive agroecosystems are particularly affected by the increasing aridity and global climatic changes. Despite being a symbol of the Mediterranean and traditionally grown using rainfed agricultural practices, olive growers have to adapt to cope with higher temperatures, drought, and more frequent severe weather incidents, necessitating their attention and adaptation (Fraga et al., 2020). Moreover, crop production in Morocco heavily relies on irrigation because rainfed cropping has limited productivity (Taheripour et al., 2020). The olive sector is of great importance in Morocco, and there is an urgent need to implement sustainable water management practices. This includes water-saving strategies such as regulated and sustained deficit irrigation (RDI and SDI) to sustain olive production and strengthen the sector's resilience to climate change and water scarcity. These strategies primarily differ in terms of their irrigation timing and the quantity of water applied (Ibba et al., 2023). This study aims to evaluate the effect of two deficit irrigation strategies on productive parameters of the Menara olive cultivar, to serve as a tool for operational irrigation water management and appraise the adaptive responses of this cultivar under conditions of induced drought stress. In pursuit of this aim, an experiment was carried out in an olive orchard over two consecutive years (2021 and 2022), comparing four treatments of regulated deficit irrigation (RDI): T1 (SP 100- NP 70% ETc), T2 (SP 100- NP 60% ETc), T3 (SP 80- NP 70% ETc), T4 (SP 80- NP 60% ETc) and two treatments of sustained deficit irrigation (SDI): T5 (70% ETc) and T6 (60% ETc), with fully irrigated trees T0 (100% ETc). The findings showed that controlled water stress, as applied through regulated deficit irrigation (RDI), did not exert a severe impact on the flowering traits and yield of the Menara olive cultivar. Notably, the RDI strategy, particularly under T4 treatment, allowed for the reduction of supplied water by 20% in sensitive periods (SP) flowering and from the beginning of oil synthesis to harvest and by 40% in the normal period (NP)during pit hardening, respectively, without compromising fruit yield. However, the SDI strategy, characterized by restricted water availability, which reduced total water application under T5 and T6 treatments by 30% and 40% throughout the entire season, led to a decline in the fruit yield by about 50% and resulted in the most significant drop in water productivity, ranging from 19% to 33% compared to the control T0. Furthermore, the findings underscored the adaptability of responses to water stress and elucidated the consequential impact of each irrigation strategy on the performance of Menara olive trees across successive years, particularly the importance of regulated deficit irrigation as a water management strategy and the need to consider its implication on flowering traits and crop yield over successive growing seasons to establish the enduring adaptability of this locally cultivated olive cultivar.

How to cite: Ibba, K., Er-Raki, S., Bouizgaren, A., and Hadria, R.: Sustainable Water Management for Menara Olive Cultivar: Unveiling the Potential of Regulated and Sustained Deficit Irrigation Strategies in Morocco, EGU General Assembly 2024, Vienna, Austria, 14–19 Apr 2024, EGU24-17808, https://doi.org/10.5194/egusphere-egu24-17808, 2024.

EGU24-17983 | ECS | Orals | HS2.1.5

Comparison of C-band radar and infrared thermal data for monitoring corn field in semi-arid area. 

Abdelhafid Elallaoui, Pierre-Louis Frison, Saïd Khabba, and Lionel Jarlan

In semi-arid Mediterranean regions, the scarcity and limitations of water resources pose major challenges. These invaluable resources are threatened by various factors such as climate change, population growth, urban expansion, and agricultural intensification. Specifically, agriculture, which consumes approximately 85% of the water in the semi-arid zone of the South Mediterranean region, directly contributes to the depletion of groundwater. To promote rational irrigation management, it becomes imperative to monitor the water status of crops. Remote sensing is a valuable technique allowing for monitoring crop fields in different parts of the electromagnetic spectrum giving complementary information about crop parameters. The main objective of this study is to assess the potential of radar and Infrared Thermal data for monitoring the water status of crops in semi-arid regions. In this context, a radar system was installed in Morocco, in the Chichaoua region, consisting of 6 C-band antennas mounted on a 20-meter tower. These antennas are directed towards a maize field. This system allowed for radar data acquisition in three different polarizations (VV, VH, HH) with a 15-minute time-step over the time period extending from September to December 2021. Additionally, the system is complemented by continuous acquisitions from a Thermal Infrared Radiometer (IRT) at 30-minute intervals. These data are further supplemented by in-situ measurements characterizing crop parameters (state of the cover, soil moisture, evapotranspiration and meteorological variables). The study initially focused on analyzing the diurnal cycle of radar temporal coherence. The results indicated that coherence was highly sensitive to wind-induced movements of scatterers, with minimal coherence when wind speed was highest in the late afternoon. Moreover, coherence was also responsive to vegetation activity, particularly its water content, as the morning coherence drop coincided with the onset of plant activity. Subsequently, the study examined the potential of the relative difference between surface vegetation temperature and air temperature to monitor the water status of crops. The results showed that during a period of imposed water stress, the amplitude of this difference increased. These results open perspectives for monitoring the water status of crops using radar and thermal observations with a high revisit frequency.

How to cite: Elallaoui, A., Frison, P.-L., Khabba, S., and Jarlan, L.: Comparison of C-band radar and infrared thermal data for monitoring corn field in semi-arid area., EGU General Assembly 2024, Vienna, Austria, 14–19 Apr 2024, EGU24-17983, https://doi.org/10.5194/egusphere-egu24-17983, 2024.

EGU24-18201 | ECS | Orals | HS2.1.5

Analyzing Tree Degradation in the Haouz Plain through Remote Sensing: Assessing the Impact of Drought and Spatial Extent 

Youness Ablila, Abdelhakim Amazirh, Saïd Khabba, El Houssaine Bouras, Mohamed hakim Kharrou, Salah Er-Raki, and Abdelghani Chehbouni

Trees characterized by persistent foliage, like olive trees, serve as indispensable assets in arid and semi-arid regions, exemplified by the Haouz plain in central Morocco. The decline in water resources for irrigation, attributed to climate change and excessive underground water extraction, has led to significant degradation of tree orchards in recent years. Employing remote sensing data, we conducted a spatial analysis of tree degradation from 2013 to 2022 using the supervised classification method. Subsequently, a drying speed index (DS) was computed based on the Normalized Difference Vegetation Index (NDVI) derived from Landsat-8 data, specifically focusing on the identified trees. This DS was then correlated with the Standardized Precipitation Index (SPIn) to elucidate the connection between tree degradation and drought, as indicated by precipitation deficit. The findings reveal a discernible declining trend in trees, with an average decrease in NDVI by 0.02 between 2019 and 2022 compared to the reference period (2013-2019). This decline has impacted an extensive area of 37,550 hectares. Furthermore, the outcomes derived from the analysis of SPI profiles depict a prolonged period of dryness, particularly extreme drought in the past four years, characterized by SPI values consistently below -2. Notably, a high correlation coefficient (R) of -0.87 and -0.88 was observed between DS and SPI9 and SPI12 respectively, emphasizing the strong linkage between drying speed and the duration and intensity of drought. These findings emphasize the reliability of NDVI as an effective tool for precise classification of tree land cover. Additionally, they underscore the significant influence of drought on the degradation of trees in the Haouz plain.

How to cite: Ablila, Y., Amazirh, A., Khabba, S., Bouras, E. H., Kharrou, M. H., Er-Raki, S., and Chehbouni, A.: Analyzing Tree Degradation in the Haouz Plain through Remote Sensing: Assessing the Impact of Drought and Spatial Extent, EGU General Assembly 2024, Vienna, Austria, 14–19 Apr 2024, EGU24-18201, https://doi.org/10.5194/egusphere-egu24-18201, 2024.

EGU24-18295 | ECS | Posters on site | HS2.1.5

The relevance of Rossby wave breaking for precipitation in the world’s arid regions 

Andries Jan De Vries, Moshe Armon, Klaus Klingmüller, Raphael Portmann, Matthias Röthlisberger, and Daniela I.V. Domeisen

Precipitation-related extremes in drylands expose more than a third of the world population living in these regions to drought and flooding. While weather systems generating precipitation in humid low- and high-latitude regions are widely studied, our understanding of the atmospheric processes governing precipitation formation in arid regions remains fragmented at best. Regional studies have suggested a key role of the extratropical forcing for precipitation in arid regions. Here we quantify the contribution of Rossby wave breaking for precipitation formation in arid regions worldwide. We combine potential vorticity streamers and cutoffs identified from ERA5 as indicators of Rossby wave breaking and use four different precipitation products based on satellite-based estimates, station data, and reanalysis. Rossby wave breaking is significantly associated with up to 80% of annual precipitation and up to 90% of daily precipitation extremes in arid regions equatorward and downstream of the midlatitude storm tracks. The relevance of wave breaking for precipitation increases with increasing land aridity. Contributions of wave breaking to precipitation dominate in the poleward and westward portions of subtropical arid regions during the cool season. In these regions, climate projections for the future suggest a strong precipitation decline, while projections of precipitation extremes are highly uncertain due to the influence of the atmospheric circulation. Thus, our findings emphasize the importance of Rossby wave breaking as an atmospheric driver of precipitation in arid regions with large implications for understanding projections and constraining uncertainties of future precipitation changes in arid regions that are disproportionally at risk of freshwater shortages and flood hazards.

How to cite: De Vries, A. J., Armon, M., Klingmüller, K., Portmann, R., Röthlisberger, M., and Domeisen, D. I. V.: The relevance of Rossby wave breaking for precipitation in the world’s arid regions, EGU General Assembly 2024, Vienna, Austria, 14–19 Apr 2024, EGU24-18295, https://doi.org/10.5194/egusphere-egu24-18295, 2024.

EGU24-19012 | Orals | HS2.1.5

Decoupling the Influence of Climate Change and Natural Variability on the Middle Eastern Shamal Wind  

Hamza Kunhu Bangalth, Jerry Raj, Udaya Bhaskar Gunturu, and Georgiy Stenchikov

The Middle Eastern Shamal, a prominent north-northwesterly wind, plays a crucial role in the Arabian Peninsula's climate and environment. Originating from the interaction between a semipermanent anticyclone over northern Saudi Arabia and a cyclone over southern Iran, it influences regional climate. The Shamal is essential in transporting dust and pollutants from the Tigris-Euphrates to the Persian Gulf, affecting air quality, health, and travel. Its potential as a renewable energy source also highlights its importance for the region's future energy strategies.

However, understanding the time series of the Shamal wind is a complex task, owing to the intertwined influences of natural climate variability and human-induced climate change. While climate change is a critical factor, natural variability driven by internal climate modes like the Atlantic Multidecadal Oscillation (AMO), Pacific Decadal Oscillation (PDO), and North Atlantic Oscillation (NAO) also significantly influences these winds. These oscillations, operating over multidecadal scales, alongside the overarching trend of climate change, form a complex web affecting the regional climate. 

This study addresses the challenge of decoupling the impacts of climate change and natural climate variability on the Shamal wind. Our analysis employs Empirical Mode Decomposition (EMD), a relatively new approach that allows us to decouple the influence of various internal climate modes from that of anthropogenic climate change. This method surpasses traditional techniques by avoiding assumptions of linearity and stationarity. The study utilizes ERA5 reanalysis data to analyze summer and winter Shamal winds.

Preliminary findings indicate that internal climate modes like the AMO are equally significant as climate change in influencing Shamal wind in the past. This insight is crucial for more accurate projections and predictions of future Shamal wind behavior, benefiting the Middle East's environmental management, health, and renewable energy sectors.

How to cite: Bangalth, H. K., Raj, J., Gunturu, U. B., and Stenchikov, G.: Decoupling the Influence of Climate Change and Natural Variability on the Middle Eastern Shamal Wind , EGU General Assembly 2024, Vienna, Austria, 14–19 Apr 2024, EGU24-19012, https://doi.org/10.5194/egusphere-egu24-19012, 2024.

EGU24-19172 | Orals | HS2.1.5

Assessing the possibilities of Sentinel products for qualifying and quantifying soil water status of agricultural systems in southern France  

Claude Doussan, Urcel Kalenga Tshingomba, Nicolas Baghdadi, Fabrice Flamain, Arnaud Chapelet, Guillaume Pouget, and Dominique Courault

Water management poses a pervasive challenge in southern France, exacerbated by increasing summer droughts linked to global warming. Water use during spring and summer increases and gets more variable in term of quantity used for crops. Agricultural water use is highly influenced by the diversity in irrigation practices and technics (sprinkler irrigation, drip irrigation, flooding, etc.) ; and can lead to tensions among water users. It is thus essential to estimate field water use at basin scale, as well as crop water status, in order to further optimize water delivered for irrigation. Advances in remote sensing, particularly with Sentinel 1 (S1) and 2 (S2) data, facilitated the development of soil moisture products (SMP) with improved spatial and temporal resolution to characterize soil water in agricultural plots. These SMP products are accessible through the Theia French public platform and suitable for main crops, with NDVI below 0.75 or surfaces with moderate roughness. These specifications can be met for a variety of crop conditions in the south of France. Yet, the validity of the SMP products under various agricultural plot conditions, considering slope, orientation, roughness, and soil moisture, remains to be assessed over extended time periods. From another point of view, such SMP products do not presently apply to orchards plots, which are however, an essential but overlooked component of water use in irrigation and deserve further examination with S1 and S2 data. The objective of our study is twofold: (i) to test SMP products for field crops in different settings and among years, (ii) to preliminary test if S1 data, combined to S2 data, may be linked to soil moisture in orchard plots. Results reveal for (i) that differences can appear between SMP products and soil moisture in various monitored plots, primarily due to variability within farming systems. Beyond a specific slope and vegetation threshold, the correlation does not improve significantly. For (ii), in orchards plots, using a time smoothing of data, S1 VV-retrodiffusion data and NDVI from S2 seem to correlate with soil moisture measurements, with an RMSE < 0.05 cm3/cm3 and enable detection of irrigation events. This study shows that S1 and S2 data are valuable in estimating soil moisture of agricultural plots, giving however some limits in their use, and gives some hope in their further use for orchards water management.

How to cite: Doussan, C., Kalenga Tshingomba, U., Baghdadi, N., Flamain, F., Chapelet, A., Pouget, G., and Courault, D.: Assessing the possibilities of Sentinel products for qualifying and quantifying soil water status of agricultural systems in southern France , EGU General Assembly 2024, Vienna, Austria, 14–19 Apr 2024, EGU24-19172, https://doi.org/10.5194/egusphere-egu24-19172, 2024.

EGU24-19511 | Posters on site | HS2.1.5

OurMED PRIMA-funded Project: Sustainable Water Storage and Distribution in the Mediterranean 

Seifeddine Jomaa, Amir Rouhani, Maria Schade, J. Jaime Gómez-Hernández, Antonio Moya Diez, Maroua Oueslati, Anis Guelmami, George P. Karatzas, Emmanouil A Varouchakis, Maria Giovanna Tanda, Pier Paolo Roggero, Salvatore Manfreda, Nashat Hamidan, Yousra Madani, Patrícia Lourenço, Slaheddine Khlifi, Irem Daloglu Cetinkaya, Michael Rode, and Nadim K Copty

The Mediterranean Region is a unique mosaic of different cultures and climates that shape its peoples, natural environment, and species diversity. However, rapid population growth, urbanisation and increased anthropogenic pressures are threatening water quantity, quality, and related ecosystem services. Known as a climate change hotspot, the Mediterranean region is increasingly experiencing intensifying droughts, diminished river flows, and drier soils making water management even more challenging. This situation calls for an urgent need for water management to shift from a mono-sectoral water management approach based on trade-offs, to more balanced multisectoral management that considers the requirement of all stakeholders. This means that sustainable water management requires ensuring that water is stored and shared fairly across all sectors at the basin scale.

The research project OurMED (https://www.ourmed.eu/) is part of the Partnership for Research and Innovation in the Mediterranean Area (PRIMA) Programme supported by the European Union’s Horizon 2020 Research and Innovation Programme under Grant Agreement No 2222. The project was launched in June 2023 and will continue for three years with a grant of 4.4 million euros to develop a holistic water storage and distribution approach tightly integrated into ecosystem services at the river basin scale.

OurMED builds on the multidisciplinary skills of 15 consortium Partners and comprises universities, NGOs, research centres and SMEs from ten countries with complementary expertise in hydrology, hydrogeology, agronomy, climate change, social sciences, remote sensing, digital twins, ecology, and environmental sciences, among others, making it a truly interdisciplinary project. OurMED includes eight distinct demo sites, representing diverse water-related ecosystem properties of the Mediterranean landscape. These include the catchment areas of Bode (Germany), Agia (Crete, Greece), Konya (Turkey), Mujib (Jordan), Medjerda (Tunisia), Sebou (Morocco), Arborea (Sardinia, Italy), and Júcar (Spain). The Mediterranean basin, as a whole, is considered as an additional regional demo site to ensure replicability and reproducibility of proposed solutions at larger scales. 

OurMED vision combines not only technologically-advanced monitoring, smart modelling and optimization capabilities, but also provides data fusion and integrated digital twin technologies to make optimized solutions readily available for decision making. OurMED concept and its implementation to the different demo sites will be presented and discussed.

How to cite: Jomaa, S., Rouhani, A., Schade, M., Gómez-Hernández, J. J., Moya Diez, A., Oueslati, M., Guelmami, A., Karatzas, G. P., Varouchakis, E. A., Tanda, M. G., Roggero, P. P., Manfreda, S., Hamidan, N., Madani, Y., Lourenço, P., Khlifi, S., Daloglu Cetinkaya, I., Rode, M., and Copty, N. K.: OurMED PRIMA-funded Project: Sustainable Water Storage and Distribution in the Mediterranean, EGU General Assembly 2024, Vienna, Austria, 14–19 Apr 2024, EGU24-19511, https://doi.org/10.5194/egusphere-egu24-19511, 2024.

EGU24-20067 | ECS | Orals | HS2.1.5

Impact Of Ocean Layer Thickness on The Simulation Of African Easterly Waves in High-Resolution Coupled General Circulation Model Simulations 

Jerry Raj, Elsa Mohino Harris, Maria Belen Rodriguez de Fonseca, and Teresa Losada Doval

African easterly waves (AEWs) play a crucial role in the high-frequency variability of West African Monsoon (WAM) precipitation. AEWs are linked to more than 40% of the total Mesoscale Convective Systems (MCSs) in the region and these MCSs contribute approximately 80% of the total annual rainfall over the Sahel. Moreover, around 60% of all Atlantic hurricanes, including 80% of major hurricanes, have their genesis associated with AEWs. The simulation of AEWs poses challenges for General Circulation Models (GCMs), for instance, coarse-resolution models in CMIP5 cannot simulate distinct northern and southern AEW tracks. Additionally, accurately simulating rainfall over West Africa proves to be a challenge for these models due to the involvement of multiscale processes and the influence of complex topography and coastlines. 

The present study investigates the impact of ocean layer thickness on the simulation of African easterly waves (AEWs) using a high-resolution coupled General Circulation Model (GCM). The study employs high-resolution global simulations conducted using the climate model ICON as part of the next Generation Earth System Modeling Systems (nextGEMS) project. Two experiments, each spanning 30 years with a horizontal resolution of 10 km, are conducted. These experiments vary in terms of the thickness of the layers in the upper 20m of the ocean. In one experiment, the upper 20m ocean layers have a thickness of 2m, whereas in the other, it is 10m. The representation of two types of AEWs with periods of 3-5 days and 6-9 days are analyzed in the simulations. There is a notable disparity in the representation of African easterly waves (AEWs) between these two experiments. The simulation with thicker ocean layers exhibits less intense wave activity over the Sahel and equatorial Atlantic for 3-5 day AEWs which is evident in the eddy kinetic energy field. This corresponds to diminished convection and negative precipitation anomalies for 3-5 day AEWs compared to the 2m upper ocean layer thickness simulation. In the case of 6-9 day AEWs, the simulation with thicker ocean layers exhibits intensification of wave activity over northern West Africa.

How to cite: Raj, J., Mohino Harris, E., Rodriguez de Fonseca, M. B., and Losada Doval, T.: Impact Of Ocean Layer Thickness on The Simulation Of African Easterly Waves in High-Resolution Coupled General Circulation Model Simulations, EGU General Assembly 2024, Vienna, Austria, 14–19 Apr 2024, EGU24-20067, https://doi.org/10.5194/egusphere-egu24-20067, 2024.

EGU24-20356 | ECS | Posters on site | HS2.1.5

Seasonal Water Turbidity Dynamics in Arid Central Asia: A Case Study of Lake Balkhash, Kazakhstan, Under Changing Environmental Conditions 

Kanchan Mishra, Kathryn E. Fitzsimmons, and Bharat Choudhary

Lake Balkhash, one of the largest inland lakes in Central Asia, plays a pivotal role in providing water and ecosystem services to approximately 3 million people. However, like many water bodies in dryland regions worldwide, Lake Balkhash's hydrology has been significantly affected by climate change and land cover and land-use shifts driven by population growth and water-intensive economic activities. To manage these vital water resources effectively, monitoring the health of water bodies is essential for effective water resource management, security, and environmental conservation. Turbidity, a water quality indicator, measures the water clarity and represents a broader environmental change, allowing us to assess the water body's health and the extent of anthropogenic impact on the entire catchment. It is a measure of water clarity and serves as a crucial indicator of water health, as it represents the primary mechanism for transporting pollutants, algae, and suspended particles.

The present study investigates the temporal and spatial variability of turbidity in Lake Balkhash. We utilize the normalized difference turbidity index (NDTI) with Landsat satellite data spanning from 1991 to 2022 to map turbidity. We consider various climatic and anthropogenic factors, including precipitation, temperature, wind speed and direction, and water levels in and around the lake.

Our findings reveal an overall declining turbidity trend over interannual and seasonal timescales. The results provide a significant negative correlation between turbidity, temperature, and water levels at both temporal scales. However, no straightforward relationship emerges between turbidity and precipitation or wind variables. Specifically, during spring and summer, turbidity exhibits a strong association with temperature and water levels, while in the fall season, water levels are more closely correlated with turbidity. These results underscore the substantial impact of rising temperatures and fluctuations in water levels on the turbidity dynamics of Lake Balkhash. These findings highlight that the warming climate and alterations in lake hydrology pose significant risks to water quality, indicating that monitoring water health alone may not suffice to mitigate the impacts of climate change and human activities.  

How to cite: Mishra, K., Fitzsimmons, K. E., and Choudhary, B.: Seasonal Water Turbidity Dynamics in Arid Central Asia: A Case Study of Lake Balkhash, Kazakhstan, Under Changing Environmental Conditions, EGU General Assembly 2024, Vienna, Austria, 14–19 Apr 2024, EGU24-20356, https://doi.org/10.5194/egusphere-egu24-20356, 2024.

EGU24-20398 | Posters on site | HS2.1.5

Analysis of operational droughts in an alpine Mediterranean basin using a conjunctive use model of surface and groundwater resources 

Juan-de-Dios Gómez-Gómez, Antonio Collados-Lara, David Pulido-Velázquez, Leticia Baena-Ruiz, Jose-David Hidalgo-Hidalgo, Víctor Cruz-Gallegos, Patricia Jimeno-Sáez, Javier Senent-Aparicio, Fernando Delgado-Ramos, and Francisco Rueda-Valdivia

Extreme events, and particularly, droughts are a main concern in Mediterranean basins that will be increased in the future due to climate change (CC), according to the forecasting for the region made by researchers. A novel integrated approach is proposed to analyze operational droughts and their propagation in future CC scenarios at a basin scale. This approach has been applied to the Alto Genil basin (Granada, Spain), an alpine Mediterranean basin with the singularity of having an important snow component in its precipitation regime. The Standardized Precipitation Index (SPI) methodology has been applied to the variable Demand Satisfaction Index (DSI) at a monthly scale to evaluate operational droughts. A conjunctive use model of surface and groundwater resources developed with the code Aquatool has been used to obtain historical and future DSI monthly series. It is an integrated management model that includes all water demands, water resources (surface, groundwater, and their interaction), regulation and distribution infrastructures in the Alto Genil system. The Vega de Granada aquifer is a key element of the water supply system such for agricultural needs as for guarantee the urban supply to the city of Granada. Groundwater flow in this important aquifer has been simulated with a distributed approach defined by an eigenvalue model to integrate it in the management model, and in order to obtain a more detailed analysis of its future evolution. The proposed methodology consists of the sequential application of the following steps: (1) generation of future scenarios for the period 2071-2100 to obtain series of precipitation (P) and temperature (T); (2) application of a chain of models: a rainfall-runoff model (Témez) coupled with a snowmelt model to obtain runoff (Q) series in subbasins of Alto Genil basin, a crop water requirement model (Cropwat) to get agricultural demand series, and an integrated management model (Aquatool) to get historical and future series of DSI; and (3) analysis of operational droughts comparing historical and future series of the Standardized Demand Satisfaction Index (SDSI), which is the application of the SPI methodology to the variable DSI. A cluster analysis of variables P and Q has been made in order to define homogeneous hydroclimatic areas by aggregation of subbasins. It will allow us to perform an analyses of the heterogeneity in  the propagation of droughts.

Aknowledments: This research has been partially supported by the projects: STAGES-IPCC (TED2021-130744B-C21), SIGLO-PRO (PID2021-128021OB-I00), from the Spanish Ministry of Science, Innovation and Universities, RISRYEARTH (Recovery funds), and “Programa Investigo” (NextGenerationEU).

How to cite: Gómez-Gómez, J.-D., Collados-Lara, A., Pulido-Velázquez, D., Baena-Ruiz, L., Hidalgo-Hidalgo, J.-D., Cruz-Gallegos, V., Jimeno-Sáez, P., Senent-Aparicio, J., Delgado-Ramos, F., and Rueda-Valdivia, F.: Analysis of operational droughts in an alpine Mediterranean basin using a conjunctive use model of surface and groundwater resources, EGU General Assembly 2024, Vienna, Austria, 14–19 Apr 2024, EGU24-20398, https://doi.org/10.5194/egusphere-egu24-20398, 2024.

EGU24-20616 | Orals | HS2.1.5

Integrating Multi-Sensor and Multi-Platform Technologies for Enhanced Assessment of Spectral Indices and Phenological Dynamics in a Seasonal Tropical Dry Forest 

Magna Moura, Rodolfo Nobrega, Anne Verhoef, Josicleda Galvíncio, Rodrigo Miranda, Bruna Alberton, Desiree Marques, Cloves Santos, Bruno Nascimento, Maria Maraiza Pereira, and Patricia Morellato

The Seasonal Tropical Dry Forest (STDF) known as Caatinga occupies approx. 10% of the Brazilian territory. Its vegetation exhibits rapid phenological responses to rainfall resulting in corresponding increases in gross primary productivity and biomass production. Determining the timing of the start and end of the growing season is very important to ecosystem studies and to precisely quantify the carbon balance. Satellite-derived vegetation indices have been widely used to capture the vegetation dynamics in response to fluctuating environmental conditions. However, the spatial and temporal resolution of these indices cannot capture fine vegetation features and phenology metrics in a highly biodiverse and heterogeneous environment such as the Caatinga. On the other hand, phenocameras have been successfully used for this particular purpose for tropical and dry ecosystems. Complementarily, proximal spectral response sensors (SRS) have been used to allow computation of vegetation indices as phenology proxies. Due to their ability to capture high spatial resolution imagery, Unmanned Aerial Systems (UAS) or drones, can deliver an excellent spatial and a very good temporal resolution for diverse detailed vegetation studies. In this context, the objective of this study was to verify whether multi-sensor and multi-platform technologies provide an enhanced assessment of spectral indices and phenological dynamics of the Caatinga. The field campaign occurred in a pristine area of caatinga vegetation, located at the Legal Reserve of Caatinga, Embrapa Semi-Arid, Petrolina, Brazil. Indices for detecting phenology dynamics were obtained using multi-spectral cameras installed on unmanned aerial vehicles (UAV), field spectral response sensors (SRS), phenocameras (digital RGB cameras) and MODIS satellite data (visible and near infrared) from 2020 to 2023. Environmental driving data were measured via instrumentation installed on a flux tower. Standard statistical measures, including correlation coefficients were employed to verify the relationship observed on Normalized Difference Vegetation Index (NDVI), Photochemical Reflectance Index (PRI), and Green Chromatic Coordinate (Gcc) determined by different sensors and platforms. We observed a substantial and fast increase in Gcc, NDVI and PRI immediately after rainfall events. The sensitivity of NDVI and PRI to changes in vegetation can vary depending on factors such as vegetation greenness, overall plant health, and stress responses according to the environmental conditions of the study area. Particularly during the dry season, indices derived from higher spatial resolution sensors consistently showed lower NDVI values compared to those obtained from proximal spectral response sensors (SRS) and drones. Our observations indicate that the representation of vegetation captured by satellites and drones aligns well with the data obtained from phenocamera and proximal SRS platforms. The combination of high temporal resolution provided by SRS and phenocameras resulted in improved and more reliable indices that will be indispensable for evaluating the response of Caatinga vegetation to current and future conditions.

Funding: This study was supported by the São Paulo Research Foundation-FAPESP (grants ##2015/50488-5, #2019/11835-2; #2021/10639-5; #2022/07735-5), the Coordination for the Improvement of Higher Education Personnel - CAPES (Finance Code 001), the National Council for Scientific and Technological Development - CNPq (306563/2022-3).

How to cite: Moura, M., Nobrega, R., Verhoef, A., Galvíncio, J., Miranda, R., Alberton, B., Marques, D., Santos, C., Nascimento, B., Pereira, M. M., and Morellato, P.: Integrating Multi-Sensor and Multi-Platform Technologies for Enhanced Assessment of Spectral Indices and Phenological Dynamics in a Seasonal Tropical Dry Forest, EGU General Assembly 2024, Vienna, Austria, 14–19 Apr 2024, EGU24-20616, https://doi.org/10.5194/egusphere-egu24-20616, 2024.

EGU24-20999 | ECS | Orals | HS2.1.5

Soil and rock water dynamics in a semiarid karst savanna undergoing woody plant encroachment

Pedro Leite, Bradford Wilcox, Daniella Rempe, and Logan Schmidt

EGU24-804 | ECS | Orals | HS2.1.9

The role of proglacial rock glaciers in redistributing glacial meltwater 

Bastien Charonnat, Michel Baraer, Janie Masse-Dufresne, Eole Valence, Jeffrey McKenzie, Chloé Monty, Kaiyuan Wang, and Elise Devoie

The deglaciation of high mountain ranges is leading to the expansion of proglacial areas, which encompasses diverse permafrost and ground ice landforms. These features exert an increased influence on the hydrology and hydrogeology of alpine catchments as glaciers retreat. Despite the heightened attention received by rock glaciers for the last decades, their role within the broader hydrological and hydrogeological valley system remains understudied. Previous studies have highlighted rock glaciers’ ability to act as hydrological storage and to buffer water release from alpine catchments. However, there is a lack of studies about their ability to modify the groundwater flow paths in a proglacial valley system and to redistribute glacial meltwater. This study addresses this knowledge gap by investigating how the rock glacier redistributes glacial meltwater in a study catchment.

Shar Shäw Tágà (Grizzly Creek) is a subarctic glaciated catchment located in the St. Elias Mountains, Yukon (Canada) that experiences significant glacial retreat. A non-relict rock glacier at the outlet of a glacial sub-catchment obstructs the valley thalweg, with only a few springs exhibiting minimal discharge from its front. These minor springs contrast remarkably with the substantial discharge observed at higher elevations above the rock glacier.

Water level, water temperature and electrical conductivity variables were monitored in identified springs throughout the summer 2022. Results were compared to meteorological data with wavelet coherence analysis to determine the springs’ origins and drivers. Additionally, multiple sampling campaigns were conducted in the summers of 2022 and 2023 to analyze major ions concentrations and water stable isotopes signatures in the catchment’s streams.

The results reveal that the rock glacier serves as a critical obstacle and deflector to subsurface meltwater, either forcing upstream meltwater to penetrate deeper into the subsurface, or redirecting lateral subsurface flow to resurge at its front, forcing part of the alluvial floodplain shallow aquifer to reach the surface.

While rock glaciers are often considered potential water reservoirs, this study illuminates their dual role as critical deflectors for shallow subsurface flow in proglacial valley systems. They can impede glacial meltwater flow, originating alternative pathways toward deep aquifers or lowlands’ surface waters. Such findings nuance the ability of rock glaciers to store and release glacial meltwater, as they can deflect shallow subsurface flow. Additionally, it shows that rock glaciers can force infiltration and resurgence of water at specific locations, affecting the broader mountain hydrogeological system. Furthermore, it enforces their critical role in the future of water resources supplied by high mountain ranges in a deglaciation context.

How to cite: Charonnat, B., Baraer, M., Masse-Dufresne, J., Valence, E., McKenzie, J., Monty, C., Wang, K., and Devoie, E.: The role of proglacial rock glaciers in redistributing glacial meltwater, EGU General Assembly 2024, Vienna, Austria, 14–19 Apr 2024, EGU24-804, https://doi.org/10.5194/egusphere-egu24-804, 2024.

Spaceborne gravimetry is the only satellite method that can observe terrestrial water storage at a continental scale. The time variable gravity field, observed by GRACE and GRACE-FO, is a measure of mass transport primarily in the global water cycle. In this contribution we analyse the runoff-storage relationship in the GRACE time frame for the pan-Arctic drainage basins. Over these boreal catchments, the conventional hysteresis-type formulation requires algorithmic adaptations in order to accommodate snowload and base-flow during winter periods. We show that the parameters involved in the pan-Arctic runoff-storage relationships are transferable, albeit with a few exceptions, between the various catchments. This remarkable fact allows us access to determining runoff from ungauged drainage areas across the pan-Arctic. As a result we can quantify the total freshwater flux from pan-Arctic basins into the Arctic Ocean.

How to cite: Sneeuw, N., Yi, S., Saemian, P., and Tourian, M. J.: Estimating runoff from pan-Arctic basins through an improved runoff-storage relationship using satellite gravimetry in the GRACE period 2002-2019, EGU General Assembly 2024, Vienna, Austria, 14–19 Apr 2024, EGU24-2098, https://doi.org/10.5194/egusphere-egu24-2098, 2024.

EGU24-2191 | ECS | Orals | HS2.1.9

Process-based modeling of the streamflow generation in a highly glaciated Alpine headwater catchment since the last little Ice Age (i.e., 1850). 

Florentin Hofmeister, Xinyang Fan, Madlene Pfeiffer, Inga Labuhn, Ben Marzeion, Bettina Schaefli, and Gabriele Chiogna

The streamflow generation related to snow and glacier melt is particularly sensitive to temperature fluctuations and, hence, highly affected by global warming. However, the non-linear and complex interaction between streamflow contributions originating from snow melt versus glacier melt and being transferred to stream via the subsurface complicates the investigation of climate-induced changes in high-elevation catchments. We used the physically-based hydrological model WaSiM to simulate the climate-induced changes in the streamflow generation in the Kaunertal (Austria), a highly glaciated Alpine headwater catchment. The simulations extend from the last little Ice Age (i.e., 1850) to 2015. Large-scale climate processes of a general circulation model (GCM) were dynamically downscaled with the Weather Research & Forecasting Model (WRF) to the central Alpine region at a 2 km spatial resolution from 1850 to 2015. The WaSiM model parameters were transferred from a WaSiM configuration driven by station data and partly optimized by a manual calibration on observed streamflow. For model evaluation, a multi-objective approach was chosen considering streamflow, SWE, snow cover duration, and glacier mass balances. The hydrological model results showed a good representation of the individual components and seasonal streamflow generation. However, difficulties exist in the spatial representation of the heterogeneous and small-scale differences in the snowpack. In addition, there are limitations in the simulation of glacier evolution using WaSiM over long periods (> 30 years) in highly glaciated catchments, as WaSiM does not contain an ice flow routine that can simulate the glacier dynamics during advance or retreat. Despite the cascade of uncertainties in this complex model chain (i.e., GCM, WRF, WaSiM), the results of the long-term simulation show interesting dynamics and enable an analysis of streamflow generation for periods where no observational data is available. For instance, glacier melt indicates a high dependence on the development of summer temperatures (i.e., JJA). The rising temperatures led to an earlier onset of snow and glacier melt, which shifted the streamflow regime and increased the daily streamflow magnitude, especially from 1995 onwards. The next step will be the comparison of the hydrological model results with those from other headwater catchments in the eastern Central Alps with a different degree of glaciation. The novelty lies in comparing 165 years of simulated streamflow and the contributions from snow and glacier melt. This comparison will validate the transferability and generalizability of the complex model chain and the simulation results.

How to cite: Hofmeister, F., Fan, X., Pfeiffer, M., Labuhn, I., Marzeion, B., Schaefli, B., and Chiogna, G.: Process-based modeling of the streamflow generation in a highly glaciated Alpine headwater catchment since the last little Ice Age (i.e., 1850)., EGU General Assembly 2024, Vienna, Austria, 14–19 Apr 2024, EGU24-2191, https://doi.org/10.5194/egusphere-egu24-2191, 2024.

EGU24-2310 | ECS | Posters on site | HS2.1.9

Spring floods and their major influential factors in the source region of the Yangtze River during 2001–2020 

Ying Yi, Shiyin Liu, Yu Zhu, Kunpeng Wu, and Fuming Xie

    Many reservoirs have been constructed in the Yangtze River basin, however, spring floods in its source region pose increasingly severe challenges to reservoirs operation and water resources management due to increased climatic variability under global warming. Understanding spring flood variability and their major influential factors under changing climates is crucial to improving water management, agricultural irrigation, reservoir operation, and flood prevention. In this study, we have examined the spring flood characteristics and their influential factors in the source region of the Yangtze River based on station data and multisource remote sensing products during 2001–2020. Late Mays have seen most of the highest spring flood discharge, while some springs have experienced multiple peaks. Extreme spring floods were identified in the years 2012, 2013, 2019, and 2020, with the highest peak discharge (1365.83 m3/s) and longest flood duration (47 days) in 2019. Spring snowmelt played a key role in 2019 spring flood and others were also driven by snowmelt in the UJSB. We defined Snow Water Volume (SWV) as an indicator of the precondition for high spring flood. In 2019, large winter SWV along with spring snowfall melted into meltwater under the rising temperature, resulting in extreme spring flood event in late April. Whereas, in 2012 and 2020, snowmelt and rainfall combined to contribute to the extreme spring flood events in late Mays. In 2013, although snowmelt made a contribution to the first spring flood peak, the flood event at the end of May was primarily contributed by rainfall. Based on spatiotemporal variations in spring SWV and the isotherm of critical temperature for snow melting, the key regions dominating spring floods were identified as the regions with large amount of SWV. Weather pattern analysis showed that the enhanced Westerly jets in winters brought about large snowfall and extended snow cover in the region which can be released as floods triggered by rapid increase in air temperature in the coming spring.

How to cite: Yi, Y., Liu, S., Zhu, Y., Wu, K., and Xie, F.: Spring floods and their major influential factors in the source region of the Yangtze River during 2001–2020, EGU General Assembly 2024, Vienna, Austria, 14–19 Apr 2024, EGU24-2310, https://doi.org/10.5194/egusphere-egu24-2310, 2024.

EGU24-5329 | ECS | Orals | HS2.1.9

Contribution of glacier melt to runoff under climate change using a conceptual hydrological model in selected high alpine regions in Austria 

Caroline Ehrendorfer, Franziska Koch, Sophie Lücking, Thomas Pulka, Hubert Holzmann, Philipp Maier, Fabian Lehner, Herbert Formayer, and Mathew Herrnegger

The timing and quantity of snow and ice melt in high-alpine regions is of great importance, especially for time-sensitive processes such as hydropower production. In most conceptual hydrological models, the simulations of these components are frequently only based on simple temperature index methods, and the question arises whether these are sufficient to derive useful information on changing runoff seasonality and quantities for hydropower producers.

This study examines the quantitative and seasonal changes in glacier melt contribution to total runoff under climate change in several Austrian high-alpine catchments with hydropower production (Stubaital, Stubachtal, Kölnbrein/Maltatal, Schlegeis/Zillertal). As the estimation of precipitation model inputs for areas with complex terrain is characterised by a high degree of uncertainty, an undercatch-correction adapted for high-alpine areas was applied, integrating information from local weather stations, topography and iterative feedback from the modelled water balance. The conceptual, semi-distributed rainfall-runoff model COSERO was set up for the case study regions.  To cover long-term changes, the model was run for Stubai- and Stubachtal for the reference period (1990-2020) and future scenarios (2021-2100) with daily timesteps. In addition to the daily timesteps, COSERO was also coupled with the physically-based snowpack model Alpine3D for simulations in the Kölnbrein and Schlegeis catchments for recent decades to implement the simulation of relevant components of the water balance including snow and ice processes at an hourly timestep based on more complex energy-balance modelling. Besides air temperature and precipitation, the coupling requires additional hourly meteorological input such as radiation, relative humidity and wind information.

The combination of COSERO with Alpine3D improves results at the hourly timestep, but the conceptual model delivers satisfying results on its own as well. Moreover, the results are in line with literature and show the expected decrease of ice volume and ice melt in coming years. By 2050, the ice melt contribution to total runoff is significantly reduced in all case study areas and seasonality shifts due to less ice melt and earlier snowmelt in the form of more winter and spring runoff and less flow in summer are prevalent. In addition, we show that the modelling of the water balance components in the past can be greatly improved by using the undercatch-corrected precipitation data.


Acknowledgements: We thank the VERBUND Energy4Business GmbH, the Austrian Climate Research Programme (ACRP), the Austrian Research Promotion Agency (FFG), and the ÖBB for funding, fruitful discussions and providing us with data.

How to cite: Ehrendorfer, C., Koch, F., Lücking, S., Pulka, T., Holzmann, H., Maier, P., Lehner, F., Formayer, H., and Herrnegger, M.: Contribution of glacier melt to runoff under climate change using a conceptual hydrological model in selected high alpine regions in Austria, EGU General Assembly 2024, Vienna, Austria, 14–19 Apr 2024, EGU24-5329, https://doi.org/10.5194/egusphere-egu24-5329, 2024.

EGU24-5531 | ECS | Posters on site | HS2.1.9

Enhancing Snow Ablation Modeling in the Generation of Gridded Snow Water Equivalent Data 

Michelle Yu, Christopher Paciorek, Alan Rhoades, Mark Risser, and Fernando Perez

Snow Water Equivalent (SWE) is a critical parameter for understanding water availability in regions with seasonal snow cover. Ensuring an accurate representation of SWE across regular spatial and temporal intervals is essential and plays a pivotal role in hydrological and climatological studies. This work critically examines the ablation modeling strategy employed by the University of Arizona daily 4km SWE dataset (UA SWE), a widely adopted SWE gridded product in the United States, highlighting limitations inherent in methodologies that rely solely on temperature data.

Recognizing the utility of a more nuanced perspective to capture the complexities of snowmelt dynamics, we propose a novel method that incorporates a diverse set of meteorological and terrain characteristics as input variables in the predictive modeling of snow ablation. Our approach is further extended to directly model SWE, eliminating the need for intermediate ablation estimation and providing a more intuitive solution for empirical SWE prediction.

Our versatile methodology can be easily applied to produce high-resolution gridded SWE data. By addressing deficiencies in a leading empirical approach, our technique aims to enhance the accuracy of SWE representation at both the point and grid levels.

How to cite: Yu, M., Paciorek, C., Rhoades, A., Risser, M., and Perez, F.: Enhancing Snow Ablation Modeling in the Generation of Gridded Snow Water Equivalent Data, EGU General Assembly 2024, Vienna, Austria, 14–19 Apr 2024, EGU24-5531, https://doi.org/10.5194/egusphere-egu24-5531, 2024.

EGU24-7278 | ECS | Orals | HS2.1.9

Cold-laboratory experiments to observe meltwater and ice layer interactions in snowpacks 

Connor Shiggins, Douglas Mair, James Lea, and Isabel Nias

The fate of percolating surface meltwater encountering ‘impermeable’ ice layers is uncertain in the accumulation zone of the Greenland Ice Sheet (GrIS). Often, ice layers are considered to retard meltwater and cause lateral runoff. However, modelled and field-based observations in the percolation zone of the GrIS have suggested ice layers are not necessarily impermeable and meltwater can breakthrough, percolating to deeper depths of snow/firn and consequently inferring a greater refreezing capacity within the accumulation zone. The physical and thermal conditions which control the permeability of ice layers remain unclear and effective parameterisation of these processes is lacking for snow/firn modelling of melt, refreezing and runoff. Here we present repeat cold-laboratory experiments which seek to understand how meltwater interacts with thin ice layers (5 to 20 mm) for two differing thermal regime contexts whereby the surrounding snow/firn thermal regime is either (i) below or (ii) at the melting point.

We find that under extreme melt regimes, ice layers continually retard wetted fronts of percolating meltwater when the thermal regime of the snowpack is below the melting point. This barrier results in the snowpack at depth remaining at least ~1oC cooler than snow above the ice layer which is saturated with meltwater. We also find that the ice layer forces ~35% of the percolating meltwater to runoff, cooling the overlying snow and increasing the refreezing capacity of the snow closer to the snowpack surface. The remaining ~65% of meltwater ponds and later refreezes on the ice layer, thickening the impenetrable surface.

When the thermal regime of the surrounding snow/firn is at the melting point, we find that meltwater is able to pond without refreezing, resulting in the ice layer failing and allowing deeper percolation into the snowpack. These findings suggest that the thermal regime of a snowpack is crucial for the structural integrity of an ice layer and thus the permeability of a snowpack.

Consequently, these findings have implications for parameterising meltwater runoff and ice layer integrity in snow and firn models which incorporate ‘impermeable’ barriers in their domains. Future work will continue to explore similar experiments with thicker ice layers (~60 mm) to determine whether ice layer breakthrough is primarily a function of snow/firn thermal regime and/or ice layer thickness. 

How to cite: Shiggins, C., Mair, D., Lea, J., and Nias, I.: Cold-laboratory experiments to observe meltwater and ice layer interactions in snowpacks, EGU General Assembly 2024, Vienna, Austria, 14–19 Apr 2024, EGU24-7278, https://doi.org/10.5194/egusphere-egu24-7278, 2024.

EGU24-9702 | ECS | Posters on site | HS2.1.9

Inferring Debris Properties on Debris-Covered Glaciers: Implications for Glacier Modelling 

Vicente Melo Velasco, Evan Miles, Michael McCarthy, Thomas E. Shaw, Catirona Fyffe, and Francesca Pellicciotti

Debris, ranging from thin surface dust to medial moraines and thick, continuous layers in ablation zones, partially covers glaciers all around the world. By modifying energy transfer from the atmosphere to the ice, the supraglacial debris layer fundamentally controls sub-debris melt rates. Debris physical properties such as surface roughness (z0) and thermal conductivity (k) have only been derived from local measurements at a few sites, and modelling studies of debris-covered glaciers have often relied on literature values. The correct representation of these properties in energy-balance models is crucial for understanding the climate-glacier dynamics and how debris-covered glaciers will behave in the future. There are several established methods to derive these properties from field measurements, yet relatively few studies undertake to measure properties for their sites, or to evaluate the resulting property values.

We undertook an observational campaign to investigate supraglacial debris properties at Pirámide Glacier, in the central Chilean Andes. First, we used established approaches, as well as some variations on those approaches, to derive z0 from wind-temperature tower data and k from thermistor strings in the debris at three glacier locations. Second, we determined locally-optimal k and z0 values to reproduce observed ice melt: we optimised k by simulating energy conduction through the debris with the surface temperature as an input, then optimised z0 by running a complete energy-balance model using the observed surface meteorology. We then conducted point-scale energy-balance modelling using the z0 and k values obtained i) with the derivations from field measurements; ii) through optimisation, or; iii) from the typical values found in literature. This allowed us to evaluate how the different methods perform by comparing the modelled and measured ice melt. 

Our results show that deriving local debris properties from measurements is challenging and that measured values can differ significantly from common literature values. The values derived from measured data can vary significantly depending on the method employed. It is important to note that these values can also differ significantly from the values required by an energy-balance model to accurately represent sub-debris ice melt. Furthermore, energy-balance models typically assume a representation of heat transfer within the supraglacial debris layer based solely on conduction and require a bulk thermal conductivity value. This highlights the necessity of efforts to reevaluate measurements in the field and reconsider our definition of debris properties in melt modelling.

How to cite: Melo Velasco, V., Miles, E., McCarthy, M., Shaw, T. E., Fyffe, C., and Pellicciotti, F.: Inferring Debris Properties on Debris-Covered Glaciers: Implications for Glacier Modelling, EGU General Assembly 2024, Vienna, Austria, 14–19 Apr 2024, EGU24-9702, https://doi.org/10.5194/egusphere-egu24-9702, 2024.

EGU24-12337 | ECS | Orals | HS2.1.9

Current and future glacier melt contribution to groundwater dynamics in a high-altitude, Himalaya basin 

Caroline Aubry-Wake and Walter Immerzeel

While mountain groundwater in glacierized regions has gained increasing attention, comprehensive insights of glacier melt contributions to groundwater and their resurfacing patterns remain limited. Our study employs a cryosphere-surface hydrology model in combination with numerical groundwater simulations to estimate the water table variations across the high-altitude Langshisha basin in the Langtang Himalaya (4094-6049 m). We evaluate surface water-groundwater interactions amidst current and projected climatic conditions. Utilizing in-situ weather forcings and evaluated with field measurements, our findings indicate that glacier melt contributes up to 70% of groundwater recharge in the Langshisha basin during the 2012-2020 period. This substantial contribution is attributed to the basin's considerable glacier cover (40%) and its high elevation, where cold temperatures in areas above 5300 m limit melt and are underlain by permafrost, restricting recharge. Groundwater simulations based on these recharge rates reveal a high sensitivity to hydraulic conductivity parameters but are constrained by field measurements of creek exfiltration indicating a water table near the surface along the main streams. The combination of groundwater simulations and field measurements suggests that groundwater exfiltration along the proglacial stream is a predominant surface-water-groundwater exchange mechanism within the basin. Considering the important role of glacier melt in groundwater recharge, our study applies future climate scenarios to gauge the impact of warming trends and glacier retreat on surface water-groundwater dynamics within the basin.

How to cite: Aubry-Wake, C. and Immerzeel, W.: Current and future glacier melt contribution to groundwater dynamics in a high-altitude, Himalaya basin, EGU General Assembly 2024, Vienna, Austria, 14–19 Apr 2024, EGU24-12337, https://doi.org/10.5194/egusphere-egu24-12337, 2024.

EGU24-13919 | Orals | HS2.1.9 | Highlight

Accounting for interannual variability in dust accelerated snowmelt in process-based hydrologic prediction, Rocky Mountains, USA 

S. McKenzie Skiles, Patrick Naple, Otto Lang, and Joachim Meyer

Seasonal mountain snowmelt is an important contributor to surface water resources and groundwater recharge in the midlatitudes, making forecasting of snowmelt timing and duration critical for accurate hydrologic prediction. Net solar radiation, controlled primarily by snow albedo, is the main driver of snowmelt in most snow covered environments. Lowering of snow albedo from episodic dust deposition has been shown to be an important control on snowmelt patterns in the Rocky Mountains of the Western United States. Here, we compare and contrast trends in dust impacted albedo over the previous two decades with a focus on two regions: 1) the Colorado Rockies, headwaters of the Colorado River, which recieves dust from the southern Colorado Plateau and 2) the Wasatch Mountains (UT), headwaters of the Great Salt Lake, which recieves dust from the Great Basin. Results show that while snow darkening occurs every year, the magnitude of impact is spatially and temporally variable, and there are no emerging relationships that indicate when 'high-impact' dust years will occur. To account for spatial and interannual variability in dust impacted net solar radiation in hydrologic prediction we developed a spatially distributed process-based snowmelt model that incorporates near-real time snow albedo from remote sensing and incoming solar radiation from numerical weather prediction. The model improves simulated timing of snowmelt initiation and duration in all years, even those with lower dust impacts, demonstrating the importance of accurate snow albedo in snowmelt modeling. 

How to cite: Skiles, S. M., Naple, P., Lang, O., and Meyer, J.: Accounting for interannual variability in dust accelerated snowmelt in process-based hydrologic prediction, Rocky Mountains, USA, EGU General Assembly 2024, Vienna, Austria, 14–19 Apr 2024, EGU24-13919, https://doi.org/10.5194/egusphere-egu24-13919, 2024.

EGU24-14158 | Posters on site | HS2.1.9

Enhancing NESDIS Global Automated Snow and Ice Cover Mapping System 

Peter Romanov

A new version of the Global Multisensor Automated Snow and Ice Mapping System (GMASI) has been implemented into operations at NESDIS is summer 2023. The new system is an upgrade of the previous version of the GMASI which was operated since 2006. The system provides information on the snow and ice distribution for NOAA numerical weather prediction and climate models as well as for a number of other atmosphere and land remote sensing products. The retrieval algorithm uses satellite observations in the visible/infrared and in the microwave spectral bands and delivers daily spatially continuous (gap-free) maps of the snow and ice cover.  

Compared to previous version, the new system incorporates data from a larger set of microwave sensors and features an enhanced retrieval algorithm. The spatial resolution of the output maps has been improved from es improved from 4km to 2km.  In the presentation we provide details of the data processing algorithm and of the output product focusing on the improvements and upgrades. We demonstrate that the output of the new GMASI system closely matches the accuracy of snow maps produced within NOAA Interactive Multisensor Snow and Ice Mapping System (IMS) and agrees well to in situ station snow depth report. Improvements to the retrieval algorithm mostly affected reproduction of small-scale features in the snow and ice cover distribution, particularly in alpine areas.  In the same time, large-scale climatologically-important cryosphere features as the continental and hemisphere snow and ice extent estimated with the new snow and ice maps remain consistent with the previous version of the product. 

How to cite: Romanov, P.: Enhancing NESDIS Global Automated Snow and Ice Cover Mapping System, EGU General Assembly 2024, Vienna, Austria, 14–19 Apr 2024, EGU24-14158, https://doi.org/10.5194/egusphere-egu24-14158, 2024.

EGU24-15373 | ECS | Posters on site | HS2.1.9 | Highlight

The importance of small glaciers for accurate projection of future runoff in High Mountain Asia 

Alexandra von der Esch, Matthias Huss, Marit Van Tiel, Justine Berg, Tarang Patadiya, Pascal Horton, Saurabh Vijay, and Daniel Farinotti

High Mountain Asia is characterized by a substantial glacier coverage with glaciers of varying sizes. These glaciers are crucial in the area's hydrological cycle since they feed large rivers such as the Indus, Ganges, and Brahmaputra rivers. However, ongoing climate change is having a significant negative impact on glacier mass and projections show strong further declines of glacier mass in the future. This is raising concerns about future water security. How big the impact of the evolution of small glaciers (< 2 km2) is towards changing water availability remains to be investigated.

Most studies focus on the regional evolution of glaciers as a whole, which means that small-scale glaciers are often overlooked due to larger glaciers dominating the signal in area and volume changes, despite the fact that small glaciers make up about 30% of the glacierized area in High Mountain Asia. To address this issue, we applied the Global Glacier Evolution Model (GloGEM) to simulate all ca. 100’000 glaciers of High Mountain Asia (Regions 13-15 of the Randolph Glacier Inventory v6.0) under various climate scenarios in the period of 1980-2100. We compared the spatio-temporal variability of the timing of peak water, as well as glacier volume change, between small and large glaciers for a set of approximately 30 catchments in the headwater of Indus, Ganges and Brahmaputra rivers.

We find that there is a larger difference between future scenarios for the timing of peak water for smaller glacier, with it ranging from 2030-2060 and then runoff declining rapidly. Meanwhile, peak water for larger glaciers is likely to occur between 2070-2080 according to an intermediate emission scenario, with glacier runoff decreasing gradually thereafter. As for the ice volume change, smaller glaciers are expected to reach volumes close to zero near the year 2080, while larger glaciers are expected to reach this point only after 2100. The quicker response of small glaciers compared to large glaciers emphasize the need for a particular focus on small glaciers to better understand their responses to climate change and make accurate projections about local and regional scale near future water availability.

How to cite: von der Esch, A., Huss, M., Van Tiel, M., Berg, J., Patadiya, T., Horton, P., Vijay, S., and Farinotti, D.: The importance of small glaciers for accurate projection of future runoff in High Mountain Asia, EGU General Assembly 2024, Vienna, Austria, 14–19 Apr 2024, EGU24-15373, https://doi.org/10.5194/egusphere-egu24-15373, 2024.

EGU24-15646 | Posters on site | HS2.1.9

Combined use of evolutionary algorithms and hydrological models to simulate snow cover and flow in alpine basins 

Jose David Hidalgo Hidalgo, Antonio Juan Collados Lara, David Pulido Velazquez, Eulogio Pardo Iguzquiza, Juan de Dios Gomez Gomez, and Francisco Jose Rueda Valdivia

Snow cover area, which can be obtained from satellite, is a valuable information to simulate streamflow in snow-dominated mountain basins where snowmelt is a major runoff factor. However, usually satellite do not provide long completed snow cover area spatiotemporal series, which are required to calibrate and validate hydrological models. It is due to difference limitations, as presence of clouds, sensor failure, low revisit time or spatial resolution, or recent launch.

Cellular automata models, which use precipitation and temperature as driving variables and some transition rules between cells through calibrated parameters, are capable of capturing the dynamics of snow cover area. Therefore, they can be used to complete and extend the information provided by satellite.

In this work, we simulate long series of daily streamflow in the Canales basin (Sierra Nevada, south Spain) by combining a cellular automata model and the Snowmelt Runoff Model. The Snowmelt Runoff Model is a degree-day model that requires data of temperature, precipitation, and snow cover area and has been widely used in simulation of streamflow in snow-dominated mountainous basins around the world.

The water resources in the Canales basin are regulated by a reservoir, which contributes to supply the Granada city water demand. The main resources stored in reservoir come from Sierra Nevada Mountains during the melting season. Therefore, the dynamics of snow is essential to simulate streamflow in the Canales basin.

It has been also used to simulate future local climate scenarios generated for specific level of warming in peninsular Spain.

Aknowledments: This research has been partially supported by the projects: STAGES-IPCC (TED2021-130744B-C21), SIGLO-PRO project (PID2021-128021OB-I00), SIERRA-CC project (PID2022-137623OA-I00) from the Spanish Ministry of Science, Innovation and Universities, and SER-PM (2908/22) from the National Park Research Program.

How to cite: Hidalgo Hidalgo, J. D., Collados Lara, A. J., Pulido Velazquez, D., Pardo Iguzquiza, E., Gomez Gomez, J. D. D., and Rueda Valdivia, F. J.: Combined use of evolutionary algorithms and hydrological models to simulate snow cover and flow in alpine basins, EGU General Assembly 2024, Vienna, Austria, 14–19 Apr 2024, EGU24-15646, https://doi.org/10.5194/egusphere-egu24-15646, 2024.

EGU24-16055 | Posters on site | HS2.1.9

A Central Asian pro-glacial discharge database for improving hydrological models 

Eric Pohl, Mukhammed uulu Esenaman, Ardamehr Halimov, Dominik Amschwand, Tomas Saks, and Jingheng Huang

Central Asia’s mountain rivers are to a large degree fed by snow and ice melt and are a crucial contributor of fresh water downstream for millions of people. The attribution of how these meltwater sources will change their contribution to stream flow in a warmer future are, however, very uncertain. A major reason for this is an extremely sparse hydrometeorological monitoring network. This affects the calibration and validation of large-scale cryo-hydrological models that could be used for the task, or the validation and bias correction of reanalysis and remote sensing data needed to run such models. In combination with uncertainties about the glacier mass balances in the region, hydrological models are facing a pronounced equifinality problem. In order to improve this, and to understand better the glacier response to the current meteorological forcing in different climate zones of Central Asia, we instrumented 8 pro-glacial streams in Kyrgyzstan and Tajikistan with automated runoff gauges running at hourly resolution to also capture diurnal variability. These measurements complement the already (re-)established glaciological monitoring network at most of these sites and allow tackling the equifinality problem by constraining many variables. Here, we present first results from this database that shall serve to improve hydrological model calibration and parameterization, and understand relationships between meteorological forcing, annual glacier mass balance and meltwater generation. We also discuss instrumenting strategies and problems, and uncertainties related to gauge calibration.

How to cite: Pohl, E., uulu Esenaman, M., Halimov, A., Amschwand, D., Saks, T., and Huang, J.: A Central Asian pro-glacial discharge database for improving hydrological models, EGU General Assembly 2024, Vienna, Austria, 14–19 Apr 2024, EGU24-16055, https://doi.org/10.5194/egusphere-egu24-16055, 2024.

EGU24-18059 | ECS | Posters on site | HS2.1.9

On the Importance of groundwater constraining in hydrological modeling of the Pamir region 

Jingheng Huang, Eric Pohl, and Juan Carlos Richard-Cerda

Central Asia is a climate change hot spot, facing an unprecedented juxtaposition of regional climate- and water-related issues. Meltwater from the Pamir Mountains plays a crucial role in Central Asia's hydrological cycle, and its response to climate change has been widely investigated using glacial-hydrological models. However, the hydrological simulation in Pamirs is highly uncertain, primarily driven by data scarcity and the complex interplay between climatic factors and glacier dynamics. Ongoing efforts concentrate on including more calibration data and constraining the uncertainty about the exact internal process representation of hydrological models. However, the quality of the groundwater simulation is often neglected. Groundwater reservoirs, buffering meltwaters and providing river flow when little to no surface runoff occurs, are extremely important in the Pamir region. Although physically based groundwater models provide a more detailed picture of the possible evolution of the system, empirical groundwater models are often used in hydrological modeling due to their minimal input data requirements and low computational cost compared to physically based models. However, the traditional empirical groundwater model with single linear storage is not suitable for the Pamir region. The region is characterized by a variety of sedimentary deposits in different landscape morphologies, resulting in varying delays in water recharge, release, and storage capacities. We improved the baseflow representation by coupling two linear groundwater reservoirs (one fast and one slow) into a widely-used hydrological model in the region. A representative catchment in the central Pamir, the Gunt River basin, is used as a case study to demonstrate the importance of groundwater in constraining the hydrological calibration process. Groundwater is the only contribution to winter river discharge in the Gunt basin and can thus be used as an indicator of groundwater parameter constraint. Here we show that the hydrological model can achieve good performance (in terms of daily discharge, seasonal snow cover fraction, and annual glacier mass balance) even when calibrated with only total daily discharge and winter baseflow. Especially the baseflow calibration helps constraining snowmelt onset in spring and improving adjustments of precipitation and temperature, which are the most uncertain sources in hydrological modeling in the region. Despite improvements, degree day factors still show a large variability. The resulting model equifinality problem still leads to predictive uncertainty, indicating that more glacier observations are needed for a sound process understanding. Based on the simulated results, the hydrological cycle in Gunt was analyzed and compared with previous studies.

How to cite: Huang, J., Pohl, E., and Richard-Cerda, J. C.: On the Importance of groundwater constraining in hydrological modeling of the Pamir region, EGU General Assembly 2024, Vienna, Austria, 14–19 Apr 2024, EGU24-18059, https://doi.org/10.5194/egusphere-egu24-18059, 2024.

EGU24-18338 | ECS | Posters on site | HS2.1.9

Assessing the use of GPR and drone snow data for model development and runoff predictions in Northern Sweden 

Ilaria Clemenzi, David Gustafsson, Viktor Fagerström, Daniel Wennerberg, Björn Norell, Jie Zhang, Rickard Pettersson, and Veijo Pohjola

In cold regions, snow is a crucial component of the cryosphere, experiencing changes such as decreasing snowpack and snow cover. These changes impact the seasonal amount of snow and cause a shift in the timing of spring floods, particularly in mountainous areas. The complex and diverse snow processes and interactions in mountainous environments challenge making accurate predictions on snow and runoff. Moreover, snow is not uniformly distributed in space and time, which emphasizes the importance of monitoring mountain snowpack to enhance the understanding of hydrological processes and improve forecasting in the face of changing conditions. In the past few years, ground penetrating radar and drone acquisitions have emerged as a state-of-the-art methodology for obtaining snow data at high spatial resolution with a significant area coverage compared to traditional point observations. This study used data from ground penetrating radar and drone acquisitions to develop and evaluate a new snowfall distribution function based on wind speed, direction and topography to model wind redistribution in the semi-distributed hydrological model HYPE. We assessed the effect of the new snowfall distribution function compared to the one based on wind direction and topography on the snow distribution close to the accumulation peak in the Överuman catchment, Northern Sweden. We further assessed the impact of the two snowfall distribution functions on the catchment runoff predictions. Results show that the snowfall distribution function based on wind speed and direction better simulated the snow spatial distribution in the catchment than the snowfall function based on wind direction. Ground penetrating radar and drone acquisitions provided complementary model development and evaluation information.

How to cite: Clemenzi, I., Gustafsson, D., Fagerström, V., Wennerberg, D., Norell, B., Zhang, J., Pettersson, R., and Pohjola, V.: Assessing the use of GPR and drone snow data for model development and runoff predictions in Northern Sweden, EGU General Assembly 2024, Vienna, Austria, 14–19 Apr 2024, EGU24-18338, https://doi.org/10.5194/egusphere-egu24-18338, 2024.

EGU24-18443 | ECS | Orals | HS2.1.9

Snow accumulation dynamics and its contribution to the hydrology of a glacierized catchment in the Northern Pamirs 

Achille Jouberton, Stefan Fugger, Thomas Shaw, Evan Miles, Marin Kneib, Abdulhamid Kayumov, Ardamehr Halimov, Hofiz Navruzshoev, Husraf Kabutov, Firdavs Vosidov, and Francesca Pellicciotti

Mountain glaciers are shrinking at accelerating rates due to enhanced ablation and reduced accumulation. In High Mountain Asia (HMA), recent glacier and snow changes have been highly heterogeneous, due to differences in accumulation regimes and sensitivity of glacier mass balances to temperature increases. The Pamir-Karakoram region is well known for hosting some of the only glaciers featuring neutral or even positive mass balance since the 2000, yet the causes for this anomaly are not fully understood, neither how long it will persist in the future nor its hydrological implications. In the semi-arid basins of Central Asia, snow- and glacier melt sustains most of the annual streamflow, with glacier melt being especially important towards the end of the dry summers. However, very few direct observations exist at high elevation, hindering the quantification of glacier mass inputs which is essential to estimate the long-term sensitivity of glaciers to warming. 

In this study, we combine in-situ hydro-meteorological observations with remote sensing observations to constrain a land-surface model and understand snow accumulation dynamics at a glacierized catchment in the Pamir mountains of Tajikistan. In-situ snow height and mass changes have been collected since 2021 from automatic weather stations, time-lapse cameras and pressure loggers in seasonally frozen lakes, providing a uniquely rich dataset for this region. We use MODIS, Landsat-8 and Sentinel-2 satellite images to derive snow cover dynamics at high spatial and temporal resolutions, and very high-resolution (2m) optical stereo imagery (Pleiades) to derive spatially resolved snow depths. These in-situ and remote-sensing observations are then used to inform a land-surface model that we force with statistically downscaled and bias-corrected reanalysis data (ERA5-Land) at 100m spatial and hourly temporal resolution, from 2015 to 2023.

We use our model to dissect the glacier mass balance seasonal dynamics, to quantify how much mass is gained through snowfall and avalanches, and how much mass is lost through melting and sublimation. We find that glaciers in our catchment receive a large part (58 %) of their annual mass input (1081 mm w.e.) from March to July, suggesting that spring and early summer precipitation events are key to control accumulation and therefore dictate glacier mass balances. Importantly, 11% of the annual snowfall is returned to the atmosphere via sublimation. At the catchment scale, snowmelt contributes to 67% of the annual runoff (625 mm), followed by glacier melt (24%) and rain (9%). When most of the seasonal snowpack has melted out (usually in August), glacier melt becomes the dominant contribution (with 55% in September). In most of the study period years, the glacier mass balance is close to neutral, but it turned negative in the last three years, where warmer conditions have led to more rapid seasonal snowpack melt-out and higher glacier ELAs, deteriorating the health of these previously spared glaciers and casting doubts on their ability to provide fresh water during the dry summers in the longer term.

How to cite: Jouberton, A., Fugger, S., Shaw, T., Miles, E., Kneib, M., Kayumov, A., Halimov, A., Navruzshoev, H., Kabutov, H., Vosidov, F., and Pellicciotti, F.: Snow accumulation dynamics and its contribution to the hydrology of a glacierized catchment in the Northern Pamirs, EGU General Assembly 2024, Vienna, Austria, 14–19 Apr 2024, EGU24-18443, https://doi.org/10.5194/egusphere-egu24-18443, 2024.

EGU24-19899 | Posters on site | HS2.1.9

Flood modelling of a partly glacierized catchment in the Himalayas in a context of climate change 

Domenico De Santis, Christian Massari, Silvia Barbetta, Farhad Bahmanpouri, Viviana Maggioni, Sagar Gupta, Ashutosh Sharma, Ankit Agarwal, and Sumit Sen

The Himalayan region is severely exposed to the flood risk due to the heavy rainfall during the summer monsoon. The dynamics of the hydrological response during extreme events is relatively less understood, because of several complex and interactive processes. In this scenario, the use of rainfall-runoff models capable of adequately taking these processes into account could be crucial for reliable flood forecasting. However, in areas with such complex topography, accurately characterizing meteorological forcing and streamflow dynamics remains a challenging task due to the lack of ground measurements. Furthermore, in highly glacierized Himalayan basins, the significant contribution to streamflow by snow and ice melting has been shown to be progressively increasing due to its sensitivity to climate change, in parallel with the loss in glacier mass.

In this study, a conceptual and parsimonious hydrological model was implemented in semi-distributed mode and calibrated against streamflow and glacier loss volume data simultaneously. The MISDc-2L model was modified to simulate not only the snow accumulation and melt, but also the glacier melting in the ice-covered fraction of sub-basin area, assumed to occur once the seasonal snowpack is locally depleted. The Alaknanda River (one of the two headstreams of the Ganges) was chosen as a case study because it experiences several disastrous flood events in recent years. The basin upstream the Rudraprayag gauge was considered (≈8600 km2), for the period 2000-2020. The Randolph Glacier Inventory v7.0 was employed to locate glacierized areas, while glacier storage change data were extracted from available literature studies. Elevation data from NASADEM and hourly variables from ERA5-Land reanalysis dataset were used. A joint objective function was considered for calibration, including the Kling-Gupta efficiency, a high-flows hydrological signature and the error in glacier stored water loss. The model, constrained with glacier storage change data, was found to be able to provide good hydrological performances, both in calibration and validation, also with specific reference to annual flood peaks.

Despite the simplicity and the flood-oriented approach, the proposed modelling procedure simulated the dominant hydrological processes in a physically plausible way, in a basin with high-altitude glacierized areas in a context of climate change. The goal of adequately characterizing the contribution of glacier melt to total streamflow was pursued by aiming for consistency with additional data sources.


This work was funded by:

-          the Next Generation EU - Italian NRRP, Mission 4, Component 2, Investment 1.5, call for the creation and strengthening of 'Innovation Ecosystems', building 'Territorial R&D Leaders' (Directorial Decree n. 2021/3277) - project Tech4You - Technologies for climate change adaptation and quality of life improvement, n. ECS0000009. This work reflects only the authors’ views and opinions, neither the Ministry for University and Research nor the European Commission can be considered responsible for them.

-          the FLOSET Project 'Probabilistic floods and sediment transport forecasting in the Himalayas during the extreme events’, funded in the context of the 'ITALY-INDIA JOINT SCIENCE AND TECHNOLOGY COOPERATION CALL FOR JOINT PROJECT PROPOSALS FOR THE YEARS 2021 2023'.

How to cite: De Santis, D., Massari, C., Barbetta, S., Bahmanpouri, F., Maggioni, V., Gupta, S., Sharma, A., Agarwal, A., and Sen, S.: Flood modelling of a partly glacierized catchment in the Himalayas in a context of climate change, EGU General Assembly 2024, Vienna, Austria, 14–19 Apr 2024, EGU24-19899, https://doi.org/10.5194/egusphere-egu24-19899, 2024.

EGU24-19969 | Orals | HS2.1.9

Correction of raingages' snow undercatch at meteorological stations using data from snow surveys: an Armenian case study 

Vazken Andréassian, Amalya Misakyan, and Artur Gevorgyan

The hydrological analysis of high elevation catchments is particularly difficult for two reasons:

. first, precipitation measurements are scarce at higher elevations,

. second, even when there are precipitation measurements, the collected amounts are strongly biased due to the well-known effect of wind on snowflakes.

Several formulations have been proposed to correct this wind-dependent underestimation of solid precipitation amounts. They all depend on at least one parameter, which must be calibrated for the specific location. At a few locations in the world, a double-fenced shielded raingage can be used to provide a reference precipitation amount, and the parameter of the correction can be determined experimentally. But at most locations, we have no real way to parameterize the adjustment relationship.

We use here a newly released dataset comprising 30 years of data for 11 stations located at high elevation in Armenia, where the precipitation gage network is strongly impacted by snow undercatch. Using ground snow surveys jointly with a degree-day based snow accumulation and melt model, we show that we can propose an adapted parameterization of the correction formula.

How to cite: Andréassian, V., Misakyan, A., and Gevorgyan, A.: Correction of raingages' snow undercatch at meteorological stations using data from snow surveys: an Armenian case study, EGU General Assembly 2024, Vienna, Austria, 14–19 Apr 2024, EGU24-19969, https://doi.org/10.5194/egusphere-egu24-19969, 2024.

EGU24-335 | ECS | PICO | HS2.1.10

Isotope Hydrology progress in sub-Saharan Africa. What information for water management?  

Bertil Nlend, Fréderic Huneau, and Suzanne Ngo Boum-Nkot

The utility of isotope techniques in hydrological investigations stems from their ability to label water sources and cycling processes including surface/groundwater interaction, water residence times, flow pathways, evaporation fluxes, and solute processes, to name a few. In Africa, they have been applied since four decades following the severe drought of the 1970s, and can now be summarized in important case studies. This review focusing on Cameroon (often called the little Africa) aims to put together all the stable and radioactive isotopic data (>500 samples from rainfall, surface and groundwater) published in the country to: (i) identify the drivers responsible for precipitation isotopes spatial variation and climatological implications, (ii) elucidate the groundwater recharge mechanisms over the countries and relationships with rivers, and (iii) highlight the existence of paleo-groundwater in the country. It is found that rainfall stable isotopes variation is linked to the migration of the Intertropical Convergence Zone (ITCZ). The groundwater recharge can be diffuse and focused. This latter mechanism is mainly observed in the semi-arid region. It is in this relatively dry region that most of the paleo-groundwater resources are identified thanks to 14C dating. This information will be useful to develop water management strategies regarding all the challenges (e.g., climatic and demographic) faced by the country. Finally, this paper discusses the gaps groundwater isotope hydrology can still fill for contributing to a sustainable development of the country. Reflections provided here can be extend in each country of the sub-Saharan Africa region.

How to cite: Nlend, B., Huneau, F., and Ngo Boum-Nkot, S.: Isotope Hydrology progress in sub-Saharan Africa. What information for water management? , EGU General Assembly 2024, Vienna, Austria, 14–19 Apr 2024, EGU24-335, https://doi.org/10.5194/egusphere-egu24-335, 2024.

Arid and semi-arid areas are characterized by low annual rainfall that is unevenly distributed in time and space. These low and variable rainfall conditions are exacerbated by the effects of climate change, resulting in increasing agricultural losses for rain-fed crops. To overcome this, several water conservation techniques have been developed to safeguard agricultural yields. For example, supplemental irrigation using catchment basins is a climate change adaptation solution that has been promoted for many years in drought-prone areas. Unfortunately, this technique has had limited success in the Sahel due to the large amount of water lost through infiltration into the basins. These losses are closely related to the type of lining chosen to seal the runoff collection basins. Using a factorial analysis model, this paper highlights farmers' preferences for four of the most popular liners in Burkina Faso. Based on Waso-2 method, the survey was conducted in 2022 among 41 pond-owning farmers in the Central, Central Plateau and Central South regions. The results clearly show that the choice of liner has little to do with its availability and cost: producers focus all their attention on the liner's ability to improve the watertightness of their ponds and on the complexity of its maintenance. Concrete is therefore the first choice of producers as it is the most watertight, weatherproof, and durable, but also the most expensive. It is followed by plastic sheeting, a highly waterproof material available on the market, but not very durable. Clay comes third, despite its availability and low cost. Well-known in traditional architecture for ensuring the comfort of buildings, clay has proved ineffective for waterproofing submerged structures where the ground is unstable or cracked. Bitumen came last, as it is little known for pond protection and is not available in rural Burkina Faso.

Keywords: Rainwater harvesting basin, sealing solutions, supplemental irrigation, Waso-2.

How to cite: Kaboré, T. V. R.: Analysis of farmers' perception about sealing techniques for runoff harvesting ponds: the case of Burkina Faso., EGU General Assembly 2024, Vienna, Austria, 14–19 Apr 2024, EGU24-668, https://doi.org/10.5194/egusphere-egu24-668, 2024.

EGU24-2318 | ECS | PICO | HS2.1.10

Hydrological Model Performance Assessment across several Moroccan Catchments: Investigating the Effect of Model Attributes, Catchment Features, and Precipitation Inputs 

Oumar Jaffar, Abdessamad Hadri, El Mahdi El Khalki, Khaoula Ait Naceur, Mohamed El Mehdi Saidi, Yves Tramblay, and Abdelghani Chehbouni

Hydrology research can benefit significantly from large-sample hydrology studies by offering the possibility for better hydrological models’ assessment and by providing a suitable ground for identifying catchment characteristics that influence model performance. In our study, we conducted a performance assessment of eight monthly lumped rainfall-runoff models (GR2M, XM, WM, VUB, abcd, DWBM, GR5M, and Wapaba) in 30 Moroccan catchments, forced by rainfall data from 34 rain gauges. During the study period 1983-2019, we investigated the relationship between model performance (quantified with KGE) and both model complexity and structural attributes. Furthermore, we conducted correlation analysis to explore possible connections between this performance and catchment features (more than 180 features were considered), and we additionally examined how the models respond to three precipitation input data, namely ERA5, CHIRPS, and PERSIANN-CDR. Our findings revealed that no hydrological model was the best (or the worst) across the entire set of catchments. The model performance was found to be more influenced by model structure than by its degree of complexity, and more by hydro-climatic characteristics, particularly those related to calibration and calibration relative to validation, than by non-hydro-climatic factors. Among the investigated features, the Pearson correlation between observed rainfall and runoff was the strongest characteristic influencing model performance. Furthermore, this study (i) emphasized the essential role of rainfall and runoff data richness, in terms of wet and dry years, in enhancing model performance even if the calibration data is only relatively richer than the validation data and (ii) showed that dry periods are more beneficial to model performance than wet ones. Finally, our study revealed a consistent pattern in the models’ responses to the different rainfall forcings; with ERA5 consistently yielding the best model performance and PERSIANN-CDR consistently resulting in underperformance. This consistent behavior of the models was best explained by the linearity between the employed rainfall products and the catchments' observed runoff.

How to cite: Jaffar, O., Hadri, A., El Khalki, E. M., Ait Naceur, K., Saidi, M. E. M., Tramblay, Y., and Chehbouni, A.: Hydrological Model Performance Assessment across several Moroccan Catchments: Investigating the Effect of Model Attributes, Catchment Features, and Precipitation Inputs, EGU General Assembly 2024, Vienna, Austria, 14–19 Apr 2024, EGU24-2318, https://doi.org/10.5194/egusphere-egu24-2318, 2024.

EGU24-2694 | PICO | HS2.1.10

The Interplay between Land Use Changes and Hydrological Processes in the Upper Offin Basin of Ghana 

Seifu Tilahun, Afia Sarpong Anane Gyebi, Junias Adusei-Gyamfi, Andoh Kwaku Amponsah, Gerald Atampugre, and Olufunke Cofie

The transformation of the food system is intricately linked to the effective management of land and water resources, particularly in regions where diverse land uses compete for limited space. The upper Offin sub-basin serves as a prime example of this complexity, where agricultural, mining, and agroforestry practices fight for arable land, influencing the local food system and changes in hydrological processes. This study aims to comprehend the flow paths, the status of water resources, and land use changes in the agroforestry-dominated landscape of the upper Offin basin in Ghana. To assess historical land use patterns, Landsat images were utilized, alongside trend analyses of past hydro-climatic variables and a Thornthwaite-based water balance incorporating inputs from remote sensing and secondary data spanning from 1981 to 2022. Furthermore, the study instrumented an upland Mankran watershed in the upper Offin, where citizen scientists measured basic hydrological variables in three landscape positions—such as daily rainfall, streamflow rates, and groundwater levels—and water quality parameters (nitrate, phosphate, and mercury) from June to October 2023. The analysis revealed that annual and monthly rainfall exhibited minimal changes over the study period (1981–2022). Forest areas experienced a general decrease, while croplands and built-up areas increased between 2008 and 2021, impacting water balance components. Actual evapotranspiration (AET) based on the water balance model and WaPOR data demonstrated a decreasing trend, while streamflow at the basin outlet increased from 1986 to 2012. The runoff coefficient and the hydrological simulation based Thornthwaite-based water balance demonstrated that subsurface flow dominated the runoff processes, constituting approximately 20% of the average annual rainfall. This is also supported by the nitrate concentrations only peaked in rivers in June, while agricultural wells exhibited consistently high concentrations throughout the rainy period, suggesting leaching through subsurface flow. Phosphate concentrations increased in streams as the rainy period progressed, mirroring well concentrations, and mercury concentrations were low in surface water but four times higher in groundwater, indicating further the subsurface flow dominance. This study provides crucial insights for informed decision-making regarding the hydrological processes amid changing landscapes for sustainable agriculture and biodiversity preservation in the region. The emphasis on subsurface flow dominance underscores its significance in potential transport mechanisms for water quality within the landscape. Landscape management interventions must consider the role of subsurface flow to safeguard environmental resources, enhance water quality, and protect human health.

How to cite: Tilahun, S., Anane Gyebi, A. S., Adusei-Gyamfi, J., Amponsah, A. K., Atampugre, G., and Cofie, O.: The Interplay between Land Use Changes and Hydrological Processes in the Upper Offin Basin of Ghana, EGU General Assembly 2024, Vienna, Austria, 14–19 Apr 2024, EGU24-2694, https://doi.org/10.5194/egusphere-egu24-2694, 2024.

EGU24-3573 | ECS | PICO | HS2.1.10

Exploring Trends, Patterns, and Drivers of African Surface Water Dynamics 

Patrick Sogno, Igor Klein, Soner Uereyen, Felix Bachofer, and Claudia Kuenzer

Water, a fundamental resource for both ecosystems and human populations, faces escalating challenges in Africa due to water stress and changes in climate, demography, and socioeconomics. Because these changes are happening at a rapid pace, it is essential to understand the dynamics of water bodies and the factors that impact them to ensure sustainable usage strategies. Our research aims to analyze the long-term trends of surface water availability in Africa, identify the causal impacts on major water bodies, and explore the similarities between different lakes.

We use daily time series based on Earth observation, including the MODIS-based Global WaterPack for a daily uninterrupted time series of the continent's surface water area. Furthermore, we incorporate daily time series of hydrologically relevant variables such as precipitation, total evapotranspiration, groundwater, soil moisture, and Gross Primary Productivity (GPP) to analyze their impact on surface water dynamics of major African lakes. For this, we employ the Peter and Clark Momentary Conditional Independence causal identification algorithm. Our findings reveal subbasin-wide surface water and GPP to be the dominant drivers of surface water dynamics in most cases. We further find that dynamically similar lakes often share common drivers, allowing the generation of regional lake clusters. Understanding the drivers of African lakes may significantly help in the formulation of sustainable development strategies.

In conclusion, our continent-wide analysis provides valuable insights, particularly beneficial for stakeholders engaged in international development and ecosystem protection and restoration. As we deal with the challenges of water resource management in Africa, our research aims to contribute substantively to the formulation of strategies that foster sustainability and resilience in the face of evolving environmental and socio-economic conditions.

How to cite: Sogno, P., Klein, I., Uereyen, S., Bachofer, F., and Kuenzer, C.: Exploring Trends, Patterns, and Drivers of African Surface Water Dynamics, EGU General Assembly 2024, Vienna, Austria, 14–19 Apr 2024, EGU24-3573, https://doi.org/10.5194/egusphere-egu24-3573, 2024.

The recent 5-season drought in the Horn of Africa, which contributed to food security issues that nearly resulted in a declaration of famine by the UN, has renewed interest in the “East African Paradox” (cf. Rowell et al., 2015): despite observed drying trends in the March-April-May “long” rains, global coupled climate models—whose output is increasingly used to drive hydrological models and inform projections of the socioeconomic risks of climate change in East Africa—project increases in seasonal rainfall totals over both the historical period and throughout future projections in the region. This ‘Paradox’ could arise from low-frequency internal variability causing drying even if long-term trends are wetting or from structural biases in climate models (e.g. simulation of the equatorial Pacific Ocean) that cause spurious trends in model simulations. Large Ensembles, including for SST-forced runs, make differentiating between internal variability and biases in model mean behavior more feasible, and another decade of observational data since the emergence of the ‘Paradox’ helps improve our understanding of historic internal variability.

We use a large multi-model ensemble of opportunity of coupled and SST-forced runs from the latest model generation (CMIP6), spanning the observational record, to revisit the magnitude and causes of the ‘Paradox’. We find that drying trends in the long rains are timescale-dependent and weaker than they were during the peak ‘Paradox’ period. This is mostly well modeled by the SST-forced ensemble, though coupled models continue to have erroneously strong wetting trends. The ‘Paradox’ therefore is reduced to what are the causes of low frequency SST trends and why coupled models cannot reproduce them.  We will discuss if these changes are the result of natural variability temporally masking the forced trend and what the sign of that trend might be.  These results have implications for projections of future climate impacts with a potentially quantifiable range of internal variability providing more actionable information than the deep uncertainty on forced trends introduced by structural model errors.

How to cite: Schwarzwald, K. and Seager, R.: Revisiting the ‘East African Paradox’: CMIP6 models also fail to simulate observed drying trends in the Horn of Africa Long Rains, EGU General Assembly 2024, Vienna, Austria, 14–19 Apr 2024, EGU24-4687, https://doi.org/10.5194/egusphere-egu24-4687, 2024.

EGU24-5288 | PICO | HS2.1.10

Spatial prediction of borehole yield in southern Mali using machine learning classifiers 

Victor Gómez-Escalonilla, Oumou Diancoumba, Dasso Yolande Traoré, Esperanza Montero, Miguel Martín-Loeches, and Pedro Martínez-Santos

Groundwater plays a vital role in drinking water supply, food security and ecosystem services. Approximately 2.5 billion people worldwide rely exclusively on groundwater to meet their daily needs, while hundreds of millions of farmers depend on groundwater resources to sustain their livelihoods. Groundwater potential mapping based on machine learning (ML-GPM) can be used to support groundwater exploration, planning and management practices. Most ML-GPM studies aim to predict a positive or negative outcome, that is, to identify areas of high or low groundwater potential. This work takes this conventional bivariate outcome approach one step further by predicting borehole yields and applying a multiclass approach. The method is illustrated through an application over a study area of 21,000 km2, including the administrative region of Bamako and the municipalities of Kati and Kangaba in the Koulikoro region of southern Mali. Logistic Regression, Gradient Boosting and Extra Trees classifiers were trained on an imbalanced multiclass database of 483 boreholes and 20 explanatory variables. The explanatory variables include information on lithology, geomorphology, soil, land use/land cover, topography, drainage and slope-related variables and rainfall, among others. All models returned prediction scores between 0.80 and 0.87. The most important variables include elevation, vegetation cover, basement depth and geology. The alluvial sediments of the Niger river banks, especially in the southern and northern sectors, are clearly associated with the most productive class. In contrast, the Mandingue plateau has the lowest groundwater potential. The piedmont areas present an intermediate groundwater perspective. These maps could be used to inform water supply policy at a regional scale.

How to cite: Gómez-Escalonilla, V., Diancoumba, O., Traoré, D. Y., Montero, E., Martín-Loeches, M., and Martínez-Santos, P.: Spatial prediction of borehole yield in southern Mali using machine learning classifiers, EGU General Assembly 2024, Vienna, Austria, 14–19 Apr 2024, EGU24-5288, https://doi.org/10.5194/egusphere-egu24-5288, 2024.

EGU24-6712 | PICO | HS2.1.10

Developments and Challenges in Operating a Hydrometeorological Research Observatory in the Western Sudanian Savanna - Ten Years of WASCAL Observatory Experience 

Jan Bliefernicht, Samuel Guug, Rainer Steinbrecher, Frank Neidl, Ines Spangenberg, Leonard K. Amekudzi, Emmanuel Quansah, Patrick Davies, Heye Bogena, Roland Baatz, Ursula Gessner, Thomas Jagdhuber, Francis Oussou, Seyni Salack, Belko Diallo, Kehinde O. Ogunjobi, Souleymane Sy, Windmanagda Sawadogo, Verena Huber Garcia, and Harald Kunstmann

West Africa is a data-poor region, and long-term hydrometeorological field experiments are very limited but are essential for a better understanding of climate change and land use change impacts in this vulnerable region. This study provides a detailed overview of WASCAL hydrometeorological observatory, which was established in 2013 in the Sudan savanna of Burkina Faso and Ghana. This region is characterized by strong land use changes due to a rapid increase of agricultural land. The observatory is therefore designed to study the effects of land use changes on land-atmosphere exchange processes and other terrestrial land surface processes and characteristics. It consists of a network of state-of-the-art hydro-meteorological measurement equipment (e.g., automatic weather stations, agrometeorological stations) complemented by innovative devices such as cosmic ray neutron sensors for improved soil moisture monitoring. A unique component of the observatory is a micrometeorological experiment using eddy covariance towers implemented at five contrasting land use sites to study the impacts of land use change on water, energy, and greenhouse gas fluxes. The datasets of the WASCAL observatory are needed as key information for the development and evaluation of land surface models, hydrological models, and improved regional climate models and other environmental modelling approaches and products. In this presentation, we provide a detailed overview of the current development of the WASCAL observatory. In addition, selected results from the inter-twined field, remote sensing, and RCM modeling studies are presented.

How to cite: Bliefernicht, J., Guug, S., Steinbrecher, R., Neidl, F., Spangenberg, I., Amekudzi, L. K., Quansah, E., Davies, P., Bogena, H., Baatz, R., Gessner, U., Jagdhuber, T., Oussou, F., Salack, S., Diallo, B., Ogunjobi, K. O., Sy, S., Sawadogo, W., Huber Garcia, V., and Kunstmann, H.: Developments and Challenges in Operating a Hydrometeorological Research Observatory in the Western Sudanian Savanna - Ten Years of WASCAL Observatory Experience, EGU General Assembly 2024, Vienna, Austria, 14–19 Apr 2024, EGU24-6712, https://doi.org/10.5194/egusphere-egu24-6712, 2024.

EGU24-8158 | ECS | PICO | HS2.1.10 | Highlight

Investigating the human-water dynamics leading to increased drought and flood risk in Kitui, Kenya. 

Marlies H Barendrecht, Ruben Weesie, Alessia Matanó, Maurizio Mazzoleni, and Anne F. Van Loon

During the past decades, the county of Kitui in Kenya, has experienced severe droughts. Both rain seasons have failed for several years in a row. While the region is known for its aridity and the droughts it experiences, the region also experiences regular flooding. Both drought and flood events have had devastating impacts, leading to widespread water and food insecurity. In this study, we developed a system-dynamics model to investigate the interplay between drought and flood risk and how this is influenced by human-water interactions. We model the system’s hydrology, as well as drought and flood impacts and human actions and adaptation. We aim to estimate model parameters using hydrological and impact data and fit the model to the case study areas. The fitted model is used to investigate changes in drought and flood risk over the years and how these vary across three different case study areas. We investigate how both climatic drivers and human actions and responses to the changing environment influence drought and flood risk. This analysis provides insights into the main drivers of drought and flood risk and the model allows for an exploration of the policies and measures that could be implemented to reduce risk in the future.

How to cite: Barendrecht, M. H., Weesie, R., Matanó, A., Mazzoleni, M., and Van Loon, A. F.: Investigating the human-water dynamics leading to increased drought and flood risk in Kitui, Kenya., EGU General Assembly 2024, Vienna, Austria, 14–19 Apr 2024, EGU24-8158, https://doi.org/10.5194/egusphere-egu24-8158, 2024.

EGU24-8886 | PICO | HS2.1.10

Enhancing Rainfall Estimates in East Africa by Merging TAHMO Precipitation Gauge Data with Remote Sensing Rainfall Products 

Vincent Hoogelander, Nick van de Giesen, Rolf Hut, Jianzhi Dong, Camille Le Coz, and George Sserwada

Sub-Saharan Africa heavily relies on remotely-sensed rainfall measurements due to a lack of in-situ rainfall data. While a high number of satellite-based rainfall products do exist, they are typically developed and tested in regions with a high density of ground data. The Trans-African Hydro-Meteorological Observatory (TAHMO) aims to tackle the ground data gap by installing and operating a dense network of weather stations in Sub-Saharan Africa. As part of the TEMBO Africa project, TAHMO data were used to make a new regional rainfall product in East Africa based on the SM2Rain algorithm.  Subsequently, this regional product was merged with a reanalysis product (ERA5) and two MW/IR-based rainfall products (IMERG-L and CHIRPS) based on the Statistical Uncertainty analysis-based Precipitation mERging framework (SUPER). Within this framework, merging weights are based on error variances of the rainfall products determined from quadruple collocation on a pixel-to-pixel basis. The merged product and the individual products are evaluated using data of the individual TAHMO stations. Our findings indicate that the merged product outperforms the individual products in most selected evaluation metrics.  ERA5 has the highest contribution in the merged product, followed by SM2Rain. Both IMERG and CHIRPS have limited contribution in the merged product due to a high error variance. The ultimate goal of this study was to develop a workflow to enhance the accuracy of rainfall measurements in Sub-Saharan Africa by leveraging information from TAHMO data and different existing products, contributing to the improvement of remotely-sensed rainfall measurements in Sub-Saharan Africa.

We welcome suggestions on possible improvements and operational implementation, as well as ideas on how to use this merged product to understand the sources of error in satellite-based rainfall measurements in Sub-Saharan Africa.


TEMBO Africa: The work leading to these results has received funding from the European Horizon Europe Programme (2021-2027) under grant agreement n° 101086209. The opinions expressed in the document are of the authors only and no way reflect the European Commission’s opinions. The European Union is not liable for any use that may be made of the information

How to cite: Hoogelander, V., van de Giesen, N., Hut, R., Dong, J., Le Coz, C., and Sserwada, G.: Enhancing Rainfall Estimates in East Africa by Merging TAHMO Precipitation Gauge Data with Remote Sensing Rainfall Products, EGU General Assembly 2024, Vienna, Austria, 14–19 Apr 2024, EGU24-8886, https://doi.org/10.5194/egusphere-egu24-8886, 2024.

EGU24-9889 | ECS | PICO | HS2.1.10

Data rescue of millions of daily precipitation and temperature records collected within the Congo Basin 

Derrick Muheki, Bas Vercruysse, Christophe Verbruggen, Dominique Kankonde Ntumba, Ed Hawkins, Félicien Meunier, Fils Makanzu Imwangana, Hans Verbeeck, Julie M. Birkholz, José Mbifo, Kim Jacobsen, Koen Hufkens, Krishna K. T. Chandrasekar, Olivier Dewitte, Olivier Kapalay Moulasa, Pascal Boeckx, Peter Thorne, Seppe Lampe, Théophile Besango Likwela, and Wim Thiery

Local and distant archives of observed weather data present unique opportunities for scientists to obtain long time series of the historical hydrology and climate for many regions of the world. Unfortunately, most of these observational records are still to-date available only on paper, and thus require digitization and transcribing to machine-readable formats to facilitate analysis of hydroclimatic trends. Here we discuss the data rescue efforts for hydroclimatic data recorded at 36 climate stations in the Democratic Republic of Congo from the early 1950’s to-date. We describe the procedures we follow to digitize over 10,000 paper records of daily precipitation and temperature within archives both in the Democratic Republic of Congo and Belgium, and subsequently the steps to transcribe this data set using different methods including machine learning. Furthermore, we undertake quality control and quality assessment of the transcribed data. The resultant time series, comprised of millions of observations from the archived data, will resolve the challenges of limited available hydroclimatic data within the Congo basin and expedite research on the hydroclimate in the basin.

How to cite: Muheki, D., Vercruysse, B., Verbruggen, C., Ntumba, D. K., Hawkins, E., Meunier, F., Imwangana, F. M., Verbeeck, H., Birkholz, J. M., Mbifo, J., Jacobsen, K., Hufkens, K., Chandrasekar, K. K. T., Dewitte, O., Moulasa, O. K., Boeckx, P., Thorne, P., Lampe, S., Likwela, T. B., and Thiery, W.: Data rescue of millions of daily precipitation and temperature records collected within the Congo Basin, EGU General Assembly 2024, Vienna, Austria, 14–19 Apr 2024, EGU24-9889, https://doi.org/10.5194/egusphere-egu24-9889, 2024.

EGU24-13236 | ECS | PICO | HS2.1.10

Determinants of soil field-saturated hydraulic conductivity across sub-Saharan Africa: texture and beyond 

Aida Bargués Tobella, Leigh A. Winowiecki, Douglas Sheil, and Tor G. Vågen

Soil infiltration is a critical hydrological process governing water security and related ecosystem services. The infiltration capacity of soils is largely controlled by their hydraulic conductivity. Hence, understanding soil hydraulic conductivity is critical for effective soil and water management. Despite recent efforts in assembling measurements of soil hydraulic conductivity, global databases and derived pedotransfer functions lack coverage in the tropics. Africa, in particular, remains sparsely represented in these global databases, and representative observations of soil hydraulic properties are few and of mixed form and quality.

In this presentation, we introduce a new dataset of soil infiltration measurements and accompanying indicators of soil and land health collected systematically using the Land Degradation Surveillance Framework (LDSF) in 3573 plots from 83 100 km2 sites across 19 countries in sub-Saharan Africa and present the results from a recent study* where we used these data to (a) determine field-saturated hydraulic conductivity (Kfs) and (b) explore which variables best predict variation in Kfs.

Our results show that sand content, soil organic carbon (SOC), and woody cover had a positive relationship with Kfs, whereas grazing intensity and soil pH had a negative relationship. Our findings highlight that, despite soil texture being important, structure also plays a critical role. These results suggest significant opportunities to improve soil hydrological functioning through management and restoration practices that protect and enhance soil structure. Enhancing SOC content, limiting livestock stocking rates, promoting vegetation cover, particularly woody vegetation, and preventing and halting soil erosion can increase Kfs. This evidence can guide sustainable land management practices and restoration interventions across the region for improved soil health and water security.

Our dataset expands existing regional and global databases of soil hydraulic properties, improving coverage for Africa and providing field data for underrepresented land uses and soils. As such, we envision that this dataset can contribute to improved understanding and prediction of soil hydraulic properties and to improved Earth system and land surface models for applications in Africa.


* Bargués-Tobella, A., Winowiecki, L.A., Sheil, D., and Vågen, T.G. Determinants of soil field-saturated hydraulic conductivity across sub-Saharan Africa: texture and beyond. Water Resources Research. DOI 10.1029/2023WR035510. In-press.

How to cite: Bargués Tobella, A., Winowiecki, L. A., Sheil, D., and Vågen, T. G.: Determinants of soil field-saturated hydraulic conductivity across sub-Saharan Africa: texture and beyond, EGU General Assembly 2024, Vienna, Austria, 14–19 Apr 2024, EGU24-13236, https://doi.org/10.5194/egusphere-egu24-13236, 2024.

EGU24-13773 | ECS | PICO | HS2.1.10

Multi-Objective Calibration of Nile River Basin Using Recovered Records 

Irenee Felix Munyejuru and James Stagge

The transboundary Nile River Basin (NRB) occupies a tenth of the African continent and supports the daily livelihood of approximately 300 million people in 11 riparian countries. The NRB is hydrologically complex: two major watersheds, the Blue and White Nile, contribute about 85% of the total annual discharge; more than 50 % of the White Nile’s water is lost over the Sudd wetland; and the Blue and White Nile watersheds produce dramatically different seasonal hydrologic responses due to differences in hydroclimate and lake/wetland storage. The Inter-Tropical Convergence Zone (ITCZ) drives anomalies in temperature and precipitation; however, this atmospheric driver likely produces distinct hydrologic responses that depend on the spatial center over the Blue or the White Nile headwaters. Quantifying this effect requires a well-calibrated hydrologic model of the entire watershed under near-natural conditions, including hydrologic routing through major lakes and the Sudd wetland. This study aims to calibrate such a hydrologic model and recreate the hydrologic response of the major watersheds in the NRB using recovered records that extend to 1901, thereby greatly increasing the period used for model calibration and approximating near-natural responses prior to construction of several modern reservoirs. We employed GR4J, a parsimonious rainfall-runoff hydrologic model, because of its flexibility and minimal data requirements to match the NRB’s limited data availability, particularly during the early 1900s. Climate drivers, including precipitation and daily minimum/maximum temperatures were based on the Global Soil Wetness Project Phase 3 (GSWP3). Discharge data for model calibration were acquired from the Global Runoff Data Centre (GRDC) and through digitization of long discharge records from Hurst (1958). The NRB was discretized into 36 hydrological response units (HRUs), and calibrated using stepwise, multi-objective approach at 16 gauge locations between 1901 and 1964. In addition to avoiding the effects of several modern reservoirs, this early calibration period also avoided the most severe effects of climate change, as supported by the lack of discernible trends using the Mann-Kendall test. Our results show a successful calibration of the GR4J hydrological model to reasonably reproduce discharge at multiple locations across the NRB, with Nash-Sutcliffe Efficiencies of 0.83 and 0.64 at the outlets of the Blue and the White Nile, respectively. Additionally, the calibrated model accurately captured an abrupt change of Lake Victoria levels during the 1960s, affirming its reliability in simulating regional climate disruptions and lake dynamics. The model can therefore be used to study the sensitivity of major watersheds in the NRB and serves as a benchmark for understanding anthropogenic-induced departures from the natural hydrological behavior of the Nile River.

Keywords: Nile River Basin, GR4J, Calibration, Hydrology

How to cite: Munyejuru, I. F. and Stagge, J.: Multi-Objective Calibration of Nile River Basin Using Recovered Records, EGU General Assembly 2024, Vienna, Austria, 14–19 Apr 2024, EGU24-13773, https://doi.org/10.5194/egusphere-egu24-13773, 2024.

EGU24-19265 | ECS | PICO | HS2.1.10

Multi-scale and multi-model approaches to water management – application to drought and irrigation in Morocco 

Sven Berendsen, Justin Sheffield, Chiara Corbari, Nicola Paciolla, Diego Cezar Dos Santos Araujo, Ahmad Al Bitar, Kamal Labbassi, and Zoltan Szantoi

Water management is a problem of matching supply and demand whilst sustaining environmental conditions for a range of sectors and ecosystems, potentially under changing conditions of climate or demand. In dryland regions, this is particularly difficult given low available water supply and high climate variability, often with lack of data for operations, planning and design. Addressing these challenges at national scale requires whole-system approaches to incorporate the range of relevant sectors and their interactions, and multi-scale approaches to capture the large-scale drivers of water availability and the fine-scale variability of supply and demand within catchments, irrigation districts or urban areas.

In the context of the AFRI-SMART project “EO-Africa multi-scale smart agricultural water management” funded under the ESA EO Africa - National Incubators EXPRO+ programme, we have developed a multi-scale, multi-model approach to help address water management challenges in Morocco. On-going drought conditions in the country for the past 5 years have left reservoirs without water for irrigation, which must be prioritized for public water supply, impacting on food production, agricultural exports and farmer incomes. More accurate information on water resources distribution in space and time across scales and sectors is needed to address sustainable agriculture, to help guarantee food and water security, and increase resilience to hydro-meteorological extremes.

At national scale multiple sources of information from ground observations, satellite remote sensing, and climate and hydrological models are integrated to provide the best estimate of hydroclimate and drought indices to characterize the large-scale variability in water supply. This feeds into basin scale hydrological modeling, focused on the Oum Er-rbia basin using the HydroBlocks modelling framework, which combines a 1-D land surface model with a cluster-based landscape representation, allowing large-domain simulations at 10s metres resolution. HydroBlocks is coupled to the RAPID stream flow routing scheme to provide high resolution stream flow estimates. Predicted stream flow is routed to the main reservoirs in the basin which are simulated using a simple mass balance approach. Withdrawals from the reservoirs are supplied to one of the basin’s irrigation districts of Doukkala. Actual and optimized irrigation water needs for specific crops, at fine resolution (daily, 10 m) are predicted using the energy-crop-water balance model FEST-EWB-SAFY driven by Landsat LST and Sentinel2 vegetation indices.

The system is used to provide historic reconstructions of water availability and analyzed to identify times of supply risks. The system is also implemented in monitoring and seasonal forecast mode as a tool to understand upcoming risks to water supply and potential interventions to reduce risks, such as provision of early warning of risks, options for adjusted reservoir management, or altered/optimized irrigation scheduling. An open online decision support tool has been developed to provide intuitive near real-time visualization of information from the satellites/models and explore forecasts and future scenarios. We also discuss the collaboration with end user groups in helping to define the management problem and identification of critical decisions in water management across scales.

How to cite: Berendsen, S., Sheffield, J., Corbari, C., Paciolla, N., Dos Santos Araujo, D. C., Al Bitar, A., Labbassi, K., and Szantoi, Z.: Multi-scale and multi-model approaches to water management – application to drought and irrigation in Morocco, EGU General Assembly 2024, Vienna, Austria, 14–19 Apr 2024, EGU24-19265, https://doi.org/10.5194/egusphere-egu24-19265, 2024.

EGU24-336 | ECS | Orals | HS2.1.11

Improving runoff generation knowledge through baseflow campaigns 

Camyla Innocente dos Santos, Julian Klaus, and Pedro Luiz Borges Chaffe

Predictions from Global Climate Models point to increasing water scarcity across the Global South. However we currently lack understanding of how these predicted changes propagate through the hydrological cycle to smaller-scale systems. This lack of understanding is due to limited knowledge of hydrological processes, which persists in tropical, subtropical, and arid environments of the Global South. Clear blueprints exist for experimental catchment setups that allow us to understand spatiotemporal catchment processes (e.g., the Long Term Ecological Research LTER, the Critical Zone Observatory network CZO, and the Terrestrial Environmental Observatories TERENO); yet, it is not feasible to maintain such dense experimental networks in the understudied Global South. Reconciling snapshot baseflow campaigns as sources of data can be an alternative to expanding hydrological observation, particularly in developing countries where long-term records are scarce and pressure on water resources is growing. Here, we present results from baseflow campaigns in small nested catchments across different landscape elements to improve a rainfall-runoff model (geomorphologic instantaneous unit hydrograph) and provide insights into spatial patterns of flow, catchment water storage, and estimates of streamflow sources. The Peri Lake Experimental Catchment (19 km²) is characterized by granite and diabase dike and covered by the Atlantic rainforest. We measured baseflow discharge and sampled isotopes (δ18O and δ2H) at 25 catchments (areas ranging from 0.02 to 5.33 km²). Through combining flow velocity and discharge, we incorporated spatial variations of velocity in the channels during runoff, using a constant relationship between velocity and celerity. The Nash values were above 0.80, and we eliminated the need for concentration time formulas, where uncertainty reaches 500%. Combining isotopes and discharge enhanced our knowledge of the role of geology, with the Spearman coefficient between the percentage of granite and specific discharge being -0.68 (p-value < 0.05). We conceptualize that the diabase dikes are shallower with greater permeability, functioning as a conductor and supplier of water during baseflow. Simulations with a 3D surface-subsurface hydrological model  verify the capacity of the observed baseflow patterns in this catchment with heterogeneous geology. The results suggest that measurements in nested catchment during baseflow conditions reflect the heterogeneity of the different sources that contribute to streamflow. Snapshot measurement and sampling  campaigns are a powerful tool to understand runoff generation patterns in subtropical and tropical catchments of the Global South where continuous monitoring is hard to implement.

How to cite: Innocente dos Santos, C., Klaus, J., and Chaffe, P. L. B.: Improving runoff generation knowledge through baseflow campaigns, EGU General Assembly 2024, Vienna, Austria, 14–19 Apr 2024, EGU24-336, https://doi.org/10.5194/egusphere-egu24-336, 2024.

EGU24-896 | ECS | Orals | HS2.1.11

Water level regimes, forest composition, and forest functioning in floodplain forests in southeastern Brazil 

Aline Meyer Oliveira, Fernanda Gianasi, Patrícia Vieira Pompeu, Rubens Manoel dos Santos, and Ilja van Meerveld

Floodplain forests are unique ecosystems at the interface between rivers and terrestrial environments. They provide important ecosystem services, such as biodiversity conservation and flood control. However, they are also one of the most threatened ecosystems. Vegetation composition in floodplain forests depends on the flood regime, but there is a lack of knowledge on the relation between the water level regime and forest composition and functioning for the seasonally dry tropics. As a result, it is unclear how these forests will be impacted by climate change.

In the WatForFun (“Water level regime and forest functioning in floodplain forests”) project, we brought together an interdisciplinary team of hydrologists and ecologists to better understand the relation between flood dynamics (e.g., flood frequency and duration) and tree species composition, phylogenetic diversity, functional diversity and taxonomic diversity. Fieldwork was conducted in six seasonally flooded forests in the state of Minas Gerais in southeastern Brazil. Three floodplains are located in the Rio Grande basin (Capivari, Jacaré, and Aiuruoca), and another three in the São Francisco basin (Jequitaí, Verde Grande, and Carinhanha). The floodplains encompass a gradient in climate, from humid subtropical to seasonal dry tropical. For each floodplain, we identified five geomorphological eco-units based on the vegetation composition: marginal levee, lower terrace, upper terrace, lower plain, and higher plain. We surveyed the vegetation at each site and installed groundwater wells and surface water level loggers to monitor the water level regime. We sampled xylem water, soil water, groundwater, surface water and precipitation to identify the sources for tree water uptake based on the stable isotopes of hydrogen and oxygen.

The eco-units differ from each other with regards to vegetation composition, phylogenetic and taxonomic diversity, and in terms of flood duration and flood frequency. The terraces remained flooded for longer periods of time than the other eco-units. The flood duration for the levees differed for the two basins. The xylem water was more depleted during the wet season than during the dry season, suggesting that trees change water uptake strategies depending on water availability. These findings help us to better understand the relation between floods and vegetation composition and to predict the impacts of climate change on vegetation composition and diversity.  

How to cite: Meyer Oliveira, A., Gianasi, F., Vieira Pompeu, P., Manoel dos Santos, R., and van Meerveld, I.: Water level regimes, forest composition, and forest functioning in floodplain forests in southeastern Brazil, EGU General Assembly 2024, Vienna, Austria, 14–19 Apr 2024, EGU24-896, https://doi.org/10.5194/egusphere-egu24-896, 2024.

EGU24-1529 | ECS | Posters on site | HS2.1.11

Understanding water use strategies of Central European tree species in dependency on groundwater depth 

Clara Rohde, Alberto Iraheta, Matthias Beyer, Gökben Demir, and Maren Dubbert

In 2003, 2015, and 2018 extreme droughts caused severe depletion in soil water storage, decreased groundwater tables, and severe damage to forest ecosystems in Europe, such as increased mortality rate. In the future, such extreme droughts will be more likely to occur due to climate change. Therefore, it is crucial to understand and develop mitigation strategies and responses to reduced water availability of European trees for drought resilience.

Tree species significantly differ in their response to drought. Isohydric trees, for example, which are often deep-rooted, close their stomata when sensing a change in soil water potential while anisohydric trees - often shallow-rooted - continue to transpire even when soil moisture declines. As a result, anisohydric trees have an increased risk of hydraulic failure under drought stress because of their high stomatal conductance. Moreover, it is assumed that deep-rooted trees are more resilient to droughts than shallow-rooted trees because these trees possess an enhanced capacity to better withstand periods of drought. However, when naturally deep-rooted and isohydric trees lose their stable water source connection they might be strongly susceptible to drought. In this study, we examine the different below and above-ground mitigation strategies of common central European tree species in a temperate climate.

We chose a mixed forest stand composed of Fagus sylvatica L., Carpinus betulus L., Fraxinus excelsior L., and Quercus spp. trees on a hillslope in NW Germany where a natural gradient of groundwater distance (> 4 m top site, ~ 1.50 m valley) exists and variable rooting depths are found. Observations of soil and plant water status, as well as groundwater level at three hillslope positions (top, slope, valley), started in May 2023. Two point-dendrometers per tree species and hillslope position providing annual tree growth were used to determine tree water potential. Sap flow sensors (three per tree species and position) were installed to estimate plant water use and stem water content as well as for upscaling to tree and stand-level photosynthesis. All sensors will run another growing season for comparative analysis.

Although the year 2023 was not particularly dry and no severe soil water depletion was observed, the first growing season measurements indicate that e.g. C. betulus and F. excelsior are performing better - i.e. showing higher sap flux velocities and higher growth rates - in the valley than at the top position. Potential reasons could include the proximity of the groundwater table in the valley, trees being less limited in their transpiration efforts. However, other factors such as differing shading and less competition to C. betulus trees, which are more abundant uphill, need to be explored further.

How to cite: Rohde, C., Iraheta, A., Beyer, M., Demir, G., and Dubbert, M.: Understanding water use strategies of Central European tree species in dependency on groundwater depth, EGU General Assembly 2024, Vienna, Austria, 14–19 Apr 2024, EGU24-1529, https://doi.org/10.5194/egusphere-egu24-1529, 2024.

EGU24-3398 | ECS | Posters on site | HS2.1.11

Soil and plant water ages in two Pinus radiata forests with markedly different annual precipitation amounts  

Lutz Klein, Bruce Dudley, Julian Klaus, and Dean Meason

Pinus radiata, which grows under a wide range of climate conditions, makes up the majority of the planted forests in New Zealand leading to concerns over the impact of this non-native species on water availability and quality. Transit times of water through the vadose zone reflect water fluxes and affect runoff chemistry. However, little is known on how vadose zone transit times differ for forests of the same species under different precipitation regimes. Our goal here is to evaluate how root water uptake (RWU), water transit times, and groundwater recharge in Pinus radiata plantations differ under variant precipitation. We investigated soil water fluxes and RWU in nine soil profiles in two Pinus radiata forests with greatly differing annual precipitation amounts (2934 mm vs. 725 mm) in New Zealand’s South Island. We estimated water age of vadose zone and xylem water using an isotope-enabled version of the one dimensional hydrological model Hydrus 1-D. We inversely derived the model parameters using a Monte-Carlo simulation with Latin hypercube sampling with times series of soil moisture and soil and xylem water stable isotopes. 
At the dry forest site, we found that transpiration and recharge accounted for over 80%, and around 10% of annual precipitation, respectively. At the wet forest site transpiration accounted for 24% and recharge 70% of annual precipitation. RWU at the dry forest site was nearly constantly soil moisture-limited while vapour pressure deficit was the limiting factor at the wet forest site. At the dry forest site, a large range of water ages contributed to RWU. During dry periods water age of RWU was high, but dropped sharply in surface soil layers and RWU following intense precipitation events. This was not observed at the wet forest site where soil water age and xylem water age were less variable. While at the wet forest site Pinus radiata almost exclusively relied on water from the current season for RWU, at the dry forest site significant amounts of RWU in the summer stemmed from winter precipitation.   Our results demonstrate not only greater impacts of these plantation forests on soil water balances in more arid climates, but also suggest greater susceptibility of dryland forests to variation in precipitation regimes.  

How to cite: Klein, L., Dudley, B., Klaus, J., and Meason, D.: Soil and plant water ages in two Pinus radiata forests with markedly different annual precipitation amounts , EGU General Assembly 2024, Vienna, Austria, 14–19 Apr 2024, EGU24-3398, https://doi.org/10.5194/egusphere-egu24-3398, 2024.

EGU24-7687 | ECS | Orals | HS2.1.11

Soil moisture dynamics of forest soils – magnitude, persistence and implications of soil water repellency  

Pascal Benard, Julian Schoch, Andrea Mazza, Peter Lehmann, and Andrea Carminati

Soil water repellency has been observed across a range of ecosystems, including forests. Among other parameters such as organic matter content and quality, climate, and soil texture, the magnitude and persistence of water repellency is controlled by the initial soil moisture content. With the increasing risk of prolonged and recurrent drought events across Europe causing significant increases in tree mortality, the feedback between soil moisture and soil rewetting is of increasing importance, as delayed soil rewetting may prolong water stress beyond drought events and reduce the plant available water. In this study, we quantified the local contact angle (sessile drop method) and in-situ rewetting dynamics (electrical resistivity tomography), including their relationship with initial soil moisture (sorptivity), of forest soils with contrasting vegetation.

The results showed a fundamental difference in the persistence of water repellency and rewetting dynamics between an oak and a spruce stand. Despite prolonged precipitation (> 100 mm) following a dry summer, the sandy loam topsoil under spruce did not rewet after rain events, indicating persistent water repellency and fast water percolation to greater depth via preferential flow paths. In contrast, the sandy loam topsoil under oak rewetted after rainfall and was unaffected by water repellency, despite the similarly high initial contact angle of about 85° of dry soil at both sites.

Our results highlight the importance of moisture dependence and persistence of soil water repellency for plant-available soil water in forests. The striking persistence of low soil moisture in topsoil, in combination with shallow-rooted spruce may explain in parts the severe dieback of spruce across Europe. Furthermore, the hydrological response of repellency-affected forest sites is likely to be influenced by the feedback between initial soil moisture, soil wettability and its persistence, and soil rewetting dynamics.

How to cite: Benard, P., Schoch, J., Mazza, A., Lehmann, P., and Carminati, A.: Soil moisture dynamics of forest soils – magnitude, persistence and implications of soil water repellency , EGU General Assembly 2024, Vienna, Austria, 14–19 Apr 2024, EGU24-7687, https://doi.org/10.5194/egusphere-egu24-7687, 2024.

Bimodal runoff behavior, characterized by two distinct peaks in flow response, often leads to significant stormflow and associated flooding. Understanding and characterizing this phenomenon is crucial for effective flood forecasting. However, this runoff behavior has been understudied and poorly understood in semi-humid regions. This study delves into the mechanisms behind delayed stormflow generation in a mountainous forested watershed within the semi-humid regions of North China. We assess the influence of soil water content and groundwater levels on the threshold behavior of delayed stormflow. Results indicate that the threshold behavior of the bimodal hydrograph is jointly controlled by soil water storage and groundwater levels, with soil water storage serving as the initiating factor for delayed stormflow. The groundwater replenishment and subsequent rise in groundwater level, crucial for the delayed stormflow, occur specifically when the soil water storage reaches 200 mm amid rainfall. At this point, shallow groundwater flow is promptly mobilized, swiftly moving into the channel and leading to the initiation of delayed stormflow. Notably, upon reaching a specific threshold groundwater level, each hillslope responds almost simultaneously, establishing a more extensive hydrological connectivity between the hillslopes and the stream channel. A substantial volume of shallow groundwater is released within a day, resulting in a hybrid bimodal hydrograph. These findings can enhance our understanding of the groundwater stormflow generation mechanism in semi-humid forest watersheds and contribute to the refinement of related runoff generation theories. 

How to cite: Cui, Z. and Tian, F.: Bimodal Hydrographs in Semi-humid Forested Watershed: Controlling Factors and Generation Mechanism , EGU General Assembly 2024, Vienna, Austria, 14–19 Apr 2024, EGU24-7747, https://doi.org/10.5194/egusphere-egu24-7747, 2024.

EGU24-8425 | Orals | HS2.1.11

Rainfall partitioning by vegetation in China 

Yafeng Zhang, Chuan Yuan, Ning Chen, and Delphis Levia

Rainfall partitioning into stemflow, throughfall, and interception loss by vegetation alters hydrological and biogeochemical fluxes between vegetation and soil, and further affects water and nutrient balances at local, catchment, and regional scales. Here, we compiled a comprehensive dataset of rainfall partitioning by vegetation (forests, shrublands, croplands, and grasslands) in China. Based on this dataset, we delineate the general characteristics of rainfall partitioning in China from field observations. We summarize the best-fit functions reported for rainfall partitioning fluxes as a function of rainfall amount, as well as the rainfall thresholds for throughfall and stemflow initiation. We explore the patterns of the proportions of stemflow, throughfall, and interception loss to the gross rainfall across vegetation types in China. We determine whether and to what extent the chemical composition of rainwater is altered during rainfall partitioning processes. We use a machine learning method (boosted regression trees) to model the relative effects of cross-site biotic and abiotic predictors on each of the rainfall partitioning fluxes (%) and on the magnitude of chemical alteration in throughfall and stemflow. Our study avails a global readership to the findings of a large cache of Chinese studies that have been inaccessible hitherto, would aid in an accurate estimation of water and nutrients budget in vegetated ecosystems worldwide, and are helpful for making viable strategies to enhance forestry water resources management.

How to cite: Zhang, Y., Yuan, C., Chen, N., and Levia, D.: Rainfall partitioning by vegetation in China, EGU General Assembly 2024, Vienna, Austria, 14–19 Apr 2024, EGU24-8425, https://doi.org/10.5194/egusphere-egu24-8425, 2024.

EGU24-10997 | ECS | Posters on site | HS2.1.11

Modelling surface water and energy transfer in karstic mediterranean forests 

Brune Raynaud--Schell, Jérôme Demarty, Jordi Etchanchu, Chloé Ollivier, Léna Collet, Jean Kempf, Jean-Marc Limousin, Olivier Marloie, Albert Olioso, Jean-Marc Ourcival, Guillaume Simioni, and Véronique Leonardi

Droughts are a major factor in the vulnerability of Mediterranean ecosystems, particularly forest ecosystems, which are mainly located in karstic environments. Under the effects of global change, these environments are exposed to increasingly frequent and intense droughts. Recent ecophysiological and isotopic studies have shown that tree roots are able to feed deep enough in the epikarst to support transpiration during periods of water stress. However, the quantification of stocks and temporal dynamics are not yet fully established. This calls for the development of models adapted to the complexity of the environment, with the aim of improving our knowledge of both aquifer recharge and the hydric functioning of forests. The work carried out in this study goes in this direction. It aims to suggest, implement and test a SVAT-type model of energy and water exchanges at the soil-vegetation-atmosphere interface, adapted to Mediterranean forest environments in karstic zones. The modelling objective is dual: i) to jointly simulate the processes of diffuse infiltration into the soil (i.e. the superficial part of the root zone) and rapid infiltration into the network of karstic fractures (i.e. the deep part of the root zone); ii) to simulate the transpiratory and water extraction processes throughout the root zone. To do this, an adaptation of the SiSPAT model was developed and then deployed for the first time on two sites in the ICOS network, namely the forest sites of Font-Blanche (Bouches-du-Rhône, P.I. URFM) and Puéchabon (Hérault, P.I. CEFE). The results highlight the importance to represent both diffuse and preferential flows in SVAT modelling for karstic areas. It particularly shows that preferential infiltration builds up deep water reserves throughout the year. It helps to reproduce better observed transpiration by the plant canopy during periods of water stress. It also significantly affects the different hydrological components of the surface, e.g. runoff and drainage to the aquifers.

How to cite: Raynaud--Schell, B., Demarty, J., Etchanchu, J., Ollivier, C., Collet, L., Kempf, J., Limousin, J.-M., Marloie, O., Olioso, A., Ourcival, J.-M., Simioni, G., and Leonardi, V.: Modelling surface water and energy transfer in karstic mediterranean forests, EGU General Assembly 2024, Vienna, Austria, 14–19 Apr 2024, EGU24-10997, https://doi.org/10.5194/egusphere-egu24-10997, 2024.

EGU24-11093 | Orals | HS2.1.11

Are spatial patterns of soil moisture or percolation affected by throughfall heterogeneity? Empirical evidence from a beech-dominated forest. 

Anke Hildebrandt, Fischer-Bedtke Christine, Metzger Johanna Clara, Demir Gökben, and Wutzler Thomas

Heterogeneity in throughfall, caused by the redistribution of precipitation in the vegetation canopy, has repeatedly been hypothesized to influence the variation in soil water content and runoff behavior, especially in forests. However, observational studies directly relating the spatial variation in the soil water content or dynamics to net precipitation are rare. Here, we investigate how throughfall patterns affect the spatial heterogeneity in the soil water response in the main rooting zone. We assessed rainfall, throughfall, and soil water content (at two depths, 7.5 and 27.5 cm) in a 1 ha temperate mixed beech forest plot in Germany during the 2015 and 2016 growing seasons using independent, high-resolution, stratified, random designs. Because the throughfall and soil water content cannot be measured at the same location, we used kriging to derive the throughfall values at the locations where the soil water content was measured.

Spatial patterns of throughfall were related to canopy density. Although spatial autocorrelation decreased with increasing event size, temporally stable throughfall patterns emerged, resulting in the reoccurrence of higher- and lower throughfall locations across precipitation events. Linear mixed-effects model analysis showed that while soil water content patterns were poorly related to spatial patterns of throughfall, the increase in soil water content after rainfall was strongly related. More water was stored in the soil in areas where throughfall was elevated. At the same time, however, the local soil water response was modified by the soil wetness itself in a way that suggests processes of rapid drainage and runoff. Locations with a lower than average topsoil water content tended to store less of the input water, indicating locally enhanced preferential flow. In contrast, in the subsoil, locations with above average water content stored less water than their drier counterparts. In addition, macroporosity also modified how much water was retained in soil storage.

Overall, throughfall patterns influenced soil water content much less than soil water dynamics shortly after rainfall events. Furthermore, drainage reduced the soil moisture variation within hours to days, when returning from the wetted to the dry state. Therefore, we conclude that percolation rather than the soil water content is affected by small-scale spatial heterogeneity in canopy input patterns.

Reference

Fischer-Bedtke, C., Metzger, J. C., Demir, G., Wutzler, T., and Hildebrandt, A.: Throughfall spatial patterns translate into spatial patterns of soil moisture dynamics – empirical evidence, Hydrol. Earth Syst. Sci., 27, 2899–2918, https://doi.org/10.5194/hess-27-2899-2023, 2023.

How to cite: Hildebrandt, A., Christine, F.-B., Johanna Clara, M., Gökben, D., and Thomas, W.: Are spatial patterns of soil moisture or percolation affected by throughfall heterogeneity? Empirical evidence from a beech-dominated forest., EGU General Assembly 2024, Vienna, Austria, 14–19 Apr 2024, EGU24-11093, https://doi.org/10.5194/egusphere-egu24-11093, 2024.

EGU24-11540 | Posters on site | HS2.1.11

Climate change drives hydrological decoupling of a central European beech forest 

Daniela Sauer, Simon Drollinger, Michael Dietze, Dominik Seidel, Daniel Schwindt, and Jago Birk

Climate change models suggest increasing rain variability for Europe in the next decades, with hypothesised cascading effects on ecosystems. We evaluate decadal-scale data of a measuring plot in a beech forest in central Germany to test these model-based suggestions and potential implications by empirical evidence.

Based on 15 min resolution metrics of precipitation and subsequent water pathways towards and within the soil, we show medium-term trends in rainfall characteristics and their modulation by biota.

Rain event durations and rain amounts per event tended to decrease over the observation period, while rain intensity increased, accommodating the effect of the two former parameters on annual precipitation. This change in precipitation patterns, together with canopy structure caused a systematic decrease in throughfall ratios and an exponentially enhanced throughfall variability.

Our results suggest that changing rainfall and throughfall patterns will progressively decouple hydrological links in one of Europe’s most extensive ecosystem types. Based on the observed trends, we discuss effects of changing vegetation-modulated rain-input on ecosystem functioning and soil-hydrological trajectories to be anticipated in the near to mid-term future.

How to cite: Sauer, D., Drollinger, S., Dietze, M., Seidel, D., Schwindt, D., and Birk, J.: Climate change drives hydrological decoupling of a central European beech forest, EGU General Assembly 2024, Vienna, Austria, 14–19 Apr 2024, EGU24-11540, https://doi.org/10.5194/egusphere-egu24-11540, 2024.

EGU24-11844 | Orals | HS2.1.11

Time-lapse photography – a tool for unravelling the intricate complexity of eco-hydrologic processes 

Laurent Pfister, Bonanno Enrico, Fabiani Ginevra, Gourdol Laurent, Hissler Christophe, Huck Viola, Iffly Jean François, Keim Richard, Martínez-Carreras Núria, Mestdagh Xavier, Montemagno Alessandro, Penna Daniele, Schymanski Stan, and Zehe Erwin

For decades, field data collection has been largely in decline in favour of environmental modelling – the latter being considered less labour and cost-intensive. However, this trend goes against the grain with new observational field data having repeatedly been the source of breakthroughs in science (e.g., high-frequency measurements in stream water, in-situ monitoring of the isotopic composition of tree xylem water, imaging of infiltration pathways with electrical resistivity tomography, or time-lapse mapping of surface-saturation dynamics with thermal infrared imagery). Hypotheses generated from this type of novel, integrative, observations offer the potential to free hydrological concepts from the restrictions of typical datasets.

However, recent technological developments in field instrumentation have also revealed an increasingly complex landscape heterogeneity. General organizing principles have been proposed to explain river basin complexity. Deciphering this heterogeneity remains very challenging – essentially because eco-hydrologic processes occur over a wide range of spatial and temporal scales and vary by multiple orders of magnitude. The dilemma here is that we could continue instrumenting our catchments to the point of littering, and still miss out on processes or features that we were simply not looking for.

Here, we demonstrate the potential for time-lapse photography to unravel the complex organisation of eco-hydrologic processes at various temporal and spatial scales. This technique (also called undercranking) consists of taking regular frames with a camera and subsequently speeding up the action during playback. We installed a wildlife monitoring camera (RECONYX Hyperfire 2 Professional White Flash Camera) in the forested Weierbach experimental catchment (WEC) – an interdisciplinary Critical Zone observatory dedicated to the long-term study of hydrological, hydro-geochemical, and eco-hydrological processes. The rainfall-runoff response of the WEC is characterized by a strong seasonality, with pronounced summer low flows and winter high flows (resulting from a complex interplay of multiple eco-hydrological processes). The full time-lapse video of a hillslope-riparian zone-stream transect in the Weierbach catchment spans from December 2020 to July 2022 and is available online via https://youtu.be/74S7DfT7Uhs.

The high-speed playback of pictures recorded between December 2020 and July 2022, combined with in-situ eco-hydrological measurements reveals a comprehensive view of contrasted seasons with gradually changing processes. In winter, snowfall events trigger a slow but gradual snow-fed groundwater recharge (recorded by soil moisture probes and groundwater wells). Balmy weather in spring announces the onset of leaf-out and a recession in groundwater levels and hydrographs. In summer, vegetation is highly dynamic and growing, while groundwater levels and discharge evolve between high and low levels along successive dry and wet sequences. With cooler autumn temperatures and wet weather, leaf senescence starts, and the groundwater system switches back to a rain-fed recharge state.

The combination of a four-season-long time-lapse sequence of the pulse of the Weierbach with a high-frequency, multi-parameter dataset is offering an innovative opportunity for combining ‘soft’ and ‘hard’ data across multiple scales and eventually improving the dialogue between experimentalists and modelers. Such an alternative source of information may eventually become the starting point for a new cycle of hypothesis framing and testing.

Further information on this study is available at https://doi.org/10.1002/hyp.15026.

How to cite: Pfister, L., Enrico, B., Ginevra, F., Laurent, G., Christophe, H., Viola, H., Jean François, I., Richard, K., Núria, M.-C., Xavier, M., Alessandro, M., Daniele, P., Stan, S., and Erwin, Z.: Time-lapse photography – a tool for unravelling the intricate complexity of eco-hydrologic processes, EGU General Assembly 2024, Vienna, Austria, 14–19 Apr 2024, EGU24-11844, https://doi.org/10.5194/egusphere-egu24-11844, 2024.

Plant canopies divert a portion of precipitation to the base of their stems through “stemflow”, a phenomenon that influences the canopy water balance, soil microbial ecology, and intrasystem nutrient cycling. However, a comprehensive integration of stemflow into theoretical and numerical models in natural science remains limited. This perspective examines three unresolved, fundamental questions hindering this integration, spanning the canopy to the soil. First, the precise source area within the canopy that generates stemflow is undefined. Thus, we asked, “whence stemflow?” Current common assumptions equate it to the entire tree canopy, a potentially misleading simplification that could affect our interpretation of stemflow variability. Second, we asked what are the various conditions contributing to stemflow generation—beyond rain, to dew and intercepted ice melt—and could the exclusion of these volumes consequently obscure an understanding of the broader implications of stemflow? Third, we explored ”whither stemflow?” This question extends beyond how much stemflow infiltrates where, into what uptakes it and from where. Addressing these questions is constrained by current observational and analytical methods. Nevertheless, by confronting these challenges, the stemflow research community stands to make significant strides in comprehending this unique hydrological component and situating it within the broader context of natural science.

How to cite: Van Stan, J. and Pinos, J.: Three Fundamental Challenges to the Advancement of Stemflow Research and Its Integration into Natural Science, EGU General Assembly 2024, Vienna, Austria, 14–19 Apr 2024, EGU24-12393, https://doi.org/10.5194/egusphere-egu24-12393, 2024.

EGU24-12425 | ECS | Posters on site | HS2.1.11

Importance of vegetation structure for predicting evapotranspiration in a tropical mosaic landscape 

Raunak Kirti, Alejandra Valdés-Uribe, and Dirk Hölscher

Evapotranspiration (ET) is a critical process within the hydrological cycle, susceptible to shifts due to changes in land use. In tropical forest regions, widespread transformations often result in mosaic patterns of land-use types. Our goal was to explore the importance of vegetation structure, topography, meteorology and soil for the spatial variability of ET in a tropical mosaic landscape. We used a random forest machine learning technique for spatial data, employing forward feature selection and cross-validation to prevent overfitting. Our study region is situated in north-eastern Madagascar and is mainly composed of forest fragments, vanilla agroforests, rice fields and fallow land of shifting cultivation. We used a combination of open-source data products derived from various satellite experiments. Daily ET data were retrieved from the ECOsystem Spaceborne Thermal Radiometer Experiment on Space Station (ECOSTRESS). Forest structure predictors from GEDI and PROBA-V, meteorological data from ERA5, topography from JAXA and soil data from ISRIC were obtained. The variables included in the L3 algorithm to calculate ECOSTRESS ET daily data were not included in the study to prevent bias in the models. The models achieved high accuracy for the spatial prediction of ET (R2) of 0.76 and 0.82 for different days. Besides other biophysical variables, leaf area index, tree cover and tree height were important variables in predicting ET. Our findings thereby underscore the crucial role of forest structure on ET even in complex structured tropical mosaic landscapes.

How to cite: Kirti, R., Valdés-Uribe, A., and Hölscher, D.: Importance of vegetation structure for predicting evapotranspiration in a tropical mosaic landscape, EGU General Assembly 2024, Vienna, Austria, 14–19 Apr 2024, EGU24-12425, https://doi.org/10.5194/egusphere-egu24-12425, 2024.

EGU24-15823 | Orals | HS2.1.11

Diurnal Vegetation Moisture Dynamics and Water Stress: Insights from GNSS Reflectometry-Derived Vegetation Water Content 

Milad Asgarimehr, Jens Wickert, Adriano Camps, and Dara Entekhabi

The dynamics of Vegetation Water Content (VWC) throughout the day reflect how plants cope with water stress, trying to replenish lost water during daylight hours. Traditional radar sensors have shown sensitivity to diurnal vegetation moisture fluctuations but struggle due to their limited sampling rates, making it difficult to monitor daily patterns effectively. Innovations like Global Navigation Satellite Systems Reflectometry (GNSS-R) present a promising solution to overcome these limitations.

In this study, we leverage GNSS-R measurements from the NASA Cyclone (CYGNSS) mission, launched in late 2016, to study diurnal VWC cycles in Amazon's evergreen forests. CYGNSS offers high sampling rates and increased sensitivity to VWC, penetrating vegetation layers effectively with longer L-band wavelengths. The eight satellites of CYGNSS provide frequent measurements in tropical regions across different times of the day.

Our results uncover distinct differences between morning and evening VWCs over Amazon. We have observed a strong correlation (R = 0.75) between VWC and Vapor Pressure Deficit (VPD) throughout 2019, indicating VPD as a crucial factor influencing water stress. The diurnal VWC cycles in the Amazonian peatland demonstrate disruptions during arid periods and emphasize the significant role of VPD in governing vegetation diurnal moisture dynamics.

Our findings bridge the information gap on water stress in vegetation, showing the potential of VWC derived from advanced remote sensing technologies. It complements in-situ data on water potential gradients, offering valuable insights into vegetation water status in these critical ecosystems.

How to cite: Asgarimehr, M., Wickert, J., Camps, A., and Entekhabi, D.: Diurnal Vegetation Moisture Dynamics and Water Stress: Insights from GNSS Reflectometry-Derived Vegetation Water Content, EGU General Assembly 2024, Vienna, Austria, 14–19 Apr 2024, EGU24-15823, https://doi.org/10.5194/egusphere-egu24-15823, 2024.

EGU24-16271 | ECS | Posters on site | HS2.1.11

Modeling the effects of forest stand characteristics on the water dynamics of mountain forests 

Franciele de Bastos and Hubert Hasenauer

Mountain forests are essential for reducing runoff, sediment transport, and risk of natural hazards. In this analysis we address the protection function of mountain forests by assessing the interactions among the forest structure and the water dynamics. We are specifically interested in the forest's ability to reduce the outflow during a 10-day rainfall period according to the leaf area index (LAI) of the forested areas. The study was conducted using 31 Norway spruce (Picea abies) forest stands covering a wide range of LAI located in the Rindbach watershed in Austria. The elevation ranges from 446 m to 1379 m, and the predominant soil type is the Orthic Rendzina. From 1960 to 2022, the mean average annual precipitation was 1498 mm, and the mean average annual temperature was 6.6 °C. We use the biogeochemical ecosystem model Biome-BGC with its parameter settings for European tree species to simulate the daily carbon, nitrogen, water, and energy flux dynamics and assess the relative proportion of the daily water balance parameters during the 10-day rain period grouped according to the leaf area index (LAI). Our results for the 10-day rain period with a total accumulation of 135.3 mm (about 9.7 % of the annual rainfall in the area) suggest: (i) Norway spruce forest areas with an LAI < than 1 m²/m², outflow was evident on the first day of rainfall while Norway spruce forests with an LAI ≥ 7 m2/m-2 exhibited the first outflow on the ninth day of rainfall. (ii) This resulted in a 4 to 5 times lower outflow compared to forest stands with an LAI < 1m²/m² (e.g. 51.3 versus 11.1 mm, within 10 days). This emphasizes the importance of forest vegetation coverage in reducing runoff, avoiding flooding, mudslides, and sediment transport, and improving the protection function of mountain forests.

How to cite: de Bastos, F. and Hasenauer, H.: Modeling the effects of forest stand characteristics on the water dynamics of mountain forests, EGU General Assembly 2024, Vienna, Austria, 14–19 Apr 2024, EGU24-16271, https://doi.org/10.5194/egusphere-egu24-16271, 2024.

EGU24-18190 | ECS | Posters on site | HS2.1.11

Wintertime Tree Surface Temperature Dynamics in Boreal and Sub-Alpine Forests Revealed by Thermal Infrared Imaging 

Vincent Haagmans, Giulia Mazzotti, Clare Webster, and Tobias Jonas

Canopy surface temperature is a critical state variable of land surface models. During winter, it plays a key role in modulating energy fluxes between atmosphere, canopy air space, and sub-canopy snowpack. Understanding these surface temperature dynamics spatially and temporally is becoming increasingly important as recent hyper resolution models are now capable of resolving snow-forest interactions at the scale of individual trees and within concrete canopy structure.

Here, we present a novel dataset and analyze spatio-temporal wintertime canopy surface temperaturedynamics derived from ground-based thermal infrared (ThIR) images. Panoramic ThIR images were captured in forest gaps and dense stands at up to hourly intervals throughout diurnal cycles in boreal and sub-alpine forests. Postprocessing enabled documentation of absolute vertical and azimuthal tree surface temperature distributions within the forest under varying meteorological conditions. Our observations revealed the spatiotemporal dynamics of canopy temperatures offsets relative to ambient air temperatures. Positive offsets mainly followed direct insolation patterns within the 3-dimensional canopy structure in case of clear sky conditions. Insolated stems in forest gaps were observed to be up to 20 degrees above the surrounding canopy, while at the same time shaded stems could be up to 3 degrees colder than the canopy. Moreover, combining ThIR observations with RGB imagery further demonstrated evidence of insolation driven unloading of snow intercepted by the canopy, providing valuable data for further development of hyper resolution forest snow models.

How to cite: Haagmans, V., Mazzotti, G., Webster, C., and Jonas, T.: Wintertime Tree Surface Temperature Dynamics in Boreal and Sub-Alpine Forests Revealed by Thermal Infrared Imaging, EGU General Assembly 2024, Vienna, Austria, 14–19 Apr 2024, EGU24-18190, https://doi.org/10.5194/egusphere-egu24-18190, 2024.

Potential climate change impacts on water resources have been extensively assessed in Norway due to substantial changes in climate in the recent decades. However, the combined and isolated effects of forest and forest management have been rarely considered in the climate impact studies in Norway although about 38% of the land area is covered by forest. This study aims to improve hydrological impact projections in forest dominant catchments by considering the effects of forest growth and management and to attribute hydrological changes to climate and forest changes. The eco-hydrological model SWIM (Soil and Water Integrated Model) was applied to simulate hydrological processes and extremes for two micro-scale, two meso-scale and two macro-scale catchments, accounting for the effects of spatial scale. The climate projections were generated by three EURO-CORDEX (Coordinated Downscaling Experiment for the European domain) regional climate models (RCMs) for two RCPs (Representative Concentration Pathways, RCP2.6 and RCP4.5) and were bias corrected using the quantile-mapping method. Forest development over time was simulated as a function of climate determining growth and SSP-dependent harvest levels determining wood outtake. The simulations were initialized with the forest status of the year 2020 and different forest types are distinguished according to structural characteristics represented by three key parameters: leaf area index, mean tree height and surface albedo. Preliminary simulation results show that there are minor changes (within ±5%) in hydrological processes under the combinations of the climate and forest scenarios for these catchments. Climate change is the major driver of hydrological change at the catchment scale whereas forest development mainly influences the spatial distribution of the hydrological fluxes. The results further indicate that forest growth under a warming climate helps to reduce the risk of the floods and drought slightly by reducing surface runoff in wet periods and increasing base flow in dry periods, respectively.

How to cite: Huang, S., Eisner, S., Wong, W. K., and Cattaneo, N.: The potential impacts of climate change and forest management on water resources for micro-, meso- and macro-scale catchments in cold regions, EGU General Assembly 2024, Vienna, Austria, 14–19 Apr 2024, EGU24-18681, https://doi.org/10.5194/egusphere-egu24-18681, 2024.

Sardinia island is a reference for ecohydrological studies on past and future climate change effects, representing typical conditions of the western Mediterranean Sea basin. Ecosystems are heterogenous, and trees optimize the use of water through the root systems, uptaking water from the deep layers.

Two micrometeorological towers have been installed in two different sites under different precipitation conditions. The first is installed in Orroli (annual precipitation of about 600 mm), a case study of the ALTOS European project, which is a patchy mixture of wild olive trees and C3 herbaceous that grow in a shallow under a rocky layer of basalt, partially fractured (soil depth 15 40 cm), with a tree cover percentage of 33% in the footprint. Instead, the second is in a mountainous forest site of Quercus ilex characterized by steeper slopes and rocky outcrops (mean annual precipitation of about 800 mm), and tree cover percentage of 68% in the footprint. In both sites land surface fluxes and CO2 fluxes are estimated using the eddy correlation technique, soil moisture was estimated with water content reflectometers, and periodically leaf area index (LAI) were estimated, while tree transpiration component is estimated using the sap flow sensors.

The following objectives are addressed:1) pointing out the dynamics of land surface fluxes, soil moisture and CO2 for two contrasting sites; 2) assess the impact of vegetation dynamics and type on the CO2 and water balance dynamics; 3) evaluate the soil effect on water and energy budgets.

The Orroli site is more controlled by rainfall seasonality, and vegetation species use the source of water stored in the deep rocky layer to sustain their physiological activity. In the Orroli site we found seasonal dynamics in the CO2 flux and in the evapotranspiration (ET) terms, which are higher when grass and woody vegetation species are present and lower when the grass component dies. Instead, we found a constant flux of ET in the Marganai highlighting the high efficiency of tree species in extract the deep sources of water. ET is higher in the Orroli site as long as the grass species are present in live form, and then LE is higher in the Marganai forest. The ET of Quercus ilex in the Marganai forest seems being not controlled by surface soil moisture, because the annual precipitation is enough for sustain the transpiration needs of that fraction of tree cover. The results confirm a threshold of 700 mm/year of rain, below which rain can restrict tree cover growth.

How to cite: Corona, R., Sirigu, S., Montaldo, N., and Katul, G. G.: On the Evapotranspiration estimates of two contrasting and Heterogenous Ecosystems in a Mediterranean region, Sardinia, under water limited conditions, EGU General Assembly 2024, Vienna, Austria, 14–19 Apr 2024, EGU24-19390, https://doi.org/10.5194/egusphere-egu24-19390, 2024.

EGU24-419 | ECS | Posters on site | HS2.1.12

Exploring the landscape heterogeneity and the hydrological diversity in three contrasted observatories of the French critical zone research infrastructure OZCAR 

Julien Ackerer, Sylvain Kuppel, Isabelle Braud, Sylvain Pasquet, Ophélie Fovet, Anne Probst, Marie Claire Pierret, Laurent Ruiz, Tiphaine Tallec, Nolwen Lesparre, Sylvain Weill, Christophe Flechard, Jean Luc Probst, Jean Marçais, Agnes Riviere, Florence Habets, Sandrine Anquetin, and Jerome Gaillardet

The French OZCAR critical zone network offers the opportunity to conduct multi-site studies and to explore the critical zone functioning under contrasted climate, geology, vegetation and land use. In this study, an integrated modeling of the water cycle is performed with the ecohydrological model EcH2O-iso in three long-term observatories: (1) the Naizin watershed characterized by an oceanic climate, a metamorphic bedrock and an intensive agriculture (north-west of France, AgrHyS observatory); (2) the Aurade watershed, a watershed with a warmer semi-continental oceanic climate, a sedimentary geological substratum and a crop cover with a wheat-sunflower rotation (south-west of France, Aurade observatory) and; (3) the Strengbach watershed characterized by a mountain climate, a granitic bedrock, and a beech-spruce forest cover (north-east of France, OHGE observatory).

Modeling robustness is evaluated by taking advantage of the large database for critical zone sciences including stream flow, water level in piezometers, and evapotranspiration fluxes measured from climatological stations and flux-towers located in the watersheds. Our comparative study brings these general outcomes: (1) the long term CZ evolution controlling the regolith thickness strongly impacts the total water storage in watersheds; (2) the Quaternary geomorphological evolution influences the current hydrological partitioning and the separation of hydrologically active and inactive water storage; (3) Both internal watershed characteristics and external forcings, such as current atmospheric forcing and recent land use need to be considered to infer stream persistence and to understand hydrological diversity; and (4) the observed hydrological diversity cannot be fully understood without considering a continuum of time scales in CZ evolution.


Overall, this work illustrates the strength of critical zone networks, allowing a new level of multi-site and comparative studies that are crossing several observatories and encompassing a wide diversity of geology and climate.


How to cite: Ackerer, J., Kuppel, S., Braud, I., Pasquet, S., Fovet, O., Probst, A., Pierret, M. C., Ruiz, L., Tallec, T., Lesparre, N., Weill, S., Flechard, C., Probst, J. L., Marçais, J., Riviere, A., Habets, F., Anquetin, S., and Gaillardet, J.: Exploring the landscape heterogeneity and the hydrological diversity in three contrasted observatories of the French critical zone research infrastructure OZCAR, EGU General Assembly 2024, Vienna, Austria, 14–19 Apr 2024, EGU24-419, https://doi.org/10.5194/egusphere-egu24-419, 2024.

EGU24-2143 | Posters on site | HS2.1.12

Time matters: photosynthetic vs. weathering-induced C drawdown and the role of dust inputs along a one-million-year soil weathering gradient on the Galápagos Islands 

Franz Zehetner, Martin H. Gerzabek, J. Gregory Shellnutt, Pei-Hao Chen, I Nyoman Candra, Kuo-Fang Huang, and Der-Chuen Lee

The Galápagos archipelago, a chain of islands formed by hotspot volcanism on the Nazca tectonic plate, exhibits a pronounced rock age gradient with distance from the volcanic hotspot from west to east. Here, we investigate chemical weathering along a soil chronosequence (1.5 to 1070 ka) under humid conditions. Our results show considerable loss of base cations already in the early to intermediate phases of weathering (e.g. 95% of Na and 78% of Mg lost from the topsoil after 26 ka) and almost complete loss from the entire profile in soils older than 800 ka. Depletion of Si was less pronounced, with topsoil losses of 24% and 63-68% after 26 ka and >800 ka, respectively. Total weathering flux and associated CO2 consumption rates estimated from profile-scale element losses in this study exceeded catchment-scale estimates reported for other volcanic islands or global averages during the early weathering phase, but were much lower in the intermediate and late phases. Nevertheless, total C drawdown was dominated by soil organic C sequestration (70-90% share) rather than inorganic, weathering-induced CO2 consumption during early pedogenesis (≤4.3 ka), and the relative importance switched in the intermediate and late phases (90-95% share of weathering-induced C drawdown at ≥166 ka). Dust deposition derived from a nearby ocean sediment core was <20% of total basalt mass loss at the young and intermediate-aged sites, but reached 40-60% at the older sites (>800 ka). Our results suggest that (1) young volcanic surfaces are very efficient (inorganic and organic) C sinks, (2) the development of thick soil covers at advanced pedogenic stages effectively shields the underlying rocks from further weathering, and (3) dust inputs become an increasingly important biogeochemical factor in such highly weathered environments.

How to cite: Zehetner, F., Gerzabek, M. H., Shellnutt, J. G., Chen, P.-H., Candra, I. N., Huang, K.-F., and Lee, D.-C.: Time matters: photosynthetic vs. weathering-induced C drawdown and the role of dust inputs along a one-million-year soil weathering gradient on the Galápagos Islands, EGU General Assembly 2024, Vienna, Austria, 14–19 Apr 2024, EGU24-2143, https://doi.org/10.5194/egusphere-egu24-2143, 2024.

EGU24-4999 | Posters on site | HS2.1.12 | Highlight

Lessons learned from 15 years of TERENO: the integrated TERrestrial ENvironmental Observatories in Germany 

Steffen Zacharias, Theresa Blume, Heye Bogena, Ralf Kiese, Erik Borg, Peter Dietrich, Susanne Liebner, Hans Peter Schmid, Martin Schrön, and Harry Vereecken

The need to develop and provide integrated observation systems to better understand and manage global and regional environmental change is one of the major challenges facing Earth system science today. In 2008, the German Helmholtz Association took up this challenge and launched the German research infrastructure TERrestrial ENvironmental Observatories (TERENO). The aim of TERENO is to establish and to maintain a network of observatories as a basis for an interdisciplinary and long-term research programme to investigate the effects of global environmental change on terrestrial ecosystems and their socio-economic consequences. State-of-the-art methods from the field of environmental monitoring, geophysics, and remote sensing are used to record and analyze states and fluxes in different environmental compartments from groundwater through the vadose zone, surface water, and biosphere, up to the lower atmosphere. To date, four observatories are part of the network, and over the past 15 years we have gained collective experience in running a long-term observing network, thereby overcoming unexpected operational and institutional challenges, exceeding expectations and facilitating new research. Today, the TERENO network is a key pillar for environmental modelling and prediction in Germany, an information hub for regional stakeholders, a nucleus for international collaboration, an important anchor for large-scale experiments, and a trigger for methodological innovation and technological progress. We will present the main lessons learned from this 15-year endeavour, and illustrate the need to continue long-term integrated environmental monitoring programmes in the future.

How to cite: Zacharias, S., Blume, T., Bogena, H., Kiese, R., Borg, E., Dietrich, P., Liebner, S., Schmid, H. P., Schrön, M., and Vereecken, H.: Lessons learned from 15 years of TERENO: the integrated TERrestrial ENvironmental Observatories in Germany, EGU General Assembly 2024, Vienna, Austria, 14–19 Apr 2024, EGU24-4999, https://doi.org/10.5194/egusphere-egu24-4999, 2024.

EGU24-7396 | Posters on site | HS2.1.12

Developing a coupled hydrological model for UK chalk catchments 

Mostaquimur Rahman, Ross Woods, Francesca Pianosi, Fai Fung, and Rafael Rosolem

Chalk forms one of the most important aquifers in the UK. Extending over large parts in the south-west, chalk aquifers account for more than half of the groundwater used for drinking in England and Wales. Groundwater held in these aquifers supports flows in chalk rivers. Hence, chalk aquifers play an important role in sustaining the riverine ecosystem. It is, therefore, important to assess and manage freshwater resources in these catchments. Here we develop and evaluate a distributed numerical model for simulating coupled subsurface and land surface hydrological processes including soil moisture variability, flow, and groundwater dynamics in chalk catchments. The parsimony and computational efficiency of this model make it possible to perform numerous simulations within a reasonable time. This allows for sensitivity analysis, calibration, and multiple scenario analysis that are useful in management decision making.

How to cite: Rahman, M., Woods, R., Pianosi, F., Fung, F., and Rosolem, R.: Developing a coupled hydrological model for UK chalk catchments, EGU General Assembly 2024, Vienna, Austria, 14–19 Apr 2024, EGU24-7396, https://doi.org/10.5194/egusphere-egu24-7396, 2024.

EGU24-9338 | ECS | Posters on site | HS2.1.12

The importance of in-situ soil moisture observations to evaluate the main drivers of event runoff characteristics in a small-scale catchment 

Adriane Hövel, Christine Stumpp, Heye Bogena, Andreas Lücke, and Michael Stockinger

A catchment’s runoff response to precipitation largely depends on the antecedent soil moisture in the catchment, but also on hydro-meteorological conditions in terms of, e.g., evapotranspiration. Studies investigating the effects of hydro-meteorological conditions on runoff event characteristics at the small catchment scale with daily temporal resolution mostly used surrogate measures for soil moisture, e.g., derived from hydrological models or using the antecedent precipitation index (API). Here, we applied a time-series based pattern search to 11 years of daily in-situ measured soil moisture in three depths (5, 20, 50 cm) at 33 locations in the Rollesbroich catchment (40 ha) in Germany to identify key variables influencing runoff event characteristics under similar wetness patterns. After identifying wetness patterns, we split the corresponding runoff responses into similar and dissimilar ones by means of goodness-of-fit criteria and analyzed their respective hydro-meteorological variables and event runoff coefficients (ERC), i.e., the proportion of rainfall that transforms into runoff during an event. Results showed that for similar soil moisture patterns, mean potential evapotranspiration, and antecedent soil moisture in all three depths had a smaller standard deviation for similar runoff responses than for dissimilar. This indicates a larger influence on the runoff response compared to rainfall-derived variables such as total event rainfall, maximum event rainfall intensity, or API. Furthermore, during runoff events under similar wetness conditions, the Spearman rank correlation coefficient (ρ) indicated a low average correlation between ERC and API (ρ=0.17). In terms of antecedent soil moisture conditions, the highest correlation between ERC and antecedent soil moisture was observed in the topsoil at 5 cm depth (ρ=0.43), while at 20 cm (ρ=0.16) and 50 cm (ρ=0.30) depths, the correlations were comparatively lower. Our study indicates that using the API as a substitute for antecedent wetness conditions may not be able to comprehensively reflect the relation between the runoff response and antecedent soil moisture conditions in the topsoil in the given catchment. Consequently, the results show that topsoil moisture measurements are more suitable than the surrogate API for assessing the impact of hydro-meteorological variables on daily runoff characteristics.

How to cite: Hövel, A., Stumpp, C., Bogena, H., Lücke, A., and Stockinger, M.: The importance of in-situ soil moisture observations to evaluate the main drivers of event runoff characteristics in a small-scale catchment, EGU General Assembly 2024, Vienna, Austria, 14–19 Apr 2024, EGU24-9338, https://doi.org/10.5194/egusphere-egu24-9338, 2024.

EGU24-9375 | ECS | Posters on site | HS2.1.12

Link between groundwater storage and landscape changes in mountainous areas: the Kahule Khola watershed (Nepal) 

Kapiolani Teagai, John Armitage, Léo Agélas, Christoff Andermann, and Niels Hovius

In many watersheds of various sizes, the role played by groundwater to sustain river flow is still misunderstood. This is the case in mountainous areas where geological features as fractures, altered or unaltered bedrocks and steep slopes notably play an important role for storing groundwater into the subsurface. The groundwater support to low flows was considered for a long time as a minor contribution, due to the steep slopes in those areas. But in Nepal, it is estimated that 2/3 of the volume of rivers comes from the exfiltration of groundwater through resurgences. Though several attempts were made with numerical modelling based on data monitoring and field surveys to quantify river-groundwater exchanged fluxes, some ambiguities remain. Especially regarding the impact of landscape change in a mountainous topography. The aim of this work is to characterize the subsurface infiltration, recharge, and storage mechanisms of a mountainous hydrogeological system in the Himalayas using field investigations and numerical modelling. In the Kahule Khola watershed (Nepal), a steep catchment of 33 km² whose altitudes range between 1000 and 3500 masl, various field experiments were made to identify groundwater pathways into the altered subsurface and to catch the river/groundwater interactions: seismic and electric surveys (ERT), infiltration tests, physical and isotopic measurements of springs/streams and the water tracking on the surface with loggers installed along gullies in the overall watershed. The region is submitted to intense rainfall as monsoon, intercalated by dry periods in which the river flow is still sustained. Moreover, by closing ancient fractures and opening new ones, earthquakes can deviate springs and change the surface water/groundwater pathways. This contributes to reshaping the landscape. However, the spatial and temporal contribution of groundwater to maintain a baseflow in the river is not quantified yet, in space and time. The ERT data from a time-lapse realized before and after monsoon show a deep alteration zone with a shallow humid layer of 10 m thick at least all year long under the slopes. Areas of low resistivity reveal infiltration zones and preferential flow paths. These areas are recharged in the wet season and drained in the dry season. At the surface, we estimate an average hydraulic conductivity at saturation of 3,5.10-5 m.s-1 in 150 cm depth which suggest an infiltration rate higher than the average rainfall rate (~3000 mm.year-1). In order to quantify the groundwater storage into the subsurface, a numerical groundwater model in 2D has been developed (Python) and is able to simulate and quantify the water storage dynamics of a spatial and temporal pre-defined domain. The data measured on the field will be used to define the initial conditions of future scenarios.

How to cite: Teagai, K., Armitage, J., Agélas, L., Andermann, C., and Hovius, N.: Link between groundwater storage and landscape changes in mountainous areas: the Kahule Khola watershed (Nepal), EGU General Assembly 2024, Vienna, Austria, 14–19 Apr 2024, EGU24-9375, https://doi.org/10.5194/egusphere-egu24-9375, 2024.

EGU24-13095 | Posters on site | HS2.1.12

Hydrological, biogeochemical, and ecological linkages at the land-sea margin: Insights from a coastal critical zone network 

Holly Michael, Dannielle Pratt, Yu-Ping Chin, Sergio Fagherazzi, Keryn Gedan, Matthew Kirwan, Angelia Seyfferth, Lee Slater, Stephanie Stotts, and Katherine Tully

Ghost forests and abandoned farms are stark indicators of ecological change along world coastlines, caused by sea level rise (SLR). These changes adversely affect terrestrial ecosystems and economies, but expanding coastal marshes resulting from SLR also provide crucial ecosystem services such as carbon sequestration and mediate material fluxes to the ocean. A US-NSF Critical Zone Network project was designed to understand the hydrological, ecological, geomorphological, and biogeochemical processes that are altering the functioning of the marsh-upland transition in the coastal critical zone. We have instrumented six sites in the mid-Atlantic region of the US, along the coastlines of the Atlantic Ocean, Delaware Bay, and Chesapeake Bay where marshes are rapidly encroaching into forests and farmland. Field observations, laboratory experiments, and modeling are revealing the drivers and impacts of coastal change, as well as feedbacks among competing processes that accelerate or reduce rates and magnitude of change. We discuss examples of processes and feedbacks and highlight the importance of interdisciplinary exploration and synthesis in advancing process understanding at the land-sea transition.

How to cite: Michael, H., Pratt, D., Chin, Y.-P., Fagherazzi, S., Gedan, K., Kirwan, M., Seyfferth, A., Slater, L., Stotts, S., and Tully, K.: Hydrological, biogeochemical, and ecological linkages at the land-sea margin: Insights from a coastal critical zone network, EGU General Assembly 2024, Vienna, Austria, 14–19 Apr 2024, EGU24-13095, https://doi.org/10.5194/egusphere-egu24-13095, 2024.

EGU24-13395 | Posters on site | HS2.1.12

Exploring Earth's Critical Zone Through the U.S. Critical Zone Collaborative Network 

Elizabeth W. Boyer, Bhavna Arora, Emma Aronson, Holly Barnard, Steven Holbrook, Jeffery S. Horsburgh, Lixin Jin, Praveen Kumar, Holly Michael, Jeff Munroe, Julia Perdrial, Claire Welty, and Jordan Read

The Critical Zone Collaborative Network (CZ Net) is a national research initiative in the United States supporting investigations of the Earth's critical zone (CZ) -- the vital near-surface environment extending from the top of the vegetation canopy to the weathered bedrock beneath. CZ Net fosters collaboration, data sharing, and interdisciplinary research to understand complex landscapes. The network comprises nine thematic clusters covering diverse geological, climatic, and land use settings. The thematic clusters explore many areas, including bedrock geology's effects on landscapes and ecosystems, ecosystem responses to climate and land-use disturbances, processes occurring between land and sea affected by sea-level rise, land-water interactions in agricultural regions, water and carbon cycles in arid regions, the impact of mineral dust transported in the atmosphere on ecosystems, water storage's influence on landscape and ecosystem processes, relationships between landscapes and microbial communities, and ecosystem processes in cities. A coordinating hub provides cross-cluster support. In the presentation, we introduce CZ Net and the focal research areas of each thematic cluster. We consider synthesis work addressing environmental challenges faced by the CZ, which is under increasing pressure to meet societal needs while safeguarding the environment for future generations. Further, we discuss opportunities for engagement with the network, reflecting CZ Net's dedication to advancing knowledge and addressing critical environmental issues through collaborative efforts. International coordination through developing a network of networks can foster collaborative research that transcends national boundaries, allowing scientists to combine expertise, data, and resources for a deeper understanding of CZ processes. Such collaboration is imperative for addressing pressing global environmental challenges.

How to cite: Boyer, E. W., Arora, B., Aronson, E., Barnard, H., Holbrook, S., Horsburgh, J. S., Jin, L., Kumar, P., Michael, H., Munroe, J., Perdrial, J., Welty, C., and Read, J.: Exploring Earth's Critical Zone Through the U.S. Critical Zone Collaborative Network, EGU General Assembly 2024, Vienna, Austria, 14–19 Apr 2024, EGU24-13395, https://doi.org/10.5194/egusphere-egu24-13395, 2024.

EGU24-15452 | ECS | Posters on site | HS2.1.12

Exploring fluvial morphodynamics through scales  

Boris Gailleton, Philippe Steer, Philippe Davy, and Wolfgang Schwanghart

Surface processes control mass transfer efficiency on Earth, responding to tectonic and climatic forcings. These forcings impact landscape dynamics across a wide range of temporal scales, from individual events (e.g., storms) to geological time spans (e.g., Cenozoic climate cooling). Bridging these temporal scales poses a significant challenge for Landscape Evolution Models (LEMs). While LEMs are conventionally employed to study the effects of climate or tectonics on landscape dynamics over geological time, numerical methods simulating short-term processes such as landslides, floods, erosion, and sediment transport struggle to be projected beyond a few hundred years. 

In this contribution, we address this challenge by leveraging a recent model development—graphflood—that enables the computation of hydro-stationary water surfaces and discharge using a simplified shallow water approximation. This new model shows an order-of-magnitude improvement in speed over its predecessors, achieved through the efficiency of algorithms applied to directed acyclic graphs. Through testing induced subgraph dynamic traversals for initial calculations of a stationary state and employing GPU techniques to maintain the state to slower erosion and deposition processes, we demonstrate the potential for an additional order-of-magnitude reduction in computation time for fluvial dynamics. We also investigate how the computation of landslide runout using a shallow water approximation with a friction coefficient modified to account for velocity-weakening can be introduced within the same numerical framework. 

First, we explore various sets of fluvial erosion and deposition laws (e.g., stream power, Meyer Peter Muller) to determine the minimal representation needed for fluvial morphodynamics and projecting them across scales at the lowest computational cost. We then perturb the system with landslides processes and observe the controls on its resilience to external forcings. Lateral dynamics (e.g., lateral erosion, deposition, interaction with valley walls) and the model's ability to capture different river states (e.g., high flow vs low flow, flood) emerge as crucial elements in understanding the complexity of river responses to climato-tectonic perturbations. 

How to cite: Gailleton, B., Steer, P., Davy, P., and Schwanghart, W.: Exploring fluvial morphodynamics through scales , EGU General Assembly 2024, Vienna, Austria, 14–19 Apr 2024, EGU24-15452, https://doi.org/10.5194/egusphere-egu24-15452, 2024.

EGU24-15453 | Posters on site | HS2.1.12

High Mountain Plateau Margin Critical Zone Observatory, Kaligandaki River Nepal 

Christoff Andermann, Kristen Cook, Basanta Raj Adhikari, Niels Hovius, and Rajaram Prajapati

Mountains are hotspots for earth surface processes, with very fast erosion rates, mass movements, catastrophic flooding and enhanced geochemical weathering rates. These landscapes respond quickly to external forcing by tectonics and/or climate. As a consequence, the hazard potential in mountains is very high, and mountains produce a wide range of large catastrophes which often have wide-reaching impacts on infrastructure and human lives. Furthermore, mountains can be considered as the water towers of the world, as they are very effective at harvesting water from the atmosphere, storing it, and redistributing it to the adjacent lowlands. The key role of mountain regions can be extended endlessly to other disciplines such as ecology, climatology, social sciences and so forth. Yet, despite their importance, high mountains remain inaccessible and notoriously understudied. High elevation terrains are only lightly covered by monitoring systems, with elevations >2500 m asl. widely underrepresented in global monitoring networks (Shahgedanova et al., 2021). The Himalayan mountains are particularly poorly covered by coordinated monitoring observatories.

In this contribution we present the set up and overview results of the ~last 10 years of integrated critical zone monitoring in the Kaligandaki Catchment in the central Himalayas in Nepal.

Motivated by fundamental research questions on coupled surface process and the high mountain water cycle in the Himalayan mountain range, we began observation in the Kaligandaki Catchment with two major stations for climatological and hydrological monitoring that have operated continuously over the past 10 years. At each location trained personal conducted manual river water sampling for river water geochemistry and suspended sediment monitoring as well as water discharge and bulk meteorological parameters. These observations were complemented by targeted short-term deployments and field sampling campaigns to cover the full spatial extent as well as the seasonal variability. Research question range from organic carbon export, climate and erosion feedback as well as water pathways in high mountains to large mass-movements and intramountain sediment storage and feedbacks with landscape evolution.

Our findings from the past 10 years of monitoring motivate the development of a more substantial observatory in the Kaligandaki catchment, which is particularly suited as a critical zone observatory in the Himalayas. The Kaligandaki is a trans-Himalayan river that connects the Tibetan Plateau through the Himalaya to the low elevation foreland. The river crosses distinct climatological, ecological, tectonic, and geomorphic zones, including the arid high elevation plateau, the rapidly uplifting high Himalaya and monsoon precipitation maxima, and the middle hills. The river corridor is highly prone to flood and landslide hazards, and is experience increasing development and human impact, particularly road construction and hydropower. In addition, the river basin is highly sensitive to changing precipitation patterns, which have brought anomalous rainfall and flooding in recent years, and to changing melting patterns, which affect water resources. Together with local partners and the international research community we are proposing this unique catchment as potential integrated mountain critical zone observatory in order to close the monitoring gap in the highest mountain range on Earth.

Literature:

Shahgedanova, M., et al. 2021, https://doi.org/10.1659/MRD-JOURNAL-D-20-00054.1

How to cite: Andermann, C., Cook, K., Adhikari, B. R., Hovius, N., and Prajapati, R.: High Mountain Plateau Margin Critical Zone Observatory, Kaligandaki River Nepal, EGU General Assembly 2024, Vienna, Austria, 14–19 Apr 2024, EGU24-15453, https://doi.org/10.5194/egusphere-egu24-15453, 2024.

EGU24-15523 | Posters on site | HS2.1.12

The impact of groundwater dynamics on landsliding and hillslope morphology: insights from typhoon Morakot and landscape evolution modelling 

Philippe Steer, Lucas Pelascini, Laurent Longuevergne, and Min-Hui Lo

Landslides represent a pervasive natural hazard, exerting a significant influence on hillslope morphology in steep regions. Intense rainfall events are well-established as primary triggers for landslides, particularly those characterized by high rainfall intensity, intermediate to long durations, and substantial cumulative precipitation during and before the event. While the evolving roles of soil saturation and mechanical properties are well-identified in shallow landslide occurrences, the influence of groundwater dynamics on the triggering of deep-seated or bedrock landslides remains less understood. Despite this knowledge gap, deep-seated landslides play a dominant role in the volume budget of landslide catalogs and serve as the primary geomorphological process shaping hillslope evolution in steep regions. In this study, we explore the impact of groundwater dynamics on landslide triggering. Our investigation focuses initially on landslides triggered during Typhoon Morakot, examining their relationship with water table fluctuations derived from the HydroModPy 3D hydrogeological model, forced by water recharge data obtained from the Community Land Model CLM 4.0. Analyzing several contrasting catchments, we demonstrate a strong correlation between the locations and depth of deep-seated landslides and the instability predicted by a simple landslide model that integrates pore pressure and water table depth. Notably, these predictions are valid within specific ranges of hydrogeological (i.e., aquifer thickness, porosity, and conductivity) and mechanical (i.e., cohesion and friction angle) parameters, providing valuable insights into the hydrogeological and mechanical properties of the studied catchments. In an exploratory study, we then shift our focus to the longer-term geomorphological impact of rainfall-triggered landslides on hillslope evolution and morphology. Using a coupled 2D model of water table evolution and landsliding, we investigate topographic changes at the hillslope scale, under different scenarios. Our investigation considers the influence of seasonal recharge, intense rainfall events, and hillslope hydrological convergence or divergence perpendicular to the hillslope orientation on resulting hillslope morphology and dynamics. Overall, our results particularly highlight the role of groundwater dynamics on hillslope finite shape.

How to cite: Steer, P., Pelascini, L., Longuevergne, L., and Lo, M.-H.: The impact of groundwater dynamics on landsliding and hillslope morphology: insights from typhoon Morakot and landscape evolution modelling, EGU General Assembly 2024, Vienna, Austria, 14–19 Apr 2024, EGU24-15523, https://doi.org/10.5194/egusphere-egu24-15523, 2024.

EGU24-17282 | ECS | Posters on site | HS2.1.12

Assessing the impact of stress–dependent hydraulic properties on hillslope-scale groundwater flow and transport 

Ronny Figueroa, Clément Roques, Ronan Abherve, Landon Halloran, and Benoit Valley

The occurrence of springs and their connectivity within stream networks is typically associated with three key controlling factors: climate, topography and the distribution of hydraulic properties. In crystalline media, this distribution is often related to lithology and the presence of fractures. In addition, tectonic and topographic stresses can modify properties through compressive and extensional forces acting on the rock mass and fractures. However, these controls are rarely considered for hillslope scale applications. The aim of this research is to investigate the effects of stress on bedrock hydraulic properties and their implications for groundwater flow and transport at the hillslope scale. A numerical experiment has been designed that combines linear poroelasticity to simulate the distribution of permeability and porosity, together with groundwater flow and transport simulations. Different slope and stress conditions are examined, providing a comprehensive sensitivity analysis framework.

Our results show that vertical stress leads to a decrease in permeability and porosity at depth, following an exponential-like trend. Increasing the proportion of lateral stresses relative to the total vertical stresses reduces the mean permeability and porosity and increases the variance in the distribution along the hillslope. For high values of lateral stress, a low permeability domain develops downslope at the valley bottom due to the accumulation of compressive stresses, while the extensive regime at the crest provides higher permeabilities. As expected, groundwater flow simulations revealed that the partitioning of flow paths is strongly influenced by such heterogeneous stress-induced permeability and porosity fields. As stress increases, groundwater flow becomes more channelized in the near subsurface, strongly deviating from the classical Dupuit model. We also found that the distribution of normalized groundwater discharge rates shows higher values in the upper part of the seepage zone than in the lower part. By analyzing the results of particle tracking simulations, we found that mean residence times increase with higher external stress due to a decrease in mean permeability. In addition, the shape of the residence time distribution is strongly modified by the channeling of groundwater flow with increasing lateral stress, with the probability of shorter residence times increasing as stress increases. We discuss the implications of these fundamental results for our understanding of the role of stress in groundwater-dependent systems, with important insights into the recharge, storage and discharge mechanisms that may control the resilience of landscapes to the effects of climate change.

How to cite: Figueroa, R., Roques, C., Abherve, R., Halloran, L., and Valley, B.: Assessing the impact of stress–dependent hydraulic properties on hillslope-scale groundwater flow and transport, EGU General Assembly 2024, Vienna, Austria, 14–19 Apr 2024, EGU24-17282, https://doi.org/10.5194/egusphere-egu24-17282, 2024.

EGU24-17490 | Posters on site | HS2.1.12 | Highlight

Hydroclimatic versus geochemical controls on silicate weathering rates 

Sylvain Kuppel, Yves Goddéris, Jean Riotte, and Laurent Ruiz

Water is the first order controlling factor of the weathering reactions. In the recent years, efforts have been made towards the building of model cascades able to simulate the water fluxes and the residence time of the water in the various compartments of the critical zone. Those hydrological constrains are then injected into numerical models simulating the water-rock interactions from the surface down to the impervious bedrock. In this contribution, we describe such a model cascade, where the water-rock interaction model WITCH is fed by the process-based ecohydrological model EcH2O-iso. This model cascade, WITCH2O, is designed for the modeling of water fluxes & stores, as well as the weathering reactions and transport of weathering products (including atmospheric CO2 consumption), from the vertical profile to the catchment scale, and from the submonthly to decadal time scales. We deployed WITCH2O along a gneiss-saprolite-ferralsol profile in a small tropical forested catchment in peninsular India. Long-term observations of water and geochemical fluxes are available, allowing for a 2-step model calibration and evaluation (hydrological and geochemical) across the different processes simulated. Using various temporal averages of simulated water fluxes and stores, preliminary results highlight that seasonal hydrological variability (driven by monsoon dynamics and deep root water uptake) is key for capturing groundwater nutrient concentrations, despite highly-buffered water table variations. We also explore how this non-linear dependence of weathering fluxes upon hydrological states is modulated by the propagation of uncertainties regarding i) modeled hydrology and ii) uncertainties in geohydrochemical properties (e.g. reactive surface and mineral abundance).

How to cite: Kuppel, S., Goddéris, Y., Riotte, J., and Ruiz, L.: Hydroclimatic versus geochemical controls on silicate weathering rates, EGU General Assembly 2024, Vienna, Austria, 14–19 Apr 2024, EGU24-17490, https://doi.org/10.5194/egusphere-egu24-17490, 2024.

EGU24-20178 | Posters on site | HS2.1.12

Coevolution in the critical zone: the key role of fast hydrologic processes 

Patricia Saco, Juan Quijano Baron, Jose Rodriguez, Mariano Moreno de las Heras, and Samira Azadi

Feedback effects between hydrology, vegetation and erosion processes are pervasive across landscapes. These tight interactions lead to the coevolution of landscape patterns that modulate landform shape and regulate many other critical zone processes. We study these feedbacks and interactions using simulations from landform evolution models that account for the effect (and feedbacks) of spatially and temporally varying hydrologic pathways and vegetation over landscapes displaying a variety of vegetation patterns. 

We first present results from a landscape evolution modelling framework, that accounts for a comprehensive representation of hydrology and vegetation, including the effect of various vegetation pools on erosion processes. The model includes interacting modules for hydrology, dynamic vegetation, biomass pools partition, and landform evolution. Our simulations indicate that each of the biomass pools provides a specific erosion protection mechanism at a different time of the year. As rainfall events and the resulting vegetation growth and protection are asynchronous, the maximum values of erosion are associated with runoff at the beginning of the rainy season when vegetation protection is not as its maximum. These results show how rapid hydrological processes affecting vegetation have long term implications for landform development. Results for a Eucalyptus savanna landscape study site in the Northern Territory (Australia) showed that models that do not account for the vegetation dynamics can result in prediction errors of up to 80%.  

We also present simulations of the coevolution of landforms and vegetation patterns in selected sites with patchy Acacia Aneura (Mulga) vegetation.  These sites display a sparse vegetation cover and strong patterns of surface water redistribution, with runoff sources located in the bare areas and sinks in the vegetation patches. This effect triggers high spatial variability of erosion/deposition rates that affects the evolving topography and induces feedbacks that shape the dynamic vegetation patterns. We run simulations using rainfall, vegetation and erosion data, and vegetation parameters previously calibrated for Mulga sites in the Northern territory. We further investigate the effect of alterations in hydrologic connectivity induced by climate change and/or anthropogenic activities, which affect water and sediment redistribution and can be linked to loss of resources leading to degradation. We find that an increase in hydrologic connectivity can trigger changes in vegetation patterns inducing feedbacks with landforms leading to degraded states. These transitions display non-linear behaviour and, in some cases, can lead to thresholds with an abrupt reduction in productivity. Critical implications for management and restoration are discussed.  

How to cite: Saco, P., Quijano Baron, J., Rodriguez, J., Moreno de las Heras, M., and Azadi, S.: Coevolution in the critical zone: the key role of fast hydrologic processes, EGU General Assembly 2024, Vienna, Austria, 14–19 Apr 2024, EGU24-20178, https://doi.org/10.5194/egusphere-egu24-20178, 2024.

HS2.2 – From observations to concepts to models (in catchment hydrology)

EGU24-766 | ECS | Posters on site | HS2.2.1

Estimating open channel surface flow velocities under low luminosity conditions, using fluorescent quinine-based tracing techniques and UAS imagery 

Soheil Zehsaz, João L. M. P. de Lima, Jorge M. G. P. Isidoro, M. Isabel P. de Lima, and Ricardo Martins

This study discusses the application of innovative fluorescent quinine-based tracer techniques to estimate surface flow velocities under low luminosity conditions. Quinine is known for its luminescent properties when exposed to ultraviolet A (UVA) light. This research involves fieldwork measurements conducted in open channels with varying hydraulic characteristics. The application of quinine solutions in liquid and solid (ice cubes) states into the water flow allows the recording of the movement of the tracers. This movement is registered by tracking the leading edge of the liquid tracer plume or solid particles over specific time intervals. An Unmanned Aerial System (UAS) equipped with a camera was used to record the movement of the tracers in the channels. To benchmark the performance of the quinine-based tracers, flowmeter-based velocity maps and a thermal tracer technique were employed in the experiments. Results indicated that both liquid and solid quinine solution tracers successfully estimated open channel surface flow velocities under low luminosity conditions. The quinine solid tracer can be used as a dual (fluorescent-thermal) tracer and, despite its smaller volume used in the experiments compared to the liquid tracer, the solid form was easier to track. This was attributed to the conservation of a higher quinine concentration for longer periods of time in the solid tracers, resulting in a higher contrast easier to identify. On the other hand, the liquid tracer faded earlier due to diffusion in the turbulent flow. Nonetheless, the main advantage of using the liquid over the solid tracer was its easier availability for the experiments. This study highlights the applicability and reliability of quinine-based tracers in estimating surface flow velocities, in low luminosity conditions. The use of the UAS in the measurements’ set-up facilitated and enhanced data collection, contributing to the accuracy of the results. The observational approach allowed for capturing the inherent luminescent properties of quinine when exposed to UVA light using minimal tracer quantities.

How to cite: Zehsaz, S., L. M. P. de Lima, J., M. G. P. Isidoro, J., P. de Lima, M. I., and Martins, R.: Estimating open channel surface flow velocities under low luminosity conditions, using fluorescent quinine-based tracing techniques and UAS imagery, EGU General Assembly 2024, Vienna, Austria, 14–19 Apr 2024, EGU24-766, https://doi.org/10.5194/egusphere-egu24-766, 2024.

EGU24-1581 | Posters on site | HS2.2.1

How changing environmental conditions affect soil water isotopic composition in pre-Alpine grassland soils 

Natalie Orlowski, Tanja Vollmer, and Katrin Schneider

Alpine and pre-Alpine grasslands offer crucial ecosystem services like fodder production, biodiversity support, carbon sequestration, and water retention. However, changing environmental conditions like rising temperatures threaten these grassland soils, potentially disrupting their functionality. Understanding how climate change and farming practices impact soil functions and eco-hydrological processes is vital for developing effective strategies to sustainably manage these grasslands.

For this study, we conducted soil water isotope and soil water balance measurements from 2018-2019 in the grassland lysimeters of the TERENO Pre-Alpine observatory along an elevation gradient. Several lysimeters were translocated from the higher-elevation site Graswang (860 m a.s.l., control site) to the lower lying site at Fendt (600 m a.s.l., climate-change site). This gradient represents a 2°C temperature rise along with a 400 mm precipitation decrease at the climate-change site. Our study aimed to explore how elevated temperature and reduced precipitation affect soil hydrological and soil water isotopic composition seasonally, annually and with regard to soil depth.

We did not find significant differences in the isotopic composition at 0.1m soil depth among the different lysimeter groups. Differences in soil water isotopic composition between the lysimeter groups become more pronounced at deeper soil layers, which are typically less affected by daily temperature fluctuations.

Despite higher temperatures at the climate-change site, soil water isotopes closely followed the Local Meteoric Water Line, indicating minimal evaporation. However, the line-conditioned excess (lc-excess) significantly differed between the control and the climate-change site across depths. In contrast, no differences were found between the Fendt and Graswang climate-change site’s isotopic values at any depth. This suggests a stronger influence of actual evapotranspiration at the climate-change site visible in the lc-excess values. Overall, this research enhances our understanding of climate change's impact on water cycling through pre-Alpine grassland soils at varying altitudes. This insight could help to manage these grasslands sustainably in the face of climate change.

How to cite: Orlowski, N., Vollmer, T., and Schneider, K.: How changing environmental conditions affect soil water isotopic composition in pre-Alpine grassland soils, EGU General Assembly 2024, Vienna, Austria, 14–19 Apr 2024, EGU24-1581, https://doi.org/10.5194/egusphere-egu24-1581, 2024.

EGU24-1751 | ECS | Posters virtual | HS2.2.1

Isotopic fingerprint of precipitation in NW Argentina 

Sonia Valdivielso, Jesica Murray, Ashkan Hassanzadeh, Daniel Emilio Martínez, and Enric Vázquez-Suñé

The isotopic composition of rainfall varies spatially and temporarily, depending on the climatic phenomena that originate the movement of air masses, their moisture content and the isotope fractionation processes that occur until precipitation falls isotopic composition of rainfall varies spatially and temporarily, depending on the climatic phenomena that originate the movement of air masses, their moisture content and the isotope fractionation processes that occur until precipitation falls.

One passive precipitation collector was installed in the lower part of Los Pozuelos basin, is located in the extreme northwest of Argentina, in the province of Jujuy. 19 accumulated precipitation samples were collected in the installed passive precipitation collector from 26 January, 2020 to 27 March, 2023. The objectives of this study are: (I) characterizing climatic variables; (II) Characterizing the isotopic composition of precipitation; (III) Establishing relationships between stable isotopes and the identified variables; and (IV) Identifying the trajectories of the air masses responsible for precipitation.

The time series of air temperature, relative humidity, precipitation, wind speed, solar radiation, OLR and SST exhibit a clear seasonal pattern, with the exception of the SST anomaly. The variables generally show a parametric distribution, except for daily rain. The δ18O and δ2H values of the 19 precipitation samples collected show interannual variation. The summer precipitation is depleted in heavy isotopes, has a high d-excess value and corresponds to the highest precipitation rates. This is due to the fact that the moisture masses have a greater continental extent in summer and convective precipitation dominates, both in the Amazon region and in the central and northern mountain ranges of the Andes. This is reflected in the high values of convective precipitation rate (CPR) and the lowest ORL values in the Los Pozuelos basin during the year. In winter, the heavy isotope enrichment in precipitation is due to the colder sea surface temperatures and lower evaporation associated with the Pacific Ocean compared to the Atlantic. Finally, the relationship of the isotopic composition of precipitation to the identified variables was determined. δ18O and δ2H show a high and direct correlation to each other, but inversely to precipitation amount and relative humidity. D-excess shows a moderate degree of correlation and the same tendency to increase as OLR.

The back trajectories of the HYSPLIT model air masses indicates that in summer, the dominant source of humidity was the Atlantic Ocean, which crossed both the Amazon basin and the Río de la Plata and Gran Chaco basins. A smaller percentage of the air masses is blown over by westerly winds from the Pacific Ocean. This is because the period of study is influenced by La Niña events, which cause an intensification of the westerly winds. In spring, all air masses come from the Pacific Ocean. In winter, the dominant source of humidity was the Pacific Ocean. The application of this methodology in the Los Pozuelos basin validated the appropriateness of our methods, contributing positively to the overall comprehension of water resource dynamics in the region.

How to cite: Valdivielso, S., Murray, J., Hassanzadeh, A., Martínez, D. E., and Vázquez-Suñé, E.: Isotopic fingerprint of precipitation in NW Argentina, EGU General Assembly 2024, Vienna, Austria, 14–19 Apr 2024, EGU24-1751, https://doi.org/10.5194/egusphere-egu24-1751, 2024.

EGU24-2059 | Orals | HS2.2.1

Using Chlorine-36 to understand the sources of solutes in rivers: A new use for an old tracer 

Ian Cartwright, Zibo Zhou, William Howcroft, Keith Fifield, and Dioni Cendon

The radioisotope 36Cl, which has a half life of 301 ka, is traditionally used to estimate groundwater residence times of deep old groundwater in large basins. However, systematic variations in R36Cl values in young shallow catchment waters permit its use in determining the sources of solutes in rivers. Elevated R36Cl values in precipitation were recorded during the 1950s to 1970s due to the atmospheric nuclear tests. Some of this bomb-pulse 36Cl is likely to still be present in shallow catchment waters. Additionally, as R36Cl values of precipitation generally increase with distance from the ocean, groundwater older that ~7 ka that was recharged during periods of low sea levels in the Holocene is likely to have higher R36Cl values than modern rainfall. Most of the water from within catchments that sustains streamflow (e.g., the shallower parts of the groundwater system, interflow, bank storage waters, riparian groundwater) is less than a few thousand years old. There is negligible decay of 36Cl over those timescales, and thus R36C values will reflect the initial R36C values of those waters.

River water from the intermittent Avoca catchment in southeast Australia has R36Cl values of 32 to 67 that are generally higher than those of modern rainfall (R36Cl = 25 to 35) but similar to shallow (<50 m deep) near-river groundwater (R36Cl = 51-61). These data indicate that much of the solute load is derived from the input of older waters (mean residence times of up to a few thousand years) stored within the catchment rather than evapotranspiration of recent rainfall. River water from the headwaters of the nearby perennial Barwon catchment has higher R36Cl values (38-46) than local rainfall (14-20) and most of the shallow groundwater (21 to 31). These high R36Cl values reflect the input of bomb-pulse 36Cl from shallow catchment waters. Downstream, R36Cl values of the river water decrease to 20 to 31, reflecting the inputs of solutes from groundwater that again has mean residence times of up to a few thousand years.

36Cl has allowed the origins of solutes in these rivers to be better understood. In both cases, the volume of older groundwater contributing to these rivers is moderate to minor. However, due to much higher salinities, these minor groundwater inflows influence solute geochemistry. 36Cl was particularly useful in distinguishing between evapotranspiration of recent rainfall and input from waters stored within the catchment as a source of stream river. In turn, this helps understand catchment functioning and solute fluxes within the catchments. Additionally, the palaeoclimate signal of initial R36Cl values adds to the understanding of groundwater residence times and recharge processes in catchments. 

How to cite: Cartwright, I., Zhou, Z., Howcroft, W., Fifield, K., and Cendon, D.: Using Chlorine-36 to understand the sources of solutes in rivers: A new use for an old tracer, EGU General Assembly 2024, Vienna, Austria, 14–19 Apr 2024, EGU24-2059, https://doi.org/10.5194/egusphere-egu24-2059, 2024.

Sub-surface flow pathways and transit times of water to rivers are vital catchment characteristics that determine how climate change and land use affect surface water quality and runoff amounts. These catchment characteristics also determine the appropriateness of catchment scale management decisions to control water quality and runoff.

Conservative hydrologic tracers remain reliable, accurate tools to partition river flows among flow pathways, and calculate transit times. For example, hydrogen (H) and oxygen (O) stable isotopes provide the data for robust calculation of the young (less than a few months old) fraction of river flow. H and O isotopes also have the potential to be integrated into the next generation of 'isotope-enabled' hydrological models, which are designed to provide accurate flow-source partitioning and flow estimates outside the range of historical climate conditions.

Currently, the use of H and O stable isotopes as hydrologic tracers in large catchment scale hydrology across New Zealand is hindered by the requirement for extensive, non-routine sampling. To lower this hurdle, we have prepared national databases of precipitation and river water isotope data, and developed national-scale, time varying isotope models (isoscapes).      

Here, I describe our development of precipitation and river isoscapes for New Zealand, and initial calculations of young water fractions across New Zealand rivers.

Database development used a combination of regional government, research and citizen science collections. Our databases now include regular long-term (>18 months) sampling from around 100 rivers, and over 100 precipitation sites nationally.

Using these databases, we have developed isoscapes using a range of statistical modelling techniques.  Sinusoidal precipitation isoscape results suggest that strong seasonal cycles of precipitation stable isotope values in some areas of New Zealand (but not others) are conducive to calculation of young water fractions for rivers and may require consideration for interpreting sources of recharge to groundwater and river water. Our machine-learning precipitation isoscape captures much of the non-seasonal temporal variation that dominates in windward areas of New Zealand. These results have wider implications for the application of stable isotopes as hydrological tracers in regions with mixed marine- and continental-type climates.

Results indicate that precipitation isoscapes can now be combined with regular river sampling to provide robust comparisons of young water fractions at a regional level.

How to cite: Dudley, B., Hill, A., McKenzie, A., and Yang, J.: Lag times and flow pathways of New Zealand's river catchments: Developing robust national scale metrics using stable isotopes  , EGU General Assembly 2024, Vienna, Austria, 14–19 Apr 2024, EGU24-2661, https://doi.org/10.5194/egusphere-egu24-2661, 2024.

Seasonality plays a critical role in the rate, timing and magnitude of hydrological and chemical transport in permafrost underlain mountain catchments. During spring, large volumes of water are delivered as snowmelt, yet infiltration is limited by the presence of frozen ground and shallow flow pathways rapidly deliver water to streams. As thaw progresses, catchment storage capacity increases, runoff pathways lengthen, and previously frozen soil water becomes mobile. Changing storage capacity and activation of deeper flow paths can alter the degree of mixing in storage and alter transit time distributions of outgoing fluxes. Water age can reveal vital information about catchment storage and flow pathways however, limited work has been conducted on characterizing water age dynamics in permafrost underlain catchments due to logistical challenges associated with working in cold and remote catchments. Here we characterize the age dynamics of two headwater catchments underlain with continuous permafrost located in Tombstone Territorial Park in Yukon, Canada. Both streams are considered to be non-perennial as they consistently freeze to the bed over winter. Both watersheds are primarily overlain by peat soils and have virtually no intra- and sub-permafrost groundwater contributions to streamflow. Considering the lack of hydrological characterization in this environment, our objectives are to; (1) evaluate the rate, timing, and magnitude of all hydrological fluxes, (2) utilize Bayesian mixing analysis to partition runoff into rain and snow contributions, and (3) apply StorAge Selection (SAS) functions to characterize water age dynamics in both catchments. The SAS framework can characterize variability in transit times and characterize preferential movement of water through storage, as it can assess age dynamics of water at the catchment scale by age tagging all parcels of water stored within and moving out of a hydrological system. We utilized snow survey, discharge, meteorological and eddy covariance data to quantify the inputs and outputs of the basins. Additionally, we utilized frost surveys and continuous soil moisture/temperature data to estimate active layer thickness across the basin and potential mobilization of previously frozen water. We used Isosnow, a spatially distributed parsimonious model, to simulate isotopic evolution of snow and snowmelt. A total of 410 mm precipitation entered the basin, 45% of which was snow, which melted over 4 weeks. Evapotranspiration (ET) approximately equaled discharge and increased in magnitude as summer progressed. Mixing results suggest nearly all (> 90%) of runoff during freshet was snow water in both catchments, indicating very little mixing with old water during this period. In contrast, the majority of rain left the basin as ET. The water balance and SAS framework indicate significant contributions of melting ground ice to discharge post freshet, highlighting the importance of late season rains for a particular year on discharge in the following year. The SAS framework also indicates that ET is composed primarily of very young water, likely due to high storage capacity of peat and shallow root depth of tundra vegetation. High discharge led to a more uniform SAS function for discharge, indicating greater mixing of storage during high flows.

How to cite: Grewal, A., Harman, C., and Carey, S.: Water age dynamics in non-perennial permafrost underlain catchments: Insights from hydrometrics, end-member mixing, and StorAge Selection functions, EGU General Assembly 2024, Vienna, Austria, 14–19 Apr 2024, EGU24-4408, https://doi.org/10.5194/egusphere-egu24-4408, 2024.

Continuing negative rainfall anomalies, coupled with climate change projections of increased drought severity and frequency, result in an urgent need to increase resilience and integration in land and water management strategies in many regions of the World. However, complex interactions between landcover change, hydrological partitioning and water availability are difficult to quantify, especially at different spatio-temporal scales. We will present insights from integrated monitoring and tracer-aided modelling approaches from the long-term experimental catchment Demnitzer Mill Creek catchment, NE Germany. We combine stable water isotopes measured at different compartments of the critical zone and landscape with process-based tracer-aided models of different complexity to investigate and quantify ecohydrological fluxes and dynamics of water storage, pathways and ages. Such tracer-aided, ecohydrological modelling frameworks provide robust science-based evidence for policy makers allowing quantitative assessment of landuse effects on water availability and effective communication with stakeholders. Our findings also underscore the urgent requirement for enhancing resilience and promoting integrated strategies in managing land and water resources to better respond to drought.

How to cite: Tetzlaff, D., Smith, A., Luo, S., and Soulsby, C.: Integrated monitoring and isotope-aided modelling to assess ecohydrological fluxes and storage dynamics in a drought sensitive lowland catchment, Germany, EGU General Assembly 2024, Vienna, Austria, 14–19 Apr 2024, EGU24-4416, https://doi.org/10.5194/egusphere-egu24-4416, 2024.

Water limitation has become one of the most pressing threats to groundwater and forest resources also in the north. Despite increased precipitation in many high latitude regions, suggested by both empirical observations and climate models, large regions are on a trajectory of increasing water limitation that already caused substantial loss of forest biomass, threatening targets for biodiversity, carbon sequestration, and bioeconomy. Key to these northern challenges are how the intensification of the water cycle results in earlier snowmelt, enhanced evapotranspiration (ET) rates, lower groundwater levels during the vegetation period and declining summer runoff. In my talk, I will present 25 years of consistent water isotopic data from precipitation, groundwater and stream flow in order to disentangle critical processes that determine the availability of water for trees and streams during the growing season. I will draw my examples from the Krycklan Catchment Study (KCS) that has supported water isotope research for over tree decades. The research infrastructure is based on a 6790 ha catchment and includes a dozen gauged streams, 150 groundwater wells, 500 permanent forest inventory plots, a large radar system for tree water content measurements and a 150 meter tall tower for biosphere-atmosphere carbon and water exchange processes. The combination of long-term monitoring, shorter-term research projects, and large-scale experiments, including manipulations of the water cycle related to climate, forest management and peatland restoration. This work has contributed to our process understanding of water in the boreal landscape, while also supporting the development of better models and guidelines for research, policy, and management.

How to cite: Laudon, H.: Intensification of the water cycle in northern catchments: Long-term isotopic and hydrometric evidence and consequences   , EGU General Assembly 2024, Vienna, Austria, 14–19 Apr 2024, EGU24-4645, https://doi.org/10.5194/egusphere-egu24-4645, 2024.

EGU24-6220 | ECS | Orals | HS2.2.1

A multiscale analysis using young water fractions and transit time distributions in the Yellow River Source Area 

Jinzhu Fang, Michael Stockinger, Yibo Yang, Peng Yi, Christine Stumpp, Jijie Shen, Ling Xiong, and Jiayong Shi

Estimating water yield is a crucial aspect of evaluating water conservation strategies and ensuring sustainable development in watersheds. The widespread application of isotopes to quantify the temporal dynamics of precipitation transforming into runoff has helped to identify the influence of watershed runoff and mixing processes on nutrient transport and biogeochemistry. Nevertheless, in permafrost regions characterized by strong landscape heterogeneity, sparse and discontinuous data collection poses challenges in obtaining isotope data of permafrost thaw meltwater for studying its influence on catchment hydrology. The primary objective of this study is to assess the accuracy and reliability of the convolution integral model in simulating the transit time distribution in permafrost regions, considering the introduced parameters. Additionally, the study aims to evaluate the water retention capacity of the permafrost watershed and explore the key physical control factors influencing the impact of permafrost thaw on mean transit time (MTT). The northeastern part of the Qinghai-Tibet Plateau, situated in the source region of the Yellow River (SAYR), is at the boundary between discontinuous permafrost and seasonal frozen ground. Permafrost degradation is evident, leading to a complex runoff generation mechanism. Within five nested sub-catchments of the SAYR region (20,000~120,000 km2), we collected high-resolution water stable isotope data for both rainfall and runoff, and we quantified the contribution of permafrost thaw meltwater during the melting period. The influence of permafrost meltwater from the active layer on water transit times was accounted for in the convolution integral method by introducing an additional source contributing to runoff (Q0, x% contribution with isotope ratio δ0). The study finds that additional sources of soil melt water runoff contribution are crucial to solving the problem of non-convergence of the convolution integral model in permafrost areas, and the MTTs of the watersheds are mainly influenced by river channel topography, the water retention capacity of the watersheds depended on the topographical and morphological characteristics of the watershed, and is secondarily affected by land use type, soil type, and frozen soil thermal stability.

How to cite: Fang, J., Stockinger, M., Yang, Y., Yi, P., Stumpp, C., Shen, J., Xiong, L., and Shi, J.: A multiscale analysis using young water fractions and transit time distributions in the Yellow River Source Area, EGU General Assembly 2024, Vienna, Austria, 14–19 Apr 2024, EGU24-6220, https://doi.org/10.5194/egusphere-egu24-6220, 2024.

Understanding erosion and sediment transport is essential for the sustainable management of water and soil resources in the critical zone. Soil erosion is considered as the main threat to soils and poses food security problems. Given these significant challenges, it is important to understand and prioritize the processes that control erosion dynamics and sediment transfers within watersheds.

However, these dynamics exhibit strong spatio-temporal variability, as illustrated by the wide dispersion of relationships between suspended sediment concentrations and liquid discharge (Q) at catchment outlets. However, these dispersions are often interpreted based on the variability along the sediment axis (e.g., origin and availability of particles), while very few studies have focused on the variability along the discharge axis (water origin). In particular, the interactions between groundwater flow and sediment transport have been little studied.

The aim of this study is to assess the impact of groundwater flow on sediment transport dynamics in two headwater catchments (respectively 1.07 km² at Brusquet and 0.86 km² at Laval) of the Draix-Bléone observatory with different vegetation cover rate (respectively 80% at Brusquet and 30% at Laval). The work first involved developing an EMMA (End-Member Mixing Analysis) method for decomposing flood hydrographs and separating the respective contributions of groundwater flow and surface runoff for each flood using the high-frequency conductivity signal, highly correlated to sulfate concentrations, as a tracer discriminating these two water compartments.

This EMMA method was used to calculate groundwater contributions during 120 floods between 2015 and 2020 in the Laval catchment and 116 floods between 2013 and 2020 in the Brusquet catchment. Analysis of the results of these decompositions revealed seasonal variations in groundwater contributions in both catchments, with winter and spring floods showing higher groundwater contributions than summer and autumn floods. These decompositions made it possible to examine the dynamics of fine sediment transport during floods as a function of surface runoff rate and to identify the impact of groundwater on hydrosedimentary processes (effect of dilution or of remobilization of riverbed sediment). By comparing the results of the decompositions from the two catchments, it was possible to assess the impact of vegetation cover on the contribution of groundwater to flood and on each catchment sediment dynamics.

Overall, this study suggests that the use of high frequency conductivity signals as tracer of water origin offers a promising approach to performing high frequency decompositions of flood hydrographs. The results of the decompositions highlight the importance of groundwater flows for understanding hydrosedimentary processes in headwater catchments (~km²).

How to cite: Fischer, O., Legout, C., Le Bouteiller, C., and Nord, G.: Study of the contribution of groundwater to hydrosedimentary processes in two Mediterranean mountainous watersheds using the high frequency conductivity signal as a tracer of water origin, EGU General Assembly 2024, Vienna, Austria, 14–19 Apr 2024, EGU24-6278, https://doi.org/10.5194/egusphere-egu24-6278, 2024.

EGU24-6285 | Orals | HS2.2.1

Modelling the isotopic signatures of solutes derived from weathering reactions 

Jennifer Druhan and Paolo Benettin

High-resolution water chemistry records in rivers typically show that the routing of reactive solutes through the Critical Zone is a dynamic process that can change drastically across hydrologic responses. Quantitative transient models are needed to interpret these riverine solute measurements as emergent signatures of coupled geochemical and ecohydrological functioning. In this context, the stable isotope signatures of geogenic solutes offer a unique opportunity to disentangle processes such as the dissolution or primary minerals, precipitation of secondary phases and ecological nutrient cycling. Here, we describe the first merging of a parsimonious hydrological model featuring time-variant fluid age distributions with a geochemical model for isotopically fractionating weathering reactions. Using SiO2(aq) and the corresponding silicon isotope ratio δ30Si as an example, we show that the stable isotope signatures of riverine solutes produced by weathering reactions reflect a component of the fluid age distribution that is unique to the corresponding solute concentrations. This distinct sensitivity offers a novel diagnostic tool to interpret the SiO2(aq) and δ30Si dynamics recorded in six low-order streams spread across a diversity of climates, geologies, and ecosystems.

How to cite: Druhan, J. and Benettin, P.: Modelling the isotopic signatures of solutes derived from weathering reactions, EGU General Assembly 2024, Vienna, Austria, 14–19 Apr 2024, EGU24-6285, https://doi.org/10.5194/egusphere-egu24-6285, 2024.

EGU24-6550 | ECS | Orals | HS2.2.1

Stable silicon isotope signatures reflect the storage and flow paths of fluid draining through both mesoscale hillslopes and natural watersheds. 

Andrew Guertin, Charlie Cunningham, Julien Bouchez, Marine Gelin, Jon Chorover, Peter Troch, Hannes Bauser, Minseok Kim, Louis Derry, and Jennifer Druhan

The variety of transit times and pathways water takes from infiltration to discharge through a hillslope determines the dynamic storage of the system, the capacity for water-rock-life reactivity, and ultimately the chemical composition of streamflow. In the laboratory, fluid phase stable Si isotopes (δ30Si) enrich through time during secondary silicate mineral formation as Si is removed from solution1. However, despite streams being weighted towards young waters, discharge from individual catchments commonly maintains a stable, often strongly fractionated δ30Si signature, reflective of chemically evolved solute signatures2. Furthermore, each individual catchment exhibits its own characteristic δ30Si signature in the stream discharge, even for comparable extents of Si depletion from solution. Such intra-site variability was attributed to a combination of multiple fractionation pathways (plant uptake and mineral precipitation) and the unique structure of fluid storage and drainage through each catchment. Here, we use three replicate artificial hillslopes at the Landscape Evolution Observatory (LEO) in Tucson, Arizona as model catchments to test if δ30Si of discharge can be described by an isotope-enabled reactive transport model (RTM) constrained by both the characteristic transit time distribution (TTD) and fractionation pathways of LEO. At the LEO hillslopes, the role of vegetation and hence the compounding effects of ecosystem cycling can be omitted, limiting δ30Si fractionation solely to the effects of mineral precipitation. We collected samples, with constrained TTDs, and measured δ30Si from the discharge at the outlet of each hillslope during three randomized storm events of varying intensity. The δ30Si in aqueous discharge reflects a clear and consistent signature of fractionation that is confined to a narrow range of values, much like natural upland watersheds, despite highly variable irrigation scenarios, retaining a signature across the three hillslopes defined by the unique hydrologic flow paths of the replicated system.  We offer a quantitative and process-based framework describing these observations using an isotope-enabled RTM3. Close agreement between this coupled RTM and the discharge measurements from LEO supports our hypothesis that the δ30Si of headwater streams is reflective of both characteristic watershed TTDs and fractionation pathways. By applying this new understanding to reexamine upland watershed datasets we can gain insight into fluid flow paths and contributions of various fractionation pathways to water circulation through the shallow subsurface Critical Zone.


1Fernandez, N. M., Zhang, X., & Druhan, J. L. (2019). Silicon isotopic re-equilibration during amorphous silica precipitation and implications for isotopic signatures in geochemical proxies. Geochimica et Cosmochimica Acta, 262, 104-127. https://doi.org/https://doi.org/10.1016/j.gca.2019.07.029

2Fernandez, N. M., Bouchez, J., Derry, L. A., Chorover, J., Gaillardet, J., Giesbrecht, I., et al. (2022). Resiliency of silica export signatures when low order streams are subject to storm events. Journal of Geophysical Research: Biogeosciences, 127, e2021JG006660. https://doi.org/10.1029/2021JG006660

3Druhan, J. L., & Benettin, P. (2023). Isotope Ratio – Discharge Relationships of Solutes Derived From Weathering Reactions. American Journal of Science, 323. https://doi.org/10.2475/001c.84469

How to cite: Guertin, A., Cunningham, C., Bouchez, J., Gelin, M., Chorover, J., Troch, P., Bauser, H., Kim, M., Derry, L., and Druhan, J.: Stable silicon isotope signatures reflect the storage and flow paths of fluid draining through both mesoscale hillslopes and natural watersheds., EGU General Assembly 2024, Vienna, Austria, 14–19 Apr 2024, EGU24-6550, https://doi.org/10.5194/egusphere-egu24-6550, 2024.

EGU24-6956 | ECS | Posters on site | HS2.2.1

Sulfur and oxygen isotope ratios constrain riverine sulfate sources and terrestrial pyrite oxidation 

Huiying Hu, Changqiu Zhao, Sen Xu, Rongfei Wei, Teklit Zerizghi, Qiyu Tan, and Qingjun Guo

Pyrite oxidation, coupled with carbonate weathering, can be a source of carbon dioxide (CO2) in the atmosphere over geological timescales. However, this source of CO2 is an important but not entirely understood component of the long-term carbon cycle. The exact identification of the riverine sulfate sources and terrestrial pyrite weathering flux is crucial for a quantitative understanding of this source, but it still faces great challenges. Sulfur and oxygen isotope ratios are widely used to constrain sulfate sources. Here, we reviewed the effect of pyrite oxidation on the carbon cycle and synthesized sulfur isotope and oxygen isotope data for global rivers. We also figured out the fluxes of riverine sulfate caused by pyrite oxidation in various rivers around the world using a Bayesian model that is based on the sulfur and oxygen isotope ratios in riverine sulfates and local end elements. The highest pyrite-derived sulfate fluxes were found in the Mississippi River (198.3 ± 37.8 Gmol SO42-year-1). Higher pyrite oxidation rates occurred in areas with higher runoff rates, and global climate change may have also affected pyrite oxidation rates. This may assist in re-evaluating the role of chemical weathering on the carbon cycle and improve the theory of the carbon cycle.

How to cite: Hu, H., Zhao, C., Xu, S., Wei, R., Zerizghi, T., Tan, Q., and Guo, Q.: Sulfur and oxygen isotope ratios constrain riverine sulfate sources and terrestrial pyrite oxidation, EGU General Assembly 2024, Vienna, Austria, 14–19 Apr 2024, EGU24-6956, https://doi.org/10.5194/egusphere-egu24-6956, 2024.

EGU24-7183 | ECS | Posters on site | HS2.2.1

Temperature Profiles due to Groundwater Flow in a Subsurface Porous Medium with a Heat Convective Boundary 

Chia-Hao Chang, Bo-Tsen Wang, and Jui-Pin Tsai

The temperature in subsurface porous media (i.e., subsurface temperature) has been popularly treated as a natural tracer of groundwater flow. Several previous studies usually neglected the thermal boundary effects to build simple geothermal models for simulating the subsurface temperature. Although a few studies considered the thermal boundary effects, their models considered the thermal boundaries under either specific-temperature or specific-heat-flux conditions. However, these models are expectedly inapplicable to the cases of subsurface porous media with convective thermal boundary conditions. This study hence proposes a heat-transport model for describing the subsurface temperature induced by a heat convective boundary. The model is composed of a heat conduction-advection equation subject to a convective boundary condition at the bottom of a porous medium. The study results show how the convective boundary effects influence he subsurface temperature and indicate the effects are dominated by some parameters, including the medium thicknesses, medium thermal conductivity, heat transport coefficient, and groundwater flux.

How to cite: Chang, C.-H., Wang, B.-T., and Tsai, J.-P.: Temperature Profiles due to Groundwater Flow in a Subsurface Porous Medium with a Heat Convective Boundary, EGU General Assembly 2024, Vienna, Austria, 14–19 Apr 2024, EGU24-7183, https://doi.org/10.5194/egusphere-egu24-7183, 2024.

EGU24-8015 | ECS | Orals | HS2.2.1

Revealing the origin, age and seasonality of streamflow, soil waters and transpiration 

Marius G. Floriancic, Scott T. Allen, and James W. Kirchner

The forest water cycle is dominated by vegetation-mediated processes, such as interception, infiltration, and transpiration, that greatly impact the redistribution of waters between the atmosphere and subsurface. Based on a three-year time series of water stable isotopes in precipitation, soils of various depths, groundwater, streams and xylem from the “WaldLab Forest Experimental Site” in Zurich, Switzerland, we estimated seasonal signals and the fractions of more recent and older waters across the different compartments of the forest water cycle. These findings yield new understanding of water transport in forest ecosystems.

Seasonal variation in streamflow isotopic signatures was small, indicating that annual streamflow was dominated by old waters draining from subsurface storages. Mobile and bulk soil waters all showed a distinct seasonal signature, with the seasonal amplitude decreasing with depth and mobile soil waters varying less than bulk soil waters. Young water fractions and new water fractions in forest soils decreased with increasing depth, indicating different degrees of subsurface mixing with waters from previous events and seasons. The fractions of recent precipitation in soil waters were generally smaller in summer than in winter, revealing the effects of interception and evaporation. Xylem water signatures in beech and spruce trees largely matched the bulk soil water signatures. The relative lack of soil water recharge in summer led to both species predominantly transpiring winter precipitation. Canopy interception did not substantially alter the isotopic signal of precipitation, but where it is more significant it could bias interpretations of transit times and seasonal precipitation partitioning.

How to cite: Floriancic, M. G., Allen, S. T., and Kirchner, J. W.: Revealing the origin, age and seasonality of streamflow, soil waters and transpiration, EGU General Assembly 2024, Vienna, Austria, 14–19 Apr 2024, EGU24-8015, https://doi.org/10.5194/egusphere-egu24-8015, 2024.

EGU24-8684 | ECS | Posters on site | HS2.2.1

CFC stream water mean transit times reveal subsurface flow processes across scales at Krycklan 

Tamara Kolbe, Virginie Vergnaud-Ayraud, Barbara Yvard, and Kevin Bishop

Catchment transit time distributions span the range from minutes to hours (e.g. overland flow) to years, decades and longer. As time-variant catchment descriptors they are useful indicators for flow and transport processes. Stable water isotopes are established tracers to inform about young water components in stream water, but are less well-suited to defining ages for the older components of the transit time distribution. To infer slow flow water components, tracers that are able to date water over longer timescales are needed.

Here, we used atmospheric tracers (i.e. chlorofluorocarbons (CFCs)) that are able to cover the timescale of subsurface flow over decades to determine mean transit times of stream water. CFCs are well established tracers for dating groundwater, but their use is limited in surface waters as they might partially reequilibrate with ambient atmospheric concentrations of CFCs within a few hours. We measured CFCs at different subcatchment outlets of the Krycklan catchment basin under different flow conditions (49 samples in total). Krycklan is a boreal research catchment in northern Sweden at which stable water isotopes are extensively used to understand hydrological processes. The CFC results show that stream water mean transit times vary between 32 years and 59 years. These ages are similar to those observed for groundwater in the aquifer. This, and the patterns for individual CFCs suggest limited reequilibration with contemporary atmospheric CFC concentrations. Mean transit times across scales are independent of catchment size suggesting local groundwater contributions to streams. Furthermore, mean transit times negatively correlate with specific discharge supporting findings of increasing young water components during high flow conditions.


How to cite: Kolbe, T., Vergnaud-Ayraud, V., Yvard, B., and Bishop, K.: CFC stream water mean transit times reveal subsurface flow processes across scales at Krycklan, EGU General Assembly 2024, Vienna, Austria, 14–19 Apr 2024, EGU24-8684, https://doi.org/10.5194/egusphere-egu24-8684, 2024.

EGU24-11340 | ECS | Orals | HS2.2.1

South African Mediterranean Catchments Comparison Using Environmental Tracers and Hydrochemistry 

Angela Welham, Jared Van Rooyen, Andrew Watson, Reynold Chow, and Alakendra Roychoudhury

Water quantity and quality in Mediterranean catchments are of concern due to evaporation rates often exceeding rainfall rates. Spatio-temporal hydrological shifts caused by climate change within these environments affect the catchment's hydrodynamics. The Western Cape region in South Africa boasts Mediterranean climate and is dependent on rainfall and surface water to recharge dams, which support various industrial, domestic, and agricultural sectors. The 2015 – 2018 Western Cape drought decreased the contribution of surface sources, leading to an increase in groundwater dependence across industries. This exerted pressure on both the hydrological system and ecosystem functionality leading to water security issues. To determine sustainable water management strategies, environmental tracers (stable and radioactive isotopes) and hydrochemical analyses were applied to two data-poor contrasting catchments hosting important estuarine wetlands in the Western Cape. Verlorenvlei Catchment, a semi-arid environment, is predominantly occupied by agricultural practices (potatoes, citrus, grapes, and rooibos). In contrast, the Eerste River Catchment is a wetter region but is subjected to high urban modifications such as wastewater treatment plants, informal/formal settlements, water diversion and canalization. To disentangle the two wetland watersheds' temporal and spatial hydrological characteristics four sample campaigns were completed in March, June, September, and November 2023. Water samples (i.e., event-based rainfall, surface water and groundwater) were analysed for isotopes (δ18O, δ2H, 3He, 4He,21Ne, 20Ne, 22Ne, 36Ar, 40Ar, 84Kr, and 136Xe) and major ions. Within the topographically and surface water delineated watershed, the Verlorenvlei estuary experiences high evaporation compared to other surface waters, hence is reliant on baseflow to support its hydrological functioning. During prolonged dry periods, groundwater from outside the watershed predominantly supports the wetland. However, under normal or above-average rainfall conditions, support shifts to local groundwater. Two sandstone and shale-dominated sub-catchments within the watershed exhibit overlapping groundwater isotope ratios and water types compared to the Verloren sub-catchment, suggesting a disproportionately high groundwater contribution from both sub-catchments into the wetland. Conversely, the Eerste River Catchment water quality is of a greater concern. The Macassar coastal wetland is less vulnerable to evaporation and depends on two perennial rivers for support. However, strong surface water-groundwater interconnectivity and an approximate 9-month lag in recharge suggest a high baseflow response. Therefore, the Macassar wetland can likely maintain a steady water level due to continuous streamflow support by groundwater discharge during dry periods, unlike in Verlorenvlei. Despite these Mediterranean catchments’ different settings, they share a high sensitivity to rainfall and evaporation changes. To mitigate the impact of projected droughts on these respective wetlands, the government’s water management department is encouraged to improve its water regulations and policies, taking into account both local and regional groundwater support. Additionally, water agencies should actively engage more with stakeholders to raise water awareness and improve water management (e.g., organizing monthly seminars to discuss water recycling, water-conserving irrigation systems, and other related strategies).

How to cite: Welham, A., Van Rooyen, J., Watson, A., Chow, R., and Roychoudhury, A.: South African Mediterranean Catchments Comparison Using Environmental Tracers and Hydrochemistry, EGU General Assembly 2024, Vienna, Austria, 14–19 Apr 2024, EGU24-11340, https://doi.org/10.5194/egusphere-egu24-11340, 2024.

EGU24-11479 | ECS | Orals | HS2.2.1

The EXPECT method: a multi-tracer approach for reliable high temporal resolution young water fraction estimates 

Alessio Gentile, Jana von Freyberg, Davide Gisolo, Davide Canone, and Stefano Ferraris

The portion of recently introduced water molecules in a stream, known as the young water fraction, is crucial in catchment intercomparison studies. The unweighted or flow-weighted average young water fraction in a catchment, over the period of isotope sampling, can be assessed through the ratio of flow-weighted or unweighted seasonal isotope cycles amplitudes in streamwater (A(*)S) and precipitation (AP), respectively. The symbol ‘*’ here indicates a flow-weighted variable. However, the young water fraction resulted to be a no-stationary quantity within individual catchments.

Indeed, past studies revealed that young water fractions increase with stream discharge (Q). Accordingly, the rate of increase in young water fraction with increasing Q has been defined as the discharge sensitivity of young water fraction (S*d). S*d has been quantified as the parameter of a non-linear equation that expresses how AS(Q) varies with Q. Such parameter is directly obtained by fitting a sine curve, with amplitude AS(Q), on streamwater isotope data. Accordingly, in catchments with sparse isotope data S*d could be highly uncertain.

In this study, we introduce a novel approach designed to enhance the temporal resolution of young water fraction estimates, consequently refining the determination of S*d. Our proposed method, referred to as EXPECT, is grounded in three fundamental assumptions.

  • We propose a mixing relationship that follows an exponential decay of EC with an increasing young water fraction.
  • We posit that the two-component hydrograph separation technique, utilizing measured Electrical Conductivity (EC) as a proxy of water age and the aforementioned exponential mixing relationship, can effectively delineate the proportion of young and old water in a stream by using appropriate end-members.
  • We assume that the EC value of the young water endmember (ECyw) is lower than that of the old water endmember (ECow).

The two endmembers, ECyw and ECow, have been adjusted through a calibration process by aligning the unweighted and flow-weighted average young water fractions obtained through hydrograph separation with the corresponding values derived from seasonal isotope cycles (AS/AP  and A*S/AP, respectively).

The method has been tested in three small catchments in the Alptal valley, Switzerland, returning promising results. Nevertheless, we emphasize the importance of considering the limitations of EC as a tracer and the peculiar characteristics of the catchments under investigation for the appropriate application of the EXPECT method.

Keywords: Stable water isotopes, Electrical Conductivity, Young water fraction, Discharge Sensitivity

Acknowledgements: This publication is part of the project NODES which has received funding from the MUR –M4C2 1.5 of PNRR with grant agreement no. ECS00000036.

References

Gentile, A., von Freyberg, J., Gisolo, D., Canone, D., and Ferraris, S.: Technical Note: two-component Electrical Conductivity-based hydrograph separaTion employing an EXPonential mixing model (EXPECT) provides reliable high temporal resolution young water fraction estimates in three small Swiss catchments, EGUsphere [preprint], https://doi.org/10.5194/egusphere-2023-1797, 2023.


How to cite: Gentile, A., von Freyberg, J., Gisolo, D., Canone, D., and Ferraris, S.: The EXPECT method: a multi-tracer approach for reliable high temporal resolution young water fraction estimates, EGU General Assembly 2024, Vienna, Austria, 14–19 Apr 2024, EGU24-11479, https://doi.org/10.5194/egusphere-egu24-11479, 2024.

EGU24-11764 | ECS | Posters on site | HS2.2.1

Approaching mass (im)balance when using artificial DNA tracer using DNA extraction methods 

Sören Köhler, Jan Willem Foppen, Peter Chifflard, Florian Leese, and Yvonne Schadewell

Artificial tracers play an important role in hydrological studies that aim to identify subsurface flow paths. Tracers can be used to investigate water transit times but also, for example, to assess if a structure is leak-proof. Recently, artificial DNA (artDNA) has been proposed as a tracer alongside traditional tracers such as salt. However, like traditional tracers, artDNA suffers from input tracer mass loss. This is even more pronounced in the case of artDNA. Different approaches were proposed to improve the recovery of tracer mass and thus reach the required limit of detection and quantification required for the analysis. Using column tests, a controlled experiment was designed to examine the recovery success of DNA extraction and the detachment from soil via a buffer. In each case water was spiked with artDNA, flushed through the column and subsequently the remaining molecules recovered using a magnetic bead extraction method. The ongoing experiments will show the enhancement of artDNA tracer recovery by using methods for DNA extraction from molecular biology. Further, to recover potential substrate-bound artDNA and possibly identify one source of the observed mass imbalance, a phosphate-containing buffer of high pH was used to detach artDNA from the substrate inside the column. The results will be cross-factored by comparing the recovery of tracer mass in the plain eluate vs. the DNA extracted from the eluate and by determining the substrate-bound artDNA in both cases. Insights from this experiment and the methodological advancement will be fundamental for the use of artDNA-based tracing in hydrological research.

How to cite: Köhler, S., Foppen, J. W., Chifflard, P., Leese, F., and Schadewell, Y.: Approaching mass (im)balance when using artificial DNA tracer using DNA extraction methods, EGU General Assembly 2024, Vienna, Austria, 14–19 Apr 2024, EGU24-11764, https://doi.org/10.5194/egusphere-egu24-11764, 2024.

End-member mixing analysis (EMMA) has been frequently applied to advance our understanding of hydrologic pathways, water sources, and surface water and groundwater interactions in catchment hydrology. Very recently, EMMA has been applied to hydrogeological systems to better understand groundwater recharge and movement. In conjunction with diagnostic tools of mixing models (DTMM), EMMA relies on eigenvectors extracted from coincident time series of geochemical and isotopic values measured at the same location to characterize the mixing space (numbers of end-members and conservative tracers), identify end-members, and quantify their contributions to streamflow and the groundwater system. However, this traditional approach limits the use of EMMA in many studies with small sample sets (short intervals). We hypothesize that EMMA can be extended to studies with infrequent sampling schemes if samples are collected from multiple scales or locations within a catchment by adding an additional mixing model assumption that end-members are consistent over varying scales. In other words, the underlying assumption means that only contributions of end-members vary with scales. This work uses two examples to demonstrate the success of EMMA for analyzing short-duration time series of water samples collected from multiple locations, one from a glacierized catchment in Bhutan and the other from a hydrogeological study in volcanic setting of El Salvador. The success was evaluated by independent tracers (not used in EMMA and also no direct connection with those used in EMMA) and semi-independent tracers (e.g., specific conductance (SC) and pH, which are chemically related to geochemical tracers used in EMMA). In the glacierized catchment, a three-end-member mixing model was developed using geochemical tracers for streamflow with contributions from glacier melt and direct precipitation, shallow groundwater (below and in front of glaciers), and catchment groundwater (base flow generated outside the glacierized area). The projections using the EMMA results and the measured values were very well correlated for independent and semi-independent variables, including SC (R2 = 0.97, slope =0.98, p < 0.001), pH (R2 = 0.70, slope =1.1, p < 0.001), stream temperature (R2 = 0.77, slope =0.6, p < 0.001), and δ18O (R2 = 0.90, slope =1.16, p < 0.001; not used in EMMA in this case). In the case of El Salvador study, three end-members were also identified for a number of groundwater wells, with direct precipitation and two types of groundwater from different geologic settings. The El Salvador model was validated using SC (R2 = 1.00, slope =0.97, p < 0.001) and sulfur (R2 = 0.87, slope =0.81, p < 0.01) that were not used in EMMA. The successful application of this new approach will significantly extend the application of EMMA to catchments that are difficult to access, or frequent sampling is impractical.

How to cite: Liu, F. and Gierke, J.: A New Approach to Conduct End-Member Mixing Analysis in Catchment Hydrology and Hydrogeology, EGU General Assembly 2024, Vienna, Austria, 14–19 Apr 2024, EGU24-12055, https://doi.org/10.5194/egusphere-egu24-12055, 2024.

EGU24-12536 | Posters on site | HS2.2.1

Using Stable Water Isotopes to Estimate Source Water Contribution in a Tidal Marshland 

Sophia Bradach, Jing Yan, Sunendra Joshi, Mohammad Afsar, and Yan Jin

Sea level rise due to climate change is exacerbating issues of saltwater intrusion and contamination. Identifying sources of water in coastal marshland under the influences of tides is critical in assessing vulnerability and developing strategies to protect coastal ecosystems. Mixing models such as end-member mixing, allow the contributions of salt and freshwater to be quantified using conservative tracers such as water isotopes. Using stable water isotopes as tracers to assess the impact of saltwater intrusion in coastal environments has been limited compared to their application in catchment hydrology. This study aims to explore the feasibility of using water isotopes to quantify the salt and freshwater dynamics in a tidal salt marsh at the St. Jones Reserve (39.10 N, 75.44 W) in Delaware, USA.  During a full tidal cycle, porewater samples were collected from piezometers (at 30 and 100 cm depths below the surface) at four sampling sites along a saline gradient at St. Jones Reserve.  Samples were taken at specific time intervals to capture the full effect of the tide. The isotope composition of the collected porewater samples was measured using a Liquid Water Isotope Analyzer (LWIA). End member analysis will be used to estimate the relative contributions of salt and freshwater at each point along the salt gradient. By quantifying these contributions, we hope to gain insights into the potential impacts of saltwater intrusion on the tidal marsh ecosystem. The information will allow better understanding of the hydrological conditions of the marshland and aid interpretations of an array of soil physical and chemical properties and processes being studied at the site.

How to cite: Bradach, S., Yan, J., Joshi, S., Afsar, M., and Jin, Y.: Using Stable Water Isotopes to Estimate Source Water Contribution in a Tidal Marshland, EGU General Assembly 2024, Vienna, Austria, 14–19 Apr 2024, EGU24-12536, https://doi.org/10.5194/egusphere-egu24-12536, 2024.

EGU24-12870 | ECS | Orals | HS2.2.1

Development of a model agnostic isotope tracer simulator  

Tegan Holmes, Tricia Stadnyk, and Alain Pietroniro

Isotope tracers can benefit hydrologic modeling, by adding observational data relating to evaporation and water ages as a supplement to flow data. A few hydrologic models have had tracers embedded in their software, resulting in numerous studies and identified benefits from isotope tracer simulation. A key barrier to more wide-spread application of linked flow and isotope simulation in hydrologic modeling is the considerable effort required to add an isotope tracer simulation to an existing model, which requires an uncommon overlapping expertise in both hydrologic model development and isotope tracer science. To expand the utilization of isotope tracers, a model agnostic isotope tracer simulator (MAITsim) has been developed, which can currently simulate two common stable isotope tracers (deuterium and oxygen-18) in association with a wide range of hydrologic models. 

MAITsim runs as a post-processing model using outputs from a hydrologic model as inputs, such that only the model specific linkage needs to be set up in order to simulate both flow and isotope tracers. The tracer simulator is compatible with any flux-state model with unidirectional flow paths, as it uses no pre-determined spatial sub-divisions (any combination of soil layers, sub-catchments and hydrologic response units can be linked to MAITsim). The model includes both mixing and evaporative fractionation and is designed to be numerically stable in wet and desiccating conditions. 

The MAITsim model results are compared to an existing embedded isotope tracer model (isoWATFLOOD). The next phase in development is to test MAITsim functionality and performance in multiple existing hydrologic models. 

How to cite: Holmes, T., Stadnyk, T., and Pietroniro, A.: Development of a model agnostic isotope tracer simulator , EGU General Assembly 2024, Vienna, Austria, 14–19 Apr 2024, EGU24-12870, https://doi.org/10.5194/egusphere-egu24-12870, 2024.

EGU24-13916 | ECS | Posters on site | HS2.2.1

A comparison of Lumped Convolution approach and Ensemble Hydrograph Separation in soil transit time distribution estimations: case study of San Francisco catchment 

Pablo Peña, David Windhorst, Patricio Crespo, Edison Timbe, Esteban Samaniego, and Lutz Breuer

Mean Transit Time (MTT) and Transit time distribution (TTD) functions are crucial for understanding the temporal dynamics of water flow through a catchment system, particularly in the context of rainfall-runoff processes that govern the solute storage and transport. Traditionally, these insights have been assessed using lumped TTD functions through models based on quasi-linearity and steady-state conditions. 
In contrast, the Ensemble Hydrograph Separation technique (EHS) presents a promising alternative for estimating TTD through multiple linear equations representing the relation between tracer fluctuations. This approach is advantageous, eliminating the need for continuous time series data of tracer measures and avoiding constraints related to the shape of transit distributions or system stationarity. However, EHS faces a sensitivity challenge in its regularization process, governed by a parameter denoted as "v," making the technique susceptible to either under-smoothing or over-smoothing the TTD function. Consequently, the judicious estimation of the regularization parameter within EHS becomes imperative.
This study aims to investigate how both the traditional lumped TTD approach and the innovative EHS method contribute to our understanding of catchment hydrology. The present investigation was conducted using stable water isotope data of stream and soil water collected in a typical Andean tropical mountain cloud forest catchment. The sampling was conducted at six sites along two altitudinal transects (at elevations of 3000 m, 2000 m, and 1000 m), encompassing two distinct land covers (forest and pasture). At each site, soil water samples were collected at three different depths (0.10, 0.25, and 0.40 m below ground). The main objective is to assess the feasibility of substituting one method with the alternative by comparing their performance using different evaluation criteria such as the Nash-Sutcliffe coefficient (NSE), mean absolute error (MAE), and coefficient of determination (R2).
Through Monte-Carlo simulations, we calibrated the “v” parameter and conducted a comprehensive comparison of both approaches. At 75% of the monitoring points, we observed NSE and R2 coefficients exceeding 0.65. These results align with previous studies, emphasizing the feasibility of assuming stationary conditions in humid tropical ecosystems. The study systematically examined the concordance between the Lumped TTD approach and Ensemble Hydrograph Separation (EHS) findings when utilizing similar TTDs. Furthermore, it provided a detailed analysis of the strengths and limitations of EHS implementation with actual real data. The insights gained from this research can be extrapolated to identify situations where each approach may be more suitable, offering valuable recommendations for their future application in various catchments.

How to cite: Peña, P., Windhorst, D., Crespo, P., Timbe, E., Samaniego, E., and Breuer, L.: A comparison of Lumped Convolution approach and Ensemble Hydrograph Separation in soil transit time distribution estimations: case study of San Francisco catchment, EGU General Assembly 2024, Vienna, Austria, 14–19 Apr 2024, EGU24-13916, https://doi.org/10.5194/egusphere-egu24-13916, 2024.

EGU24-16018 | Posters on site | HS2.2.1

Understanding snow meltwater fractional contributions to streamflow in a subarctic catchment 

Pertti Ala-aho, Kashif Noor, Jeffrey M. Welker, Kaisa-Riikka Mustonen, Björn Klöve, and Hannu Marttila

Snow plays an important role in the Northern water cycle providing temporary water storage, and resulting in high flows during spring snowmelt. Snow is experiencing rapid changes due to global warming, and process-based understanding of how snowmelt interacts with the environment is becoming ever more important. Stable isotopes of 18O and 2H are recognized as reliable tracers for determining water sources and tracing their movement within a catchment. The Isotope-Based Hydrograph Separation (IHS) is used to determine the mix of water sources in streams. However, when determining the snowmelts contribution to streamflow using IHS, uncertainties arise due to the lack of a clear and consistent snow sampling approach do define the isotope signal of snowmelt water for IHS calculations. To tackle these uncertainties, we did intensive sampling of snowfall, snowpack, and snow meltwater 18O isotopes at the Pallas catchment in Northern Finland. Our examination of different snow sampling strategies revealed potential biases in the IHS analysis. By employing samples directly from the snowmelt water 18O isotope value as an endmember in IHS, we determined the fractional contribution from streamflow was 59.6% (with a ±2% uncertainty). Yet, using alternate average weighted isotope values from either snowfall or mid-winter snowpack resulted in underestimations of snowmelt fraction by 17.8% and 22.6% respectively. In the absence of snowmelt samples, samples collected from the snowpack during high snowmelt period resulted in smaller biases (4.2 % lower snowmelt fractions). Our findings underline the importance of selecting the right snow sampling method for IHS, or any other ecohydrological analysis using stable water isotope tracers.

How to cite: Ala-aho, P., Noor, K., Welker, J. M., Mustonen, K.-R., Klöve, B., and Marttila, H.: Understanding snow meltwater fractional contributions to streamflow in a subarctic catchment, EGU General Assembly 2024, Vienna, Austria, 14–19 Apr 2024, EGU24-16018, https://doi.org/10.5194/egusphere-egu24-16018, 2024.

EGU24-16332 | Posters on site | HS2.2.1

Water stable isotope approaches for estimating water ages in the hydrological cycle 

Christine Stumpp, Hatice Türk, Selma Hajric, and Michael Stockinger

Water stable isotopes provide a tracer signal input into the hydrological cycle with every precipitation event over a certain area. Tracking this signal, its seasonal distribution, and its relative changes since that water fell as snow or rain, can provide information about water flow and transport processes in the critical zone or integrative information about them within catchments. Water stable isotopes combined with other approaches can also be used to estimate water ages, such as the transit or residence time of water. Knowing the distribution of transit or residence times and how they vary over time and space can further inform about flow paths and hydrological processes as well as time scales of solute transport and hydrochemical processes. In this talk, an overview of the importance of water ages in hydrology will be provided, and different methods will be introduced for estimating water transit or residence times based on water stable isotope data. Several examples will be shown where we used experimental data-based methods and hydrological modelling for estimating water ages in soils and in catchments. The importance of high-resolution isotope data will be emphasized for uncovering hydrological processes, their dynamics, and controlling factors.

How to cite: Stumpp, C., Türk, H., Hajric, S., and Stockinger, M.: Water stable isotope approaches for estimating water ages in the hydrological cycle, EGU General Assembly 2024, Vienna, Austria, 14–19 Apr 2024, EGU24-16332, https://doi.org/10.5194/egusphere-egu24-16332, 2024.

EGU24-16911 | ECS | Posters on site | HS2.2.1

Study of stable isotope in daily precipitation for the lower Brahmaputra region at Guwahati. 

Madhusmita Nanda and Archana M Nair

This study analysed the stable isotopic composition of daily precipitation from a monitoring station established in Guwahati located near the bank of the lower Brahmaputra region. Between September 2022 and December 2023, the precipitation samples were collected for hydrogen and oxygen stable isotope analysis. The analysis was performed following the conventional analytical procedure for laser-based, off-axis integrated cavity output spectroscopy (ICOS) in Liquid Triple Isotopic Water Analyser (L-TIWA). The preliminary study helps to define Local meteoric water line (LMWL) in the Lower Brahmaputra region. The pre-monsoon samples show regression line with slope lesser and an intercept greater than Global meteoric water line (GMWL), but the monsoon samples are showing a trend line similar to GMWL. The smaller intercept difference in the pre-monsoon and monsoon rainwater samples indicates the moisture sources of precipitation in this region originating from the Indian summer monsoon more than the western disturbances. The enrichment of heavier isotopes in precipitation of different seasons might be the result of a complex interplay between atmospheric circulation, moisture sources, elevation effects, and transport processes. Further analysis by using air mass back trajectories models and GIS tools will be able to understand and correlate the diverse origin of moisture and observed daily isotopic variability.

How to cite: Nanda, M. and Nair, A. M.: Study of stable isotope in daily precipitation for the lower Brahmaputra region at Guwahati., EGU General Assembly 2024, Vienna, Austria, 14–19 Apr 2024, EGU24-16911, https://doi.org/10.5194/egusphere-egu24-16911, 2024.

EGU24-17064 | ECS | Posters on site | HS2.2.1

Physiographic controls on fractions of new water in 12 nested catchments 

Turk Guilhem, Gey Christoph J., Schöne Bernd R., Hissler Christophe, Barnich François, Leonard Loic, and Pfister Laurent

In the context of global change, the characterization and quantification of the “changing pulse of rivers” is a pressing challenge. Over the past decades, rapidly increasing computational capabilities and the related complexity of numerical models have contributed significantly to improve flood forecasting systems. However, our understanding of the mechanistic causality – especially of extreme hydrological events – remains fragmented. Streamflow responses are notoriously threshold-bound and site-specific, thus making extrapolations to ungauged basins and projections into future climate scenarios difficult without physical evidence. There is thus still a need for inter-catchment studies across contrasted physiographic and climate settings, ideally spanning over large observation time intervals.  Here, we rely on a 13 year-long, fortnightly resolved precipitation and stream water δ18O isotope record from 12 nested catchments with different bedrock geologies (marls, sandstone, schists) and land cover in the Alzette River basin (Luxembourg). Located on the eastern edge of the sedimentary Paris Basin, our study area has a rather homogeneous semi-oceanic climate. The δ18O records varied between catchments – exhibiting both seasonal and interannual patterns during the 13 years of observations. The seasonal amplitude of the precipitation δ18O signal was strongly damped in stream water of catchments dominated by permeable bedrock geology and large storage volumes. This dampening effect was much less pronounced in catchments dominated by marly (and thus less permeable) bedrock with limited storage capacity.


Across the set of 12 nested catchments, stream responses to precipitation were highly variable. Runoff coefficients were typically highest in catchments dominated by less permeable bedrock, as opposed to catchments with permeable bedrock, exhibiting low runoff coefficients. We found that the fractions of new water (Fnew) determined via ensemble hydrograph separation (as per Kirchner, 2019), i.e., water less than two weeks ‘old’, were correlated to bedrock geology. In catchments with mixed (i.e., permeable and less permeable) bedrock types, we noticed an increase in Fnew with discharge – mirroring the domination of groundwater contributions from areas with permeable bedrock during low to medium discharge and the activation of fast flow paths in sectors dominated by less permeable substrate at higher discharge. Findings shed new light on the role of bedrock geology on fundamental catchment functions of water collection, storage, mixing and release. The latter largely determine the responsiveness of catchments to variability and/or changes in climate. This information is key for better anticipating catchment response to future changes in climate.


References:

Kirchner, James W. (2019). Quantifying new water fractions and transit time distributions using ensemble hydrograph separation: theory and benchmark tests. Hydrology and Earth System Sciences, 23, 303–349.

How to cite: Guilhem, T., Christoph J., G., Bernd R., S., Christophe, H., François, B., Loic, L., and Laurent, P.: Physiographic controls on fractions of new water in 12 nested catchments, EGU General Assembly 2024, Vienna, Austria, 14–19 Apr 2024, EGU24-17064, https://doi.org/10.5194/egusphere-egu24-17064, 2024.

EGU24-17342 | Posters on site | HS2.2.1

Evaluating the Vulnerability of Mountain Springs: A Case Study in Italy to Prioritize Conservation and Management Strategies 

Maria Battistel, Lucio D'Alberto, Giovanni Mario, Raffaele Marciano, Giuliano Dreossi, Alessandro Pozzobon, Barbara Stenni, and Mauro Masiol

This research introduces a methodology for evaluating the protection zone of vulnerable mountain springs using an hydrogeochemical approach. Mountain springs play a crucial role in maintaining the ecological balance and ensuring the well-being and resilience of communities residing in mountainous areas. These resources frequently serve as the primary freshwater supply in numerous mountainous regions, their impact extends beyond these areas by catering to diverse applications, including agriculture, farming, hydropower generation, artificial snowmaking, and industrial utilization.

Despite their importance, mountain springs are under increasing threat due to climate change and human activities and thus need to be preserved and managed to ensure a sustainable use and conservation. In this study, we assess the vulnerability of two mountain springs located in a karstic water system in the Northern Italy mountainous region. Particularly we analyze the hydrogeological and hydrogeochemical parameters of the two mountain springs, together with the oxygen and hydrogen isotopic composition (δ18O and δ2H) and d-excess of both the springs and the rainwater of the area. The considered parameters were continuously measured from September 2018 to September 2021. The main goal is to assess the geochemical and hydrological processes that control the springs water quality and the isotopic composition of precipitation and use them for formulating effective springs protection measures.  Our results show that the vulnerability of mountain springs is influenced by various factors that include the use of the resource, the meteorological conditions, and the hydrogeology of the area. We propose a method that integrates the Vulnerability Estimator for Spring Protection Areas index with the use of the water stable isotopes to identify springs’ protection zones that takes in consideration the recharge area of the aquifers feeding the springs. Our study contributes to the development of a framework for assessing the vulnerability of mountain springs and highlights the importance of integrating the geochemical characteristics and the anthropic pressure in the conservation and management of these critical freshwater resources. This study is part of Next Innovation Ecosystem Program "Interconnected Northeast Innovation Ecosystem (iNEST)" supported by the European Union.

How to cite: Battistel, M., D'Alberto, L., Mario, G., Marciano, R., Dreossi, G., Pozzobon, A., Stenni, B., and Masiol, M.: Evaluating the Vulnerability of Mountain Springs: A Case Study in Italy to Prioritize Conservation and Management Strategies, EGU General Assembly 2024, Vienna, Austria, 14–19 Apr 2024, EGU24-17342, https://doi.org/10.5194/egusphere-egu24-17342, 2024.

EGU24-18018 | Orals | HS2.2.1 | Highlight

Isotope applications in the Critical Zone across Europe: the latest activities of the WATSON COST Action 

Daniele Penna and Ilja van Meerveld and the WATSON Extended Core Group

The COST Action WATSON - Water isotopes in the Critical Zone: from groundwater recharge to plant transpiration (CA19120; www.watson-cost.eu) is an European network of researchers and stakeholders who use the stable isotopes of hydrogen and oxygen to trace water fluxes to better understand hydrological, hydrogeological, and ecological systems. WATSON currently includes more than 250 members from 38 countries. The Action aims to integrate and synthesize current interdisciplinary scientific knowledge on the use of the stable isotopes of water to understand the mixing and partitioning of water in the Earth’s Critical Zone. The network is organized into four working groups (WGs) that focus on major scientific challenges: 1) groundwater recharge and soil water mixing processes; 2) vegetation water uptake and transpiration; and 3) catchment-scale residence time and travel times. A fourth WG is in charge of the communication and dissemination activities.

WATSON started in 2020 and is currently in its final year. In this contribution, we synthetize the most recent results and the current and planned activities. WG1 is analyzing different isotope-based methods to calculate groundwater recharge in various environments, preparing training and educational material, and a review paper on isotope methods to assess groundwater recharge and subsurface mixing processes. WG2 is analyzing the data from two Europe-wide isotope sampling campaigns to estimate the sources of water uptake of beech trees and spruce trees. Moreover, WG2 is finalizing a review paper on isotope sampling, extraction, and isotopic analysis methods to study vegetation water use. WG3 is comparing different isotope-based methods to calculate transit times, and preparing training scripts and educational guidelines. WG4 is in charge of many dissemination and communication activities, including the monthly seminar series, updating the website and the social media accounts with the latest information, videos, and technical and scientific material. In addition, all WGs are involved in the preparation of an online, interactive, and open data-map showing locations where isotope samples have been collected.

The WATSON activities will conclude with a large, final online conference, where all WATSON members (and beyond) will be invited to share their knowledge, experience, findings, and recommendations in using stable isotopes to advance our understanding of water fluxes in the Critical Zone.


How to cite: Penna, D. and van Meerveld, I. and the WATSON Extended Core Group: Isotope applications in the Critical Zone across Europe: the latest activities of the WATSON COST Action, EGU General Assembly 2024, Vienna, Austria, 14–19 Apr 2024, EGU24-18018, https://doi.org/10.5194/egusphere-egu24-18018, 2024.

EGU24-18336 | ECS | Posters on site | HS2.2.1

Snowmelt runoff characteristics in an alpine headwater catchment, Northern Japan Alps 

An Nakata, Maki Tsujimura, Mayu Fujino, Yuuri Kawabata, Koichi Sakakibara, and Keisuke Suzuki

It is important to understand the hydrological processes in the alpine headwaters, because the areas sustain the water resources in the down streams. In Japanese high mountain areas affected by Asian monsoon, there is large amount of precipitation in summer season, and is covered by vegetation even in the area with an elevation more than 2,000 m. We focus on snowmelt runoff processes in a Japanese alpine headwater catchment with different land cover conditions.We performed an intensive field monitoring at Mt. Norikura, a stratovolcano mountain, located at the southern end of the Northern Japan Alps with the maximum elevation of 3026m, specifically two headwater catchments, namely NR1 and NR2. The dominant area of NR1 is bare, whereas NR2 is covered by forest dominantly.We observed precipitation, temperature, and runoff of stream from 13th July to 11th October 2023. which includes snowmelt season. In addition, we collected stream water daily, and rainwater, snowmelt water, and spring water at the intervals of approximately two weeks. The concentrations of major inorganic solutions and stable isotopic ratios of oxygen and deuterium are determined on all water samples.The d-excess value of snowmelt water was higher than that of rainwater, whereas SiO2 concentration of groundwater/ spring water was higher than that of rainwater/snowmelt water. Therefore, we applied End Member Mixing Analysis(EMMA)to separate stream water into three components, rainwater, snowmelt water, and groundwater, using d-excess and SiO2 as tracers, focusing on snowmelt season. The EMMA results show that the snowmelt water contribution to the stream water was estimated to be 55% in NR1, whereas that in NR2 was estimates to be 25% in the beginning of snowmelt season, then the snowmelt component decreased gradually. The groundwater contribution to the stream water in NR1 was estimated to be 15%, whereas that in NR2 was estimated to be 75%.There results show that the effect of snowmelt water to stream water varies depending on land cover condition, snow cover and vegetation. The snowmelt component contributed to the stream water, even after the snow cover disappeared. This suggests that the snowmelt water would contribute to the stream water via the shallow groundwater nearby the stream in addition to the direct discharge.

How to cite: Nakata, A., Tsujimura, M., Fujino, M., Kawabata, Y., Sakakibara, K., and Suzuki, K.: Snowmelt runoff characteristics in an alpine headwater catchment, Northern Japan Alps, EGU General Assembly 2024, Vienna, Austria, 14–19 Apr 2024, EGU24-18336, https://doi.org/10.5194/egusphere-egu24-18336, 2024.

EGU24-18631 | Posters on site | HS2.2.1

Origins, flow paths, and mean travel times of water in an Australian alpine catchment 

Willem Vervoort, Claudia Keietel, Robert Chisari, Kellie-Anne Farrawell, and Alexander Buzacott

Understanding water origins, flowpaths, and the timescales over which precipitation becomes streamflow are critical for knowledge of the functioning of catchments. Catchments on the Great Dividing Range along the east coast of Australia are important sources of flows into Murray Darling basin for agricultural and drinking water use. This study collected a unique dataset that includes hydrometric measurements and samples of groundwater, surface water and precipitation between 2016 to 2020 to investigate hydrological processes in the Corin catchment, an alpine catchment in south-eastern Australia. Water samples were analysed for major ion chemistry and stable isotopes in water, and eight samples were selected for analysis of tritium activities. Major ion chemistry and stable isotope values were used to assess the relative contributions of water from two contrasting geological areas of the catchment to streamflow. Streamflow exiting the catchment had a consistently different chemical and isotopic signature compared to the groundwater found in the catchment valley. Instead, streamflow consistently resembled water originating from the slopes of the catchment that are underlain by a relatively younger geology. The mean travel times (MTT) of valley groundwater are likely to be in the decades, while baseflows are estimated to have a MTT of around 7 years. This work demonstrates the power of a multi-tracer approach to unravel the hydrological complexities of headwater catchments in south-eastern Australia.

How to cite: Vervoort, W., Keietel, C., Chisari, R., Farrawell, K.-A., and Buzacott, A.: Origins, flow paths, and mean travel times of water in an Australian alpine catchment, EGU General Assembly 2024, Vienna, Austria, 14–19 Apr 2024, EGU24-18631, https://doi.org/10.5194/egusphere-egu24-18631, 2024.

EGU24-19706 | Posters on site | HS2.2.1

Hydrogeochemical characteristics in an urbanized tropical watershed, Kuala Lumpur area, Malaysia 

Taiga Suzuki, Maki Tsujimura, Mariko Saito, and Sumire Torimaru

There is not enough data on the hydrogeochemical characteristics of groundwater-surface water interaction in the urbanized tropical watersheds. Tropical regions are generally characterized by high annual precipitation and groundwater recharge. Especially the coastal cities of southeastern Asia have larger hydraulic gradient and subsurface water flux due to high topographical gradient in the elevation recharge area. We focus on an urbanized coastal watersheds, Langat River and Klang River watersheds, Kuala Lumpur area, capital city, Malaysia and investigate the hydrogeochemical characteristics of river water and subsurface water with the multi-tracer methods using inorganic dissolved constituents and stable isotope ratios.
    The SiO2 concentrations and (Na+K)/(Ca+Mg) ratio of river water decreases from upstream to midstream in Langat River. The decrease seems to be caused by geological setting, granite in the upper reaches and schist in the middle reaches. The stable isotope ratios (δ18O & δ2H) of the river water are plotted along with the local meteoric water line, and tend to be enriched toward to downstream. In the upstream area, hot springs are distributed along the faults and rivers. They showed Na-HCO3 type quality and much higher SiO2 concentrations than that of river water. There are wetland and lake in the midstream, and they show a significant depletion of d-excess value, suggesting an evaporation from the water surface of lakes and wetland. Na+, Cl- concentrations and stable isotope ratios increase in downstream of Langar River, suggesting seawater intrusion. On the other hand, stable isotope ratios and inorganic dissolved constituents decrease in the downstream of Klang River. This would be caused by the process that deep groundwater with depleted isotopic ratios discharges to the stream.

How to cite: Suzuki, T., Tsujimura, M., Saito, M., and Torimaru, S.: Hydrogeochemical characteristics in an urbanized tropical watershed, Kuala Lumpur area, Malaysia, EGU General Assembly 2024, Vienna, Austria, 14–19 Apr 2024, EGU24-19706, https://doi.org/10.5194/egusphere-egu24-19706, 2024.

EGU24-19892 | ECS | Posters on site | HS2.2.1

Role of Subsurface Water in Stream Runoff in an Alpine Headwater Catchment 

Mayu Fujino, Maki Tsujimura, Yuri Kawabata, An Nakata, Koichi Sakakibara, and Keisuke Suzuki

We conducted field surveys and water sampling from July through October 2023. We compared stream runoff and stream water quality in two watersheds with different land cover in an alpine headwater, Mt. Norikura, Japan. We performed observation in two watersheds, namely NR1 with dominant bare soil surface with limited vegetation cover, 21% of total area, and NR2 dominantly covered by vegetation, 51% in total area. Stream runoff in the NR1 decreased to 0 m after the snowmelt season and runoff occurred only after rainfall, whereas runoff occurred constantly during the observation period in NR2. The stable isotope ratios of hydrogen and oxygen (δ2H and δ¹⁸O) in stream shows variation close to that of precipitation in NR1, whereas those are stable in NR2. These results suggest that the transit time of water in NR2 is longer than that in NR1. The contribution ratio of the groundwater component to the stream runoff during the observation period was higher in NR2 (72.2%) than in NR1 (15.5%). In NR2, the contribution ratio of the groundwater component to stream runoff tends to be lower when API (Antecedent Precipitation Index) is higher. Additionally, the contribution ratio of snowmelt water component increases       with rainfall and decreases promptly. The results indicate that groundwater plays an important role for maintaining stream runoff in NR2 with high coverage of vegetation. Even in NR1, where the contribution ratio of groundwater component to stream runoff is low, the presence of groundwater table is necessary for the discharge of water that is in the subsurface zones.

How to cite: Fujino, M., Tsujimura, M., Kawabata, Y., Nakata, A., Sakakibara, K., and Suzuki, K.: Role of Subsurface Water in Stream Runoff in an Alpine Headwater Catchment, EGU General Assembly 2024, Vienna, Austria, 14–19 Apr 2024, EGU24-19892, https://doi.org/10.5194/egusphere-egu24-19892, 2024.

EGU24-20064 | ECS | Posters on site | HS2.2.1

Constraining stream water source dynamics in a high-latitude catchment using tracer-aided modeling 

Andrea Popp, David Gustafsson, Hjalmar Laudon, Charlotta Pers, Benjamin Fischer, and Tricia Stadnyk

Standard hydrologic model calibration and evaluation primarily rely on streamflow observations, which can hinder an accurate representation of physical processes generating streamflow. Recent studies demonstrate that using tracers such as stable water isotope data in addition to flow observations in model calibration considerably reduces parameter uncertainty and constrains stream water source dynamics (e.g., He et al., 2019; Popp et al., 2021; Stadnyk and Holmes, 2023). In this study, we demonstrate the capabilities of an isotope-aided HYPE model (Lindström et al., 2010) in the Krycklan Catchment Study in Sweden. To this end, we integrated the isoWATFLOOD model's isotope routine (https://github.com/h2obabyts/isoWATFLOOD) into the HYPE model and incorporated extensive time series of stable water isotope data collected from different water sources including precipitation, snow, and groundwater and stream water. Our goal is to deepen the process understanding of snow-dominated catchments undergoing rapid changes due to global warming.

References

He, Z., Unger-Shayesteh, K., Vorogushyn, S., Weise, S. M., Kalashnikova, O., Gafurov, A., Duethmann, D., Barandun, M., and Merz, B. (2019. Constraining hydrological model parameters using water isotopic compositions in a glacierized basin, Central Asia, Journal of Hydrology, 571, 332–348, https://doi.org/ 10.1016/j.jhydrol.2019.01.048.

Lindström, G., Pers, C., Rosberg, J., Strömqvist, J. and Arheimer, B. (2010). Development and testing of the HYPE (Hydrological Predictions for the Environment) water quality model for different spatial scales. Hydrology Research 41.3–4, 295-319.

Popp, A. L., Pardo‐Álvarez, Á., Schilling, O. S., Scheidegger, A., Musy, S., Peel, M., ... & Kipfer, R. (2021). A framework for untangling transient groundwater mixing and travel times. Water Resources Research, 57(4), e2020WR028362.

Stadnyk, T. A., & Holmes, T. L. (2023). Large scale hydrologic and tracer aided modelling: A review. Journal of Hydrology, 129177.

How to cite: Popp, A., Gustafsson, D., Laudon, H., Pers, C., Fischer, B., and Stadnyk, T.: Constraining stream water source dynamics in a high-latitude catchment using tracer-aided modeling, EGU General Assembly 2024, Vienna, Austria, 14–19 Apr 2024, EGU24-20064, https://doi.org/10.5194/egusphere-egu24-20064, 2024.

EGU24-20344 | ECS | Posters on site | HS2.2.1

Isotopic hydrograph separation in the Hydrological Open Air Laboratory, Austria 

Borbála Széles, Ladislav Holko, Juraj Parajka, Christine Stumpp, Michael Stockinger, Jürgen Komma, Gerhard Rab, Stefan Wyhlidal, Katharina Schott, Patrick Hogan, Lovrenc Pavlin, Peter Strauss, Elmar Schmaltz, and Günter Blöschl

Exploring the contributions of new and old water to runoff during precipitation events in agricultural catchments is essential for understanding runoff generation, solute transport, and soil erosion. The aim of this study was to compare two isotope hydrograph separation methods in the Hydrological Open Air Laboratory (HOAL) in Austria, a 66-ha large experimental catchment dominated by agricultural land use. The classical two-component (IHS) and the ensemble isotope hydrograph separation (EIHS) methods were applied to multiple events in May-October of 2013-2018 using δ18O and δ2H. The new water contributions obtained by the IHS during peak flow were compared with the average new water fraction from the EIHS. The results showed that EIHS provided average new water fractions during peak flows (0.46 for δ18O and 0.47 for δ2H) that were close to the averages obtained by IHS (0.48 for δ18O and 0.50 for δ2H). While the EIHS may be a more robust approach compared to IHS, as it relaxes some of the assumptions of IHS and it gives a reliable average of the new water contribution, the IHS can provide useful information on the new water contribution variability for individual events.

How to cite: Széles, B., Holko, L., Parajka, J., Stumpp, C., Stockinger, M., Komma, J., Rab, G., Wyhlidal, S., Schott, K., Hogan, P., Pavlin, L., Strauss, P., Schmaltz, E., and Blöschl, G.: Isotopic hydrograph separation in the Hydrological Open Air Laboratory, Austria, EGU General Assembly 2024, Vienna, Austria, 14–19 Apr 2024, EGU24-20344, https://doi.org/10.5194/egusphere-egu24-20344, 2024.

EGU24-21419 | Orals | HS2.2.1 | Highlight

Quantifying mountainous groundwater age and contributions to streamflow with environmental tracers and integrated hydrologic models 

Erica Siirila-Woodburn, Nicholas Thiros, Michelle Newcomer, Rosemary Carroll, Matthias Sprenger, P. James Dennedy-Frank, Daniel Feldman, Ken Williams, and Eoin Broide

Ongoing atmospheric warming and declines in snow are expected to continue with anthropogenic climate change, with unknown impacts on mountainous water budgets that provide out-sized water resources to lower elevations. In a headwater catchment of the Upper Colorado River Basin (USA), six years of high-frequency groundwater observations at a lower montane well show >1m decline in baseflow water table levels since 2016 with corresponding mean ages from environmental tracers (CFC-12, SF6, 3H, and 4He) ranging from decades to millennia. Meanwhile, 100+ years of observed streamflow with reconstructed precipitation estimates suggests a long-term decline in annual runoff efficiency, but with interannual variability that remains high. This begs the question, is old-aged groundwater buffering streamflow? Using an integrated hydrologic model that allows for three-dimensional groundwater interaction with surface-water and land-surface fluxes of water and energy, we quantify spatio-temporal trends in water partitioning in the East River Watershed over the recent, observational period. Over half of the simulated water years show basin-wide groundwater loss, especially after low-snow years. Simulated runoff efficiency is inversely related to groundwater storage efficiency (what we define as the annual change in subsurface storage expressed as a fraction of precipitation), suggesting an underlying physical mechanism linking the two responses. We test a conceptual model where relative declines in groundwater storage accompany either a) new water input (precipitation or snowmelt) bypassing groundwater, instead feeding streamflow and/or b) groundwater reserves that are consistently being drained, also effectively subsidizing streamflow. With a Lagrangian particle tracking method, we quantify the groundwater age distributions that contribute to streamflow under different conditions. Results show substantial old-aged groundwater exports that are invariant to contemporary snow or melt conditions. This is unlike the young-aged groundwater contributions to streams, which are more transient. Numerical experiments of +2.5 and +4 degrees C of surface air temperature show higher rain-to-snow fractions, higher evapotranspiration rates, and losses to total streamflow yield. Together, these changes result in declines in runoff efficiency by ~2-3% per degree C of warming. Notably, the model shows disproportionate impacts to the highest elevations of the watershed with warming (10-30% change in water table depth, with local changes as high as 5 m), suggesting these regions will be most impacted by a warmer climate. Ongoing work uses the transient particle tracking age distributions, precipitation and snow stable isotope measurements, and the convolution integral to predict streamwater stable isotope dynamics, which can be compared to measurements from the past ~6 years at biweekly frequencies. This comparison will better constrain model performance and improve understanding of future water budget partitioning under warming and low-to-no snow conditions.

How to cite: Siirila-Woodburn, E., Thiros, N., Newcomer, M., Carroll, R., Sprenger, M., Dennedy-Frank, P. J., Feldman, D., Williams, K., and Broide, E.: Quantifying mountainous groundwater age and contributions to streamflow with environmental tracers and integrated hydrologic models, EGU General Assembly 2024, Vienna, Austria, 14–19 Apr 2024, EGU24-21419, https://doi.org/10.5194/egusphere-egu24-21419, 2024.

EGU24-21802 | Orals | HS2.2.1

Variation of δD, and δ18O in springs and precipitation of Takoli gad watershed Uttarakhand in the lesser Himalayas 

Nitish Kumar, Satyabrata Das, and Abhayanand Singh Maurya

The environmental isotopes (δD and δ18O) in natural water play a crucial role as indicators for hydrological processes, serving as a significant method to track the moisture sources in mountainous watersheds. The current study presents the isotopic compositions (δD, and δ18O) of the springs, streams, and rainwater samples from the Takoli Gad catchment, Uttarakhand in the Lesser Himalayas. Our results show that the spring, and stream samples, with an average δD and δ18O values of (-60‰ ± 4.11‰) and (-8.81‰ ± 0.55‰), respectively, represent the most depleted isotopic compositions during the monsoon season. During post-monsoon and pre-monsoon seasons, isotopic compositions are enriched with an average of (δ18O = -8.44 ± 0.43‰, δD: -57.79 ± 2.43‰) and (δ18O = -8.10 ± 0.42‰, δD: -55.7 ± 3.07‰), respectively. The depleted isotopic compositions during the monsoon period suggest the impact of monsoon precipitation on spring waters. Additionally, evaporation from the spring water has led to an enrichment of isotopic compositions during the pre-monsoon season. This conclusion is reinforced by the highest d excess values observed in spring water during the monsoon (10.27‰ ± 1.47‰) and the lowest during the pre-monsoon (9.12‰ ± 1.75‰). Furthermore, The rainwater samples collected during the winter season have the highest d excess values (13.7‰ ± 5.4‰) in comparison to the same during pre-monsoon (9.9‰ ± 4‰) and monsoon period (9.2‰ ± 2‰). These highest d values of the precipitation during winter mostly correspond to the westerlies' effect. The mass balance equation, including δ18O and d-excess values, estimates that approximately 83% of the spring water budget is contributed by monsoon precipitation. Similarly, the δ18O-enabled altitude effect (0.06‰/100m) is found to be within range of other Himalayan catchments. However, the same is ~5 times lower in comparison to the altitude effect estimated using the precipitation of the region (0.3‰/100m). Also, our study suggests a significant role of evaporation in altering the δ18O-associated altitude effect in precipitation. Finally, the rainout percentage approximation (using both δ18O and δD compositions of the rainfall) estimates that ~32% ± 4% of the moisture is being removed from the cloud as the same is traversing in the region.

How to cite: Kumar, N., Das, S., and Maurya, A. S.: Variation of δD, and δ18O in springs and precipitation of Takoli gad watershed Uttarakhand in the lesser Himalayas, EGU General Assembly 2024, Vienna, Austria, 14–19 Apr 2024, EGU24-21802, https://doi.org/10.5194/egusphere-egu24-21802, 2024.

EGU24-528 | ECS | Posters on site | HS2.2.3

The effects of future climate-induced adaptation of the root-zone storage capacity on modeled streamflow dynamics 

Magali Ponds, Markus Hrachowitz, Marie-Claire ten Veldhuis, Gerrit Schoups, Harry Zekollari, Sarah Hanus, and Roland Kaitna

Hydrological models play a vital role in evaluating future changes in streamflow. Despite the strong awareness of non-stationarity in hydrological system characteristics, model parameters are typically assumed to be stationary and derived through calibration on past conditions. Integrating the dynamics of system change in these models remains challenging due to uncertainties surrounding changes in future climate and ecosystems.
Nevertheless, studies show that ecosystems evolve in response to prevailing climate conditions. There is increasing evidence that vegetation adjusts its root zone storage capacity – considered a critical parameter in hydrological models – to prevailing hydroclimatic conditions. This adaptation of the root zone to moisture deficits is central to the water balance method. When combined with long-term water budget estimates from the Budyko framework, the water balance method offers a promising approach to describe future climate-vegetation interactions within process-based hydrological models

Our study provides an exploratory analysis of the role of non-stationary hydrological model parameters for six catchments in the Austrian Alps. More specifically, we investigate future changes in the root zone storage and their consequent impact on modeled streamflow. Using the water balance method, we derive climate-based parameter estimates of the root zone storage capacity under historic and projected future climate conditions. These climate-based estimates are then implemented in our hydrological model to assess their consequent impact on modeled past and future streamflow.
Our findings show that climate-based parameter estimations significantly narrow the parameter ranges linked to root zone storage capacity. This stands in contrast to the broader ranges obtained solely through calibration. Moreover, using projections from 14 climate models, our findings indicate a substantial increase in the root zone storage capacity parameters across all catchments in the future, ranging from +10% to +100%. Despite these alterations, the model performance remains relatively consistent when evaluating past streamflow, independent of using calibrated or climate-based estimations for the root zone storage capacity parameter. Additionally, no significant differences are found when modeling future streamflow when including future climate-induced adaptation of the root zone storage capacity in the hydrological model. Variations in annual mean, maximum, and minimum flows remain within a 5% range, with slight increases found for monthly streamflow and runoff coefficients.

In summary, our research shows that although climate-induced changes in root zone storage capacity occur, they do not notably affect future streamflow projections in the Alpine catchments under study. This suggests that incorporating a dynamic representation of the root zone storage capacity parameter may not be crucial for modeling streamflow in humid and energy-limited catchments. However, our observations indicate relatively larger changes in root zone storage capacity within the less humid catchments studied, corresponding to higher variations in modeled future streamflow. This points to a potential higher significance of dynamically representing root zone characteristics in arid regions and underscores the necessity for further research in these areas.

How to cite: Ponds, M., Hrachowitz, M., ten Veldhuis, M.-C., Schoups, G., Zekollari, H., Hanus, S., and Kaitna, R.: The effects of future climate-induced adaptation of the root-zone storage capacity on modeled streamflow dynamics, EGU General Assembly 2024, Vienna, Austria, 14–19 Apr 2024, EGU24-528, https://doi.org/10.5194/egusphere-egu24-528, 2024.

EGU24-973 | ECS | Orals | HS2.2.3

Model development for a water supply catchment in southeast Brazil 

Ana Clara de Sousa Matos, Marvin Höge, Thiago Victor Medeiros do Nascimento, Gustavo de Oliveira Corrêa, Francisco Eustáquio Oliveira e Silva, and Fabrizio Fenicia

Brazil faced a severe water crisis during the mid-2010s, resulting in water scarcity and water rationing in various cities. The Belo Horizonte Metropolitan Region was seriously affected. It is located in the southeastern part of the country and home to roughly 5 million people (Costa et al., 2015) and mining industry. The region’s water supply relies on a complex and integrated system, which combines a water abstraction at the Velhas river and three reservoirs. One of these reservoirs, named Serra Azul, reached a minimum of only 5,4 % of its total capacity during the crisis. Here, we demonstrate tools for improving the water management in this area, by developing a hydrological model suitable for mountainous regions with tropical climates. Our case study was the Serra Azul reservoir’s well-gauged catchment. We selected 12 gauges that cover several head waters and rivers section in the 260 km² area.  We used these discharge data (3-5 years), and available static catchments' attributes (e.g. subsurface properties), to adapt a flexible framework for conceptual hydrological modeling. Hence, we identified a suitable model structure using SUPERFLEX (Fenicia et al., 2014). The findings show that by including soil type, lithology and land cover as explanatory variables in the model, we obtained significant improvements in performance, e.g. the correlation between the base flow index estimated for observed and simulated time-series increased from 0.40 to 0.76. We also accounted for groundwater contributions to the streamflow, modelling the relation between the percentage of porous aquifer within each catchment and its flow magnitude. Thereby, we improved the average NSE and timeseries correlation considerably.  Overall, we successfully set up a parsimonious hydrologic model for water resources management in a region that is notoriously difficult to predict, where anthropic activities such as mining and agriculture have a decisive impact on the water cycle.


References:

Costa et al. Caracterização e Quadros de Análise Comparativa da Governança Metropolitana no Brasil: análise comparativa das funções públicas de interesse comum (Componente 2)-RM do Rio de Janeiro (Relatório de Pesquisa). (2015). Rio de Janeiro: Institute for Applied Economic Research–Ipea.

Fenicia et al. "Catchment properties, function, and conceptual model representation: is there a correspondence?." Hydrological Processes 28.4 (2014): 2451-2467.

How to cite: de Sousa Matos, A. C., Höge, M., Medeiros do Nascimento, T. V., de Oliveira Corrêa, G., Oliveira e Silva, F. E., and Fenicia, F.: Model development for a water supply catchment in southeast Brazil, EGU General Assembly 2024, Vienna, Austria, 14–19 Apr 2024, EGU24-973, https://doi.org/10.5194/egusphere-egu24-973, 2024.

ParFlow CONCN model is the first integrated groundwater-surface water modeling platform over the mainland of China with a resolution of 30-arcsec and a depth of 492 m. With the flexibility of reconstruction and prediction of groundwater and surface water states and fluxes, it is undoubtedly an efficient tool for scientific understanding on water cycle and decision making on water resources and thus to tackle China’s water crisis in the changing world. Nonetheless, the CONCN model may have broader significances to the hydrologic community. Model evaluation and comparison is a common practice in the geoscientific modeling communities, such as those of land surface and earth system models. Due to the challenges in aquifer parameterization and the expensive computing requirement, high-resolution, large-scale, 3D groundwater modeling or integrated hydrologic modeling with 3D groundwater component is still under development though becoming more active in the past decade. Several national-scale such integrated hydrologic models, for example, ParFlow models over CONUS, west Africa, and Germany, have been built at 1 km resolution or higher with satisfying performances. However, the wide extension of modeling in this category to other places worldwide or to global scale is limitedly explored, preventing the evaluation of modeling workflows at different places and comparison with models using other parameterization schemes. Here, we demonstrate the construction and the first-phase evaluation of CONCN model by leveraging global datasets. Global permeability (GLHYMPS 1.0) and hydrography (MERIT Hydro) products were helpful to build the model while global water table depth (Fan et al., Science, 2013 and Zeng et al., JAMES, 2018) and streamflow (GRADES-HYDRDL and CNRD v1.0) products were adopted to preliminarily evaluate the simulation results. In this data-poor modeling area, both the construction and evaluation of the CONCN model are impossible about five years earlier as most of these global datasets did not exist. Therefore, the CONCN model can be one of the pioneers to evaluate and then to improve the current workflow of the existing models and address the challenges in new modeling areas with hydrogeology, hydrography, and climatology unseen in existing models. We also expect our dilemma caused by lacking observations as many other modelers in China can push the data-sharing to constrain hydrologic models and to motivate the collaboration such as model intercomparison in the Chinese hydrologic modeling community, which are well developed in the global community.

How to cite: Yang, C., Condon, L., and Maxwell, R.: Building and evaluating the high-resolution, integrated groundwater-surface water ParFlow modeling platform of continental China (CONCN): leveraging global datasets in a data-poor region   , EGU General Assembly 2024, Vienna, Austria, 14–19 Apr 2024, EGU24-2600, https://doi.org/10.5194/egusphere-egu24-2600, 2024.

EGU24-2729 | Orals | HS2.2.3

Study on the collapse characteristics and threshold behavior of the subsurface stormflow mechanism 

Yuanxin Song, Yanjun Zhang, Shanqi Li, and Jiahui Yang

Abstract: Subsurface stormflow is the dominant runoff generation mechanism during certain flash flood events. The collapse characteristics and threshold behavior are critical to the transition from the slow runoff stage to the rapid runoff stage and the relevant study is not only essential for hydrology theory but also for flash flood disaster prevention. In recent years, efforts have been made to explore the common principles of hydrological processes under strong spatial heterogeneity, but findings from field experiments and numerical studies were difficult to apply to the modeling process. Furthermore, we have yet to develop a deeper understanding of the mechanisms for the impact of complex factors on subsurface stormflow and lack a comprehensive understanding of the formation mechanism of threshold.
This presentation discusses how we plan to address this research gap. Firstly, around the phenomenon of “burst-block-burst” in the subsurface stormflow runoff generation process, rainfall-runoff simulation experiments were carried out and factor analysis was conducted to determine the main influencing factors of subsurface stormflow runoff generation. The main influencing factors include soil texture factors, collapse state factors, initial state factors, and other factors, and the influence of these four types of factors decreases in turn. In the second step, we constructed a field hydrological station in the Huanggou Watershed located in Hubei Province, China, collected the rainfall-runoff data, and found that the subsurface stormflow process shows a three-stage-double-threshold behavior: the water storage stage, the initial flow stage, and the rapid flow stage. In the third step, synthesizing the main influencing factors, the three-stage double-threshold process was quantified. Further, the three-stage subsurface stormflow-based model (TSSM) was developed and applied to the Huanggou Hillslope and the Huanggou Watershed. The results show that TSSM performed well, with NSEs of 0.82 and 0.67 in the calibration and verification periods of the Huanggou slope, and NSEs of 0.76 and 0.74 in the calibration and verification periods of the Huanggou Watershed, respectively.
This study elucidated the collapse characteristics and threshold behavior of subsurface stormflow and developed an effective simulation model, which contributes to increasing our understanding of three-stage subsurface stormflow and is beneficial for hydrologists to develop more realistic hydrological models.

Keywords: Subsurface stormflow; Collapse characteristics; Threshold behavior; Three-stage subsurface stormflow mechanism; TSSM

How to cite: Song, Y., Zhang, Y., Li, S., and Yang, J.: Study on the collapse characteristics and threshold behavior of the subsurface stormflow mechanism, EGU General Assembly 2024, Vienna, Austria, 14–19 Apr 2024, EGU24-2729, https://doi.org/10.5194/egusphere-egu24-2729, 2024.

To represent the physical processes at hillslope scales for hyper-resolution land surface modeling, we propose a hierarchical, catchment-based spatial tessellation method. The land surface is divided into a hierarchical structure: catchments, height bands along hillslopes within a catchment, and land cover patches within a height band. This catchment-based structure explicitly represents hillslope drainage networks and can be applied at various resolutions determined by a pre-defined maximum height band size. The proposed tessellation method is superior to the conventional grid-based structure in representing land surface heterogeneity, resulting in a higher aggregation skill through the height band representation. The spatial variations in air temperature, leaf area index, saturated soil hydraulic conductivity, and soil porosity are generally lower within a height band than those in a conventional rectangular grid, reflecting the nature of topographic control on climate, vegetation, and soil distribution. The improvement in aggregation skill depends on resolutions and terrain slope angle, more pronounced at 1/6° model resolution and over steeper terrains. Finally, we demonstrate that our proposed catchment-based structure performs better than the grid-based structure through modeling tests over the Columbia River basin at resolutions of 1/2°, 1/6°, and 1/20° and a global test at 1/2° using the ILAMB model evaluation metrics.

How to cite: Lina, H. and Shupeng, Z.: A Catchment-Based Hierarchical Spatial Tessellation Approach to a Better Representation of Land Heterogeneity for Hyper-Resolution Land Surface Modeling , EGU General Assembly 2024, Vienna, Austria, 14–19 Apr 2024, EGU24-3343, https://doi.org/10.5194/egusphere-egu24-3343, 2024.

EGU24-3356 | ECS | Posters on site | HS2.2.3

Effects of watershed subdivision based on soil and land use inputs on SWAT performance in a coastal Mediterranean catchment 

Mathilde Puche, Magali Troin, Dennis Fox, and Paul Royer-Gaspard

Assessing the benefits of increasing the discretization level of semi-distributed hydrological models is of great importance for hydrological applications. The impact of spatial discretization on model performance is investigated with the use of the Soil and Water Assessment Tool (SWAT) model when applied on a Mediterranean watershed (Argens, France). This study aims to explore how the spatial discretization (number of sub-basins and of hydrological response units (HRUs)) affects the model’s performance at simulating daily streamflows, and if the choice of soil and land use input datasets modifies model accuracy. Low and moderate resolution soil (5 km and 250 m) and land use (400 m and 100 m) maps are considered. Four SWAT input sets are created, each corresponding to a different combination of land use and soil datasets. Each input set is used to build 17 configurations with an increasing number of sub-basins (4, 12, and 18) and HRUs (from 4 to 320). The 68 models (4 input sets x 17 configurations) are evaluated on the 2001-2021 period using the Kling-Gupta efficiency (KGE) metric. Results indicate no influence of the number of sub-basins on SWAT performance. However, increasing the number of HRUs leads to a significant performance decrease (from 0.13 to 0.26 of KGE loss), regardless of the number of sub-basins and input datasets. The SWAT model is found to be more sensitive to soil dataset than to land use dataset. Despite significant differences in hydrological soil groups between the two soil maps, no clear impact on the derived hydrological properties is observed, such as the curve number. The observed decline in SWAT performance with an increasing number of HRUs is attributed to the calibration process rather than the soil and land use input datasets. This study suggests that, when the calibration of the semi-distributed SWAT model is not performed at the finer spatial HRU level, an increase in the spatial discretization does not lead to an improvement of the overall model accuracy.  Therefore, minimizing the number of HRUs during the watershed subdivision is recommended for getting optimal simulations of streamflow while dealing with the computational efficiency of SWAT.

How to cite: Puche, M., Troin, M., Fox, D., and Royer-Gaspard, P.: Effects of watershed subdivision based on soil and land use inputs on SWAT performance in a coastal Mediterranean catchment, EGU General Assembly 2024, Vienna, Austria, 14–19 Apr 2024, EGU24-3356, https://doi.org/10.5194/egusphere-egu24-3356, 2024.

EGU24-4058 | ECS | Orals | HS2.2.3

SCS-CN parameter determination from observed rainfall runoff data. A critical review. 

Konstantinos Soulis, Stergia Palli Gravani, and Dionissios Kalivas

One the most difficult challenges in applied hydrology is predicting runoff in ungauged or poorly gauged watersheds. Thus, simple approaches for runoff estimation are especially useful in hydrologic applications. A simple, well established, and widely used technique for predicting the direct runoff depths of rainfall events is the Soil Conservation Service - Curve Number (SCS-CN) method. Due to its straightforward but well-proven approach, readily available and well documented environmental inputs, and incorporation of numerous variables influencing runoff generation into a single CN parameter, it quickly rose to prominence among engineers and practitioners. Tables can be used to identify the CN parameter values corresponding to prevailing soil, land cover and land management conditions. However, it is always better to estimate the CN value using observed rainfall-runoff (P-Q) data when available. Estimating appropriate CN values for additional soil – land cover conditions and additional regions is also critical for extending and updating the method’s documentation given that the SCS-CN approach is extremely sensitive to variations in the CN values.

However, even when the CN value is determined from measured P-Q data, the estimated CN values vary substantially from storm to storm on any given watershed. For this reason, various methods to estimate the CN value characterizing each watershed have been proposed up to know, and many theories on the reasons behind the observed relationships between CN and P for each watershed have been stated. Though, after many years of research, there isn’t still a unique agreed method to estimate the CN values characterizing a watershed or a soil-land cover complex, while the proposed methods lead to different CN values and in many cases neglect spatial variability. Further, an increasing number of modified SCS-CN versions are continuously developed, and new parameters are introduced complicating the situation even more.

Accordingly, this study attempts to collect, categorize, and systematically analyze the huge number of studies on SCS-CN method published in the last 30 years. We selected this period as 30 years ago, in 1993, R.H. Hawkins published his emblematic study on the “Asymptotic determination of runoff curve numbers from data” (J. Irrigat. Drain. Div. ASCE, 119(2): 334–345). In this review study, specific attention is given to the methods focusing on CN value determination from measured P-Q data. The advantages and limitations of the various approaches are investigated, as well as trends and gaps in existing literature. The analysed methods are classified and the main paths are identified. Based on the obtained results, conclusions on the current status are being made, and the more promising approaches are highlighted.  Then, ideas on future research pathways towards the target of a unified CN values determination approach are discussed.

How to cite: Soulis, K., Palli Gravani, S., and Kalivas, D.: SCS-CN parameter determination from observed rainfall runoff data. A critical review., EGU General Assembly 2024, Vienna, Austria, 14–19 Apr 2024, EGU24-4058, https://doi.org/10.5194/egusphere-egu24-4058, 2024.

EGU24-4385 | ECS | Orals | HS2.2.3

Can we identify dominant hydrological mechanisms in ungauged catchments? 

Cristina Prieto, Nataliya Le Vine, Dmitri Kavetski, Fabrizio Fenicia, Andreas Scheidegger, and Claudia Vitolo

Hydrological modelling of ungauged catchments, which lack observed streamflow data, is an important practical goal in hydrology. A major challenge is to identify a model structure that reflects the hydrological processes relevant to the catchment of interest. Paraphrasing a well-known adage, “all models are wrong, but some model-mechanisms (process representations) might be useful.”

We extend a method previously introduced for mechanism identification in gauged basins, by formulating the Bayesian inference equations in the space of (regionalized) flow indices principal components and by accounting for posterior parameter uncertainty. We use a flexible hydrological model to generate candidate mechanisms and model structures. Then, we use statistical hypothesis testing to identify the "dominant" (more a posteriori probable) hydrological mechanism. We assume that the error in the regionalization of flow indices principal components dominates the error of the hydrological model structure.

The method is illustrated in 92 catchments from northern Spain. We treat 16 out of the 92 catchments as ungauged. We use 624 model-structures from FUSE (flexible hydrological model framework). The case study includes real data and synthetic experiments.

The findings show that routing is among the most identifiable processes, whereas percolation and unsaturated zone processes are the least identifiable. The probability of making an identification (correct or wrong), remains stable at ~25%, both in the real and in the synthetic experiments. In the synthetic experiments, where the “true” mechanism is known, we can evaluate the reliability, i.e., the probability of identifying the true mechanism when the method makes an identification. Reliability varies between 60%-95% depending on the magnitude of the combined regionalization and hydrological error. The study contributes perspectives on hydrological mechanism identification under data-scarce conditions.

Prieto et al. (2022) An Exploration of Bayesian Identification of Dominant Hydrological Mechanisms in Ungauged Catchments, WRR58(3), doi:10.1029/2021WR030705.

How to cite: Prieto, C., Le Vine, N., Kavetski, D., Fenicia, F., Scheidegger, A., and Vitolo, C.: Can we identify dominant hydrological mechanisms in ungauged catchments?, EGU General Assembly 2024, Vienna, Austria, 14–19 Apr 2024, EGU24-4385, https://doi.org/10.5194/egusphere-egu24-4385, 2024.

EGU24-5237 | Posters on site | HS2.2.3

Exploring the Reciprocity Behavior Distributions in Space for Hydrogeological Parameters 

Zi-Jun Hsu, Hong-Ru Lin, and Jet-Chau Wen

Past studies of hydrogeological parameters of aquifers have not using drawdown data from multiple sets of sequential pumping tests (SPT) at the same site to characterize the interaction of hydrogeological parameters (such as transmittance, T and storage coefficient, S) distribution field. Therefore, the purpose of this study was to use the same site (well site at the northeast corner of Yunlin University of Science and Technology, Douliu City, Yunlin County) collected for many years (20xx,20xx..year, five groups in total) of SPT drawdown data. First, the interaction between the drawdown water levels from the same observation well and five sets of pumping tests was analyzed. Afterwards, this study used the numerical method of (hydraulic tomography, HT) to analyze the leakage data of five groups of SPTs., reverse calculation the distribution of T and S of five groups of SPT and a spatial comparison was performed, comparing the interaction between 5 sets of T and S distribution fields, discuss in different time and space background, interaction of distribution field of local hydrogeological parameters.

How to cite: Hsu, Z.-J., Lin, H.-R., and Wen, J.-C.: Exploring the Reciprocity Behavior Distributions in Space for Hydrogeological Parameters, EGU General Assembly 2024, Vienna, Austria, 14–19 Apr 2024, EGU24-5237, https://doi.org/10.5194/egusphere-egu24-5237, 2024.

Hydrological losses play a significant role in determining the runoff coefficient, influencing the amount of precipitation that ultimately contributes to surface runoff. These losses are influenced by various characteristics, including rainfall, the physical and geographical attributes of the watershed (such as slope and land use), and the soil moisture content within the watershed.

Here, we evaluate the effect of the variability of the loss function on the amount of simulated runoff and the runoff coefficient in specific watersheds in Iran. The investigation entails the assessment of two distinct conditions. First, the runoff coefficient is calculated under the assumption of a constant loss, utilizing the φ index. Second, a variable loss function, derived from a soil moisture algorithm, is employed to determine the runoff coefficient.

Our analysis shows that the assumption of a variable loss function yields more realistic results. When the variable losses are considered, the simulated runoff coefficient is closer to the observed values and determines the runoff coefficient for all months, including those characterized by low rainfall. The constant loss φ index exhibits two significant practical limitations: the overestimation of runoff coefficient values, and an inability to estimate runoff coefficient during months with low rainfall. The study emphasizes the need for a variable loss function to provide more realistic results. Our findings suggest that utilizing the variable loss function within the soil moisture algorithm produces more accurate results. Thus, the application for improved forecasting of rainfall and runoff processes is recommended.


How to cite: Eslami, Z., Abdollahi, K., and Kirchner, J.: Analyzing the fixed or variable effect of considering hydrological loss functions on the runoff coefficient in continuous modeling, EGU General Assembly 2024, Vienna, Austria, 14–19 Apr 2024, EGU24-5982, https://doi.org/10.5194/egusphere-egu24-5982, 2024.

EGU24-6789 | Posters on site | HS2.2.3

High-resolution Spatial Mapping of Runoff Prediction for Micro-scale Surface Rainwater Harvesting 

Dongryeol Ryu, Sri Priyanka Kommula, Bharat Lohani, and Stephan Winter

Spatially distributed runoff information is one of the most critical inputs to determining suitable locations of rainwater harvesting (RWH) structures. The majority of hydrological assessments for siting RWH structures rely on empirical formula, such as the Soil Conservation Service – Curve Number method that combines soil type, land covers, land use practices, surface conditions, and antecedent moisture conditions with a weak basis on hydrological processes. In addition, runoff generation by topography is considered separately through the computation of flow accumulation.  As a result, the current practice of determining suitable RWH locations is done using arbitrary scores rather than the actual spatiotemporal estimate of runoff.

The present study employs a topography-based hydrological model, TOPMODEL, to explicitly generate runoff for an experimental catchment of 1800 ha located in Haryana, India. The catchment has been subdivided into 102 sub-catchments where sub-catchment-scale runoff was calculated using daily forcing data of 40 years (1980 - 2020) with other static inputs such as soil and topography data.  For topography input, a 1-m resolution digital elevation model (DEM) collected by a Light Detection and Ranging (LiDAR) was used. The input variables of the model were calibrated using ground-based discharge values.

The daily sub-catchment-scale runoff from TOPMODEL was aggregated to monthly, seasonal, and annual time scales to produce more detailed picture of water availability for harvest over wet and dry seasons. Finally, the runoff was converted to grid-based values using the flow accumulation scheme widely used on GIS tools. The final grid-based map at 1-m resolution contains the runoff information across the entire catchment at monthly, seasonal and annual time scales. The improved spatio-temporal representation of runoff using TOPMODEL in combination with flow accumulation scheme offers enhanced assistance to designing RWH structures tailored by the actual water volume available at candidate locations and its seasonal and interannual variability.

How to cite: Ryu, D., Kommula, S. P., Lohani, B., and Winter, S.: High-resolution Spatial Mapping of Runoff Prediction for Micro-scale Surface Rainwater Harvesting, EGU General Assembly 2024, Vienna, Austria, 14–19 Apr 2024, EGU24-6789, https://doi.org/10.5194/egusphere-egu24-6789, 2024.

Flash floods, characterized by rapid streamflow response to rainfall, pose a significant natural hazard, particularly in small tropical watersheds (< 40 km2). Understanding the role of rainfall event characteristics, including amount, intensity, and spatial structure, is crucial for addressing and predicting flash floods. This study employs the WRF-Hydro® model with high-resolution (250-m, hourly) rainfall data and the Random Balance Designs – Fourier Amplitude Sensitivity Testing (RBD-FAST) method to investigate how rainfall impacts streamflow, specifically peak flow events, in seven watersheds on Oʻahu, USA.

Analyzing storm events from 2015 to 2020, we examined peak flow responses to corresponding rainfall event characteristics and estimated their contributions to model efficiency. In addition, (1) random redistribution of rainfall and (2) spatial shifting of rainfall were experimented with to assess the sensitivity of peak flow to rainfall event characteristics. Not only the rainfall amount and intensity but heavy rainfall areas (>= 25 mm) within an event also exerted a significant impact on peak flow, while other spatial features contributed varying degrees of influence. Notably, spatially shifting rainfall for at least 250-m in any direction highly affected event peak streamflow, emphasizing the importance of rainfall amount, intensity, heavy rainfall areas, total rainfall areas, and connectivity among rainfall areas.

Given the significance of rainfall's spatial heterogeneity, these findings underscore the benefits of incorporating rainfall spatial characteristics in probabilistic flood forecasting and the mitigation of flood risks. This research contributes valuable insights for enhancing flood prediction strategies in small tropical watersheds, providing a basis for informed decision-making and risk management.

How to cite: Huang, Y.-F. and Tsang, Y.: Sensitivity analysis of streamflow responses to varied rainfall spatial patterns in small tropical watersheds, EGU General Assembly 2024, Vienna, Austria, 14–19 Apr 2024, EGU24-7129, https://doi.org/10.5194/egusphere-egu24-7129, 2024.

Recent advances in the application of machine learning techniques to estimate soil hydraulic properties using soil datasets have shown promising results. PedoTransfer Functions (PTFs) can facilitate the mapping of the complex relationship between soil properties and soil hydraulic properties, e.g., lateral hydraulic conductivity—a necessity for estimating lateral subsurface flow in spatially distributed hydrological models like wflow_sbm. The vertical-to-horizontal saturated hydraulic conductivity ratio (fKh0) is crucial for model calibration, but an established PTF is currently lacking. Our objective is to investigate the potential of ML algorithms in estimating PTFs for fKh0 prediction. First, optimized fKh0 across Great Britain (GB) resulting from a sensitivity analysis of the wflow_sbm model (Weerts et al., 2024) were used to train two ML algorithms; Random Forest (RF) and Boosted Regression Trees (BRT), using seven soil parameters from SoilGrids v1.0. Both algorithms effectively predicted fKh0 of 92 subbasins (i.e., test set of 25%) with high performance as compared against the optimized values, and RF slightly outperformed BRT. As a next step, we compared wflow_sbm simulated discharge results using uncalibrated fKh0 (default value of 100) and predicted values. The predictions notably improved wflow_sbm predictive accuracy by rising the median KGE from 0.55 (using uncalibrated fKh0) to 0.75 (using predicted fKh0). Following, we generated two globally distributed fKh0 maps, allowing us to further investigate the transferability of the ML-based PTFs. Therefore, we tested the predicted fKh0 across 559 gauge stations within the Loire basin in France. The utilization of either RF or BRT improved performance in around 75% of these subbasins with a KGE that was, on average, 0.06 higher. Furthermore, fKh0 prediction uncertainty and the impact of model spatial resolution were further analyzed. In conclusion, our study demonstrates the potential of ML methods to find relationships between soil properties and (model) soil hydraulic properties, which assists in parameter estimates for distributed hydrological models in gauged and ungauged basins.

How to cite: Ali, A. M., Imhoff, R. O., and Weerts, A. H.: Machine learning for predicting spatially variable lateral hydraulic conductivity: a step towards efficient hydrological model calibration and global applicability, EGU General Assembly 2024, Vienna, Austria, 14–19 Apr 2024, EGU24-8347, https://doi.org/10.5194/egusphere-egu24-8347, 2024.

EGU24-8809 | ECS | Posters on site | HS2.2.3

The potential of empirical mode decomposition to evaluate hydrological model simulations 

Svenja Hoffmeister and Erwin Zehe

We explore the potential of the empirical mode decomposition (EMD), a signal-processing method, to evaluate hydrological model simulations. Usually, hydrological models are assessed in the time domain observing and comparing residuals on a point-to-point basis. An additional model evaluation in the frequency domain might provide useful and complementary insights about the model’s capability to reproduce dynamic system behaviour. EMD separates a signal (e.g. a soil moisture time series) into fast and slow oscillations based on a sifting process, in which subtracting the signals moving average from itself reveals the highest frequency oscillation. This allows for instance to analyse phase shifts of different signature modes (e.g. daily fluctuations) in different depths and by that to make assumptions on soil hydraulic properties such as the conductivity. Naturally, a model will always miss high-frequency components of the “real” signal as measurement devices used as model input already act as a filter of such. However, the ability to capture the lower frequency remains interesting as they include relevant hydrological processes. Advantages of EMD over traditional methods like Fourier or wavelet transform are that no prior assumptions are needed and that it works well for nonlinear or non-stationary signals.

We test the EMD method on soil moisture and matric potential time series of observations and a process-based hydrological model extracted for the same site and compare the phase shifts and spectral components. We want to test whether metrics such as the RMSE of frequency spectra help to further compare and elucidate different signals. First results underpin the potential of including EMD as a tool to quantify models from a different perspective. We observe difference in observation and model frequencies of soil water time series and can related certain intrinsic modes to hydrological processes.

How to cite: Hoffmeister, S. and Zehe, E.: The potential of empirical mode decomposition to evaluate hydrological model simulations, EGU General Assembly 2024, Vienna, Austria, 14–19 Apr 2024, EGU24-8809, https://doi.org/10.5194/egusphere-egu24-8809, 2024.

EGU24-9070 | Orals | HS2.2.3

Virtual Hydrological Laboratories to develop the next generation of conceptual models and support decision-making under change 

Dmitri Kavetski, Mark Thyer, David McInerney, Hoshin Gupta, Seth Westra, Holger Maier, Anthony Jakeman, Barry Croke, Daniel Partington, Margaret Shanafield, Craig Simmons, and Christina Tague

The ability of contemporary hydrological models to serve as a basis for credible prediction and decision making is increasingly challenged – especially as hydrological systems are pushed outside the envelope of historical experience. Conceptual models are the most common type of surface water hydrological model used for decision support due to reasonable performance in the absence of change, ease of use and computational speed that facilitate scenario, sensitivity and uncertainty analysis. Hence, conceptual models arguably represent the current "shopfront" of hydrological science as seen by practitioners. However, these models have notable limitations in their ability to resolve internal catchment processes and subsequently capture hydrological change. New thinking is needed to confront the challenges faced by the current generation of conceptual models in dealing with a changing environment. We argue that the next generation of conceptual models should combine the parsimony of conceptual models with our best available scientific understanding. We propose a strategy to develop such models using multiple hydrological lines of evidence. This strategy includes using appropriately selected physically-resolved models as "Virtual Hydrological Laboratories" to test and refine the simpler models' ability to predict future hydrological changes. This approach moves beyond the sole focus on "predictive skill" measured using metrics of historical performance, facilitating the development of the next generation of conceptual models with hydrological fidelity - i.e., that "get the right answers for the right reasons". This quest is more than a scientific curiosity – it is expected by environmental policy makers and broader stakeholders.

How to cite: Kavetski, D., Thyer, M., McInerney, D., Gupta, H., Westra, S., Maier, H., Jakeman, A., Croke, B., Partington, D., Shanafield, M., Simmons, C., and Tague, C.: Virtual Hydrological Laboratories to develop the next generation of conceptual models and support decision-making under change, EGU General Assembly 2024, Vienna, Austria, 14–19 Apr 2024, EGU24-9070, https://doi.org/10.5194/egusphere-egu24-9070, 2024.

EGU24-9082 | Orals | HS2.2.3

Assessment of a global hydrological service by application-based metrics 

Jonas Olsson, Yiheng Du, Kristina Isberg, Johan Strömqvist, and Yeshewatesfa Hundecha

The calibration and validation of hydrological models often involve a suite of established statistical metrics, which may not always match the needs of local stakeholders, thereby constraining the evaluative scope, particularly in the context of global climate services. This study introduces an alternative, complementary evaluation approach by formulating two types of application-based evaluation metrics (Du et al., 2024), representing model performance in terms of (i) temporal matching of the extreme quantiles and (ii) reproduction of the maximized split-sample difference in flow signatures. The introduced metrics are compared to conventional statistical metrics, at seven case study areas across the world, with three model settings representing different datasets and calibrations, generated from the global hydrological model World-Wide HYPE (WWH; Arheimer et al., 2020). The different performances found using application-based and conventional metrics, respectively, reveal their ability to uncover the models' capability in various aspects. Ultimately, the comprehensive analysis of conventional and application-based metrics allows us to delineate two scenarios for model application: generally applicable models, and conditionally applicable models. For example, in some areas the WWH model, when applied with global dataset and local calibration, is well capable of producing predictions for the timing of extreme quantiles and the relative difference in flow signatures, even though it may not excel according to conventional evaluation metrics. Consequently, this model can be classified as conditionally applicable, suitable for areas where local data is scarce, yet providing reliable information that can aid decision-makers in developing strategies for water resources management.

Arheimer, B., Pimentel, R., Isberg, K., Crochemore, L., Andersson, J.C.M., Hasan, A.,  Pineda, L. (2020). Global catchment modelling using World-Wide HYPE (WWH), open data, and stepwise parameter estimation. Hydrology and Earth System Sciences, 24, 535-559.

Du, Y., Olsson, J., Isberg, K., Strömqvist, J., Hundecha., Y., Silva, B.C., Rafee, S.A.A., Fragoso Jr., C.R., Beldring, S., Hansen, A., Uvo, C.B., Sörensen, J. (2024). Application-based evaluation of multi-basin hydrological models. Journal of Hydrology, under revision.

How to cite: Olsson, J., Du, Y., Isberg, K., Strömqvist, J., and Hundecha, Y.: Assessment of a global hydrological service by application-based metrics, EGU General Assembly 2024, Vienna, Austria, 14–19 Apr 2024, EGU24-9082, https://doi.org/10.5194/egusphere-egu24-9082, 2024.

EGU24-9140 | ECS | Orals | HS2.2.3

Towards an understanding of the hydrological processes of greenhouse horticulture districts 

Daniele la Cecilia, Accursio Venezia, Davide Maino, and Matteo Camporese

The occurrence of agricultural catchments covered by plastic greenhouses is growing worldwide. Horticultural greenhouse production allows for saving irrigation water at the farm scale, but also alters the natural hydrological cycle. Currently, these alterations are not accounted for in physics-based hydrological models. In this study, we aim to couple the greenhouse climate model KASPRO1, to estimate indoor crop transpiration from outdoor meteorological variables, with the integrated surface-subsurface hydrological model CATchment HYdrology (CATHY2) to simulate the stream discharge as well as the shallow groundwater depth in an agricultural catchment (11 km2) covered by plastic greenhouses in South Italy. The dynamic presence of greenhouses, along with bare soils and vegetated lands, is mapped with the Open field and Protected Agriculture land cover Classifier (OPAC3).

We first compare our simulations against indoor measurements of water use (drip- and sub-irrigation) and soil moisture dynamics at different depths at the plot scale. Next, we run CATHY at the catchment scale and compare the output against measured stream water level.

The aim of our study is to validate the capabilities of KASPRO and CATHY to provide high-fidelity spatially distributed dynamic simulations of evapotranspiration and irrigation fluxes, as well as soil moisture and groundwater flows. Such capabilities are essentials to understand the implications of plastic greenhouse districts on the hydrological cycle and thus making these models useful tools for a more sustainable management of agricultural catchments.

References

1 De Zwart, H.F., 1996. Analyzing Energy-Saving Options in Greenhouse Cultivation Using a Simulation Model. Landbouwuniversiteit, Wageningen.

2 Camporese, M., Paniconi, C., Putti, M., & Orlandini, S. (2010). Surface--subsurface flow modeling with path-based runoff routing, boundary condition-based coupling, and assimilation of multisource observation data. Water Resources Research, 46, W02512.

3 la Cecilia, D., Tom, M., Stamm, C., Odermatt, D., 2023. Pixel-based mapping of open field and protected agriculture using constrained Sentinel-2 data. ISPRS Open Journal of Photogrammetry and Remote Sensing 8. https://doi.org/10.1016/j.ophoto.2023.100033.


Acknowledgements: We thank the Consorzio di Bonifica in Destra del Fiume Sele for the continuous support in the MSCA-PF REWATERING project.

Funding: This project has received funding from the European Union’s Horizon Europe research and innovation under the Marie Skłodowska-Curie grant agreement No. 101062255

How to cite: la Cecilia, D., Venezia, A., Maino, D., and Camporese, M.: Towards an understanding of the hydrological processes of greenhouse horticulture districts, EGU General Assembly 2024, Vienna, Austria, 14–19 Apr 2024, EGU24-9140, https://doi.org/10.5194/egusphere-egu24-9140, 2024.

EGU24-9217 | ECS | Posters on site | HS2.2.3

Testing the Adequacy of 7533 KGE Calibrated Conceptual Model Structures 

Diana Spieler and Niels Schütze

Discussions calling for more rigorous evaluation practices for hydrologic models have recently increased. In addition to the widely used aggregated objective functions, hydrologic signatures are becoming common evaluation metrics for testing the adequacy of hydrologic models for specific application purposes.

This work calibrates 7533 conceptual model structures using KGE as an objective function. These structures are evaluated based on their accuracy (KGE performance) and their adequacy. We defined adequacy as showing less than a +/- 50% percentage bias on inter- and intra-annual flow representation as well as on ten selected signatures. These signatures represent five aspects of the hydrological regime (magnitude, frequency, duration, rate of change, and timing). The large number of model structures, calibrated to the streamflow of 12 hydro-climatically differing MOPEX catchments, allows general insight into how well common conceptual model structures can represent observed hydrological behavior evaluated by signatures.

Results show that a large number of model structures perform accurately (high KGE performance) but almost none of these may be considered adequate (poor signature performance). In nine catchments not a single model can be considered adequate. In the remaining three catchments, only between 1 (0.1%) and 49 (0.7%) of all tested model structures are adequate according to all testing requirements. While inter-annual mean flow representation is typically represented well, the number of models able to represent intra-annual mean flow and/or individual signatures rapidly decreases.

This study presents overwhelming evidence that traditional single-objective function-based calibration is unlikely to return model structures that adequately represent complete hydrologic regimes. We therefore recommend that any model intercomparison or evaluation study needs to be constrained with additional data and/or evaluated by more meaningful metrics than traditional objective functions alone.

How to cite: Spieler, D. and Schütze, N.: Testing the Adequacy of 7533 KGE Calibrated Conceptual Model Structures, EGU General Assembly 2024, Vienna, Austria, 14–19 Apr 2024, EGU24-9217, https://doi.org/10.5194/egusphere-egu24-9217, 2024.

EGU24-9701 | Posters on site | HS2.2.3

Using a regionalized distributed hydrological modelling approach for prediction low flow on ungauged French territory based on the training of artificial neural network  

Thomas de Fournas, Nathalie Folton, François Colleoni, and Killian Pujol--Nicolas

This study delves into the exploration of low-flow rivers, a crucial subject within the global river network. These rivers, characterized by reduced flows over significant periods, play an essential role in various ecosystems. They constitute a substantial portion of the global river network, spanning diverse regions, including arid, semi-arid, temperate, humid tropical, boreal, and alpine areas. The flow variations observed in these watercourses are influenced by multiple factors, including climate change and increased water withdrawals associated with human activities. Ungauged basins, where reliable flow data is not readily available, present a significant hurdle in hydrological modelling. The absence of direct measurements makes it difficult to understand and predict the flow dynamics of rivers and streams, particularly in regions with low flow watercourses. To overcome this challenge, the study leverages the SMASH platform (Spatially-distributed Modelling and ASsimilation for Hydrology), a versatile multi-model framework capable of handling the complexities associated with ungauged territories.

The model implemented within the SMASH platform draws inspiration from the GR model family, a collection of global and semi-distributed models developed over the past years at INRAE. SMASH is a flexible, spatially distributed hydrological modelling platform capable of operating at high spatial and temporal resolution in both gauged and ungauged catchments. It is designed to simulate flow hydrographs across all grid cells in the computational domain.

Additionally, it incorporates functionalities for parameter sensitivity analysis and methods for both uniform and spatially distributed parameter calibration with different objective functions.

The principal aim of this study is to test the performance of various hydrological model structures, inspired by the GR model on the SMASH platform in low flow context. The evaluation centers on calibration and validation processes, employing uniform calibration techniques and regionalization approaches over a comprehensive dataset spanning 40 years at a daily time step. This extensive evaluation aims to elucidate the efficacy of these models in reproducing the low flows, seasonnality and bilan of watercourses over a set of basins (100) covering France with differents hydrometeorologic catchments. Furthermore, the study introduces a novel dimension by leveraging an artificial neural network (ANN) to process catchment descriptors specific to France. The ANN facilitates the exploration of regionalization by establishing a meaningful correspondence between select catchment descriptors and model parameters.

The study will then conclude with a comprehensive comparison of all simulations, highlighting the best hydrological model structure and regionalisation.

How to cite: de Fournas, T., Folton, N., Colleoni, F., and Pujol--Nicolas, K.: Using a regionalized distributed hydrological modelling approach for prediction low flow on ungauged French territory based on the training of artificial neural network , EGU General Assembly 2024, Vienna, Austria, 14–19 Apr 2024, EGU24-9701, https://doi.org/10.5194/egusphere-egu24-9701, 2024.

Land-surface evapotranspiration (ET) is a major component of the hydrologic cycle. It is a very attractive approach to estimate land surface ET by means of complementary relationship (CR). After 60 years of continuous exploration, the CR has developed from linear relationships to the present nonlinear ones. There are usually four boundary conditions (BCs) for the nonlinear CR, among which the first-order one in completely wet environments (dy/dxx=1) has been a debatable issue, including both the difference in values of dy/dxx=1, and the divergence in definitions of the independent variable x. It has always been a problem how to consider the advection effect in CR. The effect degree of advection from outside the region varies in the ET process at different spatial scales. In this paper, x denotes the ratio of equilibrium ET (ETe) to apparent potential ET (ETpa), y denotes the ratio of ET to ETpa, and x=1 is set as the benchmark with ETe as the lower limit of ETpa. According to the characteristics of ET processes at different spatial scales, we extend the value range of dy/dxx=1, and take dy/dxx=1=k (k≥0) to establish the generalized BC. The generalized CR model for ET is then proposed by using an exponential function, expressed as y=EXP[k/d(1-1/x^d)] (denoted by GCR-EXP; d>0), where k and d are model parameters. k is equal to 2 in the absence of advection, which is the most complementary case. When k < 2, warm advection plays a role, and the value of k gradually decreases as the advection influence increases. Brutsaert (2015) considered the effect of minimal advection, and used the potential ET (Priestley and Taylor,1972) as ET’s constraint to determine the first-order BC in completely wet environments for the polynomial model of CR, which is a case that fits quite well with a large number of observed data. When k = 0, the CR is no longer valid, and the ET is always equal to ETpa, which reflects the ET of a small wet surface. When 0≤x≤xmin, y is equal or approximately equal to 0. xmin and Priestley-Taylor coefficient α can be determined by the values of x at y close to 0 and to 1 in GCR-EXP model, respectively. For instance, the value of x at y=0.001 can be taken as the value of xmin. k reflects advection effects and the corresponding degrees of CR. Moreover, the GCR models, which satisfy the four BCs including dy/dxx=1=k, can be also expressed as a power-exponential function form and other ones besides the proposed exponential one (Supported by Project 41971049 of NSFC).

How to cite: Liu, W., Mu, Z., and Cheng, C.: Advection Effect and Boundary Condition in the Formulation of Generalized Complementary Relationship for Evapotranspiration, EGU General Assembly 2024, Vienna, Austria, 14–19 Apr 2024, EGU24-10306, https://doi.org/10.5194/egusphere-egu24-10306, 2024.

EGU24-12273 | ECS | Posters on site | HS2.2.3

Exploring the Impact of Various Streamflow Products on Ice-Jam Formation  

Mohammad Ghoreishi, Shervan Gharari, Mohamed Elshamy, and Karl-Erich Lindenschmidt

Ice jams present a significant flood risk in communities located along northern rivers, especially during the breakup of ice cover, resulting in increased backwater levels and flooding beyond riverbanks. The accurate simulation of ice formation relies on precise streamflow data, a vital input for hydraulic models. This study aims to evaluate how different streamflow products influence ice formation, focusing on simulating ice-jam flooding of the Athabasca River at Fort McMurray, Canada, with the broader goal of assessing the suitability of global datasets for predicting such events at a local scale. In our investigation, we integrate MizuRoute, a river network routing tool, and RIVICE, a one-dimensional, hydrodynamic, and river-ice hydraulic model. By employing various large-scale runoff from different models and datasets, such as MESH, ERA5, and VIC among others, our goal is to comprehensively understand how each product impacts the formation of ice jams and the subsequent flooding events. The incorporation of these runoff products is particularly relevant to investigate utilizing global datasets for predicting ice-jam flooding at a local scale.

How to cite: Ghoreishi, M., Gharari, S., Elshamy, M., and Lindenschmidt, K.-E.: Exploring the Impact of Various Streamflow Products on Ice-Jam Formation , EGU General Assembly 2024, Vienna, Austria, 14–19 Apr 2024, EGU24-12273, https://doi.org/10.5194/egusphere-egu24-12273, 2024.

EGU24-12287 | ECS | Orals | HS2.2.3

How well does CLM5 simulate water and energy cycles over India? - A performance evaluation  

Chiru Naik Devavat and Dhanya Chandrika Thulaseedharan

Land surface processes exert a significant impact on local, regional, and global climate through intricate physical exchanges, including energy, water cycle dynamics, vegetation response, soil moisture variations, and heat fluxes between land and atmosphere. A comprehensive understanding of these processes necessitates the analysis of land surface states (e.g., soil moisture, temperature) and fluxes (e.g., evapotranspiration, runoff) over an extended period for various research fields such as hydrological process modeling, weather and climate forecast, drought/flood monitoring, and water resource conservation. However, the accuracy of analyses is hindered by the sparse and uneven distribution of in-situ measurements. To overcome this limitation, satellite-based data and land surface models are employed. While satellites provide continuous global data, they only capture surface-level conditions and have limited daily spatial coverage. Daily, multi-depth soil profile information is essential for understanding land condition dynamics and their impact on the water cycle and agriculture. The Community Land Model (CLM), specifically its latest version CLM5, stands as a pivotal tool for simulating biophysical and biogeochemical processes, including interactions with the atmosphere. Nevertheless, its efficacy in accurately simulating water and energy cycles over India, where local land surface changes are particularly pertinent due to sparse in-situ data remains to be evaluated. To address this gap, our study employs CLM5 to simulate the land surface process at a 0.1° resolution from 1980 to 2020 over India. The evaluation process is comprehensive, involving comparisons with diverse land surface datasets, encompassing in-situ, remotely sensed, and reanalysis measurements. For soil moisture, CLM5 demonstrates good agreement with in-situ data (correlation: 0.66 to 0.67) but exhibits wet biases when compared to in-situ and GLEAM. In the case of evapotranspiration and runoff, CLM5SP closely matches the patterns observed in GLEAM and GRUN datasets (correlation: 0.89 to 0.95 for evapotranspiration and 0.77 to 0.96 for runoff). However, it is noteworthy that CLM5SP tends to overestimate both evapotranspiration and runoff when compared to the reference datasets. The anticipated outcome of this study provides valuable insights into the capabilities of CLM5 simulations over India, offering applications and references for enhancing the model's characterization of water and energy fluxes in the future.

How to cite: Devavat, C. N. and Chandrika Thulaseedharan, D.: How well does CLM5 simulate water and energy cycles over India? - A performance evaluation , EGU General Assembly 2024, Vienna, Austria, 14–19 Apr 2024, EGU24-12287, https://doi.org/10.5194/egusphere-egu24-12287, 2024.

Conducting highly standardized model intercomparison studies of hydrologic models across large scales is beneficial in various aspects such as improving model accuracy and robustness, informing decision making, addressing uncertainties, enhancing educational and outreach opportunities and facilitating model benchmarking among others. However, looking beyond streamflow for hydrologic models is required to ensure that models simulate the right results for the right reasons. Continental scale analyses provide further insights into which systematic limitations a model has.

In this study, seven models (GR4J-CemaNeige, HMETS, Blended-v1, Blended-v2, HBV-EC, HYPR, SAC-SMA) have been setup for more than 2500 watersheds across Canada and the US using the RAVEN modeling framework. The models are setup using a standardized set of meteorologic and geophysical datasets to inform the model regarding forcings, soil, landcover, and terrain. All models are calibrated with respect to daily streamflow (2001-2015) and are subsequently validated on an independent time period (1986-2000). Calibration was performed using 10 independent trials of the Dynamically Dimensioned Search algorithm each using a budget of 2000 model evaluations and Kling-Gupta Efficiency (KGE) as the objective function. Additional variables such as actual evapotranspiration (AET), surface soil moisture (SSM), and snow water equivalent (SWE) for the calibrated model setups were recorded and compared against independent gridded reference datasets (AET and SSM from GLEAM, SWE from ERA5-Land). 

The results (surprisingly) show that all tested models perform equally well for streamflow prediction (range of median KGE values across all sites during calibration period is [0.83, 0.87] and validation period is [0.46, 0.54]). 

Differences between models are most apparent for the auxiliary variables analyzed, i.e. AET, SSM, and SWE. The most interesting differences between the models lie in their abilities to predict AET, with median KGE being the highest for SAC-SMA (0.71), followed by GR4J-CemaNeige (0.65), while the lowest values were observed for HMETS (0.37) and HBC-EC (0.17). Indeed SAC-SMA showed highest performances across 51% of locations while the second-best model is GR4J-CemaNeige with best performance at 13% of locations. 

The SSM, evaluated using the Pearson correlation (r) coefficient, was predicted relatively well by all models (r ranging between 0.62 and 0.72); however, while most models had poorer predictions in the Rocky mountains and at higher latitudes, the SAC-SMA was definitely a better predictor of the temporal dynamics in SSM in these regions.

While the median performance for SWE prediction was relatively low across all models (median KGE between 0.23 and 0.40), poorer predictions mostly occurred in regions with low annual SWE, and predictions improved with increasing annual snow amounts. 

The study reveals novel insights regarding the consistent ability of a suite of models to predict streamflow, while clear ranking of models was apparent based on their ability to simulate spatially distributed variables like AET. Such differences likely arise due to model equifinality highlighting the value of model evaluation against multiple spatially distributed and lumped metrics, generating the correct streamflow for the right reasons.

How to cite: Mai, J. and Basu, N. B.: Beyond streamflow predictions: A continental scale hydrologic model intercomparison experiment, EGU General Assembly 2024, Vienna, Austria, 14–19 Apr 2024, EGU24-12485, https://doi.org/10.5194/egusphere-egu24-12485, 2024.

EGU24-12492 | Posters on site | HS2.2.3

Metrics that Matter: Calibration Choices and Their Impact on Signature Representation in Conceptual Hydrological Models 

Peter Wagener, Diana Spieler, and Niels Schütze

Hydrologists are generally aware that the choice of calibration metric will affect how their model reproduces catchment runoff. However, scientific literature mainly provides a theoretical or case study specific discussion of the topic and no general guidelines. This study thus aims to develop a broader picture by evaluating the influence of 8 different objective functions on the representation of 15 hydrologic signatures for 45 lumped conceptual models in 10 climatically diverse catchments.

The 10 selected catchments are a subset of the CARAVAN dataset (Kratzert et al. [2023]) chosen by using a k-means clustering algorithm based on climate indices (Willmott and Feddema [1992]). The 45 models are taken from the MARRMoT toolbox (Knoben et al. [2019], Trotter et al. [2022]) and only models performing over a specified benchmark are used for the analysis. The signatures that will be analysed represent different processes and aspects of the hydrological regime and the following 8 calibration metrics are investigated: KGE, NSE, log KGE, log NSE, NP-KGE (Pool et al. [2018], Split KGE (Fowler et al. [2018], SHE (Kiraz et al. [2023], DE (Schwemmle et al. [2021]).

Preliminary results show that the ability to reproduce specific signatures is clearly influenced by the chosen metric and therefore this choice should always be based on the specific goal of the prospective modelling study. Each metric has specific strengths and weaknesses that may be used to make a decision. However, the results vary based on climate conditions, the applied model structure and the investigated signature. It is therefore difficult to disentangle all interdependencies and develop more general guidelines with the limited catchment set used in this study. We speculate that very dominant processes shaping the general runoff generation in a catchment (such as snow melt) reduces the impact of the choice of calibration metric, and that more complex models typically are more consistent in process representation.

References:
Fowler et al. (2018): doi: 10.1029/2017WR022466
Gupta et al. (2009): doi: 10.1016/j.jhydrol.2009.08.003
Kiraz et al. (2023): doi: 10.1029/2023WR035321
Knoben et al. (2019): doi: 10.5194/gmd-12-2463-2019
Kratzert et al. (2023): doi: 10.1038/s41597-023-01975-w
Nash and Sutcliffe (1970): doi: 10.1016/0022-1694(70)90255-6
Pool et al. (2018): doi: 10.1080/02626667.2018.1552002
Schwemmle et al. (2021): doi: 10.5194/hess-25-2187-2021
Trotter et al. (2022): doi: 10.5194/gmd-15-6359-2022
Willmott and Feddema (1992): doi: 10.1111/j.0033-0124.1992.00084.x

Disclaimer: The first author conducted the presented research at TUD, now a PhD student at UofC

How to cite: Wagener, P., Spieler, D., and Schütze, N.: Metrics that Matter: Calibration Choices and Their Impact on Signature Representation in Conceptual Hydrological Models, EGU General Assembly 2024, Vienna, Austria, 14–19 Apr 2024, EGU24-12492, https://doi.org/10.5194/egusphere-egu24-12492, 2024.

EGU24-12534 | ECS | Orals | HS2.2.3

Modelling the effectiveness of multiple natural flood management interventions at a large catchment scale 

Qiuyu Zhu, Megan Klaar, Thomas Willis, and Joseph Holden

While natural flood management (NFM) as a resilience flood mitigation strategy is widely used in the UK and Europe, there remains a lack of scientific evidence regarding its effectiveness. The primary uncertainties stem from two aspects: the determination of NFM effectiveness on flood mitigation is limited by the scale of impact assessment; and the combination of multiple NFM interventions implemented within a catchment which may result in flood synchronicity. We argue that the effectiveness of combined scenarios involving multiple NFM interventions within a catchment can vary.  We utilize a hydrological model that simulates both instream and terrestrial interventions at a large catchment scale. To demonstrate how scale and interventions interact to determine flood peaks, we integrated various NFM interventions and land cover changes within the upstream catchment into a model, including afforestation, soil aeration, catchment/floodplain restoration and hedge planting. We modelled existing and planned scenarios using a spatially distributed hydrological model, Spatially Distributed TOPMODEL (SD-TOPMODEL). In comparison to previous versions of TOPMODEL, we have improved the simulation efficiency to allow for the simulation of up to a 200-year return period flood event at a larger catchment scale (~84 km2); and simplified the model parameters which are not related to the effects of NFM interventions and retained three key parameters which are physically significant. Following extensive parameter calibration and validation, the model is stable, providing a reliable fit for flood peaks, with the Nash-Sutcliffe coefficient (NS) between modelled and observed discharge reaching up to 0.905. The modelling results illustrated the effectiveness of NFM interventions in reducing flood peaks at a large catchment scale. Further refinements will involve incorporating additional types of NFM interventions into our next coupled model. 

How to cite: Zhu, Q., Klaar, M., Willis, T., and Holden, J.: Modelling the effectiveness of multiple natural flood management interventions at a large catchment scale, EGU General Assembly 2024, Vienna, Austria, 14–19 Apr 2024, EGU24-12534, https://doi.org/10.5194/egusphere-egu24-12534, 2024.

EGU24-13129 | Orals | HS2.2.3

Multi-basin calibration of the ECMWF land-surface model ECLand 

Stephan Thober, Juliane Mai, Cinzia Mazzetti, Gianpaolo Balsamo, Christel Prudhomme, Robert Schweppe, Matthias Kelbling, Sebastian Müller, and Luis Samaniego

Accurately and efficiently estimating parameters for spatially distributed environmental models is impossible without proper regularization of the parameter space. The Multiscale Parameter Regionalization (MPR, Samaniego et al. 2010) makes use of high-resolution physiographic data (i.e., physiographic data such as soil maps and land cover information) to translate local land surface properties into model parameters. MPR consists of two steps: first, the high-resolution model parameters are derived from physiographic data via transfer functions at the native resolution. Second, the model parameters are upscaled to the target resolution the environmental model is applied on. MPR has already been successfully applied to the mesoscale hydrologic model (mHM, Samaniego et al. 2010, Kumar et al. 2013). An agnostic, stand-alone version implementation of MPR (Schweppe et al., 2022) allows applying this technique to any land-surface model or hydrological model.

In this study, we apply MPR to optimize parameters for the land-surface model ECLand (Boussetta et al. 2021) of the ECMWF Integrated Forecasting System. ECLand is calibrated at multiple locations simultaneously to provide an improved representation of river discharge at a global scale. We demonstrate the flexibility of the MPR approach by optimizing different transfer functions including the default one used in ECLand. In particular, we will discuss how specific choices in the calibration setting (i.e., chosen model parameters and ranges, basin locations, transfer function) affect the obtained ECLand model performance.


References:

Samaniego L., Kumar, R., and Attinger, S.: “Multiscale parameter regionalization of a grid-based hydrologic model at the mesoscale”, Water Resour. Res., 46, 2010.

Kumar, R., Samaniego, L., and Attinger, S.: “Implications of distributed hydrologic model parameterization on water fluxes at multiple scales and locations”, Water Resources Res, 2013

Schweppe, R., Thober, S., Müller, S., Kelbling, M., Kumar, R., Attinger, S., and Samaniego, L.: MPR 1.0: a stand-alone multiscale parameter regionalization tool for improved parameter estimation of land surface models, Geosci. Model Dev., 15, 859–882, https://doi.org/10.5194/gmd-15-859-2022, 2022

Boussetta S, Balsamo G, Arduini G, Dutra E, McNorton J, Choulga M, Agustí-Panareda A, Beljaars A, Wedi N, Munõz-Sabater J, de Rosnay P, Sandu I, Hadade I, Carver G, Mazzetti C, Prudhomme C, Yamazaki D, Zsoter E. ECLand: The ECMWF Land Surface Modelling System. Atmosphere. 2021; 12(6):723. https://doi.org/10.3390/atmos12060723

How to cite: Thober, S., Mai, J., Mazzetti, C., Balsamo, G., Prudhomme, C., Schweppe, R., Kelbling, M., Müller, S., and Samaniego, L.: Multi-basin calibration of the ECMWF land-surface model ECLand, EGU General Assembly 2024, Vienna, Austria, 14–19 Apr 2024, EGU24-13129, https://doi.org/10.5194/egusphere-egu24-13129, 2024.

EGU24-13230 | Orals | HS2.2.3

An Improved Representation of The Variable Contributing Area Concept in Hydrologic and Land Surface Models 

Tricia Stadnyk, Mohamed Ismaiel Ahmed, Martyn Clark, and Alain Pietroniro

Hydrologic modelling in the low-lying, flat prairie or arctic pothole regions is challenging because of variable contributing areas that modify the transformation of local runoff into streamflow. Most hydrological and land surface models fail in predicting prairie hydrology due to overlooking or inadequately representing the variable contributing area dynamics. In this study, we develop an open-source, model-agnostic version of a revised formulation of the recently developed Hysteretic Depressional Storage (HDS) model. This revised formulation accounts for the hysteretic relationship of pothole depressions and its effects on streamflow generation. The revised HDS model is implemented and tested with two different hydrological models of varying complexity (MESH and HYPE). The modified hydrological models are tested on a number of prairie pothole basins in Canada. Results show improved simulations of the streamflow response in the tested basins. Importantly, the modified models replicate the known hysteretic relationships between depressional storage and contributing areas in that region. The open-source HDS implementation approach is designed for use in hydrologic or land surface modelling systems, enabling improvements in simulating the complex hydrology and streamflow regimes globally.

How to cite: Stadnyk, T., Ahmed, M. I., Clark, M., and Pietroniro, A.: An Improved Representation of The Variable Contributing Area Concept in Hydrologic and Land Surface Models, EGU General Assembly 2024, Vienna, Austria, 14–19 Apr 2024, EGU24-13230, https://doi.org/10.5194/egusphere-egu24-13230, 2024.

EGU24-13626 | ECS | Orals | HS2.2.3

How can spatial parameter sensitivity analysis enhance streamflow calibration routines in hyper-resolution hydrological models? 

Luiz Bacelar, Hongli Liu, Guoquiang Tang, Noemi Vergopolan, Naoki Mizukami, Andy Wood, and Nathaniel Chaney

Efficiently modeling water and energy fluxes across spatial scales has historically involved grouping landscapes based on hydrological similarities. The HydroBlocks (HB) modeling framework, using unsupervised machine learning of high-resolution environmental datasets, emerges as a robust tool for representing heterogeneity in Land Surface Models (LSMs). This framework effectively discretizes complex gridded LSMs, such as Noah-MP, into spatially unstructured Hydrological Response Units (HRUs), facilitating the modeling of hydrological processes at hyper-resolution (10-100 m) with computational efficiency suitable for continental and global simulations. However, extending process-based hydrological models to such scales does not inherently ensure heightened simulation accuracy. For operational purposes, especially in flood warning systems, calibrating new LSMs remains imperative. Therefore, this study proposes a spatial parameter sensitivity methodology based on the pyVISCOUS algorithm, with the potential to facilitate HRU-level parameter calibration and enhance the application of hyper-resolution resolving LSMs for real-time streamflow prediction.

Our investigation delves into the relationship between spatial parameter sensitivity and model discretization across the Contiguous United States (CONUS), mainly focusing on surface and subsurface runoff states. Two clustering architectures were used to generate HB HRUs for an ensemble of simulations varying Noah-MP LSM parameters. The simplified HB configuration clusters HRUs based on terrain and hillslope variations, while the formal HB incorporates finer-scale land heterogeneity from high-resolution land cover and soil properties maps. Results reveal that saturated hydraulic conductivity was considered the most sensitive parameter for runoff production independent of the HRU grid configuration. The infiltration controlling parameter REFDK was ranked as the second most important in first-order sensitivity and had a higher spatial impact (% of HRUs) over the experiment with a higher level of clustering small-scale heterogeneity. Lower sensitivities were found in HRUs classified as urban areas, while soil properties parameters demonstrate reduced sensitivity near streams, where the floodplain remains closer to saturation. We intend to demonstrate that excluding the least sensitive HRU groups within a defined parameter range from calibration could potentially minimize computational costs while preserving physically realistic spatial patterns of LSM fluxes and states at field-scale resolutions, mitigating artifacts introduced by conventional methods (e.g. constant parameter multiplier over subbasins).

How to cite: Bacelar, L., Liu, H., Tang, G., Vergopolan, N., Mizukami, N., Wood, A., and Chaney, N.: How can spatial parameter sensitivity analysis enhance streamflow calibration routines in hyper-resolution hydrological models?, EGU General Assembly 2024, Vienna, Austria, 14–19 Apr 2024, EGU24-13626, https://doi.org/10.5194/egusphere-egu24-13626, 2024.

Abstract
Study region: Typical basin in humid areas in the Huaihe River 
Study focus: Accurate flood forecasting is essential for making timely decisions regarding flood control and disaster reduction. The theory of watershed runoff generation and convergence serves as a crucial foundation for flood forecasting, while the calculation of runoff is necessary to simulate flood discharge. Identifying watershed runoff generation mechanisms has been a challenging task, particularly under complex underlying surface conditions. To improve the accuracy of flood simulation, this study examines the underlying surface information in the watershed, such as particle composition and content, soil bulk density, geological slope, land use, and other spatial attributes, aiming to analyze the mechanisms of runoff generation. In the study of sub-watersheds, various combinations of runoff generation mechanisms are identified to determine the patterns of runoff. Subsequently, a semi-distributed hydrological model is developed, which incorporates both saturation-excess and infiltration-excess runoff, utilizing the information obtained from the underlying surface. The model is validated using rainfall-runoff data from 14 events at the Xiagushan watershed. 
New hydrological insights for the region: The analysis of the fundamental physical conditions of the underlying surface of the watershed revealed that 69.70% of the area is prone to saturation-excess runoff, with an additional 30.30% of the area being susceptible to infiltration-excess runoff. The model considers the spatial distribution of runoff patterns by incorporating complex underlying surface information and demonstrates high accuracy in simulating flood events (NSE= 0.87, Epeak = 12.08%, Wpeak = 13.16%, Tpeak = 0.14 hours, R2 = 0.90). The model is straightforward, practical, and exhibits promising potential in terms of timeliness and applicability, thus lending itself well to further application in other watersheds, contributing to the scientific foundation of flood warning and forecasting efforts.

How to cite: Hu, C., Liu, C., Niu, C., and Yu, Q.: Construction of a semi-distributed hydrological model considering the combination of saturation-excess and infiltration-excess runoff space under complex substratum, EGU General Assembly 2024, Vienna, Austria, 14–19 Apr 2024, EGU24-14494, https://doi.org/10.5194/egusphere-egu24-14494, 2024.

EGU24-15260 | Posters on site | HS2.2.3

Extreme low flow estimation: added value of piezometry to constrain the asymptotic behavior of a lumped rainfall-runoff model 

Joël Gailhard, Antonin Belin Mergy, Matthieu Le Lay, and Alexandre Devers

The adaptation to climate change of thermal power plants necessitates the identification and characterization of high impact hazards. Extremely low river flow is one of these situations. The estimation methods traditionally used today still rely on extreme value theory (i.e., statistical adjustment on few observations and/or simulations), but these methods suffer from numerous limitations. Recent developments now make it possible to consider another approach, based on hydro-climatic simulations: extreme low flow quantiles are estimated by coupling a climate generator and a hydrological model. A first proof of concept was recently tested on a single basin and showed significant potential (Parey et al. 2022). Areas for improvement were also identified, both on the climate generator and the hydrological model.

The purpose of this work was then (i) to extend this first proof of concept to a larger number of basins and (ii) to quantify the sensitivity of the simulation chain (i.e., extreme low flow quantiles estimation) to the parameters of the hydrological model (in our case, the MORDOR-SD daily lumped rainfall-runoff model, Garavaglia et al. 2017).

A dataset of 33 catchments, each of them being associated with at least one piezometer, was selected to investigate whether the MORDOR-SD model could be constrained by piezometric time series to improve low flow simulations. By performing calibrations using only streamflow information we first confirmed that a particular state of the model was well correlated with piezometry in most studied catchments (the level of the so-called « deep » store, dedicated to the baseflow component).

A multi-objective calibration approach was then implemented, optimizing both (i) flow simulation with 4 criterions focusing on different streamflow signatures and (ii) eventually one supplementary criterion base on the affine correspondence between the deep storage level of the model and piezometry (i.e., calibration with or without piezometric information).

The results led us to propose a classification of the 33 basins based on two indices. The first index characterizes the importance of the baseflow in the streamflow (BFI = baseflow index). The second index characterizes the a priori representativity of the piezometric time series during low flows (Cor QMNA/ZMNA, index also used in Andreassian & Pelletier 2023).

For 14 out of the 33 basins (BFI > 0.7), piezometric information was almost neutral and did not lead to a significant improvement: the streamflow information was sufficient to constrain the low flow simulations. For 11 out of the 33 basins (Cor QMNA/ZMNA < 0.6 and BFI < 0.7), piezometric information was misleading and degraded the results: we assume that the piezometric information was not sufficiently relevant. Ultimately, only 8 out of the 33 basins (Cor QMNA/ZMNA > 0.6 and BFI < 0.7) emerged as interesting case studies. For these 8 watersheds, the piezometric information appears relevant to be included in the calibration process to derive a physics-based extrapolation of extremely low flow quantiles.

How to cite: Gailhard, J., Belin Mergy, A., Le Lay, M., and Devers, A.: Extreme low flow estimation: added value of piezometry to constrain the asymptotic behavior of a lumped rainfall-runoff model, EGU General Assembly 2024, Vienna, Austria, 14–19 Apr 2024, EGU24-15260, https://doi.org/10.5194/egusphere-egu24-15260, 2024.

EGU24-15445 | ECS | Posters on site | HS2.2.3

Introducing WSFS-P, Process-based Version of the Watershed Simulation and Forecasting System (WSFS) in Finland 

Meseret Menberu, Juho Jakkila, Noora Veijalainen, Kristin Böttcher, Stefan Fronzek, Vesa Kolhinen, Paula Havu, Nasim Fazel, Miia Kumpumäki, Ari Koistinen, and Markus Huttunen

This study introduces the WSFS-P model, an evolution of the well-established national WSFS (Watershed Simulation and Forecasting System) hydrological model. This new model represents a significant shift, moving from a conceptual WSFS hydrological model framework to a more physically based, and process-oriented approach (WSFS-P). WSFS-P is a two-layer semi-distributed hydrological model developed at the Finnish Environment Institute (Syke) in order to offer more detailed physical representations in hydrological forecasting and research. This hydrological model incorporates a number of sub-models that cover a wide range of hydrologic processes, including precipitation, snow dynamics, evapotranspiration, lake evaporation, soil moisture, groundwater, river routing, and ice thickness. The model utilizes meteorological inputs such as precipitation, temperature, relative humidity, air pressure, net radiation, cloudiness, and wind speed to deliver a comprehensive and detailed simulation of the hydrological cycle. The WSFS-P aims to enhance the accuracy and effectiveness of hydrological forecasting and research in Finland by leveraging spatially distributed data, such as Corine land use, altitude, and Finnish soil database. This model covers the entire Finnish mainland and transboundary catchments but excludes islands and smaller coastal catchments. This study assesses the WSFS-P model in 58 different catchments in Finland that were selected to cover diverse hydrological characteristics, reliable data, and minimal influence from lake regulation. The selected catchments feature a variety of catchment sizes and topographical and land-use patterns, including forests and agricultural areas, and have varying soil types and distinct climatic conditions. Several catchments are characterized by numerous lakes typical to Finland. Additionally, the study provided a comprehensive examination of five specific catchments to highlight the model’s effectiveness. The preliminary results demonstrate the model’s capabilities in predicting water availability, contributing to efficient water resource management and enhanced flood and drought prediction in Finland. This study aims not only to introduce the WSFS-P model but also to validate its operational readiness for diverse hydrological conditions.

How to cite: Menberu, M., Jakkila, J., Veijalainen, N., Böttcher, K., Fronzek, S., Kolhinen, V., Havu, P., Fazel, N., Kumpumäki, M., Koistinen, A., and Huttunen, M.: Introducing WSFS-P, Process-based Version of the Watershed Simulation and Forecasting System (WSFS) in Finland, EGU General Assembly 2024, Vienna, Austria, 14–19 Apr 2024, EGU24-15445, https://doi.org/10.5194/egusphere-egu24-15445, 2024.

EGU24-16034 | ECS | Orals | HS2.2.3

Developing perceptual models of hydrologic behavior across the North American continent 

Wouter Knoben, Martyn Clark, Ying Fan, Hilary McMillan, Jordan Read, and Katie van Werkhoven

The North American continent is home to a wide range of different hydro-climates. A key research gap is that there is currently limited understanding on the spatial variability of dominant hydrologic processes across these different hydro-climates. This limited understanding makes it difficult to select computational models that faithfully represent the hydrologic processes across such large domains, yet faithful representation of the different hydro-climatic behaviors is critical for accurate numerical prediction.

Here we present progress on a synthesis of dominant hydrologic processes under different combinations of climate-terrain-human forcings, engaging the broader community of catchment and Critical Zone scientists. The product from this research will be a continental “Hydrologic Mosaic”, with each landscape in the mosaic described by a set of perceptual and conceptual models. In this first step, we produce a continental map of hydrologic landscapes defined through the juxtaposition of hydroclimate, terrain and geology, and vegetation, land use, and management. We will define hydrologically meaningful indicators of terrestrial hydrology that concisely describe a location’s (i) hydroclimate (e.g., aridity, snow fraction, energy/water seasonality), (ii) topography and geology (e.g. depth to bedrock, soil porosity, topographic slope), and (iii) vegetation, land use and management (e.g., vegetation type, agricultural drainage, reservoir size), and calculate values for these indicators for each location on the continent. We then use clustering analysis to create a manageable number of representative hydrologic landscapes.

This work functions as a starting point in a wider project, where these initial hydrologic landscapes will be refined through interactions with regional experts. Together, we will develop perceptual (sketches and descriptions) and conceptual (box-and-arrow diagrams) of the dominant processes in each hydrologic landscape. These conceptual diagrams will contribute to large-domain modeling efforts by allowing targeted model selection and comparison efforts for each hydrologic landscape.

How to cite: Knoben, W., Clark, M., Fan, Y., McMillan, H., Read, J., and van Werkhoven, K.: Developing perceptual models of hydrologic behavior across the North American continent, EGU General Assembly 2024, Vienna, Austria, 14–19 Apr 2024, EGU24-16034, https://doi.org/10.5194/egusphere-egu24-16034, 2024.

EGU24-16116 | ECS | Posters on site | HS2.2.3

Can we parameterise Subsurface Stormflow in a conceptual simulation model using flow duration curve percentiles for calibration? 

Tamara Leins, Nikolai Späth, Christian Reinhardt-Imjela, and Andreas Hartmann

Subsurface stormflow (SSF) is an important runoff-generation process, especially in humid, mountainous regions. It can play a major role in flood generation and contaminant transport at the catchment scale. However, as it is a subsurface and heterogeneous process, its monitoring can be very challenging. In turn, the identification of SSF parameters in hydrological models is a difficult task and is often affected by equifinality.  Our study uses the HBV-light model, a conceptual model at the catchment scale, to simulate SSF (and catchment discharge) at a catchment in the Ore Mountains in Saxony, Germany. To see whether it is possible to improve the identifiability of SSF parameters by looking at different flow conditions separately, we divide discharge data according to flow duration curve (FDC) percentiles. We then calibrate the conceptual model several times, each time using only discharge data within one percentile of the FDC. Using a Monte Carlo based calibration, we select the same number of behavioural parameter sets for every FDC percentile based on the Kling-Gupta-Efficiency as an objective function. With a regional sensitivity analysis as well as a GLUE uncertainty estimation, we analyse and compare the parameter sets and discharge simulations of the different percentile calibrations. In this way, we analyse whether there is more information content on SSF hidden in a specific part of the FDC and thus, SSF parameters and processes become better quantifiable.

How to cite: Leins, T., Späth, N., Reinhardt-Imjela, C., and Hartmann, A.: Can we parameterise Subsurface Stormflow in a conceptual simulation model using flow duration curve percentiles for calibration?, EGU General Assembly 2024, Vienna, Austria, 14–19 Apr 2024, EGU24-16116, https://doi.org/10.5194/egusphere-egu24-16116, 2024.

EGU24-16210 | Posters on site | HS2.2.3

rechaRge – a package for integrated groundwater recharge modelling in R 

Yannick Marcon and Emmanuel Dubois

[9:56 AM] Emmanuel Dubois

The project introduces the new R package, rechaRge, dedicated to open-source groundwater recharge (GWR) models. The goal is to facilitate the simulation of GWR estimates for researchers, professionals, and stakeholders, for both hydrogeologists and non-hydrogeologists, by providing all the tools for state-of-art modelling and the available GWR models in a single R package. The package includes functions for data preparation (utility functions), automatic calibration, sensitivity analysis, and uncertainty analysis, all integrated directly in the R environment. A first open-source GWR model, the HydroBudget model, is also incorporated in the package. The model’s excellent performance allowed for the simulation of large datasets of spatially distributed and transient GWR in several projects in Canada, ranging from small watershed scale (few km2) to regional scale (thousands of km2). Sensitivity analysis, calibration, and uncertainty for the models were greatly facilitated by the utility functions of the package. At the region scale, GWR was simulated within a global change context with a spatial resolution of a 500 m x 500 m and a monthly time step for up to 150 years and 24 scenarios. Moreover, the rechaRge package is a collaborative effort and developers of open-source GWR modelling codes are warmly invited to publish their models in this package and take advantage of the existing functions.

How to cite: Marcon, Y. and Dubois, E.: rechaRge – a package for integrated groundwater recharge modelling in R, EGU General Assembly 2024, Vienna, Austria, 14–19 Apr 2024, EGU24-16210, https://doi.org/10.5194/egusphere-egu24-16210, 2024.

EGU24-18302 | Orals | HS2.2.3

Recession discharge from compartmentalized bedrock hillslopes: hydrogeological processes and solutions for model calibration  

Clement Roques, Ronan Abhervé, Etienne Marti, Nicolas Cornette, Jean-Raynald de Dreuzy, David Rupp, Alexandre Boisson, Sarah Leray, Philip Brunner, and John Selker

Due to the difficulties of gathering relevant data of groundwater systems and the lack of fundamental physically-based understanding on the processes involved, the representation of groundwater flow heterogeneity in catchment- to regional-scale hydrological models is often overlooked. We often limit the representation of groundwater with simplified homogeneous and shallow aquifers where effective hydraulic properties are derived from global-scale database. This raises questions regarding the validity of such models to quantify the potential impacts of climate change, where subsurface heterogeneity is expected to play a major role in their short- to long- term regulation.

We will present the results of a numerical modelling experiment designed to explore the role of the vertical compartmentalization of hillslopes on groundwater flow and recession discharge. We found that, when hydraulic properties are vertically compartmentalized, streamflow recession behaviour may strongly deviate from what is predicted by groundwater theory that considers the drainage of shallow reservoirs with homogeneous properties. We further identified the hillslope configurations for which the homogeneous theory derived from the Boussinesq solution approximately holds and, conversely, for those for which it does not. By comparing the modelled streamflow recession discharge and the groundwater table dynamics, we identify the critical hydrogeological conditions responsible for the emergence of strong deviations. We further present new solutions to better represent subsurface heterogeneity in catchment-scale models and calibrate hydraulic parameters that properly capture the groundwater and streamflow dynamics.

How to cite: Roques, C., Abhervé, R., Marti, E., Cornette, N., de Dreuzy, J.-R., Rupp, D., Boisson, A., Leray, S., Brunner, P., and Selker, J.: Recession discharge from compartmentalized bedrock hillslopes: hydrogeological processes and solutions for model calibration , EGU General Assembly 2024, Vienna, Austria, 14–19 Apr 2024, EGU24-18302, https://doi.org/10.5194/egusphere-egu24-18302, 2024.

EGU24-19135 | ECS | Orals | HS2.2.3 | Highlight

New modelling paradigm linking groundwater, surface water and rainfall-runoff relationship shifts under multi-year drought 

Keirnan Fowler, Dominic Regan-Beasley, Michael Nixon, and Glen Walker

While there is little opposition to the idea that groundwater can play a central role in rainfall-runoff response, there is little consensus on how this should be modelled. Here, we present modelling supporting a recently advanced hypothesis that links groundwater-surface water interactions with observed shifts in the relationship between rainfall and runoff in south-east Australia.  While many approaches assume a direct and simplistic relationship between groundwater head and baseflow, evidence arising from a multi-year drought in Australia challenges traditional notions. GRACE and bore data during the Millennium Drought (1997-2010) show multi-year declines in groundwater storage, of such severity that we might expect the baseflow to cease, giving a flashier regime.  In reality, the shape of the hydrograph is mostly unchanged, but other changes abound: a year of given rainfall generates less runoff today than it did pre-drought (ie. shift in rainfall-runoff relationship). In other words, during and after the drought we see a hydrograph of similar shape to before, but diminished. While many Australian hydrologists are convinced that groundwater played a key role in this behaviour, it is unclear how these observations can be explained by existing hypotheses or modelling methods for groundwater surface-water interaction, and new paradigms are required.

The hypothesis explored here is that these observations can be explained by leaky bedrock in headwater catchments, which facilitates gradual groundwater export from upslope areas to downslope areas (within the same catchment).  Upslope areas subject to groundwater decline then see groundwater-surface water decoupling and reduced runoff. The hypothesised leakage is slow enough to go unnoticed during wetter periods, but in drier periods recharge may be too low to balance the export, leading to reduced groundwater levels and groundwater surface-water decoupling. When wetter conditions resume, the groundwater deficits may take a while to be replenished, delaying recovery of rainfall-runoff relationships (as observed in Australia).  In downslope areas, the drained water may contribute to streamflow, but may also be lost to evaporation and transpiration, particularly in drier catchments with flatter valley bottoms of alluvium or colluvium. In such catchments, the net effect of these processes is to allow groundwater originating from upslope to supplement evaporative budgets downslope rather than increasing streamflow.

We advance this hypothesis, firstly by presenting evidence of its applicability in south-east Australia; and secondly by building and testing improved numerical models that incorporate a simplified representation of these processes. Modelling results show improved performance when tested across several catchments affected by rainfall-runoff relationship changes, and improved realism such as multi-year declines in simulated groundwater storage, consistent with observations.  These results suggest a promising avenue for further research relevant to a variety of water resource applications including climate change impact assessment.

How to cite: Fowler, K., Regan-Beasley, D., Nixon, M., and Walker, G.: New modelling paradigm linking groundwater, surface water and rainfall-runoff relationship shifts under multi-year drought, EGU General Assembly 2024, Vienna, Austria, 14–19 Apr 2024, EGU24-19135, https://doi.org/10.5194/egusphere-egu24-19135, 2024.

EGU24-19742 | ECS | Posters on site | HS2.2.3

Predicting reservoir inflows with an advanced SWAT+ model calibration in the Tagus River headwaters (Spain) 

José Manuel Rodríguez-Castellanos, Alejandro Sánchez-Gómez, Silvia Martínez-Pérez, and Eugenio Molina-Navarro

The Tagus River is the longest in the Iberian Peninsula and its basin is highly managed: it is the most populated and subject to the Tagus-Segura water transfer, which sends an annual average of 330 hm3 to southeast Spain. Its starting point is a hyper-reservoirs' system (Entrepeñas-Buendía-Bolarque) located in the basin´s headwaters sector. The total inflow to this reservoir system has decreased by 50% in the last decades, mostly as a consequence of the already noticeable impacts of climate change, and this situation will be further aggravated in the future. Thus, both gaining knowledge about the hydrological behaviour of the Tagus River headwaters and developing reliable tools to predict inflows to this reservoirs' system are highly relevant tasks to aid for a sustainable water resources management in coming years.

In this work, we set up a highly detailed catchment model with SWAT+ in the Tagus River headwaters. Before calibration, two additional tasks were addressed: 1) HRUs were grouped into three classes with varying lithology and permeability (carbonate, detrital of high and medium permeability, detrital of low permeability), and 2) two hydrological indices, the runoff rate and the baseflow index, were obtained for eight subbasins that have streamflow records. Three sets of parameters were designed, one for each HRU geological class, and then a complex calibration procedure was addressed. A soft calibration, narrowing parameters´ ranges to reproduce the hydrological indices realistically, was followed by a multi-site hard calibration of the streamflow in eight subbasins. During hard calibration, the streamflow simulation performance and the accuracy of the model reproducing the runoff coefficient and the groundwater contribution were considered. Afterwards, a best simulation was chosen and tested with an initial validation of the daily streamflow produced in each reservoir watershed, obtaining both statistically and graphically satisfactory results. After some final modifications in the model, a second and final validation on the monthly inflows into the hyper-reservoirs system was done, successfully reproducing the observed records, with NSE, R2 and PBIAS values of 0.86, 0.88, 2.5% in Entrepeñas and 0.89, 0.91 and -8.5% in Buendía.

The SWAT+ calibration approach followed in this work is novel because it takes into account the heterogeneity in the hydrogeological properties of a catchment to parameterize it, optimizing the parameters values at a geological class level and evaluating the model performance at subbasin level, which implies a higher spatial calibration resolution that the usual one in SWAT studies. As a result, the model not only simulates accurately subbasins with uniform geological properties,  but the entire Tagus headwaters,  including those subbasins  with  mixed  geology, thus resulting  in a model that accurately simulates reservoir inflows. By performing a multi-site calibration on smaller subbasins, results are more accurate, and the model represents more realistically local hydrological conditions. For that reason, this methodology helps also to understand how specific environmental conditions might affect all hydrological model process, thus also helping in water management decision making.

How to cite: Rodríguez-Castellanos, J. M., Sánchez-Gómez, A., Martínez-Pérez, S., and Molina-Navarro, E.: Predicting reservoir inflows with an advanced SWAT+ model calibration in the Tagus River headwaters (Spain), EGU General Assembly 2024, Vienna, Austria, 14–19 Apr 2024, EGU24-19742, https://doi.org/10.5194/egusphere-egu24-19742, 2024.

EGU24-19765 | ECS | Orals | HS2.2.3

Application of the new SWAT+ water allocation module in the Tagus River basin 

Alejandro Sánchez-Gómez, Jeffrey Arnold, Katrin Bieger, Nancy Sammons, Silvia Martínez-Pérez, and Eugenio Molina-Navarro

SWAT+ is a completely restructured version of the SWAT model. It includes new capabilities, and the possibility of modelling water resources management is particularly relevant. A new water allocation module allows to allocate water for different purposes inside and outside a basin. Reservoir management can be modelled using decision tables that define which actions occur under different scenarios. Despite the relevance of these novelties, there is a lack of studies demonstrating accurate simulations of reservoir outflows using decision tables in SWAT+, and there are to date no publications regarding the water allocation module.

The Tagus River basin (Spain) is the most populated (11 million inhabitants) basin on the Iberian Peninsula and its water resources management is highly controversial. This basin is a clear example of the importance of including anthropogenic water management in the modelling process, since it is intensively regulated by more than 50 reservoirs, several water transfers, and irrigation. Therefore, the water allocation module (for simulating water transfers and irrigation) and decision tables (for reservoir management and irrigation) were used in a detailed model of the Upper Tagus River Basin (UTRB), where most of the water demands of the basin are located.

Firstly, more than 30 reservoirs were introduced to the model and their management was analyzed using observed data. Different decision table structures were created considering the properties of the reservoirs (purpose, storage, etc.) and then adapted to each of the reservoirs. A satisfactory simulation of reservoir storage and outflow was achieved in most of the cases, demonstrating the reliability of the model and the adequacy of this approach.

There are numerous water transfers in the UTRB, of which the Tagus-Segura water transfer (TSWT) is the most relevant one. Some transfer water from one reservoir to another, while two of them divert water outside the modelled basin. In addition, water is transferred from reservoirs to water treatment plants and subsequently released to selected receiving channels. All these transfers were modelled using the SWAT+ water allocation module and for most of them the modelled volumes matched the observed ones well.

The agricultural water demand was estimated from the River Basin Management Plan. To simulate the irrigation, all demand objects within the UTRB (irrigated agricultural lands, 282 objects) and their respective sources (closest channel to those objects, 118 sources) were identified. An irrigation decision table was developed for the basin, allowing to simulate a demand close to the calculated and to supply enough water to meet more than 80% of this demand.

This works presents a novel approach to simulating water resources management in a highly regulated river basin using SWAT+. Results shows a satisfactory simulation of different management actions (reservoirs, irrigation, water transfers inside and outside the basin, wastewater discharges). Further work on the water allocation module will boost even more the application of SWAT+.

How to cite: Sánchez-Gómez, A., Arnold, J., Bieger, K., Sammons, N., Martínez-Pérez, S., and Molina-Navarro, E.: Application of the new SWAT+ water allocation module in the Tagus River basin, EGU General Assembly 2024, Vienna, Austria, 14–19 Apr 2024, EGU24-19765, https://doi.org/10.5194/egusphere-egu24-19765, 2024.

EGU24-19807 | ECS | Orals | HS2.2.3

Simulations of energy and water balances with WRF and WRF-Hydro models: the role of model coupling and parameterizations 

Ioannis Sofokleous, Adriana Bruggeman, Corrado Camera, Hakan Djuma, Mohsen Amini Fasakhodi, and George Zittis

We tested the widely used atmospheric WRF (Weather Research and Forecasting) model in a coupled mode to the hydrological model WRF-Hydro. The coupled WRF/WRF-Hydro model adds the simulation of horizontal surface and subsurface flow of water relative to the standalone WRF. We conducted simulations for the Mediterranean island of Cyprus and 31 small mountainous river basins for the hydrological year 2011-2012. We found higher soil moisture (20%), more evapotranspiration (33%) and a small increase in rainfall (3%) for the coupled WRF/WRF-Hydro model, compared to the WRF model without horizontal flows. We also forced WRF-Hydro with observed rainfall and five different set-ups of WRF and examined the modelled streamflow. The WRF set-ups were adapted from combinations of different microphysics, cumulus cloud, planetary boundary layer and surface layer schemes. We found that WRF-Hydro with observed rain underestimated the average streamflow by 6%, during a two-year simulation (2011-2013). The best of the five WRF set-ups showed a 19% underestimation of the average streamflow, thus, an optimized ensemble of WRF set-ups is needed to model the streamflow. Our study suggests that the coupling of WRF with the WRF-Hydro model can improve land-atmosphere simulations. We will also present the calibration of parameters of the land surface component of the coupled model with observations of soil moisture and transpiration that could further enhance the ability of the model to represent the different parts of the combined terrestrial-atmospheric water cycle.

How to cite: Sofokleous, I., Bruggeman, A., Camera, C., Djuma, H., Amini Fasakhodi, M., and Zittis, G.: Simulations of energy and water balances with WRF and WRF-Hydro models: the role of model coupling and parameterizations, EGU General Assembly 2024, Vienna, Austria, 14–19 Apr 2024, EGU24-19807, https://doi.org/10.5194/egusphere-egu24-19807, 2024.

EGU24-21063 | Orals | HS2.2.3 | Highlight

The sociology of modelling: how we shape a perception together 

Lieke Melsen

Science, despite its status as objective and searching for truth, is inherently a social activity. Research is conducted by scientists that collaborate, work in teams, get advised by their supervisor, get funding to study particular questions, know one another from earlier projects, and so on. In these social interactions, we together define what we consider important to study, or what we deem unimportant. This occurs at multiple levels: Funding agencies, for example, have the power to determine which research questions should be addressed. As hydrological modelling community, we have implicitly agreed that discharge is the main variable of interest - focusing on other fluxes or states is often presented as an advancement.  And at the modelling team level, we often (implicitly) agree on a modelling vision. From interviews with modellers from different teams, it for example became apparent that one team had the modelling vision to `keep things as simple as possible’. Given this vision, the modeller was inclined to choose the simpler parameterization over a more complex one to describe the same process. In another team, ‘scale invariance’ was considered more important, and therefore process representations were selected based on their scalability. Therefore, if we want to “advance” process-representation in models across spatial and temporal scales, the theme of this session, we should acknowledge that different researchers have different perceptions of what advancing comprehends, that there is no objective measure to define advancement, and that the first step probably is, that we have to clarify and express our modelling vision.

How to cite: Melsen, L.: The sociology of modelling: how we shape a perception together, EGU General Assembly 2024, Vienna, Austria, 14–19 Apr 2024, EGU24-21063, https://doi.org/10.5194/egusphere-egu24-21063, 2024.

EGU24-678 | ECS | Posters on site | HS2.2.5

Overland flow and shallow subsurface flow generation in a small pre-Alpine catchment: insights from tracer experiments 

Anna Leuteritz, Victor Gauthier, and Ilja van Meerveld

Near-surface flow pathways are important runoff processes in humid catchments with low permeability soils and provide fast transport of water and solutes from the hillslopes to the stream network. To improve our understanding of the spatial variability in solute transport and mixing in overland flow and shallow subsurface flow, we conducted tracer experiments on trenched runoff plots in a small headwater catchment underlain by Gleysols in the Swiss pre-Alps.

We applied a line of NaCl tracer to the surface of 14 small (3 m2) runoff plots and continuously measured flow rates and electrical conductivity in overland flow and shallow subsurface flow during natural rainfall events. In addition, we conducted tracer experiments during artificial rainfall on two large (>80 m2) trenched plots. Uranine and NaCl were applied as a line tracer at various distances from the trench after overland flow and subsurface flow had reached a steady state. NaBr was applied into the subsurface (at ~20 cm depth) and deuterium-enriched water was applied via the sprinklers. Samples of overland flow and shallow subsurface flow were collected at intervals ranging from 1 minute to 1 hour during several hours. We also continuously measured the rainfall rate, flow rates and electrical conductivity of overland flow and shallow subsurface flow, and soil moisture content.

The breakthrough curves from the small-scale experiments highlight the high spatial variation in overland flow and subsurface flow generation across the catchment, and the importance of mixing with shallow soil water for both overland flow and shallow subsurface flow. The results of the big plot experiments confirm the significant mixing of overland flow and subsurface flow. Maximum velocities, calculated from the first arrival of the tracers, were very high and ranged from 6x10⁻³ to 2x10⁻² m s-1 for overland flow and 3x10⁻³ to 1x10⁻² m s-1 for subsurface flow. Runoff generation in the large mixed forest plot was faster than for the large grassland plot and occurred primarily via macropores and soil pipes. In contrast, at the large meadow plot solute transport appears to be dominated by flow through the soil matrix.

How to cite: Leuteritz, A., Gauthier, V., and van Meerveld, I.: Overland flow and shallow subsurface flow generation in a small pre-Alpine catchment: insights from tracer experiments, EGU General Assembly 2024, Vienna, Austria, 14–19 Apr 2024, EGU24-678, https://doi.org/10.5194/egusphere-egu24-678, 2024.

EGU24-704 | ECS | Orals | HS2.2.5

Near surface runoff generation in a pre-Alpine headwater catchment 

Victor Gauthier, Anna Leuteritz, and Ilja van Meerveld

Near-surface flow pathways can be important contributors to runoff in headwater catchments with low conductivity soils. However, the high spatio-temporal variability and connectivity between surface flow and shallow subsurface flow makes it difficult to study these processes. As a result, they are still poorly understood, especially for well vegetated humid catchments. The TopFlow project, therefore, aims to enhance our understanding of the generation and connectivity of overland flow and shallow subsurface flow in a pre-Alpine headwater catchment with low permeability Gleysols.

We installed 14 small (1 by 3 m) runoff plots at different topographic locations to cover the range in slope, vegetation, and wetness conditions across the catchment. At each plot, we measured overland flow (including biomat flow) and shallow subsurface flow from the rooting zone during two snow-free seasons. In addition, we collected groundwater, precipitation and soil moisture data. We also installed two larger plots (8 by >10 m), where we collected data during natural rainfall events and sprinkling experiments. Specifically, we conducted experiments to determine the surface flow path lengths and celerity of overland flow and shallow subsurface flow.

Overland flow and shallow subsurface flow occurred frequently on most plots (on average for 40% of the 26 rainfall events for which data were collected) but the spatial and temporal variability in overland flow and shallow subsurface flow generation was high. The timing and relative importance of overland flow and subsurface flow varied as well. Runoff ratios increased with increasing soil moisture storage and precipitation, and were generally higher for sites with a higher Topographic Wetness Index. Runoff ratios were sometimes larger than 1, indicating the importance of connectivity between subsurface and surface flow. Flow path lengths and celerity also differed for the plots and can be explained by differences in soil characteristics and wetness conditions. Overall, these results highlight the importance of fast near surface flow pathways for runoff generation and its high spatial and temporal variability.

How to cite: Gauthier, V., Leuteritz, A., and van Meerveld, I.: Near surface runoff generation in a pre-Alpine headwater catchment, EGU General Assembly 2024, Vienna, Austria, 14–19 Apr 2024, EGU24-704, https://doi.org/10.5194/egusphere-egu24-704, 2024.

The growing demand for water resources is exacerbated by the impacts of climate variations, uneven rainfall distribution, and population growth. In the global inventory of water resources, rivers in mountainous regions contribute significantly to the available water supply. The subsurface aquifer system in these mountainous watersheds plays a crucial role in the hydrological cycle, serving not only as a primary source for downstream rivers or aquifers but also as a vital replenishment source during periods of drought. Due to its remote location and limited manpower, a comprehensive understanding of the hydrological functions of groundwater within the mountain system remains a challenge. Accordingly, this study selected the alpine watershed of Beinan River in eastern Taiwan, characterized by minimal human activities, to delineate groundwater flow paths and evaluate potential contribution of groundwater to water resources to address the existing gaps in understanding. Through long-term streamflow and groundwater level analyses combined with hydraulic tests and tracer experiments, the objective of this study focuses on delineating the subsurface flow paths from weathered soils and regolith to fractured bedrock and characterizing their associated hydraulic properties in this alpine hydrogeological setting. The results show that the main contributor to streamflow is shallow groundwater, particularly during the dry season. Rainfall infiltration is primarily observed in the weathered soils and regolith manifesting as the mountain front recharge (MFR). The groundwater flow in the bedrock is predominated influence by the fractures and its sources can be traced back to distant hillslopes. The water budget within the entire alpine system is preliminary quantified based on the long-term data and hydraulic parameters obtained from the field tests. The results obtained in this study can provide as a reference for developing conceptual models and fundamental frameworks for quantifying the water budget in alpine environments.

Keywords: alpine hydrogeology, groundwater flow path, fractured flow, water budget, Taiwan


How to cite: Lee, Y. H. and Chiu, Y. C.: Hydrogeological Study and Tracing of Groundwater Flow Paths in the Beinan River Basin within Eastern Taiwan's Alpine Catchment, EGU General Assembly 2024, Vienna, Austria, 14–19 Apr 2024, EGU24-3788, https://doi.org/10.5194/egusphere-egu24-3788, 2024.

EGU24-4376 | Orals | HS2.2.5

Spatio-temporal variability of hydrological connectivity through interflow 

Julian Klaus, Philipp Schultze, and Rhett Jackson

Interflow is lateral subsurface flow in hillslopes during and after precipitation events moving above a restrictive layer of lower hydraulic conductivity soil and rock. Interflow thus becomes more important in steeper hillslopes with a high contrast between the hydraulic conductivities of the layers that impede vertical water movement. However, the travel distance of a water parcel downslope in a perched water body is limited due to potential percolation of water through the impeding layer. This potential travel distance of interflow can be described with the concept of "Downslope Travel Distance" (DTD) that applies to temporary, perched groundwater in hillslopes. The determination of this downslope travel distance in catchments is possible with available topographic and subsurface data. Yet, how this interflow connects to the catchment outlet is poorly understood and depends on the spatio-temporal extension and contraction of the stream network. 

This presentation introduces the concept of DTD and employs calculations based on published data from various catchments and landscapes. In these catchments, DTDs ranged from about just one meter to over several hundred meters. Yet, the DTDs on must hillslopes with data are less than 50 m and less than 30% of the hillslope length showing that most shallow perched water percolates through the impeding layer before contributing to valley water or streamflow via interflow. In a subsequent step, we illustrate the spatial and temporal variability of the area connecting to the catchment outlet via interflow and thus contributing to discharge in different catchments. While soil properties and topographic characteristics generally remain stable over short periods, the wetted stream network undergoes notable changes both in the short and long term. Consequently, the pronounced variability of the area connecting to the catchment outlet via interflow is observable and characteristic for individual catchments. Lastly, we emphasize the present significant constraints of experimental studies and data concerning hillslopes in different landscapes, underscoring the necessity for revisiting research on runoff generation at the hillslope scale.

How to cite: Klaus, J., Schultze, P., and Jackson, R.: Spatio-temporal variability of hydrological connectivity through interflow, EGU General Assembly 2024, Vienna, Austria, 14–19 Apr 2024, EGU24-4376, https://doi.org/10.5194/egusphere-egu24-4376, 2024.

EGU24-4588 | Posters on site | HS2.2.5

Identifying the source areas of subsurface stormflow through the analysis of depth profiles of water-soluble organic matter 

Peter Chifflard, Christina Fasching, Yvonne Schadewell, and Florian Leese

The hydrological dynamics of hillslopes, particularly subsurface stormflow (SSF), exhibit intricate variability in space and time. Existing studies are often confined to single slopes or limited storm events, resulting in uncertainties when applying findings to other slopes or catchments. To address this, a comprehensive understanding of hillslope hydrological dynamics and factors influencing spatial and temporal SSF patterns is essential for upscaling and model validation. Linked to hillslope hydrology is the export of organic carbon to streams, yet spatial carbon sources remain unclear due to limited knowledge of SSF flow paths within slopes.

We propose a hydro-biogeochemical approach, measuring water-soluble organic matter (WSOM; concentration, absorbance, and fluorescence) at 480 locations across 100 hillslopes in four contrasting catchments (Sauerland, Ore Mountains, Black Forest, Alps). This approach aims to establish empirical relationships between landforms, bedrock, and soil properties, quantifying spatial variability and stability of subsurface hydrological processes (e.g., flow directions, transit times, hydrochemical and biochemical composition).

Distributed sampling of WSOM along soil profiles (6 samples per profile) will assess vertical and lateral subsurface flow paths in unsaturated and saturated zones, aiding spatial discretization of SSF source areas.

Preliminary results will provide depth profiles of WSOM in the four catchments spanning low to high mountain ranges (Sauerland, Ore Mountains, Black Forest, Alps), facilitating the detection of SSF source areas.

How to cite: Chifflard, P., Fasching, C., Schadewell, Y., and Leese, F.: Identifying the source areas of subsurface stormflow through the analysis of depth profiles of water-soluble organic matter, EGU General Assembly 2024, Vienna, Austria, 14–19 Apr 2024, EGU24-4588, https://doi.org/10.5194/egusphere-egu24-4588, 2024.

EGU24-5045 | ECS | Posters on site | HS2.2.5

Insights into Subsurface Stormflow Dynamics using multitracer approaches 

Jonas Pyschik, Alexey Kuleshov, Christina Fasching, Peter Chifflard, Theresa Blume, Luisa Hopp, and Markus Weiler

Subsurface stromflow (SSF) is an important runoff generation mechanism in hillslope catchments. However, since the process occurs below ground, it is difficult to observe and measure. So far, the dynamics and thresholds of SSF occurrence remain elusive.

To gain insights into the mechanisms and to determine SSF quantities and their dynamics, we installed three SSF trenches in a first-order catchment in the Black Forest, Germany. We selected hillslopes with different landuse and topography and excavated slope-perpendicular trenches to bedrock (approx. 15 m wide, 2.5 m deep). The trenches are split by soil depth to collect subsurface flow from a top and from a bottom layer. The flow is channeled to tipping buckets for measuring discharge, and autosamplers for semi-continuous water sampling. The water samples are then used to measure multi tracers like stable water isotopes, dissolved organic carbon as well as major anions and cations.

In November and December 2023, the catchment experienced three extreme, multi-day rainfall events. The generated subsurface discharge showed distinct differences in volume among the trenches (up to 100% of upslope-area-corrected flow volume). Most flow (70-90%) occurred in the lower trench sections. Top layer flow was only activated during peak discharge in the bottom layer. Using the multitracer approach, we can gain first insights into the dynamics of the different natural tracers and relate them to the observed subsurface flow variations, possible flow pathways and transit times. Ultimately, we aim to compare these findings to data from three other trenched research catchments to gain a more general understanding of the underlying subsurface stormflow generation mechanisms.

How to cite: Pyschik, J., Kuleshov, A., Fasching, C., Chifflard, P., Blume, T., Hopp, L., and Weiler, M.: Insights into Subsurface Stormflow Dynamics using multitracer approaches, EGU General Assembly 2024, Vienna, Austria, 14–19 Apr 2024, EGU24-5045, https://doi.org/10.5194/egusphere-egu24-5045, 2024.

Sensitivity analyses are an important component of modeling test, which represents the process of evaluating the sensitivity of groundwater flow to changes in hydraulic parameters. This can useful to understand the operating rules of the groundwater system. The major research area including regulating the transport of hydrogeological contamination, planning groundwater protection measures before land development and managing groundwater resources.

In this study, we choose to use the adjoint equation method to conduct the sensitivity analysis of the simulation field, which is used to analyze the sensitivity of the head to the model parameters (transmissivity and storativity) in the case of pumping under a two-dimensional transient heterogeneous groundwater parameter field. we will also consider the spatial correlation of the parameter field, which is often ignored in previous literature. In groundwater sensitivity analysis, spatial correlation can effectively improve the efficiency of the analysis and reduce the total computational cost in the adjoint equation method.

And then we will perform dimensionless analysis on the analytical solution that has been derived. This will make the analysis method no longer affected by the physical meaning, so that the equation can be applied to different situations without the need to re-derive or calculate, thus increasing the application range of the model.

The results will be numerically verified with the VSAFT2 numerical model, which is developed based on the adjoint method. A multi-well work area will be created that can simultaneously calculate the sensitivity coefficient change rate of multiple observation wells and a single pumping well. This will help to more effectively simulate the water flow and sensitivity at the field pumping site, and effectively expand the results of previous literature that only studied dual-well experiments. 

How to cite: Kuo, J.-T. and Wen, J.-C.: Analysis and Research on Hydraulic Characteristic Parameters and Related Sensitivity Changes of Groundwater Layers during Pumping Tests, EGU General Assembly 2024, Vienna, Austria, 14–19 Apr 2024, EGU24-5114, https://doi.org/10.5194/egusphere-egu24-5114, 2024.

In this work, the parallel and fully integrated coupled hydrologic model Parflow-CLM was used to simulate the water and energy fluxes in a 4.2 km2 mountainous headwater catchment in the Odenwald, Germany, for a period of three years at hourly resolution. First, to establish the most time-efficient configuration of the model able to describe the observed discharges of the catchment, different definitions of the numerical domain for a fixed set of parameters along with different horizontal and vertical grid resolutions were compared. Second, with the purpose of achieving a calibrated state of the model, hydraulic soil parameters such as saturated hydraulic conductivities, Van Genuchten parameters, Manning coefficients, and anisotropy factors were optimized. In addition, the influence of the spin-up period was investigated, whereby an spin-up period of eight years was required for each simulation, despite the high computational effort involved, as the different model configurations result in different initial conditions. Finally, computational efforts, subsurface and surface storages, and statistical error measurements related to observed streamflow will be presented, aiming to provide some recommendations to the community about the required complexity for the calibration of complex integrated hydrological models.

How to cite: Muñoz-Vega, E., Bogena, H., and Schulz, S.: Influence of geometry, grid resolution, initial conditions and hydraulic soil parameters for the integrated coupled hydrological model Parflow-CLM, EGU General Assembly 2024, Vienna, Austria, 14–19 Apr 2024, EGU24-6830, https://doi.org/10.5194/egusphere-egu24-6830, 2024.

Streamflow represents the hydrological output behavior of the catchment system and can elucidate the physical processes of other hydrological variables, such as rainfall–runoff processes and storage–discharge dynamics. Understanding streamflow dynamics not only enhances comprehension of complex hydrological processes and influencing factors, but also aids in estimating potential hydrological conditions in ungauged areas. In this study, we explored the differences in the flow duration curve (FDC) structure of streamflow components, ranging from slow to fast, using multiple hydrograph separation. Additionally, we analyzed the recession index and recession parameters of individual recession segments to characterize the storage-discharge dynamics based on the linear and nonlinear reservoir assumptions, respectively. We applied an analytical probabilistic streamflow model to determine which structure better aligns with the model’s physical basis, assuming streamflow generation from groundwater discharge when a sequence of rainfall events increases soil moisture beyond the retention capacity. It also provides estimations of optimal recession parameters for comparison with individual recession segment results. The recession analyses and multiple streamflow components separation revealed differences in dominant recession index, recession parameters, and streamflow complexity between catchments, highlighting their relationships with catchment characteristics. Recession parameters from FDCs with different components demonstrated the storage–discharge mechanisms associated with changes in streamflow components. The conformity of multiple streamflow component structures to the model’s basic assumptions can be evaluated through the model performance, contributing to an understanding of streamflow component structures in catchments and their relevance to specific streamflow generation mechanisms.

How to cite: Huang, C.-C., Yeh, H.-F., and Yang, Y.-S.: Effect of Streamflow Component Structure on Characterizing Storage–Discharge Dynamics in an Analytical Probabilistic Streamflow Model, EGU General Assembly 2024, Vienna, Austria, 14–19 Apr 2024, EGU24-6990, https://doi.org/10.5194/egusphere-egu24-6990, 2024.

EGU24-7599 | Posters on site | HS2.2.5

Revealing spatial patterns of lateral hydraulic conductivity through sensitivity analysis of wflow_sbm  

Albrecht Weerts, Awad mohammed Ali, ruben Imhoff, and Willem van Verseveld

Moving toward high-resolution gridded hydrologic models asks for novel parametrization approaches. The use of transfer functions and advances in scaling and regionalization play an important role to ensure flux matching across scales. However, for some processes no transfer functions are yet available or simplified approaches, such as a fixed vertical-to-horizontal saturated hydraulic conductivity ratio, are being used. To get insight into the spatial variability of the vertical-to-horizontal saturated hydraulic conductivity ratio we performed a sensitivity analysis on one parameter of the wflow_sbm model across England, Wales and Scotland exploiting the CAMELS-GB dataset. The wflow_sbm models were setup using reproducible workflows based on HydroMT (https://deltares.github.io/hydromt/stable/) for each CAMELS-GB basin.  To investigate the sensitivity to rainfall forcing all derived wflow_sbm models were first run using a default ratio of 100 with both EOBS and CEH GEAR rainfall data. The sensitivity analysis was only based on the high quality CEH GEAR rainfall dataset. In the sensitivity analysis, the vertical-to-horizontal saturated hydraulic conductivity ratio was varied over a large range from 1 – 10,000 and results were assessed using the non-parameteric KGE (which focuses more on recession/baseflow performance). Even with a fixed uniform vertical-to-horizontal saturated hydraulic conductivity ratio results show a big impact of the precipitation forcing on the model results.  The uncertainty analysis shows that wflow_sbm model results have a high sensitivity to the vertical-to-horizontal saturated hydraulic conductivity ratio. For the optimal ratios, we obtain high KGE values (median=0.84). In addition, when plotting the optimal ratios across the GB clear patterns emerge that seem to coincide with geological features. The resulting optimized lateral saturated hydraulic conductivity values seem realistic when compared with literature values. When compared to Grid2Grid model results the wflow_sbm model shows similar performance for most stations. However, for parts in the south of the England where the geology consists of chalk, the performance of Wflow_sbm is poor, but this is likely caused by the used soil depth map when constructing the models which limits the soil depth often to 30-60cm while it is known that the chalk below the soil is also hydrologically active. 

How to cite: Weerts, A., Ali, A. M., Imhoff, R., and van Verseveld, W.: Revealing spatial patterns of lateral hydraulic conductivity through sensitivity analysis of wflow_sbm , EGU General Assembly 2024, Vienna, Austria, 14–19 Apr 2024, EGU24-7599, https://doi.org/10.5194/egusphere-egu24-7599, 2024.

EGU24-8263 | ECS | Posters on site | HS2.2.5

Performance assessment of a conceptual model to simulate fluxes in the unsaturated zone to better represent runoff and infiltration processes 

Veethahavya Kootanoor Sheshadrivasan, Jakub Langhammer, Lukáš Vlček, and Václav Šípek

In continuation to the previously presented methodological approach to estimate vadose zone boundary fluxes titled “A novel conceptualization to estimate unsaturated zone mass-fluxes and integrate pre-existing surface- and ground- water models” at the EGU GA 2022, and the performance assessment thereof showcased at the EGU GA 2023, titled “Performance assessment and Benchmarking of a conceptually coupled groundwater - surface-water model”, this study aims to assess the performance of the proposed methodology to couple surface- and ground- water models aims to investigate its local performance in a soil-column by comparing the results of a controlled simulation with that of HYDRUS-1D.


To recap, the initial study presented a conceptual numerical scheme that aimed to adequately estimate the in- and out- fluxes of the Unsaturated Zone (UZ) with the primary aim of coupling existing groundwater (GW) and surface-water (SW) models. It was expected that such a numerical scheme would provide a viable alternative to solving the computationally expensive Richard’s model for cases where description of fluxes within the UZ and the spatial description of the soil moisture were not in the interest of the modeller. Examples of such cases would be efforts to model the hydro(geo)logical effects of various climate-scenarios, efforts to estimate GW recharge dynamically, and efforts to design integrated watershed management design structures and systems, among others.


The model, and in effect, the methodology, established its capacity to simulate the fluxes of the UZ for the Tilted-V theoretical catchment setup during its comparison against the physically based ParFlow model, in the previous study. However, it also did demonstrate certain crucial shortcomings that arose from the nature of the coupling scheme (loose coupling - where the models ran consecutively until the end of a timestep, exchanged information, and continued so and and so forth until the end of the simulation period) used to couple the two GW and SW models.


In this study, the authors aim to more effectively assess the methodology, by attempting to simulate a real-world scenario of transport of water fluxes in the subsurface of a Spruce/Beech Stand in a Peatland experimental site in the Bohemian Forest region of Czechia. The model setup involves the simulation of fluxes in a 1D soil profile using the said methodology and also using the HYDRUS-1D modelling software and comparing the results of the two models and the results with observations. It is expected that such a setup should provide a robust assessment of the methodology. The discussion shall be an extensive analysis of the obtained results.


The authors also hope that the study fosters discussions to unify the polarising modelling approaches as outlined in Markus Hrachowitz er al., 2017.

How to cite: Kootanoor Sheshadrivasan, V., Langhammer, J., Vlček, L., and Šípek, V.: Performance assessment of a conceptual model to simulate fluxes in the unsaturated zone to better represent runoff and infiltration processes, EGU General Assembly 2024, Vienna, Austria, 14–19 Apr 2024, EGU24-8263, https://doi.org/10.5194/egusphere-egu24-8263, 2024.

EGU24-8814 | ECS | Orals | HS2.2.5

Integrating High-Resolution Tracer Data with Soil Moisture and Precipitation Dynamics to Characterize Streamflow Age Distribution in a Headwater Catchment 

Hatice Turk, Markus Hrachowitz, Karsten Schulz, Peter Strauss, Günter Blöschl, Christine Stumpp, and Michael Stockinger

The partitioning of rainfall into different hydrological components, such as lateral subsurface flow,  overland flow, and soil water storage, is essential for understanding and predicting streamflow responses and contaminant transport. This study investigates flow processes within shallow sub-surface layers and streamflow responses in an agricultural headwater catchment by utilizing high-resolution data of oxygen (δ18O) and hydrogen (δ2H) stable isotopes of water. We used weekly data from grab and event streamflow samples (ranging from 15 minutes to 2 hours based on the anticipated event length) in a tracer-based transport model to estimate water travel times and examine how catchment characteristics and climate factors influence storage water release and travel time distributions with a StorAge Selection function approach. We tested two conditions for the activation of preferential flow paths: i) based on soil moisture only, and ii) based on both soil moisture and precipitation intensity. The results show that calibrating a tracer-based transport model, coupled with soil moisture and precipitation intensity data, improve the tracer simulation of quick responses in stream flow (increase in Nash-Sutcliffe Efficiency from 0.21 to 0.51) and can greatly enhance the accuracy of streamflow age distribution estimates in headwater catchment compared to using soil moisture data only. Particularly in summer months with intense precipitation, the catchment shows dominant infiltration-excess overland flow processes resulting in young water to reach to the stream. The results also demonstrate that during wet conditions, a significant portion of event water bypasses through fast flow paths. These results highlight the importance of tracer data in understanding the interplay between catchment characteristics, rainfall intensity, and water storage release.

How to cite: Turk, H., Hrachowitz, M., Schulz, K., Strauss, P., Blöschl, G., Stumpp, C., and Stockinger, M.: Integrating High-Resolution Tracer Data with Soil Moisture and Precipitation Dynamics to Characterize Streamflow Age Distribution in a Headwater Catchment, EGU General Assembly 2024, Vienna, Austria, 14–19 Apr 2024, EGU24-8814, https://doi.org/10.5194/egusphere-egu24-8814, 2024.

Non-perennial streams, i.e., rivers that periodically cease to flow, are the focus of increasing research attention. Understanding how the spatiotemporal dynamics of runoff generation drives expansions and contractions of their active stream network is still challenging, due to the complex interplay among climate, topography, and geology. In this context, experimental data on the spatiotemporal variations of the wet channels of a river network are very valuable to study the joint variations of active stream length (L) and discharge at the catchment outlet (Q) and to analyze the processes driving such complex L-Q patterns. However, experimental data usually do not provide insights on what happens below the catchment surface; therefore, important insights can be gained by integrated surface-subsurface hydrological modeling (ISSHM), whereby the spatial configuration of the wet channels, the corresponding catchment discharge and the processes that drive the wetting and drying of different portions of the stream network can be simulated across the whole surface-subsurface continuum. In this study, we used CATHY (CATchment HYdrology) to simulate the stream network dynamics of two virtual catchments with the same, spatially homogeneous, subsurface characteristics (hydraulic conductivity, porosity, water retention curves, depth to bedrock) but different morphology (shape and slope). By running simulations under transient and steady-state conditions for different levels of antecedent catchment wetness, we investigated the role of topography, climate, and morphology on the resulting L-Q relation and on the processes that lead to the emergence of wet channels while comparing the numerical results with corresponding outcomes from simplified analytical formulations. Overall, we show that ISSHMs are useful tools to identify the main physical drivers of non-perennial streams, thanks to their capability of accurately describing the spatiotemporal variations of the storages and fluxes across the landscape, which eventually control network dynamics.

How to cite: Zanetti, F., Botter, G., and Camporese, M.: Looking below the ground: analyzing the processes that drive spatiotemporal variation of wet channels in dynamic river networks using a physics-based hydrological model, EGU General Assembly 2024, Vienna, Austria, 14–19 Apr 2024, EGU24-10046, https://doi.org/10.5194/egusphere-egu24-10046, 2024.

EGU24-10603 | Orals | HS2.2.5

Exposing Seasonal and Spatial Variability in Storage and Release Upstream of the Outlet 

Natalie Ceperley, Sabina Kurmann, Anna Meier, Martine Helfer, and Bettina Schaefli

Understanding the seasonal interplay of subsurface storage and release of water is critical to drought risk assessment in alpine environments because of the substantial carry-over effects of snow. Spatial variation across the catchment and its compartments governs the seasonal interplay and can shift dramatically according to annual fluctuations in snowfall. This analysis investigates the interaction between scale and yearly anomalies in assessing seasonal patterns of storage and release interpreted through the annual stable isotope signal (δ2H, δ18O, and δ17O) within the Vallon de Nant catchment in the Swiss Alps. We explore the limitation of simplifying catchment processes to a single outlet that integrates upstream water storage and release but overlooks nuanced variations within different compartments, including upstream springs, tributaries, near-surface groundwater, and vegetation (Larix decidua) and years with more and less snow.

Furthermore, using a mixing model, we explore the effects of seasonal precipitation dynamics by examining the summer-to-winter precipitation ratio based on the variation of stable isotopes (δ2H, δ18O, and δ17O) within these distinct compartments and across multiple observation years. Notably, our findings highlight a pronounced anomaly in the fraction of summer-to-winter precipitation within springs, particularly following the snow-drought year of 2022. This observation raises critical questions regarding the long-term sustainability of groundwater resources in alpine regions. To ascertain the broader implications of this drought-induced anomaly, we extend our investigation to include 51 National Groundwater Monitoring (NAQUA) sites across Switzerland to assess the potential recurrence of this phenomenon on a broader scale.

How to cite: Ceperley, N., Kurmann, S., Meier, A., Helfer, M., and Schaefli, B.: Exposing Seasonal and Spatial Variability in Storage and Release Upstream of the Outlet, EGU General Assembly 2024, Vienna, Austria, 14–19 Apr 2024, EGU24-10603, https://doi.org/10.5194/egusphere-egu24-10603, 2024.

Reliable quantification of subsurface dynamics in catchment hydrological models largely depends on good estimates of soil hydraulic properties which influence subsurface runoff generation, flows and storage. In most hydrological modelling concepts, the saturated hydraulic conductivity (Ksat) is a key parameter that controls the vertical transfer of water through the soil layers and the lateral subsurface flow. Ksat values are derived from direct measurements, literature, or available soil datasets, most of which do not reach depths beyond 2 or 3 m. This is one of the common motivations for limiting the soil column to shallow depths in most catchment models. This study investigates the model schematization of Ksat in an extended soil column, where Ksat measurements are absent, and the ensuing impacts on catchment hydrological functioning. The motivation is to determine a suitable modelling approach for catchments with deeper soil columns to sufficiently capture the subsurface, including the groundwater, and the feedback with the surface.

Different Ksat–depth relationships were conceptualized and implemented in the distributed hydrological model wflow_sbm. Most wflow_sbm applications so far have used a standard soil column thickness of 2.0 m and an exponentially declining Ksat with depth. The different Ksat schematizations were tested in the Dutch-German catchment Vecht where the model soil column was extended to capture the groundwater system.

The results reveal the impact of an extended soil column and the different Ksat schematizations on catchment water balance, surface and subsurface flows, and water table depths. Varying changes were observed among the different Ksat schematizations but all produced generally good, and in some cases improved, model performance when compared with observations of river discharge and water table depth. The results demonstrate the suitability of extending the soil column and applying the different vertical Ksat–depth relationships in catchment hydrological models.

How to cite: Mendoza, R., Weerts, A., and van Verseveld, W.: Assessment of saturated hydraulic conductivity-depth relationships and extended soil column thickness in catchment hydrological modelling, EGU General Assembly 2024, Vienna, Austria, 14–19 Apr 2024, EGU24-11384, https://doi.org/10.5194/egusphere-egu24-11384, 2024.

EGU24-11740 | ECS | Posters on site | HS2.2.5

Biological connectivity indicates hydrological flow pathways in the subsurface 

Yvonne Schadewell, Sören Köhler, Peter Chifflard, and Florian Leese

Extreme rainfall events are likely to increase in intensity and frequency due to climatic changes and therefore the forecast of flooding events will become more important in the following decades. The flow properties of rainwater in the subsurface play a critical role in the flood formation process, but the underlying mechanism of this subsurface stormflow (SSF) formation has not been fully understood so far. Here, we explore the viability of environmental DNA (eDNA) as an indicator for small-scale flow pathway reconstruction. eDNA comprises genetic signatures from organisms across the Tree of Life (ToL), from whole microorganisms to molecular traces of higher taxa, such as plants or animals. The degree of similarity of biodiversity patterns indicates biological and therefore, in principle, also hydrological connectivity. As part of the SSF Research Unit we characterised 3 trenched hillslopes in 4 catchment areas in Germany and Austria through eDNA ToL-metabarcoding. With this broad-range approach, we aim to understand whether and how eDNA diversity patterns can inform subsurface flow pathways. We found three-dimensional connectivity patterns of biodiversity indicating systematic barriers as well as pathways of hydrological connectivity within each hillslope. Variation between catchments reflects their geographic differences as well as geological peculiarities. Although our results support the potential of eDNA to identify flow pathways and enhance our understanding of SSF, we are still at the beginning of understanding the viability of eDNA as a tracer in hydrological research. Nonetheless, making use of such natural occurring tracers can extend our understanding of hydrological phenomena and can contribute to a more accurate flood prediction.

How to cite: Schadewell, Y., Köhler, S., Chifflard, P., and Leese, F.: Biological connectivity indicates hydrological flow pathways in the subsurface, EGU General Assembly 2024, Vienna, Austria, 14–19 Apr 2024, EGU24-11740, https://doi.org/10.5194/egusphere-egu24-11740, 2024.

EGU24-12256 | Orals | HS2.2.5

Antecedent soil moisture conditions and receiving rainfall predict high streamflow in flashy watershed in Hawaiʻi 

Yinphan Tsang, Maxime Gayte, Yu-Fen Huang, and Yen-Wei Pan

Extreme events such as heavy precipitations and associated floods often have devastating consequences on societies and ecosystems. However, extreme rainfall alone is not the sole driver that results in high flow. Previous studies highlighted that annual maximum daily rainfall exhibits inconsistency with annual peak discharge in their occurrence timing in Hawaiʻi. The mechanism of runoff generation and, therefore, consequential storms and floods remain unclear. In this study, we investigated the linkage between extreme rainfall and high discharge events. Rainfall, soil moisture, and discharge data, in one watershed on Oahu and one on Maui were used in this study. We defined antecedent soil moisture conditions using Antecedent Soil Moisture Indexes (ASI) calculated from soil moisture data. We compared the timing of the occurrence of annual maximum hourly or accumulated (from three to twelve hours) rainfall and annual peak discharge. Then, we estimated the timing of high-flow events based on antecedent soil moisture conditions and maximum hourly rainfall. Multi-linear regressions were used to estimate high-flow event timing. Finally, we compared these estimates with the actual high-discharge events. We found out that the consistency between the timing of maximum rainfall and the timing of annual peak flow did not improve when we used hourly or accumulated hourly rainfall. Nevertheless, the consistency improved when we included antecedent soil moisture conditions by including ASI. We successfully estimated the occurrence timing of majority high-flow events at the site on Oahu and at the site on Maui. These accurate estimations emphasize the importance of incorporating soil moisture with hourly rainfall to estimate high discharge events and increase our understanding of flood events induced by extreme rainfall in Hawaiʻi.

How to cite: Tsang, Y., Gayte, M., Huang, Y.-F., and Pan, Y.-W.: Antecedent soil moisture conditions and receiving rainfall predict high streamflow in flashy watershed in Hawaiʻi, EGU General Assembly 2024, Vienna, Austria, 14–19 Apr 2024, EGU24-12256, https://doi.org/10.5194/egusphere-egu24-12256, 2024.

EGU24-13242 | ECS | Orals | HS2.2.5

Controls on soil moisture variability on two Mediterranean hillslopes during dry and wet periods using wavelet coherence analysis 

Ilenia Murgia, Konstantinos Kaffas, Matteo Verdone, Francesca Sofia Manca di Villahermosa, Andrea Dani, Federico Preti, Christian Massari, Catalina Segura, and Daniele Penna

Although topography and evapotranspiration rates are the main determinants of soil moisture, climatic forcings play a crucial role. In the Mediterranean climate, the marked sensitivity of soil moisture to alternations between wet and dry periods exerts a strong control on hydrological and ecohydrological processes at the hillslope and catchment scales.

We monitored soil moisture in two hillslopes in the Re della Pietra experimental catchment, Appennine mountains, Tuscany, central Italy. The two hillslopes (HS1 and HS2) show different morphological characteristics, such as elevation (≅ 670m asl for HS1 and 940m asl for HS2), slope (≅ 26° for HS1 and 36° for HS2), and tree composition (fruit chestnut grove converted into coppice in HS1 and pure beech forest in HS2). For two years, soil moisture was measured in each hillslope, at three different positions and two different depths (15 and 30 cm) along a longitudinal transect. We used wavelet coherence analysis to evaluate the dominant factors controlling soil moisture variability in the two hillslopes during dry and wet periods.

Preliminary results reveal a clear coupling of soil moisture at 15 cm and 35 cm on both hillslopes during wet periods, indicating a relatively homogeneous soil water content across the two depths. Conversely, a decoupling occurs during dry periods when soil moisture values at 35 cm are greater than those at 15 cm, reflecting significant solar radiation, atmospheric demand, and tree water uptake from shallow soil layers. During dry periods, we observed significant differences in soil moisture between the two depths in HS1 compared to HS2, suggesting that local conditions affect hillslope-scale soil moisture response.

Ongoing analyses investigate the role of rainfall, solar radiation, vapor pressure deficit, and tree transpiration on soil moisture spatio-temporal variability on the two hillslopes.

How to cite: Murgia, I., Kaffas, K., Verdone, M., Manca di Villahermosa, F. S., Dani, A., Preti, F., Massari, C., Segura, C., and Penna, D.: Controls on soil moisture variability on two Mediterranean hillslopes during dry and wet periods using wavelet coherence analysis, EGU General Assembly 2024, Vienna, Austria, 14–19 Apr 2024, EGU24-13242, https://doi.org/10.5194/egusphere-egu24-13242, 2024.

EGU24-13275 | ECS | Orals | HS2.2.5

Seasonal variability of surface run-off, recharge and soil moisture dynamics in lowland catchments 

Mahdi Miri, Helena Galys, Christof Hübner, Martin Sauter, Felix Becker, and Irina Engelhardt

For an effective water resources management in regions faced with scarcity understanding infiltration dynamics in the unsaturated zone at a high temporal-spatial resolution is essential for quantifying stored water volumes in the vadose zone.

Our pilot-site (area 790 km²) is the Lower Spree catchment, located E of Berlin, Germany.This area is characterized by a continental climate and a low water supply compared to other German states. Increasing industrial water-use (e.g.Tesla factory) and increased irrigation demand causes conflicts over water availability for the different water user.Three aquifers(GWL 1 to 3)in the Lower Spree consist of sands and gravel-sands. Since 1980, the groundwater level in all aquifers has collectively dropped by 5m. The planned phase-out of coal mining up-stream of Berlin will reduce the discharge of the river Spree by 50-75%. With an average precipitation of 549 mm/y,average recharge decreases to 114 mm/y. Landuse varies between forests(46%) and grasslands(20%).The soil types range from Histosols and Fluvisol and are followed by an unsaturated zone's thickness varying from 5 to over 50m.  

We installed in pilot site 8 pressure-sensors in lakes, 12 pressure-sensors in streams, 8 pressure-sensors in groundwater observation wells and 21 Time Domain Reflectometry (TDR)sensors at various depths (25, 50 and 75 cm)in the unsaturated zone within different soil types and landuse.

Hydrological regimes,in ground and surface water, are affected by a high seasonal variability. Approximately 35% of the river discharge results from baseflow, which feed lakes and ecosystems. Comparison between coniferous forest-dominated and grassland-dominated areas shows that coniferous- forest plays a crucial role in attenuating streamflow variability.Lag-times between precipitation and discharge response are similar for both landuse(2-4 days).However, coniferous-forests result in decreasing river discharge during and immediately after precipitation.

Due to the shallow thickness of unsaturated-zone(<10m) in the southern, groundwater levels in both GWL 1 and 2quickly respond with a lag-time of 25-65 days to precipitation. The northern and central areas, characterized by a deeper unsaturated-zone(>15m)and the lag-time increases to 96-153 days.The groundwater flow system provides a highly relevant water resource for rivers and lakes and due reduced baseflow(35% of the discharge)and the short lag-time of a few days summer periods and droughts with limited precipitation results in a drying of streams and enormous lake level drop.5 streams dried from (May-August),also 7 streams and 5 lakes exhibited declining water levels from(winter-summer).

Soil Moisture Active Passive(SMAP)satellite estimates near-real time surface soil-moisture(5 cm-depth) and root zone soil-moisture(1 m-depth)with 9 km resolution.We compared SMAP with our measured soil moisture obtaining correlation-coefficients of(0.31-0.63).Higher soil-moisture values are observed in grassland and peat-soil.The soil-moisture curves indicate that the soils below coniferous-forests have a larger capacity to store and release water than those below in grassland.Based on these measurements we will be able to design a sophisticated water management concept:using the surplus of discharge during autumn,winter and store it our lakes.For the later infiltration into the unsaturated zone and groundwater we can identify regions with i)optimal storage capability of the vadose zone,ii)best protection of the artificially enriched groundwater from evapotranspiration loss.iii) maximum storage volumes,and iv) minimum discharge loss into lakes and streams.

How to cite: Miri, M., Galys, H., Hübner, C., Sauter, M., Becker, F., and Engelhardt, I.: Seasonal variability of surface run-off, recharge and soil moisture dynamics in lowland catchments, EGU General Assembly 2024, Vienna, Austria, 14–19 Apr 2024, EGU24-13275, https://doi.org/10.5194/egusphere-egu24-13275, 2024.

EGU24-14582 | ECS | Orals | HS2.2.5

Lessons from a decade-long drought and non-recovery: hydrological processes understanding and modelling 

Margarita Saft, Murray Peel, Timothy Peterson, Keirnan Fowler, Luca Trotter, and Hansini Weligamage

Prolonged changes in climatic conditions can induce unexpected shifts in catchment hydrologic functioning due to the indirect impact of catchment adaptation on streamflow. In a multiyear drought, streamflow can be reduced significantly more than expected from the typical response to the same annual precipitation. For example, the same annual rainfall in the first and the tenth years of a dry period is likely to result in significantly lower streamflow during the tenth year than in the first year. Such hydrological shifts were first detected in Australia during the Millennium Drought (1997 – 2009). Since then, similar shifts were also reported in studies from other continents. Subsequently, it was also discovered that catchments, once they shift their hydrologic behaviour, may not necessarily recover back to the pre-drought behaviour even after record-breaking floods and years of annual rainfall similar to the pre-drought conditions. Observed shifts not only challenge some common assumptions of long-term hydrologic functioning but also present an interesting practical problem as hydrological models tend to reproduce historic behaviour and systematically overestimate the streamflow when the hydrologic shifts occur. Here we present the results from a large collaborative project in Australia devoted to two questions (1) which hydrological processes are responsible for the observed shifts and (2) how to improve our hydrological models to provide robust predictions under non-stationary climate? We hope that the lessons from the Millennium drought and post-drought period will be helpful in the other parts of the world where similar hydrological shifts were or will be observed.

How to cite: Saft, M., Peel, M., Peterson, T., Fowler, K., Trotter, L., and Weligamage, H.: Lessons from a decade-long drought and non-recovery: hydrological processes understanding and modelling, EGU General Assembly 2024, Vienna, Austria, 14–19 Apr 2024, EGU24-14582, https://doi.org/10.5194/egusphere-egu24-14582, 2024.

EGU24-18248 | Posters on site | HS2.2.5

Spatial patterns and temporal dynamics of subsurface hillslope-stream connectivity 

Theresa Blume, Natasha Gariremo, Anne Hartmann, Alexey Kuleshov, Ilja van Meerveld, and Luisa Hopp

Subsurface hillslope-stream connectivity is a major control on runoff-generation and catchment storage dynamics. However, detecting this connectivity is challenging, as processes in the subsurface are not easily observable. Furthermore, we are faced with a high spatial variability as well as pronounced temporal dynamics.

In this context, we are investigating three catchments in German mid-mountain ranges: Black Forest, Ore Mountains and Sauerland. The experimental design consists of three trenched hillslopes per catchment as well as numerous observation wells and stream gauges along the stream. Water samples are taken at all locations during snapshot campaigns and are analyzed for major cations and anions to complement event-based sampling at the trenches and in the stream. This comparative design aims at moving beyond single-site insights to gaining a broader view of the process and its spatio-temporal patterns. First observations of these patterns based on physical and chemical signals of subsurface connectivity are presented.

How to cite: Blume, T., Gariremo, N., Hartmann, A., Kuleshov, A., van Meerveld, I., and Hopp, L.: Spatial patterns and temporal dynamics of subsurface hillslope-stream connectivity, EGU General Assembly 2024, Vienna, Austria, 14–19 Apr 2024, EGU24-18248, https://doi.org/10.5194/egusphere-egu24-18248, 2024.

EGU24-18826 | ECS | Posters on site | HS2.2.5

Influence of rainfall event characteristics on the subsurface stormflow response: a multi-site analysis 

Emanuel Thoenes, Bernhard Kohl, Markus Weiler, and Stefan Achleitner

In many natural landscapes, subsurface stormflow (SSF) is a runoff-producing mechanism which can substantially contribute to the storm hydrograph of a stream. Despite its importance, its complex and highly dynamic nature have hindered its conceptualization and integration in most hydrological models. The lack of general rules to describe SSF is partly linked to the fact that SSF studies are often conducted at only one specific site or analyze only a handful of storm events. In the quest to gain a better understanding of the processes governing SSF, multiple SSF-capturing trenches have been excavated on intensely instrumented hillslopes characterized by different land uses, geology, soils and climates. The trenches are 10-15 m wide and 2-3 m deep and are vertically divided into an upper and lower flow-capture zone, which allows to study SSF at different depths. At the sites, SSF was continuously recorded over a period of ca. 1.5 year, during which numerous rainfall events occurred. This study analyses how the different rainfall event characteristics (e.g. total rainfall, intensity, etc.) influence the SSF response and to what degree the relationships between rainfall and SSF event characteristics are affected by the initial subsurface conditions (i.e. initial trenchflow and initial water content).

How to cite: Thoenes, E., Kohl, B., Weiler, M., and Achleitner, S.: Influence of rainfall event characteristics on the subsurface stormflow response: a multi-site analysis, EGU General Assembly 2024, Vienna, Austria, 14–19 Apr 2024, EGU24-18826, https://doi.org/10.5194/egusphere-egu24-18826, 2024.

EGU24-22500 | Posters on site | HS2.2.5

Understanding low-flow periods based on river and aquifer recessions using a sequential groundwater-surface water modelling approach 

Lemuel Ramos, Daniel Paradis, Erwan Gloaguen, Louis-Charles Boutin, and René Lefebvre

Low-flow periods are a seasonal component of a river regime characterized by a reduction in discharge. This recession phenomenon is associated with water shortages and quality problems that are detrimental to communities and ecosystems that rely on groundwater-fed rivers. This paper presents a methodology to understand the dynamics of low-flow periods by utilizing the information contained in the response of the river-aquifer system during recessions. The methodology is developed and applied to the 5000 km2 Yamaska River watershed in Quebec (Canada), where critical low-flow conditions are frequently observed in winter and summer, and where the heterogeneous nature of the geology can lead to complex interactions between the rivers and the aquifer. Multiple water table and streamflow recession events recorded over a period of 20-50 years at 16 monitoring wells and 22 gauging stations were combined to obtain an averaged recession response at each location, referred to as the master recession curve (MRC). An MRC, which is minimally influenced by precipitation and evapotranspiration processes, contains important information about the flow and storage characteristics of an aquifer and its connection to rivers. Moreover, MRCs from wells and gauging stations provide complementary information. The recession-based analysis provided a tenable framework to disregard the surface modelling component at this stage since, during the depletion periods, the system is minimally influenced by atmospheric processes. A sequential modelling approach was devised to construct an integrated hydrological model using the HydroGeoSphere simulator to capture the groundwater-surface water interactions during low flows. First, the hydraulic characteristics of the subsurface were derived from the MRCs by history matching with the model in fully saturated mode. With the subsurface domain characterized, the rest of the processes were parameterized to capture the observed groundwater and surface water hydrographs using the fully integrated model. Beyond elucidating the low-flow dynamics, this methodology showcases efficiency due to its sequential strategy, alleviating the inherent computational burdens of setting up integrated models. This communication presents the outcomes from conceptual and numerical analyses, contributing to understanding hydrologic systems under low-flow conditions.

How to cite: Ramos, L., Paradis, D., Gloaguen, E., Boutin, L.-C., and Lefebvre, R.: Understanding low-flow periods based on river and aquifer recessions using a sequential groundwater-surface water modelling approach, EGU General Assembly 2024, Vienna, Austria, 14–19 Apr 2024, EGU24-22500, https://doi.org/10.5194/egusphere-egu24-22500, 2024.

EGU24-164 | ECS | PICO | HS2.2.6

What is more important for model calibration: information on the discharge dynamics or information on the discharge volume? 

Franziska Clerc-Schwarzenbach, Ilja van Meerveld, Marc Vis, and Jan Seibert

Previous studies have shown that information on the discharge dynamics (e.g., variation in the water level) is valuable to constrain the parameters of a lumped hydrological model for some catchments, and that information on the discharge volume further improves model performance for most catchments. It has been suggested that for some catchments an estimate of the mean discharge already leads to a good model fit but so far, there have not been any systematic studies to test this. Therefore, it remains unclear for which catchments (i.e., for which regions or for catchments with specific characteristics) information on the discharge dynamics are most valuable for model calibration, for which catchments an estimate of the mean annual discharge is already sufficient, and for which catchments both data sources are needed for model calibration. Therefore, we used a subset of the Caravan large-sample dataset and assessed the value of water level measurements, estimates of the mean discharge, and both data sources together for the calibration of a simple bucket-type hydrological model. Preliminary results suggest that mainly climatic characteristics determine the relative value of the different data types for hydrological model calibration. This type of assessment of the value of data for a wide range of catchments allows for more optimal allocation of resources when it comes to obtaining limited data for the calibration of hydrological models for ungauged catchments.

How to cite: Clerc-Schwarzenbach, F., van Meerveld, I., Vis, M., and Seibert, J.: What is more important for model calibration: information on the discharge dynamics or information on the discharge volume?, EGU General Assembly 2024, Vienna, Austria, 14–19 Apr 2024, EGU24-164, https://doi.org/10.5194/egusphere-egu24-164, 2024.

Risks to the planet's freshwater systems are currently subjected to soaring concern worldwide. We applied the coupled Social-Ecological Systems approach to study and systematize the risks due to ten major water related stressors (variability, overuse, groundwater, floods, droughts, organic pollution, salinity, eutrophication, drinking water, sanitation). We used gridded socioeconomic indicator data for the analysis of human exposure and its vulnerability (adaptive capacity) to these stressors in 540 river basin units covering the whole world. Among the stressors, lack of appropriate sanitation scored highest, followed by droughts and eutrophication. The large and densely populated Asian basins, Ganges-Brahmaputra-Meghna, Indus, and Yangtze, topped, followed with the largest African basins (the Nile, Niger, and Congo/Zaire). The other top-ten basins were Rajasthan Inner Basins, Huang, Hai, and Myanmar South Coastal Basins. The ranking changed when weighting the stressor data (on physical entities) with socioeconomic vulnerability data (on societal ones). Each included basin unit manifested a specific risk profile. For the basin units, we developed a typology using principal component and cluster analyses. This allowed us identification of the roles of vulnerability and population exposure in worldwide river basin risk framework and revealed distinctive basin clusters associable with the following characterizations: (1) too little water – high salinity – high variability – overexploited, (2) high organic pollution, eutrophic, flood prone – highly populated, (3) water abundant, (4) lacking infrastructure – low socioeconomic development. These clusters largely form a sequence as for instance there are basins that fall at the edge of (1), with many similarities already to (2), etc. The analysis provides a new perspective to comparison of world’s river basins and looking for novel learning opportunities for river basin management and risk reduction policies, especially in a multihazard-multirisk setting allowing the identification of the basin-specific risk profile and the roles of vulnerability and exposure.

How to cite: Varis, O.: Typology of world’s river basins regarding socio-ecological resilience to ten major water related risks, EGU General Assembly 2024, Vienna, Austria, 14–19 Apr 2024, EGU24-3507, https://doi.org/10.5194/egusphere-egu24-3507, 2024.

EGU24-3850 | ECS | PICO | HS2.2.6

Catchment Classification-Based Comparison of Hydrological Models to Inform Water Systems Analysis 

Saumya Srivastava, Leyang Liu, Abhinav Wadhwa, Gowri Reghunath, Venkatesh Budamala, Barnaby Dobson, Nagesh Kumar Dasika, and Ana Mijic

Choosing a suitable model and determining the best calibration method are complex processes. These can be simplified by comparing uncalibrated models and analyzing modeling results based on catchment characteristics. The amalgamation of these two stages forms "informing water systems analysis." This study examines the application of the Water Systems Integrated Modelling framework (WSIMOD), which is a comprehensive water systems model applied previously for catchments in the UK, and the Soil and Water Assessment Tool (SWAT), a commonly used hydrological model in India. The comparison is conducted using a catchment classification scheme based on physiography. This approach establishes a connection between the catchment characteristics and the model performances, providing valuable insights for the analysis of water systems. WSIMOD demonstrates superior performance compared to SWAT in its out-of-the-box configuration, particularly when simulating average flows. WSIMOD necessitates a greater amount of data preparation compared to SWAT, but it involves a less complex calibration process. The performance of SWAT is highly dependent on the characteristics of each catchment, necessitating the use of multi-site calibration. WSIMOD's performance is not significantly influenced by catchment characteristics, enabling regions within the same agro-ecological zone to share identical parameter values. The catchment classification analysis indicated that to enhance the accuracy of the SWAT model, it is necessary to select topography, precipitation, and soil parameters for calibration. Additionally, the infiltration rate and residence times of water should be further refined to improve the WSIMOD model. This proposed methodology facilitates and simplifies the processes of model selection and calibration.

How to cite: Srivastava, S., Liu, L., Wadhwa, A., Reghunath, G., Budamala, V., Dobson, B., Kumar Dasika, N., and Mijic, A.: Catchment Classification-Based Comparison of Hydrological Models to Inform Water Systems Analysis, EGU General Assembly 2024, Vienna, Austria, 14–19 Apr 2024, EGU24-3850, https://doi.org/10.5194/egusphere-egu24-3850, 2024.

EGU24-3872 | PICO | HS2.2.6

CAMELS-CZ: A catchment attribute database for hydrological and climatological studies using a large sample of catchments 

Michal Jenicek, Radovan Tyl, Ondrej Nedelcev, Ondrej Ledvinka, Petr Šercl, Jana Bernsteinová, and Jakub Langhammer

Hydrological methods based on the analysis of data from a large sample of catchments with different characteristics (large-sample hydrology; comparative hydrology) allow a comprehensive analysis of the hydrological regime and thus a description of hydrological variability and change in the components of the water balance. These methods provide insight into hydrological processes shaped by environmental and climatic factors and allow more general conclusions to be drawn. However, besides climate and runoff data, catchment attributes, such as geology, soils, topography and vegetation, are essential for effective hydrological behaviour analysis. For these reasons, the global hydrological community has recently developed a number of freely available large-scale datasets known as CAMELS (Catchment Attributes and MEteorology for Large-sample Studies), which provide catchment attributes, as well as hydrological and meteorological time series, in a comparable structure at national scales. The aim of this contribution is to present the current state of preparation of the CAMELS database for Czechia (CAMELS-CZ) as a reference data platform for analysis and modelling, using a large sample of catchments.

The database contains 389 catchments in Czechia maintained by the Czech Hydrometeorological Institute (CHMI) for which daily runoff data are available for at least 30 years. Catchments cover a variety of elevations (200–1600 m a.s.l) and runoff regimes (from pluvial to nival). Climate attributes were calculated from newly created daily climate grids (mean daily precipitation, mean daily air temperature) available in spatial resolution 1 km. Vegetation attributes are calculated based on Landsat data and the Corine Land Cover database. Soil texture database, hydraulic soil characteristics and geology maps are used for soil and geology attributes calculation. The subset of the catchments included in the upcoming CAMELS-CZ database has already been used for several purposes, mostly in mountain areas to analyse changes in snow cover and their influence on both low and high flows. For this subset, simulations of the conceptual hydrological model have been performed and used. The future goal is to prepare runoff simulations for all catchments included in the CAMELS-CZ database which will be publicly available for use among the hydrological community.

How to cite: Jenicek, M., Tyl, R., Nedelcev, O., Ledvinka, O., Šercl, P., Bernsteinová, J., and Langhammer, J.: CAMELS-CZ: A catchment attribute database for hydrological and climatological studies using a large sample of catchments, EGU General Assembly 2024, Vienna, Austria, 14–19 Apr 2024, EGU24-3872, https://doi.org/10.5194/egusphere-egu24-3872, 2024.

EGU24-3944 | PICO | HS2.2.6

Large-sample hydrology lessons 

Wouter Berghuijs

The emergence of large-sample hydrology datasets has opened many new opportunities to derive more robust and more generalizable conclusions about hydrological processes and models. Here I showcase several examples of how large-sample hydrology can help unveil unknown hydrological behaviors, test and refine existing hypotheses, and challenge current modeling practices. Such advancements can include generating a better understanding of how climate, landscapes, and humans shape the diversity of hydrological conditions we encounter worldwide but can also focus on general emergent behaviors that are surprisingly similar between places. I also reflect on how large-sample hydrology datasets could evolve to become an even more productive playground for hydrology to advance.  

How to cite: Berghuijs, W.: Large-sample hydrology lessons, EGU General Assembly 2024, Vienna, Austria, 14–19 Apr 2024, EGU24-3944, https://doi.org/10.5194/egusphere-egu24-3944, 2024.

EGU24-3984 | ECS | PICO | HS2.2.6

How catchment ecosystems globally manage root water access under different (climate) conditions 

Fransje van Oorschot, Ruud van der Ent, Tom Viering, Andrea Alessandri, and Markus Hrachowitz

The root zone storage capacity (Sr) is the maximum volume of water in the subsurface that can potentially be accessed by vegetation for transpiration. Sr is an essential characteristic of hydrological systems as it controls the partitioning of precipitation into evaporation and runoff. Understanding the influence of climatic and landscape characteristics on Sr is essential for predicting how different ecosystems will respond to disturbances such as human activities and climate change. While the magnitude of Sr on ecosystem scale is partly influenced by landscape characteristics such slopes, bedrock properties and soil characteristics, there is widespread consensus that it is primarily controlled by climate conditions (i.e., the temporal dynamics of water and energy availability) as vegetation optimizes its root system to sustain atmospheric water demand.

Several studies have identified the influence of various climatic variables on Sr, but for different regions conflicting influences of these variables on Sr appeared. So far, it remains unclear what aspects of the climate are most important controls on Sr on global scale. This research aims to bridge this gap by exploring how different climatic and landscape characteristics influence the magnitude of Sr globally. Based on discharge measurements in a large sample of catchments worldwide (~4000), we estimated the actual Sr using the memory method as in Van Oorschot et al. (2021, 2023). With a random forest model we were able to adequately predict Sr using various climatic and landscape characteristics. Analysis of the driving variables of the random forest model show that the precipitation inter-storm duration is the most dominant control on Sr, and positively influences Sr in all regions. On the other hand, the influence of mean precipitation on Sr is conflicting in different regions. We found that in water limited regions, increased mean precipitation leads to increased Sr, while in energy limited regions, increased mean precipitation leads to decreased in Sr. Furthermore, the developed model is used to extrapolate the catchment Sr estimates to a global gridded map of Sr ensuring coverage of data-scarce regions. This extrapolated map can be used for more adequate modelling of subsurface vegetation water availability in large scale hydrological and land surface models.

van Oorschot, F., van der Ent, R. J., Hrachowitz, M., and Alessandri, A.: Climate-controlled root zone parameters show potential to improve water flux simulations by land surface models, Earth Syst. Dynam., 12, 725–743, https://doi.org/10.5194/esd-12-725-2021, 2021.

van Oorschot, F., van der Ent, R. J., Alessandri, A., and Hrachowitz, M.: Influence of irrigation on root zone storage capacity estimation, EGUsphere [preprint], https://doi.org/10.5194/egusphere-2023-2622, 2023.

How to cite: van Oorschot, F., van der Ent, R., Viering, T., Alessandri, A., and Hrachowitz, M.: How catchment ecosystems globally manage root water access under different (climate) conditions, EGU General Assembly 2024, Vienna, Austria, 14–19 Apr 2024, EGU24-3984, https://doi.org/10.5194/egusphere-egu24-3984, 2024.

EGU24-4626 | ECS | PICO | HS2.2.6

Global natural catchment classification based on hydrological similarity 

Huan Xu, Hao Wang, Pan Liu, Weibo Liu, and Chutian Zhou

Catchments are important in hydrology, and a catchment classification framework helps to understand the catchment hydrological behaviors, explain the differences between catchments, and predict in ungauged catchments. However, no research has yet established a global catchment classification framework.

We selected a group of hydrological signatures to represent catchment hydrological behaviors, and used the fuzzy clustering method to classify natural catchments. To explain the classification rules and the catchment attributes dominating the classification, we used decision tree and random forests, respectively. The results show that: the global natural catchments are divided into six classes by the fuzzy clustering method, most of the classes are extreme in at least one hydrological behavior, and the selected hydrological signatures can distinguish the catchment groups; The decision tree gives explicit classification rules, with an accuracy rate of over 93%, which reasonably explains the fuzzy clustering results and facilitates the judgment of catchment classes; The precipitation characteristics, aridity index and the lowest altitude of catchments are considered to be the dominant catchment attributes for catchment classification, among which the average daily precipitation is the most important; Compared with physiography, land cover, soil and geological factors, the relative importance of climate factors in catchment classification exceeds 50%; The global catchment classification pattern output by random forests is a comprehensive reflection of hydrological signatures and can better reflect the hierarchical differences in hydrological behavior among catchments in contrast to climate classification.

The validity of the proposed global classification pattern is supported by its consistency with regional studies conducted in Europe, the United States, and Australia. Furthermore, about 64.1% classification accuracy of catchment class and 62.0% simultaneous hit rates of eight hydrological signatures can be achieved by the random forests model, demonstrating the ability of proposed catchment classification in estimating the hydrological behavior of ungauged catchments. As the first step towards global catchment classification, this study developed a natural catchment classification method based on hydrological similarity using data-driven approaches, obtained a global distribution map, and laid the foundation for establishing a generally accepted global catchment classification framework.

How to cite: Xu, H., Wang, H., Liu, P., Liu, W., and Zhou, C.: Global natural catchment classification based on hydrological similarity, EGU General Assembly 2024, Vienna, Austria, 14–19 Apr 2024, EGU24-4626, https://doi.org/10.5194/egusphere-egu24-4626, 2024.

EGU24-5544 | ECS | PICO | HS2.2.6

Catchments deviate less from their own Budyko curves over time than previously thought 

Muhammad Ibrahim, Miriam Coenders, Markus Hrachowitz, and Ruud van der Ent

Quantification of precipitation partitioning into evaporation and runoff is crucial for predicting future water availability. Over longer time scales, the widely used Budyko Framework, which is a curvilinear relationship between evaporative index (i.e., actual evaporation over precipitation) and aridity index (i.e., potential evaporation over precipitation), robustly quantifies precipitation partitioning under prevailing climatic conditions. Global long-term records indicate that catchments generally follow Budyko curves; however, a narrow scatter around these curves have been demonstrated in various studies, raising questions about the framework's applicability. To address this, we quantified (based on historical long-term water balance data of over 2000 river catchments world-wide) the global, regional and local distributions of deviations from parametric Budyko curves, between multiple 20-year periods over the last century. This process resulted in four 20-year distributions of deviation for each catchment. On average, it was observed that in 73% of the catchments, the long-term median deviation values across these distributions were not significantly different from zero suggesting minimal to no median deviations. Furthermore, it is found that for majority of the catchments (78%) the four 20-year distributions of deviations are not significantly different to each other implying consistency in deviations among different 20-year periods. Our analysis revealed that, for 80% of these catchments, the long-term median deviations, for the last century, fall within the range of ±0.02 with a very narrow spread in Interquartile Range values. These findings demonstrate that while catchments do not precisely follow the expected Budyko trajectories, the deviations are small and quantifiable. Consequently, by taking into account these deviations, the Budyko Framework remains a valuable tool for predicting future evaporation and runoff under changing climatic conditions, within quantifiable margins of error.

How to cite: Ibrahim, M., Coenders, M., Hrachowitz, M., and van der Ent, R.: Catchments deviate less from their own Budyko curves over time than previously thought, EGU General Assembly 2024, Vienna, Austria, 14–19 Apr 2024, EGU24-5544, https://doi.org/10.5194/egusphere-egu24-5544, 2024.

EGU24-5850 | PICO | HS2.2.6

Wastewater discharges and urban land cover dominate urban hydrology signals across England and Wales  

Gemma Coxon, Hilary McMillan, John P Bloomfield, Lauren Bolotin, Joshua F Dean, Christa Kelleher, Louise Slater, and Yanchen Zheng

Urbanisation is a critical driver of changes in streamflow. These changes are not uniform across catchments due to the diverse changes to water sources, storage, and pathways in urban river systems from impervious areas, abstractions, sewage networks, and sewage treatment plans. While land cover data are typically used to explain urbanisation, water management practices are poorly quantified. Consequently, urbanisation impacts are often difficult to detect and quantify, and the relative impact of these factors is currently poorly understood.

Here, we assess urban impacts on streamflow dynamics for a large-sample of catchments across England and Wales using data characterising water management practices and land cover. We quantify urban impacts on a wide range of streamflow dynamics (flow magnitudes, variability, frequency and duration) using random forest models. We demonstrate that wastewater discharges from sewage treatment plants and urban land cover dominate urban hydrology signals across England and Wales and have different impacts on streamflow dynamics. Wastewater discharges increase low flows and reduce flashiness in urban catchments, while urban land cover increases flashiness and frequency of medium and high flow events. We demonstrate the need to move beyond land cover metrics and include other features of urban river systems in large-sample hydrological analyses to quantify current and future drivers of urban streamflow.

How to cite: Coxon, G., McMillan, H., Bloomfield, J. P., Bolotin, L., Dean, J. F., Kelleher, C., Slater, L., and Zheng, Y.: Wastewater discharges and urban land cover dominate urban hydrology signals across England and Wales , EGU General Assembly 2024, Vienna, Austria, 14–19 Apr 2024, EGU24-5850, https://doi.org/10.5194/egusphere-egu24-5850, 2024.

EGU24-6641 | ECS | PICO | HS2.2.6

EStreams: Building an integrated dataset of streamflow, hydro-climatic variables and landscape attributes for catchments in Europe 

Thiago V. M. do Nascimento, Julia Rudlang, Marvin Höge, Ruud van der Ent, Jan Seibert, Markus Hrachowitz, and Fabrizio Fenicia

High-quality datasets are essential to hydrological analysis1. Although many such datasets exist, their accessibility is typically time-consuming and often challenging. Recently, there has been a significant spread of large-sample hydrology (LSH) datasets. Many of these datasets are referred to as Catchment Attributes and MEteorology for Large-sample Studies (CAMELS) or derivations1–4, covering hydro-climatic and landscape static attributes and time series data. These data have collectively been made available5 including first extensionsbased on daily time series such as the Global Runoff Data Base (https://www.bafg.de/GRDC)6. Additionally, there have been collection efforts for global streamflow data indices and signatures7–9. However, such globally accessible dataset represent only a small fraction of what is currently available. 

Here we present EStreams, a new dataset and data-access catalogue of streamflow, hydro-climatic  variables and landscape descriptors for over 15,000 catchments in 39 European countries, set to be released in 2024. The data spans up to 100 years of streamflow data and includes several open-source catchment aggregated landscape attributes on topography, soil, lithology, vegetation, and land cover, as well as climatic forcing and streamflow time-series, hydro-climatic signatures and a catalogue of streamflow providers (“European streamflow data and where to find them”). EStreams offers both an extensive and extensible data collection along with codes for data retrieval, aggregation and processing. Our goal is to extend current large-sample datasets and take a step towards integrating hydro-climatic and landscape data across Europe.

References

1. Addor, N., Newman, A. J., Mizukami, N. & Clark, M. P. The CAMELS data set: Catchment attributes and meteorology for large-sample studies. Hydrol Earth Syst Sci 21, 5293–5313 (2017).

2. Coxon, G. et al. CAMELS-GB: hydrometeorological time series and landscape attributes for 671 catchments in Great Britain. Earth Syst Sci Data 12, 2459–2483 (2020).

3. Höge, M. et al. CAMELS-CH: hydro-meteorological time series and landscape attributes for 331 catchments in hydrologic Switzerland. Earth Syst Sci Data 15, 5755–5784 (2023).

4. Klingler, C., Schulz, K. & Herrnegger, M. LamaH-CE: LArge-SaMple DAta for Hydrology and Environmental Sciences for Central Europe. Earth Syst Sci Data 13, 4529–4565 (2021).

5. Kratzert, F. et al. Caravan - A global community dataset for large-sample hydrology. Scientific Data 2023 10:1 10, 1–11 (2023).

6. Färber, C. et al. GRDC-Caravan: extending the original dataset with data from the Global Runoff Data Centre (0.1) [Data set]. Zenodo https://zenodo.org/records/8425587 (2023) doi:10.5281/ZENODO.8425587.

7. Do, H. X., Gudmundsson, L., Leonard, M. & Westra, S. The Global Streamflow Indices and Metadata Archive (GSIM)-Part 1: The production of a daily streamflow archive and metadata. Earth Syst Sci Data 10, 765–785 (2018).

8. Gudmundsson, L., Do, H. X., Leonard, M. & Westra, S. The Global Streamflow Indices and Metadata Archive (GSIM)-Part 2: Quality control, time-series indices and homogeneity assessment. Earth Syst Sci Data 10, 787–804 (2018).

9. Chen, X., Jiang, L., Luo, Y. & Liu, J. A global streamflow indices time series dataset for large-sample hydrological analyses on streamflow regime (until 2022). Earth Syst Sci Data 15, 4463–4479 (2023).

How to cite: M. do Nascimento, T. V., Rudlang, J., Höge, M., van der Ent, R., Seibert, J., Hrachowitz, M., and Fenicia, F.: EStreams: Building an integrated dataset of streamflow, hydro-climatic variables and landscape attributes for catchments in Europe, EGU General Assembly 2024, Vienna, Austria, 14–19 Apr 2024, EGU24-6641, https://doi.org/10.5194/egusphere-egu24-6641, 2024.

Accurate meteorological forcings are a fundamental component for reliable hydrological modelling. Gridded meteorological products offer spatially distributed information facilitating hydrological model applications. In addition, they are often available at large scale (e.g. regional or continental scale), easing the application on large samples of basins, and generally enhancing the replicability of the experiments. Nevertheless, the accuracy of these products varies, and it must be rigorously assessed to ensure the validity of model simulations.

This study aims to evaluate the accuracy of four gridded meteorological products: three based on ground observations (E-OBS, SCIA, and ARCIS) and one reanalysis (ERA5-Land), across a large sample of over 150 catchments in three administrative regions of Northern Italy. To assess their reliability, we adopt an indirect evaluation method. This involves assessing the performance of a conceptual hydrological model, which is forced with each of the four gridded meteorological products, over the selected catchments.

The E-OBS dataset, developed by the ECA&D project, offers climatic variables at a 0.1° x 0.1° (~11 x 11 km) resolution from 1950 onwards across Europe. ERA5-Land is a global scale reanalysis dataset from ECMWF which provides data at a 9 x 9 km resolution from 1950. Finally, ARCIS (Pavan et al., 2019) and SCIA (Desiato et al., 2007) datasets are Italian meteorological products, respectively at 5 x 5 and 10 x 10 km spatial resolution, starting from 1961.

For the study catchments, four distinct meteorological forcings, including the daily time series of areal mean precipitation, temperature, and potential evapotranspiration, were estimated using each of the four gridded products. Daily streamflow data were collected from three different regional agencies managing hydroclimatic data and were manually validated.

The rainfall-runoff model used for the indirect validation is the CemaNeige-GR6J (Coron et al., 2023), a daily lumped and continuously simulating model. We investigate the performances of the model in simulating streamflow, in order to get insights on the reliability of the gridded products across the region and along the years.

Model performances are also analysed against catchment features (such as orography and presence of upstream reservoirs) and data set characteristics (such as gauge network density) to investigate whether certain conditions influence the representativeness of the gridded products and the corresponding streamflow simulations, enhancing our understanding of their applicability and limitations. 

References

Coron, L., Delaigue, O., Thirel, G., Dorchies, D., Perrin, C. and Michel, C. (2023). airGR: Suite of GR Hydrological Models for Precipitation-Runoff Modelling. R package version 1.7.4, doi: 10.15454/EX11NA, URL: https://CRAN.R-project.org/package=airGR.

Desiato, F., Lena, F., & Toreti, A. (2007). SCIA: a system for a better knowledge of the Italian climate. Bollettino di Geofisica Teorica ed Applicata, 48(3), 351-358.

Pavan, V., Antolini, G., Barbiero, R., Berni, N., Brunier, F., Cacciamani, C., ... & Torrigiani Malaspina, T. (2019). High resolution climate precipitation analysis for north-central Italy, 1961–2015. Climate Dynamics, 52, 3435-3453.

How to cite: Sarigil, G., Neri, M., and Toth, E.: An Indirect Validation of National and International Gridded Precipitation Products in Northern Italy through Rainfall-Runoff Model Application, EGU General Assembly 2024, Vienna, Austria, 14–19 Apr 2024, EGU24-6800, https://doi.org/10.5194/egusphere-egu24-6800, 2024.

EGU24-7429 | ECS | PICO | HS2.2.6

River Flow Dynamics across Europe: Insights from continental to regional scales 

Julia Rudlang, Markus Hrachowitz, Thiago V. M. do Nasciamento, Ruud van der Ent, and Fabrizio Fenicia

River flow is affected by change in climate and land use. Today, we see many different magnitudes and directions of trends of change across European rivers with respect to streamflow, which affects water supply and hydrological extremes such as floods and droughts. Moreover, the drivers of change in streamflow and its temporal trends vary on multiple scales from local to regional to continental. 

In this study, we identify changes, trends and possible patterns of change in the hydrological response across the whole of Europe, as well as its underlying drivers. We do this by using multi-decadal streamflow data that was collected from more than 15000 European stream flow gauging stations in 39 European countries. This large-sample dataset, named EStreams and set to be published in 2024, provides valuable new perspectives on the hydrological response in Europe.

In the analysis, similar catchments across Europe were clustered into groups, based on their hydrological response, as characterised by a wide range of hydrological signatures. This allowed to identify the different controls of hydrological response between the groups, such as climate, landscape and seasonal water balance.

Furthermore, the high-resolution streamflow dataset used allowed for the opportunity to zoom in further and gave a meaningful look at the differences within the clustered groups. This ensured that it was possible to investigate the differences in hydrological responses that were primarily dictated by landscape characteristics, as within cluster catchments are assumed to have limited climate variability. 

Altogether, mapping out the different hydrological responses across Europe and the differences in hydrological response within nested sub-catchments gave a comprehensive identification and quantitative description of dominant landscape characteristics shaping the hydrological response within clusters of hydro-climatically distinct European regions.

How to cite: Rudlang, J., Hrachowitz, M., V. M. do Nasciamento, T., van der Ent, R., and Fenicia, F.: River Flow Dynamics across Europe: Insights from continental to regional scales, EGU General Assembly 2024, Vienna, Austria, 14–19 Apr 2024, EGU24-7429, https://doi.org/10.5194/egusphere-egu24-7429, 2024.

EGU24-8081 | PICO | HS2.2.6

Introducing the BULL Database – Spanish Basin attributes for Unraveling Learning in Large-sample hydrology 

Javier Senent-Aparicio, Gerardo Castellanos-Osorio, Francisco Segura-Méndez, Adrián López-Ballesteros, Patricia Jimeno-Sáez, and Julio Pérez-Sánchez

Large-Sample Hydrology (LSH) plays a crucial role in understanding different hydrological processes, using large basin datasets as fundamental resources that allow researchers to explore multiple facets of hydrology (Addor et al. 2020). In recent years, multiple LSH datasets adapted to the national scale have been developed. We present BULL, a novel basin dataset for large-sample hydrological studies in Spain. BULL includes data from 503 watersheds, providing daily hydrometeorological time series (streamflow and climatic variables) and attributes related to basin characteristics. To collect these attributes, the recommendations included in the CARAVAN (Kratzert et al. 2023) initiative for the generation of a truly open global hydrological dataset have been followed. BULL covers the entire territory of Peninsular Spain, which is characterized by its wide climatic and hydrological variability, including catchments ranging from 100 km2 to 2000 km2. One of the main novelties of BULL to other national-scale datasets is the analysis of the hydrological alteration of the basins included in this dataset. The hydrological alteration is calculated by statistical comparison of the monthly flow values measured in the gauges and the flow values obtained from the Integrated System for Rainfall-Runoff Model (SIMPA) (Estrela and Quintas, 1996) developed by the Center for Hydrographic Studies (CEDEX), for the entire Spanish territory. This aspect is especially important in countries such as Spain, which is characterized as one of the countries in the world where rivers suffer from the highest levels of anthropization. The BULL dataset is made freely available to scientific users via the open-access repository Zenodo.


References:

Addor, N., Do, H.X., Alvarez-Garreton, C. et al. Large-sample hydrology: recent progress, guidelines for new datasets and grand challenges. Hydrological Sciences Journal 65, 712–725 (2020). https://doi.org/10.1080/02626667.2019.1683182

Estrela, T., Quintas, L., 1996. A distributed hydrological model for water resources assessment in large basins. Proceedings of 1st International Conference on Rivertech. Vol. 96, pp. 861–868.

Kratzert, F., Nearing, G., Addor, N. et al. Caravan - A global community dataset for large-sample hydrology. Sci Data 10, 61 (2023). https://doi.org/10.1038/s41597-023-01975-w

How to cite: Senent-Aparicio, J., Castellanos-Osorio, G., Segura-Méndez, F., López-Ballesteros, A., Jimeno-Sáez, P., and Pérez-Sánchez, J.: Introducing the BULL Database – Spanish Basin attributes for Unraveling Learning in Large-sample hydrology, EGU General Assembly 2024, Vienna, Austria, 14–19 Apr 2024, EGU24-8081, https://doi.org/10.5194/egusphere-egu24-8081, 2024.

Catchments descriptors are widely used in hydrological science to infer dominant hydrological processes, identify, and transfer information across catchments and scales. However, persistent use of descriptors aggregated as spatially-lumped values (i.e., catchment averages), without considering their spatial variability within catchments might hamper the efficiency of these tasks. In this study, we use interpretable machine learning to investigate the value of topographically enhanced catchment descriptors (i.e., weighting them using distance to outlet, distance and height to the nearest drainage and stream order) belonging to seven distinct categories (i.e., climate, topography, land use, geology, hydrogeology, soil physical properties, and soil water properties) for predicting mean values, variability and seasonality characteristics of hydrological droughts and runoff events occurred in 401 German catchments in the period 1979-2002.

We found that the spatially-differentiated catchment descriptors aggregated with topographical enhancing are able to predict droughts and runoff events characteristics more accurately than the lumped descriptors. The improvement is particularly promising for prediction of runoff event characteristics. Particularly, descriptors aggregated using height above the nearest drainage and stream order are essential for accurate prediction of variability of runoff events characteristics, while the proximity to the stream and to the outlet are more relevant for predicting their seasonality. In case of droughts, the descriptors weighted by the proximity to the stream improve the predictions of the variability and seasonality of duration and severity (i.e., deficit volume) of hydrological droughts. Moreover, we show that spatially-differentiated aggregation has the potential to identify the importance of descriptors that appeared irrelevant when aggregated in lumped way, particularly shading a light on the role of mean annual potential evapotranspiration and forest land cover descriptors for the prediction of mean values and seasonality of time scale of runoff events, and the role of groundwater yield and wetland land cover to predict the variability of time rise of runoff events. Our study highlights that development of the methods for spatially-differentiated aggregation has potential to disentangle the effects of different physio-geographical controls on event response in different catchments and to improve its predictability in ungauged locations.

How to cite: Ziani, C., Ribbe, L., Aala, S., and Tarasova, L.: The value of spatially-differentiated  catchments descriptors for predicting characteristics of hydrological events in German catchments, EGU General Assembly 2024, Vienna, Austria, 14–19 Apr 2024, EGU24-8259, https://doi.org/10.5194/egusphere-egu24-8259, 2024.

Large-sample hydrology aims to identify common patterns in the hydrologic behaviour of numerous catchments at the regional, continental and global scales. Large-sample datasets play a fundamental role in the context of large-sample hydrology as they collect data from multiple catchments and hydroclimatic variables.

This study focuses on the characterization of the water balance for 189 Spanish headwater catchments. The different ratios derived from the water balance equation will be calculated using multiple hydroclimatic datasets available for the Spanish domain for two consecutive and equally long periods: 1990-2005 and 2006-2020. Precipitation data will be extracted from a gridded dataset at 0.05º resolution from the Spanish Meteorological Agency (AEMET). Streamflow time series will be provided by the Spanish Center for Public Work and Experimentation (CEDEX). Evaporation data will be gathered from the Global Land Evaporation Amsterdam Model (GLEAM) versions 3.7a and 3.7b.

The results of this work will highlight the potential of using large-sample datasets to characterize the water balance for the Spanish catchments and will reveal key changes in their hydrologic behaviour during the last three decades.

ACKNOWLEDGMENTS: This study has been funded by a Humboldt Research Fellowship from the Alexander von Humboldt Foundation.


How to cite: Yeste, P. and Bronstert, A.: Large-sample evaluation of the water balance for the Spanish catchments using multiple hydroclimatic datasets, EGU General Assembly 2024, Vienna, Austria, 14–19 Apr 2024, EGU24-8309, https://doi.org/10.5194/egusphere-egu24-8309, 2024.

EGU24-8643 | PICO | HS2.2.6

The value of hydrologic observatories for large sample hydrology and vice versa 

Thorsten Wagener, Gemma Coxon, John P. Bloomfield, Wouter Buytaert, Matthew Fry, David M. Hannah, Gareth Old, and Lina Stein

Hydrologic observatories have been a cornerstone of hydrologic science for many decades, advancing hydrologic process understanding with focused field observations and targeted experiments. Observatories present our key opportunity for achieving great depth of hydrologic investigation, most often at the headwater catchment scale. We address two main aspects concerning hydrologic observatories in this contribution: (1) While reviews of individual hydrologic observatories and observatory networks exist, no study has investigated the diversity of observatories to understand whether common aspects increase the likelihood of scientific success. We synthesise information from 80 hydrologic observatories and conduct 25 interviews with observatory leads to fill this gap. We find that scientific outcomes are most enhanced by involving scientific and stakeholder communities throughout observatory inception, design, and operation; by enabling infrastructure to be adjustable to changing ideas and conditions; and by facilitating widespread data use for analysis. (2) While observatories are key for advancing local hypotheses, the transferability of knowledge gained locally to other places or scales has often been difficult or even remained elusive. Headwater catchments in particular show a wide range of process controls often only understood if viewed in a wider regional context of climatic, topographic, or other gradients. We therefore must place observatories into the wider tapestry of hydrologic variability, for example through comparison with large samples of catchments, even though significantly less information is available to characterise these diverse systems. We provide some thoughts on how this connection could be improved through digital infrastructure, mobile observational infrastructure and a renewed focus on gradients and contrasts of controlling processes. We believe that there is a significant opportunity to enhance transferrable knowledge creation in hydrology.

How to cite: Wagener, T., Coxon, G., Bloomfield, J. P., Buytaert, W., Fry, M., Hannah, D. M., Old, G., and Stein, L.: The value of hydrologic observatories for large sample hydrology and vice versa, EGU General Assembly 2024, Vienna, Austria, 14–19 Apr 2024, EGU24-8643, https://doi.org/10.5194/egusphere-egu24-8643, 2024.

EGU24-11151 | PICO | HS2.2.6 | Highlight

A global dataset of near-natural basins for climate change detection 

Steve Turner, Jamie Hannaford, Lucy Barker, Harry Dixon, Adam Griffin, Amit Kumar, and Gayatri Suman and the ROBIN Network

As hydrological extremes become more severe in the warming world, impacts to livelihoods, infrastructure, and economies worsen. To attribute emerging trends to climate change, we need to remove the signal of anthropogenic activities, such as, the presence of dams, land-cover change, channelisation and the abstraction of water for public water supplies, industry and agriculture. These human disturbances can obscure climate change signals and distort trends in river flows and, in some cases, lead to a complete reversal of true, natural trends. 

There have been many studies of long-term changes in river flows around the world however, at a global scale (as represented by Intergovernmental Panel on Climate Change (IPCC) reports), confidence in observed river flow trends remains low. It can also be a challenge to integrate the results of various regional- and national-scale studies due to the different methods used, hampering consistent continental- and global-scale assessments. 

Identifying the problem, many countries have ‘Reference Hydrometric Networks’ (RHNs) which consist of natural or near-natural catchments. Globally, however, these types of catchment can be sparse in both their spatial and temporal nature and in order to provide real value to international assessments of hydrological change on a consistent basis (such as those undertaken by the IPCC), an integrated approach is needed. 

The Reference Observatory of Basins for INternational hydrological climate change detection or ROBIN initiative, is a worldwide collaboration to bring together the first global RHN. The network currently consists of partners from almost 30 countries spanning every continent, the first iteration of the ROBIN dataset is now available – a consistently defined network of near-natural catchments consisting of over 3,000 catchments.  

Here we will present the criteria for inclusion of river flow data in the ROBIN network, detail the quality control undertaken to prepare the dataset for analysis, and highlight data availability. Where data sharing allows, the dataset of daily mean river flow data at near-natural sites has been made openly available for the community to use as a resource to interrogate and conduct analyses on and alongside this the ROBIN team are undertaking the first, truly global analysis of trends in river flows using minimally disturbed catchments. 

Going forwards, whilst the first iteration of the ROBIN dataset has been published, it is our aim to continue network growth to increase the number of countries involved and add more catchments and even more diverse geographies to the dataset to continue developing this unique resource of river flow data. 

With the support of international organisations, including WMO, UNESCO and IPCC, ROBIN will lay the foundations for an enduring network of catchments, to support global assessments of climate-driven trends and variability in the future. 

How to cite: Turner, S., Hannaford, J., Barker, L., Dixon, H., Griffin, A., Kumar, A., and Suman, G. and the ROBIN Network: A global dataset of near-natural basins for climate change detection, EGU General Assembly 2024, Vienna, Austria, 14–19 Apr 2024, EGU24-11151, https://doi.org/10.5194/egusphere-egu24-11151, 2024.

EGU24-12051 | ECS | PICO | HS2.2.6

Living among Artiodactyls - Current status and future plans of the Caravan dataset 

Frederik Kratzert, Nans Addor, Guy Shalev, and Oren Gilon

High-quality datasets are essential to support hydrological science and modeling. Several datasets exist for specific countries or regions (e.g. the various CAMELS datasets). However, these datasets lack standardization, which makes global studies difficult. Additionally, creating large-sample datasets is a time and resource consuming task, often preventing the release of data that would otherwise be open.

About a year ago, we released the Caravan (as in “a series of camels”) dataset, a community initiative that consists of 

  • a large-sample hydrology dataset which is derived from globally consistent data sources, and
  • open source code that facilitates the creation of Caravan extensions to new regions by leveraging cloud computing on Earth Engine.

On release, the Caravan dataset included 6830 gauges from 14 different countries with daily streamflow records (median record length ~30 years), 9 meteorological variables (from 1981 - 2020) in different daily aggregations, 4 hydrological reference states, and a total of 221 catchment attributes.

Since then, the dataset has been extended with several thousands of gauges in various, previously uncovered regions by different community members. Importantly, GRDC has joined the Caravan community effort and released a Caravan extension for 5357 watersheds (covering the period from 1950-2022) from the GRDC station catalog from 25 different countries. 

At this point, and with all extensions combined, the Caravan dataset now consists of 22494 gauge stations from 35 countries and contains a total of 660,382 years of streamflow records (median still at ~30 years).

With this submission, we want to reflect in more detail on the current state of the Caravan community efforts and share our thoughts and ideas for the future of Caravan. Additionally, we welcome interactions with owners of hydrological datasets interested in contributing to Caravan and discussions with users of large-sample datasets to understand the needs and desires for datasets and inform our future efforts. All information on Caravan can be found at https://github.com/kratzert/Caravan/

How to cite: Kratzert, F., Addor, N., Shalev, G., and Gilon, O.: Living among Artiodactyls - Current status and future plans of the Caravan dataset, EGU General Assembly 2024, Vienna, Austria, 14–19 Apr 2024, EGU24-12051, https://doi.org/10.5194/egusphere-egu24-12051, 2024.

The question of what makes two catchments hydrologically similar is of fundamental importance for the understanding of catchment hydrology and for transferring hydrological information from gauged to ungauged catchments. In the regionalisation of rainfall-runoff model parameters, the definition of a similarity measure for identifying the donors basins as a function of catchment characteristics is an essential step for the most consolidated techniques. As demonstrated by a very large number of studies in the literature, conducted all around the world, the main controls of catchment similarity may change subtsantially across different hydroclimatic regions.

The recent availability of large-sample catchment dataset for rainfall-runoff studies in different hydroclimatic regions across the globe allows scientists to conduct comparative experiments for enhancing our knowledge about the factors that shape hydrological processes, including catchment similarity and regionalisation.

The aim of this study is to test how hydroclimatic characteristics in different regions of the world influence the main factors that control catchment similarity when regionalising rainfall-runoff model parameters, using a homogenised modeling protocol.

Two conceptually different bucket-type rainfall-runoff models are calibrated on more CAMELS-type large samples of catchments all around the world, characterised by different hydroclimates and data availability (i.e. streamgauge density). For each regional sample and for each model, one of the most consolidated parameter regionalisation approaches, based on the choice of a set of “most similar” donor catchments and on the transfer of the entire sets of model parameters from the donors to the target catchment, is applied in jack-knife cross-validation. Naturally, in such approach the choice of the donors (and therefore the regionalised model parameters) strictly depends on the catchment descriptors used to define the similarity measure between target and gauged basins.

Assuming that the higher is the similarity of the donors to the target catchment, the better is the model performance, the idea of the work is to assess which catchment features better represent similarity for the transfer of model parameters in each of the regional samples. In particular, it is interesting to analyse if and how such features change across different hydroclimates. In order to reach such goal, the regionalisation technique is implemented by including different typologies and combinations of climatic and/or morphological characteristics when defining similarity, therefore obtaining different donors and different regionalised model performances. The findings achieved in the different large samples are compared, mainly focusing on how the set of basin descriptors bringing to the best model performances varies across the different hydroclimatic regions.

How to cite: Neri, M. and Toth, E.: Exploring the controls of catchment similarity for the transfer of rainfall-runoff model parameters: a comparative study in different large-sample datasets around the globe, EGU General Assembly 2024, Vienna, Austria, 14–19 Apr 2024, EGU24-12411, https://doi.org/10.5194/egusphere-egu24-12411, 2024.

EGU24-12459 | PICO | HS2.2.6

FOCA: a new quality-controlled collection of floods and catchment attributes in Italy 

Pierluigi Claps, Giulia Evangelista, Daniele Ganora, Paola Mazzoglio, and Irene Monforte

In recent years, various national databases of geomorphoclimatic watershed attributes have been released. Relevant examples are the CAMELS datasets for countries such as the United States, Australia, Chile, Brazil, Switzerland, France, Germany, and the United Kingdom (now integrated into Caravan), and LamaH-CE. 

This work introduces FOCA (Italian FlOod and Catchment Atlas), a national-scale collection of 631 Italian basins that we fully characterized by providing more than 100 attributes related to geomorphology, soil, land cover, NDVI, climate, and extreme precipitation. The basins reported in FOCA are derived from a national-scale inventory of peak floods and annual maximum daily floods named "Catalogo delle Piene dei Corsi d'acqua Italiani", realized thanks to a data rescue initiative performed by merging recent data, already available in digital format, with historical information available on printed documents.

The selection of descriptors that we included in FOCA followed three main criteria: a) national spatial coverage; b) absence of regional or local distortions; c) adequate spatial resolution. Preference was given to local sources, resorting to global data only in specific cases. The inclusion of basin boundaries will allow users to assess additional descriptors using their models or datasets.

FOCA stands out from other national datasets due to its robust collection of geomorphological descriptors, computed using the r.basin algorithm of GRASS GIS and subjected to thorough quality controls. Another distinctive feature is the incorporation of extreme rainfall characteristics, evaluated using station data instead of reanalysis data — deviating from the approach often seen in the development of CAMELS datasets. For this purpose, the Improved Italian - Rainfall Extreme Dataset (I2-RED) has been used. I2-RED is a national collection of rainfall extremes measured by more than 5000 rain gauges from 1916 up to the present that was developed as the outcome of a data rescue project.

With this nationwide data collection, a wide range of environmental applications, with particular reference to flood studies, can now be undertaken on the Italian territory.

How to cite: Claps, P., Evangelista, G., Ganora, D., Mazzoglio, P., and Monforte, I.: FOCA: a new quality-controlled collection of floods and catchment attributes in Italy, EGU General Assembly 2024, Vienna, Austria, 14–19 Apr 2024, EGU24-12459, https://doi.org/10.5194/egusphere-egu24-12459, 2024.

EGU24-12781 | ECS | PICO | HS2.2.6

How does reservoir-regulation impact hydrological extremes in the Alps? 

Jonas Götte, Massimiliano Zappa, and Manuela Brunner

Low-flows and floods cannot be viewed as purely natural phenomena since their
occurrence and characteristics are influenced by water storage and regulation.
Reservoir-regulation has strong impacts on flow seasonality and can intensify
or attenuate hydrological extremes and change their duration. It is yet hardly
quantified how reservoir regulation affects low- and high flows in the Alps, where
most reservoirs are operated for hydropower production. We need a better un-
derstanding of the effect of reservoir-regulation on hydrological extreme events
in order to assess the readiness of current regulation schemes for the future.
However, the analysis of river flow and estimation of hydrological extremes is
challenging in regulated catchments, particularly in large-samples studies, where
detailed information about reservoir-regulation is missing.
In this study, we analyse how reservoir-regulation has changed the magni-
tude and frequency of hydrological extreme events in the European Alps. To do
so, we have compiled a dataset of discharge stations and reservoirs which in-
cludes reservoir characteristics such as the first year of operation or the storage
capacity. With this information, we distinguish between discharge time series
before and after reservoir construction for about 70 catchments in the European
Alps and calculate a normalized reservoir storage capacity for each catchment.
Then, we calculate flood return periods based on annual maxima discharges
and a generalized extreme value distribution and the minimum 7 day moving
average runoff (MAM7) for each time series. We compare flood and low-flow
characteristics before and after reservoir construction for each catchment to as-
sess the influence of reservoir-regulation on hydrologic extremes. Furthermore,
we analyse changes in the seasonality of hydrological extremes and evaluate how
it is affected by seasonal reservoir-regulation schemes.
Our preliminary results show that reservoirs affect both, low-flows and floods.
Annual low-flows have mostly increased since reservoir-construction, while their
variability has decreased. Annual maximum flows with low return periods (be-
low 10-years) have mostly decreased after reservoir-construction with catch-
ments with a larger normalized storage capacity showing a stronger effect of
reducing extreme flows. Consequently, we conclude that reservoirs operated for
hydropower production mostly have an alleviating effect on both low-flows and
floods.

How to cite: Götte, J., Zappa, M., and Brunner, M.: How does reservoir-regulation impact hydrological extremes in the Alps?, EGU General Assembly 2024, Vienna, Austria, 14–19 Apr 2024, EGU24-12781, https://doi.org/10.5194/egusphere-egu24-12781, 2024.

EGU24-13885 | ECS | PICO | HS2.2.6

A web-based watershed delineation tool and its application to delineate 24,000 watersheds across Canada 

Kasope Okubadejo, Juliane Mai, and Nandita B. Basu

Watershed delineation is the identification of the boundary of a drainage basin, representing the contributing area for a specific outlet. This application of hydrography is essential in the analysis of watershed behaviour and has historically been performed manually. The automation of delineation provides faster and more consistent results which can be more accurate and reproducible definitions of borders compared to the results of the manual delineation. There is a wide range of software and tools capable of performing watershed delineation automatically; all generally following the same steps – utilizing conditioned DEMs to create flow direction and accumulation rasters used in addition to a specified pour point that defines the extent of contributing area desired. These different tools and their results have been explored, addressing their similarities, contrasts, and complications. Using this analysis, selected methods have been included in a web application for watershed delineation for users to either delineate individual points selected on a web map or upload lists of points of interest The automatically delineated watersheds are then made available for download. One tool has been deemed most applicable and has been used to delineate more than 24,000 watersheds across Canada successfully. The presentation will include (1) the results of the comparison of the various tools tested, (2) a demonstration of the webtool as well as (3) the presenting the results of the large scale delineation task across Canada.

How to cite: Okubadejo, K., Mai, J., and Basu, N. B.: A web-based watershed delineation tool and its application to delineate 24,000 watersheds across Canada, EGU General Assembly 2024, Vienna, Austria, 14–19 Apr 2024, EGU24-13885, https://doi.org/10.5194/egusphere-egu24-13885, 2024.

The percentage of total impervious area (TIA) is a popular proxy for the level of urbanization, adopted in many applications ranging from water quality assessments in developed watersheds to regional modeling for flood prediction in ungauged basins. However, TIA cannot satisfactorily capture important interactions between land development and its impacts on runoff patterns and peak flows, such as the effects of the spatial distribution of impervious patches, or the distinction between directly and indirectly connected impervious areas. In other words, TIA cannot incorporate information on hydrologic connectivity.  However, during a storm, these differences may have major implications on the surface runoff volumes that are contributed to the stream network from the impervious portions of a watershed, as well as their travel times, ultimately leading to large variability in the hydrologic response. E.g., the occurrence of pervious areas along the runoff paths from impervious patches to the stream may significantly decrease water volumes from those patches, attenuating both their impacts on direct runoff and the risks of stream contamination from localized pollution sources. Many recent strategies for flood mitigation at the local scale (also known as best management practices, or BMPs) exploit the concept of impervious-area disconnection to reduce peak-flow volumes via marginal landscape changes.

Although several other urbanization descriptors have been proposed in the literature, there is no agreement yet on alternative indices that could replace the traditional TIA in hydrological applications, so it is still predominantly used. One reason may be that these alternative measures may be difficult to derive for a given case-study basin. Some require the topology of the watershed’s stormwater drainage network, which is rarely available, especially in the case of large-scale studies. Other methods analyze patterns in concurrent flow and precipitation series, attempting to implicitly determine the proportion of directly connected impervious area from runoff coefficients, under the assumption that it is this component of the basin’s surface that governs its hydrologic response when smaller storms occur.  But this approach comes with major uncertainties related to the potentially variable contributions from pervious areas, depending on their antecedent soil moisture conditions.

We propose a new GIS framework for deriving connectivity-based urbanization measures using the digital elevation model, land-use, and soil maps of a watershed. We analyze its correlation to other, established urbanization measures, and test its predictive power in regionalization approaches. Our new index can aid urban water management on many fronts, including the assessment of alternative candidate BMPs on the overall connectivity of a watershed, enhancing the accuracy of regional models for prediction in ungauged basins (PUBs), and the analysis of the relationships between urbanization and water quality. The proposed methodology uses easily available datasets and can be implemented using Google Earth Engine and other open-source software, thus ensuring broad applicability irrespective of the study scale, as well as consistent analyses across different regions.

How to cite: Dell'Aira, F. and Meier, C. I.: Beyond Total Impervious Area: A New GIS Framework for Characterizing Urban Basins in Water Resources Management Applications incorporating Hydrological Connectivity, EGU General Assembly 2024, Vienna, Austria, 14–19 Apr 2024, EGU24-14235, https://doi.org/10.5194/egusphere-egu24-14235, 2024.

EGU24-14923 | PICO | HS2.2.6

A few hundred catchments later – lessons learned from modeling large catchment samples 

Jan Seibert, Ilja van Meerveld, Marc Vis, Franzisca Clerc-Schwarzenbach, and Sandra Pool

Traditionally, hydrological models are applied to one or a few catchments because preparation of the input and calibration data for a more extensive set of catchments is challenging. The availability of data sets with hydrometeorological time series for large numbers of catchments has been a game changer in hydrological catchment modeling in recent years. One example are the CAMELS data sets with the basic data to run hydrological models for several hundreds of catchments in various countries. In several recent studies, we have used these data sets for bucket-type modeling of a large number of catchments in different regions. In this presentation, I will discuss some of our main findings:

  • Variability of results: Simulation results vary considerably between catchments, making it pertinent to apply a model to a large number of catchments for robust results.
  • Uncalibrated model performance: Simple bucket-type models can provide surprisingly good results for some catchments even when not calibrated. This needs to be considered when we assess model performances.
  • Prediction in ungauged catchments: It can be challenging to improve simulations for ungauged catchments by regionalization as it is not obvious how to choose the most suitable donor catchments. Thanks to data sets with a vast number of potential donor catchments, we found that almost perfect donor catchments seem to exist in most cases. However, the challenge remains to identify them.
  • Model structure: For some catchments, a simplified soil routine with only one free parameter (instead of three) outperformed the standard model version.
  • Value of data: Large samples of catchments allow us to evaluate the value of different data types: a limited number of streamflow gaugings and other data types, such as stream level, stream width or water level class data, can be informative for streamflow simulations.

How to cite: Seibert, J., van Meerveld, I., Vis, M., Clerc-Schwarzenbach, F., and Pool, S.: A few hundred catchments later – lessons learned from modeling large catchment samples, EGU General Assembly 2024, Vienna, Austria, 14–19 Apr 2024, EGU24-14923, https://doi.org/10.5194/egusphere-egu24-14923, 2024.

EGU24-14974 | PICO | HS2.2.6

GRDC-Caravan: extending the original dataset with data from the Global Runoff Data Centre 

Claudia Färber, Henning Plessow, Simon Mischel, Frederik Kratzert, Nans Addor, Guy Shalev, and Ulrich Looser

Large-sample datasets are essential in hydrological science to support modelling studies and global assessments. The Global Runoff Data Centre (GRDC) is an international data centre operating under the auspices of the World Meteorological Organization (WMO) at the German Federal Institute of Hydrology (BfG). Established in 1988, it holds the most substantive collection of quality assured river discharge data worldwide. Primary providers of river discharge data and associated metadata are the National Meteorological and Hydrological  Services of WMO Member States.

As the awareness for open data and reproducibility has increased in recent years, GRDC is working to simplify data provision to its users and to comply with the FAIR (findable, accessible, interoperable, reusable) principles. GRDC data and products are accessible online for non-commercial use (https://grdc.bafg.de). However, there are still hurdles on the way to a completely open and free exchange of data such as restrictive data policies and a lack of data standardisation.

Caravan is a community initiative to create a large-sample hydrology dataset of meteorological forcing data, catchment attributes, and discharge data for catchments around the world (Kratzert et al. 2023). Compared to existing large-sample hydrology datasets, the focus on Caravan is to use globally consistent forcing and attribute data to facilitate global studies. Additionally, Caravan provides the code to derive community extension on Earth Engine with as little as catchment boundaries and streamflow data required. The vision of Caravan is to provide the foundation for a truly global open source community resource that will grow over time.      

This dataset is the 6th extension to the original Caravan data set. It is based on a subset of hydrological discharge data and station-based watersheds from GRDC, which are covered by an open data policy (Attribution 4.0 International; CC BY 4.0). The dataset covers stations from 5357 catchments and 25 countries, spans 1950 – 2023, and is already publicly available on Zenodo: https://zenodo.org/records/10074416


Reference:

Kratzert, F., Nearing, G., Addor, N. et al. Caravan - A global community dataset for large-sample hydrology. Sci Data 10, 61 (2023). https://doi.org/10.1038/s41597-023-01975-w

How to cite: Färber, C., Plessow, H., Mischel, S., Kratzert, F., Addor, N., Shalev, G., and Looser, U.: GRDC-Caravan: extending the original dataset with data from the Global Runoff Data Centre, EGU General Assembly 2024, Vienna, Austria, 14–19 Apr 2024, EGU24-14974, https://doi.org/10.5194/egusphere-egu24-14974, 2024.

The field of hydroclimatology is witnessing a transformative era with the convergence of various technologies and methodologies aimed at enhancing research reproducibility and collaboration. Within this context, hydroclimatic datasets have emerged as fundamental tools for unraveling the interplay between climate and hydrology, resonating across geographical boundaries. Particularly, the exploration of large-scale datasets can shed light on hydrological differences and similarities across diverse catchments, serving both scientific and educational purposes. Efforts to enhance the availability of such datasets are ongoing globally, with the introduction of initiatives like CAMELS (catchment attributes and meteorology for large-sample studies). Despite this collective global effort to unravel hydroclimatic complexities, and the abundance of online hydrologic databases, valuable information remains fragmented and scattered across different platforms. Much local data is still presented and documented in languages other than English, impeding the transfer of knowledge between local and international communities. For example, a considerable portion of open hydrologic data provided by Swedish governmental authorities is solely accessible in Swedish, hindering its integration into pan-European or global research.

Therefore, we here introduce the community-accessible CAMELS-SE dataset, which covers 50 catchments in Sweden spanning a wide range of hydroclimatic, topographic and environmental catchment properties. The dataset includes daily hydroclimatic variables (precipitation, temperature, and streamflow) over a 60-year period (1961-2020), and information on geographical location, landcover, soil classes, hydrologic signatures, and regulation for each catchment. Data was collected from various sources, such as the Swedish Meteorological and Hydrological Institute (SMHI), the Swedish Geological Survey (SGU) and several Copernicus products provided by the European Environment Agency (EEA). The compiled, spatially-matched, and processed data is publicly available online through the Swedish National Data Service (https://snd.gu.se/en). CAMELS-SE adds a new region to the list of existing CAMELS datasets, offering a valuable resource for studying hydrological processes, climate dynamics, environmental impacts and sustainable water management strategies in Nordic regions.

How to cite: Teutschbein, C.: Introducing CAMELS-SE: Connecting 60 Years of Hydroclimatic Observations with Catchment Attributes for 50 Sites in Sweden, EGU General Assembly 2024, Vienna, Austria, 14–19 Apr 2024, EGU24-15238, https://doi.org/10.5194/egusphere-egu24-15238, 2024.

EGU24-17667 | ECS | PICO | HS2.2.6

CAMELS-DE: Benchmark dataset for hydrology – significance, current status and outlook 

Alexander Dolich, Pia Ebeling, Michael Stölzle, Jens Kiesel, Jonas Götte, Björn Guse, Sibylle Haßler, Mirko Mälicke, Larisa Tarasova, Ingo Heidbüchel, Corina Hauffe, Hannes Müller-Thomy, and Ralf Loritz

CAMELS datasets are recognized in the hydrological community as consistent and comprehensive benchmark datasets for hydrological and meteorological analyses. CAMELS stands for "Catchment Attributes and MEteorology for Large-sample Studies”. CAMELS datasets link landscape and catchment attributes (e.g. land use, geology, soil properties), hydrological time series (e.g. water level, discharge) and meteorological time series (e.g. precipitation, air temperature) in a large number of catchment areas. They clearly indicate the uncertainties and processing of individual variables and thus enable the comparison of models and data in different landscapes, but also contribute to the general understanding of hydrological processes across landscapes. This is crucial for assessing the consequences of the climate crisis and improves the basis for water resource management decisions. Although CAMELS datasets are intensively used in other countries, such a dataset is still lacking for Germany.

This contribution highlights the crucial importance of consistent and easily accessible benchmark datasets for hydrological research and education. We discuss both the challenges faced so far in compiling the dataset and the future ambitions of the project. In addition, an overview is given of the scope of the first version of the CAMELS-DE data set, which will include around 2,000 measuring stations with daily time series of discharge and water level with an average length of nearly 50 years in mainly small and medium-sized catchments. Also included are the landscape and catchment attributes as well as meteorological time series. A key focus is on the easy availability and straightforward import of data into programming environments. We discuss how such benchmark datasets not only increase efficiency in the use of environmental data, but also play a key role in ensuring the reproducibility of research results. Especially in the age of machine learning learning, they form an indispensable basis for modern, data-driven hydrology. By integrating CAMELS-DE into the research landscape, we want to emphasize that data publications and benchmark datasets are much more than a by-product of a doctoral thesis, but rather the basis and key to modern environmental science.

How to cite: Dolich, A., Ebeling, P., Stölzle, M., Kiesel, J., Götte, J., Guse, B., Haßler, S., Mälicke, M., Tarasova, L., Heidbüchel, I., Hauffe, C., Müller-Thomy, H., and Loritz, R.: CAMELS-DE: Benchmark dataset for hydrology – significance, current status and outlook, EGU General Assembly 2024, Vienna, Austria, 14–19 Apr 2024, EGU24-17667, https://doi.org/10.5194/egusphere-egu24-17667, 2024.

EGU24-17964 | ECS | PICO | HS2.2.6

Framework development and flag-based quality control for a national scale dataset using UK's Historical 15-Minute Flow Data 

Felipe Fileni, Hayley J. Fowler, Elizabeth Lewis, Fiona McLay, and Longzhi Yang

The United Kingdom has an extensive repository of 15-minute flow data dating back to the 1930s, yet this wealth of information has remained decentralized within respective measuring authorities responsible for localized quality control. Consequently, the absence of standardization has resulted in heterogeneous data records. Several discrepancies can be observed, ranging from minor issues such as having different decimal places, to bigger issues such as having duplicate records with different values or having different quality codes in the data.

In the aim of producing a quality assured and consistent 15-min flow dataset for the whole UK, data has been requested from all UK measuring authorities. The data collected laid the groundwork for the development of a quality control framework, featuring both traditional, amply academically used and UK specific quality control flags. These flags have been used to standardise the data and produce a quality assured 15-min flow dataset for the UK.

More than 1000 stations and tens of thousands of years of data have been passed through different flags aiming to identify data and stations that have suspicious data. 14 flags have been generated in the framework. The flags vary in complexity and aim to provide better understanding of the data.  Even simple flags, such as detecting negative values serve multiple purposes: from identifying tide-influenced stations characterized by negative flows, to using the flag to remove/replace the negative values for hydrological analysis.  Conversely, complex hydrology flags such as identifying large flow events preceded by large rainfall events or identifying the relationship between the high flow of stations in the same river can be used for an enhanced comprehension of hydrological systems at a national scale.

This presentation aims to elucidate the flags that have been applied to the data; spotlight interesting case studies discovered in the quality control process; and showcase the versatile applications of the flags in data selections for specific hydrological analysis. In this PICO we want to emphasize the pivotal role that appropriate data selection has in shaping robust conclusions in the field of large sample hydrology.

How to cite: Fileni, F., J. Fowler, H., Lewis, E., McLay, F., and Yang, L.: Framework development and flag-based quality control for a national scale dataset using UK's Historical 15-Minute Flow Data, EGU General Assembly 2024, Vienna, Austria, 14–19 Apr 2024, EGU24-17964, https://doi.org/10.5194/egusphere-egu24-17964, 2024.

High-quality observational data is critical for driving, evaluating, and calibrating geo-environmental models, particularly data-driven models. The quality and availability of such data greatly influence the output of these models. Over recent decades, numerous national, regional, and global observational datasets have been developed for catchment-scale hydrological modeling. However, the regional and national datasets often differ widely in data sources, formats, and variables, making their use challenging and time-consuming. Furthermore, existing global datasets do not include all available data sources and thus have limited coverage. In this presentation, we introduce a harmonized, comprehensive database that amalgamates existing national, regional, and global datasets into a unified, user-friendly resource. Our database consists of daily streamflow observations, daily time series of 10 meteorological variables, climatic and physiographic attributes, and catchment boundaries for over 28,000 catchments worldwide. These catchments range in size from 2~km$^2 to 1300~km$^2 (mean 150~km$^2$) and the number of daily streamflow observations per catchment ranges from 200 to 18,000 (mean 400). The meteorological data covers precipitation, temperature, humidity, radiation, and wind speed for each catchment. We included precipitation estimates from 17 state-of-the-art products such as CHIRPS, ERA5, GSMaP, IMERG, MSWEP, and SM2RAIN. To explore the database and retrieve data, we have developed a straightforward Python-based Application Programming Interface (API). All related code will be open sourced and accompanied by extensive documentation and usage examples. We anticipate this database will be an invaluable resource for various hydrological studies, including model calibration, evaluation, inter-model comparisons, and the assessment of different forcing datasets.

How to cite: Abbas, A. and Beck, H.: A large sample harmonized database of daily streamflow, meteorological data, and catchment attributes for over 28,000 global catchments, EGU General Assembly 2024, Vienna, Austria, 14–19 Apr 2024, EGU24-19406, https://doi.org/10.5194/egusphere-egu24-19406, 2024.

EGU24-1225 | ECS | Posters on site | HS2.2.9

A Long-term Spatial Runoff and Flood Prediction Method in Higher Accuracy 

Jiaqing Wang, Jianshi Zhao, and Quanjun Wang

When predicting future long-term runoff using hydrological models, the large uncertainty associated with general circulation models (GCMs) pose significant limitations. Additionally, current accurate long-term runoff predictions are restricted to specific locations with gauge stations, hindering basin-wide water resource planning and management. To address these challenges, this study proposes a hybrid Hydrological model, Empirical Orthogonal Function analysis, Gaussian Process Regression (HEG) model, which demonstrates higher accuracy in daily runoff prediction across the entire basin compared to the traditional multi-model ensemble mean method, with KGE improved by 0.09~0.11, and NSE improved by 0.08~0.32). Moreover, to enhance the estimation of future extreme flood risks which are of great concern of the public but are often predicted with high uncertainty, the model incorporates uncertainty interval information into prediction and is called HEGU model. Evaluations conducted in the topographically and climatically diverse Brahmaputra River Basin confirm the effectiveness of the HEGU model. The relative error of peak discharge (REPD) is reduced to an average of ~46% of that obtained through the ensemble mean method, while the correlation coefficient (CC) for flood volume estimation during the monsoon period increases from -0.054 to 0.645. Furthermore, the HEGU model demonstrates the potential to improve overall runoff prediction accuracy across the basin when the data quality of extremely few grids in the high-fidelity dataset is enhanced. The enhancement can be achieved through the incorporation of additional runoff gauge stations, remote sensing data, and other data augmentation techniques. These findings underscore the practical significance of the HEGU model, indicating its high effectiveness and applicability in real-world future hydrological projection and water resource management scenarios.

How to cite: Wang, J., Zhao, J., and Wang, Q.: A Long-term Spatial Runoff and Flood Prediction Method in Higher Accuracy, EGU General Assembly 2024, Vienna, Austria, 14–19 Apr 2024, EGU24-1225, https://doi.org/10.5194/egusphere-egu24-1225, 2024.

EGU24-1606 | ECS | Posters on site | HS2.2.9

Integrated Approach to Mekong River Flow Modeling: Data Gaps and Climate Trends 

Khosro Morovati, Keer Zhang, and Fuqiang Tian

The transboundary Mekong River, spanning approximately 4800 km with numerous tributaries and floodplains, serves as a vital resource for power generation, fisheries, and agriculture. Despite its significance, the river's productivity faces disruption due to inadequate cooperation among riparian countries regarding data sharing, the uneven distribution of gauging stations, and data gaps for many parts of the river length. This disparity poses challenges in accurately modeling the river's natural runoff, flow characteristics, and the flooded area, navigating through mountainous and relatively flat terrains.

To address this, we have developed an integrated modeling framework comprising a physically-based hydrological model and a hydrodynamic model. For 2500 km of the Mekong River’s mainstream, a highly accurate hydrodynamic model was developed. The produced velocity, water level, and discharge data were compared with gauging stations with continuous data records, showing high accuracy with NSE exceeding 0.93. Additionally, a point-by-point comparison of the yielded water level and discharge data by the hydrodynamic model was conducted with the low-resolution recorded data for stations lacking continuous time series data. Results indicated a high accuracy with an average NSE greater than 0.91, demonstrating the model's precision in capturing the dynamic behavior of the Mekong River.

The hydrodynamic model's results were then used to fill data gaps in stations with significant data deficiencies, allowing the production of reliable data and sufficient gauging network distribution for the entire basin. These datasets, combined with recorded gauging data, served as the calibration stations for the developed physically-based hydrological model. This calibration aimed to assess the impacts of climate change on natural runoff, encompassing not only the mainstream but also tributaries and lake floodplains of the Mekong River. Findings revealed a discernible declining trend in natural runoff within the Mekong River over the specified four-decade period.

This enhanced modeling capability is particularly crucial for accurately simulating dynamic river flows with insufficient continuous data. Our comprehensive approach contributes to a more precise understanding of the Mekong River's complex hydrological dynamics, supporting informed decision-making for sustainable resource management.

How to cite: Morovati, K., Zhang, K., and Tian, F.: Integrated Approach to Mekong River Flow Modeling: Data Gaps and Climate Trends, EGU General Assembly 2024, Vienna, Austria, 14–19 Apr 2024, EGU24-1606, https://doi.org/10.5194/egusphere-egu24-1606, 2024.

EGU24-4402 | ECS | Posters on site | HS2.2.9

A comprehensive method based on machine learning schemes in predicting river flow, case study: Po River 

Golmar Golmohammadi, Babak Razdar, Kourosh Mohammadi, Giovanna Grossi, and Saman Javadi

River flow forecasting has been the focus of many researchers for many years.  The methods evolved from simple statistical methods to highly sophisticated mathematical models.  In recent years, due to the advancement of computers and artificial algorithms, new methods have become increasingly reliable and easier to use.  One of the promising artificial intelligence methods is the Extreme Gradient Boosting (XGBoost) model.  XGBoost is a scalable, distributed gradient-boosting decision tree machine learning library.  It provides parallel tree boosting and is the leading machine learning library for regression, classification, and ranking problems.  Three different algorithms of XGBoost were used in this research and the results were compared.  These algorithms were Random Search, Grid Search, and CatBoost. The proposed models were conducted in a station located Pò River basin which is the longest river in Italy, and it flows from the Cottian Alps and ends at a delta projecting into the Adriatic Sea new Venice.  The data were divided into training and validation sets.  The statistical indicators included mean square error, Nash-Sutcliffe efficiency, and mean absolute error were calculated for each set to compare the efficiency of each algorithm.  These indicators showed that XGBoost using random search algorithm had better performance, although the other algorithms were also acceptable predictions.  In general, the XGBoost model could be used as a reliable tool to forecast the river flow at locations with enough historical data.

How to cite: Golmohammadi, G., Razdar, B., Mohammadi, K., Grossi, G., and Javadi, S.: A comprehensive method based on machine learning schemes in predicting river flow, case study: Po River, EGU General Assembly 2024, Vienna, Austria, 14–19 Apr 2024, EGU24-4402, https://doi.org/10.5194/egusphere-egu24-4402, 2024.

EGU24-4407 | ECS | Posters on site | HS2.2.9

 Daily Streamflow Simulations Improvement in Data Scarce Watersheds using different Optimization Techniques and Calibration Methods 

Khaoula Ait naceur, El mahdi El khalki, Abdessamad Hadri, Oumar Jaffar, Luca Brocca, Mohamed El mehdi Saidi, Yves Tramblay, and Abdelghani Chehbouni

Hydrological modeling is critical for effective water resources management, especially in developing countries such as Morocco where data are scarce. This study aims to improve daily river discharge predictions in 26 Moroccan catchments from 1993 to 2019. It evaluates the GR4J and MISDc models, focusing on optimizing their performances using four optimization techniques: Particle Swarm Optimization (PSO), the Nelder-Mead simplex algorithm (FMIN), Simulated Annealing (SA), and the Genetic Algorithm (GA). The two hydrological models are coupled with six calibration methods to provide the different ranges of uncertainties and to assess their consistency across diverse datasets. The methods include the split-sample or half-half method, the odd/even year method, as well as the calibration on a longer period than validation and vice versa. In addition, the Kling-Gupta Efficiency (KGE) and the relative bias were used as performance criterions. Due to the high elevation of some catchments studied and to the important amount of the snowmelt contribution in the river discharge at their outlets, a snow module incorporation was necessary to assess whether snowmelt impacts runoff or not. The outcomes demonstrate that all algorithms were able to successfully calibrate the GR4J and MISDc models (-0.26<median KGE< 0.34). However, FMIN and PSO demonstrated greater consistency in their performance across all calibration methods and proved to be the most computationally efficient algorithms, making them the best choices in situations requiring both time effectiveness and performance. Despite its slower speed, GA's robustness makes it a viable option under less time-sensitive conditions. The relative bias metric indicates that for the GR4J model, the FMIN, PSO, and GA had comparable and balanced performance, while SA showed greater variability. For the MISDc model, FMIN showed a tendency to slightly underestimate the discharge, while GA and PSO showed higher biases in some cases. In addition, MISDc significantly outperformed GR4J in simulating runoff across all catchments, making it a suitable choice for our region. The integration of a snow module in both models enhanced their performance in some larger pluvio-nival catchments, illustrating the complexity of snow dynamics in hydrological modeling and the need for high resolution data as well as ground measurements.

Keywords: River discharge prediction, GR4J, MISDc, Moroccan catchments, Optimization methods, Data scarcity.

How to cite: Ait naceur, K., El khalki, E. M., Hadri, A., Jaffar, O., Brocca, L., Saidi, M. E. M., Tramblay, Y., and Chehbouni, A.:  Daily Streamflow Simulations Improvement in Data Scarce Watersheds using different Optimization Techniques and Calibration Methods, EGU General Assembly 2024, Vienna, Austria, 14–19 Apr 2024, EGU24-4407, https://doi.org/10.5194/egusphere-egu24-4407, 2024.

The Salt Dilution Tracer method has been used in some form for >100 years (Allen and Taylor, 1923, Østrem, G. 1964, Moore, D 2004).  Recently, the method has undergone a renaissance as techniques and equipment have been improved, facilitating lower dosing (<100g/cms) and increased accuracy.  This paper studies the impact and best practices for filtering, extrapolation, and interpolation of the breakthrough curve to reduce uncertainty, and more importantly, extend the tail of the slug injection signal if the measurement is ended early.  By extrapolating, the user can leave the field in as little half the time, while introducing only +/- 5% uncertainty.  We examine different fitting models (gamma, SCS Unit Hydrograph, χ2, etc) and fitting methods.  An online fit/fill/filter tool is presented and happiness of user is optimized.

How to cite: Sentlinger, G. and Anderson, Z.: Fitting, Filling, and Filtering of Salt Dilution Breakthrough Curves for Reduced Field Time, Increased Accuracy, and Optimized Happiness, EGU General Assembly 2024, Vienna, Austria, 14–19 Apr 2024, EGU24-4685, https://doi.org/10.5194/egusphere-egu24-4685, 2024.

EGU24-4937 | Orals | HS2.2.9

Flexible and physically based stage–discharge rating curves using a "double-Manning" approach 

Andrew Wickert, Jabari Jones, and G.-H. Crystal Ng

Rating curves translate between river stage (i.e., water level) and water discharge. They are applied ubiquitously for stream monitoring, water-resource estimation, and flood forecasting. However, they are calculated using a basic empirical power-law fit that lacks flexibility to robustly represent channel–floodplain structure or to adapt to changing hydraulic geometry or roughness. Furthermore, such empirical fits require many measurements of stage and discharge. Gathering these measurements is expensive and might not be possible if the channel and/or floodplain evolve before a sufficient range of flows may be measured.

To address this deficit with a similarly simple but physically grounded approach, we present a strategy based on Manning's equation. This "double-Manning" approach implements Manning's equation within and above the channel and a power-law relationship – analogous to a generalized Manning's equation – for flows crossing the floodplain. We demonstrate that the double-Manning equation can effectively fit field data and, in the process, accurately estimate bankfull width, bankfull depth, channel Manning's n, and Manning-style power-law parameters for floodplain-flow characteristics. For sites lacking exhaustive field data, the physical basis of the double-Manning approach enables rating-curve creation using a combination of stage–discharge data and common field measurements of the channel and floodplain. Such rating curves may be adjusted as the channel and floodplain evolve to predict how geomorphic change might affect flow depth and flood inundation.

The double-Manning approach may be run as a forward (predictive) or inverse (fit to data) model. Documented, open-source code may be acquired from GitHub (https://github.com/MNiMORPH/doublemanning) and Zenodo.

How to cite: Wickert, A., Jones, J., and Ng, G.-H. C.: Flexible and physically based stage–discharge rating curves using a "double-Manning" approach, EGU General Assembly 2024, Vienna, Austria, 14–19 Apr 2024, EGU24-4937, https://doi.org/10.5194/egusphere-egu24-4937, 2024.

EGU24-5805 | ECS | Posters on site | HS2.2.9

IRIS: Global Reach-Scale River Surface Slopes from the ICESat-2 Satellite  

Daniel Scherer, Christian Schwatke, Denise Dettmering, and Florian Seitz

We present the latest version of the global reach-scale “ICESat-2 River Surface Slope” (IRIS) dataset, which comprises average and extreme water surface slopes (WSS) derived from observations of the ICESat-2 satellite between October 2018 and August 2023 as a supplement to 130,283 reaches from the “SWOT Mission River Database” (SWORD). To gain full advantage of ICESat-2’s accurate and unique measurement geometry with six parallel lidar beams, the WSS is determined across pairs of beams or along individual beams, depending on the intersection angle of spacecraft orbit and river centerline. Combining both approaches maximizes spatial and temporal coverage. IRIS can be used to research river dynamics, estimate river discharge, and correct water level time series from satellite altimetry for shifting ground tracks. Additionally, we compare IRIS with observations from the recently launched SWOT mission. 

How to cite: Scherer, D., Schwatke, C., Dettmering, D., and Seitz, F.: IRIS: Global Reach-Scale River Surface Slopes from the ICESat-2 Satellite , EGU General Assembly 2024, Vienna, Austria, 14–19 Apr 2024, EGU24-5805, https://doi.org/10.5194/egusphere-egu24-5805, 2024.

EGU24-6865 | ECS | Orals | HS2.2.9

Monitoring river morphology with Sentinel 2 data: limitations and opportunities across scales  

Elisa Bozzolan, Simone Bizzi, Andrea Brenna, Nicola Surian, and Patrice Carbonneau

Satellite imageries are starting to become for geomorphologists a new tool to monitor medium-large river dynamics at high revisit time (weekly or daily). The Sentinel 2 mission, in particular, provides without charges a multi-spectral image of the earth surface at 10 meters resolution every 5 days (cloud cover permitting). Machine learning algorithms can then classify these images, automatically discriminating those river macro-geomorphic features, i.e. water, sediment and vegetation, that describe how a river responds to different hydrological impulses and boundary conditions. When using these tools (Sentinel 2 images + machine learning algorithm), it is important to first identify what geomorphic processes we can reliably detect, i.e. what are the applicability boundaries dictated by the spatio-temporal resolution of these images. In a dynamic, braided reach of the Sesia River (Northern Italy), we assessed how this inherent uncertainty associated with S2's spatiotemporal resolution can impact the interpretation of the active channel (a combination of sediment and water) delineation and evolutionary trajectory. The analysis demonstrates that water is ∼20% underestimated whereas sediments are ∼30% overestimated. These under- and over-underestimations are not random but a function of the mixed pixels present in each classified macro geomorphic unit. Nevertheless, the results show that these spatial errors are an order of magnitude smaller than the geomorphic changes detected in the 5 years analysed, so the derived active channel trajectory can be considered robust. Within these newly assessed applicability boundaries, in the Po River basin we started to explore in similarly dynamic river reaches new geomorphic indicators able to describe river responsiveness to seasonality and to different flood regimes.

How to cite: Bozzolan, E., Bizzi, S., Brenna, A., Surian, N., and Carbonneau, P.: Monitoring river morphology with Sentinel 2 data: limitations and opportunities across scales , EGU General Assembly 2024, Vienna, Austria, 14–19 Apr 2024, EGU24-6865, https://doi.org/10.5194/egusphere-egu24-6865, 2024.

The 4DMED-Hydrolog ESA project aims at developing a high-resolution (1km) and consistent reconstruction of the Mediterranean terrestrial water cycle by using the latest Earth Observation (EO) products. We exploit here the synergy between available EOs to better estimate the terrestrial water cycle components (i.e., precipitation P, evaporation E, water storage dS and river discharge RD). The obtained, more accurate, representation of our environment is intended to feed decision support systems, in a changing climate, for a more resilient society. Among the water components, RD is strategic because it integrates many water-related processes. Unfortunately, in situ RD measurements are very sparse spatially. This paper presents a new approach for the mapping (i.e., spatially continuous estimate) of RD based on indirect EOs and a water budget balance constraint. First, satellite estimates of P, E, and dS are corrected, at the basin scale, using RD from a gauge network. Second, the water budget is balanced at the grid level using a horizontal flow direction information from topography. This approach is therefore based on satellite products and in situ measurements, without the use of any dynamical model. This methodology is used over the Po and Ebro basins. We use the new P, E, and dS data products, at high spatio-temporal resolution (1km and daily), developed in the 4DMED project. The resulting RD mapping is evaluated using a leave-one-out experiment, resulting in a mean KGE of 0.6 over the Ebro, to be compared to 0.5 for a river dynamical model such as Continuum. The spatially continuous RD is, by design, closer to the in situ measurements. Such work combining EO datasets to optimize, at high spatial resolution, to optimize our monitoring of the water cycle opens new doors for hydrology, water management, agriculture, as well as natural hazards predictions and response.

References:

  • Pellet, Aires, Yamazaki, Zhou, Paris, A first satellite-based mapping of river discharge over the Amazon. Journal of Hydrology,  10.1016/j.jhydrol.2022.128481, 2022.
  • Pellet, Aires, Yamazaki, Satellite monitoring of the water cycle over the Amazon using upstream/downstream dependency. Part I: Methodology and initial evaluation. Water Resources Res., 57, e2020WR028647, 2021.
  • Pellet, Aires, Yamazaki, Papa, Satellite monitoring of the water cycle over the Amazon using upstream/downstream dependency. Part II: Mass-conserved reconstruction of total water storage change and river discharge. Water Resources Research, 57, e2020WR028648, 2021.
  • Pellet, Aires, Munier, Papa, Long-term estimate of the water storage change in the large Himalayan river basins from water budget closure, HESS, 5194/hess-24-3033-2020, 2020.
  • Pellet, Aires, Munier, Optimisation of satellite observations to study the water cycle over the Mediterranean region, HESS, 5194/hess-2018-319, 2019.
  • Pellet, and Aires, Analyzing the Mediterranean water cycle via satellite data integration, Pure Appl. Geophys, 10.1007/s00024-018-1912-zpp, 2018.
  • Munier, Aires, A new global method of satellite dataset merging and quality characterization constrained by the terrestrial water cycle budget, RSE, 2017
  • Munier, Aires, Schlaffer, Prigent, Papa, Maisongrande, and Pan, Combining datasets of satellite retrieved products. Part II: Evaluation on the Mississippi Basin and closure correction model, JGR, 10/2014, 10.1002/2014JD021953, 2015
  • Aires, Combining datasets of satellite retrieved products. Part I: Methodology and water budget closure, J. Hydrometeor., 10.1175/JHM-D-13-0148.1, 2014

How to cite: Pellet, V. and Pellet, V.: Satellite-based mapping of river discharge at very high spatio-temporal resolution over the Ebro and Po basins, EGU General Assembly 2024, Vienna, Austria, 14–19 Apr 2024, EGU24-7740, https://doi.org/10.5194/egusphere-egu24-7740, 2024.

EGU24-9754 | Posters on site | HS2.2.9

An ADCP large-scale international intercomparaison: Sault-Brénaz 2023 

Aurélien Despax, Blaise Calmel, Jérôme Le Coz, Alexandre Hauet, and David Mueller

In the last decades, Acoustic Doppler Current Profilers (ADCP) has become the most widely used tool for measuring discharge of rivers and canals. Discharge is a key information for many risk studies, structures dimensioning and even impact assessments. These values must therefore be correctly estimated. Quality assurance and quality control (QA/QC) procedures have been established to ensure that hydrological services share the best practices. Also, to ensure that ADCP tools are working properly, services has to regularly check that the equipment is properly calibrated.

The lack of references value most of the time makes the task difficult. To make sure that ADCP is properly calibrated, interlaboratory testing are frequently organized. Large-scale intercomparaisons are particularly interesting because of the diversity of models and practices but it also makes them more complicated to organize. The Sault-Brénaz intercomparaison was definitively a big one with more than 120 European participants with 16 RiverPro, 15 M9, 15 StreamPro and 12 RS5 for a total of 160 measurements with 1870 transects among 4 sessions. Due to hydrological conditions, the protocol had to be adapted. Measurements took place on small straight canal of the Rhone river with a discharge of around 2m3/s.

Following QA/QC procedures, participant had to post-process their data with the QRevInt open-source software. QRevInt provides many quality filters and computes uncertainty following OURSIN method. Then, to compute interlaboratory results, the QRame software has been used. This open-source software has been developed to apply QRevInt with default settings to a set of ADCP discharge measurements and to retrieve post-processed discharge and uncertainty results. When the dataset is actually an ADCP interlaboratory experiment, the empirical discharge uncertainty, for a given number of transects taken in the average, can be computed by application of the standard interlaboratory method.

Results show that discharge varied slightly over time, particularly between sessions. To exploit further all the discharge results, different approaches to homogenizing data were tested. This issue of varying discharge over time is a common issue for interlaboratory experiments. A generalizable solution would enable experiments in extended conditions. Also, interlaboratory experiments permit to validate uncertainty computations. The greater the number of intercomparisons and the wider the measurement conditions, the more robust uncertainty models will be.

How to cite: Despax, A., Calmel, B., Le Coz, J., Hauet, A., and Mueller, D.: An ADCP large-scale international intercomparaison: Sault-Brénaz 2023, EGU General Assembly 2024, Vienna, Austria, 14–19 Apr 2024, EGU24-9754, https://doi.org/10.5194/egusphere-egu24-9754, 2024.

EGU24-11189 | ECS | Posters on site | HS2.2.9

A Contactless Rapid Rating Curve Assessment Based On Drone-borne Measurement 

Xinqi Hu, Ye Tuo, Karl Broich, Fabian Merk, and Markus Disse

Rating curve relationship is vital to hydrological studies, such as flood control and other water-related decision-making processes. Traditionally, rating curve are estimated by using single- or multiple-gauging observations, which is time-consuming, costly, and lacks spatial resolution. Hydraulic models are usually a reliable method to quickly derive the stage-discharge relation for discharge estimation, especially for assessing more reliable high-flow rating relations in extrapolation beyond gauge observation. To establish such models, hydraulic parameters such as water surface elevation, bathymetry, and bed roughness are needed, but they are mostly not available in remote and inaccessible regions. Drone-borne hydrometric monitoring technologies can be deployed to address this problem.

As one of the primary objectives of the Horizon Europe UAWOS project, which is dedicated to developing an Unmanned Airborne Water Observing System for providing key hydrometric variables at high spatial resolution/coverage, and data-based products/services to enhance management and decision-making, this work centers on integrating hydraulic modeling with the unmanned airborne water observing system to establish the rating curve relationship. Water surface elevation data is derived by radar altimetry, bathymetry data by water penetrating radar and sonar, and Doppler radar for surface velocity. By utilizing the surface velocity and water surface elevation data, in conjunction with shallow-water equations, a bathymetry estimation algorithm is used to interpolate the bathymetry from the observed cross-section to the whole simulated river channel. We also come up with a method to directly retrieve the river roughness parameter from the UAV drone observation data.

As a whole, these methods collectively establish a framework that is easily to use to estimate the rating curve in remote regions. The study shows how information from high spatial resolution and coverage hydrometric variables derived by drone-borne hydrometric monitoring technologies can improve rating curve estimates from models.

How to cite: Hu, X., Tuo, Y., Broich, K., Merk, F., and Disse, M.: A Contactless Rapid Rating Curve Assessment Based On Drone-borne Measurement, EGU General Assembly 2024, Vienna, Austria, 14–19 Apr 2024, EGU24-11189, https://doi.org/10.5194/egusphere-egu24-11189, 2024.

EGU24-12507 | Posters on site | HS2.2.9

Towards a comprehensive optical workflow for monitoring and estimation of water levels and discharge in watercourses 

Jens Grundmann, Xabier Blanch, André Kutscher, Ralf Hedel, and Anette Eltner

Coping with natural disasters such as floods places special demands on the emergency units. From the point of view of command-and-control operators, observations of watercourses are desirable in the event of flooding in order to obtain an accurate picture of the situation. Optical measurement methods using cameras offer thereby advantages as they do not require water contact and hence can be used safely. Therefore, the project "KIWA: Artificial Intelligence (AI) for Flood Warning" (http://kiwa.hydro.tu-dresden.de/) is developing AI-based tools for the robust quantification of water levels, flow velocities and flow rates from surveillance cameras.

In this article, we present the workflow for an exclusive optical measurement of time series of water level and discharge from single images and short video sequences. The basis is a high-precision (i.e., at centimetre level), georeferenced 3D terrain model of the measurement site including the riverbed. The terrain model is created using the structure-from-motion (SfM) technique and georeferenced via ground control points (GCPs) measured with a multiband GNSS receiver. To determine the water level, the water area in the single images is automatically segmented using AI based on convolutional neural networks (CNNs) and then intersected with the terrain model. Changes of the camera geometry influence the measurement accuracy during long-term observations. Therefore, the GCPs are automatically detected in the individual images with an adapted AI-based keypoint detector to frequently update the estimated camera orientation. To estimate the discharge, the water surface flow velocity is determined using short video sequences and applying the particle tracking (PTV) method, whereby the segmented water area narrows down the search area for the particle detection. Afterwards, the "OptiQ" modelling approach is used to derive the discharge times series based on the PTV measurements. Thereby, data filtering and error correction methods are used to achieve continuous time series. 

The methods were developed at three different measuring gauges, whose cameras record single images and videos every 15 minutes over several months. The accuracy of the water level measurement is in the centimetre range, even at night with the support of infrared emitters. Depending on the water level, there are deviations in the flow rate, which average less than 10%.

How to cite: Grundmann, J., Blanch, X., Kutscher, A., Hedel, R., and Eltner, A.: Towards a comprehensive optical workflow for monitoring and estimation of water levels and discharge in watercourses, EGU General Assembly 2024, Vienna, Austria, 14–19 Apr 2024, EGU24-12507, https://doi.org/10.5194/egusphere-egu24-12507, 2024.

EGU24-14090 | ECS | Orals | HS2.2.9

Optimizing Flood Control: A Comprehensive 3D Computationsl Fluid Dynamic Study of the Comite Diversion Channel in the Comite and Amite River Basins 

Christopher Denney, Gaurav Savant, Abigail Grant, Tate McAlpin, and Keaton Jones

To address the escalating challenges posed by extreme weather events and the critical importance of water management, this presentation focuses on innovative methodologies in streamflow monitoring and prediction. Specifically, we present a comprehensive study undertaken to enhance flood mitigation in the Comite and Amite River Basins of central Louisiana.

In response to the imperative need for effective flood control, a 12-mile diversion channel has been designed to redirect flow from the Comite River into the Mississippi River. Our research, commissioned by the United States Army Corps of Engineers, New Orleans District, aims to quantify the impact of design modifications on crucial flow parameters within the diversion structure. We employ advanced three-dimensional, multiphase computational fluid dynamics (CFD) modeling techniques, utilizing the open-source OpenFOAM library with the interFoam finite volume solver.

The study evaluates the alignment of the diversion channel by analyzing flow diversion, velocity profiles, and streamlines within the channel and the associated hydraulic control structure. Special emphasis is placed on understanding the dynamics of the drop structure flow, interactions with upstream drainage features, and potential sediment accumulation risks. Our model, validated through perturbations in turbulence models, boundary roughness, and grid independence studies, provides valuable insights into the performance of the diversion structure under various flow conditions. 

In conclusion, our findings underscore the importance of informed engineering decisions for fostering climate resilience in riverine regions. By providing insights into the dynamics of the diversion channel and quantifying uncertainties associated with flow parameters, this study offers actionable solutions to enhance streamflow monitoring efficiency in the face of evolving hydrological challenges.

How to cite: Denney, C., Savant, G., Grant, A., McAlpin, T., and Jones, K.: Optimizing Flood Control: A Comprehensive 3D Computationsl Fluid Dynamic Study of the Comite Diversion Channel in the Comite and Amite River Basins, EGU General Assembly 2024, Vienna, Austria, 14–19 Apr 2024, EGU24-14090, https://doi.org/10.5194/egusphere-egu24-14090, 2024.

EGU24-14133 | Orals | HS2.2.9 | Highlight

Measuring stream discharge using audible sound 

Marek Zreda

Before we see a stream we can hear it. The discharge of that stream can be inferred from measurements of its sound. Sound pressure level is proportional to the energy of the flowing water and is related to discharge by a sound-discharge rating curve. Measurements with a hand-held sound level meter take seconds to acquire, allowing for high-resolution, long-term monitoring of stream discharge, campaign surveys, and ad hoc measurements. Sound measurements correlate well with the standard stream gauge data over the full range of discharges studied, from 0.02 m3/s to 33 m3/s. The following characteristics make the method an attractive alternative to the standard stream gauging: the instrumentation is simple and inexpensive; field deployment requires no built infrastructure; the instrument is suitable for rapid or emergency deployment; the measurements are non-invasive and non-contact, made at a distance from the stream, using a stationary or roving instrument; the acoustic response curve is linear; and the interfering sound sources are either negligibly small or easily removed.

If there is enough time, attendees will be able to create their own sound-discharge rating curve using their cell phones and the Decibel-X app to measure sound intensity. The conference room's audio equipment will provide sound clips of an actual stream along with the independently measured discharges.

How to cite: Zreda, M.: Measuring stream discharge using audible sound, EGU General Assembly 2024, Vienna, Austria, 14–19 Apr 2024, EGU24-14133, https://doi.org/10.5194/egusphere-egu24-14133, 2024.

EGU24-15519 | ECS | Posters on site | HS2.2.9

Exploring the relative scale of uncertainty in high-resolution soil moisture remote sensing products towards model integration  

Pietro Stradiotti, Wouter Dorigo, and Luis Samaniego

Soil moisture (SM) is a fundamental hydrological variable for understanding processes in the land-atmosphere, biological, or geophysical domains and an output of many hydrological or land surface models. It is peculiar in that its variability reflects distinct hydrological processes moving from the field scale, where local topography plays a role, to the regional scale, where meteorological forcing is the main control. Correctly representing this variety of processes is a complex modeling task often alleviated by integrating information from well-established Earth Observation (EO) systems, which produce SM data with near global coverage at coarse (10-25 km) resolution. Still, the increasing need for fine scale (1 km, 1 day) simulations of the water cycle is to be met by EO data of similarly high resolution. 

High resolution satellite-based SM data is now available from several sources. 1km datasets are multiplying following simultaneous efforts to retrieve SM from backscatter measurements of the Sentinel-1 mission with various inversion models. At the same time, physical or statistical relationships are leveraged to down-scale coarse resolution products by ingesting data from distinct observational sources, coming from the mentioned Sentinel-1 or the optical domain. However, while products of the first type are confronted with the limited sensitivity of C-band microwave to SM and reduced spatial and temporal availability, down-scaled products might retain much of the original signal and fail the fine-scale process representation. The question of which of these resources can preferably be integrated to reliably improve high-resolution modelling is therefore an open one. 

In this study we perform a round robin (i.e., inter-comparative) assessment of the most prominent high-resolution SM products in the EO landscape. While adapting validation and error characterization techniques and tools (e.g., the Quality Assurance for SM service) that are routinely used at the coarse scale, we address the partial lack of 1km scale reference measurements through the application of an emerging high resolution validation framework. Such a framework demonstrates that metrics for high resolution benchmarking can be reliably retrieved with only sparse, point-scale measurements. The first results suggest that the true spatial SM heterogeneity might explain a minimum noise tradeoff between coarse- and high-resolution EO products. This work is a fundamental step to assess the current state-of-art in EO and its maturity for integration in high-resolution water cycle modelling.

How to cite: Stradiotti, P., Dorigo, W., and Samaniego, L.: Exploring the relative scale of uncertainty in high-resolution soil moisture remote sensing products towards model integration , EGU General Assembly 2024, Vienna, Austria, 14–19 Apr 2024, EGU24-15519, https://doi.org/10.5194/egusphere-egu24-15519, 2024.

EGU24-16356 | Posters on site | HS2.2.9

Sharing perceptual models of uncertainty – on the use of soft information about discharge data uncertainty 

Ida Westerberg and Reinert Huseby Karlsen

Many hydrologists face the situation that they have no, or very limited, information about the uncertainty in the discharge data they are using. Data uncertainty is rarely communicated by monitoring agencies and data providers – and is often not available on request. This means that data users typically treat data as if they are error-free, whereas in reality there can be large uncertainties and errors.

However, the absence of metadata and ‘hard’ information about data uncertainty does not mean that there is no information about the data uncertainty. Instead, we can use other types of ‘soft’ information to understand the likelihood that discharge data in a particular location are uncertain. For example, if high flows are of short duration (i.e., a few hours) and the rainfall-runoff lag time is short, it is practically quite difficult to manage to gauge high flows, leading to likely extrapolation of stage–discharge rating curves and large high flow uncertainty. A second example is if a river is ice-covered during the winter season, then most of the winter water-level time series is subjectively estimated, leading to substantial uncertainty in winter low flows. Such soft information about data uncertainty is well known by field hydrologists and data uncertainty experts but is not as commonly known in the wider hydrological community. In this presentation we focus on uncertainty in discharge data calculated from stage–discharge rating curves and aim to share – and to encourage sharing – of soft information about data uncertainty sources, to promote more informed decisions on data uncertainty in hydrological studies.

We summarize the soft information about discharge data uncertainty as a perceptual model of uncertainty. Our perceptual model divides the soft information into three categories: station characteristics, climate and flow regime, and catchment characteristics. For each category we present and describe different types of soft information, the uncertainty sources and impacts they can inform us about, and sources for each soft information type (e.g., photos, satellite images, land use). We find that soft information can inform us about three main types of uncertainty sources: uncertainty related to the hydraulic control, uncertainty related to incomplete gauging of the full flow range, and uncertainty due to measurement error.

Our generalised perceptual model can be seen as a smorgasbord of information about uncertainty sources, where the soft information can be considered as relevant to a particular dataset and can inform us if high or low data uncertainty is likely. We believe that a key benefit of the type of generalized perceptual model of uncertainty we present is to facilitate dialogue on, and understanding of, possible sources of observational uncertainties and their impacts.  We encourage others to complement our perceptual model of discharge data uncertainty based on experience from different regions and for other discharge monitoring techniques such as index-velocity stations or drone/camera-based methods.

How to cite: Westerberg, I. and Huseby Karlsen, R.: Sharing perceptual models of uncertainty – on the use of soft information about discharge data uncertainty, EGU General Assembly 2024, Vienna, Austria, 14–19 Apr 2024, EGU24-16356, https://doi.org/10.5194/egusphere-egu24-16356, 2024.

EGU24-16913 | ECS | Posters on site | HS2.2.9

Characterizing the space-time evolution of wet channels in a non-perennial Mediterranean catchment exploiting a network of camera traps 

Simone Noto, Nicola Durighetto, Flavia Tauro, Salvatore Grimaldi, and Gianluca Botter

Non-perennial streams are those streams that periodically cease to flow in at least one point along their network. The research community well recognizes the importance of such watercourses for they have a global prevalence and provide diverse hydrological functions and ecosystem services. The spatiotemporal pattern of the active drainage network is anything but simple, sometimes showing a very complex pattern. Non-perennial streams, in fact, are often located in heterogeneous environments, in which the combination of climate, morphology, land cover, soil, substrate, and anthropic factors could play a role in the observed drying and wetting patterns. This work combined two techniques, with different spatiotemporal resolutions, to characterize the spatiotemporal extent of the stream network in a 3.7 km2 Mediterranean catchment of central Italy. The hydrological status of a set of nodes of the network was derived for the period 2020-2022 from sporadic visual surveys and, most importantly, through the analysis of sub-hourly images collected by 21 cameras distributed along a set of strategic nodes of the network. The latter technique is particularly promising to reconstruct the hydrological dynamics taking place in the target cross-section, as the temporal evolution of the underlying hydrological conditions (wet vs. dry), the water stage, and the corresponding discharge can be inferred from the automatic or manual analysis of the acquired images. The available experimental data  was combined exploiting the hierarchical principle, that postulates the existence of a Bayesian chain based on the local persistency of the nodes that dictates their drying/wetting order during stream retraction/contraction cycles. The results highlighted the complexity of the network dynamics in the study area: while the number of wet nodes decreased during the dry season and increased during the wet season, the local persistency of the nodes showed a highly heterogeneous and non-monotonic pattern, resulting in a dynamically disconnected network. The approach allowed the reconstruction of the entire river network and represented a useful tool to estimate the extent of its wet portion, even in case part of the network could not be inspected. This work represents a novel approach to reconstruct the extension of the wet portion of the stream network in difficult-to-access environments, where traditional techniques might be inadequate.

How to cite: Noto, S., Durighetto, N., Tauro, F., Grimaldi, S., and Botter, G.: Characterizing the space-time evolution of wet channels in a non-perennial Mediterranean catchment exploiting a network of camera traps, EGU General Assembly 2024, Vienna, Austria, 14–19 Apr 2024, EGU24-16913, https://doi.org/10.5194/egusphere-egu24-16913, 2024.

EGU24-16956 | ECS | Orals | HS2.2.9 | Highlight

Improving the resolution of satellite precipitation products in Europe 

Paolo Filippucci, Luca Ciabatta, Hamidreza Mosaffa, and Luca Brocca

Climate change is increasing the challenges related to extreme weather events, shifting precipitation patterns, causing water scarcity and increasing the occurrence of natural disasters. Accurate and timely precipitation data are critical for understanding and mitigating these events, as well as for informing decision-makers. Specifically, Europe climatic and physiographic features make capturing fine-scale (1 km-daily) variations crucial to improve the precision of climate models and facilitate targeted adaptation strategies in this area.

This can be achieved by using the recent remote sensing technologies, which allow to systematically monitor wide areas without the need of maintaining ground networks. In particular, for satellite precipitation estimation, both the top-down and bottom-up approaches have been exploited in recent years to obtain information related to rainfall. Both the methodologies carry advantages and limitations. Their merging, coupled with high spatial resolution ancillary information, is therefore recommended to reach the final aim of detailed and accurate precipitation data.

In this study, the rainfall data obtained from IMERG Late Run and SM2RAIN ASCAT (H SAF) are downscaled and merged over the whole Europe. The downscaling is obtained by leveraging high spatial resolution statistical information from CHELSA product, while a triple collocation technique is applied to merge the two downscaled datasets. The resulting high resolution rainfall is subsequently compared against multiple products, including coarse resolution ones such as H SAF, IMERG-LR, ERA5, EOBS, PERSIANN, CHIRP, GSMAP, and high-resolution products like EMO, INCA, SAIH, COMEPHORE, MCM, 4DMED. These comparisons, spanning ground, model and satellite data, serve to assess its capabilities in estimating precipitation over Europe.

How to cite: Filippucci, P., Ciabatta, L., Mosaffa, H., and Brocca, L.: Improving the resolution of satellite precipitation products in Europe, EGU General Assembly 2024, Vienna, Austria, 14–19 Apr 2024, EGU24-16956, https://doi.org/10.5194/egusphere-egu24-16956, 2024.

EGU24-17533 | Posters on site | HS2.2.9

A Round Robin Exercise for an intercomparison of Snow Cover Area maps retrieved from Earth Observation 

Federico Di Paolo, Matteo Dall'Amico, Pietro Stradiotti, and Luis Samaniego

In Europe, the majority of the precipitation during winter falls as snow over 1.000 m altitude, and remains stored in the snowpack until the melting season, when it returns in the hydrological cycle and is partly used for irrigation and power generation. Snow cover estimation is then one of the main indicators necessary to evaluate water budget and plan water management, predict possible drought conditions, and drive operational flood prediction. 

The use of Earth Observation (EO) for Snow Cover Area (SCA) estimation has been improved during the last decade thanks to high resolution satellites such as the ESA Sentinels, having a pixel resolution of 10 m. Furthermore, diverse processing techniques, nowadays mature, are used by the different data providers to retrieve SCA and Fractional Snow Cover (FSC) maps from EO data.

The scope of our work is an intercomparison of different medium- to high-resolution EO-retrieved SCA/FSC maps over Europe; we use as a benchmark a vast dataset of in situ data coming from different sources and harmonized by Matiu et al. (2021). 

Regarding the dataset, SCA or FSC maps retrieved from multispectral Sentinel-2 and Landsat-8 images are considered, together with gap-filled maps evaluated integrating Sentinel-1 (Synthetic Aperture Radar) and/or Sentinel-3 (multispectral). A unique dataset of Sentinel-1-retrieved snow depth maps is also used in the exercise. Finally, for a continuity with a previous project on EO snow products, medium-resolution MODIS-retrieved SCA images have been added to our dataset.

The results can be used to correctly interpret the accuracy of the EO datasets as well as the processing methodologies. From the comparison it can be evaluated the possibility of merging the different dataset in order to enhance the temporal resolution to a sub-weekly effective revisit time.

How to cite: Di Paolo, F., Dall'Amico, M., Stradiotti, P., and Samaniego, L.: A Round Robin Exercise for an intercomparison of Snow Cover Area maps retrieved from Earth Observation, EGU General Assembly 2024, Vienna, Austria, 14–19 Apr 2024, EGU24-17533, https://doi.org/10.5194/egusphere-egu24-17533, 2024.

EGU24-19308 | Posters on site | HS2.2.9

Evaluation of remote sensing actual evapotranspiration products for hydrological modeling applications 

Matěj Orság, Milan Fischer, Almudena García-García, Jian Peng, Luis Samaniego, and Miroslav Trnka

Evapotranspiration (ET) is one of the main environmental variables for the study of land-atmosphere interactions due to its interconnection with the energy and water balance at the land surface. Despite the dedicated effort of the remote sensing community to estimate the magnitude of ET at global scales, the uncertainties and differences between products are still very large, especially when comparing ET products with different spatial resolutions. Here, we designed a round-robin experiment to determine the product or products most suitable for future integration in hydrological modeling. The evaluation is performed using eddy covariance measurements as reference and point-scale downscaling (PSD) benchmarking criteria to identify the added value of the high-resolution products. The eddy covariance measurements of latent and sensible heat fluxes are known to not close the surface energy budget. Therefore, the use of eddy covariance measurements as a reference could have important consequences for the later use of ET products in assimilation approaches. Therefore, two main strategies to deal with the energy balance closure problem are considered here. Firstly, we considered three energy balance closure scenarios – (i) assigning the energy balance residuum to sensible heat flux; (ii) distributing the residuum to both turbulent energy fluxes by preserving their ratio, i.e. Bowen ratio; (iii) assigning the entire residuum to latent heat flux. While the first case has no impact on ET, the two remaining ones lead to an increase in ET. Secondly, the use of the triple collocation method, which does not require a reference dataset, will be explored to complement these results. Despite these efforts to identify the best ET product for the integration of satellite ET products in hydrological models, we cannot conclude that the products reaching the best metrics in this evaluation will be the products adding more value to the assimilation approach. Therefore, further experiments should be designed to test if the products selected in the round-robin exercise are indeed improving the performance of hydrological models or on the contrary other ET products are more suitable for assimilation approaches. We acknowledge support from AdAgriF - Advanced methods of greenhouse gases emission reduction and sequestration in agriculture and forest landscape for climate change mitigation (CZ.02.01.01/00/22_008/0004635).

How to cite: Orság, M., Fischer, M., García-García, A., Peng, J., Samaniego, L., and Trnka, M.: Evaluation of remote sensing actual evapotranspiration products for hydrological modeling applications, EGU General Assembly 2024, Vienna, Austria, 14–19 Apr 2024, EGU24-19308, https://doi.org/10.5194/egusphere-egu24-19308, 2024.

EGU24-19632 | Posters on site | HS2.2.9

Eddy covariance, scintillometer, and cosmic ray 1 km scale measurements at three sites (grassland, forest, and vineyard) in North-West Italy compared with CLM simulations 

Stefano Ferraris, Alessio Gentile, Davide Gisolo, Davide Canone, Stefano Bechis, Brendan Heery, Biddoccu Marcella, Giorgio Capello, Gerrit Maaschwitz, Alexander Myagkov, Enrico Gazzola, and Luca Stevanato

Water and energy balances have been monitored at a scale which is comparable with remote sensing one in three North-West Italy sites. One step has been to evaluate the performance of a land surface model, in this work the Community Land Model. The measurements taken at the horizontal hundreds meters scale are also compared with vertical profiles of local sensors of soil moisture.

At the grassland mountain site (2600 m asl) the eddy covariance data are taken from 6 years, while the 25 m high mast eddy covariance in the forest from 3 years. The scintillometer and cosmic ray in the vineyard have been installed from one year.

The main result is to have different land cover monitored at about 1 km scale, and to see that the uncalibrated simulations with CLM are following quite well the data in most cases. Also the comparison of cosmic ray and point soil moisture time series will be discussed. The future work will be the comparison with satellite data.

This work is a part of the project NODES which has received unding from the MUR-M4C2 1.5 of PNRR grant agreement no. ECS00000036

How to cite: Ferraris, S., Gentile, A., Gisolo, D., Canone, D., Bechis, S., Heery, B., Marcella, B., Capello, G., Maaschwitz, G., Myagkov, A., Gazzola, E., and Stevanato, L.: Eddy covariance, scintillometer, and cosmic ray 1 km scale measurements at three sites (grassland, forest, and vineyard) in North-West Italy compared with CLM simulations, EGU General Assembly 2024, Vienna, Austria, 14–19 Apr 2024, EGU24-19632, https://doi.org/10.5194/egusphere-egu24-19632, 2024.

EGU24-19935 | Orals | HS2.2.9

An evaluation of low-cost terrestrial LiDAR sensors for assessing geomorphic change 

Matthew Perks, Seb Pitman, Rupert Bainbridge, Alejandro Diaz Moreno, and Stuart Dunning

For process geomorphologists, accurate topographic data acquired at appropriate spatio-temporal resolution is often the cornerstone of research. Recent decades have seen advances in our ability to generate highly accurate topographic data, primarily through the application of remote sensing techniques. Structure from Motion Multi View Stereo (SfM-MVS) and LiDAR have revolutionised the spatial resolution of surveys across large spatial extents. Continuing technological developments have led to commercialisation of small form LiDAR sensors that are suited to deployment on both mobile (e.g. uncrewed aerial systems), and in fixed semi-permanent installations. Whilst the former has been adopted (e.g. DJI Zenmuse L1), the potential for the latter to generate data suitable for geomorphic investigations has yet to be assessed. We address this gap here in the context of a three-month deployment where channel change is assessed in an adjusting fluvial system. We find that the small form sensors generate change detection products comparable to those generated using an industry-grade LiDAR system (Riegl VZ-4000). Areas of no geomorphic change are adequately characterised as such (mean 3D change of 0.014m compared with 0.0014m for the Riegl), with differences in median change estimates in eroding sections of between 0.01-0.03m. We illustrate that this data enables accurate characterisation of river channel adjustments through extraction of bank long-profiles, the assessment of bank retreat patterns which help elucidate failure mechanics, and for the extraction of water surface elevations. Deployment of this emerging, new technology will enable better process understanding across a variety of geomorphic systems as data can be captured in 4D with near real-time processing.

How to cite: Perks, M., Pitman, S., Bainbridge, R., Diaz Moreno, A., and Dunning, S.: An evaluation of low-cost terrestrial LiDAR sensors for assessing geomorphic change, EGU General Assembly 2024, Vienna, Austria, 14–19 Apr 2024, EGU24-19935, https://doi.org/10.5194/egusphere-egu24-19935, 2024.

EGU24-22332 | Orals | HS2.2.9

Monitoring of infrastructure at risk of scour and other hydraulic actions 

Eftychia Koursari, John MacPherson, Hazel McDonald, Maggie Creed, Stuart Wallace, Hossein Zare-Behtash, Andrea Cammarano, and Kevin Worrall

Scour is a significant impact caused by climate change on infrastructure, while also being the most common cause of bridge failure worldwide. Approximately 60% of bridge collapses are a result of scour (Briaud and Hunt, 2006; Wardhana & Hadipriono, 2003).

Climate change has resulted in the increase of extreme weather events, such as wildfires and floods among others. Global warming is evident, sea levels are rising, and the frequency and magnitude of flood events is increasing. As the climate is changing, the risk of scour is expected to increase further.

Monitoring is crucial for the identification of scour taking place around a structure, its magnitude, as well as the rate of deterioration to allow owners and operators to establish when predetermined thresholds are at risk of being reached. Scour monitoring is crucial to safeguard infrastructure that could be exposed to scour action.

According to the Design Manual for Roads and Bridges BD 97/12 Standard entitled ‘The assessment of scour and other hydraulic actions at highway structures’, scour monitoring techniques can be divided in the following categories (Highways Agency, 2012):

  • Measuring the maximum scour level that has taken place;
  • Measuring scour development adjacent to a structure during high flow events;
  • Methods correlating with scour development, such as water level monitoring, flow velocity monitoring and weather warnings.

Scour monitoring techniques are mainly reactive. This study compares existing and emerging scour monitoring methods, exploring a combination of scour monitoring sensors at structures at risk of scour.  The introduction of a new, innovative sensing platform for scour monitoring is discussed, linking the new sensor package to the asset health management platform using telematics, enhancing the understanding of scour taking place through accurate visualisation. This method facilitates more proactive monitoring of scour, the collection of data necessary for the design and implementation of scour protection measures, and innovative, more accurate scour prediction.

References:

Briaud JL and Hunt BE (2006) Bridge scour and the structural engineer. Structure Magazine, December: pp. 57–61.

Highways Agency, Transport Scotland, Welsh Government and Department for Regional Development Northern Ireland, UK (2012) Design Manual for Roads and Bridges. Highway Structures: Inspection and Maintenance. Volume 3, Section 4, Part 21. BD 97/12. The Assessment of Scour and Other Hydraulic Actions at Highway Structures. The Stationery Office, London, UK.

Wardhana K and Hadipriono FC (2003) Analysis of recent bridge failures in the United States. J. Perform. Constr. Facil. 17 (3): 144–150. https://doi.org/10.1061/(ASCE)0887-3828(2003)17:3(144)

How to cite: Koursari, E., MacPherson, J., McDonald, H., Creed, M., Wallace, S., Zare-Behtash, H., Cammarano, A., and Worrall, K.: Monitoring of infrastructure at risk of scour and other hydraulic actions, EGU General Assembly 2024, Vienna, Austria, 14–19 Apr 2024, EGU24-22332, https://doi.org/10.5194/egusphere-egu24-22332, 2024.

EDF (Électricité De France) is the world's largest electricity generator, with an installed capacity of about 130 GW. In order to safely operate the plants, optimize natural resources and fulfill ecological requirement, EDF has installed, since 1946, a sensor network dedicated to the monitoring of hydro-climatologic parameters.


In the context of non-intrusive methods for measuring flood discharge (LSPIV, SVR[1]), understanding the depth-averaged to surface velocity ratio is crucial. The depth-averaged to surface velocity ratio is here called α. This study analyzes a substantial sample of gaugings data (current meters and ADCP methods), totaling around 6,500 observations collected at various EDF sites. For current meters measurements, three methods are employed to compute α : fitting of a log- and a power-law and using the measured surface velocity. For ADCP measurements, three methods are applied to approach α : fitting of power-power, constant-no slip and 3-point-no slip law by using the Qrame[2] application.


This study aims at creating an alpha coefficient database (classified by riverbed, hydraulic radius, etc.) directly usable for non-intrusive streamflow measurements. 


[1] LSPIV (Large-Scale Particle Image Velocimetry), SVR (Surface Velocity Radar).

[2] QRame (QRevint Adcp Massive Exctraction), INRAE, 2023.

How to cite: Perriaud, T., Morlot, T., and Hauet, A.: Velocity profile and depth-averaged to surface velocity in natural streams: a review over a large sample of rivers using current meters and ADCP measurements., EGU General Assembly 2024, Vienna, Austria, 14–19 Apr 2024, EGU24-22428, https://doi.org/10.5194/egusphere-egu24-22428, 2024.

HS2.3 – Water quality at the catchment scale

The North American Great Lakes constitute a distinctive hydrological system comprising five interconnected lakes (Superior, Michigan, Huron, Erie, and Ontario) that together represent one of the planet's most significant freshwater reserves. Extensive environmental surveillance by federal, state, and provincial governments targets major water quality parameters such as temperature, pH, total dissolved solids, electrical conductivity, and dissolved oxygen, as well as concentrations of nutrients and major ions. However, trace element concentrations are more scarcely measured, and the comparatively little available data on trace element concentrations in the Great Lakes is typically older, discontinuous, or focused on historically contaminated areas. Consequently, the myriad of processes and sources involved in the distribution patterns of trace elements is poorly studied, and there remains a lack of understanding the natural baselines for these elements, including for the Rare Earth Elements (REE). The REE play a crucial role in various technological applications, including electronics, renewable energy technologies, and other high-tech industries. Because of their increasingly applications, REE are currently a significant concern, particularly in mining and industrialized areas, due to their enduring toxicity, radioactive properties, and the potential for bioaccumulation.

To understand the REE distribution pattern in the North American Great Lakes, we assessed REE concentrations in >70 surface water samples from Lakes Huron, Erie, and Ontario. The concentrations of dissolved REE, filtered at <0.22 µm, exhibited significant spatial heterogeneity across the lakes, with higher ΣREE values in Lake Huron (0.065±0.082 μg/L, n=27, 2022) than in Lake Erie (0.041±0.033 μg/L, n=14, 2021 and 2022) and Lake Ontario (0.033±0.041 μg/L, n=27, 2021 and 2022). Interestingly, there was no consistent upstream-to-downstream increase in dissolved REE concentrations within the basin, but dissolved REE levels decreased nearshore-to-offshore across all lakes. Enrichment of light REE over heavy REE, particularly in samples closer to the shore, was suggestive of riverine inputs and aqueous speciation modeling indicated strong control of speciation (hydrochemistry) on REE dynamics. Finally, we employed normalization and pattern-filling to assess REE enrichments in lake surface waters. Anomalies for Gadolinium (Gd), exceeding 20%, on average, across the lakes, were notably higher than for other REE but exhibited significant spatial variability, with enrichment observed especially in proximity to urban centers and in Lake Ontario. This research contributes valuable baseline data, enhancing our understanding of the dynamics of Rare Earth Elements in the Great Lakes and providing a foundation for further studies worldwide.

How to cite: Junqueira, T. and Vriens, B.: Rare Earth Elements Concentration Patterns in Surface Waters of Lakes Ontario, Erie, and Huron (North America), EGU General Assembly 2024, Vienna, Austria, 14–19 Apr 2024, EGU24-1326, https://doi.org/10.5194/egusphere-egu24-1326, 2024.

EGU24-2137 | Orals | HS2.3.1 | Highlight

Increasing hydrologic connectivity contributes to browning of northern freshwater 

Stefano Basso and Heleen de Wit

Sustained increments of organic carbon concentrations in northern freshwaters have triggered concerns about the impacts of water browning and raised questions on the underlying mechanisms causing this phenomenon. In addition to the key role played by reduced sulfate deposition, hydrologic mechanisms have been put forward as possible concurrent causes of the observed trends of organic carbon concentrations. How the suggested hydrologic controls act is however still unclear. In this study we analyze long data series (> 30 years) of daily discharge and weekly to biweekly Total Organic Carbon (TOC) concentration for four reference acid-sensitive rivers in Norway, whose locations span the entire length of the country, to clarify hydrologic changes which may be promoting freshwater browning. In all cases we observe stable values of the slopes of double logarithmic relations between concentration and discharge, as well as a steady growth along the years of the intercepts of these relations. These joint observations enable sorting out previously proposed biogeochemical mechanisms for the observed trends of TOC concentrations (i.e., less sulfate deposition versus higher soil temperature). Decreasing ratios of concentration and discharge variability along the years, observed in all watersheds during the autumn season, point at growing stores of organic carbon produced in summer and suggest that the spatial distribution of the sources is becoming more homogeneous. In detail, analyses of the runoff frequency, which is typically higher in wetter and more hydrologically connected watersheds, suggest that sources are more homogeneously connected to streams than before. In fact, increasing trends throughout the years of the runoff frequency, as well as strong relations between runoff frequency and increasing concentrations of aquatic organic carbon, are detected in all cases. More connected sources together with more frequent runoff events, which multiply the chances for the organic carbon to reach streams, may hence contribute to the observed rise of organic carbon concentrations in northern freshwaters.

How to cite: Basso, S. and de Wit, H.: Increasing hydrologic connectivity contributes to browning of northern freshwater, EGU General Assembly 2024, Vienna, Austria, 14–19 Apr 2024, EGU24-2137, https://doi.org/10.5194/egusphere-egu24-2137, 2024.

EGU24-2921 | Orals | HS2.3.1

Chloride Trends in the Fox River watershed: Stratton Dam to Illinois River  

Elias Getahun and Atticus Zavelle

Applying road salt to melt ice on urban roads and pavements has raised the chloride levels in streams and rivers in the U.S. over time, which can damage aquatic life. High chloride levels in the waterbodies of the Fox River watershed, where one-third of the land is urban, are mainly caused by road salt application for deicing. This study analyzed how the chloride levels changed over the years and seasons in the Fox River watershed – from Stratton Dam to Illinois River. The Seasonal Kendall Tau (SKT) method was used to estimate the annual and seasonal trends in chloride concentration at 44 monitoring sites on the Fox River and its tributaries for three time periods (2017–2021, 2012–2021, and 1997–2021), after conducting exploratory data analysis and assessing the data suitability. The chloride concentration in the watershed varied over time, space, and season. From 2012 to 2021, it declined or remained stable at most of the monitoring sites, but it rose slightly from 1997 to 2021. The 5-year trend from 2017 to 2021 was similar, except that some sites showed an increase in summer and fall. The chloride concentration along the Fox River and Tyler Creek showed a longitudinal pattern, decreasing from upstream to downstream in most seasons and periods, except for the 5-year annual and fall trends, which increased. Weighted Regression on Time Discharge and Season (WRTDS) models were developed to estimate the trends in flow-normalized chloride flux for one site on the Fox River and two sites on its tributaries with daily flow data. The resulting trends indicate that the chloride fluxes dropped significantly at the Fox River and Polar Creek sites, mainly in the winter of 2012–2021. However, the site on Blackberry Creek had an opposite trend of increasing chloride flux, except for the winter flux, which also declined. Trends in selected streamflow statistics including mean, 7-day minimum, and 1-day maximum flows were also analyzed for the three monitoring sites to provide insight into how hydrologic variability affects chloride trends. The trends in annual and seasonal flow statistics exhibited a steep slope for low flows but a gradual slope for high flows, indicating more variability in the low flow statistics during the periods of analysis. The changes in chloride concentration and flux were partly related to the changes in flow, but other factors affecting water quality, such as watershed conservation, may also play a role. Assessing trends over distinct periods provides a nuanced understanding of how mitigation strategies may influence water quality improvements through the years and serves as a crucial guide for initiatives aimed at enhancing the overall health of the Fox River ecosystem. Choosing deicing methods that balance cost, performance, and environmental impacts should be a vital part of a mitigation plan. Moreover, monitoring and evaluating trends can help assess the current status of chloride levels in the watershed and inform future actions.

How to cite: Getahun, E. and Zavelle, A.: Chloride Trends in the Fox River watershed: Stratton Dam to Illinois River , EGU General Assembly 2024, Vienna, Austria, 14–19 Apr 2024, EGU24-2921, https://doi.org/10.5194/egusphere-egu24-2921, 2024.

EGU24-3559 | ECS | Orals | HS2.3.1

Deciphering pollution loads in the Middle-Lower Yangtze River by coupling water quality models with machine learning 

Sheng Huang, Jun Xia, Yueling Wang, Gangsheng Wang, Dunxian She, and Jiarui Lei

Pollution control and environmental protection of the Yangtze River have received major attention in China. However, modeling the river’s pollution load remains challenging due to limited monitoring and unclear spatiotemporal distribution of pollution sources. Specifically, anthropogenic activities’ contribution to the pollution have been underestimated in previous research. Here, we coupled a hydrodynamic-based water quality (HWQ) model with a machine learning (ML) model, namely attention-based Gated Recurrent Unit, to decipher the daily pollution loads (i.e., chemical oxygen demand, COD; total phosphorus, TP) and their sources in the Middle-Lower Yangtze River from 2014 to 2018. The coupled HWQ-ML model outperformed the standalone ML model with KGE values ranging 0.77–0.91 for COD and 0.47–0.64 for TP, while also reducing parameter uncertainty. When examining the relative contributions at the Middle Yangtze River Hankou cross-section, we observed that the main stream and tributaries, lateral anthropogenic activities, and parameter uncertainty contributed 15%, 66%, and 19% to COD, and 58%, 35%, and 7% to TP, respectively. For the Lower Yangtze River Datong cross-section, the contributions were 6%, 69%, and 25% for COD and 41%, 42%, and 17% for TP. The primary drivers of the anthropogenic pollution sources, in decreasing order of importance, were temperature (reflecting seasonality), date, and precipitation. This study emphasizes the synergy between physical modeling and machine learning, offering new insights into pollution load dynamics in the Yangtze River.

How to cite: Huang, S., Xia, J., Wang, Y., Wang, G., She, D., and Lei, J.: Deciphering pollution loads in the Middle-Lower Yangtze River by coupling water quality models with machine learning, EGU General Assembly 2024, Vienna, Austria, 14–19 Apr 2024, EGU24-3559, https://doi.org/10.5194/egusphere-egu24-3559, 2024.

China has been a traditional aquaculture powerhouse, contributing over one-third of the global production. The Guangdong-Hong Kong-Macao Greater Bay Area stands out as a primary region for aquaculture. Pond aquaculture is a significant method employed in this area, benefiting from its geographical advantages with a widespread and numerous distribution of fish ponds within the Greater Bay Area. The primary production units for aquaculture ponds are predominantly household-based, decentralized, and lack a significant intensive production effect. Aquaculture personnel often rely on experiential judgment to assess water quality. In recent years, increased human factors and a lack of effective management in the aquaculture pond industry have exacerbated water pollution issues. This has resulted in a growing severity of water pollution problems, with governmental departments unable to conduct large-scale monitoring of aquaculture pond water quality. Dissolved oxygen serves as a crucial indicator reflecting the water quality of these aquaculture ponds. Only dissolved oxygen concentrations within suitable ranges can facilitate the growth of aquatic products; concentrations that are either too high or too low can adversely affect aquatic product growth. This study utilized Landsat 8/9 OLI satellite images, employing atmospheric correction based on Rayleigh reflectance. It combined machine learning and water body index methods to establish a dissolved oxygen Support Vector Regression (SVR) inversion model (R2=0.67). This model determined the trends in dissolved oxygen concentration changes and spatial distribution patterns in aquaculture ponds within the Greater Bay Area over the past decade. The results indicate that from 2013 to 2023, there was a marginal decrease of 0.04% in dissolved oxygen concentration. Concentrations decreased during 2014-2016 and 2018-2020, while they increased in other years. Seasonally, concentrations were higher in spring and autumn and lower in summer and winter. Summer exhibited the lowest dissolved oxygen concentration throughout the year, with the smallest concentration difference and relatively concentrated numerical distribution. Dissolved oxygen concentrations varied significantly in other seasons. Aquaculture ponds in low latitude coastal areas generally had lower dissolved oxygen concentrations, while those in northern mountainous and upstream river regions had relatively higher dissolved oxygen concentrations.

How to cite: Mao, K. and Yang, X.: Remote Sensing Retriving of Dissolved Oxygen Concentration in Aquaculture Ponds in the Guangdong-Hong Kong-Macao Greater Bay Area, EGU General Assembly 2024, Vienna, Austria, 14–19 Apr 2024, EGU24-4925, https://doi.org/10.5194/egusphere-egu24-4925, 2024.

Dissolved organic carbon (DOC) in surface waters originates mainly from riparian soils, where several processes affect the mobilisation/immobilisation of organic compounds. Among these processes, iron reduction is thought to be of primary importance for DOC mobilisation and export to surface waters. However, this process can be inhibited by the presence of nitrate due to its higher redox potential than Fe(III), making microbial nitrate reduction thermodynamically favourable compared to iron reduction. In agricultural catchments, the groundwater is typically enriched in nitrate. Thus, rising water tables in riparian areas during the (winter) wet season may inhibit iron reduction and the subsequent DOC mobilisation in soil and surface water. In this study, we tested this hypothesis in a well-monitored agricultural catchment belonging to the OZCAR network, the so-called Kervidy-Naizin catchment (5 km²). We installed 21 zero-tension lysimeters in the riparian zone of the catchment along three transects to sample soil solution in organic-rich top soil horizons (15 cm below the soil surface), at weekly to fortnightly intervals (oct 2022 – jun 2023). We analysed DOC, nitrate, Fe(II) concentrations as well as dissolved organic matter (DOM) composition through its optical properties (3D fluorescence coupled with PARAFAC modelling) to obtain information about DOM sources and dynamics across the hydrological cycle. We found that DOC concentrations were positively correlated with Fe(II) concentrations both spatially and temporally. In contrast nitrate concentrations were negatively related to Fe(II) in the soil solutions during the winter period. These observations support the hypothesis that nitrate is an inhibitor of iron reduction and subsequent DOC mobilisation. Data on the optical properties of DOM show that the DOC mobilised by this process contains large proportions of organic molecules of microbial origin, probably derived from the processing of soil organic matter. In addition, the mobilisation of high amounts of DOC unrelated to iron reduction in some zero-tension lysimeters suggests that other controls, such as wet-dry cycles, may be equally important for sustaining organic compounds in soil solutions and surface waters.

How to cite: Dupas, R., Lambert, T., and Durand, P.: The influence of nitrogen and iron biogeochemical cycles on the production and export of dissolved organic matter in headwater catchments, EGU General Assembly 2024, Vienna, Austria, 14–19 Apr 2024, EGU24-5683, https://doi.org/10.5194/egusphere-egu24-5683, 2024.

EGU24-6339 | ECS | Orals | HS2.3.1

Quantifying the impacts of an exogenous dust input to the soil and stream chemistry of an upland Mediterranean watershed using a reactive transport modeling framework 

Celia Aranda Reina, Julien Bouchez, Jon K. Golla, Pierre-Alain Ayral, and Jennifer L. Druhan

In upland watersheds, depletion of essential nutrients due to physical erosion and chemical weathering can be compensated by exogenous inputs such as aeolian dust deposition. The presence and chemical composition of exogenous dust arriving in natural environments is commonly analyzed in soil profiles using a suite of geochemical and isotopic tracers. However, it remains an outstanding challenge to describe the impacts of dust on the reaction rates that produce these profiles and how this cascades into ecosystem function and water chemistry. As increasingly intense and episodic periods of drought and aridity are promoted by a warming climate, the role of dust production and deposition in Critical Zone structure and function requires improved modeling techniques to facilitate rigorous quantification and prediction. Here we present a newly developed process-based reactive transport framework by modifying the open source CrunchTope software in order to quantitatively interpret the impacts of dust deposition and solubilization in stream water chemistry, regolith weathering rates, and ecosystem nutrient availability. We describe two simulations: (1) a generic model demonstrating a simplified system in which bedrock uplift and soil erosion occur in tandem with solid phase dust deposition at the land surface; (2) a case study based on a small (0.54 km2) upland Mediterranean watershed located on Mont Lozère in the National Park of Les Cévennes, France. In the absence of an exogenous dust input, long-term field observations of calcium in stream water, rain, bedrock, soil, and plant samples cannot be produced from reactive transport simulations of the weathering profile. By adding a carbonate-rich depositional input consistent with the composition of Saharan dust, both stream water chemistry and elemental mass-transfer coefficients in the soil profile better align with field observations, suggesting that dust has become a significant input to this field site in the last ~10 ka. Over this period, the deposition of exogenous carbonates has introduced far more calcium into the system than what could be supplied by the Ca-poor granitic bedrock. This highly soluble carbonate also limits the reactive potential of infiltrating precipitation, ultimately inhibiting chemical weathering rates and hence the component of elemental export fluxes derived from local bedrock. This is the first demonstration of solid-phase dust deposition incorporated into a multi-component reactive transport framework. Our update to the CrunchTope source code allows us to show how dust incorporation affects geochemical cycling across upland watersheds beyond the prohibitive limitations of simplified steady-state assumptions, a feature that will allow further research of a variety of Critical Zone systems subject to the effects of environmental change scenarios. 

How to cite: Aranda Reina, C., Bouchez, J., Golla, J. K., Ayral, P.-A., and Druhan, J. L.: Quantifying the impacts of an exogenous dust input to the soil and stream chemistry of an upland Mediterranean watershed using a reactive transport modeling framework, EGU General Assembly 2024, Vienna, Austria, 14–19 Apr 2024, EGU24-6339, https://doi.org/10.5194/egusphere-egu24-6339, 2024.

EGU24-6444 | ECS | Orals | HS2.3.1

Identifying nitrate-vulnerable zones for surface water pollution in Flanders based on the depth of the redoxcline and aquifer thickness 

Abdul Hadi Al Nafi Khan, Jan Vanderborght, Erik Smolders, and Jan Diels

As in other areas with intensive agriculture in Europe, Flanders struggles with bringing surface water quality in line with the EU Nitrates Directive. At about 25% of the 874 surface water measurement locations in Flanders monitored by the Flanders Environment Agency (VMM), the 90th percentile from monthly measurements conducted during 2018-2023 exceeded a NO3- concentration of 50 mg/L.

A large fraction of the nitrate that leaches out of the root zone is denitrified in the groundwater. However the denitrification rate varies spatially, so mitigation measures are best targeted to zones from where NO3- is transported to the surface water without undergoing significant denitrification in the aquifer. We used a novel methodology to predict NO3- concentrations in the outlets of small catchments that explicitly considers hydrochemical variation within aquifers and is based on the thickness of oxidized and reduced zones in an aquifer.

The depth of the redoxcline, the boundary between the oxidized and reduced zone, was determined from the phreatic groundwater monitoring network of VMM consisting of 2089 multilevel groundwater wells in Flanders. Analysis of the time series of hydro-chemical data (redox potential and dissolved NO3-, O2, Fe, Mn) allowed us to classify the filters as being in oxidized or reduced zone. For each well, the depth of the first ‘reduced’ filter was taken as the depth of the redoxcline.

Assuming a spatially uniform nitrate concentration in the groundwater recharge, the nitrate concentration of the water reaching the catchment outlet can be estimated as:

NO3- at catchment outlet = (thickness of oxidized zone / equivalent aquifer thickness ) × NO3-   in recharge water        (1)

This simple approach assumes that all nitrate is denitrified once the groundwater flowline crosses the redoxcline. Instead of the true aquifer depth, we used the aquifer's equivalent thickness, utilizing the Hooghoudt equation based on the average distance between watercourses. The nitrate input in the recharge water for this calculation was taken from VMM’s NEMO model, which provides the nitrate leachate from agricultural fields to groundwater.

Our investigation covered 68 small agricultural catchments (0.4-20.4 km²). The ratio of oxidized to entire aquifer thickness varied from 0.03 to 1, averaging 0.33. Therefore, on average, 33% of the agricultural areas would show high nitrate vulnerabilities because flowlines originating from there do not cross the redoxcline. However, the ratio of the average observed NO3- concentration in surface water to that in recharge water is 0.46, indicating an overestimation of denitrification. The estimated nitrate concentrations in surface water, calculated using Equation (1), showed a reasonable agreement with observed values (R2 = 0.32). A much lower R2 (0.08) is observed when replacing the ratio of thicknesses in Equation (1) with the average thickness ratio of 0.33. This suggests that the variation in nitrate concentration at the catchment outlet is predominantly governed by the relative thickness of the oxidized zone.

This method identifies nitrate-vulnerable areas along water courses in a catchment that can be used to better target mitigation measures across Flanders.

How to cite: Khan, A. H. A. N., Vanderborght, J., Smolders, E., and Diels, J.: Identifying nitrate-vulnerable zones for surface water pollution in Flanders based on the depth of the redoxcline and aquifer thickness, EGU General Assembly 2024, Vienna, Austria, 14–19 Apr 2024, EGU24-6444, https://doi.org/10.5194/egusphere-egu24-6444, 2024.

In recent years, intensive agricultural practices have been adopted to enhance crop yields for food production. Therefore, the issue of agricultural non-point source pollution attracts attention due to the increasing use of fertilizer. The non-point source pollution control is diverse and difficult to manage because of the physical landscape and agricultural practices (e.g., topography, soil texture, farming, and irrigation). In addition, excessive fertilizer used to enhance crop yields would lead to land degradation. During a rainfall event, nitrogen and phosphorus from fertilizers would be washed into surface water and infiltrated into groundwater, resulting in the degradation of the aquatic environment.

In this study, the use of slow-release fertilizer, compared to the reference of conventional chemical fertilizer, and a constructed wetland were adopted at a pilot-scale study. During a 40-day growing cycle, Brassica Chinensis L.(Pak-Choi) was chosen as the model crop, and two types (i.e., chemical fertilizer and slow-release fertilizer) of fertilizers were applied under pre-designed conditions. Two simulated intense rainfalls were operated on the 26th and 33rd days, and the surface runoff was introduced to the constructed wetland for further nutrient removal. The soil and water samples from the soil and wetland were analyzed for nutrient concentration variation, and the nutrient distribution and removal efficiency were assessed. The results showed that the chemical fertilizer has a higher nutrient loss rate. The nitrogen (N), phosphorus (P), and potassium (K) contents in the soil increased rapidly after top dressing and decreased significantly after the simulated rainfall. In contrast, slow-release fertilizer has a relatively steady nutrient loss rate during the growing cycle. Meanwhile, the chemical fertilizer has a higher total N, P, and K loss via infiltration and runoff than slow-release fertilizer. For the wetland treatment, the N removal for chemical fertilizer and slow-release fertilizer after 15 days was 24.4 % (i.e., from 19.99 ppm to 15.11 ppm) and 29.5 % (i.e., from 20.81 ppm to 14.68 ppm), the P removal amount was 38.1 % (i.e., from 0.21 ppm to 0.13 ppm) and 87.5 % (i.e., from 0.08 ppm to 0.01 ppm), respectively. Opposing to the conventional chemical fertilizers, the use of slow-release fertilizers could reduce nutrient loss. The constructed wetland demonstrated a positive effect on removing the nutrients in neighboring water, which reduced the impact of agricultural non-point source pollution.

Keywords: Conventional farming, Best management practices, Slow-release fertilizer, Constructed wetlands

How to cite: Huang, C.-J. and Fan, C.: Non-point source pollution control in farmland by source-reduction strategies coupled with wetland treatment, EGU General Assembly 2024, Vienna, Austria, 14–19 Apr 2024, EGU24-7171, https://doi.org/10.5194/egusphere-egu24-7171, 2024.

Cover crops (CC) have shown promise in reducing nitrogen (N) leaching, but in semi-arid regions, they might compete with subsequent field culture for water availability. In Austria's Marchfeld region, which is intensively used for agriculture, nitrate levels in groundwater exceed threshold values due to N surplus and limited dilution of seepage water caused by low annual precipitation. Early sown CC with sufficient emergence and N uptake might reduce such groundwater contamination. Further, later tillage dates keep the N stored in the organic pool and reduce mineralisation during autumn and winter. However, CC induced changes in soil water availability could impact the follow-up crop.
This study investigates the impact of cover crop (CC) varieties with different i) seed compositions, ii) tillage dates and iii) on-demand irrigation on N leaching and soil water availability for subsequent field culture.

The randomized block trial included a) frosting CC – autumn conversion, b) frosting CC – spring conversion, c) a mixture of winter hardy and frosting CC – spring conversion and d) fallow plots. On-demand irrigation was performed at plots with same varieties to enhance CC emergence and simulate conditions of both wet and dry years. Within each plot soil moisture sensors and suction cups were installed. Some plots were equipped with matrix potential sensors. Monthly soil samples were analysed for plant available N and plant samples were taken twice. Evaporation was evaluated using four mini-lysimeters, one for each CC composition. STOTRASIM, which is a soil water and mass transport model was used to model the amount of seepage water of each plot and was calibrated on matrix potential measurements.

In general, the results show that all tested varieties of CC significantly reduce plant available nitrogen during winter compared to fallow. Despite the relatively low levels of leached N, in semi-arid regions even minor amounts pose a risk of groundwater contamination. Soil water content analysis revealed no significant differences between the CC varieties. The yield of the subsequent crop remained unaffected by the different CC.
While CC reduced N leaching and did not compete with the subsequent field culture, integrating practical considerations like phyto-sanitation, seedbed preparation, tillage methods, crop rotation and succeeding crop selection into CC practices is crucial to prevent adverse effects on subsequent field culture.

How to cite: Schmid, A., Scheidl, A., and Eder, A.: Cover crop varieties, tillage dates and irrigation on-demand: their impact on nitrogen and soil water dynamics in Austria’s semi-arid Marchfeld region, EGU General Assembly 2024, Vienna, Austria, 14–19 Apr 2024, EGU24-7589, https://doi.org/10.5194/egusphere-egu24-7589, 2024.

EGU24-8959 | ECS | Posters on site | HS2.3.1

Valorization of agricultural residues through its transformation into sustainable filters for water treatment 

Águeda M. Sánchez-Martín, Sara Pérez Dalí, Tomás Undabeytia López, Jorge Marquez Moreno, Alba Dieguez-Alonso, Frank Behrendt, Germán Almuiña-Villar, and José María De la Rosa

Finding a sustainable solution to the increasing amount of organic waste generated, and reducing air, soil and water pollution are two most pressing environmental issues today. In both problems, agriculture plays a crucial role. Within this context, this study aims to valorize abundant agricultural waste via its transformation into activated carbon (AC), useful for the removal of emerging organic contaminants (EOCs) in water.
Thus, rice husk (RH) and almond shell (AS) were characterized, pyrolyzed and tested as feedstock for ACs to be used as water filters. In addition, chemical (with KOH) and physical activation (with water vapor) of the pyrolyzed materials were performed.
The elemental composition and physical properties were suitable in both cases (alkaline pH, high water retention capacity, Carbon content and Iodine index). The specific surface area (SSA-BET) increased significantly to values 600 m2 gr-1 on the ACs produced from physically activated and pyrolyzed RH.
Furthermore, adsorption tests of anti-inflammatory and antibiotic compounds in water showed that ACs produced from RH were able to adsorb up to 100 % of the these persistent EOPs, performing similarly to commercial AC.


Acknowledgements:
This study received financial support in the framework of the Project RICERES4CHANGE (grant TED2021-130964B-I00), by the Spanish Agency of Research (MCIN/AEI/10.13039/501100011033) and the European Union (Next Generation EU/PRTR funding).
A.M. Sánchez-Martín thanks The Spanish Ministry of Science and Innovation (MICIN) for her contract as Technical Support Personnel (PTA2021-020000-I). M. Arenas is thanked for this technical and analytical support.

How to cite: Sánchez-Martín, Á. M., Pérez Dalí, S., Undabeytia López, T., Marquez Moreno, J., Dieguez-Alonso, A., Behrendt, F., Almuiña-Villar, G., and De la Rosa, J. M.: Valorization of agricultural residues through its transformation into sustainable filters for water treatment, EGU General Assembly 2024, Vienna, Austria, 14–19 Apr 2024, EGU24-8959, https://doi.org/10.5194/egusphere-egu24-8959, 2024.

EGU24-9538 | Orals | HS2.3.1

German-wide analysis of high-frequency, continuous concentration-discharge relationships 

Jens Kiesel, Tobias Houska, Janosch Müller-Hillebrand, and Nicola Fohrer

High-frequency observations of solute and particulate concentrations (C) and associated discharge (Q) measurements allow the analysis of C-Q relationships on the event-scale. Together with catchment attributes and event properties, C-Q relationships can be used to disentangle the fine-grained dependencies between catchment properties, hydrologic processes and water quality.

We collected 72 high-frequency (sub-hourly), continuous C and Q time series across Germany in catchments ranging from 8 to 122.000km² (median of 6.051km²). Besides discharge at all 72 locations, the database contains water temperature (60 locations), turbidity (34), conductivity (59), oxygen (57), pH (53), ammonia (16), nitrate (22), phosphate (10) and chlorophyll (12) in varying lengths over a maximum period of 20 years. Event filters were used to extract single discharge events. Hysteresis indices and classes of each event were used to describe the C-Q relationships. Event properties such as season, magnitude, variability, length, antecedent conditions, rise- and fall characteristics and physical catchment characteristics were assigned to each C-Q relationship.

We used a Random Forest model to explain the hysteresis properties based on the event- and catchment characteristics. Particularly the variables turbidity and conductivity revealed spatio-temporal dependencies, which we relate to interplays of land use and soil characteristics. We further found that the C-Q patterns are significantly impacted by the identifiability and definition of the extracted discharge events across the heterogeneous catchments as well as the resolution and quality of the measurements of the different C variables.

How to cite: Kiesel, J., Houska, T., Müller-Hillebrand, J., and Fohrer, N.: German-wide analysis of high-frequency, continuous concentration-discharge relationships, EGU General Assembly 2024, Vienna, Austria, 14–19 Apr 2024, EGU24-9538, https://doi.org/10.5194/egusphere-egu24-9538, 2024.

EGU24-9606 | Orals | HS2.3.1 | Highlight

Field scale optimization of woodchip bioreactors for nitrate removal from drainage water in the Netherlands 

Stefan Jansen, Inge Van Driezum, Joachim Rozemeijer, Arnaut Van Loon, and Frank Van Herpen

It is known from recent international research that woodchip bioreactors can be an effective measure to reduce emissions of nitrate from agricultural drainage water. In the Netherlands, up till now no experience was present with woodchip bioreactors. Therefore, a field pilot was started at an agricultural test location situated in a lowland catchment in the south of the Netherlands (Vredepeel). A woodchip bioreactor was installed to treat drainage water from 4 ha arable land on sandy soil. Nitrate was measured in the in- and effluent of the bioreactor to estimate nitrate removal efficiency over time. Also, water chemistry and discharge were monitored. 
With a series of sampling points in the woodchip bioreactor, biogeochemical processes in the reactor are investigated that can explain the performance of the reactor. The goal is to not only determine the removal efficiency, but also potential side effects and effects of temporarily limited flow rate (e.g. sulfide and ammonia production and oxygen demand). We aim to give practical guidelines for practical design and application for agricultural fields in sandy lowland catchments. In this contribution we will present the monitoring results of one drainage season.

How to cite: Jansen, S., Van Driezum, I., Rozemeijer, J., Van Loon, A., and Van Herpen, F.: Field scale optimization of woodchip bioreactors for nitrate removal from drainage water in the Netherlands, EGU General Assembly 2024, Vienna, Austria, 14–19 Apr 2024, EGU24-9606, https://doi.org/10.5194/egusphere-egu24-9606, 2024.

EGU24-10390 | Orals | HS2.3.1

Increasing stream water DOC concentrations in peat-affected catchments: insights from high-resolution water quality analysis 

Tobias Houska, Ingo Müller, Klaus Kaiser, Klaus-Holger Knorr, Maximilian Lau, Conrad Jackisch, and Karsten Kalbitz

Peatlands are an important natural terrestrial carbon sink. Any impact on the drivers of hydro-biogeochemical processes in these ecosystems can be particularly severe. Climate change and degradation by drainage and ditching are dramatically changing peatlands. Degraded peatlands turn from effective carbon sinks to emitters. They can also threaten drinking water supplies, as (heavy) metals can leach from degraded peatlands together with dissolved organic carbon (DOC). However, quantifying DOC fluxes from terrestrial to aquatic ecosystems is challenging. The hydro-biogeochemical processes at the soil-aquatic interface are not only complex but also occur at different spatial and temporal scales. These processes depend on a variety of constantly changing external conditions such as temperature, nutrient and oxygen availability. In addition, there is no sensor that can directly measure DOC concentrations in streams in situ.

Here we investigated the DOC concentration in two nested catchments of two adjacent streams in the Ore Mountains of southern Saxony, Germany. One stream is dominated by mineral soils, the other by (degraded) peat soils. Each of the four sites is equipped with YSI-EXO fDOM sensors. Other data include discharge, water temperature, turbidity and electrical conductivity. A machine learning algorithm (Random Forest) was trained to predict DOC concentration from the available data set (validation r² between 0.85 and 0.98). The 15-minute resolution DOC data were analysed for potential driving factors. Interestingly, the area-specific loads of the peat-dominated catchment with 3.4 g C m-2 a-1 were not significantly different from those of the mineral soil-dominated catchment with 1.8 g C m-2 a-1. However, the annual loads were almost twice as high as previously determined from monthly data. With the high-resolution DOC data, we can identify periods of extreme DOC concentrations (up to 40 mg l-1) after heavy rain events in summer and constant high DOC concentrations of 20 mg l-1 during snowmelt in winter. By applying the algorithm to DOC:DON ratios, we were also able to quantify the different sources contributing to streamwater DOM with plant-derived material from peat and microbially-derived material from the mineral soil.

Previous DOC measurements, mostly based on 2-week to monthly measurements, are likely to greatly underestimate the contribution of DOC to C fluxes in ecosystems. This is particularly important for C-rich ecosystems such as peatlands.

How to cite: Houska, T., Müller, I., Kaiser, K., Knorr, K.-H., Lau, M., Jackisch, C., and Kalbitz, K.: Increasing stream water DOC concentrations in peat-affected catchments: insights from high-resolution water quality analysis, EGU General Assembly 2024, Vienna, Austria, 14–19 Apr 2024, EGU24-10390, https://doi.org/10.5194/egusphere-egu24-10390, 2024.

EGU24-11237 | ECS | Posters on site | HS2.3.1

Using field deployable sensors to identify the inter-event predictability of Dissolved Organic Matter mobilisation in an urban river 

Hongzheng Zhu, Kieran Khamis, David M. Hannah, and Stefan Krause

Emerging sensor technology offers new opportunities to monitor different fractions of Dissolved Organic Matter (DOM) in high resolution. Concentration-discharge (C-Q) relationships (e.g. hysteresis or c-q slopes), derived from high frequency observation can offer insight into source mobilization and reactive transport processes of DOM. However, few studies have explored patterns in urban catchments, where understanding of storm event DOM responses under different hydrometeorological conditions remains elusive. To bridge this gap, we collected 2-years (15 min resolution) fluorescence data (humic-like fluorescence [HLF: Ex. 325 nm/ Em 470 nm] and tryptophan-like fluorescence [TLF: Ex 275 nm/ Em 350 nm]) in an urban headwater stream (Birmingham, UK). We used c-q slopes and two indices, the hysteresis index (HI) and flushing index (FI), to explore the inter-event variability in DOM dynamics. In addition, we assessed the hydrometeorological factors (e.g., antecedent conditions, temperature, discharge and rainfall characteristics) that govern DOM mobilisation and transport using statistical multiple linear regression. Our findings reveal pronounced seasonal variation in the behaviour of TLF and HLF. In warmer periods, the chemodynamic characteristics of both fluorescence peaks become evident. We observed a consistent counter-clockwise hysteresis pattern accompanied by flushing behaviour. The magnitude of discharge, antecedent temperature, and rainfall intensity were identified as key drivers of HLF and TLF flushing and hysteresis dynamics. Conversely, during colder months, a shift in DOM mobilisation was observed. For TLF, source limitation was apparent, characterized by clockwise hysteresis and a notable dilution. In contrast, HLF exhibited a more variability during this period, with complex hysteresis patterns and a combination of solute flushing and dilution. The magnitude of discharge and antecedent wetness were identified as the key factors influencing the solute behaviour in this cooler period. Our research indicates that the responses of DOM in urban rivers exhibit distinct responses to hydrometeorological conditions which were relatively predictable (i.e. low stochasticity within particular event types). However, variability in DOM composition and magnitude was pronounced between event types which has implications for managing urban rivers, specifically ensuring ecological health and resilience are maintained in the face of increasing climatic extremes.

How to cite: Zhu, H., Khamis, K., Hannah, D. M., and Krause, S.: Using field deployable sensors to identify the inter-event predictability of Dissolved Organic Matter mobilisation in an urban river, EGU General Assembly 2024, Vienna, Austria, 14–19 Apr 2024, EGU24-11237, https://doi.org/10.5194/egusphere-egu24-11237, 2024.

EGU24-11516 | Posters on site | HS2.3.1

Integrating and managing nitrogen and phosphorus dynamics in agriculturally impacted inland waters via a stoichiometric nutrient management framework 

Daniel Graeber, Anika Große, Katja Westphal, Alexander Wachholz, Marc Stutter, Gabriele Weigelhofer, Thomas Alexander Davidson, Tom Shatwell, Andreas Musolff, Rohini Kumar, and Dietrich Borchardt

Agricultural nutrient management tends to treat nitrogen (N) and phosphorus (P) in surface waters as separate entities, potentially overlooking their strong interactions in biogeochemical cycles. This study proposes a unifying approach by integrating these nutrients through a stoichiometric nutrient management framework. This framework suggests two paradigm shifts in inland-water nutrient management: 1. It improves catchment and ecosystem-level understanding of N and P sources and effects via N : P ratio assessments of sources, transport and ecological effects, such as eutrophication. 2. It proposes that provision of organic carbon (OC) can increase the retention of N and P in agriculturally impacted inland waters, which can be assessed using C : N : P ratios. Provision of OC to modify C : N : P ratios may be reached through restoring natural OC sources. This can be done by focusing on areas such as wetlands, riparian forests, and bogs at catchment scale. Here, stoichiometric rules are utilized to assess the responses of key microbial processes, which includes examining how nutrients are assimilated by microbial primary producers and heterotrophs, as well as the process of denitrification. Understanding the secondary effects of wetted area development through the stoichiometric nutrient management framework will also support decision making for flood and drought protection based on such wetted areas. With these aspects, the stoichiometric nutrient management framework provides comprehensive understanding of nutrient dynamics, retention, and their ecological impacts in inland water catchments and ecosystems. In the presentation, we will present evidence supporting the comprehensiveness of the stoichiometric nutrient management framework. This evidence is based on a series of studies we conducted, including conceptual modeling, statistical modeling, ratio-based monitoring, and targeted proof-of-concept microcosm experiments. We conclude that the stoichiometric nutrient management framework could provide crucial strategies to mitigate current nutrient pollution issues in agriculturally-impacted inland waters, thereby aligning with the Water Framework Directive’s objectives for improving water quality.

How to cite: Graeber, D., Große, A., Westphal, K., Wachholz, A., Stutter, M., Weigelhofer, G., Davidson, T. A., Shatwell, T., Musolff, A., Kumar, R., and Borchardt, D.: Integrating and managing nitrogen and phosphorus dynamics in agriculturally impacted inland waters via a stoichiometric nutrient management framework, EGU General Assembly 2024, Vienna, Austria, 14–19 Apr 2024, EGU24-11516, https://doi.org/10.5194/egusphere-egu24-11516, 2024.

EGU24-12746 | ECS | Orals | HS2.3.1

Sediment ponds; an effective mitigation measure for reducing nutrient export in agricultural drainage ditches?  

Linda Heerey, Owen Fenton, Fiona Regan, Blánaid White, Nigel Kent, and Karen Daly

The agricultural sector is a large contributor to poor water quality in our freshwater systems. One potential pathway for agriculturally sourced pollution to enter the freshwater environment is through drainage ditches, which can be either open surface drains or subsurface pipes, or a combination of both. While large scale tile-drainage systems with a central output point are common in some countries, Irish agricultural drainage networks tend to be comprised of a complex network of drains, each with varying levels of connectivity to freshwater systems. Recent research by Moloney et al. (2020) categorised these drains in terms of their connectivity, finding that those with a direct connection between a farmyard and river/stream were at the greatest risk for transporting the highest concentrations of nutrients (phosphorus and nitrogen). Therefore, to target the most ideal location to mitigate against nutrient transport through drainage ditches, drains with direct farmyard connectivity provide the most resource- and cost-effective option.

This study investigated the effectiveness of sediment ponds installed in drainage ditches which had a direct connection between a farmyard and a river. Three case study farms were selected, two in the south (Cork) and one in the south-east (Wexford) of Ireland. All ponds were installed by 2021, with sampling commencing in December 2022. Grab water samples were collected weekly (Wexford farm) and fortnightly (Cork farms) at multiple points upstream and downstream of the ponds, and were analysed for nitrogen, phosphorus and dissolved organic carbon. Sediment samples were extracted from within the drainage ditches in summer 2023 and analysed for Mehlich-3 P, pH, Morgan’s P and particle size distribution. Initial results suggest ponds provide limited attenuation of nutrients, with no significant decreases at the downstream sample points. While sediment phosphorus concentrations are marginally elevated downstream, suggesting potential accumulation in the soil, further sampling is needed to confirm this trend. This study provides valuable insights into nutrient dynamics within agricultural drainage ditches and contributes to a better understanding of the effectiveness of sediment ponds as a potential mitigation measure for nutrient retention.

How to cite: Heerey, L., Fenton, O., Regan, F., White, B., Kent, N., and Daly, K.: Sediment ponds; an effective mitigation measure for reducing nutrient export in agricultural drainage ditches? , EGU General Assembly 2024, Vienna, Austria, 14–19 Apr 2024, EGU24-12746, https://doi.org/10.5194/egusphere-egu24-12746, 2024.

EGU24-13731 | Orals | HS2.3.1 | Highlight

Memory and Management: Competing Controls on Long-Term Nitrate Trajectories in U.S. Rivers 

Kimberly Van Meter, Nandita Basu, and Danyka Byrnes

Excess nitrogen from intensive agricultural production, atmospheric N deposition, and urban point sources elevates stream nitrate concentrations, leading to problems of eutrophication and ecosystem degradation in coastal waters. A major emphasis of current US-scale analysis of water quality is to better our understanding of the relationship between changes in anthropogenic N inputs within watersheds and subsequent changes in riverine N loads. While most water quality modeling assumes a positive linear correlation between watershed N inputs and riverine N, many efforts to reduce riverine N through improved nutrient management practices result in little or no short-term improvements in water quality. Here, we use nitrate concentration and load data from 478 US watersheds, along with developed N input trajectories for these watersheds, to quantify time-varying relationships between N inputs and riverine N export. Our results show substantial variations in watershed N import-export relationships over time, with quantifiable hysteresis effects. Our results show that more population-dense urban watersheds in the northeastern U.S. more frequently show clockwise hysteresis relationships between N imports and riverine N export, with accelerated improvements in water quality being achieved through the implementation of point-source controls. In contrast, counterclockwise hysteresis dynamics are more common in agricultural watersheds, where time lags occur between the implementation of nutrient management practices and water-quality improvements. Finally, we find higher tile-drainage densities to be associated with more linear relationships between N inputs and riverine N. The empirical analysis in this study is bolstered by modeled simulations to reproduce and further explain drivers behind the hysteretic relationships commonly observed in the monitored watersheds.

How to cite: Van Meter, K., Basu, N., and Byrnes, D.: Memory and Management: Competing Controls on Long-Term Nitrate Trajectories in U.S. Rivers, EGU General Assembly 2024, Vienna, Austria, 14–19 Apr 2024, EGU24-13731, https://doi.org/10.5194/egusphere-egu24-13731, 2024.

 Cascade reservoirs construction has modified the nutrients dynamics and biogeochemical cycles, consequently affecting the composition and productivity of river ecosystems. Cascade reservoirs in different rivers typically exhibit distinct variabilities in the retention characteristics of different nutrients. The Jinsha River, as the predominant contributor to runoff, suspended sediment (SS), and nutrients production within the Yangtze River, is a typical cascade reservoir region with unclear transport patterns and retention mechanisms of nutrients (nitrogen and phosphorus). Therefore, we monitored monthly variations in nitrogen and phosphorus concentrations from November 2021 to October 2022. The results demonstrated that the concentrations and fluxes of total phosphorus (TP) and particulate phosphorus (PP) significantly decreased as they moved downstream along the cascade of reservoirs, primarily due to PP deposited with SS, while total nitrogen (TN) and dissolved total nitrogen exhibited opposing trends. Moreover, the positive average annual retention rates for TP and PP were 9.64% and 15.64%, respectively, in contrast to the negative averages of -8.38% for TN and -10.51% for particulate nitrogen. A higher proportion of TP and PP was retained by the reservoirs in the flood season compared to the non-flood season. Additionally, the variability in runoff-sediment and hydraulic retention time (HRT) of cascade reservoirs played crucial roles in the retention of TP and PP. A stronger relationship between HRT and TP retention rate during the flood season suggested that the cascade reservoirs could effectively transport or intercept TP downstream when HRT was either less than or greater than 5.3 days. Consequently, the HRT of these reservoirs could be managed to control nutrients delivery, which was of particular significance for watershed government institutions. This study enhances our comprehension of how cascade reservoirs influence the distribution and transport patterns of nutrients, offering a fresh perspective on nutrients delivery regulation. 

How to cite: Zeng, Q.: Impact of cascade reservoirs on nutrients transported downstream and regulation method based on hydraulic retention time, EGU General Assembly 2024, Vienna, Austria, 14–19 Apr 2024, EGU24-14010, https://doi.org/10.5194/egusphere-egu24-14010, 2024.

EGU24-14984 | Orals | HS2.3.1

The establishment and use of local coastal water boards is tested in Denmark to find bottom-up solutions for RBMP 2027 

Jørgen Windolf, Kristoffer Piil, Torben B. Jørgensen, Hans E. Andersen, Tommy Dalgaard, and Brian Kronvang

The Danish EPA has in the 3rd River Basin Management Plan (RBMP) under the Water Framework Directive set target nitrogen loads for each coastal water for how to reach the reduction needed from coastal catchments to be implemented in 2027. In this context four locally based pilotprojects have been initiated to engages stakeholders to find local solutions for the RBMP. One of these new pilots are focusing on the Hjarbæk estuary situated in Limfjorden being one of the coastal water bodies in Denmark that needs the highest reductions in nitrogen loadings to be achieved before 2027 (ca. 65 %). This new project involving a coastal water board with all main stakeholders in the region being represented was initiated in February 2023 and has delivered proposals for 2 scenarios by the end of 2023 that can assure that the Hjarbæk estuary reach the target of achieving good ecological conditions.

Because of the high reductions in nitrogen loadings needed it is necessary to reduce all sources and both nitrogen and phosphorus to reach the goal. Focus in the RBMP has so far been to reduce the total nitrogen (TN) loadings. In the locally based scenarios phosphorus has gained greater focus. Our calculations show that every ton of phosphorus that is removed corresponds to removing 22 tons of nitrogen in Hjarbæk Fjord.  To be most cost-effective the effort will be carried out based on the principle of achieving the greatest possible effect per area unit. For that a detailed mapping of nitrogen (N) attenuation in the catchment have been conducted at a scale of ca. 15 km2 (ID15 sub-catchments) including mapping of both N-retention in groundwater and surface waters as well as N-delays in groundwater in Karst sub-catchments. The mapping shows huge differences in N-retention in both groundwater and surface waters within the ID15 sub-catchment (<20 % to >80 %).

The local engagement of stakeholders representing all sectors in the catchment and estuary have worked together to set up two scenarios that includes: i) marine mitigation measures such as mussel farming and eelgrass planting; ii) reductions in point source loadings; iii) use of a new portfolio of N mitigation measures to be adopted at source (e.g. catch crops, early seeding, set a side, afforestation, etc.); iv) use of transport mitigation measures from field to surface water (several types of constructed wetlands, riparian buffers and restored wetlands); v) the possible use of different phosphorus mitigation strategies in the catchment (lowering bank erosional P-losses, buffer strips, afforestation, etc.).

How to cite: Windolf, J., Piil, K., Jørgensen, T. B., Andersen, H. E., Dalgaard, T., and Kronvang, B.: The establishment and use of local coastal water boards is tested in Denmark to find bottom-up solutions for RBMP 2027, EGU General Assembly 2024, Vienna, Austria, 14–19 Apr 2024, EGU24-14984, https://doi.org/10.5194/egusphere-egu24-14984, 2024.

EGU24-15329 | Orals | HS2.3.1

Redox driven mobilisation of DOC from riparian wetlands in Krycklan (N Sweden) after a drought experiment 

Benny Selle, Anja Hortmann, Klaus-Holger Knorr, and Hjalmar Laudon

Riparian wetlands are major sources of dissolved organic carbon (DOC) to streams. Increasing DOC concentrations were observed for many northern streams during the last decades, with potential implications for carbon (C) storages of wetland soils and streamwater quality. Drivers behind these trends, and particularly the significance of redox processes in wetland soils, are still incompletely understood. In soils, organic C is often associated with or bound to iron (oxy) hydroxides. These associations of iron (Fe) and organic C may immobilise and protect soil organic matter from mineralisation under oxic conditions. However, organic C can be remobilised if ferric Fe is reduced under anoxic conditions, a process which also increases pH further enhancing DOC solubility. Redox processes are therefore presumably important drivers of DOC dynamics in both wetland soils and the adjacent streams. We hypothesised that in-stream DOC concentrations are mainly driven by redox conditions within riparian organic soils, where DOC mobilisation is controlled by reduction of DOC associated Fe. We further propose that these DOC mobilising redox processes are particularly relevant for periods of rewetting of riparian soils, e.g. in autumn. In this study, were used monitoring data following a drought experiment conducted in summer 2017 in a sub-catchment of Krycklan in northern Sweden. For the experiment, a drought was simulated for a sub-catchment in Krycklan by damming a lake outlet that feeds a small stream. For the rewetting period after the drought experiment, daily time series of discharge, DOC and Fe feeding into the manipulated stream section were calculated from data measured at the top and the bottom of the stream section. Discharge was measured by flumes. From discharge time series, baseflow feeding into the stream section was computed using a baseflow separation filter. Time series of baseflow was assumed to represent average watertable dynamics in riparian wetlands. Both Fe and DOC concentrations were obtained from absorbances measured across different wavelength using a portable ultraviolet–visible probe. Adsorbances were converted into aquatic concentrations using a partial least-squares regression model calibrated on Fe and DOC concentrations measured in the laboratory. Furthermore, concentration time series were corrected for discharge and in-stream retention (for DOC only). We found that Fe increased with increasing baseflow with a time lag of 5d indicating delayed iron reduction in riparian areas in response to elevated watertables. Dynamics of DOC were weaker related to baseflow than to Fe, but DOC was significantly correlated to Fe. From rules to obtain directed acyclic graphs it can be inferred that changing baseflow - as a proxy of watertables in riparian wetlands - caused changing discharge corrected Fe concentrations in the stream, which can be understood as a proxy of Fe concentrations in riparian wetlands. Changing Fe concentrations caused changes of computed in-stream DOC concentrations, which can be seen to represent mobilised DOC pools in riparian wetlands. It is concluded that redox driven mobilisation of DOC is a plausible process for rainfall periods in autumn, when riparian soils are rewetted after summer.

How to cite: Selle, B., Hortmann, A., Knorr, K.-H., and Laudon, H.: Redox driven mobilisation of DOC from riparian wetlands in Krycklan (N Sweden) after a drought experiment, EGU General Assembly 2024, Vienna, Austria, 14–19 Apr 2024, EGU24-15329, https://doi.org/10.5194/egusphere-egu24-15329, 2024.

EGU24-15361 | ECS | Posters on site | HS2.3.1

Mitigation of nitrogen loss in rice fields through soil desaturation prior to re-irrigation and the application of controlled-release nitrogen fertilizer: a meta-analysis 

Sabi Kidirou Gbedourorou, Pierre G. Tovihoudji, Marnik Vanclooster, and Irénikatché P. B. Akponikpe

Water pollution by nitrogen residues from agricultural intensification has become a recurring problem, particularly in wetlands used for rice production. As a solution to remediate this issue, sustainable water and nutrient management are being explored. These practices involve matching water and nutrient availability with plant needs in space and time while ensuring production objectives are met. In this study, we performed a meta-analysis to synthesize the current knowledge on the effect of water and nutrient management practices on nitrogen losses and uptake by plants in rice cropping systems. Using a random effects model, we summarized the effect sizes of 103 observations from 27 peer-reviewed studies. Tree water management practices were evaluated: “Continuous Flooding” (used as control), “Alternate Wet and Dry (AWD)” and “Controlled Irrigation (CI)”. The response ratio (RR) of nitrate leaching and total nitrogen loss was negative for CI (-0.53 and -0.34, respectively) and AWD (-0.13 and -0.36, respectively). Regardless of water management practices (AWD or CI), desaturating the soil before re-irrigation reduced nitrate and total nitrogen losses. When considering the source of nitrogen input, water management practices involving desaturation of the soil before re-irrigating were effective in reducing nitrogen losses in urea-only applications. However, in the case of controlled release urea (CRF) applications, water management treatments (AWD or CI) were not necessary to reduce nitrogen losses, especially those due to ammonia volatilization. This result also indicates the effectiveness of CRF treatment in retaining the essential nitrogen component required for plant growth and development. Nevertheless, when nitrogen rates exceed 200 kg N/ha, adopting water management practices such as CI and AWD becomes necessary to decrease nitrate leaching and total nitrogen loss in rice fields. Regarding the rice grain yield, water management practices that involve reducing the amount of water (AWD and CI) have shown no significant effect on yield (RR 0.017 and -0.0001). In conclusion, AWD and CI water management practices have been shown to reduce nitrogen losses without compromising rice grain yield. Additionally, the application of CRF reduces nitrogen losses that may occur in a continuous flooding system.

Key-words: Water management; Nitrogen; Rice; Controlled release urea; Water pollution

How to cite: Gbedourorou, S. K., Tovihoudji, P. G., Vanclooster, M., and Akponikpe, I. P. B.: Mitigation of nitrogen loss in rice fields through soil desaturation prior to re-irrigation and the application of controlled-release nitrogen fertilizer: a meta-analysis, EGU General Assembly 2024, Vienna, Austria, 14–19 Apr 2024, EGU24-15361, https://doi.org/10.5194/egusphere-egu24-15361, 2024.

EGU24-17087 * | Orals | HS2.3.1 | Highlight

Paludiculture: multifunctional land-use to decrease nutrient loading 

Jeroen Geurts, Marelle Van der Snoek, Christian Fritz, and Gert-Jan Van Duinen

To counteract soil subsidence and greenhouse gas emissions, groundwater levels in agriculturally used peatlands are increased in summer (e.g. by subsurface irrigation). This rewetting could lead to increased nutrient mobilization under anaerobic conditions in nutrient-rich soils, which will lead to eutrophication in ditches and lakes. However, rewetted peatlands can also be used to purify surface water and utilize the available nutrients by cultivation of wet crops like Typha and Phragmites, which is called “paludiculture”. These wet crops can provide raw materials for fiber based products (e.g. insulation and building materials). Paludiculture can also be implemented in multifunctional buffer zones along streams in sandy landscapes.

This multifunctional land-use can create a win-win situation that combines biomass production of wet crops with the provision of ecosystem services, such as peat preservation and water purification. To underpin what the water purification potential of paludiculture is, measurements have been done in several mesocosm experiments and field-scale paludiculture pilots within national and European projects (e.g. VIP-NL, KLIMAP, Carbon Connects and CINDERELLA). These pilots and experiments were used to learn how to cultivate paludiculture crops under different hydrological circumstances (water level and fluctuations), nutrient loads, water quality, soil types and field configurations. We quantified the nutrient uptake by Typha and Phragmites and the change in water quality between inlet and outlet in different situations. The results are also used to investigate which combination of factors will give the most efficient combination of water purification, nutrient uptake and biomass production.  In the end, this contributes to developing new ways of sustainable and economical feasible farming on wet peat soils and in brook valleys.

How to cite: Geurts, J., Van der Snoek, M., Fritz, C., and Van Duinen, G.-J.: Paludiculture: multifunctional land-use to decrease nutrient loading, EGU General Assembly 2024, Vienna, Austria, 14–19 Apr 2024, EGU24-17087, https://doi.org/10.5194/egusphere-egu24-17087, 2024.

EGU24-17979 | Orals | HS2.3.1 | Highlight

Impact of drought on nitrogen concentrations in leaching water from agricultural areas in the Netherlands 

Marieke Oosterwoud, Harm Wismans, Astrid Vrijhoef, Richard van Duijnen, and Susanne Wuijts

Since the introduction of the EU Nitrates Directive (91/676/EEC), nitrogen concentrations have gradually declined. The recent summer droughts (2018-2020) in the Netherlands, have caused an increase in nitrogen concentrations in water leaching from agricultural soils, exceeding standards. It is expected that with increasing numbers of climate extremes, summer droughts will occur more often in the Netherlands. In order to develop possible strategies, it is important to better understand the underlying mechanisms and consequent impact of droughts on water quality. 


In rural areas of the Netherlands the water quality of shallow groundwater and surface water (leaching water) is strongly influenced by agricultural land use. The EU Nitrates Directive aims to protect waters against pollution caused by nitrates from agricultural sources. In the Netherlands, leaching of nitrogen to shallow groundwater and surface water is monitored for over 30 years by the Dutch Mineral Policy Monitoring Programme (LMM). Within the LMM, the Netherlands is divided in 4 main and 14 subregions based on soil type. The water sampling at participating farms, enables to analyse the effect of farming practices on water quality in the different LMM regions. 


Nutrients applied during the growing season can leach to shallow groundwater and surface water in the following autumn and winter. Summer drought inhibits the uptake of nutrients by crop, hampers the process of denitrification and leads to thickening of the soil moist and upper groundwater, leading to accumulation of excess nitrates in the soil. These excess nitrates can potentially increase nitrogen concentrations in leaching water in winter. Not every soil region responds similarly to a drought period. The aim of this study is to investigate why certain regions experience a stronger impact of drought on nitrogen leaching than others. 


We used monthly spatial Standardized Precipitation Evaporation Index data provided by the Royal Meteorological Institute (KNMI) over the period 1990-2022 to identify where (region) and when (year) summer droughts occurred. The LMM dataset was used to analyse the change in groundwater levels, nitrogen concentrations in leaching water and soil nitrogen surplus following a summer drought. Furthermore, we investigated the role of soil type and land use on the change in nitrogen concentrations in leaching water caused by drought.


Our findings reveal that the magnitude of the increase in nitrogen concentration in leaching water following a summer drought is determined by the duration and intensity of the drought. Furthermore, soil type and agricultural practices influenced the variation of the impact by droughts between regions. These results can be used to identify areas that are more sensitive to impacts of droughts on water quality based on their soil and land use characteristics and thus support the development of adaptation strategies by farmers, water authorities and national government. 

How to cite: Oosterwoud, M., Wismans, H., Vrijhoef, A., van Duijnen, R., and Wuijts, S.: Impact of drought on nitrogen concentrations in leaching water from agricultural areas in the Netherlands, EGU General Assembly 2024, Vienna, Austria, 14–19 Apr 2024, EGU24-17979, https://doi.org/10.5194/egusphere-egu24-17979, 2024.

The Nitrates Directive (91/676/EEC) obliges all EU Member States to protect groundwater and surface water against pollution caused by nitrates from agricultural sources. To meet this objective, the Netherlands has developed standards for the use of manure and inorganic fertilisers. Empirical models are used to evaluate these standards to ensure that they are consistent with the objectives of the Nitrates Directive. This study has evaluated field data over a period of 30 years to assess leaching fractions of nitrogen surplus for different soil types and land use (arable vs grassland).   The results serve as input for the empirical models.

The aim of this study was to calculate the part of the nitrogen surplus on arable land and grassland that leaches into ground and surface water (nitrogen leaching fraction). This is done for four regions characterised by different soil types (sand, loess, clay and peat). The sand region is herein divided in different groundwater depth regime classes (GRC’s) which are an indicator for the soil drainage condition. 

The type of soil and its usage impact specific soil microorganisms. These microorganisms are able to break down nitrate. The more denitrification takes place, the less of the nitrogen surplus, in the form of nitrate, reaches ground and surface water, resulting in a reduced leaching fraction. 

This study utilised monitoring data from the Minerals Policy Monitoring Programme (LMM). This long term monitoring programme monitors the agricultural practice and water quality on agricultural farms in the Netherlands since 1991 onwards. All farms in this study were randomly sampled and selected (about 750 farms over the whole period).

Nitrogen surplus was derived by subtracting nitrogen outputs from input at the farm level. Precipitation surpluses were used to calculate nitrogen loads from nitrate concentrations per soil region and land use (arable or grassland). This was done using year specific long-term median precipitation surplus based on fractions of crop types, soil types and GRC’s. 

The nitrogen leaching fraction is highest in dry sandy soils, followed by loess, clay and peat. Leaching fractions were found to be significantly higher on arable land than on grassland. The findings of this study closely align with prior research on leaching fractions from 1991 to 2014   even though input data was completely renewed.

The most remarkable change in input data from the former version was visible on Dutch soil and GRC maps: soil types and GRC’s have shifted over the monitoring period. Shallow peat soils located on sands have shifted, due to oxidation, to a more sandy soil, whereas groundwater tables have fallen. 

This method is, as far as known, unique because of the use of a large sample of random, shallow water quality measurements, aggregating to a long term leaching fraction, without the use of complex model instruments. This measurement-based method can be a helpful tool to derive environmentally sound N use standards to meet with the objectives of the Nitrate Directive.

How to cite: Brussée, T. and Oosterwoud, M.: Estimating nitrogen leaching fractions to ground and surface water on agricultural farms from long-term monitoring data, EGU General Assembly 2024, Vienna, Austria, 14–19 Apr 2024, EGU24-18419, https://doi.org/10.5194/egusphere-egu24-18419, 2024.

EGU24-18955 | ECS | Posters on site | HS2.3.1

Shifting nitrate seasonality along decades of anthropogenic impact in western European catchments 

Pia Ebeling, Rémi Dupas, Benjamin Abbott, Rohini Kumar, Sophie Ehrhardt, Jan H. Fleckenstein, Nils Turner, and Andreas Musolff

Nitrate pollution in streams, although attempts have been made to combat it, remains a persistent problem, especially in highly anthropogenically impacted landscapes such as Western Europe. Nitrate concentrations and discharge typically vary with the seasons, as does the vulnerability of water bodies to high nitrate inputs. However, the degree of variability and seasonal timing vary in space and time while nitrate inputs in catchments have undergone drastic long-term changes. The changing N sources and distribution in the catchments and their variable hydrological activation suggest that different nitrate seasonality has emerged across catchments over the decades. In this study, we hypothesize that nitrate concentrations respond faster to changes in input during the high-flow season than during the low-flow season, as shallow sources are typically activated during high flow and are the first to be affected by changes in management. To test this hypothesis, we propose a hysteresis approach of long-term nitrate seasonality during low- and high-flow seasons, which we applied in 290 catchments in Germany and France with nitrate and discharge time series of 20 or more years. Our results show that in the majority of catchments, nitrate and discharge vary synchronously with peaks in winter. Deviating average nitrate-discharge typologies could be linked to topography and hydroclimatic seasonality as well as to the regionally characteristic source heterogeneity and lithology in northwestern France. Contrary to our hypothesis, we found both types of trajectories with preceding high-flow and low-flow nitrate concentrations were equally present. We could exemplarily show high-flow concentrations responded first in an agricultural catchment and low-flow concentrations reacted first in a more point source intense catchment. However, across the large number of catchments, consistency was not observed suggesting higher complexity of interacting processes. In a further step, we plan to investigate the long-term trajectories of phosphorus to account for the ratios of the major nutrients affecting the resulting impact of land-stream transfer processes on eutrophication.

References: Ebeling, P., Dupas, R., Abbott, B., Kumar, R., Ehrhardt, S., Fleckenstein, J. H., & Musolff, A. (2021). Long-term nitrate trajectories vary by season in Western European catchments. Global Biogeochemical Cycles, 35, e2021GB007050. https://doi.org/10.1029/2021GB007050

How to cite: Ebeling, P., Dupas, R., Abbott, B., Kumar, R., Ehrhardt, S., Fleckenstein, J. H., Turner, N., and Musolff, A.: Shifting nitrate seasonality along decades of anthropogenic impact in western European catchments, EGU General Assembly 2024, Vienna, Austria, 14–19 Apr 2024, EGU24-18955, https://doi.org/10.5194/egusphere-egu24-18955, 2024.

Diffuse pollution of shallow groundwater as a result of leaching of substances from agricultural soils has a negative impact on groundwater quality. In the drinking water sector, the focus has traditionally been on nitrogen (nitrate) and crop protection products, which are subject to strict standards. Geochemical buffering processes in the subsurface convert a large part of the nitrate load that leaches to groundwater from agricultural soils. However, these processes can often lead to an increase in the hardness (sum of the calcium and magnesium concentrations) of groundwater, which is undesirable for drinking water and domestic use.

Recent research shows that 70% of phreatic groundwater extraction locations in the Netherlands show a significant increasing trend in hardness. However, quantitative insight into the relationship between spatial characteristics (land use, soil type and geochemical composition of the subsoil) and hardness has so far been lacking. In this research we analyzed a long time series of data (since 1900) from shallow (< 25 m below ground surface) phreatic and semi-confined groundwater extraction locations in the Netherlands. The trends in hardness and partial pressure of CO2 (PCO2) and relationship with spatial characteristics of the extractions is presented.

A clear influence of agriculture activities in groundwater protection areas was observed; the hardness in agricultural-dominated extraction sites was 2.5 times higher compared to nature-dominated extraction sites, while the trend in the increase in hardness was almost 3 times higher. The trend is observed in both calcium carbonate-rich and calcium carbonate-poor soils. In carbonate-rich areas, the hardness of groundwater is determined by the addition of acid, from atmospheric deposition, agricultural activities such as fertilization and crop harvesting and by weak acid (CO2) contributions from root respiration and mineralization of organic matter. In carbonate-poor soils hardness sources are the use of calcium and magnesium salts and the application of manure on agricultural land. 

In carbonate-rich systems, slightly less than half of the groundwater hardness was found to be due to limescale weathering due to strong acid input, while slightly more than half of the hardness was due to weathering from CO2. Higher PCO2 levels and trends in agricultural-dominated extraction sites comparted to nature-dominated sites reveals an impact of intensive agricultural production on the CO2 production is soils, and thereby on groundwater quality, that have not been considered so far.

To minimize hardness as a result of soil acidification it is recommended to reduce nitrogen deposition, limiting nitrate leaching and limit the use of fertilizers that acidify the soil. To minimize hardness as a result of weak acid (CO2) weathering, more extensive agricultural practices to reduce root respiration should be adopted, and the degradation of soil organic matter can be limited by preventing (short-term) lowering of groundwater levels in organic rich soils. The results indicate that land use has a significant effect on the hardness and PCO2 in groundwater. Mitigating measures should consider an area-based approach, taking into account the land-use, soil type and geochemical characteristics of the subsurface to limit the impacts of increased hardness and PCO2 as a result of agricultural activities.

How to cite: Hockin, A., van der Grift, B., and Scheper, D.: Unexpected impact of agricultural land-use practices on the concentration and trend in hardness of groundwater abstracted for drinking water supply, EGU General Assembly 2024, Vienna, Austria, 14–19 Apr 2024, EGU24-20251, https://doi.org/10.5194/egusphere-egu24-20251, 2024.

EGU24-20400 | ECS | Posters on site | HS2.3.1 | Highlight

Understanding hysteresis in high-frequency water quality data in rivers: adding value to targeted research using routinely collected operational data  

Josie Ashe, Emilie Grand-Clement, and Richard. E Brazier

Patterns and variability in the concentration-discharge relationship may be used to describe the complex interactions and combined effects of catchment processes affecting sources, mobilisation and transport of contaminants. Many concentration-discharge relationships display temporal variability on diurnal, event, seasonal and annual scales. This has been widely demonstrated through both routine regular sampling and targeted storm sampling.

The set-up costs of high frequency in-situ river and reservoir sensors is high, and operation and maintenance of a wide network is both time and resource intensive and the conditions for operation (e.g. environmental conditions, signal, power) are rarely ideal. Yet with technological advances and the growth in availability of high-frequency is-situ water quality sensors, the complexity of the water quality response to changes in flow, across multiple timescales, has become increasingly evident. The observed dynamics during events, and range of hysteresis patterns displayed, shows that the sources of contaminates, mechanisms for mobilisation, and transport times are highly variable both spatially and temporally. Furthermore, seasonal and interannual controls on catchment functioning are seen to result in pronounced differences in the behaviour of parameters between sites, and between individual events at the same site.

This study shows how routine high-frequency data, collected with an operational focus for source protection and in raw water at drinking water treatment works, provide opportunities when trying to identify sources and pathways for contaminants. Despite challenges, these data support the development of a baseline understanding for water quality within a specific catchment or region, and provide insight into catchment specific event-driven dynamics. In catchments where routinely collected data is the only source of multiannual high-frequency water quality data, these data may be crucial in building understanding of long term (decadal) variability and trends; in particular, gaining understanding the changing interactions and effects due to extremes in seasonal patterns across different years. However, the key limitations in the use of these data include undefined uncertainties and missing data, monitoring design, and limited metadata. Therefore, building on initial analysis of routine data, efficient monitoring campaigns for targeted research can be designed to investigate any previously unexplored or unidentified processes and pathways.

This study is part of a wider programme of research on the identification of sources and pathways for contaminants of concern in catchments supplying drinking water in the south west of the UK, and how water quality dynamics are impacted by meteorological and catchment conditions, including atypical events. It supports work on increasing resilience in drinking water source areas and reducing treatment demands and costs, through improving understanding of how water quality in rivers and reservoirs is affected by landscape and farm-based catchment interventions.

How to cite: Ashe, J., Grand-Clement, E., and Brazier, R. E.: Understanding hysteresis in high-frequency water quality data in rivers: adding value to targeted research using routinely collected operational data , EGU General Assembly 2024, Vienna, Austria, 14–19 Apr 2024, EGU24-20400, https://doi.org/10.5194/egusphere-egu24-20400, 2024.

EGU24-2180 * | Orals | HS2.3.2 | Highlight

The Water Quality Protocol for Model Intercomparisons Under Climate Change Impacts  

Maryna Strokal, Ilaria Micella, Mirjam P. Bak, Arthur H. W. Beusen, Martina Flörke, Simon N. Gosling, Ann Van Griensven, Bruna Grizzetti, Nynke Hofstra, Edward R. Jones, Carolien Kroeze, Albert Nkwasa, Tineke Troost, Michelle T.H. van Vliet, Mengru Wang, and Rohini Kumar

Water quality is under threat in many places on Earth. This is associated with impacts of climate change (e.g., droughts, floods) that are integrated with socio-economic developments (e.g., agriculture, urbanization). Computer models have been developed and combine our knowledge and data to quantify water pollution levels, sources of pollution, and impacts of a wide range of pollutants such as salinity, nutrients, pathogens, plastics, and chemicals. These models are diverse in time and space and their modeling approaches. Such diversity offers a great opportunity to compare model results to identify robust pollution hotspots, their sources and explore trends under global change across pollutants, scales, scenarios, and sectors. We take this unique opportunity and develop a protocol for water quality models within the Inter-Sectoral Impact Model Intercomparison Project (ISIMIP) initiative supported by the Process-based models for Climate Impact Attribution Across Sectors (Proclias COST Action). This protocol serves as a guide for water quality modelers on how to harmonize model inputs and outputs and contributes to cross-scale and cross-sectoral assessments of water quality. Within our community, we identified challenges and opportunities for implementing the protocol. One of the challenges is the diversity of water quality models in their approaches, spatial and temporal level of detail, and water quality constituents that the models consider. The other challenge is inconsistencies in data for model inputs that make the data harmonization more difficult. However, opportunities exist for the large water quality modeling community to creatively identify approaches for model intercomparison purposes. This not only facilitates interactions among the modelers but also contributes to the development of novel model intercomparison approaches for the diverse water quality models. During several workshops throughout 2022-2023, the water quality modeling community (largely focused on large-scale) discussed and identified two promising directions for model intercomparisons. The first direction is qualitatively based. It aims largely at the integration of model outputs (e.g., via indicator-based approaches) from various water quality models to identify robust hotspots, sources and trends across pollutants and scenarios. This direction could fit the recently initiated “Fast Track” with the ISIMIP platform for the water quality sector. The second direction is quantitatively based. It aims largely at the intercomparison of model outputs. An example is the comparison of water pollution levels between two or more models for the same pollutant, scenario, scale, climate model, and sector. This requires at least two model simulations for one water quality constituent. This second direction requires more efforts in harmonizing model inputs across models and could serve as a good basis for the ongoing ISIMIP3 model intercomparison purposes across sectors. The first attempts were made to harmonize model inputs in scenario developments for global water quality assessments by the modeling community of the UN-World Water Quality Alliance. This can be the basis for further model harmonization. In EGU, we will discuss promising examples of the two directions and the ways forward. We will draw lessons on the process to develop such a protocol for model intercomparisons to understand climate change impacts on water quality better. 


How to cite: Strokal, M., Micella, I., P. Bak, M., H. W. Beusen, A., Flörke, M., N. Gosling, S., Van Griensven, A., Grizzetti, B., Hofstra, N., R. Jones, E., Kroeze, C., Nkwasa, A., Troost, T., T.H. van Vliet, M., Wang, M., and Kumar, R.: The Water Quality Protocol for Model Intercomparisons Under Climate Change Impacts , EGU General Assembly 2024, Vienna, Austria, 14–19 Apr 2024, EGU24-2180, https://doi.org/10.5194/egusphere-egu24-2180, 2024.

EGU24-2349 | ECS | Orals | HS2.3.2

Ten years of MARINA modeling: Multi-pollutant hotspots and their sources under global change 

Ilaria Micella, Mengru Wang, Mirjam P. Bak, Nynke Hofstra, Carolien Kroeze, Yanan Li, Shiyang Li, Vita Strokal, Aslihan Ural-Janssen, Qi Zhang, and Maryna Strokal

Water quality has been deteriorating in many lakes, rivers and coastal waters. Climate change is one of the drivers that can further deteriorate water quality (e.g., droughts contribute to higher concentrations of pollutants). Meanwhile, human activities add more loadings of pollutants to water, e.g., intensified agriculture, more cities with poor wastewater treatment facilities, and low access to improved sanitation, especially in less developed countries. Examples are nutrients from overfertilized land leading to eutrophication issues in fresh and coastal waters. Pathogens in surface waters from poor sanitation facilities can make people sick. Plastics in surface waters can result from mismanaged solid waste (e.g., macroplastics) and untreated wastewater (e.g., microplastics from laundry, dust, car tires and personal care products). In general, human activities serve as common sources of multiple pollutants. For example, animal manure is often used as fertilizer in agriculture and contains nutrients, pathogens, antibiotics, and heavy metals. Therefore, it is important to better understand common sources of multiple pollutants in water across scales to identify effective solutions. We develop computer models for different scales covering grids, (sub)basins, regions and the globe. Our models are for multiple pollutants, i.e. nutrients, plastics, antibiotics, pathogens (Cryptosporidium) and pesticides. Therefore, in this abstract, we aim to compare our model results for multiple pollutants to identify robust water pollution hotspots and their sources across scales. This will contribute to and support the Fast Track initiative within the Inter-Sectoral Impact Model Intercomparison Project (ISIMIP) platform. At the EGU conference, we will show examples of multi-pollutant modeling using our MARINA models (Models to Assess River Inputs of pollutaNts to seAs) family and GlowPa (Global Waterborne Pathogens) model developments. We will compare our model results for multiple pollutants by using different global climate models. Accordingly, we will discuss the impact of climate simulations on multi-pollutant hotspots. We will also show examples of identified robust multi-pollutant hotspots globally. We will zoom into regional analyses to better understand the impact of climate change on water pollution. Ultimately, we will highlight the need for such model intercomparisons for multiple pollutants and scales to better understand pollution hotspots and their sources under global change.

How to cite: Micella, I., Wang, M., Bak, M. P., Hofstra, N., Kroeze, C., Li, Y., Li, S., Strokal, V., Ural-Janssen, A., Zhang, Q., and Strokal, M.: Ten years of MARINA modeling: Multi-pollutant hotspots and their sources under global change, EGU General Assembly 2024, Vienna, Austria, 14–19 Apr 2024, EGU24-2349, https://doi.org/10.5194/egusphere-egu24-2349, 2024.

EGU24-3370 | ECS | Orals | HS2.3.2

Revealing neglected hotspots for China’s quality-induced water scarcity 

Shuman Liu, Junguo Liu, Dandan Zhao, and Wenfang Cao

A dependable assessment of quality-induced water scarcity (QualWS) is essential for tackling the issue and achieving sustainable development goals. The conventional emission-based grey water footprint (GWF) may over- or under- estimate QualWS, as it solely focuses on local pollutant emissions while disregarding other influential factors. To address this limitation, we propose the State-based GWF to reflect the quality status of local water resources accurately. The indicator is applied in annual and monthly QualWS assessments at the provincial scale in China. In 2021, 19 provinces were identified as QualWS hotspots, comprising seven moderate and 12 slight hotspots for at least one pollutant. Notably, the State-based assessment revealed eight previously overlooked hotspots undetected by conventional methods. Furthermore, Total phosphorus (TP) emerged as the most critical water pollutant, followed by total nitrogen (TN) and chemical oxygen demand (COD). Our assessment presents an innovative perspective for understanding QualWS and establishes a scientific basis for effective aquatic environment management.

How to cite: Liu, S., Liu, J., Zhao, D., and Cao, W.: Revealing neglected hotspots for China’s quality-induced water scarcity, EGU General Assembly 2024, Vienna, Austria, 14–19 Apr 2024, EGU24-3370, https://doi.org/10.5194/egusphere-egu24-3370, 2024.

EGU24-3427 * | ECS | Orals | HS2.3.2 | Highlight

Future global water scarcity including quality under climate and socioeconomic change 

Edward R. Jones, Marc F.P. Bierkens, and Michelle T.H. van Vliet

Inadequate availability of clean water presents systemic risks to human health, food production, energy generation and ecosystem functioning. While future alterations to water demands and availability are widely projected to exacerbate water scarcity, the impact of changing water quality is largely unknown. Leveraging a newly-developed global surface water quality model (DynQual1) which is coupled to a global hydrological model (PCR-GLOBWB2), we make the first projections of future global water scarcity including both water quantity and quality aspects.

We consider three combined RCP-SSP scenarios (SSP1-RCP2.6, SSP3-RCP7.0 and SSP5-RCP8.5), each of which simulated with bias-corrected CMIP6 climate input from five GCMs provided within ISIMIP3b, to encompass a range of possible future conditions and to capture uncertainty inherent in the climatological (GCM) projections. Simulated monthly sectoral water demands (domestic, industrial, livestock and irrigation), water availability (e.g. discharge) and water quality (total dissolved solids, biological oxygen demand and fecal coliform) for 2005-21002 are used as basis for quantifying clean water scarcity, which we express in terms of population exposure.

We find that 57% of the global population (~4 billion people) are currently exposed to clean water scarcity at least one month per year, increasing to 58 – 68% by the end of the century based on different plausible scenarios for climate change and socioeconomic development. Increases in exposure are largest in developing countries – particularly in Sub-Saharan Africa – driven by a combination of water quantity and quality issues. Strong reductions in both human water use and pollution are therefore necessary to minimise the impact of future water scarcity on humans and the environment.


References

1 Jones, E.R., M.F.P. Bierkens, N. Wanders, E.H. Sutanudjaja, L.P.H. van Beek,  M.T.H. van Vliet (2023), DynQual v1.0: A high-resolution global surface water quality model, Geosci. Model Dev., 16, 4481–4500, https://doi.org/10.5194/gmd-16-4481-2023

2 Jones, E.R., M.F.P. Bierkens, P.J.T.M. van Puijenbroek, L.P.H. van Beek, N. Wanders, E.H. Sutanudjaja, M.T.H. van Vliet (2023) Sub-Saharan Africa will increasingly become the dominant hotspot of surface water pollution, Nature Water, 1, 602–613, https://doi.org/10.1038/s44221-023-00105-5

How to cite: Jones, E. R., Bierkens, M. F. P., and van Vliet, M. T. H.: Future global water scarcity including quality under climate and socioeconomic change, EGU General Assembly 2024, Vienna, Austria, 14–19 Apr 2024, EGU24-3427, https://doi.org/10.5194/egusphere-egu24-3427, 2024.

EGU24-3783 | ECS | Orals | HS2.3.2

Generalizability evaluation of heterogeneous ensembles models for benthic macroinvertebrate index predictions 

Taeseung Park, Jihoon Shin, and YoonKyung Cha

Predictive models, which leverage the relationship between environmental variables and river health, serve as a valuable tool for predicting the river health at unmonitored sites. Such models should be generalizable to unseen data. However, predictions derived from machine learning (ML) models can exhibit large variability even with minor changes in the training dataset. The potentially unstable behaviors of a ML model decrease the model’s generalizability to unseen data, likely limiting its applicability as an assistant tool for decision making. Heterogeneous ensemble models are recognized to achieve greater generalizability compared to single models owing to their structural diversity. In this study, various machine learning (ML) models are employed to understand the relationship between environmental factors and benthic macroinvertebrate health. To obtain a model with better generalizability, the present study compares the generalizability of heterogeneous ensembles with those of homogeneous ensembles and single models by using the bias–variance decomposition. The models classified five grades (very good to very poor) of benthic macroinvertebrate index (BMI). The models incorporated diverse environmental factors, including water quality, hydrology, meteorological conditions, land cover, and stream properties, as input variables. The data were monitored at 2,915 sites in the four major river watersheds in South Korea during the 2016–2021 period. The results indicated better generalizability of the heterogeneous and homogeneous ensembles than single models. Moreover, heterogeneous ensembles tended to show higher generalizability than homogeneous ensembles, although the differences were marginal. Weighted soft voting was the most generalizable of the heterogeneous ensembles, with loss of 0.49. Weighted soft voting also delivered acceptable classification performance on the test set, with accuracy of 0.52. The identified contributions of the environmental factors to BMI predictions and the directions of their effects agreed with established knowledge, confirming the reliability of the predictions. These results demonstrate the usefulness of the heterogeneous ensemble models for increasing the generalizability of ML model predictions. Furthermore, despite the slightly lower generalizability than voting-based ensembles, homogeneous ensembles demonstrated comparable levels of generalizability to heterogeneous ensembles.

How to cite: Park, T., Shin, J., and Cha, Y.: Generalizability evaluation of heterogeneous ensembles models for benthic macroinvertebrate index predictions, EGU General Assembly 2024, Vienna, Austria, 14–19 Apr 2024, EGU24-3783, https://doi.org/10.5194/egusphere-egu24-3783, 2024.

EGU24-6414 | ECS | Orals | HS2.3.2

Testing Bayesian Network transferability to diverse agricultural catchments with high phosphorus saturation 

Camilla Negri, Nicholas Schurch, Andrew J. Wade, Per-Erik Mellander, and Miriam Glendell

A Bayesian Network (BN) aimed at calculating stream phosphorus (P) concentrations in agricultural catchments was previously parametrized with high-frequency data in a pilot study. To test model transferability, the BN was applied to three further agriculture-dominated catchments in Ireland with varying land use, hydrology, and P pressures, all monitored through the Agricultural Catchments Programme (ACP) of the Irish Agriculture and Food Development Authority. While the pilot catchment Ballycanew was dominated by poorly drained grassland, the further three catchments were dominated by well-drained grassland (Timoleague), well-drained arable (Castledockrell), and moderately-drained arable (Dunleer), respectively. In all four catchments, the main P source came from agriculture and (minimal) domestic inputs, whilst the well-drained arable catchment also contained Sewage Treatment Works (STWs).

To best fit the characteristics of the catchments, a total of six different BN structures were developed. The models were parametrized using a range of methods, including bootstrapping of high-frequency data to obtain fitted distributions, distribution fitting of literature data, and expert elicitation to quantify in-stream P uptake processes. Model transferability and fit were evaluated using a suit of approaches, including 1) calculating percentage bias between simulated and observed distributions fitted to the observed stream Total Reactive P (TRP) concentration, 2) comparing modelled concentration quantiles and means to the observed, and 3) visually comparing the posterior distributions by plotting them against daily observations.

The original BN structure developed in the pilot study was found to best fit the poorly and moderately drained catchments, irrespective of the dominant land use (78% ≤ PBIAS ≤ 81%), not as well in the groundwater-dominated catchments. This confirms that the initial BN represents the catchment-specific process understanding whereby transport via quick-flow dominates P processes in these catchments. In contrast, the well-drained catchments required more complex BN structures to perform well. The additional processes included groundwater Total Dissolved P (TDP) loads, derived from observed concentrations from piezometer data, STWs loads, and in-stream P uptake calculations. These more complex model implementations yielded good results in Castledockrell and Timoleague (-5% ≤ PBIAS ≤ 14%). In all four catchments, the additional in-stream P removal process improved the model performance, however, it remains a second-order mechanism.

Overall, the unique monitoring programme allowed pilot-testing BN transferability, a research avenue that needs to be further explored across catchment typologies and scales.

How to cite: Negri, C., Schurch, N., Wade, A. J., Mellander, P.-E., and Glendell, M.: Testing Bayesian Network transferability to diverse agricultural catchments with high phosphorus saturation, EGU General Assembly 2024, Vienna, Austria, 14–19 Apr 2024, EGU24-6414, https://doi.org/10.5194/egusphere-egu24-6414, 2024.

EGU24-7691 | ECS | Orals | HS2.3.2

Extreme water temperatures in mountain rivers – changes and driving processes 

Amber van Hamel and Manuela Brunner

Water temperature is one of the most important indicators of water quality as it regulates physical, chemical and biological processes in rivers. When water temperatures reach extreme values, this can have potentially severe consequences for the survival of aquatic ecosystems. Extreme water temperatures can be caused by extreme weather phenomena such as heat waves and prolonged droughts. In mountain regions, the complexity of water temperature dynamics is greater than in lowland regions due to changes in the hydrological regime caused by glacier retreat and changes in the contribution of snowmelt to streams. Despite the potential impacts of water temperature extremes, knowledge of the occurrence and driving processes of water temperature extremes in mountain rivers remains limited.

Here, we aim to improve our understanding of the spatial and temporal variability and long-term changes in the occurrence of extremes. In addition we aim to identify the main processes influencing the occurrence of water temperature extremes in mountain rivers in Europe.  First, we compare 30 years of water temperature data in 18 catchments in the Alps to gain insight into the temporal variability of water temperature extremes. We examine the seasonality of these extremes and use trend tests to assess long-term trends. Second, we compare 177 catchments across four different mountain regions in Europe to understand the frequency, severity and variability of water temperature extremes at a regional scale. Finally, we use random forest models to investigate the importance of different processes contributing to water temperature extremes and how the main driving processes vary in both time and space.

The results of the trend analysis in the Alps show that extreme water temperatures, i.e. water temperatures exceeding a locally varying threshold, have increased faster than mean water temperatures during the summer period of 1991-2021. The most severe extreme events are mainly found in low elevation catchments. The number of extreme events has increased over time at all elevations, with the strongest increase for high elevation catchments. Furthermore, the analysis of the driving processes shows that air temperature is the main driver of non-extreme water temperature. However, to predict water temperature extremes, other hydroclimatic variables such as soil moisture, snowmelt, and baseflow should also be considered. This suggests that current water temperature models, which use only air temperature and discharge as input variables, may not be suitable for predicting water temperature extremes at high elevations. These insights into the behaviour of water temperature extremes are valuable for predicting future changes in extremes in mountain rivers. 

How to cite: van Hamel, A. and Brunner, M.: Extreme water temperatures in mountain rivers – changes and driving processes, EGU General Assembly 2024, Vienna, Austria, 14–19 Apr 2024, EGU24-7691, https://doi.org/10.5194/egusphere-egu24-7691, 2024.

The presence of errors in water quality and hydrologic variables can significantly impair the calibration of water quality models. To enhance the estimation of model parameters, it is important to accurately identify data errors during the calibration process. However, this task is challenging due to the complex interactions between model parameter uncertainty and data uncertainty. Existing methods for incorporating data uncertainty in model calibration have limitations, such as high-dimensional computation or the inability to handle stochastic errors.

To address these challenges, a novel method called Bayesian Error Analysis with Reordering (BEAR) has been developed. Given that the data uncertainty arises from the data itself and is independent of the model calibration or simulation, the cumulative distribution function (CDF) of the data error can be estimated ahead and regarded as the prior information of Bayesian inference. Then the values of data error series only depend on their ranks in the CDF. BEAR method transforms the values of data error series into their ranks in the CDF. This transformation enables the effective identification of input and/or output data errors in water quality calibration.

The innovation of the BEAR method can be attributed to several key aspects:

1) Modification of the secant method to handle the non-linear transformation from input to output, ensuring the correspondence between the rank of input data error and the residual error of the model.

2) Decomposition of model simulations to calculate the delay between each input and its corresponding output.

3) Utilization of the Autoregressive model to account for the correlation of residual errors.

4) Selection of an appropriate updating logic to minimize the compensation effects among multiple sources of data uncertainty.

Overall, the BEAR method demonstrates flexibility and adaptability to various environmental modelling scenarios, making it a valuable tool for improving model specification under conditions of data uncertainty.

How to cite: Wu, X., Marshall, L., Sharma, A., and Duan, Q.: Identifying input and output data errors in the calibration of a water quality model using Bayesian error analysis with reordering (BEAR) method, EGU General Assembly 2024, Vienna, Austria, 14–19 Apr 2024, EGU24-9238, https://doi.org/10.5194/egusphere-egu24-9238, 2024.

EGU24-9472 | ECS | Orals | HS2.3.2

Advancing water quality assessment under uncertainties: Multi-risk and multi-scenario analyses in the face of future climate change 

Diep Ngoc Nguyen, Elisa Furlan, Silvia Torresan, Jacopo Furlanetto, Donata Canu, Leslie Aveytua Alcazar, Cosimo Solidoro, and Andrea Critto

Water quality is a critical element of ecosystem health and human well-being. However, it is increasingly challenged by a variety of human induced impacts related to land-use, socio-economic development, and climate change that alter the physical, chemical, and biological components. It is challenging to obtain a comprehensive understanding and effective management of water quality, especially under large uncertainties arising from future climate change and socio-economic developments. An integrated approach is essential for developing adaptive strategies that consider future uncertainties, ensuring the preservation of water quality and the sustainability of aquatic ecosystems in the face of evolving environmental conditions.

This research investigates the intricate dynamics of water quality in transitional environments with a case study in the Venice Lagoon, particularly focusing on the uncertainties arising from future climate change. Utilizing a multi-scenario analysis approach, we explore a range of potential outcomes to understand the complex interactions shaping water quality in these critical ecosystems. The scenarios are designed to simulate future conditions, considering two different climate change scenarios (RCP 4.5 and RCP 8.5), river load (reduced/unvaried river runoff), and the operation of the marine hydraulic interventions for flood prevention (the MOSE system) under medium- and long-term futures. Using data from SHYFEM-BFM - a 3D coupled hydrodynamic and ecological model, key physico-chemical parameters are integrated into a multi-parameter water quality index – the CCMEWQI. This index considers the Scope (number of failed parameters), Frequency, and Amplitude of non-compliant tests to water quality standards for ecological status and aquatic life. By exploring diverse trajectories, we aim to anticipate potential shifts in water quality spatio-temporal dynamics. The multi-scenario analysis unfolds potential future states of water quality in the Venice Lagoon, highlighting critical points of vulnerability and resilience.The outcomes contribute to a more comprehensive understanding of the complexities inherent in transitional water systems, aiding policymakers and water resource managers in making informed decisions to ensure the resilience and sustainability of water quality in the face of an uncertain future.

Additionally, future developments extend the scope of this study to encompass a multi-risk assessment on river networks in the Veneto Regione to understand the multi-risk dynamic for regional water quality management. The multi-risk analysis in the freshwater system incorporates a range of stressors to river water quality, including single/compound extreme climate events and anthropogenic activities. We aim to unravel the multi-risk dynamics through the application of a novel approach employing machine learning techniques that encompass multiple hazards, exposures, and vulnerabilities. Furthermore, future scenarios of climate, land-use, and population changes are integrated into the multi-risk model together with nature-based solutions to create multi-risk scenarios for water quality, providing a holistic view of the potential risks and vulnerabilities in different environmental contexts.

How to cite: Ngoc Nguyen, D., Furlan, E., Torresan, S., Furlanetto, J., Canu, D., Aveytua Alcazar, L., Solidoro, C., and Critto, A.: Advancing water quality assessment under uncertainties: Multi-risk and multi-scenario analyses in the face of future climate change, EGU General Assembly 2024, Vienna, Austria, 14–19 Apr 2024, EGU24-9472, https://doi.org/10.5194/egusphere-egu24-9472, 2024.

For communities to adapt, effective water management and governance strategies are necessary due to climate change's pressing challenges. Specifically, the proposed study examines the role of traditional water management systems in supporting land adaptation to harsh climate conditions on Pantelleria, a volcanic island in the Sicilian Channel.

On the island of Pantelleria, there is a rich cultural heritage of water management, exemplifying a complex interaction between desertification, climate change, biodiversity, ecosystem services and land adaptation. As a result of Pantelleria's traditional water management, the landscape mosaic has been able to adapt and remain resilient to climate change impacts. Considering its successful application over time, the ingenious rainwater accumulation, storage, and distribution system demonstrates that this heritage serves not only as a legacy of the past, but as a critical organizing principle for the present. From a social-ecological perspective, preserving cultural heritage shifts the paradigm from innovating traditional knowledge toward reclaiming traditional water management methods that already contribute to the sustainability of local and environmental communities and incorporating them into a perspective of land adaptation to climate change.

This study combines scientific research on desertification and land degradation in Southern Italy with interviews with local stakeholders in an effort to emphasize the importance of cultural heritage knowledge along with bottom-up actions by citizens, and advocates for the systemic vision of rural landscapes by mapping the distribution and abundance of traditional water systems in order to assess their functions in preserving and enhancing ecosystem services in an environment of constant land changing.

Pantelleria serves as a model to demonstrate how similar regions experiencing water-related issues may benefit from its solutions and this study examines the barriers to integrating traditional and modern water management systems based on political, cultural, and institutional factors in order to improve water management and governance in similar harsh environments.

How to cite: De Agostini, C.: Assessing the role of cultural heritage in water management and land adaptation facing climate change: Pantelleria's case study., EGU General Assembly 2024, Vienna, Austria, 14–19 Apr 2024, EGU24-9545, https://doi.org/10.5194/egusphere-egu24-9545, 2024.

EGU24-9619 | ECS | Posters on site | HS2.3.2

A comprehensive analysis of land use and climate change impacts on water quality in Italian river basins 

Olinda Jack Mariano Rufo, Samuele Casagrande, Vuong Pham, and Andrea Critto

The degradation of water quality, pivotal for sustainable development, is exacerbated by the interconnected impacts of climate change (CC) and land-use/land-cover change (LULCC). Rapid global development has amplified these effects, disrupting key processes that regulate river flows and runoff. LULCC, particularly in agriculture, plays a central role in nutrient cycle and runoff to the water bodies, thus affecting the water quality and ecosystem resilience. Concurrently, climate change intensifies algal blooms, reduces dissolved oxygen, and alters aquatic ecosystems. Shifts in precipitation and rising temperatures amplify pollutant transport and compromise water quality. Moreover, the complex interactions among LULCC and CC have significant impacts on nutrients, pollution concentrations, and sedimentation rates in freshwater ecosystems. This research focuses on the analysis of the dynamics and impacts of LULCC and climate-induced changes on the state of water quality at the river basin scale in Italy, supporting the achievement of good chemical and ecological status of the Water Framework Directive. First, this study aims to analyse LULCC pattern changes across various spatial scales with the use of geoinformation system (GIS) techniques to identify sensitivity and changes at the pixel level within different land use types. This analysis allows the identification of linkages and dependencies between LULCC indicators and their relationships with water quality parameters in each river basin of Italy. Second, to address the compound effects of climate change, this study examines historical patterns of climate change indicators and their correlation with water quality over time. It also investigates the temporal and spatial occurrence of extreme events, which are linked to changes in nutrient and pollutant levels. The final phase of the methodology involves the development of a machine-learning model aiming at understanding and predicting the complex interplay of multiple risk factors such as the combined effects of land-use change, climate variability, and other anthropogenic influences on water quality. By using machine learning techniques, the study will be able to identify intricate patterns and non-linear relationships between multiple risk factors and their collective influence on water quality dynamics. The results will provide a comprehensive understanding required for adaptive measures and decision-making support in Italy.

How to cite: Rufo, O. J. M., Casagrande, S., Pham, V., and Critto, A.: A comprehensive analysis of land use and climate change impacts on water quality in Italian river basins, EGU General Assembly 2024, Vienna, Austria, 14–19 Apr 2024, EGU24-9619, https://doi.org/10.5194/egusphere-egu24-9619, 2024.

EGU24-10198 | ECS | Posters on site | HS2.3.2

Drought Affects Export Patterns Across Different Solutes 

Carolin Winter, Julia L. A. Knapp, and James W. Kirchner

The severe 2018 drought affected water quantity and quality across Europe. While the consequences for water quantity have received substantial attention, the effects on water quality are intricate and require careful analysis. Nevertheless, understanding these impacts is crucial because the scarcity of water resources elevates the importance of their quality.

Here, we conducted a comprehensive analysis of a high-frequency dataset (hourly) encompassing stream water chemistry across various solutes, including nutrients, heavy metals, and other ions, in the pre-alpine Erlenbach catchment (0.7 km², Switzerland). We used concentration-discharge (C-Q) relationships to detect the drought impacts on solute export patterns at the catchment outlet. The month of July 2018, characterized by the highest annual average temperature, experienced the most pronounced drought conditions. During this period, all solute concentrations exhibited a notable divergence in export patterns compared to the same month in other years with normal conditions (July 2017, 2019, 2020). In August, when conditions returned to normal, some solute concentrations also reverted to typical patterns, while others continued to deviate. These observations suggest a drought-induced alteration in solute mobilization, hydrologic transport, and retention, accompanied by potential solute-source-specific memory effects.

The extensive and unique dataset documenting stream water chemistry in the Erlenbach catchment provides valuable insights into the processes shaping water quality during drought. If this knowledge can be extrapolated to other catchments, it may offer a foundation for safeguarding our precious freshwater resources in the face of an increasing risk for the occurrence of severe and prolonged droughts.

How to cite: Winter, C., Knapp, J. L. A., and Kirchner, J. W.: Drought Affects Export Patterns Across Different Solutes, EGU General Assembly 2024, Vienna, Austria, 14–19 Apr 2024, EGU24-10198, https://doi.org/10.5194/egusphere-egu24-10198, 2024.

EGU24-10292 | ECS | Posters on site | HS2.3.2

Coupling water quality and quantity models to integrate climate risk to reservoir water quality into water planning 

Mustafa Onur Onen, Charles Rougé, Isabel Douterelo Soler, and Geoff Darch

Ensuring public access to clean water faces unprecedented challenges. The rising frequency and intensity of hot-dry conditions, coupled with population growth, strain water stocks. Concurrently, the presence of excess phosphorus and nitrogen in freshwater lakes and reservoirs leads to harmful algal blooms (HAB) precisely when hot-dry conditions occur, impacting aquatic life and complicating water treatment for human consumption. Due to uncertainties in future climate, water demands, nutrient discharge, and ecological factors, determination of HAB risk is a complex task. This hard-to-quantify risk impacts water planning since it is unknown whether reservoir water will be usable in the hot, dry summers when it is most needed.

Water planning increasingly involves fast water resource simulators. These tools evaluate the performance of adaptive infrastructure investments within complex water resource systems under changes in supply-demand conditions. Relying on water balance calculations, these fast models prioritise water quantity targets and typically neglect water quality. This overlooks water quality impacts on resource availability. Conversely, advancements in aquatic ecosystem modelling have produced complex water quality simulators, incorporating numerous space and time variant equations for hydrodynamics, biogeochemical and ecological processes, and particularly addressing HABs. These processes are much more complex than water balance dynamics, leading to models with much slower run-times than water resource simulators. In addition, to account for water quality in the design of operating strategies, we need two-way coupling of these models to communicate the simulated water quality and quantity states with each other frequently throughout simulations.

To achieve this two-way coupling, we integrated a high-performing lake model, the General Lake Model (GLM), into a recently developed water resource simulator called Pywr. Thanks to its 1D resolution of physical processes, GLM operates at speeds comparable to Pywr, and this work is, to our knowledge, the first to apply it to water planning. Enhanced communication between the models is facilitated by Pywr's extended parameters, allowing the execution of customised tasks at each timestep. Furthermore, Pywr's advanced scenario handling capability renders the coupled framework ideal for risk assessment. Coupled models are pivotal for designing operating strategies aimed at minimising HAB risk under diverse future conditions (climate, water demands and nutrient transport). Successful implementation will shed light on the feasibility of constructing new reservoirs, evaluating their susceptibility to algal blooms, and informing billion-pound investment decisions.

How to cite: Onen, M. O., Rougé, C., Douterelo Soler, I., and Darch, G.: Coupling water quality and quantity models to integrate climate risk to reservoir water quality into water planning, EGU General Assembly 2024, Vienna, Austria, 14–19 Apr 2024, EGU24-10292, https://doi.org/10.5194/egusphere-egu24-10292, 2024.

EGU24-11771 | Orals | HS2.3.2

Modelling multi-sectoral water demand and water availability to identify future water scarcity regions in Germany 

Tim aus der Beek, Florian Zaun, Thilo Streck, Tobias Weber, Sebastian Sturm, Tanja Vollmer, Friedrich Boeing, and Andreas Marx

Climate change and other dynamic changes, such as demographic change, pose challenges for public water supply in Germany. This study contributes to the identification of hot spot regions that could experience increased water shortages in the future through nationwide, regionalized forecasts of water demand in domestic, industry and agriculture sectors and their balancing with projections of groundwater recharge. Multi-sectoral water demand forecasts for the periods 2021-2050, 2036-2065 and 2069-2098 were prepared using a top-down approach at NUTS-3 level (cities and districts).

The total water demand in the domestic sector in Germany averages approx. 3.7 billion m³/a in the reference period 1998-2019. In the lower scenario, it decreases to approx. 2.2 billion m³/a by the end of the century. In the upper scenario, total water demand in the domestic sector in Germany increases to around 4.1 billion m³/a. Industrial water demand could fall to around half (10.9 billion m³/a) as early as 2030 compared to the reference period (approx. 21.6 billion m³/a) due to a sharp decline in cooling water demand. From the middle of the 21st century onwards, it is expected to stagnate at around 6.1 billion m³/a. Depending on the scenario, the irrigated agricultural area in Germany will almost double (RCP 2.6) or almost triple (RCP 8.5) by the end of the century, resulting in a near tripling (RCP 8.5) of irrigation volumes. Overall, the total water demand in Germany decreases significantly in both scenarios. In the lower scenario, water demand falls from around 26 billion m³/a to around 9 billion m³/a by the end of the century. In the upper scenario, it is reduced to around 12 billion m³/a by the end of the century. These enormous decreases in total water demand are due to reductions in water demand in the energy sector, which overlay increases in domestic and agricultural water demands.

mHM-simulations of groundwater recharge based on climate projections show constant or increasing groundwater recharge rates in large parts of Germany in the ensemble median for the 2021-2050, 2036-2065 and 2069-2098 time slices, assuming both RCP 2.6 (21 RCMs) and RCP 8.5 (49 RCMs). However, declining groundwater recharge rates may also occur in certain regions, particularly in south-western Germany. In the 25th percentile of the model ensemble, falling groundwater recharge rates occur under RCP 2.6 in southern and western Germany. Towards the end of the century, groundwater recharge rates increase in eastern Germany. Under RCP 8.5, the 25th percentile of the model ensemble shows mostly constant or increasing groundwater recharge rates. However, south-western Germany is characterized by a significant decline in groundwater recharge.

The risk index water balance RIWB was defined as an indicator to evaluate the regional water supply in relation to the balance between water demand and groundwater recharge. The RIWB shows that the ratio of water demand to groundwater recharge can be expected to remain the same or improve in the most regions, while, depending on the scenario, 4% or 11% of districts/cities, particularly in northern Germany, must prepare for a deterioration in this ratio.

How to cite: aus der Beek, T., Zaun, F., Streck, T., Weber, T., Sturm, S., Vollmer, T., Boeing, F., and Marx, A.: Modelling multi-sectoral water demand and water availability to identify future water scarcity regions in Germany, EGU General Assembly 2024, Vienna, Austria, 14–19 Apr 2024, EGU24-11771, https://doi.org/10.5194/egusphere-egu24-11771, 2024.

Saltwater intrusion in river estuaries poses significant challenges for water quality management and ecosystem sustainability. In this study, we investigate the characteristics of saltwater intrusion in the Seomjin River by constructing an Environmental Fluid Dynamics Code (EFDC) model for the Seomjin River and Gwangyang Bay, incorporating environmental changes and basic data.  After validating the model through calibration and verification processes, we conduct numerical experiments to explore 28 scenarios for the Songjeong flow rate and Daap intake rate. We begin by constructing and validating the numerical model using historical data of river discharge, tidal levels, and salinity measurements. The main income of this area is collecting a corbicula from the river. However, since the 1970s, many projects such as dam construction, river aggregate collection, and Gwangyang Bay reclamation have been carried out, and now the fishery is suffering salt damage.


To understand the long-term trends and seasonal variability of salt intrusion, we analyze historical datasets spanning multiple years. This analysis helps identify potential shifts in salt intrusion patterns over time, which could be attributed to natural variations or anthropogenic influences. We analyze salinity concentrations at four key points (Dugog, Sinbi, Mogdo, and Hwamog) during the entire period, spring, and neap periods. The spatial plane and stratified distribution of salinity are examined, and a salinity and flux model is developed. The longitudinal distribution of saltwater intrusion from the estuary is analyzed, and a salinity and saltwater intrusion distance model is constructed. Our findings reveal that the changes in salinity concentration range from 4.7 psu for Dugog to 28.2 psu for Hwamog at different Songjeong flow rates. In the spring period, salinity  changes increase, but average concentrations decrease, while in the neap period, salinity changes decrease, but average concentrations increase. Salinity stratification is observed in Sinbi, Mogdo, and Hwamog during the neap period due to significantly increased salt concentrations. Additionally, the effect of the Daap intake rate on salt concentration is found to be small, with a salinity difference of less than 1 psu. Spatially, the maximum salinity concentration decreases as the Songjeong flow rate increases, and the influence of the Songjeong flow rate is more pronounced in the spring period compared to the neap period. Furthermore, we construct quantitative prediction models for salinity reduction scenarios at different points, determining the instream flow required to achieve target salinity concentrations. The study indicates that Hwamog requires a Songjeong flow rate of 100 cms or more to achieve 20 psu during the neap period.
In conclusion, this research sheds light on the complex interactions governing salt intrusion in the Seomjin River, facilitating informed decision-making for water resource management and environmental conservation. The integration of the EFDC model with deep learning techniques offers a comprehensive understanding of saltwater intrusion dynamics and contributes to informed decision-making for water quality enhancement in
estuarine ecosystems

How to cite: Lee, G., Kim, Y., Jung, C., Park, J., and Kim, E.: Investigating Salt Intrusion Characteristics Considering Changesin River Beds, Water Intake from Rivers, and Dam Supply in theSeomjin River using a Numerical Model, EGU General Assembly 2024, Vienna, Austria, 14–19 Apr 2024, EGU24-13488, https://doi.org/10.5194/egusphere-egu24-13488, 2024.

EGU24-13664 | Orals | HS2.3.2

Dissolved phosphorus concentrations are increasing in streams across the Great Lakes Basin 

Nandita Basu, Nitin Singh, and Kim Van Meter

Excess phosphorus from agricultural intensification has contributed to the eutrophication of rivers and lakes worldwide, including the transboundary Laurentian Great Lakes Basin. Algal blooms have surged in the past decade, threatening ecosystems, drinking water supplies and lake-dependent tourism economies in both large lakes (for example, Lake Erie) and smaller water bodies. Whereas previous research has focused mainly on phosphorus loads to Lake Erie, a comprehensive analysis of phosphorus species across the basin is lacking. Here we analyse changes in soluble reactive phosphorus and total phosphorus concentrations in over 370 watersheds across the Great Lakes Basin from 2003 to 2019. We find widespread increases in soluble phosphorus concentrations (83% of watersheds, with 46% showing significant increase), while total phosphorus concentrations are decreasing or non-significant. Utilizing random forest models, we identify small, forested watersheds at higher latitudes as the areas experiencing the largest relative increases in soluble phosphorus concentrations. Furthermore, we find winter temperatures to be a key driver of winter concentration trends. We propose that the increasing soluble phosphorus concentrations across the basin, along with warming temperatures, might be contributing to the increasing frequency and intensity of algal blooms, emphasizing the need for management strategies to prevent further water-quality degradation.

How to cite: Basu, N., Singh, N., and Van Meter, K.: Dissolved phosphorus concentrations are increasing in streams across the Great Lakes Basin, EGU General Assembly 2024, Vienna, Austria, 14–19 Apr 2024, EGU24-13664, https://doi.org/10.5194/egusphere-egu24-13664, 2024.

EGU24-13703 | Posters virtual | HS2.3.2

Australia’s water quality trends over two decades 

Danlu Guo, Qian Zhang, Camille Minaudo, Shuci Liu, Remi Dupas, Kefeng Zhang, Ulrike Bende-Michl, Clement Duvert, and Anna Lintern

Water quality of rivers and streams can vary over time due to changing hydro-climatic conditions in the interaction with catchment physio-geographic conditions and local human activities. This study is the first exploration of long-term river water quality trends across Australian continent, consolidating 375 catchments with contrasting climate, hydrology, land use and land cover. We focused on five key water quality parameters and estimated their flow-normalized trends over 2000-2019 using the Weighted Regressions on Time, Discharge, and Season method (WRTDS). For each parameter, about half of nation’s catchments have significant trends, which are generally within ±10% per annum relative to the first year (2000). Except for TSS, there is no systematic non-linearity nor abrupt changes over time, while for TSS many catchments had a systematic shift from increasing to decreasing trends since around 2010. A random forest model was developed and found that catchment land characteristics, along with baseline water quality, can explain over a third of the spatial variation of the trends of EC, TN, TP and TSS (32-51% explained), but had limited explanatory power for DO (22% explained). These findings will provide critical information on the waterway health, thereby facilitating natural resources management for Australia.

How to cite: Guo, D., Zhang, Q., Minaudo, C., Liu, S., Dupas, R., Zhang, K., Bende-Michl, U., Duvert, C., and Lintern, A.: Australia’s water quality trends over two decades, EGU General Assembly 2024, Vienna, Austria, 14–19 Apr 2024, EGU24-13703, https://doi.org/10.5194/egusphere-egu24-13703, 2024.

EGU24-14412 | Orals | HS2.3.2

Effects of EU policy and climate change on future delivery of nutrients to European seas 

Bruna Grizzetti, Angel Udias, Olga Vigiak, Alberto Pistocchi, Alberto Aloe, Berny Bisselink, Faycal Bouraoui, Alexander De Meij, Jordan Hristov, Diego Macias Moy, Enrico Pisoni, Ioannis Trichakis, Franz Weiss, Matteo Zampieri, and Michela Zanni

In Europe, intensive agriculture and high population density pose pressures on water resources quality and quantity. Water abstractions, intensive agriculture and wastewaters from urban areas and industries modify natural water availability and quality. The excess of nutrients (nitrogen and phosphorus) in rivers, lakes, groundwater and coastal waters impair water quality for human and ecosystem, and damage the goods and services provided by aquatic ecosystems. Environmental policy have been in place in the EU since the 1990s to reduce nutrient pollution and ensure sustainable water resource management and ecological quality, aiming at restoring and protecting all water bodies (2000/60/EC Water Framework Directive, WFD). Moreover, in recent years the ambitious goal to halve nutrient losses to the environment have been set by the EU Green Deal, Zero Pollution and Biodiversity Strategies. However, achieving this goal might require changes in the current land and water resource management.

Climate change, with shifts in amount, seasonal distribution, and intensity of rainfall, soil moisture regime, and runoff events, affects delivery of nutrients to the fresh and marine waters. In this study, by mean of scenario modelling, we explore the possible combined effects of EU policy measures and climate change on nutrients delivery to European seas at the time horizon of 2050 compared to current condition in Europe. We discuss on the one side the expected impacts of main EU policies (such as the Common Agricultural Policy (CAP), the updated legislation addressing greenhouse gases emissions (Fit For 55 package), and the revision of the Urban Waste Water Treatment Directive UWWTD), and on the other side we look at the concurrent role of climate change (scenario RCP 4.5) on nutrient load delivered to European seas, considering regional variability.

This study helps understanding the future trajectories of nutrient pollution in European fresh and coastal waters, highlighting the respective contribution of policy measures and climate change at the regional scale.

How to cite: Grizzetti, B., Udias, A., Vigiak, O., Pistocchi, A., Aloe, A., Bisselink, B., Bouraoui, F., De Meij, A., Hristov, J., Macias Moy, D., Pisoni, E., Trichakis, I., Weiss, F., Zampieri, M., and Zanni, M.: Effects of EU policy and climate change on future delivery of nutrients to European seas, EGU General Assembly 2024, Vienna, Austria, 14–19 Apr 2024, EGU24-14412, https://doi.org/10.5194/egusphere-egu24-14412, 2024.

EGU24-17151 | ECS | Orals | HS2.3.2

Unraveling the link between precipitation and land use changes to water quality in Lake Victoria using remote sensing 

Maria Theresa Nakkazi, Albert Nkwasa, Analy Baltodano Martinez, and Ann van Griensven

Due to the continued increase in land use changes and changing climatic patterns in the Lake Victoria basin, understanding the impacts of these changes on the water quality of Lake Victoria is imperative for safeguarding the integrity of the freshwater ecosystem. Thus, we analyzed spatial and temporal patterns of land cover, precipitation, and water quality changes in the Lake Victoria basin from 2000 to 2022 using processed remote sensing (RS) data. Focusing on chlorophyll-a (Chl-a) and turbidity (TUR) in Lake Victoria, we used statistical metrics (correlation coefficient, trend analysis, change budget, and intensity analysis) to understand the relationship between land use and precipitation changes in the basin with changes in Chl-a and TUR at two major pollution hotspots on the lake i.e. Winam Gulf and Inner Murchison Bay (IMB).

Results show that the Chl-a and TUR concentrations in the Winam gulf increase with increases in precipitation. Through increases in precipitation, the erosion risks are increased and transport of nutrients from land to the lake system, promoting algal growth and turbidity. In the IMB, Chl-a and TUR concentrations decrease with increase in precipitation, possibly due to dilution, but peak during moderate rainfall. Interestingly, LULC changes showed no substantial correlation with water quality changes at selected hotspot areas even though LULC change analysis showed a notable 300% increase in built-up areas across the Lake Victoria basin. These findings underscore the dominant influence of precipitation changes over LULC changes on the water quality of Lake Victoria for the selected hotspot areas.

How to cite: Nakkazi, M. T., Nkwasa, A., Martinez, A. B., and Griensven, A. V.: Unraveling the link between precipitation and land use changes to water quality in Lake Victoria using remote sensing, EGU General Assembly 2024, Vienna, Austria, 14–19 Apr 2024, EGU24-17151, https://doi.org/10.5194/egusphere-egu24-17151, 2024.

By approving the Sustainable Development Goals (SDGs) more than 190 countries have made a commitment to “ensure availability ... of water ... to all”. Yet the implications of this high-profile pledge are unclear because of the lack of an internationally accepted definition of “water availability”. Moreover, definitions, where they exist, are usually incomplete because they neglect the important factor of water quality. This is a significant omission because degraded water quality impedes the usage of water resources for drinking water, hygiene, irrigation, habitat for plant and animal communities, and other important uses. It can be argued that contaminated water withdrawals can be treated to make more water available, but this is not an affordable option for much of the Global South except for drinking water. Hence, degraded water quality genuinely reduces water availability.

Until recently water quality could not be included in large-scale (regional to global) assessments of water availability because of the lack of appropriate data and tools. The situation is changing, however, with the development of a new class of large-scale water quality models. These models have broad geographic coverage and a fine enough grid to simulate water quality gradients along river networks.

As an example, as part of a UNEP study, the WorldQual model estimated that pathogen pollution hindered the usage of approximately one-third of the total river network in Latin America, Africa, and Asia for safe bathing and hygienic purposes. Organic pollution was estimated to impede the usage of about one-seventh of this river network for fish production, and salinity pollution about one-tenth of the network for irrigation water supply. These and other preliminary results from the modelling community suggest that water quality should not be overlooked as a potentially important factor in large-scale assessments of water availability.

To improve the performance of large-scale water quality models, and make them more reliable for including in water availability assessments, researchers will have to contend with some difficult challenges including (but not limited to):

The problem of representativeness – A wide range of water quality parameters are relevant to uses of surface water and groundwater, and the challenge is to find a manageable set of representative parameters for analysis that are both measurable and calculable on the large-scale.

The problem of validation – There is a paucity of data available for validating large-scale water quality models, and in some parts of the world the coverage and frequency of data collection is declining rather than increasing. 

The problem of characterising anthropogenic fluxes of contaminants – The data necessary for determining fluxes of contaminants into the water environment (e.g. data on wastewater discharges) are either not accessible or very incomplete in many countries. 

Finally, a particularly high priority for going forward is to establish collaborations between researchers assessing the quantity of water available (for example, under climate change) and those assessing the quality of water. These collaborations are a prerequisite for developing a more comprehensive and realistic concept of water availability.

How to cite: Alcamo, J.: Invited Keynote -- Expanding the global view of water availability to encompass water quality, EGU General Assembly 2024, Vienna, Austria, 14–19 Apr 2024, EGU24-18007, https://doi.org/10.5194/egusphere-egu24-18007, 2024.

Many aquatic ecosystems in densely populated delta’s worldwide are under stress from overexploitation and pollution. Global population growth will further increase these pressures in the coming decades, while climate change may amplify the consequences for chemical and ecological water quality. Meteorological variations are a major driver for changes in water quality. Climate change projections foresee higher temperatures and larger extremes in wet and dry periods. Still, the impact of climate change and climate variability on water quality is only poorly understood. 

In this study, we investigated the integrated effects of climatic variability on the chemical and ecological quality of groundwater and surface water in the sandy part of the Netherlands.  We especially exploited the dense monitoring information from Water Board Aa en Maas to evaluate the water quality response on the past 50 years of climate change and climatic variability.

Our results show a direct effect of climate extremes on the leaching of nutrients from agriculture. The 2018-2020 drought for example reduced nutrient concentrations in summer, but the nutrient losses increased in the subsequent wet winter seasons and in the first next wet summer of 2021. In addition, extreme wet conditions give nutrient load pulses and strongly reduce oxygen concentrations which can have both instant and long term effects on downstream ecology. The long-term trends (1990-2022) showed a general improvement in water quality due to reduce inputs, although an accelerated increase in water temperature since 2010 makes the system more vulnerable to eutrophication.

How to cite: Rozemeijer, J. and Gommans, K.: Effects of climate change and climate extremes on water quality from monitoring data in the sandy areas of the Netherlands with highly intensive agricultural land use  , EGU General Assembly 2024, Vienna, Austria, 14–19 Apr 2024, EGU24-19124, https://doi.org/10.5194/egusphere-egu24-19124, 2024.

EGU24-19395 | Orals | HS2.3.2

Spatial and Temporal Dynamics of Agricultural Water Footprint in a Changing Climate: A CORDEX-SPARE:WATER Analysis. 

Alicia Correa, Natascha Frank, Muhammad Muzammil, Bjoern Weeser, and Lutz Breuer

The far-reaching impact of climate change on water resources, particularly its intensification of scarcity, poses a substantial threat to the sustainable management of water in agriculture. To enhance cross-sectoral decision-making at various scales, it is vital to quantify both current and future water consumption, employing methodologies that assess the agricultural water footprint (WF).

This study employs the Site-sPecific Agricultural water Requirement and footprint Estimator (SPARE:WATER) to evaluate the susceptibility of green and blue agricultural WF at various scales across Colombia. The assessment is conducted under two CORDEX (Coordinated Regional Climate Downscaling Experiment)-driven climate scenarios, RCP2.6 and RCP8.5. High-resolution (0.22°) CORDEX climate model projections are used to drive the SPARE:WATER model, while historical weather data from fifteen stations (1977-2005) are employed to bias-correct the model's gridded data using the Equal Quantile Matching (EQM) method. This corrected data was spatialized using IDW interpolation. Ten major crops are selected based on their national production significance, based on the National Agricultural Survey. Crop characteristics such as harvested area, yield, and crop coefficients are obtained from local and FAO sources. The analysis focuses on both green and blue WF for the near future (2060) and far future (2099), compared to the present (2020).

Preliminary findings underscore a national WF of 45 km3/yr, with important variations at the departmental level. The spatial variability of WF is influenced by both wet and dry years.  Cocoa, coffee, and palm oil emerge as crops with the most substantial WF, showcasing respective water requirements of 30 k m3/t, 18 k m3/t, and 8 k m3/t nationally. Regional variations reveal the significance of crops such as plantain and banana in the agricultural WF landscape. Under the RCP2.6 scenario, the green and blue WF projections for 2060 and 2099 exhibit marginal changes relative to 2020. Conversely, under the RCP8.5 scenario, a discernible increase, particularly in blue WF, is evident, with a surge of 96% by 2099. This trajectory underscores the heightened water requirements anticipated for pivotal crops like cocoa and coffee in the future agricultural landscape.

These findings underscore the urgent need for informed water management strategies in the future of Colombian agriculture, particularly in the face of a high-emission scenario. The results of this study can inform policy and decision-making aimed at ensuring sustainable water resources management and food security under the evolving climate landscape.

How to cite: Correa, A., Frank, N., Muzammil, M., Weeser, B., and Breuer, L.: Spatial and Temporal Dynamics of Agricultural Water Footprint in a Changing Climate: A CORDEX-SPARE:WATER Analysis., EGU General Assembly 2024, Vienna, Austria, 14–19 Apr 2024, EGU24-19395, https://doi.org/10.5194/egusphere-egu24-19395, 2024.

EGU24-19564 | ECS | Posters on site | HS2.3.2

A high-resolution global SWATplus water quality model: Harmonizing local and global perspectives 

Albert Nkwasa, Celray James Chawanda, and Ann van Griensven

Surface water pollution has emerged as one of the predominant environmental challenges of this century, as human activities and climate change considerably alter the natural quality of freshwater ecosystems. However, gauging the true extent of how polluted or impacted freshwaters are remains challenging globally simply due to limited spatial and temporal water quality observations. To address this gap, we present a high-resolution global water quality model utilizing the Soil Water and Assessment Tool (SWAT+). Our objectives are twofold: (1) to offer locally relevant water quality estimates on a global scale and (2) to understand how human activities and climate change are influencing the water quality of rivers on the globally. In this study, we examine future spatial patterns and temporal trends in river nutrients (Total Nitrogen – TN and Total Phosphorus – TP) and sediment load concentrations until 2100, considering changing climate and socioeconomic conditions. Additionally, we attribute the primary contributing drivers to nutrient water pollution, shedding light on the key factors shaping the future of global water quality.

How to cite: Nkwasa, A., Chawanda, C. J., and van Griensven, A.: A high-resolution global SWATplus water quality model: Harmonizing local and global perspectives, EGU General Assembly 2024, Vienna, Austria, 14–19 Apr 2024, EGU24-19564, https://doi.org/10.5194/egusphere-egu24-19564, 2024.

EGU24-22136 | Posters on site | HS2.3.2

Past and future global surface water quality modelling using DynQual 

Edward R. Jones, Marc F.P Bierkens, and Michelle T.H. van Vliet

Good surface water quality is essential for safeguarding human water use activities and maintaining ecosystem health. Yet, our quantitative understanding of past developments in surface water quality is mostly predicated upon observations at monitoring stations that are discontinuous in both space and time. Furthermore, very little is known about how both climate and societal change will impact surface water quality in the future.

Process-based models provide unique opportunities to simulate both past and future surface water quality with a consistent spatial and temporal resolution. Representing one of the attempts in the emerging field of large-scale surface water quality modelling, we have developed the dynamical water quality routing model (DynQual) to simulate water temperature (Tw) and total dissolved solids (TDS), biological oxygen demand (BOD) and fecal coliform (FC) concentrations at 5 arc-minute (10km) spatial resolution and with a daily timestep. The model is open-source (https://github.com/UU-Hydro/DYNQUAL) and is coupled to the global hydrological model PCR-GLOBWB2, although hydrological input can alternatively be prescribed as a forcing. The model also incorporates a high-resolution wastewater treatment dataset1 to more realistically account for the impact of these practices on pollutant delivery to surface waters, compared to country-level or regional average rates.

DynQual has been applied and validated against observed in-stream concentrations for the historic period (1980 – 2019) using input from ISIMIP3a2, and used to project future surface water quality (up to 2100) under (uncertain) climate change and socio-economic developments using input from ISIMIP3b3. Based on these modelled results, we assess the spatial patterns, temporal variations and long-term trends in surface water pollutant concentrations to evaluate global water quality dynamics.

Our results show that surface water quality issues exist across all world regions, with current multi-pollutant hotspots especially prevalent in northern India and eastern China. Recent trends towards surface water quality deterioration are most profound in the developing world, particularly Sub-Saharan Africa and southern Asia. Conversely, in highly developed economies, organic (BOD) and pathogen (FC) pollution have decreased over time primarily due to expansions and improvements in wastewater collection and treatment. Simulations of future water quality indicate that pollution will increasingly and disproportionately affect people living in developing countries, with a widening gap in exposure rates between rich and poor countries. In particular, the combination of surface water quality deterioration and demographic changes in Sub-Saharan Africa will establish this region as a new global hotspot of surface water pollution.  


References


1 Jones, E.R., M.T.H. van Vliet, M. Qadir, M.F.P Bierkens (2021) Country-level and gridded estimates of global wastewater production, collection, treatment and re-use, Earth Syst. Sci. Data, 13, 237–254, https://doi.org/10.5194/essd-13-237-2021


2 Jones, E.R., M.F.P. Bierkens, N. Wanders, E.H. Sutanudjaja, L.P.H. van Beek,  M.T.H. van Vliet (2023), DynQual v1.0: A high-resolution global surface water quality model, Geosci. Model Dev., 16, 4481–4500, https://doi.org/10.5194/gmd-16-4481-2023


3 Jones, E.R., M.F.P. Bierkens, P.J.T.M. van Puijenbroek, L.P.H. van Beek,  N. Wanders, E.H. Sutanudjaja, M.T.H. van Vliet (2023) Sub-Saharan Africa will increasingly become the dominant hotspot of surface water pollution, Nature Water, 1, 602–613, https://doi.org/10.1038/s44221-023-00105-5

How to cite: Jones, E. R., Bierkens, M. F. P., and van Vliet, M. T. H.: Past and future global surface water quality modelling using DynQual, EGU General Assembly 2024, Vienna, Austria, 14–19 Apr 2024, EGU24-22136, https://doi.org/10.5194/egusphere-egu24-22136, 2024.

EGU24-1009 | ECS | Orals | HS2.3.3

Assessing the biological quality of freshwater bodies with machine learning technique 

Paola Di Fluri, Giacomo Capitani, Valentina Di Talia, Giacomo Antonioni, and Alessio Domeneghetti

The deterioration of superficial water quality is a relevant issue worldwide and most European rivers do not achieve the qualitative standards required by the Water Framework Directive (WFD). Furthermore, the ecological status is defined referring to surveyed data, which is available only along main watercourses and often appears erratic in time and space. Given the goals of the WFD, a short-cut methodology to perform the assessment of water pressures on rivers starting from easily accessible data is proposed. The methodology relies on machine learning techniques and implements a procedure to: (1) identify river segment exposed to pollution spills with a raster-based numerical model; (2) introduce and estimate the spatial allocation of a Biochemical Quality Index (BQI) for each exposed river segment. The study proposes a predictive tool to assess the water quality status using a machine learning algorithm trained starting from easily available input data, such as climatic and hydrological variables, anthropic pressures, water management techniques. In this prospective, the BQI is used as a reliable proxy variable to represent the anthropogenic pressures that impacts on superficial water bodies. Results show that the BQI is well reflected in the monitoring values of COD, used as proxy variable for the quality status of watercourses. We argue that the methodology can represent a solid tool for decision-making processes and predictive studies in areas with no, or poor, monitoring data.

How to cite: Di Fluri, P., Capitani, G., Di Talia, V., Antonioni, G., and Domeneghetti, A.: Assessing the biological quality of freshwater bodies with machine learning technique, EGU General Assembly 2024, Vienna, Austria, 14–19 Apr 2024, EGU24-1009, https://doi.org/10.5194/egusphere-egu24-1009, 2024.

Hydraulic connectivity has great effects on water quality. Enclosure aquaculture can largely alter lake flow regime and thus deteriorate water quality. Understanding the dynamics and influencing factors of water quality in enclosure aquaculture lakes is of great significance to ecosystem restoration of degraded lakes. However, it remains challenging due to the lack of long time series data. In this study, the dynamics of water quality in aquaculture dominated lakes were captured through 210Pb and 137Cs dating based on sediment records. Meanwhile, the effects of landscape pattern within aquaculture lakes on water quality were revealed by long time series of remote sensing images. Results showed the 210Pb and 137Cs sediment dating could provide an effective way to obtain long-term series of lake water quality data in the unmonitored area. The contents of lake sediment nutrients showed an upward trend from 1960 to 2018. The transformation of lakes from agriculture dominated to aquaculture dominated had increased sediment nutrients level. The long-term changes of lake sediment nutrients could be well explained by the landscape pattern metrics within aquaculture lakes, with an average explain power of 87.6%. The configuration metrics at class level had the most contribution (73.6%) to the changes of lake sediment nutrients, followed by the composition metrics (48.8%) and the configuration metrics at landscape level (33.4%). This study can provide a promising method to understand water quality changes in lakes with no historical monitoring data available and is of great benefit to water quality management in aquaculture dominated lakes.

How to cite: Chen, C. and Chen, Q.: Long-term changes and influencing factors of water quality in aquaculture dominated lakes unveiled by sediment records and time series remote sensing images, EGU General Assembly 2024, Vienna, Austria, 14–19 Apr 2024, EGU24-1307, https://doi.org/10.5194/egusphere-egu24-1307, 2024.

EGU24-2155 | ECS | Orals | HS2.3.3

Modeling Long-term Dissolved Organic Carbon Patterns Using Environmental Variables      

Kezhen (Jenny) Wang, Rajith Mukundan, Rakesh K. Gelda, and Allan Frei

Organic matter (OM) in rivers is an important food source to sustain aquatic ecosystem health. However, in surface water supply systems where chlorination is often used for disinfection, OM is also a precursor for the carcinogenic and mutagenic disinfection byproducts (DBPs) such as trihalomethanes (THMs) and haloacetic acids (HAAs). Effective management of OM in rivers to maintain both aquatic ecosystem functions and high water-supply quality requires better understanding of the OM transport patterns, where dissolved organic carbon (DOC) can be used as a surrogate measurement of OM. Analysis of DOC data on a watershed scale to estimate fluxes and to determine long-term trends remains challenging, largely due to the spatial and temporal variations in DOC, and low sampling frequency. To help improve the understanding of DOC sources and export processes, we compared long-term temporal patterns in six watersheds in the New York City (NYC) Water Supply System, which supplies drinking water daily to over 8.5 million people in NYC and one million people in the upstate counties. Firstly, we compared six empirical water quality models for DOC prediction. The models include flow-based linear regression (LM), dynamic linear models (DLMs), LOAD ESTimator model (LOADEST), Weighted Regressions on Time, Discharge, and Season (WRTDS), multiple linear regression (MLR), and general additive models (GAMs). Given the differences in dominant land-use and hydrological conditions in the study watersheds, we found that GAMs produced the most robust results. Secondly, we used GAMs with multiple predictor variables to predict long-term daily DOC concentrations in the six study watersheds, which allowed better trend analysis and flux estimates than using the routine grab-sample data with inconsistent sampling frequencies. Lastly, we compared the relationships between temporal patterns in DOC and watershed features to investigate the regional differences, focusing on the watershed mechanistic processes associated with DOC by parsing out the climate signals from the historical trends. The results show that hydrology plays a larger role on DOC temporal patterns in some watersheds whereas nutrient associated production processes are more important in others. The study presents a better performing approach than the solely hydrology driven models and can inform targeted monitoring strategies for DOC management in water-supply source waters.

How to cite: Wang, K. (., Mukundan, R., Gelda, R. K., and Frei, A.: Modeling Long-term Dissolved Organic Carbon Patterns Using Environmental Variables     , EGU General Assembly 2024, Vienna, Austria, 14–19 Apr 2024, EGU24-2155, https://doi.org/10.5194/egusphere-egu24-2155, 2024.

EGU24-3197 | ECS | Posters on site | HS2.3.3

Event-based high-resolution water quality measurements in rural headwater catchments: DOC quality and DOC export 

Lukas Ditzel, Caroline Spill, and Matthias Gaßmann

In this study, the DOC concentration and DOC quality as well as the discharge of a small spring catchment area in the North Hessian low mountain range were investigated over a period of 1 ½ years. The Nesselbach near Kassel is a small siliceous low mountain stream with an average flow of around 8.5 l/s. The catchment area is primarily characterized by agriculture (75% area share) and is home to a small settlement and forest areas (15% area share). The DOC concentration and the quality indices SUVA254 and SL270 and SL290 were determined using a UV-Vis in-situ probe with a resolution of 5 minutes. These indices can be used to evaluate the strength of the aromatic compounds of the DOC molecules (SUVA254) or the molecular weight (SL275 and SL290). Good DOC quality is generally associated with strong aromatic bonds and a high molecular weight. Spearman correlations were calculated to investigate factors such as water temperature and event characteristics on DOC quality and DOC export. In addition, hysteresis analyses were carried out to interpret the discharge-DOC load relationship with a time lag. The results of the study show an unexpectedly low DOC export from the headwater catchment compared to the relevant literature, as well as a strong correlation between DOC export and DOC quality. The observed fluctuations in DOC quality are mainly determined by the season and the changing land use.

How to cite: Ditzel, L., Spill, C., and Gaßmann, M.: Event-based high-resolution water quality measurements in rural headwater catchments: DOC quality and DOC export, EGU General Assembly 2024, Vienna, Austria, 14–19 Apr 2024, EGU24-3197, https://doi.org/10.5194/egusphere-egu24-3197, 2024.

The assessment of reservoir water quality is vital for preserving ecosystems and ensuring the sustainable use of water resources. Chlorophyll-a (Chl-a) acts as a vital bioindicator, reflecting the dynamics of phytoplankton populations and trophic status of aquatic ecosystems. In this study, we use Generalized Additive Mixed Model (GAMM) models to analyze variations in Chl-a concentration in two connected subtropical off-stream reservoirs (Ren-Yi and Lan-Tan). Water temperature and rainfall are the only two important variables appearing in the optimal GAMM models for both reservoirs. However, Ren-Yi's optimal model additionally includes NH3, total phosphorus (TP), and water level, suggesting these factors may play a larger role in its nutrient levels and fluctuations. This is supported by the significantly higher chemical oxygen demand (COD), TP, and total nitrogen (TN) levels in Ba-Zhang River, which recharges Ren-Yi Reservoir. Lan-Tan's optimal GAMM model incorporates 'sampling depth' variables due to significant differences between shallow and deep sites. Interestingly, in larger datasets (300 points), 'season' emerges as a crucial variable, highlighting intensified seasonal variations in denser data. Therefore, incorporating 'season' as a nominal variable is essential for accurate modeling. Variance structures of Chl-a vary within Lan-Tan by season and within Ren-Yi by sampling site (RY100) and water temperature (RY300). The optimal GAMM captures this inherent variability by incorporating sampling sites or seasons as random effects. The relationship between dissolved oxygen (DO), COD, and Chl-a concentrations is complex and influenced by multiple factors, including nutrient dynamics, algal activity, water circulation patterns, and local conditions. GAMMs are well-suited to capturing the potentially nonlinear and time-varying nature of these relationships, leading to more accurate modeling.

How to cite: Kuo, Y.-M. (.: Water quality and physicochemical conditions drive chlorophyll-a concentrations in two connected subtropical off-stream reservoirs, EGU General Assembly 2024, Vienna, Austria, 14–19 Apr 2024, EGU24-3673, https://doi.org/10.5194/egusphere-egu24-3673, 2024.

The Guangdong-Hong Kong-Macao Greater Bay Area (GBA) is one of the most economically developed and active regions in China. Fish pond farming is the most important aquaculture model in the GBA. In recent years, climate change and the continuous interference of human activities have led to Chl-a content There are significant differences in time and space, and timely monitoring is crucial to protecting the ecosystems of inland water bodies and adjacent sea areas. Most previous studies have focused on inland lakes or adjacent sea areas, and there have been few studies on fish ponds in the GBA. Based on the BST model, this study selected Landsat image data from 2013 to 2022 to invert the Chl-a concentration of cultured fish ponds in the GBA, and analyzed the temporal and spatial differences in Chl-a contained in cultured fish ponds in the GBA. The results show that: (1) The BST model performs well in retrieving Chl-a concentration in cultured fish ponds in the GBA.(2) In the past ten years, Chl-a has declined year by year from 2013 to 2018, fluctuated slightly from 2018 to 2020, and continued to rise from 2020 to 2022. (3) Aquaculture fish ponds are mainly distributed in the central and southern areas of the GBA. Aquaculture fish ponds near the Pearl River Basin are denser and have higher concentrations. (4) Chl-a has shown an overall upward trend in the past ten years. Among them, the aquaculture fish ponds in Dongguan and Zhongshan have the largest upward trend. Dongguan has the highest increase rate and Guangzhou has the lowest increase rate. (5) Chl-a in cultured fish ponds in the GBA has obvious seasonal variation characteristics, with the highest value in summer and the lowest value in winter. Chl-a concentration in the four seasons is highly correlated with water temperature. Changes in water temperature may be the main factor causing this phenomenon. (6) The concentration of Chl-a in the water bodies of fish farming ponds in the GBA is significantly higher than that of the Pearl River water body and sea water, and the Pearl River water body near the shore is higher than that in the center of the river. This may be due to human overuse of feed and disinfectants Caused. Increasing human activities have caused a significant increase in the degree of eutrophication of water bodies in farmed fish ponds. Control of nutrients such as N and P produced by human activities should be strengthened. The results of this study are important references for water body protection in the GBA and the sustainable development of the aquaculture industry value.

How to cite: Li, Z.:  Remote sensing monitoring and trend analysis of Chl-a changes in cultured fish ponds in the Greater Bay Area from 2013 to 2022, EGU General Assembly 2024, Vienna, Austria, 14–19 Apr 2024, EGU24-4298, https://doi.org/10.5194/egusphere-egu24-4298, 2024.

EGU24-4691 | ECS | Posters on site | HS2.3.3

Assessment of the accuracy of salinity simulation using heavy metal and nitrogen cycle in SWAT model in an area exposed to intensive agriculture, Navrood basin, Iran 

Zeynab Kougir Chegini, Negin Sheykhi, Maryam Navabian, Majid Vazifeh Doost, Mohammadreza Ojani, and Szilárd Szabó

The quality of water resources has been considerably changed by human activity in recent decades, resulting in current contamination or posing a risk for the future. Compared to other activities, agriculture contributes more to the depletion of surface water and the degradation of water quality. One of the primary strategies to improve the quality of water resources is agricultural management on watershed-level and water quality simulation models are useful tools for simulating the effects of different activities The catchment basin was Navrood (West Guilan, Iran), and the SWAT model was applied. The salinity load was simulated under two cycles: heavy metals and nitrogen, and the two models were compared. Data series of salinity and discharge from 2006 to 2013 were used to calibrate and validate SWAT. R2 and Nash-Sutcliffe coefficients (NS) were computed to evaluate the model's efficacy. The R2 and NS values were obtained in the river discharge simulation at 0.81 and 0.52, respectively indicating a good model fit. The model makes an acceptable performance of modeling the salinity load in the nitrogen cycle, according to the statistical index that was computed during calibration. Based on the results, the SWAT model can be used to analyze the salinity-induced transfer phenomena in the Navrood basin, considering the values of NS obtained for two stations during the calibration stage, which were equivalent to 0.43 and 0.51. The second method, which simulated the salinity load under the cycle of heavy metals in the basin, did not demonstrate a proper correspondence between the simulated and measured data of the salinity load. The R2 and NS under the cycle of heavy metals were 0.30, -0.71. Therefore, based on the results, simulating the Navrood basin's salinity load using the nitrogen cycle is recommended.

Zeynab Kougir Chegini is funded by the Stipendium Hungarian scholarship under the joint executive program between Hungary and Iran.

The study was elaborated under the research project NKFI K138079.

Keywords: paddy fields, surface water, solute transport

How to cite: Kougir Chegini, Z., Sheykhi, N., Navabian, M., Vazifeh Doost, M., Ojani, M., and Szabó, S.: Assessment of the accuracy of salinity simulation using heavy metal and nitrogen cycle in SWAT model in an area exposed to intensive agriculture, Navrood basin, Iran, EGU General Assembly 2024, Vienna, Austria, 14–19 Apr 2024, EGU24-4691, https://doi.org/10.5194/egusphere-egu24-4691, 2024.

Excessive inflow of nitrate and phosphate is a major cause of eutrophication in surface water systems. Eutrophication induces the excessive growth of photosynthetic organisms, leading to the occurrence of algae blooms. Therefore, treating excessive nutrients can be an essential method to alleviate eutrophication. This study aimed to assess the seasonal changes in the eutrophication status in a lake and to evaluate the potential of using Ca-citrate complex for the simultaneous treatment of nitrate and phosphate in the lake environment. Osongji (Osong Pond), a small lake located in Jeonju-si, Korea, was selected as the study site, and the changes in physicochemical parameters and the Korean Eutrophication Index (TSIKO) were used to evaluate the changes in the eutrophication status in the lake. In addition, a eutrophication alleviation technique using ca-citrate complex, was tested under three experimental conditions. The experiments included the application of Ca-citrate complex reagent every two weeks (T1; prevention) or one-time application (T2; one-time application). Closed (T3) and open (T4) controls (without application of the Ca-citrate complex) were also included for comparison. Analysis of seasonal changes in the eutrophication status was conducted every two months from November 2022 to September 2023, and the Ca-citrate complex experiments were conducted from June to September 2023. The results showed that Osongji had the eutrophic condition from November 2022 and the hypereutrophic condition from June to July 2023, and it returned to the eutrophic condition in August 2023. The evaluation of the eutrophication alleviation technique using ca-citrate complex indicated that, in T1 with periodic application, lower TSIKO values maintained compared to the control groups without Ca-citrate complex. In the T2 condition with a one-time application, total phosphorous (T-P) and total nitrogen (T-N) decreased two weeks after application, and TSIKO also decreased. In conclusion, the application of Ca-citrate complex reagent in the lake environment had effectiveness in preventing and alleviating eutrophication. This study can contribute to assessing the degree of eutrophication in a surface water system and developing management strategies for prevention or alleviation of eutrophication.

How to cite: Noh, S., Kang, J., and Jeen, S.-W.: Evaluation of Seasonal Changes in the Eutrophication Index and a Eutrophication Alleviation Technique in Osongji (Osong Pond), Jeonju-si, Korea, EGU General Assembly 2024, Vienna, Austria, 14–19 Apr 2024, EGU24-5014, https://doi.org/10.5194/egusphere-egu24-5014, 2024.

Chlorophyll is widely used to assess the level of eutrophication, which is recognized as one of the major causes of deterioration in water quality, especially across Irish inland waters. The use of optical remote sensing for chlorophyll monitoring has already been shown to be able to complement existing in-situ chlorophyll. However, as cloud cover impacts all optical sensors this limits the usefulness in many locations to develop long term records. A potential solution is to combine information from multiple satellites using a machine learning approach. In this study, we develop long-term time series of chlorophyll concentrations for lakes in Ireland using four different remote sensing platforms: Landsat-8, MODIS, Sentinel-2, and Sentinel-3. Several machine learning approaches have been tested, including K-nearest neighbourhood, random forest (RF), XGBoost (Extreme Gradient Boosting), artificial neutral network (ANN), and support vector regression (SVR).

Initial result indicate that a machine learning model utilising all four platforms and in-situ observation is effective in developing long-term chlorophyll concentrations. While the methods are tested and validated for Irish lakes, the methodology has the potential to be applied in a global context.

How to cite: Zhao, M. and O 'Loughlin, F.: Developing Long-term Satellite Based Chlorophyll Estimates via Multiple Machine Learning Methods , EGU General Assembly 2024, Vienna, Austria, 14–19 Apr 2024, EGU24-5496, https://doi.org/10.5194/egusphere-egu24-5496, 2024.

EGU24-6269 | ECS | Orals | HS2.3.3

Role of urban wetlands in improving catchment river water quality with implications for management 

Fangjun Peng, Leyang Liu, and Ana Mijic

The theme for World Wetlands Day in 2024 is centred on the symbiotic relationship between wetlands and human wellbeing. The urban wetland, as a nature-based solution, notably intertwines with human activities, distinguishing itself among various wetland types. Examining urban wetlands through the aspect of water quality reveals their ability to purify nitrogen and phosphorus from water sources. However, human activities affect river water quality via various sources and processes within an urban environment, including land surface and wastewater discharge, exhibiting significant complexity. Understanding how urban wetlands interact with these processes and their impacts on water quality is needed. To explore the role of wetlands in integrated urban water quality management, our study enhanced the representation of nutrient processes in wetlands and incorporated it into the whole-water cycle simulation tool – the Water Systems Integration Modelling framework (WSIMOD). This is done by quantifying the wetland-urban system interactions within subcatchments, between subcatchments, and at the catchment scale. Our study aims to (1) evaluate urban wetland benefits in water quality improvement via statistical analysis; (2) simulate such impacts through integrated modelling; (3) explore the pipe connections of wetlands and their impacts on systems-level water quality improvement to inform design and management. Analysis of observed water quality data reveals that the nitrogen concentration in a catchment influenced by the urban wetlands network is reduced by approximately 18% to 28%, with the phosphorus concentration showing a reduction of about 4% to 11%. At a local scale, within a single subcatchment, the model is demonstrted to capture the water quality dynamics and the observed impacts well by validating against the sampling data. Furthermore, at a broader scale encompassing the entire catchment, the connectivity of urban wetlands through pipes is expected to achieve better system-level water quality performance. This research emphasises the need to explore how urban wetlands influence and are influenced by various water elements, informing future urban wetland design and management strategies.

How to cite: Peng, F., Liu, L., and Mijic, A.: Role of urban wetlands in improving catchment river water quality with implications for management, EGU General Assembly 2024, Vienna, Austria, 14–19 Apr 2024, EGU24-6269, https://doi.org/10.5194/egusphere-egu24-6269, 2024.

EGU24-6935 | Posters on site | HS2.3.3

Monitoring spatial and temporal variation of field water quality and sediment organic matter for comparison of satellite image data 

Jun-Ho Lee, Hoi Soo Jung, Huigyeong Ryu, and Han Jun Woo

Sechura Bay (05°12’ to 05°50’S and 80°50’ to 81°12’W) is delimited in the north by Punta Gobernador and Punta Aguja to the south, has an approximate extension of 89 km2, and is within the Piura Region, Peru. It is considered within the transition zone between cold water transported from the south by the Humboldt Current and warm water of the tropical equatorial region. Sechura Bay is an area of high economic importance and an ecosystem with high marine biodiversity due to fan shell (Argopecten purpuratus) production and artisanal fishing. fan shell is an edible marine species of saltwater shellfish, a bivalve mollusk in the family Pectinidae. To use satellite image data in real-time at the survey point, information such as GIS (geographic information system)-based water depth and classification of the characteristics of rock, gravel, sand, silt, and clay content on the surface is required. It usually consists of factors related to the growth of shellfish (sea temperature, salinity, hydrodynamics, chlorophyll-a, etc.) and factors related to the environment surrounding the shellfish (bottom dissolved oxygen, total organic carbon, sediment acid volatile sulfide, benthic diversity, etc.). For example, the suitability score was ranked on a scale from 1.0 points (least suitable) to 8.0 points (most suitable). However, the definition of the score grade must be a decision between artisanal fishing and marine researchers. This GIS-based identify suitable site selection technique, which includes water depth and sedimentary facies information, can be used as the fan shell production management system by supporting spatial variability decision-making in near real-time comparison of satellite image data.

How to cite: Lee, J.-H., Jung, H. S., Ryu, H., and Woo, H. J.: Monitoring spatial and temporal variation of field water quality and sediment organic matter for comparison of satellite image data, EGU General Assembly 2024, Vienna, Austria, 14–19 Apr 2024, EGU24-6935, https://doi.org/10.5194/egusphere-egu24-6935, 2024.

EGU24-7448 | ECS | Orals | HS2.3.3

Understanding the variable impact of point sources on headwater stream water quality 

Caroline Spill, Lukas Ditzel, and Matthias Gassmann

In rural areas, point sources like wastewater treatment plants or combined sewer overflows are frequently overlooked or only simplistically considered in analyses of whole watersheds. The lack of available data and the difficulty of tracing hydrochemical signatures of (reactive) nutrients measured at the outlets of larger areas back to their origin are common reasons for that. The extent to which these sources influence nutrient dynamics in water bodies and how they interact with nutrients from diffuse sources has been examined in only a few studies.

As part of our study, we installed a comprehensive measurement setup in a selected rural watershed where a local wastewater treatment plant and combined sewer overflows discharge into a small river. To capture the dynamics of these point sources, pressure sensors, water quality probes, and automatic samplers were installed shortly after the treatment plant. The outlet was sampled weekly. Additional samples were taken upstream of the treatment plant and downstream of our monitoring station, to capture in-stream nutrient transformation.

In contrast to the common assumption that the influence of small treatment plants can be considered constant, the water quality of the treated wastewater undergoes significant fluctuations, especially during base flow. Comprehensive statistical analyses show that the treatment plant significantly influences the concentration-discharge relationship in the water body and is responsible for a large portion of nutrient loads. In the water body itself, ammonium constitutes half of the inorganic nitrogen It is detectable only downstream of the wastewater treatment plant outlet, where it undergoes rapid nitrification. During precipitation events, a complex interaction of the treatment plant, combined sewer overflows, and diffuse sources was observed. In particular, the increasing input of ammonium and ortho-phosphate leads to an increase in exported concentrations and loads of these nutrients. At the same time, the system is characterized by frequent activation of combined sewer overflows. Our investigations show that the effects of wastewater treatment plants in rural areas are more differentiated and extensive than commonly assumed. At the same time, there is still a high potential to reduce the discharge of nutrients from point sources and, thus, the discharge of nutrients from low order catchments.

How to cite: Spill, C., Ditzel, L., and Gassmann, M.: Understanding the variable impact of point sources on headwater stream water quality, EGU General Assembly 2024, Vienna, Austria, 14–19 Apr 2024, EGU24-7448, https://doi.org/10.5194/egusphere-egu24-7448, 2024.

EGU24-8131 | Posters on site | HS2.3.3

Modelling of impacts of combined sewer overflows pollution on urban and rural canal networks 

Matteo Masi, Daniele Masseroni, and Fabio Castelli

The rapid and chaotic expansion of many urban areas, associated with increasing frequency of extreme events, may significantly affect the rainfall-runoff processes and pollutant fate and transport in surface waters. The consequences of such trends affect the combined sewerage systems (CSSs) where wastewater and rainwater mix, leading to a reduction of the efficiency of the existing drainage infrastructures and to the release of pollutants to the water bodies. In this work we developed a coupled hydrologic, hydraulic, and water quality model to simultaneously assess the effects of hydrologic events and CSS discharge on receiving waterbodies (RWBs) on both water quantity and water quality. The modelling framework consists of three modules: (i) the MOBIDIC-U software which is a distributed and raster-based hydrological model to simulate runoff and propagation in canal network in urban and rural areas, (ii) a reactive-transport module able to simulate the advective and dispersive transport and bio-chemical reactions of pollutants in the network, and (iii) an additional software module to assess the mitigation of pollution through the implementation of nature-based solutions (e.g., constructed wetlands). The main quality parameters in the model are: carbon, ammonia nitrogen (NH3 and NH4+), nitrate NO3-, total suspended solids (TSS) and dissolved oxygen. The application of the model to rural areas is particularly critical due to poor availability of data, in particular those related to the morphological characteristics of the network. To overcome this deficiency, we developed an algorithm that automatically extracts the topological/topographical data of the network (e.g., cross sections, elevations) to be provided as input to the model from the digital terrain model. We showcase the application of the model to a case study located in a suburban area of Milan (Italy) to evaluate the effects of sewerage overflows and runoff from polluted urban and agricultural surfaces on the water quality status of the RWBs. The results demonstrate that is possible to define mitigation strategies through the implementation of constructed wetlands with the purpose of obtaining a quality suitable for agricultural and environmental reuses.

How to cite: Masi, M., Masseroni, D., and Castelli, F.: Modelling of impacts of combined sewer overflows pollution on urban and rural canal networks, EGU General Assembly 2024, Vienna, Austria, 14–19 Apr 2024, EGU24-8131, https://doi.org/10.5194/egusphere-egu24-8131, 2024.

EGU24-8173 | Posters on site | HS2.3.3

On the improvement of catchment scale simulations of nitrate transport through tile drains 

Anker Lajer Hojberg, Raphael Schneider, David Terpager Christiansen, and Simon Stisen

Nitrate transport from cultivated areas poses a significant risk to water quality of inland and marine water bodies. During subsurface transport nitrate may undergo reduction under anaerobic conditions. However, in temperate climates tile drainage are widely used in agriculture, which provides short-circuits between the root zone and surface water systems, with limited or no nitrate reduction. To identify areas most prone to loss of nitrate to the aquatic environment, it is thus vital to assess and quantify not only the transport out of the root zone, but also the fraction of nitrate being transport by tile drains vs. groundwater transport. The spatio-temporal pattern of tile drainage can be estimated by use of physically-based distributed hydrological models, but their setup and evaluation are generally challenged by limited data on drains with respect to both the tile drain network and in particular with respect to the efficiency of the drains, i.e. the amount of recharging water that is transported via drains. To support water management, the models must cover relevant scales (100 – 1000 km2) posing an additional upscaling modelling challenge.

As part of nitrogen usage regulation in Denmark, a national nitrogen model has been developed, which is currently under revision. An important task is to improve the description of drain transport. This is achieved through detailed hydrological modelling of fields with drain flow observations from which drain fractions, i.e. the fraction of precipitation being drained, are calculated for each model grid. A machine learning algorithm (gradient boosted decision tree) is then used to regionalise the drain fraction to the national scale. Results are used in model calibration to improve the spatial and temporal description of drain flow. While the drainage estimates are needed at a fine scale, preferably at grid scale, data to evaluate model accuracy in terms of nitrate transport is not available at this scale. At catchment scale, the seasonal dynamics of observed nitrogen transport in streams provide valuable information on the amount and temporal variation of the contributions from drains. Analyses of the observed time series are used to further constrain nitrate drainage transport at catchments scale. Uncertainty in model results is assed using a stochastic approach calling for numerous model runs. To limit computational time, model simulations are carried using different spatial resolutions (100 and 500 m grids), where the coarser model is run for an entire 30-year period while the finer resolution is only run for a decade. Results from the overlapping simulation period is used for tuning a downscaling of the drain flow in 500 to a 100 m resolution, thereby providing model results of nitrate transport via drainage at a 100 m resolution for the entire 30 years.

How to cite: Hojberg, A. L., Schneider, R., Christiansen, D. T., and Stisen, S.: On the improvement of catchment scale simulations of nitrate transport through tile drains, EGU General Assembly 2024, Vienna, Austria, 14–19 Apr 2024, EGU24-8173, https://doi.org/10.5194/egusphere-egu24-8173, 2024.

EGU24-9157 | Posters on site | HS2.3.3

Towards Understanding the Effects of Climate and Land Cover Change on Dissolved Organic Carbon Export in Temperate Forest Catchments 

Tam Nguyen, Rohini Kumar, José L.J. Ledesma, Ebeling Ebeling, Jan H. Fleckenstein, and Andreas Musolff

The amount of dissolved organic carbon (DOC) in surface waters is an important water quality indicator. High levels of DOC in surface waters cause negative impacts on the aquatic ecosystem (e.g., via reducing light penetration and increasing water temperature) and increase the water treatment cost for drinking water supply. DOC mobilization and export from catchments into streams are hydrologically controlled and strongly affected by catchment-specific characteristics (such as topography, soils, and land cover type) and climatic factors. In this study, we developed a simplified process-based model that explicitly includes the hillslope, riparian, and groundwater compartments with the hydro-biogeochemical concept mainly based on the mesoscale Hydrologic Model (mHM) and INCA-Carbon models. The proposed model also allows dynamic carbon input from litterfall and root breakdown. We hypothesize that such a model is needed to understand the role of different catchment compartments and land cover and climate change on instream DOC export. We applied the proposed model for instream DOC simulation in four temperate forest and agriculture catchments located in the Harz Mountains, Germany. Here, we calibrated the model for the period which includes drought years (2018-2019) and the subsequent forest dieback (starting from 2018). The models showed satisfactory results in terms of instream DOC concentrations. Here, we will further evaluate if the model provides the right results for the right reasons by analyzing the physical soundness of the internal carbon export dynamics among different model compartments from our calibrated model. Such evaluation is important when further applying this modeling concept to other areas under similar circumstances.

How to cite: Nguyen, T., Kumar, R., Ledesma, J. L. J., Ebeling, E., Fleckenstein, J. H., and Musolff, A.: Towards Understanding the Effects of Climate and Land Cover Change on Dissolved Organic Carbon Export in Temperate Forest Catchments, EGU General Assembly 2024, Vienna, Austria, 14–19 Apr 2024, EGU24-9157, https://doi.org/10.5194/egusphere-egu24-9157, 2024.

EGU24-9329 | Orals | HS2.3.3

Enhanced redox mapping at national scale of Denmark through integration of sediment color and groundwater chemistry in a machine learning framework 

Julian Koch, Joel Conde, Birgitte Hansen, Hyojin Kim, Ingelise Møller, Lærke Thorling, Lars Troldborg, Denitza Voutchkova, and Anker Højberg

Redox conditions play a crucial role in determining the fate of geogenic and anthropogenic contaminants in groundwater, impacting ecosystem services vital for both the aquatic environment and human water supply. For example, investigating the reduction of nitrate underscores the importance of data on redox conditions since denitrification takes places in anoxic environments. Specifically, knowledge of the depth to the uppermost reduced layer, i.e., first redox interface, can inform water and land management by identifying agricultural areas vulnerable or robust to nitrate leaching. Assessing redox processes is complicated by geological heterogeneities, resulting in complexities of local to regional groundwater flow paths. Geospatial machine learning techniques have previously successfully mapped redox conditions based on sediment color or water chemistry observations. This study introduces a novel approach that combines both data sources to enhance understanding of subsurface redox conditions in Denmark. In the first step, depth to the first redox interface is mapped using sediment color information from 26,800 boreholes. This depth is derived from sediment color changes, transitioning from oxic to reduced colors of quaternary sediments. The mapping utilizes a regression-based gradient boosting with decision tree algorithm trained against sediment color data and 20 covariates, encompassing information on hydrogeology, lithology, topography, and hydrology. In the second step, the depth of the first redox interface is compared against groundwater chemistry to classify continuous and discontinuous redox conditions. Continuous conditions exhibit the absence of oxic groundwater below the first redox interface, while discontinuous conditions show oxic groundwater below the interface. This classification is performed using a gradient boosting with decision tree algorithm utilizing the same 20 covariate maps and 21,800 classified groundwater samples. Both models undergo comprehensive cross-validation and feature importance analysis. The depth to the first redox interface is modeled with a mean error of 0.001 m and a root-mean-squared error of 8.3 m. The continuous/discontinuous classification attains an accuracy of 69.5 %. Both variables are mapped at a 25 m spatial resolution at the national scale of Denmark. Results indicate a mean depth to the first redox interface of 9.4 m and a standard deviation of 5.7 m, with spatial patterns largely driven by the groundwater table. 66.0% of Denmark is classified as discontinuous, indicating complex redox conditions, predominantly collocated with moraine clay. These maps contribute significantly to understanding subsurface redox processes, supporting national-scale land and water management.

How to cite: Koch, J., Conde, J., Hansen, B., Kim, H., Møller, I., Thorling, L., Troldborg, L., Voutchkova, D., and Højberg, A.: Enhanced redox mapping at national scale of Denmark through integration of sediment color and groundwater chemistry in a machine learning framework, EGU General Assembly 2024, Vienna, Austria, 14–19 Apr 2024, EGU24-9329, https://doi.org/10.5194/egusphere-egu24-9329, 2024.

EGU24-10230 | ECS | Orals | HS2.3.3

Quantifying long-term nutrient sources and pathways in the Ganges River basin 

Hamdy Elsayed, Arthur Beusen, and Lex Bouwman

The Ganges River basin is home to more than 600 million people. Intensive agriculture is widespread owing to the basin’s widespread fertile soils and abundant water availability. Together with urbanization and industrialization which have grown rapidly over the past decades across the basin, this has significantly impacted the river’s water quality with adverse impacts on human health and ecosystem. Elevated nutrient levels in the Ganges River, mainly from intensive agricultural practices and discharge of untreated wastewater, have led to surface and groundwater pollution across the basin. In this study, we employ the spatially explicit Integrated Model to Assess the Global Environment-Dynamic Global Nutrient (IMAGE-DGNM) to investigate nutrient sources and pathways and their fate in the Ganges river system. Basin-wide simulation results over the past five decades (1970-2020) will be presented and analysed along with discussions on the implication of nutrient pollution on the water quality of the Ganges River.

How to cite: Elsayed, H., Beusen, A., and Bouwman, L.: Quantifying long-term nutrient sources and pathways in the Ganges River basin, EGU General Assembly 2024, Vienna, Austria, 14–19 Apr 2024, EGU24-10230, https://doi.org/10.5194/egusphere-egu24-10230, 2024.

EGU24-10273 | Orals | HS2.3.3 | Highlight

Riverine nitrogen exports to the Wadden Sea – a travel time-based modelling approach 

Andreas Musolff, José L.J. Ledesma, Tam V. Nguyen, Pia Ebeling, Fanny Sarrazin, Dietrich Borchardt, Sabine Attinger, and Rohini Kumar

Elevated nutrient levels in inland, coastal and marine waters have led to negative eutrophication impacts such as algal blooms and biodiversity loss. In the European Union, measures to reduce nutrient pollution have been implemented as part of the Water Framework Directive, the Nitrates Directive, the Urban Wastewater Directive and the Marine Strategy Framework Directive. However, the water quality targets defined in these frameworks are not always coherent and may be too rigid when considering the future impact of climate change on nutrient cycling. This ambiguity adds to the scientific challenge of assessing current nutrient fluxes and concentrations and their future dynamics under changing boundary conditions.

Within the EU-funded project NAPSEA – N and P from Source to Sea, we address the continuum of nutrient fluxes from terrestrial sources in the Elbe and Rhine basins to the delivery in the Wadden Sea at the Dutch, German and Danish coasts. To model nitrogen (N) concentrations and fluxes, we use the water quality model (mQM, Nguyen et al. 2023) in a setting consisting of more than 500 mesoscale catchments with longer-term riverine N observations in the Elbe and Rhine basins. The model takes into account the storage, removal (denitrification) and release of N in the soil zone as a function of temperature and soil moisture. Importantly, subsurface transport and denitrification are based on a dynamic travel time approach using storage selection functions that explicitly account for N legacy effects. The model runs at an annual time-step, accounting for instream integration and retention of N, and is constrained against observations at the catchment outlets.

In this contribution, we present the model results that allow us to identify the hotspots of N export in the Elbe and Rhine basins. We capture the decadal trajectories of N fluxes and concentrations and quantify the amount of N stored as biogeochemical legacy in soils and as hydrological legacy in groundwater. The model also makes it possible to disentangle the contributions of point vs. diffuse sources to N export in time and space as well as the efficiency of N retention. The calibrated model will allow for future projections of riverine N exports to estuaries and the Wadden Sea with the aim to differentiate the effects of climate change on the one hand, and different nutrient management scenarios on the other.


References:

Nguyen, V.T., Sarrazin, F.J., Ebeling, P., Musolff, A., Fleckenstein, J.H., Kumar, R. (2022): Toward understanding of long-term nitrogen transport and retention dynamics across German catchments. Geophys. Res. Lett. 49 (24), e2022GL100278

How to cite: Musolff, A., Ledesma, J. L. J., Nguyen, T. V., Ebeling, P., Sarrazin, F., Borchardt, D., Attinger, S., and Kumar, R.: Riverine nitrogen exports to the Wadden Sea – a travel time-based modelling approach, EGU General Assembly 2024, Vienna, Austria, 14–19 Apr 2024, EGU24-10273, https://doi.org/10.5194/egusphere-egu24-10273, 2024.

EGU24-11225 | ECS | Orals | HS2.3.3 | Highlight

Water management is a success story, how water quality changed based on historical development and mid-term hydroclimate. 

Christian Marx, Dörthe Tetzlaff, Reinhard Hinkelmann, and Chris Soulsby

Urban water quality has traditionally been perceived as primarily influenced by point sources such as wastewater treatment plants and (combined) stormwater overflows. However, limited attention has been given to understanding how the urban stream syndrome evolves post the operation of water management facilities, the broader impacts on water quality beyond these measures, and the influence of hydroclimate on urban water quality.

In this study, we present spatially distributed data spanning 66 years of water quality and fertilizer application, 30 years of water quantity, and 20 years of groundwater quality in the urban Panke catchment, Berlin, Germany, aiming to address these questions. Hydroclimatic indicators, specifically the Standard Precipitation Index (SPI), were employed, and the data was analyzed for trend delineation, breakpoint analysis, and concentration-discharge relationships.

Predictably, major water quality changes were attributed to shifts in water management practices, such as the transformation of the former sewage irrigation farm, subsequent replacement with a wastewater treatment plant, and alterations in wastewater redirection. Interestingly, unaffected upstream sites were parallel improving in water quality. While concentration-discharge remained unaffected by hydroclimate, we observed trends towards lower NO3-N and higher NH4-N, oPO3-P, and CL concentrations during droughts. Despite these variations, the upstream sites demonstrated significant overall improvement, reaching the highest water quality classification, demonstrating how effective water management can enhance resilience.

The hydrochemical dynamics in upstream sites suggested altering connectivity during drought, which remains unclear and requires further investigation. Beyond our research findings, we highlight the importance of establishing a structured, long-term monitoring program and promoting knowledge transfer across various institutions. This collaborative approach is deemed crucial for comprehending and contextualizing the gathered data.


How to cite: Marx, C., Tetzlaff, D., Hinkelmann, R., and Soulsby, C.: Water management is a success story, how water quality changed based on historical development and mid-term hydroclimate., EGU General Assembly 2024, Vienna, Austria, 14–19 Apr 2024, EGU24-11225, https://doi.org/10.5194/egusphere-egu24-11225, 2024.

EGU24-12278 | ECS | Posters on site | HS2.3.3

Investigating the water quality of rivers entering the Anzali Wetland 

Mohammadreza Ojani, Eisa Ebrahimi, Zeynab Kougir Chegini, and Szilárd Szabó

The Anzali wetland, a crucial water ecosystem in Iran, has been receiving water input from various rivers over the years and is currently facing a critical condition. We aimed to determine the proportional contribution of biogeochemical loads of anthropogenic origin by the rivers supplying the wetland. Accordingly, we analyzed monthly data from 2013 to 2015, encompassing discharge, total dissolved solids, calcium, magnesium, potassium, sulfate, chloride, bicarbonate, electrical conductivity, and water acidity in the primary river feeding into Anzali wetland. We found that the Pasikhan River exhibited the highest and Chafrood River the lowest average daily water flow, with 48 m3/s and 0.42 m3/s, respectively. The annual average of total soluble solids introduced into Anzali wetland through Pirbazar and Pasikhan rivers was 164,760 and 205,713 tons, respectively. Additionally, the inflow of other substances such as chloride and sulfate into the wetland is substantial. Overall, more than half of the wetland's water originates from the Pasikhan and Pirbazar rivers in the eastern region, where Pasikhan and Pirbazar rivers are dominantly utilized for agricultural and urban purposes, respectively. Based on the multivariate analysis we quantified the contribution of the rivers and the role of land use in the region as main factors of water quality. To rejuvenate the Anzali Wetland, effective catchment area management and governmental support are imperative, with particular emphasis on prioritizing the Pasikhan and Pirbazar rivers.

Mohammadreza Ojani is funded by the Stipendium Hungarian scholarship under the joint executive program between Hungary and Iran.

The study was elaborated under the research project NKFI K138079.

Keywords: Water Pollution, Anzali Wetland, Water Analyze, Rivers, Water chemical parameters

How to cite: Ojani, M., Ebrahimi, E., Kougir Chegini, Z., and Szabó, S.: Investigating the water quality of rivers entering the Anzali Wetland, EGU General Assembly 2024, Vienna, Austria, 14–19 Apr 2024, EGU24-12278, https://doi.org/10.5194/egusphere-egu24-12278, 2024.

Decades of agricultural intensification across Europe have created nitrogen legacy stores that continue to threaten the functioning of aquatic ecosystems and human health. Climate change and climate extremes further aggravate the fate of nitrogen export and retention in the terrestrial system (e.g., soil, groundwater, and rivers) - the extent of which is yet not fully understood. Herein we provide a continental-wide analysis of the projected changes in timings and extent of nitrogen-vulnerable regions across European landscapes. Our assessment relies on a newly devised objective measure based on a Damkoehler number -- that encapsulates the transient nature of hydrologic transport and biogeochemical transformations [1]. We perform a century-long, spatially explicit daily hydrologic simulations forced with a suite of bias-corrected and downscale climate model (CMIP6) runs driven under different emission scenarios (SSP126, SSP370, and SSP585) till the end of the 21st Century. These simulations allow us to derive the transport dynamics of dissolved nitrogen based on a transient aspect of travel-time distributions (TTDs) using temporally resolved water storage and fluxes. On the other hand, biogeochemical processes like denitrification rates are characterized by the first-order decay coefficients that are further modulated by spatially and temporally varying environmental factors imposed by moisture content and temperature constraints.  Contrasting the space-time dynamics of hydrological transport times with reactive timescales of denitrification in soil, our analysis indicates that more than two-thirds of the cultivated areas across Europe are potentially vulnerable to nitrate leaching for at least one-third of the year under the contemporary climate condition (1981-2010). Further, the climate projection-based simulation results indicate that under high emission scenarios (SSP585), arable lands in Central Europe would be more prone to nitrate leaching (times), while drier conditions in Southern Europe favor stronger denitrifications. Limiting climate warming by adhering to a low-emission scenario, such as SSP126, has the potential to decrease the vulnerability of regions to nitrate leaching (extent, duration, and load). By signifying the differentiated impacts of climate warming on nitrate leaching potential, our study contributes towards unraveling the complexity of nitrogen transport dynamics across a diverse range of European landscapes under changing climatic conditions.  

[1]  Kumar, R., Heße, F., Rao, P.S.C., Musolff, A., Jawitz, J.W., Sarrazin, F., Samaniego, L., Fleckenstein, J.H., Rakovec, O., Thober, S. and Attinger, S., 2020. Strong hydroclimatic controls on vulnerability to subsurface nitrate contamination across Europe. Nat Commun 11, 6302 (2020). https://doi.org/10.1038/s41467-020-19955-8.

How to cite: Kumar, R.: Signifying impacts of climate warming on vulnerability to subsurface nitrate contamination in Europe, EGU General Assembly 2024, Vienna, Austria, 14–19 Apr 2024, EGU24-13363, https://doi.org/10.5194/egusphere-egu24-13363, 2024.

EGU24-14005 | Orals | HS2.3.3

Pairing Traditional Approaches with High-resolution In-situ Sensors to Advance the Science of Nutrient Fluxes from Agricultural Catchments  

Gurpal Toor, Charles Burgis, Jesse Radolinski, Bradley Kennedy, Fajun Sun, Emileigh Lucas, and Patricia Steinhilber

Agricultural catchments are hot spots of nutrient (nitrogen, phosphorus) fluxes to downstream watersheds. New tools are needed to disentangle flow pathways, hot spots, and the interplay of nutrient dynamics. Yet, the constraints (cost, labor) have limited our ability to use the new tools to understand nutrient dynamics from land to water. The traditional approaches of water quality monitoring (grab or composite samples collected with autosamplers) remain the gold standard for water quality monitoring, although they yield limited information on the mechanistic controls of nutrient losses. This presentation will discuss how pairing the traditional approaches (such as autosamplers) with in-situ nutrient sensors in agricultural catchments furthered our understanding of hot spots, pathways, and stoichiometric controls on nitrate and orthophosphate losses and advanced the science of water quality monitoring in agricultural catchments.

How to cite: Toor, G., Burgis, C., Radolinski, J., Kennedy, B., Sun, F., Lucas, E., and Steinhilber, P.: Pairing Traditional Approaches with High-resolution In-situ Sensors to Advance the Science of Nutrient Fluxes from Agricultural Catchments , EGU General Assembly 2024, Vienna, Austria, 14–19 Apr 2024, EGU24-14005, https://doi.org/10.5194/egusphere-egu24-14005, 2024.

EGU24-14691 | Posters on site | HS2.3.3

Development of a Deep Learning Model for Harmful Algal Blooms Prediction 

Yookyung Jeong and Kyuhyun Byun

The risk of harmful algal blooms (HABs) is exacerbated by extreme climate and hydrologic events, as well as the increased non-point pollutant sources associated with agriculture and industrialization. The resulting deterioration in water quality due to the HABs poses significant threats to water management and aquatic ecosystems. HABs, in particular, emerge from intricate chemical interactions influenced by external conditions and diverse hydrologic and water quality factors.  Existing physical models encounter difficulties in predicting HAB occurrences and concentrations due to their limitations in addressing the intricate interactions of external environments and the characteristics of non-linear, non-stationary systems. In response to this challenge, we aim to develop a deep-learning algorithm based on the wavelet transform, with a focus on key hydrologic and water quality factors specific to the Nakdong River in South Korea. We identify water temperature and Chlorophyll-a as pivotal factors influencing HABs. Leveraging the wavelet transform, we extract denoised HAB data to enhance the robustness of our predictive model. Subsequently, we employ Long Short-Term Memory (LSTM) networks to construct a deep learning model, utilizing the identified key factors and denoised data as input features. Our preliminary results demonstrate a decent level of predictive accuracy showing a high Nash-Sutcliffe Efficiency (NSE) value of 0.88 and a low Root Mean Squared Error (RMSE) of approximately 9800 cells/ml, compared to the average HAB quantity of 14474 cells/ml. These outcomes indicate that the developed deep learning approach allows for accurate simulation of HAB. The implications of our research extend to the precise analysis of HABs, enabling the establishment of pre-emptive responses for effective water resources management.


Acknowledgment:

This work was supported by the National Research Foundation of Korea(NRF) grant funded by the Korea government(MSIT) (No. NRF-2022R1A4A3032838).

How to cite: Jeong, Y. and Byun, K.: Development of a Deep Learning Model for Harmful Algal Blooms Prediction, EGU General Assembly 2024, Vienna, Austria, 14–19 Apr 2024, EGU24-14691, https://doi.org/10.5194/egusphere-egu24-14691, 2024.

EGU24-15036 | Orals | HS2.3.3

Towards a data-effective calibration of a fully distributed catchment water quality model 

Michael Rode, Salman Ghaffar, Xiangqian Zhou, Seifeddine Jomaa, Xiaoqiang Yang, and Günter Meon

Distributed hydrological water quality models are increasingly being used to manage natural resources at the catchment scale but there are no calibration guidelines for selecting the most useful gauging stations. In this study, we investigated the influence of calibration schemes on the spatiotemporal performance of a fully distributed process-based hydrological water quality model (mHM-Nitrate) for discharge and nitrate simulations at Bode catchment in central Germany. We used a single- and two multi-site calibration schemes where the two multi-site schemes varied in number of gauging stations but each subcatchment represented different dominant land uses of the catchment. To extract a set of behavioral parameters for each calibration scheme, we chose a sequential multi-criteria method with 300.000 iterations.

For discharge (Q), model performance was similar among the three schemes (NSE varied from 0.88 to 0.92). However, for nitrate concentration, the multi-site schemes performed better than the single site scheme. This improvement may be attributed to that multi-site schemes incorporated a broader range of data, including low Q and NO3- values, thus provided a better representation of within-catchment diversity. Conversely, adding more gauging stations in the multi-site approaches did not lead to further improvements in catchment representation but showed wider 95% uncertainty boundaries. Thus, adding observations that contained similar information on catchment characteristics did not seem to improve model performance and increased uncertainty. These results highlight the importance of strategically selecting gauging stations that reflect the full range of catchment heterogeneity rather than seeking to maximize station number, to optimize parameter calibration.

How to cite: Rode, M., Ghaffar, S., Zhou, X., Jomaa, S., Yang, X., and Meon, G.: Towards a data-effective calibration of a fully distributed catchment water quality model, EGU General Assembly 2024, Vienna, Austria, 14–19 Apr 2024, EGU24-15036, https://doi.org/10.5194/egusphere-egu24-15036, 2024.

EGU24-15228 | Orals | HS2.3.3 | Highlight

Impacts of the transition to a Nordic bioeconomy on streamflow and nitrogen loads in the Odense Fjord Catchment, Denmark  

Brian Kronvang, Katrin Bieger, and Mette V. Carstensen

Downscaling and extending the global Socioeconomic Shared Pathways (SSPs) into a set of storylines focusing on the Nordic land-based bioeconomy (Nordic Bioeconomy Pathways (NBPs). In short, the NBPs stand for sustainability first (NBP1), conventional first (NBP2), self-sufficiency first (NBP3), city first (NBP4) and economy first (NBP5). Each of the five NBPs includes a set of linked agricultural and forestry attributes that provide a framework for the BIOWATER researchers for generating input data to catchment models by translating qualitative narratives into quantitative values by means of stakeholder workshops.

A societal transformation towards a bioeconomy in the Nordic countries will have extensive implications for the environment and might conflict with the goal of the European WFD to achieve good ecological status of the majority of European water bodies. This study aims to explore the environmental impact of different bioeconomy scenarios combined with climate change on a Danish estuary, the Odense Fjord. We used the Nordic Bioeconomy Pathways (NBPs), which describe five possible future scenarios for a Nordic bioeconomy in 2050, to identify plausible changes in land use in response to the transition. The catchment of the Odense Fjord is intensively farmed, so the attributes selected for this study included changes in farming intensity (chemical fertilizer and manure amount), land cover change (agriculture vs. forest), and nutrient loss mitigation (buffer strips and wetlands).

We used the catchment model SWAT to model the hydrology and nitrogen (N) dynamics in the intensively farmed River Odense catchment. The water monitoring at the river outlet is the most comprehensive in Denmark, and daily data recordings of N concentrations are available for the baseline period 2001-2008. The SWAT model setup for the River Odense catchment includes 23 sub-catchments and 3,882 Hydrological Response Units (HRUs). Scenarios for the baseline and four selected agricultural attributes with and without climate change (RCP4.5 and RCP8.5) were simulated for the period 2041-2070.

The NBP narratives were translated to quantitative values that can be modelled at catchment scale by local stakeholders. The semi-distributed Soil and Water Assessment Tool (SWAT) was used to simulate the land use and climate scenarios. First, extreme values of each attribute were simulated to ensure plausibility of the model response to the changes. Subsequently, the combined effects of all changes were quantified for each NBP with and without climate change. The differences in simulated streamflow between the five NBPs were very small, whereas the impact of the different pathways on the simulated nitrogen loads was more pronounced, especially during the winter months. In both climate change scenarios using the median of an ensemble of climate models conducted for the period 2041-2070, the average annual total N loads from the River Odense catchment decrease slightly in both RCP 4.5 and RCP 8.5. The NBP scenarios showed that the needed reductions in total nitrogen loads to the Odense Fjord for obtaining a good ecological quality could only be reached when following the trajectory of NBP1 being sustainable first scenario and including restoration of all previously drained wetlands in the catchment.

How to cite: Kronvang, B., Bieger, K., and Carstensen, M. V.: Impacts of the transition to a Nordic bioeconomy on streamflow and nitrogen loads in the Odense Fjord Catchment, Denmark , EGU General Assembly 2024, Vienna, Austria, 14–19 Apr 2024, EGU24-15228, https://doi.org/10.5194/egusphere-egu24-15228, 2024.

EGU24-15527 | ECS | Posters on site | HS2.3.3

Parameter Estimation of Oxygen Transfer at Hydraulic Structures  

Ashwini Tiwari, Kotnoor Hari Prasad, and Chandra Shekhar Prasad Ojha

Dissolved oxygen is an indicator of water quality, and a minimum of 4 ppm is required for the survival of aquatic life. The oxygen is transferred when water flows over the hydraulic structure by entraining air into the bulk of the flow. The entrained air breaks into small bubbles, increasing the surface area for oxygen transfer. The oxygenation of water removes organic matter, dissolved gases, volatile liquids, offensive taste, and odor, improving the quality of the water flowing in the rivers and streams. The oxygen transfer efficiency depends upon the liquid film coefficient and specific interface area. In this study, parameters, namely liquid film coefficient and specific interface area, are estimated from dissolved oxygen concentration data. The dissolved oxygen concentration data is generated using a liquid film coefficient of 500 m/s, a specific interface area of 0.00035 m2/m3, and dissolved oxygen saturation concentration at 250C. The Parameters are estimated through numerical inversion in which the numerical model representing oxygen transfer over hydraulic structure was optimized using genetic algorithm. The seed value used for optimization is taken as 0.6. The results show that it is not possible to estimate both the liquid film coefficient and specific interface area together from dissolved oxygen concentration data only, and at least one parameter should be known. This finding is supported by the presence of local minima in the liquid film coefficient-specific area parametric space.

How to cite: Tiwari, A., Hari Prasad, K., and Ojha, C. S. P.: Parameter Estimation of Oxygen Transfer at Hydraulic Structures , EGU General Assembly 2024, Vienna, Austria, 14–19 Apr 2024, EGU24-15527, https://doi.org/10.5194/egusphere-egu24-15527, 2024.

EGU24-16265 | ECS | Orals | HS2.3.3

In-stream measurements at low-flow reveals transport and denitrification patterns in the sub-surface 

Camille Vautier, Alexandre Coche, Jean-Raynald de Dreuzy, and Gilles Pinay

Excess nitrogen in surface and groundwater, mainly in the form of nitrates, is a major concern for all stakeholders, because it leads to the degradation of drinking water resources and to the eutrophication of ecosystems. The export of nitrogen from inland to the coast is strongly determined by the transport and denitrification processes occurring in headwater catchments. Yet, most regulatory frameworks, such as the EU Water Framework Directive, impose the monitoring of medium-to-large rivers (> 100 km2) while headwaters, too numerous to be systematically monitored, are poorly understood. Headwater catchments are often characterized by strong connections between surface water and shallow aquifers, leading to a high impact of sub-surface processes on river water quality. Understanding the processes occurring in the sub-surface is thus necessary to predict river water quality, but it remains a major challenge because of the difficult access to groundwater.

Here we propose a new approach to infer sub-surface processes in headwater catchments from in-stream measurements. In an agricultural catchment, we measured nitrate and silica along headwater streams fed by a crystalline shallow aquifer, during low-flow period. Silica was used as a proxy for water residence time. We observed several trends between the nitrate concentrations and the water residence times, interpreted as the result of distinct patterns of transport and denitrification in the sub-surface. Based on this case study, we propose a general framework to infer the processes occurring in the sub-surface from the resulting chemical trends observed in low-flow streams. Regarding the simplicity of the measurement method, this framework appears as a powerful tool for water management practices. Further studies in several areas in the world will allow to validate its broad applicability.

How to cite: Vautier, C., Coche, A., de Dreuzy, J.-R., and Pinay, G.: In-stream measurements at low-flow reveals transport and denitrification patterns in the sub-surface, EGU General Assembly 2024, Vienna, Austria, 14–19 Apr 2024, EGU24-16265, https://doi.org/10.5194/egusphere-egu24-16265, 2024.

EGU24-16334 | ECS | Posters on site | HS2.3.3

Impact of sewage treatment discharges on the water quality of receiving rivers 

Zihan Yang, Fred Worrall, and Julia L.A. Knapp

Most modern societies rely on rivers for both water supply and for disposal of waste. With increasing population there is increasing pressure on receiving rivers, and therefore, the aim of this study was to assess whether discharges from sewage treatments works (STWs) detrimentally impact the water quality of receiving rivers.


The approach of this study was to consider any sewage treatment works in England where there was a monitoring point above and below the STW discharge without any other input between these monitoring points. Any determinand could be expected to change downstream with or without the presence of a sewage works discharge, and therefore, the result from river reaches with a sewage discharge were compared to results from control river reaches where there was no sewage discharge present. Downstream changes were assessed relative to date factors; type of reach (control vs. sewage discharge reach); and individual river reach. In addition, for each river reach a series of covariates were also considered – distance between monitoring points; percentile river flow at time of sampling; and upstream altitude. Where significant, results for each sewage treatment works were compared to characteristics of the sewage treatment works to see whether particular treatment processes contributed to, or mitigated, any water quality impact on the receiving rivers. The determinands considered were stream temperature; nitrate; phosphate; biochemical oxygen demand (BOD); chemical oxygen demand (COD); pH; suspended solids.


The results show that:

  • Discharge from sewage treatment work significantly altered the temperature, BOD, COD, suspended solids, pH, nitrate, phosphate and specific conductance of the receiving river.
  • Comparing impact on water quality to the nature of the sewage treatment works showed that only stream temperature was significantly altered by the nature of the secondary treatment present at any works.
  • The size of the sewage treatment works, as judged by population equivalence and dry weather flow, had a significant impact on the magnitude of effect for all except nitrate.
  • principal component analysis showed that sewage treatment works grouped together according to their COD or according to their nutrient behaviours.


The study shows that the impact of sewage treatment works is widespread, independent of the range of technologies used. At the same time, that the results show that works were rarely a problem for both suspended solids or nutrients.

How to cite: Yang, Z., Worrall, F., and Knapp, J. L. A.: Impact of sewage treatment discharges on the water quality of receiving rivers, EGU General Assembly 2024, Vienna, Austria, 14–19 Apr 2024, EGU24-16334, https://doi.org/10.5194/egusphere-egu24-16334, 2024.

EGU24-16408 | ECS | Orals | HS2.3.3

Empirical large-scale evidence of algae growth control in rivers: Is total phosphorus control (still) a good management strategy? 

Alexander Hubig, Andreas Musolff, Alexander Wachholz, Markus Weitere, Tom Shatwell, Rohini Kumar, and Ulrike Scharfenberger

Since the 1980s, the problem of algae blooms in rivers as a manifestation of eutrophication has been addressed by lowering nutrient inputs with a specific focus on limiting phosphorus. Despite the past achievements in phosphorus control, algae blooms are still frequently occurring, not least during the recent European drought years, with partly severe consequences for river ecology. This implies that additional parameters may have become important in controlling eutrophication. Regarding river management, this raises the question of whether a sole focus on further improvements in phosphorus control is still a good management strategy. Alternatively, an embedding in a multiple-stressor approach from a riverscape perspective might be necessary, particularly with regard to climate-related changes in temperature and precipitation.

Here, we analyze a Germany-wide dataset of chlorophyll a (Chl-a) concentrations over the period from 2000 to 2019 at 358 sites (33489 measurements in total) to address the following questions: (1) Are there geographical regions particularly threatened by algae blooms? (2) How sensitive are different river locations to elevated total phosphorus (TP) levels regarding algae development? (3) Can we explain spatial sensitivity differences by other in-stream parameters or catchment characteristics?

To understand when and where rivers are particularly effective in converting TP into algae biomass and thus prone to algae blooms, we use the measure of the degree of realized eutrophication, which is the ratio between the realized (i.e. the Chl-a measurement) and potential eutrophication (i.e. a theoretical upper Chl-a concentration at a given TP level if all TP is converted to biomass). Spatial differences in this degree of realized eutrophication are then analyzed together with in-stream parameters (e.g. water temperature) and catchment characteristics (e.g. topography, land use) using multivariate statistics.

We find algae blooms (> 30 µg Chl-a/l) across all analyzed German river basins and stream orders, making up 21 % of all measurements from March to November. They most frequently occur in large rivers (stream order 6 to 8) in catchments draining to the Baltic Sea and in the Elbe basin, constituting 58 % and 60 % of the measurements, respectively. For all stations, the median degree of realized eutrophication is only 1.3 %, whereas for single stations, it can go up to 20 %, revealing a large variability between sites. Results from a partial least squares regression analysis suggest that catchment characteristics like network length, seasonality of precipitation, lithology, and soil properties have predictive power, whereas in-stream parameters only play a secondary role.

While phosphorus is a critical prerequisite for algae growth, our results emphasize that its availability alone does not explain the development of algae blooms. For management, this means that a look beyond phosphorus control is necessary for preventing future river eutrophication.

How to cite: Hubig, A., Musolff, A., Wachholz, A., Weitere, M., Shatwell, T., Kumar, R., and Scharfenberger, U.: Empirical large-scale evidence of algae growth control in rivers: Is total phosphorus control (still) a good management strategy?, EGU General Assembly 2024, Vienna, Austria, 14–19 Apr 2024, EGU24-16408, https://doi.org/10.5194/egusphere-egu24-16408, 2024.

EGU24-16580 | ECS | Posters on site | HS2.3.3

The effect of land surface characteristics on runoff generation and nitrate fluxes from a Kenyan tea plantation 

Aaron Neill, Suzanne Jacobs, Lutz Breuer, and Sim Reaney

The conversion of tropical montane forests to commercial plantation agriculture affects both the generation of runoff and nutrient water quality, degrading ecosystem service delivery and impacting downstream freshwater environments. Previous empirical studies have inferred that changes to nitrate dynamics at the catchment scale likely reflect the interplay of local topography and climate, crop characteristics (e.g., type and density), fertiliser usage and soil management practices. However, the relative importance of such factors is not well understood. Through the 20th century, the Mau Forest Complex in Kenya experienced dynamic and rapid land use change, including the conversion of pristine forest to commercial tea and tree plantations. Utilising a unique long-term (2015-2021), high-resolution (10-minute) discharge and nitrate dataset collected for such a plantation (33.3 km2), we developed a simple, semi-distributed conceptual model to disentangle the drivers of runoff generation and nitrate fluxes. Insights from weekly stable water isotope data helped to further constrain simulated flow paths. The model represented the main land surfaces of the plantation (tea, eucalyptus, compacted tracks, and impervious and built surfaces) as a set of conceptual stores. Rainfall inputs were weighted by the proportional area of each surface and, where relevant, fertiliser inputs were estimated based on application rates reported in the literature. Lateral water and nitrate fluxes from each conceptual store to the river were delayed and transformed as a function of the mean distance to the river and slope gradient. The available long-term data combined with the structure of the model allowed the relative contribution of each land surface to runoff and nitrate fluxes to be successfully simulated under a range of local hydroclimatic conditions. These insights provide a valuable knowledge base for optimising fertiliser use and implementing mitigation measures to sustain water quality and ecosystem service delivery under conditions of expanding plantation agriculture. 

How to cite: Neill, A., Jacobs, S., Breuer, L., and Reaney, S.: The effect of land surface characteristics on runoff generation and nitrate fluxes from a Kenyan tea plantation, EGU General Assembly 2024, Vienna, Austria, 14–19 Apr 2024, EGU24-16580, https://doi.org/10.5194/egusphere-egu24-16580, 2024.

EGU24-17232 | ECS | Orals | HS2.3.3

Disentangling the water quality dimension of the Water-Energy-Food nexus in the Adige river basin (Italy) 

Anna Sperotto, Mathilda Vogt, Stefano Balbi, Ferdinando Villa, and Andrea Critto

Understanding and effectively managing water quality within the context of global changes necessitates a nexus approach that embraces the interconnected facets of the water-energy-food-environment system. This perspective acknowledges the intricate interplay between diverse processes—physical, chemical, biological, ecological—and human activities that collectively influence water quality. Climate change can impact these components individually and interactively, leading to cascading effects. Only by considering the whole system, including both natural and human factors, we can capture complexity understanding multiple stressors and feedback loops that affect water quality.

One of the major challenges of adopting a nexus approach for water quality assessment is primarily represented by the need to access and combine data and model from many different scientific domains which often remains compartmentalized in silos, to pre-defined scales and fields, into a single, logically consistent integrated framework of analysis. Leveraging integrative technology like Artificial Intelligence emerges as a viable solution to foster this integration permitting to maximize the value of available information. A systemic integrated model for the assessment of the conjoined impacts of climate and land use changes on water quality has been developed and tested at the catchment scale in the Adige river basin in Northern Italy. The model is developed using ARIES (Artificial Intelligence for Environment and Sustainability), an open-source Artificial Intelligence modeler which, using semantics and machine reasoning, allows independently developed models and data to be integrated and automatically assembled into workflows running at the scale most appropriated for the context of analysis. Once trained and validated the model permits to: i) predict the impact of different climate change and land use scenarios on water and ecological quality indicators (e.g. nutrients, suspended solids, water temperature, dissolved oxygen, ecological status); ii) identify sources and hot spots of pollution related with different economic sectors in the catchment; iii) test pollution reduction measures permitting to minimise trade-offs between economic activities and ecosystem health. By presenting the preliminary outcomes of pilot application, this analysis aims to showcase the potential of AI-driven approaches in enhancing data reusability and interoperability, crucial for comprehensively addressing environmental quality challenges and modelling intricate anthropic-environmental interactions at the catchment scale.

How to cite: Sperotto, A., Vogt, M., Balbi, S., Villa, F., and Critto, A.: Disentangling the water quality dimension of the Water-Energy-Food nexus in the Adige river basin (Italy), EGU General Assembly 2024, Vienna, Austria, 14–19 Apr 2024, EGU24-17232, https://doi.org/10.5194/egusphere-egu24-17232, 2024.

Assessment of water quality impacts of rainforest disturbance and land-use change on water quality in the wet tropics is hampered by the technical difficulty and prohibitive costs of collection of multi-catchment high-frequency streamflow and water quality datasets for a period of record that covers a sufficiently representative range of storm events and preceding weather and baseflow conditions. This problem is magnified in agricultural plantation areas, where water quality responses in storm events vary also with the nature of management practices, including time since fertilizer application.  There has also been little focus on impacts of land-use history such as multiple phases of logging and mature agricultural plantation.  This paper addresses these issues using a novel classification of  daily C-Q (solute concentration – specific discharge) patterns in a multi-catchment study in eastern Sabah, Malaysian Borneo. The five small (1.7 – 4.6 km2) study catchments  lie in the upper reaches of the Brantian, Kalabakan and Segama river systems within the 10,000 km2 Yayasan Sabah Forest Concession area, where rainforest since the 1970s has been either (1) selectively logged (and left to recover) up to three times, (2) subsequently converted to oil plantations, or (3) protected as primary forest in three large Conservation Areas (Danum Valley, Maliau Basin and Imbak Canyon) or as near-primary forest in  smaller Virgin Jungle Reserves.  Two of the study catchments are under primary  and near-primary rainforest; two are under forest recovering from two and three episodes of selective logging respectively; and the final catchment is covered by mature (>20 year-old) oil palm.  Annual rainfalls for the catchments are 2500-2880 mm.  Water depth, conductivity and turbidity sensors linked to Campbell data loggers have recorded readings at 5-minute intervals in each catchment from 2011. Catchment-specific solute concentration/specific conductance and stage-discharge relationships were used to derive the 5-minute solute concentration (C, mg L-1) and specific discharge (Q, m3 km-2 s-1) data series.  To compare their water quality dynamics, C-Q  relationships for each day over the 22-months period November 2011 to August 2013 were analysed for each catchment.  For each day, the correlation coefficient (r) and slope (b) of the best-fit logC-LogQ regression were calculated and graphs of Log C/Log Q scatter and  C and Q against time were produced.  Days were divided into Storm Days and Recession/Baseflow Days. A typology of C-Q patterns (eight Storm Day and four Recession/Baseflow Day types) was devised using: the r and b values; (for Storm Days) the order and relative dominance of any dilution and flushing response features; and (for Recession/Baseflow Days) the ranges in Q and C values.  Each day of each data series was classified and percentage frequency distributions of C-Q types for each catchment were derived and compared.  The frequency distribution of the oil palm catchment is markedly different (fewer “dilution” and more “flushing” storm days) than for the forested catchments  - which  can be linked to fertilizer sources and lower baseflows of the oil palm catchment. Lesser, but important differences between the forested catchments are also identified and discussed.    

How to cite: Walsh, R., Mazilamani, L. S., Annammala, K. V., and Nainar, A.: Exploring impacts of rainforest disturbance history and conversion to oil palm on water quality dynamics in eastern Sabah using a novel concentration-discharge pattern approach, EGU General Assembly 2024, Vienna, Austria, 14–19 Apr 2024, EGU24-17237, https://doi.org/10.5194/egusphere-egu24-17237, 2024.

Nutrient emission modeling in river basins includes the estimation of nutrient fluxes and retention in streams and forms a vital part for the management of water resources as well as the exploration of ecological impacts of increased nutrient input in river systems. The nutrient emission model MONERIS (Venohr et al., 2011, Lemm et al., 2021) calculates landuse-specific nutrient fluxes for entire river basins on a monthly basis and a spatial resolution of 1km x 1km and requires an ensemble of input data such as land use, atmospheric deposition, tile drainage cover, connection to sewer systems, and many more. Hydrological flows majorly drive nutrient fluxes and emission pathway composition. Consequently, runoff is one of the key constituents that needs to fit to the emission model requirements in terms of represented pathways and environmental compartments (e.g. land-use types, groundwater-surface water boundaries, spatial-temporal resolution). Using available runoff data derived by third party models can introduce large uncertainties to the resulting nutrient fluxes and water quality. Our aim was to develop a novel runoff model that operates on a monthly basis, provides runoff components for all considered emission pathways and can be applied with commonly available input data. These include, beyond the typical hydrological components (snow storage/melt, surface runoff, natural/artificial interflow, lower interflow and groundwater), flow estimates from urban areas (separate sewers, combined sewer overflows, decentralized/large treatment plants, point sources). The overall goal is to set up a data base for a Europe wide water quantity and quality model. In the presented pilot study, the runoff model was applied to the Odra River Basin (119,000 km²), calibrated against observed runoff data from 11 independent upstream gauges, and validated by runoff data from 36 additional gauges for the years 2010-2020. We compared input data sensitivity and model performance of three available daily gridded precipitation and air temperature datasets (E-OBS, EURADKLIM and CHELSA). Results showed a good model accuracy (NSE: > 0.9, PBIAS: < 7 %) and suggest that, despite its simplicity, the runoff model complements the nutrient emission model MONERIS. The next step will be the modelling of water quantity and quality for Central Europe, and, ultimately, providing an open modelling platform that allows emission modelling of other parameters and substances (e.g. salinity, heavy metals or priority substances) or be extended by additional modules for phytoplankton growth or floodplain retention.

How to cite: Oprei, A., Huk, V., and Venohr, M.: Developing a straightforward precipitation-runoff model for monthly-based nutrient emission modeling in river systems, EGU General Assembly 2024, Vienna, Austria, 14–19 Apr 2024, EGU24-18321, https://doi.org/10.5194/egusphere-egu24-18321, 2024.

EGU24-18655 | ECS | Posters on site | HS2.3.3

Enhancing the HYPE model for simulating dissolved organic carbon in inland surface waters 

Renkui Guo, Martin Berggren, and Zheng Duan

Dissolved Organic Carbon (DOC) in inland surface waters constitutes a significant component of the global carbon cycle, responsible for over half of the carbon transport from terrestrial ecosystems to the ocean. Computational modelling provides an effective method for monitoring spatial and temporal DOC dynamics in inland surface waters, beyond the limited information from in-situ measurements that are often sparse. Numerous process-based models have been developed for simulating DOC in inland surface waters. A common model structure for inland water DOC simulation is to simulate the soil carbon and its subsequent transport to the aquatic environment. Consequently, those models tend to have a complex terrestrial carbon module and comprehensive DOC transport processes from terrestrial to aquatic ecosystems, while their aquatic carbon simulation processes are often simplified. However, such simplification lead to insufficient representation of the interactions, which limits the model capability and undermines our understanding of complete DOC processes and dynamics.

The Hydrological Predictions for the Environment (HYPE) model, a process-based semi-distributed hydrological model developed by the Swedish Meteorological and Hydrological Institute (SMHI), is capable of simulating water quantity (e.g., daily streamflow) and water quality (e.g., nitrogen, phosphorus and carbon concentrations) at various scales. The HYPE model has been validated with reported good performance across the world and it is used by SMHI to provide many operational services in entire Sweden. The HYPE model is among the models that simplify the aquatic organic carbon cycle; it only considers primary production, mineralization, and sedimentation in the DOC simulation. This study aims to enhance the organic carbon module of the HYPE model by improving its presentation of aquatic carbon processes. Specifically, we will develop inclusion of additional key carbon pools and their interactions. For instance, two algae pools (upper and lower) would be added with consideration of algae mortality; the particulate organic carbon would be included in the carbon cycle; the inorganic carbon transport from the soil profile would be considered. As a result, the enhanced HYPE model will be able to represent more detailed aquatic carbon processes. The enhanced HYPE model will be tested in the Krycklan catchment in northern Sweden and several catchments in southern Sweden. Model performance will be evaluated at different timescales with commonly used metrics such as Kling-Gupta efficiency and Nash-Sutcliffe efficiency. We will also perform detailed analyses of parameter sensitivity and model uncertainty. Our study research presents a progressive step in the modelling efforts towards a better DOC simulation and prediction of carbon transport at the catchment scale, which helps us eventually obtain a deeper understanding of DOC dynamics in inland surface waters.

How to cite: Guo, R., Berggren, M., and Duan, Z.: Enhancing the HYPE model for simulating dissolved organic carbon in inland surface waters, EGU General Assembly 2024, Vienna, Austria, 14–19 Apr 2024, EGU24-18655, https://doi.org/10.5194/egusphere-egu24-18655, 2024.

EGU24-18836 | ECS | Posters on site | HS2.3.3

Proactive management of dissolved organic carbon (DOC) in drinking water catchments  

Ana Lucia Amezaga-Kutija, David Werner, Adam Jarvis, and Stewart Waugh

High levels of organic matter in drinking water catchments are a hazard as there is a known correlation between the presence of organic matter and the formation of trihalomethanes (THMs) during the chlorination stage of water treatment. Organic matter is quantified through the measurement of dissolved organic carbon (DOC) in water.  THMs are potential harmful for human consumption and regulated in drinking water standard, therefore additional chemical loads are required in water treatment to removed THMs which is costly for water companies. Temperature is also known to have a correlation with the formation of THMs during chlorination and the presence of DOC in catchments, meaning this hazard may increase in the future with the predicted changing climate.

This study investigates the potential to proactively manage DOC within a drinking water catchment before drinking water treatment to reduce the risk of THM formation during chlorination. The study focuses on a specific catchment in Northumberland, UK, which includes a reservoir that feeds directly into a drinking water treatment plant. A yearlong monitoring scheme is currently being carried out to discover the dynamics of DOC fluxes throughout the catchment and establishing the pathways and sources of DOC loads. Results so far show that for the main tributary to the reservoir DOC loads vary from 65.01Kg/day in normal conditions to 14402.24kg/day in high rainfall, storm conditions. The data collected is being used to determine relationships between DOC load, land use, land management and climate. These relationships will later be utilized in a model which will be used to simulate various scenarios including some future climate analysis. The final aim of the study is to produce a catchment management plan and business plan considering potential DOC load management methods, stakeholder involvement and scenario analysis.

How to cite: Amezaga-Kutija, A. L., Werner, D., Jarvis, A., and Waugh, S.: Proactive management of dissolved organic carbon (DOC) in drinking water catchments , EGU General Assembly 2024, Vienna, Austria, 14–19 Apr 2024, EGU24-18836, https://doi.org/10.5194/egusphere-egu24-18836, 2024.

EGU24-18838 | ECS | Orals | HS2.3.3

Integrated assessment of climate change impacts on transitional waters and the role of nature-based solutions in regulating water quality 

Asrat Tekle Asresu, Elisa Furlan, Fabienne Horneman, Ngoc Diep Nguyen, Silvia Torresan, Federica Zennaro, Donata Canu, Leslie Aveytua Alcazar, Celia Laurent, Cosimo Solidoro, Antonio Marcomini, and Andrea Critto

Transitional environments are particularly susceptible to multiple pressures like climate change, land use or pollution that can lead to the deterioration of their water quality (WQ) and ecosystem services. Nature-based solutions (NBS) can be implemented as adaptation strategies essential for maintaining WQ regulation. Numerical models offer valuable support to understand the WQ dynamics of transitional environments and the influence of NBS, together with the evaluation of the effects induced by interacting stressors and different management schemes. The Venice lagoon is a transitional environment of great ecological and socio-economic value where NBS are at play through salt marsh restoration programs. A literature review revealed that current assessments and modelling approaches of the effects of NBS on WQ are characterized by the analysis of short-term observations, lack of integration of multiple ecosystem processes, as well as limited consideration of catchment scale management strategies. Considering these challenges, a new WQ modelling system will be developed for the Venice Lagoon by integrating a vegetation module for saltmarshes into an existing coupled hydrodynamic-biogeochemical model. The vegetation module will represent the effects of NBS, i.e. saltmarshes restoration measures, in order to evaluate their role and effectiveness in regulating WQ through their influence on the hydrodynamics, as well as the nutrient and carbon cycle associated with the distribution, growth, and mortality of saltmarsh vegetation. Onsite monitoring of WQ indicators linked to eutrophication processes in relation to climate-related stressors, hydro-morphodynamic processes, and implementation of restoration activity will be utilized to support and validate the modeling methodology. For this purpose, automatic recording instruments with high temporal resolution have already been placed providing data on different WQ parameters that can be related to hydrodynamic conditions and the ongoing restoration activities. Furthermore, the designed model will support the evaluation of WQ changes in the Lagoon against future climate change scenarios and several ‘what-if’ scenarios representing different NBS, thereby informing management and adaptation decision-making processes. 

Keywords

Climate change impacts, multi-hazards, transitional ecosystem, water quality, eutrophication, integrated modelling, nature-based solutions, salt marshes, biogeochemistry, Venice Lagoon

How to cite: Asresu, A. T., Furlan, E., Horneman, F., Nguyen, N. D., Torresan, S., Zennaro, F., Canu, D., Alcazar, L. A., Laurent, C., Solidoro, C., Marcomini, A., and Critto, A.: Integrated assessment of climate change impacts on transitional waters and the role of nature-based solutions in regulating water quality, EGU General Assembly 2024, Vienna, Austria, 14–19 Apr 2024, EGU24-18838, https://doi.org/10.5194/egusphere-egu24-18838, 2024.

EGU24-19496 | ECS | Posters on site | HS2.3.3

Cost-effective based Water Quality Monitoring Network design algorithm and  WebGIS Platform 

Jiping Jiang, Wenjing Meng, Qian Liang, and Ashish Sharma

The Water Quality Monitoring Network (WQMN) design is most empirical in practices so far. Design parameters includes water quality indicators, monitoring sites, and sampling frequency, which are all linked to the cost. Among them, location is the most important, which directly affects the accuracy of data and the budget. Previously studies few considered the cost of monitoring stations in the optimization objectives, while means a design in practice need to meet the maximum budgets requirements.  This study main considers this kind of restriction for optimize the response effective of the network as if the pollution events comes.

Therefore, the basic idea is straightforward:(1) minimizing the total cost of water quality monitoring stations and (2) minimizing the average detection time of the contamination events. The candidate sets of monitoring locations are selected by topology at first. The stations are represented by an adjacency matrix L of river network, wherein the element Lij indicates whether the i-th station is adjacent to the j-th station. The velocity of each river section between stations is represented by matrix V.

The average detection time Tr of the network is calculated.


Where the distance of each station is represented by matrix D, in which the element Dij means the distance. N means the number of river sections.The total cost of stations C is calculated by the formula.


The cost required to treat the contaminated water L is calculated by the following formula.


Where means the cost of sewage treatment per unit mass,  Qvij means river discharge.

The optimization formula F is summarized by the formula.


The F value of all potential observation stations is calculated, and the smallest F is the best site. We may also consider the risks distribution among each river reach, descripted by a matrix of R,  according to the local knowledge on pollution sources.

Besides, it integrated a GIS-based module that can automatically identify the necessary of parameters, and calculating the optimal locations and number of monitoring sites. It does not rely on water quality monitoring records, nor on hydraulics. We take Maozhou River in Shenzhen, China, as an example to demonstrate the usability of the WQMN design tool and algorithm. A map of monitoring network is successfully produced with the number of WQMN stations reduced to 38. The platform for global application will be online soon for testing.


How to cite: Jiang, J., Meng, W., Liang, Q., and Sharma, A.: Cost-effective based Water Quality Monitoring Network design algorithm and  WebGIS Platform, EGU General Assembly 2024, Vienna, Austria, 14–19 Apr 2024, EGU24-19496, https://doi.org/10.5194/egusphere-egu24-19496, 2024.

EGU24-20758 | Posters on site | HS2.3.3

Development of a Web-Based Decision Support System for Watershed-Scale Agricultural Conservation Management in the United States 

Yavuz Ozeren, Luc Rébillout, Ahmet Sahin, Nuttita Pophet, Mohammad Al-Hamdan, and Ron Bingner

An automated Web-based decision support tool, Agricultural Integrated Management System (AIMS) is developed to evaluate the impacts of agricultural and channel conservation management practices within any watershed in the United States. AIMS offers a user-friendly Web-GIS framework, enabling convenient interaction with geospatial data layers, automated input data preparation for AnnAGNPS model and visualizing watershed simulation results on any device with internet access. AIMS uses the watershed-scale simulation tool of the USDA Agricultural Research Service (ARS), the Annualized Agricultural Non-Point Source Pollution (AnnAGNPS) model to estimate the runoff, sediment, nutrients, and pesticides that may originate from agricultural areas and impact water quality in rivers, streams, and other water bodies. Running the AnnAGNPS model requires various datasets including topographic, soil, land use and land cover, climate, management data. The topographic data consists of concentrated flows (reaches) and sub-catchments (cells) which are delineated for the entire United States using TopAGNPS, a topographic parameterization program for AnnAGNPS. Soil data is obtained from NRCS Soil Data Access service and processed to produce aggregated data for AnnAGNPS. Historical climate data is derived from the North American Land Data Assimilation System Phase 2 (NLDAS-2) obtained from Hydrology Data Rods. Where NLDAS-2 is unavailable or incomplete, the climate data is supplemented using Daily Surface Weather and Climatological Summaries (DAYMET). The land use data includes the spatial information about the land cover (such as crops) and the management data includes the agricultural operation (such as scheduling of tillage, planting, fertilization, harvesting etc.) performed in the region. The assimilation of the management data to AIMS is currently underway. This presentation summarizes the development of the AIMS framework, dataset preparation for the models, and displays the capabilities of AIMS.

How to cite: Ozeren, Y., Rébillout, L., Sahin, A., Pophet, N., Al-Hamdan, M., and Bingner, R.: Development of a Web-Based Decision Support System for Watershed-Scale Agricultural Conservation Management in the United States, EGU General Assembly 2024, Vienna, Austria, 14–19 Apr 2024, EGU24-20758, https://doi.org/10.5194/egusphere-egu24-20758, 2024.

EGU24-20859 | Posters on site | HS2.3.3

Nitrogen sources, retention and exports in the Hunze, Rhine and Elbe river basins 

Xiaochen Liu, Luuk van der Heijden, Joachim Rozemeijer, Tineke Troost, and Anouk Blauw

The study focused on simulating the long-term flux of Nitrogen (N) from source to mouth in the Hunze, Rhine, and Elbe river basins. This was achieved by integrating models that encompass hydrology, nutrient input to surface water, and in-stream retention. The aim was to comprehensively understand the spatial and temporal distribution of N sources, soil budget, delivery to streams, and in-stream retention across these basins. Notably, significant improvements in water quality were observed in these rivers following decades of efforts aimed at reducing nutrient pollution from agricultural and sewage sources. These improvements have brought the water quality close to the EU standard of 2.5 mg/L. However, it was observed that post-2000, the decline in N concentration stagnated. This study elucidates the long-term dynamics of N sources and their contribution to surface water in the three basins. The findings, which offer a spatially explicit nutrient source allocation, are crucial for strategically targeting nutrient reduction policies to foster sustainable water quality management.

How to cite: Liu, X., van der Heijden, L., Rozemeijer, J., Troost, T., and Blauw, A.: Nitrogen sources, retention and exports in the Hunze, Rhine and Elbe river basins, EGU General Assembly 2024, Vienna, Austria, 14–19 Apr 2024, EGU24-20859, https://doi.org/10.5194/egusphere-egu24-20859, 2024.

Reducing nutrient inputs from land-based anthropogenic pollutions is a crucial task to enhance the water quality and maintain the ecological functionality. This study aims to develop a novel method for allocating the total load reduction task to different administrative zones considering the economic and social benefits and water quality effects of each zone, taking the Mainstream of Liao River Watershed (MLRW) in China as an example. The soil and water assessment tool (SWAT) was employed as a water quality model to quantify nutrient load contributions from each pollution source and predict the water quality responses to various allocation schemes. Four load allocation schemes were developed based on environmental efficiencies calculated by Data Envelopment Analysis (DEA) and load contributions of different zones. The impacts on environmental (nutrient load), economic (GDP) and social (crop yield) benefits of the watershed were evaluated. To ensure the equality of allocation results, the environmental Gini coefficient was used to examine the equality level. The results indicated that crop planting was the largest pollution source to total nitrogen (TN), accounting for 48.7%, while animal breeding was the largest pollution source to total phosphorus (TP), accounting for 46.0%. The allocation schemes involving the environmental efficiencies were found to enhance economic and social benefits compared to those solely considered the load contributions of zones. For maximizing economic benefits, the most suitable pollution load reduction scheme involves using economic-environmental efficiency as the adjustment factor for allocation proportion. Likewise, for maximizing social benefits, the preferred scheme is to incorporate the social-environmental efficiency. The pollution load reduction scheme incorporating economic-social-environmental efficiency serves as a balanced compromise, addressing both economic and social benefits. The Gini coefficients of the four schemes were below 0.4, affirming adherence to the equality principle. The analysis framework used in this study provides decision-makers with the flexibility to select allocation schemes tailored to their specific needs when formulating water quality management strategies.

How to cite: Cong, M., Xin, Z., and Zhang, C.: Allocation of total load reduction considering the social-economic benefits and water quality impacts of subregions, EGU General Assembly 2024, Vienna, Austria, 14–19 Apr 2024, EGU24-21775, https://doi.org/10.5194/egusphere-egu24-21775, 2024.

EGU24-21783 | Posters on site | HS2.3.3

Efficiency of Azolla pinnata in Purifying Treated Wastewater in Lebanon via Phytoremediation as a Nature-Based Solution 

Farah Kamaleddine, Rabi Mohtar, Sandra Yanni, Imad Keniar, and Rania Bou Said

Irresponsible wastewater management has caused water pollution to increase to alarming levels in Lebanon. This is compounded by the economic hardships that have forced several wastewater treatment plants (WWTPs) to either shut down their operations or be inconsistent with the treatment level. Given the unsustainable performance of centralized WWTPs and
their vulnerability to economic shocks, integrating nature-based solutions such as phytoremediation has become essential. As such, this study evaluates the potential of growing Azolla pinnata, a floating fern (macrophyte), for the purification of primary,
secondary and tertiary TWW through phytoremediation. Two seasons of experiments were conducted to study the temporal variation in the physicochemical properties of water, nutrient removal efficiency, sediment composition, biomass composition and economic feasibility. All nutrients that were considered in this study were reduced in the presence of A. pinnata in TWW, except for nitrates and sodium. The highest nutrient removal efficiencies were observed in the primary TWW, with an average of 97% for ammonium, 88% for orthophosphates and 90% for potassium. Additionally, chemical oxygen demand (COD)
decreased between 66-86% in the three TWW types. This reduction has been negatively correlated with dissolved oxygen (R= -0.683, p-value=0.000). The results of the phosphorus (P) mass balance have shown that 74% of the P was fixed by Azolla in primary TWW, out of 84% P removal efficiency. In contrast, only an average of 60% and 64% P was absorbed by Azolla in STWW and TTWW out of 100% and 95% P removal efficiency, respectively. Although Azolla has a rich nutritional value, the economic assessment has shown little economic savings from its use in animal feed. Further studies on the expansion of this
technique, microbial and heavy metals contamination in Azolla, palatability of Azolla by different animals, disposal of sediments and the utilization of the Azolla biomass are needed.

How to cite: Kamaleddine, F., Mohtar, R., Yanni, S., Keniar, I., and Said, R. B.: Efficiency of Azolla pinnata in Purifying Treated Wastewater in Lebanon via Phytoremediation as a Nature-Based Solution, EGU General Assembly 2024, Vienna, Austria, 14–19 Apr 2024, EGU24-21783, https://doi.org/10.5194/egusphere-egu24-21783, 2024.

EGU24-215 | ECS | Posters on site | HS2.3.5

Sewage Derived Microplastic and Anthropogenic Fibre Retention by Integrated Constructed Wetlands  

Richard Warren, Richard Cooper, Andrew Mayes, Stefanie Nolte, Kevin Hiscock, and Jonah Tosney

High loads of microplastics and anthropogenic fibres can be discharged from wastewater treatment plants (WWTPs) into surface water bodies. Integrated Constructed Wetlands (ICWs) are potentially well suited to provide a cost-effective mitigation solution at small WWTPs where conventional treatment is prohibitively expensive. ICWs consist of a series of connected ponds (receiving all of their inflow from WWTP effluent) that are planted with diverse native vegetation, and are thus designed to improve downstream water quality. This study aimed to assess the microplastic and anthropogenic fibre retention efficiency of two ICWs (Northrepps and Ingoldisthorpe) in Norfolk (UK) over a 12-month period. Water samples were collected at approximately monthly intervals from the inlet and outlet of each wetland (n = 54) between June 2022 and May 2023, and fine bed sediment samples were collected from the Northrepps ICW (n = 23). Northrepps ICW received on average 351,588 (± 223,986) anthropogenic fibres day-1, with a retention rate of 99.3 %. No seasonal variation was observed in retention efficiency. Ingoldisthorpe ICW intermittently received anthropogenic fibres in low concentrations, with an average of 11,448 (± 518) day-1 and a retention rate of 100 %. Microplastics and anthropogenic fibres were prevalent in sediment samples of the first cell of Northrepps ICW, averaging 10,090 items kg-1 dry sediment, while none were found at concentrations above the limit of detection in the second or third cell. Of the 369 fibres analysed by ATR-FTIR, 55 % were plastic (dominated by polyester). Of the 140 suspected microplastic fragments analysed by ATR-FTIR, 73 % were confidently identified as plastic (mostly polystyrene, polyethylene, or polypropylene). This study demonstrates how ICWs can effectively retain sewage effluent derived microplastics and anthropogenic fibres. However, the accumulation of plastic waste in ICWs may complicate long term management and their cost-effectiveness. Research into the minimum size of the first cell to ensure that microplastics are retained within a small area of the overall wetland is recommended to improve long term management prospects.

How to cite: Warren, R., Cooper, R., Mayes, A., Nolte, S., Hiscock, K., and Tosney, J.: Sewage Derived Microplastic and Anthropogenic Fibre Retention by Integrated Constructed Wetlands , EGU General Assembly 2024, Vienna, Austria, 14–19 Apr 2024, EGU24-215, https://doi.org/10.5194/egusphere-egu24-215, 2024.

EGU24-1759 | ECS | Posters on site | HS2.3.5 | Highlight

Buttertubs spilled during the July 2021 flood as plastic transport tracers in the Dutch Meuse river 

Rahel Hauk, Martine van der Ploeg, Adriaan J Teuling, Winnie de Winter, and Tim HM van Emmerik

Rivers play a substantial role in plastic pollution transport and storage but the transport processes that determine macroplastic fate in the riverine environment are not fully understood yet. Usually it is unknown when and where specific plastic litter items entered the environment, therefore macroplastic transport is often studied via e.g. GPS trackers. However, the July 2021 flood provided an unique opportunity of spilled macroplastic items, with clearly known time and space of emission.
In July 2021 severe floods affected multiple European river catchments, including the Meuse catchment in Belgium. A dairy company located at the Meuse tributary Vesdre was flooded, with parts of their facilities and a lot of material washed away. Among the washed away material was also ~8 million empty dairy packages ("buttertubs"), which have a printed ID code that can be traced to their emission point. During macroplastic sampling immediately after the flood event, and in the following two years, we found 617 of these buttertubs along the Dutch section of the Meuse river (~66 - 328 km downstream of the dairy company). We used the buttertubs as tracers for macroplastic transport in the period that includes the flood event, and the following two years. Within 20 days of the flood event, some of the buttertubs were transported ~328 km and were found close to the Rhine-Meuse-Delta. However, the majority of buttertubs was transported less than 100 km within these 20 days, with an average transport distance between 9.75 - 18.25 km/day. Over the following two years the average transport distance decreased to 0.23 km/day. Which could imply that the buttertubs either were only transported across smaller distances in the following two years, or even not remobilized at all after being deposited during the flood event. Some of the buttertubs we also collected, and we investigated their mass and fragmentation development over time. 
In this unique opportunistic study, we found that the buttertubs mean transport distance moved downstream over the course of two years. The majority of them however, was deposited rather close to their emission point, even given the extreme flood situation. 

How to cite: Hauk, R., van der Ploeg, M., Teuling, A. J., de Winter, W., and van Emmerik, T. H.: Buttertubs spilled during the July 2021 flood as plastic transport tracers in the Dutch Meuse river, EGU General Assembly 2024, Vienna, Austria, 14–19 Apr 2024, EGU24-1759, https://doi.org/10.5194/egusphere-egu24-1759, 2024.

EGU24-1963 | Orals | HS2.3.5

A numerical model of microplastic transport for fluvial systems 

John Armitage and Sébastien Rohais

Rivers are the primary pathway of microplastic pollution from source to the eventual sink in the marine environment. However, like sediments, microplastic will become trapped within the fluvial system as it makes its way from source-to-sink. There is therefore the potential that rivers are an important reservoir of microplastic pollution globally. To explore the transport of microplastic through the fluvial system we develop a reduced complexity model of microplastic erosion, transport, and deposition that builds on methods developed for the transport of sediment. We apply this model to the river Têt, France, where there has been punctual monitoring of the flux of microplastic at the outlet. We find that the reduced complexity model captures the observed quantity of microplastic under reasonable assumptions of the relationship between microplastic sources and population density. The model that best matches observed fluxes of microplastic at the outlet of the Têt river requires between 1 and 10 ppm volume concentration of microplasitc per 200 × 200 m in the top half a meter of soil. This concentration of microplastic then travels within the river network with a settling velocity of between 10-4 and 10-6 m/sec. The model results imply that a large proportion of microplastic will become entrained within the sediments along the fluvial system. This model is a first step in assessing where to sample for microplastic pollution within river networks and points to regions susceptible to microplastic pollution.

How to cite: Armitage, J. and Rohais, S.: A numerical model of microplastic transport for fluvial systems, EGU General Assembly 2024, Vienna, Austria, 14–19 Apr 2024, EGU24-1963, https://doi.org/10.5194/egusphere-egu24-1963, 2024.

EGU24-2033 | ECS | Orals | HS2.3.5 | Highlight

Domestic waste management strategies to reduce future river export of macro- and microplastics to the coastal waters of Africa 

Musadiq Usman, ilaria Micella, and Maryna Strokal

The level of concern regarding plastic pollution within aquatic ecosystems has surged in recent years. The African continent is urbanizing more rapidly than other regions of the world with many countries experiencing a shift from predominantly rural populations to having more than half of their populations living in urban areas. Despite the stunning rate of urbanization and the undeniable impact on waste generation, there is a striking knowledge gap yet to address how pollution levels are changing under the twin pressures of urbanization and climate change for Africa. The need for studies that could predict pollution levels, while also addressing the role of waste management in the export of plastics into African rivers, becomes pressing.

Our study aims to identify effective domestic waste management strategies to reduce future river export of macro- and microplastics to the coastal waters of Africa. To this end, we apply the existing MARINA-Plastics model (Model to Assess River Inputs of pollutaNts to the seAs for plastics) to all sub-basins in Africa to better understand the trends and sources of macro- and microplastics for the past (2010 and 2020) and future (2050) based on the Shared Socio-Economic Pathway (SSPs) and Representative Concentration Pathway (RCPs).

Our model results show that in the past, the total river export of plastics to all coastal waters of Africa increased by 21% between 2010 and 2020. Such increases are a result of urbanization activities contributing more sewage connections and poorly treated wastewater from households. Most of the river export of plastics was macroplastics (over 80% in the past years). However, the share of microplastics in this total plastics increased from 3% in 2010 to 17% in 2020, indicating the increasing impact of urbanization over time in the recent past. In the future, the river export of plastics to all coastal waters of Africa is projected to further increase by more than double, between 2020 and 2050. This is a result of an increase in both river export of macro- (134%) and microplastics (59%) during this period. These trends are predominantly associated with factors such as increasing production and consumption patterns, ongoing urbanization and other relevant contributors (e.g. climate change).

We further develop alternative scenarios oriented towards four directions for Africa. These alternative scenarios incorporate the implementation of different reduction options such as improvements in wastewater treatment, reductions in the consumption of plastics, better waste collection, and an optimistic scenario where all three strategies are combined. We quantify the impacts of these reduction options on the future river export of plastics for Africa under global change. Our study is useful for understanding the sources and spatial variability of plastic pollution in rivers and coastal waters of Africa under global change trends. It is relevant to support decision-makers and waste managers in the implementation of policies to achieve sustainable targets for responsible consumption & production (SDG 12), and clean water (SDG 6).

How to cite: Usman, M., Micella, I., and Strokal, M.: Domestic waste management strategies to reduce future river export of macro- and microplastics to the coastal waters of Africa, EGU General Assembly 2024, Vienna, Austria, 14–19 Apr 2024, EGU24-2033, https://doi.org/10.5194/egusphere-egu24-2033, 2024.

EGU24-2649 | ECS | Posters on site | HS2.3.5

Global plastic export by rivers: large differences in trends between microplastics and macroplastics  

Suhas Puranik, Ilaria Micella, and Maryna Strokal

Plastic pollution in aquatic ecosystems has become a major concern due to the adverse consequences it poses to marine and human health. Rivers are a major source of inputs of plastic waste into seas. Modelling studies in the past have estimated plastic fluxes into seas for microplastics or macroplastics. However, sources of both macro- and microplastic exports by rivers to coastal waters and their past and future trends have hardly been addressed simultaneously in a spatially explicit way (e.g., sub-basins). This includes both point sources (sewage) for microplastics from car tyre wears, personal care products, household dust and laundry as well as diffuse sources (mismanaged solid waste) for macroplastics and their fragmentation to microplastics. This study aimed to analyse the past (2010-2020) and future (2020-2100) river export of macro- and microplastics using the MARINA-Plastics model using a scenario with the rapid urbanization and high economic development under high global warming in the existing MARINA-Plastics (Model to Assess River Inputs of pollutaNts to seAs for Plastics). The model results show that estimated that globally, the annual river export of macroplastics is modelled to decrease by only 7% whereas the river export of microplastics is modelled to increase by 144% between 2010 and 2020. The large increase for microplastics is associated with increasing trends in urbanization over the period of 2010-2020. In the future, globally, the annual river exports of macroplastics are projected to increase by 118% and microplastics are projected to decrease by 8% in 2100. The sub-basins of the Atlantic, Indian and Pacific Oceans will account for more than 85% of the total river export of plastics in the future. The large increase for macroplastics is related due to poor management of waste and poor collection rates. The hotspots for macroplastic pollution in coastal waters are modelled to shift from Europe and North America to Africa and Asia in the future. Our insights could inform the design of plastic reduction policies at the international level and support the achievement of Sustainable Development Goal 14 (clean marine waters).

All authors acknowledge the support of the Water Systems and Global Change Group of Wageningen University. I. Micella is supported by the European Union's Horizon 2020 research and innovation program under the Marie Sklodowska-Curie Grant Agreement No. 956623 (InventWater).

How to cite: Puranik, S., Micella, I., and Strokal, M.: Global plastic export by rivers: large differences in trends between microplastics and macroplastics , EGU General Assembly 2024, Vienna, Austria, 14–19 Apr 2024, EGU24-2649, https://doi.org/10.5194/egusphere-egu24-2649, 2024.

EGU24-3263 | Posters virtual | HS2.3.5

Towards improvement to understand plastic dynamics in global rivers 

Tadanobu Nakayama

Plastic pollution has been receiving considerable attention from scientists, policy makers and the public during the last few decades. Though some models succeeded to simulate transport and fate of plastic debris in freshwater systems (Meijer et al., 2021), a complete model is under development to elucidate the whole picture of plastic dynamics in continental scale. Previously, process-based eco-hydrology models, NICE (National Integrated Catchment-based Eco-hydrology)-BGC (BioGeochemical Cycle) (Nakayama, 2017), was applied to evaluate biogeochemical cycling in river basins ranging from local/regional to continental/global scales. Recently, the author linked NICE-BGC to plastic debris model that accounts for transport and fate of plastic debris (advection, dispersion, diffusion, settling, dissolution and biochemical degradation by light and temperature), and applied this new model to regional scale (Nakayama and Osako, 2023a) and global major rivers (Nakayama and Osako, 2023b). NICE-BGC was also improved to include the mass budget in water and bed sediment in order to show the seasonal variations of plastic fluxes. In this study, NICE-BGC was further extended to incorporate biofouling (with algae and phytoplankton) and heteroaggregation (with suspended particulate matter) to improve the accuracy of global plastic dynamics in global river basins and the amount of plastic flows from land into rivers and finally into the ocean. Model simulated size distribution of plastics in water and riverbed sediment of global major rivers and showed the difference of effect of biofouling and heteroaggregation in each river. In addition, the simulated result showed that flood events have a great impact on plastic mobilization and its high intra-annual variability mainly caused by settling, resuspension, and bedload transport (Hurley et al., 2018; van Emmerik et al., 2019). These results aid development of solutions and measures to reduce plastic input to the ocean, and help to quantify magnitude of plastic transport under climate change.


References

Hurley, E., et al. 2018. Nature Geoscience, 11, 251-257, doi:10.1038/s41561-018-0080-1.

Nakayama, T. 2017. Journal of Geophysical Research: Biogeosciences, 122, 966-988, doi:10.1002/2016JG003743.

Nakayama, T., Osako, M. 2023a. Ecological Modelling, 476, 110243, doi:10.1016/j.ecolmodel.2022.110243.

Nakayama, T., Osako, M. 2023b. Global and Planetary Change, 221, 104037, doi:10.1016/j.gloplacha.2023.104037.

van Emmerik, T., et al. 2019. Scientific Reports, 9, 13549, doi:10.1038/s41598-019-50096-1.

How to cite: Nakayama, T.: Towards improvement to understand plastic dynamics in global rivers, EGU General Assembly 2024, Vienna, Austria, 14–19 Apr 2024, EGU24-3263, https://doi.org/10.5194/egusphere-egu24-3263, 2024.

EGU24-7542 | ECS | Posters on site | HS2.3.5

Revising global river plastic transport 

Miranda Stibora, Tim van Emmerik, Kryss Waldschlager, Daniel González Fernández, and Albrecht Weerts

Plastic waste is globally of great concern. Rivers have the potential to transport and accumulate large amounts of plastic waste which can have harmful effects on human and animal welfare. Given the durability of plastic waste, the presence of plastic in river environments is forecasted to continue rising. As part of the project INSPIRE (Innovative Solutions for Plastic Free European Rivers), the main goal of our research is to establish a baseline for the current state of plastic litter in European rivers, with the overarching aim of facilitating the reduction of plastic waste. The initial step in achieving this reduction is the accurate modelling of plastic waste in rivers.

There is currently a lack of cohesion between plastic transport models, with models independently predicting the export of various plastic sizes (micro- and macroplastics) and in different riverine compartments (river water, riverbed sediment, riverbank). We aim to develop a single model accounting for the interaction between plastic sizes, due to degradation, and mediums, due to resuspension. Existing plastic models also generally use an annual time scale for predicting plastic concentrations in rivers. To estimate the impact of short-term climatic events, like storms and floods, on plastic concentrations in rivers, a higher temporal resolution would add value to plastic modelling.

Challenges in plastic modelling have arisen from a lack of data-availability. However, with the rise in focus on plastic research, river plastic data availability has steeply expanded, supporting a revision of current plastic modelling approaches. Our research aims to provide a more holistic approach to plastic modelling by exploring current modelling approaches to ensure an up-to-date understanding of factors affecting plastic concentrations in rivers.

Here, we revise and extend previously developed global river plastic models to also account for transport and retention. Modelling the plastic transport in rivers for all plastic sizes and in all mediums will be vital for identifying the types of plastic accumulating in the river, and in which locations. This will be imperative for the effective implementation of mitigation measures to ensure clean and safe waters for the future.

How to cite: Stibora, M., van Emmerik, T., Waldschlager, K., González Fernández, D., and Weerts, A.: Revising global river plastic transport, EGU General Assembly 2024, Vienna, Austria, 14–19 Apr 2024, EGU24-7542, https://doi.org/10.5194/egusphere-egu24-7542, 2024.

EGU24-7586 | Posters on site | HS2.3.5

Micro- and mesoplastic pollution along the beaches in the open Baltic Sea and Gulf of Riga 

Inga Retike, Inta Dimante-Deimantovica, Alise Bebrite, Māris Skudra, Maija Viška, Jānis Bikše, Marta Barone, Anda Prokopovica, Sanda Svipsta, and Juris Aigars

We present a comprehensive assessment of micro- and mesoplastic pollution along 24 beaches of the Latvian coastline (Northern Europe, Baltic states) establishing a baseline for pollution distribution in the Baltic Sea Region. A detailed analysis of sand granulometry, hydrodynamic variables (waves and currents) and tourism intensity allowed us to understand better factors that drive plastic pollution distribution along beaches. Over 250 volunteers participated in the sample collection highlighting the importance of citizen science as a tool to support data collection.

Our findings reveal a lower concentration of micro- and mesoplastic particles in the semi-closed Gulf of Riga (0.10 particles/kg dry sand) compared to the open Baltic Sea (0.16 particles/kg dry sand). The microplastic size fraction (1-5 mm) showed a distinct cluster with higher concentrations and fiber abundance in coarser beach sands of the open Baltic Sea and eastern Gulf of Riga. We emphasize hydrodynamics as a key factor in the distribution and accumulation of microplastics, while impacts are predominantly of local scale and vary considerably across existing studies. No clear pattern of recreational activities on plastic distribution was identified. Studies elaborating on aspects like sampling season, wave energy, wind, currents, sand granulometric properties, and pollution sources are encouraged to enhance result interpretation and move towards more comparable micro-litter case studies.

Reference:

Dimante-Deimantovica I, Bebrite A, Skudra M, Retike I, Viška M, Bikše J, Barone M, Prokopovica A, Svipsta S and Aigars J (2023) The baseline for micro- and mesoplastic pollution in open Baltic Sea and Gulf of Riga beach. Front. Mar. Sci. https://www.frontiersin.org/articles/10.3389/fmars.2023.1251068/full

This work was supported by voluntary donations from the student sorority Selga, the European Regional Development Fund post-doctoral projects No.1.1.1.2/VIAA/2/18/359 and No.1.1.1.2/VIAA/4/20/733, ESF Project No. 8.2.2.0/20/I/003 “Strengthening of Professional Competence of Daugavpils University Academic Personnel of Strategic Specialization Branches 3rd Call”, and the European Economic Area (EEA) Financial Mechanism 2014–2021 Baltic Research Programme (grant EMP480).

How to cite: Retike, I., Dimante-Deimantovica, I., Bebrite, A., Skudra, M., Viška, M., Bikše, J., Barone, M., Prokopovica, A., Svipsta, S., and Aigars, J.: Micro- and mesoplastic pollution along the beaches in the open Baltic Sea and Gulf of Riga, EGU General Assembly 2024, Vienna, Austria, 14–19 Apr 2024, EGU24-7586, https://doi.org/10.5194/egusphere-egu24-7586, 2024.

EGU24-7796 | Posters on site | HS2.3.5

Microplastic transport in European river networks 

Olaf Büttner, Alexander Schwab, Christiane Katterfeld, Christian Schmidt, and Dietrich Borchardt

Microplastics (MP) enter the aquatic environment through both diffuse and point sources, and are transported through the river networks into the seas and oceans. MP threatens the aquatic ecosystems and are present in water, sediment and biota. One of the main entry paths of MP pollution are wastewater treatment plant (WWTP) effluents as well as untreated surface runoff and combined sewer overflows (CSO).

In this study, we aimed to estimate the average annual load of MP to the Seas and Oceans for 125 European catchments of different sizes.

We coupled a mass balance model modified adapted from (Bollmann et al. 2019) and a transport model representing the river network as graph theory network (GTN). The GTN is based on the HydroShed network (Lehner et al. 2008) with WWTPs inserted as additional nodes. The partitioning of MP was calculated for three sinks (sewage sludge, river sediments, load to the sea) relying on literature-derived MP concentrations from untreated surface runoff, combined sewer overflow, and WWTPs effluents. Concentrations for average discharge conditions were calculated for all stream segments using steady-state discharge data from the HydroShed database.

Based on 125 European catchments containing approximately 75% of the European WWTPs with population equivalents > 2000, we found that 77% of MP entering the river network originates from WWTP effluents, the remaining 23% is sourced from untreated surface runoff and combined sewer overflow. Of the MP that has entered the river systems, 24% are transported to seas and ocean while 76% accumulate in the river sediment. The most sensitive parameters in the model related to the loads to seas and oceans are sedimentation rates.

In a next step, the model will be updated with improved hydrological parameters. Furthermore we will apply it to future scenarios of hydro-climatic and socioeconomic conditions. As the HydroShed database is globally available, the model can be applied to other regions of the world.

References

Bollmann, U.E., Simon, M., Vollertsen, J. and Bester, K. (2019) 'Assessment of input of organic micropollutants and microplastics into the Baltic Sea by urban waters', Marine Pollution Bulletin, 148, 149-155, available: http://dx.doi.org/https://doi.org/10.1016/j.marpolbul.2019.07.014.

Lehner, B., Verdin, K. and Jarvis, A. (2008) 'New global hydrography derived from spaceborne elevation data', Eos, Transactions American Geophysical Union, 89(10), 93-94.

How to cite: Büttner, O., Schwab, A., Katterfeld, C., Schmidt, C., and Borchardt, D.: Microplastic transport in European river networks, EGU General Assembly 2024, Vienna, Austria, 14–19 Apr 2024, EGU24-7796, https://doi.org/10.5194/egusphere-egu24-7796, 2024.

EGU24-8521 * | ECS | Orals | HS2.3.5 | Highlight

The impact of floods on plastic pollution 

Tim van Emmerik

Reducing plastic pollution requires a thorough understanding of its sources, sinks, abundance, and impact. The transport and retention dynamics of plastics are however complex, and assumed to be driven by natural factors, anthropogenic factors, and plastic item characteristics. Current literature shows diverging correlations between river discharge, wind speed, rainfall, and plastic transport. However, floods have been consistently demonstrated to impact plastic transport and dispersal. Here, we present a synthesis of the impact of floods on plastic pollution in the environment. For each specific flood type (fluvial, pluvial, coastal and flash floods), we identified the driving transport mechanisms from the available literature. We introduce the plastic-flood nexus concept, which is the negative feedback loop between floods (mobilizing plastics), and plastic pollution (increasing flood risk through blockages). Moreover, we assessed the impact of flood-driven plastic transport, and argue that increasing flood resilience also reduces the impact of floods on plastic pollution. In this paper we provide a perspective on the importance of floods on global plastic pollution. We argue that increasing flood resilience, and breaking the plastic-flood nexus, are crucial steps towards reducing environmental plastic pollution.

How to cite: van Emmerik, T.: The impact of floods on plastic pollution, EGU General Assembly 2024, Vienna, Austria, 14–19 Apr 2024, EGU24-8521, https://doi.org/10.5194/egusphere-egu24-8521, 2024.

EGU24-8587 | Posters on site | HS2.3.5

Environmental Assessment of Microplastic Pollution Induced by Solid Waste Landfills in the Akmola Region (North Kazakhstan) 

Javier Rodrigo-Ilarri, Natalya S. Salikova, María-Elena Rodrigo-Clavero, Saltanat E. Urazbayeva, Aniza Zh. Askarova, and Kuandyk M. Magzhanov

This work presents the outcomes derived from an environmental assessment of microplastic pollution resulting from solid waste landfills in the Akmola Region, situated in North Kazakhstan. This research represents a pioneering investigation conducted on microplastics within this specific region. This study encompasses a comprehensive examination of plastic waste disposal sites across the Akmola region, with a particular emphasis on evaluating the status of the municipal solid waste management system.

To characterize the plastic content within the waste present at the landfill sites, quantitative techniques were employed. Through experimental means, the composition and fractionation of plastics within the municipal solid waste (MSW) at the landfills were determined. These data were subjected to a comparative analysis, aligning them with official statistics and previously published scientific data from both Kazakhstan and other regions globally. The methodologies employed focused on the “soft” removal of organic substances through the use of oxidants which do not damage plastics, and were tested using a water-bath therapeutic treatment. Furthermore, an analysis of soil samples taken from the landfills unveiled the ultimate retention of microplastic particles, attributed to leachate and rainwater runoff. Extracts were obtained from the subsoil samples using a density-based separation process, involving a three-step extraction followed by subsequent filtration of the resulting supernatants. In addition, the soil samples underwent examination through dry-phase particle fractional separation. The particles were meticulously enumerated and classified, and their dimensions were measured employing microscopic techniques coupled with photographic documentation. The outcomes stemming from these diverse tests will serve as fundamental input for the forthcoming numerical modeling endeavor, which aims to simulate the behavior of microplastics within both soil and water. 

How to cite: Rodrigo-Ilarri, J., Salikova, N. S., Rodrigo-Clavero, M.-E., Urazbayeva, S. E., Askarova, A. Zh., and Magzhanov, K. M.: Environmental Assessment of Microplastic Pollution Induced by Solid Waste Landfills in the Akmola Region (North Kazakhstan), EGU General Assembly 2024, Vienna, Austria, 14–19 Apr 2024, EGU24-8587, https://doi.org/10.5194/egusphere-egu24-8587, 2024.

EGU24-8874 | Orals | HS2.3.5

Bedload transport contributions to the microplastic load of the River Waal, Netherlands 

Stefan Krause, Thainne van Dijk, Lee Haverson, Uwe Schneidewind, Liam Kelleher, Sophie Comer-Warner, and Jim Best

Microplastics in rivers and streambed sediments represent a significant risk to ecosystem health and functioning locally, but also contribute to the total load of plastic waste transported towards the oceans. Despite increasing recognition of the importance of rivers as major conduits that are connecting terrestrial sources of mismanaged plastic waste across river basins to the oceans and that can also form important long-term sinks, actual estimates of riverine plastic waste contributions to the oceans have focused exclusively on floating, and sometimes suspended, plastic debris. However, the role of plastic waste, and in particular of microplastic particles when transported as streambed sediments, and their contribution to the total riverine plastic particle load has not yet been established. Indeed, the mechanisms of microplastic deposition and accumulation, and the resulting spatial patterns within riverine sediments, remain poorly understood.

Here, we present a first attempt of combining observations of microplastic concentrations in riverbed sediments with geophysically aided quantifications of bedload sediment transport to estimate contributions of bedload-transported microplastics to the total plastic waste load of a major European river, the River Waal, a Dutch tributary of the River Rhine. We therefore analysed microplastic concentrations in the top 20 cm of streambed sediments at 18 locations across a sequence of transects covering characteristic dune bedforms in the River Waal to establish characteristic ranges and spatial distributions of microplastic concentrations at the riverbed. Analysis of a 420cm deep sediment core was used to quantify the vertical microplastic distribution in the active zone and beyond. Following organic matter digestion and density separation, identified microplastics were counted and characterised for their particle size and shape using fluorescence microscopy aided by Nile Red staining. Additionally, polymer identification was performed on identified microplastic particles using micro-Raman spectroscopy.

Time series of multibeam (MBES) bathymetric information, together with sub-bottom profiler data (parametric echo sounder, PES) of subsurface sedimentary structures, were used to characterize the transport dynamics of recent alluvial dune sediments of the active river channel, where migrating dunes represent the main bedform that control microplastic transport and burial. This information of alluvial dune movement was used to derive bedload transport budgets for the River Waal. When combining these sediment transport estimates with the ranges of microplastic concentrations observed at the surface of streambed sediments, our analysis yields first insights into the potential ranges of microplastics transported as bedload, revealing that these can be substantial and represent an under-recognized fraction of the total plastic waste load transported towards the oceans. While creating budgets at these scales remains highly uncertain given that sample locations and times are restricted by the challenges inherent to microplastic analyses in natural media, our results highlight the need for further exploring the mechanistic drivers of riverine microplastic transport and highlight the importance of streambed sediments as long-term storage zones and legacy pollutants of microplastics that can have profound impact on downstream ecosystem health and functioning.

How to cite: Krause, S., van Dijk, T., Haverson, L., Schneidewind, U., Kelleher, L., Comer-Warner, S., and Best, J.: Bedload transport contributions to the microplastic load of the River Waal, Netherlands, EGU General Assembly 2024, Vienna, Austria, 14–19 Apr 2024, EGU24-8874, https://doi.org/10.5194/egusphere-egu24-8874, 2024.

EGU24-9279 | Posters on site | HS2.3.5

Spatial and temporal variability in in-stream microplastic loads can impact downstream plastic export 

Uwe Schneidewind, Anna Kukkola, Robert Runkel, Sheila F. Murphy, Liam Kelleher, Lee Haverson, Gregory H. Sambrook Smith, Iseult Lynch, and Stefan Krause

Microplastic particles (MPs) are emerging contaminants of concern that have been isolated and described in various environmental compartments. River networks can not only act as major transport pathways of MPs to the world’s oceans, but also as intermediate and long-term sinks, as well as redistributors of MPs. MP in-stream concentration and load (concentration multiplied by discharge) are key parameters when quantifying MP downstream transport and provide an indication towards potential impacts on downstream ecosystem health. MP concentrations and loads within a catchment or river network presumably vary in space and time, yet extensive studies addressing the impact of anthropogenic factors (e.g., water management practices, point source release, landuse) in conjunction with such variability on downstream MP evolution are still scarce.

Here we present key findings from two recent studies. The first study compares downstream MP concentrations and loads for the two neighboring catchments of Boulder Creek (BC) and South Boulder Creek (SBC), Colorado, USA, which vary in their population density and degree of urbanization. We collected 21 water samples (50 L, filtered through >63 µm mesh) from locations along both river channels. For each river segment we also obtained discharge information that helped us quantify MP in-stream loads and determine segment-wise load differences. Samples underwent digestion with Fenton’s reagent before potential MPs were characterized using fluorescent microscopy and Raman spectroscopy. We found that the degree of catchment urbanization influenced downstream MP patterns for both rivers, with BC (higher degree of urbanization and population density) expressing higher MP concentrations and loads than SBC. We also observed extensive downstream MP removal at certain locations where river flow was diverted for anthropogenic use in both streams. This caused a stepwise reduction of downstream MP loads and redistribution of MPs within the wider catchment.

The second study looked at the temporal evolution of in-stream MP concentrations and loads about 1000 m downstream of a wastewater treatment plant (WWTP) at a sidearm of the River Blythe, UK. The WWTP represented a point-source and was the only major MP source to the stream at our sampling location. Water samples (3x 100 L, filtered through >63 µm mesh) were collected at different intervals (monthly over an entire year, weekly over two months, hourly over four days) to better relate possible variations in MP concentrations and loads to changes in WWTP effluent discharge and to study the representativeness of snap-shot sampling. Samples were digested with Fenton’s reagent before fluorescent microscopy and Raman spectroscopy. Results indicate that temporal variability in in-stream MP load could be based on both changes in stream discharge and changes in WWTP effluent concentration, individually or simultaneously. MP loads varied by up to an order of magnitude over the course of one hour, highlighting the importance of obtaining enough representative MP data when characterizing a river system.

Our results show that spatial and temporal variability of MP concentrations and loads in rivers and river networks can be highly variable. This variability should be considered in large scale modeling exercises quantifying plastic fate and transport to the oceans.

How to cite: Schneidewind, U., Kukkola, A., Runkel, R., Murphy, S. F., Kelleher, L., Haverson, L., Sambrook Smith, G. H., Lynch, I., and Krause, S.: Spatial and temporal variability in in-stream microplastic loads can impact downstream plastic export, EGU General Assembly 2024, Vienna, Austria, 14–19 Apr 2024, EGU24-9279, https://doi.org/10.5194/egusphere-egu24-9279, 2024.

EGU24-11235 | ECS | Orals | HS2.3.5

Limited role of discharge in global river plastic transport  

Caspar Roebroek, Adriaan Teuling, Martine Van der Ploeg, and Tim Van Emmerik

Global plastic pollution in the environment is of widespread concern. Rivers have been recognised as an important transport pathway, leading to the spatial redistribution of land-based plastic, and as a key source of plastic in the world’s oceans. Several global models have been developed to estimate the transport, accumulation and export of plastics into the ocean. Many, if not all, of these attempts formulate the river plastic transport dynamics based on estimates of land-based plastic pollution and river discharge. However, the direct relationship between discharge and the river plastic flux is put into question by river plastic pollution observations, which have largely failed to obtain any significant correlation between discharge and the plastic flux at non-extreme discharge levels. Here, we seek to explain these counterintuitive findings and provide a new perspective on how the riverine plastic research and models could improve. We address this by separating the driving forces of plastic transport into the transport capacity (transport), and the potential plastic load (supply). This perspective provides an explanation of the absence of generalizable correlations between discharge and the riverine plastic flux observations. We also highlight the need to broaden the focus of plastic research to include not only the flux in the river, but also the current plastic stocks and fluxes of the whole river systems and their relationship to human behaviour. 

How to cite: Roebroek, C., Teuling, A., Van der Ploeg, M., and Van Emmerik, T.: Limited role of discharge in global river plastic transport , EGU General Assembly 2024, Vienna, Austria, 14–19 Apr 2024, EGU24-11235, https://doi.org/10.5194/egusphere-egu24-11235, 2024.

EGU24-11798 | Posters on site | HS2.3.5

Microplastics in water and bed sediments from the Baluarte River Basin: Occurrence, behavior and composition 

Carlos René Green Ruiz, Jacqueline Hernández-Angeles, and Jose Roberto Rivera-Hernández

Given the concerning alert about the potential high toxicity of microplastics in the environment, in recent years, significant efforts have been made to understand more about the occurrence and behavior of microplastics on Earth. Focuses of these efforts include where they are found, mainly in higher concentrations; their transport pathways; their occurrence in a diversity of organisms; their toxicity; their relationship with other pollutants; and many other questions that still need to be answered. The present work is the first one to focus on the study of microplastics in a lotic exoreic environment in the tropical Mexican Pacific region. In this study, the occurrence, temporal variation, and chemical composition of microplastics found in the surface water and bed sediment of rivers of different orders from the Baluarte River Basin were investigated. In surface waters, an average of 0.23 microplastic-like particles per liter were found during both seasons, showing no significant differences between them. During the rainy season, there was an average concentration of 0.11 particles per liter. On the other hand, in sediment, the results showed average concentrations of 139.2 and 66.7 microplastic-like particles per kilogram for the dry and rainy seasons, respectively, with significantly higher concentrations during the dry season. Most of the analyzed microparticles were fibers and had light blue and transparent colours. Polyethylene terephthalate (PET) was the most found polymer in both environmental compartments, followed by cellophane and rayon. It is concluded that, in general, the microplastics found in the fluvial system of the Baluarte River Basin may come from the discharge of domestic wastewater, agriculture, fishing, garbage dumped on land, as well as the construction of a hydrological infrastructure in the area. For future more detailed studies, it is recommended to increase the number of sampling sites at varying distances from human settlements and to explore better methods for microplastic separation. If possible, it would be interesting to implement control measures in first-order rivers of the Baluarte River Basin.

How to cite: Green Ruiz, C. R., Hernández-Angeles, J., and Rivera-Hernández, J. R.: Microplastics in water and bed sediments from the Baluarte River Basin: Occurrence, behavior and composition, EGU General Assembly 2024, Vienna, Austria, 14–19 Apr 2024, EGU24-11798, https://doi.org/10.5194/egusphere-egu24-11798, 2024.

EGU24-12031 | ECS | Orals | HS2.3.5

The impact of flood events on the spatio-temporal variability of microplastics in the river sediments of two contrasting streams discharging towards the southern Caspian Sea 

Reza Dehbandi, Zainab Rasouli, Mohammad Ali Zazouli, Nafiseh Khodabakhshloo, Nouraddin Mousavinasab, Habib Nejati, Yahya Esfandiari, Jaswant Singh, and Stefan Krause

Microplastics (MPs), as global emerging pollutants, have received significant attention worldwide due to their wide spread presence in aquatic and terrestrial ecosystems. However, the mechanisms controlling their fate and transport through river networks remains poorly understood. This study investigates the spatio-temporal distribution of MPs in two contrasting rivers (Tajan and Talar) discharging to southern coasts of the Caspian Sea, Iran and identifies pollution sources and their activation. In both rivers, MPs were dominated by black-gray larger-sized (1000-5000 μm) Polystyrene (PS)particles. Spatially, MPs concentrations in both rivers differ from upstream to downstream and showed uneven distribution. The March 2019 flood event affected on the concentration and patterns of MPs in river sediments. The total MPs concentration in both river sediments in all stations significantly decreased from pre to post-flood time (p-value<0.05). It is hypothesized that during the flooding that occurred between spring and summer sampling campaigns, the active surface sediment layer of the streambed is likely to have been mobilized by the increased flow, leading to large scale resuspension of sediments and MPs, releasing MPs into the overlaying water column and consequently, causing a reduction of MPs abundance in streambed sediments. The result indicated that in such stormwater and flood events, both river can act a role of active source for MPs flux for Caspian Sea in downstreams. Our results highlight the importance of different local sources and particle release mechanisms for microplastic transport towards the Caspian Sea, the largest inland lake in the world.

Keywords: Microplastics, River, Sediment, Transport mechanisms, Flooding

How to cite: Dehbandi, R., Rasouli, Z., Zazouli, M. A., Khodabakhshloo, N., Mousavinasab, N., Nejati, H., Esfandiari, Y., Singh, J., and Krause, S.: The impact of flood events on the spatio-temporal variability of microplastics in the river sediments of two contrasting streams discharging towards the southern Caspian Sea, EGU General Assembly 2024, Vienna, Austria, 14–19 Apr 2024, EGU24-12031, https://doi.org/10.5194/egusphere-egu24-12031, 2024.

EGU24-14024 | ECS | Orals | HS2.3.5

Beyond the Surface: Vertical distribution of plastic pollution in Dutch rivers  

Stephanie B. Oswald, Ad M. J Ragas, Margriet M Schoor, and Frank P. L. Collas

Rivers act as the main transportation pathways for land-based plastic litter to the ocean. Recently, rivers have also been identified as potential sinks and reservoirs for plastics. A significant part of plastic remains in and around rivers for extended periods, and only travels short distances in river systems. However, knowledge of plastic transport over different depth profiles in rivers remains limited. In this study, we measured the vertical distribution of macro- and mesoplastic concentration and composition. An extensive monitoring campaign was performed in the river Rhine and its two major branches, i.e. Waal and IJssel using a larvae net and a trawl net, methodologies that allow for differentiating between sampling depths. Subsequently, in order to estimate the relationship between the surface transport of plastic items compared to the transport in deeper layers in the water column, an extrapolation factor was derived per day for the middle and bottom nets divided by those found in the surface net. The predominant recorded items among the investigated rivers and monitoring techniques were fragments of soft mesoplastic falling under the category “Plastic film plastics 0-2.5 cm (soft)". The distinction among the observed macro- and mesoplastic OSPAR categories collected in different layers in the water column was limited between techniques. At the sampling sites in the river Waal, river Rhine, and river IJssel, during larvae net monitoring, for both macroplastic and mesoplastics, hard plastics were more frequently found on the river surface, while soft plastics were more frequently detected near the river bottom. The average of the calculated extrapolation factor ranged between 0.45 - 3.51 and 0.70 – 1.72 for macroplastic and mesoplastic, respectively during larvae net monitoring. During trawl net monitoring, the average of the calculated extrapolation factor of macroplastic ranged from 0.82 – 1.30, and for mesoplastic transport ranged from 0.52 – 1.40. Additionally, during larvae net monitoring, extrapolation factor values indicated that mesoplastics showed varying abundances, with the greatest concentration at the bottom of the water column. Followed by high concentrations on the water surface, and with the lowest concentration located in the middle of the river. The trawl net method exhibited subtler differences in macro- and mesoplastic distribution across depths. Vertical mixing was intensified during higher discharge events as a result of turbulent flow. Overall, the findings of this study show that estimates of plastic concentrations solely based on surface transport could result in an underestimation of riverine plastic transport.

How to cite: Oswald, S. B., Ragas, A. M. J., Schoor, M. M., and Collas, F. P. L.: Beyond the Surface: Vertical distribution of plastic pollution in Dutch rivers , EGU General Assembly 2024, Vienna, Austria, 14–19 Apr 2024, EGU24-14024, https://doi.org/10.5194/egusphere-egu24-14024, 2024.

EGU24-15995 | ECS | Posters on site | HS2.3.5

Three-Dimensional Hydrodynamic and Microplastic Transport Model for Lentic Systems 

Lisa Jagau, Benjamin Gilfedder, Jan Fleckenstein, and Vadym Aizinger

Numerical modeling is an efficient tool for quantifying transport and sedimentation patterns of microplastic (MP) particles in lentic systems. To evaluate these patterns based on a specific research area we set up a three-dimensional hydrodynamic and transport model for a reservoir in Germany.

We partition the computational domain with an unstructured mesh to optimally capture the geometry of the reservoir and to adapt the mesh resolution. Thereby, shallow areas and those with steep bathymetry gradients are represented at a particularly high resolution. In vertical direction, we use a combination of z- and sigma-layers. To quantify the effects of the grid on the model results, we perform a sensitivity analysis for different horizontal and vertical mesh resolutions.

For the hydrodynamic simulations we use the Delft3D Flexible Mesh Suite (Delft3D FM). We calibrate and validate the hydrodynamic model utilizing monthly measured vertical temperature profiles for two different years. For simulating the MP transport, we rely on the sediments and morphology module of Delft3D FM. This module is based on a Eulerian approach which allows us to efficiently simulate large concentrations of MP particles.

How to cite: Jagau, L., Gilfedder, B., Fleckenstein, J., and Aizinger, V.: Three-Dimensional Hydrodynamic and Microplastic Transport Model for Lentic Systems, EGU General Assembly 2024, Vienna, Austria, 14–19 Apr 2024, EGU24-15995, https://doi.org/10.5194/egusphere-egu24-15995, 2024.

EGU24-16341 | ECS | Orals | HS2.3.5

Rivers as Conduits: A Comprehensive Model of Microplastic Fate and Transport 

Nerea Portillo De Arbeloa and Alessandra Marzadri

The surge in plastic production and its widespread usage in modern society have escalated the generation of plastic waste, resulting in the prevalent presence of microplastics (MP) in various ecosystems. Their stability and resistance to degradation promotes their persistence and accumulation in the environment, posing significant threats to ecological and human health. River systems acting as connection pathways between lands and oceans, play an important role in controlling the movement of MP. Therefore, understanding which are the main transport mechanisms that control the fate of MP in fluvial settings remains an important challenge.

To this end, we developed a process-based model that solves the advection-dispersion-reaction equation (ADRE)  to predict how the amount of MP changes along the river network. The model considers MP inputs from anthropogenic sources and characterizes the transport and removal mechanisms (i.e. sedimentation, burial, resuspension, and bank removal) according to the different hydro-geomorphological conditions of the reaches that compose the fluvial network. The capability of the model to capture observed concentrations of MP was tested by using available literature data. Comparison between observed and modeled concentration of MP confirm the robustness of the proposed tool  and its versatility to dynamically represent the MP transport-removal processes. Model results  can be helpful to understand and address the challenges posed by MP pollution in riverine systems. 

How to cite: Portillo De Arbeloa, N. and Marzadri, A.: Rivers as Conduits: A Comprehensive Model of Microplastic Fate and Transport, EGU General Assembly 2024, Vienna, Austria, 14–19 Apr 2024, EGU24-16341, https://doi.org/10.5194/egusphere-egu24-16341, 2024.

EGU24-17345 | ECS | Posters on site | HS2.3.5

The Best of Both Worlds – Combining a Revised Global River Model to In-Situ River Plastic Transport Data 

Ronja Ebner, Thomas Mani, and Laurent Lebreton

To tackle the accumulation of plastic in the open oceans and along the shorelines, it is necessary to identify and understand its input paths. With more than 4smaller coastal systems draining into the global oceans, this is a complex task. A global model representing a plethora of different systems is one way to approach this problem.

For this purpose we improved the global river model presented in Meijer et al., 2021 which is using multiple datasets such as topography, land cover, runoff, precipitation, wind, population density, landfills, dams and mismanaged plastic waste per country to estimate the magnitude of the input of plastic into the oceans. This is achieved by a mouth-2-source algorithm that originates from each river mouth. How far the influence of a given network reaches inland is dependent on the discharge within it and is parametrized with an abstract, global parameter, γ. The value of the latter can be calibrated using an analysis of both Eulerian and Lagrangian in-situ river plastic transport data from different river systems worldwide.

Our analysis highlights the importance of plastic transport experiments with high data-density. The model results put the global plastic input into the ocean close to 500 kt/yr and indicate that the influence of the numerous smaller coastal catchments needs to be taken into account  With this model we are further able to identify river systems that interesting for targeted action.

How to cite: Ebner, R., Mani, T., and Lebreton, L.: The Best of Both Worlds – Combining a Revised Global River Model to In-Situ River Plastic Transport Data, EGU General Assembly 2024, Vienna, Austria, 14–19 Apr 2024, EGU24-17345, https://doi.org/10.5194/egusphere-egu24-17345, 2024.

EGU24-18531 | Posters on site | HS2.3.5

Modeling the transport and residence time of microplastic particles in lakes and reservoirs 

Vadym Aizinger, Lisa Jagau, Benjamin Gilfedder, and Jan Fleckenstein

Microplastic (MP) particles are assumed to be potentially harmful to organisms in the hydrosphere. To better assess the exposure and the associated risk it is essential to quantify the transport and sedimentation behavior of MP particles in aquatic environments.

Using the Delft3D Flexible Mesh Suite we set up a three-dimensional hydrodynamic and MP transport model for lakes and reservoirs. Our focus is on modeling polymers with different densities and particle sizes to identify patterns of particle residence time and sedimentation. The reservoir Großer Brombachsee in Germany serves as the research site with realistic forcings and boundary conditions.

We present first results for horizontal and vertical distribution patterns for different polymer types. We found that the distribution of MP in the computational domain is strongly affected by both particle density and particle size. Smaller, lighter particles are spread over the entire horizontal extent of the reservoir, but particles of higher density or of larger size settle within a limited area around the inflow location, indicating a much higher settling velocity.

How to cite: Aizinger, V., Jagau, L., Gilfedder, B., and Fleckenstein, J.: Modeling the transport and residence time of microplastic particles in lakes and reservoirs, EGU General Assembly 2024, Vienna, Austria, 14–19 Apr 2024, EGU24-18531, https://doi.org/10.5194/egusphere-egu24-18531, 2024.

EGU24-18573 | Posters on site | HS2.3.5

A comparative analysis of global models for riverine plastic input to the ocean 

Daniel González-Fernández, Caspar T.J. Roebroek, Charlotte Laufkötter, Tim H.M. van Emmerik, and Andrés Cózar

The plastic pollution crisis demands establishing a global science-policy framework to achieve a circular economy for plastics. Such a framework should be based on scientific evidence to evaluate the success of mitigating plastic pollution in terrestrial, freshwater, and marine environments. This work focuses on the role of rivers as main pathways connecting land-based plastic to the marine environment. Existing large-scale estimates of river plastic input to the ocean used different and contrasting choices in their modelling approaches, e.g., including highly variable number of rivers in the global outputs, differing item-to-mass conversion factors, and extrapolations from microplastic to macroplastic loads. We observed that estimates can diverge up to five orders of magnitude when global models are applied to individual rivers, denoting large uncertainties in the data and approaches used to extrapolate results for the most polluting rivers at World and European scales. These uncertainties would not allow for a quantitative assessment of the effectiveness of plastic mitigation measures, as the expected reduction of plastics in the environment would vary within a much lower range than the modelled estimates. The way forward to provide meaningful assessments involves collecting comparable data using harmonized sampling methods, increasing fundamental understanding of plastic transport and retention dynamics, and a better understanding of spatio-temporal variability of plastic transport in rivers.

How to cite: González-Fernández, D., Roebroek, C. T. J., Laufkötter, C., van Emmerik, T. H. M., and Cózar, A.: A comparative analysis of global models for riverine plastic input to the ocean, EGU General Assembly 2024, Vienna, Austria, 14–19 Apr 2024, EGU24-18573, https://doi.org/10.5194/egusphere-egu24-18573, 2024.

EGU24-18967 | Orals | HS2.3.5

From the river to the sea: Microplastics in water and sediments of the Elbe and Thames rivers and the North Sea 

Friederike Stock, Katsia Pabortsava, Richard Lampitt, Maria Luiza Pedrotti, Rocio Rodriguez, Aaron Beck, Eric Achterberg, Kathrin Voges, Christopher Feltham, Lindsay Scheidemann, Anja Engel, Sandra Golde, and Alice Horton

Microplastics have been investigated for over 45 years especially in the marine environment, but only in the past years research has started to focus on freshwater environments. In the frame of the H2020 LABPLAS project, different compartments in the Elbe and Thames river basins and the North Sea were studied in order to better understand the sources, transport, distribution and impacts of plastic pollution and to detect the amount of plastics transport via the rivers into the sea.

In the frame of the project, a winter and a summer campaign were conducted 2022 and samples taken from 6 sites within each river basin and from 4 sites from the North Sea between the Elbe and Thames estuaries. Samples collected were floating macroplastics, surface microlayer samples (Garrett screen), water samples (10-1000 µm with a pump and stainless-steel filters; >335 µm using a manta net) and sediments (with a Van-Veen-grabber). Density separation and organic digestion took place and analysis was done with a hyperspectral camera, FTIR and LDIR.

The preliminary show that microplastics are present in all samples. The number of particles varies significantly between the compartments, sampling sites and the seasons showing the complexity of plastic sampling and analysis. In the sediments (>10 µm), considerably more microplastics were counted than in the water. Higher values were observed close to cities and the Elbe estuary, in the North Sea close to the Thames estuary. In general, more microplastics are present in manta nets (>335 µm) of the tidal part of the rivers than in the freshwater part. The contrary occurs for small microplastics (10-1000 µm). Only few macroplastics were found. Most common polymers were PP, Acrylates/PU/Varnish, PS and PE as well as PTFE and rubber.

How to cite: Stock, F., Pabortsava, K., Lampitt, R., Pedrotti, M. L., Rodriguez, R., Beck, A., Achterberg, E., Voges, K., Feltham, C., Scheidemann, L., Engel, A., Golde, S., and Horton, A.: From the river to the sea: Microplastics in water and sediments of the Elbe and Thames rivers and the North Sea, EGU General Assembly 2024, Vienna, Austria, 14–19 Apr 2024, EGU24-18967, https://doi.org/10.5194/egusphere-egu24-18967, 2024.

EGU24-19529 | Posters on site | HS2.3.5

The course of microplastics before and after UK WWTPs and their release into the environment. 

Nathalie Grassineau, Louise Eldridge, and Simone Rossouw

Plastic has become an invasive material in modern human lifestyle and is heavily relied upon as an essential resource. It is identified as one of the chief environmental problems. Although identified primarily into marine environments, the main source of the plastics is from land and is discharged into our shores via rivers. To be able to lessen their impacts into the ocean, it is important to understand how to reduce their production upstream. This research is focussing on the fate of the secondary microplastics (MP) from when they leave the household with the greywaters to when they are released via the WWTP (wastewater treatment plant) discharges into our urban rivers.

The household laundry of synthetic textiles has been recognised as one of the largest sources of MP production. This counts for most of the MPs leaving our home via greywaters to reach urban WWTPs. Consequently, the study has focussed on MPs released from 24 washing machine loads, consisting of well-catalogued and weighed various combinations of synthetic garments, under “normal wash conditions”. It was determined that an average load can produce up to 93,000 MP fibres per kg, but it was found that heavier loads released fewer MP fibres. Using a full washing load can reduce the number of fibres produced by up to 70%.

To estimate the release of MPs into freshwater rivers from WWTPs, six discharges from urban plants from middle size towns around Greater London have been sampled and analysed. It was found that although MP quantities are very high the numbers vary greatly due to the age and the size of those sites, but also the technique that is used. It results in a range between 0.5 and 18 million MP per hour being released. This highlights that WWTPs are not advanced enough to remove MP pollution, making these discharges the main source into the freshwater environment.

Furthermore, the MP release from plant discharges into rivers is not the main secondary source as up to 98% of the MPs passing through WWTPs might end up as sludge that can later be applied to improve agricultural land for higher crop yields. This creates a major source of MP fibres into our rural rivers upstream of the urban hubs. Not only does this introduce microplastics to terrestrial habitats but it also creates a direct secondary pathway for microplastics to enter surface waters. This study highlights the urgency to update wastewater treatment and disposal practices to tackle the various issues of fibres getting into surface and groundwaters.

How to cite: Grassineau, N., Eldridge, L., and Rossouw, S.: The course of microplastics before and after UK WWTPs and their release into the environment., EGU General Assembly 2024, Vienna, Austria, 14–19 Apr 2024, EGU24-19529, https://doi.org/10.5194/egusphere-egu24-19529, 2024.

EGU24-20087 | ECS | Orals | HS2.3.5

Mapping the Plastic Legacy: Geospatial Predictions of a Microplastic Inventory in a Complex Estuarine System Using Machine Learning 

Kristina Enders, Robin Lenz, Franziska Fischer, Klaus Schwarzer, Guntram Seiß, Dieter Fischer, and Matthias Labrenz

The persistence of microplastics (MP) in aquatic environments presents a pressing concern, with sediments serving as substantial repositories for these anthropogenic particles. Estuarine depositional systems are sensitive indicator environments for MP monitoring as they: (1) represent aquatic-terrestrial interfaces acting as a bottleneck for MP accumulation coming from land (capable of capturing riverine run-off as well as the often highly populated coastal areas), (2) comprise a confined area, favourable for sampling initiatives as compared to other systems such as long river courses or disperse inland waters. Hence, understanding MP distribution in intricate estuarine systems is essential, yet current models often falter in capturing complexities to sufficiently describe the present pollution patterns for an entire geomorphological region.

We address this gap by employing machine learning techniques to predict spatial MP inventories deposited in the Schlei, Northern Germany. Notably, the complex hydrodynamic regime, influenced by narrowings and braided embayments, freshwater tributaries, wind-driven mixing, and brackish inflows, creates an interplay of fluvial and marine sedimentary processes, which poses non-trivial challenges for reliable modelling of sedimentary MP transportation. Our approach, termed NIXVEGS (Nested Iterative X-Validation-to-Ensemble-modelling through Grid Searches), leverages machine learning, integrating model selection, rigorous validation, and ensemble techniques tailored for small datasets.

We estimated ~20 trillion MP particles or ~14.5 tonnes (50-5000 µm) residing in upper sediments of the Schlei proper, emphasizing the pivotal role of sediments as primary MP reservoirs. Our modelling concept is founded on the idea of applying granulometric proxies to account for the hydrodynamic regime bias in observed MP concentrations. We found that the high complexity of the geomorphology and extreme input events – both are predominant conditions in our study system – produce major spatio-temporal discontinuities in MP data which are not alleviated by a granulometric normalisation. Here we use hydrodynamic tracer simulations to derive variables which incorporate these discontinuities in empirical predictive modelling, but discuss simpler possibilities to enable modelling studies in systems for which such simulation data might not be feasible to acquire.

This study provides a novel framework for geospatial prediction of MP inventories in complex aquatic systems. The integration of granulometric proxies and hydrodynamic discontinuities elucidates MP distribution patterns, offering a pathway for robust predictions and informed mitigation strategies. Our findings underscore the critical role of sediments in storing and reflecting the contemporary plastic legacy, crucial for comprehensive environmental management.

How to cite: Enders, K., Lenz, R., Fischer, F., Schwarzer, K., Seiß, G., Fischer, D., and Labrenz, M.: Mapping the Plastic Legacy: Geospatial Predictions of a Microplastic Inventory in a Complex Estuarine System Using Machine Learning, EGU General Assembly 2024, Vienna, Austria, 14–19 Apr 2024, EGU24-20087, https://doi.org/10.5194/egusphere-egu24-20087, 2024.

EGU24-658 | ECS | Posters on site | HS2.3.8

Occurrence and fate of perfluoroalkyl and polyfluoroalkyl substances (PFASs) in an urban aquifer located at the Besòs River Delta (Spain) 

Carmen Sáez Camacho, Arianna Bautista, Olha Nikolenko, Laura Scheiber, Marinella Farré, Anna Jurado, and Estanislao Pujades

Due to the increasing demand of water, urban aquifers are an alternative source of water supply. However, they are at risk of contamination from persistent and mobile organic compounds (PMOCs), especially per- and polyfluoroalkyl substances (PFASs), which are artificial organic substances widely used across various industrial sectors. PFASs are considered toxic, mobile and persistent, and have therefore gained significant attention in environmental chemistry. Moreover, PFASs precursors transform into more recalcitrant and mobile products under natural conditions. Therefore, it is needed to investigate the fate of PFASs when they reach aquifers to use groundwater safely. However, there is limited information about the processes which affect their behaviour in groundwater, especially at the field-scale. In this context, the aim of this investigation is to assess and identify processes that control the evolution of PFASs in an urban aquifer in Barcelona, where groundwater behaves analogously to a river bank filtration system. A part from PFASs, 4 PMOCs were also analysed. During a summer campaign, 21 groundwater and 6 river samples were collected revealing the presence of 17 PFASs products, 3 novel PFASs and 4 PMOCs non-PFASs. PFASs products were found to be ubiquitous, with the highest concentrations found in PFBS, TFA and TFSA. Non-PFASs and novel PFASs, with the exception of Sulfanilic acid, were found to be present in very low concentrations. It was observed that the redox conditions influence the behaviour of a number of PFASs controlling their attenuation capacity or recalcitrant behaviour. Most substances showed accumulation, possibly explained by sorption/desorption processes or by transformation processes, highlighting the challenges associated with PFASs remediation. In addition, the PFAS TFSA and two of the longest chain PFASs detected presented removals at different intensities. Our results will have tremendous implications for establishing the evolution of PFASs along the groundwater flow and might be extended to similar research areas such as Manage Aquifer Recharge techniques.

How to cite: Sáez Camacho, C., Bautista, A., Nikolenko, O., Scheiber, L., Farré, M., Jurado, A., and Pujades, E.: Occurrence and fate of perfluoroalkyl and polyfluoroalkyl substances (PFASs) in an urban aquifer located at the Besòs River Delta (Spain), EGU General Assembly 2024, Vienna, Austria, 14–19 Apr 2024, EGU24-658, https://doi.org/10.5194/egusphere-egu24-658, 2024.

EGU24-761 | ECS | Posters on site | HS2.3.8

Migration of tire rubber crumbs through variably saturated laboratory-scale sand columns 

Shafkat Sharif, Jan Willem Foppen, and Marc Teixidó Planes

Tire wear rubber particles (TWRP) fall under the umbrella of microplastics and are responsible for synthetic particulate pollution in the urban environment. Urban stormwater runoff carries these particles towards receiving water bodies (e.g., aquifers, rivers, or sea). In particular, studies on their migration behaviour to the subsurface through stormwater infrastructures are still elusive.

The current study investigated the vertical migration of end-of-life truck and track tire rubber particles (TPs) in synthetic stormwater (SSW) with 5 mg C/l dissolved organic carbon through laboratory-based infiltration sand columns. Thereto, 200 mg of the particles, with a size range of 63 – 180 µm, were placed inside the column at a depth of 3 cm. Subsequently, 6 litres of SSW were flushed intermittently through the columns in varying wetting, drying, and saturation cycles simulating heavy precipitation patterns. Effluents were collected after each cycle and retained particles within the column were extracted at specific depth intervals to test for Zn concentration (as ZnO is a commonly used additive agent in tire manufacturing) as a proxy for tire particles. We found that 45 – 95% of the truck and track TPs were retained in the seeded depth of 0 – 3 cm varying with different scenarios. Significant migration occurred in the first depth interval layer (3 – 8 cm) of the columns, whereas the other layers received fewer and nearly uniform amounts of TPs. The truck particles showed 24% more penetration for wetting and drying cycles, whereas upon reduction of gap time between two subsequent wetting cycles track TPs penetrated 18% more. Furthermore, longer saturation (24-hour contact time with SSW between cycles) consistently released 2 – 6 times more Zn than shorter duration times. Our results indicated that large rubber particles in the size ranges we studied remain in the topmost part of the soil. In case of moist or wet soils, these particles will act as a source of pollution, which will finally leach into groundwater, thereby polluting aquifers.

How to cite: Sharif, S., Foppen, J. W., and Planes, M. T.: Migration of tire rubber crumbs through variably saturated laboratory-scale sand columns, EGU General Assembly 2024, Vienna, Austria, 14–19 Apr 2024, EGU24-761, https://doi.org/10.5194/egusphere-egu24-761, 2024.

EGU24-983 | ECS | Posters virtual | HS2.3.8

Electrooxidation for the removal of Sulfamethoxazole using graphite electrodes 

Anju Joshy and Sudha Goel

Sulfamethoxazole is a sulfonamide class antibiotic commonly used to cure infections caused by bacteria in humans and animals. Sulfamethoxazole is considered a contaminant of emerging concern and is one of the most frequently found antibiotics in the environment. It has proven to be highly stable and persistent in the environmental matrices, with a half-life of more than 100 days in an aqueous environment under specific environmental conditions. This causes a severe threat to human and environmental health. The presence of residue of sulfamethoxazole in water matrices shows hazardous effects on aquatic life, affecting the physiological behaviour and reproductive capacity of aquatic organisms. Sulfamethoxazole also showed potential negative impacts on the microbial communities. The persistence of these compounds for an extended period in the environment leads to the formation of antibiotic-resistant genes in bacteria, which can affect the proper functioning of the ecosystem. In this current study, the effectiveness of the electrooxidation process on the removal of sulfamethoxazole using graphite electrodes was investigated. The effect of different parameters like the electrolysis time, current density, initial concentration of sulfamethoxazole, electrolyte concentration (NaCl or Na2SO4), and initial pH of the sample solution were evaluated. Out of the various parameters, it was found that current density (1-10 mA/cm2), electrolyte concentration (100- 500 mg/ L), and the electrolysis time (0-1h) are the key parameters that determine the efficiency of the electrooxidation treatment process. It was found that for the current density value of 10 mA/ cm2, within 45 min of electrolysis time, nearly 99% of the sulfamethoxazole degradation occurred. The possible sulfamethoxazole degradation mechanisms and resulting by-products were analyzed using the Liquid chromatography-mass spectroscopy (LC-MS). Degradation kinetics were also evaluated for the electrooxidation treatment process. The results from the current study showed that electrooxidation could be a favourable treatment technique for the removal of sulfamethoxazole from water matrices.

How to cite: Joshy, A. and Goel, S.: Electrooxidation for the removal of Sulfamethoxazole using graphite electrodes, EGU General Assembly 2024, Vienna, Austria, 14–19 Apr 2024, EGU24-983, https://doi.org/10.5194/egusphere-egu24-983, 2024.

EGU24-2088 | ECS | Posters on site | HS2.3.8

Nitrification inhibitors in the soil-groundwater-river continuum of Germany 

Eva Weidemann, Johanna Dülfer, Katrin Matthes, and Matthias Gassmann

Nitrification inhibitors and urease inhibitors are organic chemicals that have been used in agriculture for decades to slow down nitrification in order to keep plant-available ammonium in the soil for longer and to reduce the leaching of nitrate. Furthermore, they serve to reduce the rapid conversion of urea to ammonia, which also has a positive effect on climate protection. Being applied to agricultural fields, there is a high risk that these substances are contaminating water bodies. We therefore initiated both an environmental sampling campaign and a lab study of the environmental fate characteristics of selected nitrification inhibitors and urease inhibitors.

In our first study, we took samples in Northern Hesse and the area of Goettingen (Germany) from streams, lakes and groundwater between October and December, mainly in agricultural areas. The samples were then analysed for six different nitrification and urease inhibitors (1) 3,4-dimethylpyrazole phosphate (DMPP), (2) 4-amino-1,2,4-triazole (ATC), (3) Dicyandiamide (DCD), (4) N-(2-nitrophenyl)phosphoric triamide (2-NPT), (5) Mixture of N-((5-methyl-1H-pyrazol-1-yl)methyl)acetamide and N-((3-methyl-1H-pyrazol-1-yl)methyl)acetamide (MPA) and (6) H-1,2,4-Triazol. We found solely two of the inhibitors in the samples, DCD and H-1,2,4-Triazol, which corresponds to the results of a study from 2014 published by the DVGW.

In a second study, we wanted to examine under what circumstances and with what dynamics the inhibitors are transferred to deeper soil zones and what influence they have on the leaching of nitrate at different temperatures and in different soils. For this purpose, we chose the above mentioned five nitrification or urease inhibitors (1-5), which are currently used in agricultural fertilizers in Germany. In order to obtain information about their behavior in the environment, we have planned a study to investigate their leaching and transformation behavior in the unsaturated soil zone. For this purpose, agricultural topsoils were selected and filled into 25 cm high columns with a diameter of 7 cm. Three fertilizers containing the above-mentioned compounds were applied separately to the soil columns at an application rate of 150 kg N/ha. Each of the variants was tested in triplicate in two different temperature ranges (12 °C, 20 °C). Irrigation was carried out over 12 weeks with a groundwater recharge rate of the fall/winter period. The leachate was analyzed 1-2 times a week and at the end of the study the soil was analyzed at two different depths for the inhibitors as well as nitrate and nitrite.

How to cite: Weidemann, E., Dülfer, J., Matthes, K., and Gassmann, M.: Nitrification inhibitors in the soil-groundwater-river continuum of Germany, EGU General Assembly 2024, Vienna, Austria, 14–19 Apr 2024, EGU24-2088, https://doi.org/10.5194/egusphere-egu24-2088, 2024.

EGU24-2535 | ECS | Posters on site | HS2.3.8

Modelling pathogen dispersal and distribution in estuarine systems under changing environment 

Xiaorong Li, Peter Robins, Jessica Kevill, Shelagh Malham, and Davey Jones

Treated and untreated wastewater enters estuaries via point source discharges, after which complex estuarine hydrodynamics can retain high concentrations of pathogens in these systems for days to weeks, posing a serious risk to public health. Through comprehensive fine scale three-dimensional numerical modelling, this research aims to study drivers of pathogen dispersal in estuaries and pathways of pathogen distribution. An interdisciplinary approach, combining knowledge from numerical modelling with laboratory derived data on pathogen behaviour and interactions with sediments, has been taken to improve the reliability of the model: 1) key fine-scale estuarine processes, i.e. current (including density current), turbulent mixing, and sediment transport have been studied using a process-based numerical model; 2) decay curves of target pathogens obtained through laboratory experiments for different water temperature, salinity, UV radiation have been implemented in the model; 3) the model also aims to incorporate pathogen attachment to sediments, their deposition, resuspension and subsequently altered decay rates.

The Conwy estuary in North Wales, UK, has been used as our case study. The estuary holds considerable historical and contemporary significance in terms of shellfishery and tourism. With a catchment area of 678 km2 supporting a population of ~80,000 and large pastures, the estuary is susceptible to a range of pathogens, posing a public health risk via ingestion of bathing waters and indirectly via sea food.  The transport of pathogens from point sources, including wastewater discharge and sewage overflow, into the coastal environment has been studied under both current and future climate conditions such as sea level rise, warmer coastal waters, stronger river flow and population growth drawn from climate projections. As a further aspect of this research, conceptual estuarine systems will also be used to study fate and transport of pathogens under common estuarine dynamics and under representative climate scenarios.  This integration will allow for a more holistic approach that widens the applicability of the findings.

This research will provide improved understanding of pathogen dispersal in coastal waters and the impact of climate change on pathogen distribution and potential exposure to humans. It will also provide insights for the development of adaptation strategies to protect public health under changing environmental conditions.

How to cite: Li, X., Robins, P., Kevill, J., Malham, S., and Jones, D.: Modelling pathogen dispersal and distribution in estuarine systems under changing environment, EGU General Assembly 2024, Vienna, Austria, 14–19 Apr 2024, EGU24-2535, https://doi.org/10.5194/egusphere-egu24-2535, 2024.

EGU24-3577 | Orals | HS2.3.8 | Highlight

Environmental risk modelling of pharmaceuticals in the water environment: towards eco-directed prescribing in Scotland 

Miriam Glendell, Lydia Niemi, Zisis Gagkas, Mark Taggart, Stuart Gibb, Naoko Arakawa, Claire Anderson, and Sharon Pfleger

Pharmaceutical pollution is a globally recognised public health and environmental issue that can negatively affect aquatic organisms, impact on drinking water quality and contribute to the spread of antimicrobial resistance. In this research, we developed the first UK multi-criteria decision support tool (DST) for medical practitioners to encourage eco-directed prescribing that considers environmental risk factors alongside medical considerations. The probabilistic DST, based on Bayesian networks, implemented a novel decision-making framework as a blueprint to predict environmental risk and inform eco-directed prescribing for an initial list of priority pharmaceuticals. The risk criteria agreed with stakeholders from both healthcare and environmental sectors included pharmaceutical physico-chemical properties; prescription and excretion rates; sewage treatment removal rates and dilution in the freshwater environment.

The priority compounds were selected through surveys, facilitated discussion and voting by stakeholders across the environment, medicines regulation, prescribing, public health and pharmaceutical industry sectors. Based on clinical and environmental factors, four pharmaceuticals were selected: carbamazepine, clarithromycin, fluoxetine, and propranolol. Expert consultation and literature review identified data on the environmental exposure and hazard of selected pharmaceuticals. Data was collated into a database, following a classification system based on prescribing data (population standardised, by mass), ecotoxicological data, environmental monitoring data, and drug physicochemical properties. Scotland-wide risk simulation models were developed, with mapping to visualise risk levels in freshwater catchments. The models show a gradient of risk in Scotland’s freshwaters, with greatest risk in the most highly populated areas.

The project has helped to increase awareness on environmental impact of pharmaceuticals, and has progressed cross-sector activity to develop support tools to introduce environmental data into prescribing decision-making in Scotland.

How to cite: Glendell, M., Niemi, L., Gagkas, Z., Taggart, M., Gibb, S., Arakawa, N., Anderson, C., and Pfleger, S.: Environmental risk modelling of pharmaceuticals in the water environment: towards eco-directed prescribing in Scotland, EGU General Assembly 2024, Vienna, Austria, 14–19 Apr 2024, EGU24-3577, https://doi.org/10.5194/egusphere-egu24-3577, 2024.

EGU24-4242 | Orals | HS2.3.8

Studying pathogen attenuation and transport in freshwater systems using novel surrogate technology 

Liping Pang, Sujani Ariyadasa, Travis Issler, Beth Robson, Richard Sutton, Susan Lin, Panan Sitthirit, Elmar Prenner, and Craig Billington

By mimicking the physicochemical properties of important waterborne pathogens, we believe that synthetic particles can be used to predict water contamination risks in freshwaters and help to design improved water treatment systems and water-supply bore protections.

We have developed two generations of synthetic pathogen surrogates for water quality applications. The first-generation was based on biomolecule-modifications of commercially available microspheres and nanoparticles to produce surrogates for the pathogens Cryptosporidium, rotavirus and adenovirus. The second-generation is based on biomolecule-modifications of microparticles and nanoparticles that we have made from food-grade natural biopolymers to produce surrogates for the pathogens Legionella, Cryptosporidium and rotavirus.

The surrogates have closely mimicked the physicochemical properties (e.g., size, shape, surface charge, hydrophobicity) of the target pathogens. Experiments conducted have validated surrogates’ performance against the actual pathogens in different systems; the surrogates displayed the same order of magnitude removal as the target pathogens in different experimental conditions.

The first-generation Cryptosporidium surrogates were used in pilot-scale studies to evaluate the efficacies of protozoan removal by drinking-water filtration systems commonly used in New Zealand under typical operating conditions. These included testing rapid sand filtration systems at a water treatment plant in collaboration with the Invercargill City Council and domestic point-of-use water filters in a domestic plumbing test rig. The experimental findings were incorporated into quantitative microbial risk assessments. Health-risk scenarios were identified and recommendations for improving water treatment performance were communicated to end-users. Our experimental results have also highlighted that turbidity, a key test of water clarity and a proxy for water quality used by water plant operators, may not be a reliable indicator of protozoan removal.

Recently, we have advanced our pathogen surrogate technology by producing and testing a second-generation of surrogates that are more compatible with use in natural water systems. These surrogates, made from food-grade natural biopolymers, can be applied in operational water treatment systems and eco-sensitive freshwater environments. Our preliminary studies suggest that these new pathogen surrogates show great promise as new tools for water applications. We will conduct further validations.

We can label the surrogates with unique synthetic DNA sequences for tracking and detection purposes. Degradation of the surrogates’ DNA was found to mimic pathogen’s DNA degradation to some degree. The DNA-tagged surrogates, even at very low concentrations, can be analysed sensitively and rapidly using qPCR. Working with ECAN and Waikato Regional Council, we have validated DNA encapsulated biopolymer particles (as pollution source tracers) in surface water, groundwater and soils, and they were readily trackable in a surface stream for at least 1 km.

The surrogate technology approach has opened a new avenue for assessing pathogen removal and transport in water systems without the risk and expense that accompany work with actual pathogens. The research findings will facilitate improved management systems and engineering approaches to reduce waterborne infection risks and safeguard public health.

How to cite: Pang, L., Ariyadasa, S., Issler, T., Robson, B., Sutton, R., Lin, S., Sitthirit, P., Prenner, E., and Billington, C.: Studying pathogen attenuation and transport in freshwater systems using novel surrogate technology, EGU General Assembly 2024, Vienna, Austria, 14–19 Apr 2024, EGU24-4242, https://doi.org/10.5194/egusphere-egu24-4242, 2024.

EGU24-5835 | ECS | Posters on site | HS2.3.8

Release of biocides in an exemplary urban river in Germany 

Christiane Meier, Korinna Ziegler, Lukas Kopp, Frank Sacher, and Stephan Fuchs

Numerous chemicals enter surface waters via various emission pathways. One important group of those are biocides, which are used in a broad range of products, e.g. as disinfectants, agents against insects, for rodent control, or as material preservatives. Biocides are primarily used in urban areas, collected and transported in sewer systems either to sewage treatment plants (STP) or directly to the receiving water body (stormwater outfalls). During heavy rainfall events, however, sewage treatment plants cannot completely treat the increased sewage volume. Therefore, a part of the untreated sewage water, that contains also biocides, enters the surface waters as combined sewer overflow (CSO).

To assess the importance of different urban emission pathways of biocides, a study was conducted in Germany in the exemplary catchment of the river Alb flowing through the city of Karlsruhe. Water quality decreases by passing the city area from a good status to a bad status as defined in the Water Framework Directive (WFD). It is questioned if and which urban entry pathway contributes to which extent to the increasing pollution of the river Alb. Between 03/2021 and 12/2023 in total 130 samples were taken from the river Alb, the effluent of the municipal STP, combined sewer overflow and storm water outfalls and subsequently analysed for 42 biocidal substances, mainly disinfectants, material preservatives and pest control products. 26 out of 42 substances were detected: 13 in the river water while 26 substances were detectable in the urban emission pathways. These substances are mainly used as material preservatives, e.g. carbendazim, diuron, isoproturon and terbutryn, and were detected in approximately 90 % of all samples. For some substances the environmental quality standard (EQS) or the predicted no effect concentration (PNEC) are exceeded. For example, in CSO-samples the concentration of the insecticide permethrin exceeds 6 to 12-fold the PNEC for surface water. Even in consideration of a regulatory dilution factor of 10 for the discharge into surface waters, the PNEC is exceeded. This can be seen as an indication that pyrethroids used in urban areas are mainly transported into surface waters via CSOs, where they pose a risk to aquatic organisms. Due to low environmental concentrations and associated challenging analytical methods, other pyrethroids were not or only seldom detected.

Present results show that biocidal substances used in material preservation products are (continuously) released via numerous pathways into surface waters, and combined sewer overflows are important emission sources of biocides in the aquatic environment. However, the findings of a part of the substances investigated cannot be unambiguously attributed to a biocidal application, since the same substances can be used as, for example, human or veterinary pharmaceuticals. Nevertheless, the project provided important insights into the occurrence of biocides in urban runoff components and identified combined sewer overflows as a relevant emission pathway in urban areas which needs further to be investigated.

How to cite: Meier, C., Ziegler, K., Kopp, L., Sacher, F., and Fuchs, S.: Release of biocides in an exemplary urban river in Germany, EGU General Assembly 2024, Vienna, Austria, 14–19 Apr 2024, EGU24-5835, https://doi.org/10.5194/egusphere-egu24-5835, 2024.

EGU24-6205 | ECS | Orals | HS2.3.8

Occurrence and load modeling of per- and polyfluoroalkyl substances in an urban watershed Vantaa River, southern Finland 

Heta Ulmanen, Harri Turtiainen, Seija Kultti, Niina Kuosmanen, and Marie-Amélie Pétré

Per- and polyfluoroalkyl substances (PFAS) are persistent environmental contaminants linked to multiple adverse impacts and they are ubiquitous in the Finnish aquatic environment. The Vantaa River watershed is densely populated and constitutes a reserve water source for water supply in the Helsinki Metropolitan area (1 million people).  The aim of this research was to quantify PFAS concentrations and test a load estimator software (LOADEST) to determine loads at the mouth of Vantaa River before it flows into the Baltic Sea. Weekly water sampling was conducted near a continuous gauging station (Oulunkylä station) between March 2023 and October 2023 resulting in 28 samples. Water samples were analyzed for 50 PFAS in a commercial laboratory in Finland. Instantaneous daily load (riverine export) of individual and total PFAS (g/day) were calculated from the measured PFAS concentration in the river and daily river discharge data. The USGS application LOADEST was used to calculate individual and total PFAS loads at a daily interval over the monitoring period.

Σ50 PFAS concentration averaged 25 ng/L (range was 7-53 ng/L) and Σ50 PFAS load averaged 27 g/day (range was 6-121 g/day). Six PFAS constituted 83,4% of total quantified PFAS, perfluorooctane sulphonic acid (PFOS) and perfluoropentane acid (PFPeA) accounted for 40%. The total Σ50PFAS load at Oulunkylä was 4,7 kg over the entire monitoring period (197 days). In addition, the PFAS yield (kg/km2 yr) calculated by dividing the annual PFAS load by the drainage area was 5.15 10-3 kg/km2 yr in Vantaa River. Statistical measures of model performance indicated that LOADEST models for Σ50PFAS was within acceptable limits, with a Load Bias of –0.5% and a Nash-Sutcliffe Efficiency Index of 0.9. Further monitoring and modeling are warranted as this study shows that LOADEST can successfully be applied to the Vantaa River watershed, and it could be used to track the PFAS load reaching the Baltic Sea and follow the evolution of the system after restriction or ban of individual PFAS in Europe.

How to cite: Ulmanen, H., Turtiainen, H., Kultti, S., Kuosmanen, N., and Pétré, M.-A.: Occurrence and load modeling of per- and polyfluoroalkyl substances in an urban watershed Vantaa River, southern Finland, EGU General Assembly 2024, Vienna, Austria, 14–19 Apr 2024, EGU24-6205, https://doi.org/10.5194/egusphere-egu24-6205, 2024.

EGU24-6395 | Posters virtual | HS2.3.8

Multiyear spatial and temporal variability of microcystin concentrations in an irrigation pond in Maryland, USA 

Jaclyn Smith, Matthew Stocker, and Yakov Pachepsky

Cyanotoxins in agricultural irrigation waters pose a potential human and animal health risk. Cyanotoxins can be transported to crops and soil during irrigation; they can remain in the soils for extended periods and be absorbed by root systems. Spatial and temporal variations of cyanotoxin concentrations have been reported for various freshwater sources. However, little has been reported for agricultural irrigation ponds. The objective of this research is to determine if persistent spatial and temporal patterns of the cyanotoxin microcystin occur in agricultural irrigation ponds over several years. The study was performed at a commercial irrigation pond in Maryland, USA, during the 2022-2023 summer sampling campaign over a fixed spatial 10-location grid on 16 sampling dates. Microcystin concentrations were determined using ELISA microcystin-ADDA kits. Ten water quality parameters were obtained using fluorometry and in-situ sensing. Temporal and spatial persistence was assessed using mean relative differences (MRDs) between measurements in each location and averaged measurements across the pond on each sampling date. Positive (negative) MRDs were found in locations where concentrations were predominantly larger (smaller) than the pond’s average. Persistent spatial patterns of microcystin concentrations were found. The pond’s flow conditions and bank proximity to sample locations were indicative of the MRD values signs and amplitudes. The highest absolute values of correlation coefficients were found between microcystin and pH, and microcystin and phycocyanin. The lowest absolute values for correlation coefficients were found for CDOM and chl-a. Results of this work show that microcystin concentrations can follow stable spatial and temporal patterns in irrigation ponds over multiple years, indicating that water quality sampling for cyanotoxins and placement of water intake should not be arbitrary. Research of the spatiotemporal variability of other cyanotoxin concentrations as well as understanding the degree of site-specificity of cyanotoxin concentration relationships with water quality parameters presents an interesting research avenue.

How to cite: Smith, J., Stocker, M., and Pachepsky, Y.: Multiyear spatial and temporal variability of microcystin concentrations in an irrigation pond in Maryland, USA, EGU General Assembly 2024, Vienna, Austria, 14–19 Apr 2024, EGU24-6395, https://doi.org/10.5194/egusphere-egu24-6395, 2024.

EGU24-6648 | Posters virtual | HS2.3.8

Estimating Escherichia coli levels using drone-based RGB imagery and machine learning techniques 

Seokmin Hong, Billie Morgan, Matthew Stocker, Jaclyn Smith, Moon Kim, Kyung Hwa Cho, and Yakov Pachepsky

Rapid and efficient quantification of E. coli levels is the important goal of the microbial water quality assessment. To address this, remote sensing and machine learning algorithms have been used recently. Application of these techniques encounter challenges from a limited number of samples and imbalances in water quality datasets. This study focused on estimating E. coli concentrations in a Maryland irrigation pond during the summer season. We utilized demosaiced drone-based RGB imagery across visible and infrared spectrum ranges along with 14 water quality parameters. Employing four machine learning algorithms (Random Forest, Gradient Boosting Machine, Extreme Gradient Boosting, and K-nearest Neighbor) under three scenarios, the research explored the utilization of only water quality parameters, both water quality and drone-based RGB data, and finally, only RGB data. Two data splitting methods, traditional random data splitting (ordinary data splitting) and quantile data splitting, were employed, with the latter providing a constant splitting ratio across each decile of the E. coli concentration distribution. Quantile data splitting resulted in a very good model performances and smaller differences between training and testing datasets. The RF, GBM, and XGB models, trained with quantile data splitting and hyperparameter optimization, resulted in R2 values above 0.847 for training and 0.689 for the test dataset. The integration of water quality and imagery data led to larger R2 values exceeding 0.896 for the test dataset. Shapley additive explanations (SHAP) highlighted the visible blue spectrum intensity and water temperature as the most influential inputs to the RF model. Overall, demosaiced RGB imagery proved to be a valuable predictor for E. coli concentration across the studied irrigation pond.

How to cite: Hong, S., Morgan, B., Stocker, M., Smith, J., Kim, M., Cho, K. H., and Pachepsky, Y.: Estimating Escherichia coli levels using drone-based RGB imagery and machine learning techniques, EGU General Assembly 2024, Vienna, Austria, 14–19 Apr 2024, EGU24-6648, https://doi.org/10.5194/egusphere-egu24-6648, 2024.

EGU24-7656 | ECS | Posters on site | HS2.3.8

Dispersion induced by braided river morphology 

Margherita Vendruscolo, Carlo Vincenzo Camporeale, and Luca Ridolfi

Braided rivers were deeply investigated as regards their morphodynamical evolution, conversely less interest was shown for the role that their peculiar topology can play in other phenomena, such as transport processes.

Our work deals with the link between the river network structure and the downstream transport of scalars, for example chemical substances (nutrient or pollutant) or suspended sediments. The river network acts as a mixer on the injected substance, thus causing a dispersion effect on the transport process. This phenomenon - known as geomorphological dispersion in the river networks at basin scale - becomes particularly relevant in braided rivers due to the complexity of their networks and their possible crucial impact on fluvial water quality.

Adopting the approach of GIUH theory, we develop a mathematical model for the dispersion in braided rivers. In particular, we assume to inject a given initial distributions of the scalar in the network inlets and aim to compute the outlet discharge by only considering the network properties, i.e. discharges at bifurcations, branches travel times, and network topology.

What we observe from the results is a strong dominance of the network topology over branch-specific hydraulic properties with regard to the outlet distributions, meaning that the properties at the network scale seem to have more influence than those relative to the scale of the individual branch. Moreover, we show how the outlet distributions depend on network properties. We find that, as the network grows, temporal distributions become closer and closer to Gaussians.  This behaviour - expected in light of the central limit theorem - is caused by the succession of bifurcations and reconnections interspersed with branches having different travel times.

How to cite: Vendruscolo, M., Camporeale, C. V., and Ridolfi, L.: Dispersion induced by braided river morphology, EGU General Assembly 2024, Vienna, Austria, 14–19 Apr 2024, EGU24-7656, https://doi.org/10.5194/egusphere-egu24-7656, 2024.

EGU24-7985 | ECS | Posters on site | HS2.3.8

Monitoring the presence of priority pollutants and emerging contaminants at Pagasitikos Gulf, Greece, following “Daniel” and “Elias” storm events, utilizing the technique of LC-VIP-HESI-TIMS-HRMS 

Rallis Lougkovois, Konstantinos Parinos, Georgios Gkotsis, Maria-Christina Nika, Nikolaos Thomaidis, Alexandra Pavlidou, and Ioannis Hatzianestis

Comprehensive monitoring of priority pollutants and emerging contaminants is considered necessary to provide insights concerning the quality of ecosystems. Chemicals such as plant protection products, pharmaceuticals, illicit drugs, personal care products, as well as per- and polyfluoroalkyl substances (PFAS) often end up in the environment and are distributed in different compartments. Human related activities and sewage facilities’ inability to remove them from the wastewater stream seem to be the main sources of contamination of the marine ecosystem. Upon ending up in the natural environment, both biotic and abiotic processes, such as hydrolysis and photolysis, take place, producing transformation products (TPs), suspected to be the cause of even more potent effects compared to parent compounds.

The region of Thessaly, Greece, was severely struck by sequential major storm events named “Daniel” and “Elias”, during the fall of 2023. Approximately 1.5 million tons of water per square kilometer rained down the surrounding area of Pagasitikos Gulf (Aegean Sea, Eastern Mediterranean) each day the phenomena were in effect. Naturally induced environmental change such as these may increase the number of chemicals, which end up in the marine ecosystem and relate to anthropogenic activities, often causing unpredictable damage to indigenous fauna and flora. Many of these compounds reach humans through the food chain and are classified as persistent, bioaccumulative and toxic (PBT).

Aiming to extract as many contaminants as possible from the studied samples, generic sample preparation protocols were applied using multilayer mixed-mode SPE cartridges to enrich the final extracts with thousands of LC-amenable, non-volatile, thermal unstable, semi-polar to polar, organic micropollutants.

The analytes were chromatographically separated using Reversed Phase Liquid Chromatography (RPLC). The chromatographic system was linked to a hybrid Trapped Ion Mobility Spectrometer coupled to High Resolution Mass Spectrometer (TIMS-HRMS). The occurrence of more than 2,000 chemicals from different chemical classes was investigated in the acquired HRMS-data through wide-scope target analysis based on strict identification criteria. TIMS provides an additional dimension of separation, adding increased value of confidence to the identification criteria, minimizing false positive selection, further optimizing wide-scope target screening methodology via HRMS analysis.

Preliminary results indicate the presence of numerous plant protection products in seawater and sediment samples, associated with agricultural activities, such as Azoxystrobin and Atrazine along with their respective TPs: Azoxystrobin acid and 2-hydroxy-atrazine, desethyl-atrazine and desisopropyl-atrazine. Pharmaceutical compounds were also detected in some cases, especially in areas close to wastewater treatment plants, such as Carbamazepine, along with its’ metabolites: 10,11-epoxy-carbamazepine and 10-hydroxy-carbamazepine, findings that could be attributed to reported overflowing of nearby sewage treatment plants, during the flood events. The presence of PFAS is also confirmed, following the detection of compounds such as Perfluorooctanesulfonic acid (PFOS) and Perfluorooctanoic acid (PFOA), possibly linked to the destruction of industrial and port infrastructure.

This work was funded by the Ministry of Development & Investment, National Strategic Reference Framework (NSRF) - Operational Program: “OP Transport Infrastructure, Environment and Sustainable Development”, in the frame of the Monitoring program for the ecological quality of rivers, transitional and coastal waters according to WFD 2000/60/ΕΕ

How to cite: Lougkovois, R., Parinos, K., Gkotsis, G., Nika, M.-C., Thomaidis, N., Pavlidou, A., and Hatzianestis, I.: Monitoring the presence of priority pollutants and emerging contaminants at Pagasitikos Gulf, Greece, following “Daniel” and “Elias” storm events, utilizing the technique of LC-VIP-HESI-TIMS-HRMS, EGU General Assembly 2024, Vienna, Austria, 14–19 Apr 2024, EGU24-7985, https://doi.org/10.5194/egusphere-egu24-7985, 2024.

Contamination of surface water with pesticides is a well-recognised, notorious problem for decades. The Drentsche Aa river in the northern Netherlands is used as drinking water resource for the city of Groningen and its surroundings. Its quality is thus relevant with respect to both ecological and human water quality. Pesticide pollution in the Drentsche Aa catchment has been recognised for years. Environmental management programs have been implemented that aim to improve the water quality and in which a broad group of stakeholders has been involved. Last year, a committee evaluated the current status and suggested measures to improve the water quality. The waterboard ‘’Hunze en Aa’s’’ helpfully provided the data for the evaluation.

Water quality with respect to pesticides has been intensively studied for the period 2011-2022 (except 2014). The monitoring changed somewhat in the course of time but is summarised as follows. Time proportional sampling of river water was done on a weekly basis at different locations in the catchment and up to 141 pesticides and metabolites get analysed. Targeted grab sampling campaigns were additionally performed. 

Non-compliance at the inlet for drinking water production was most frequently observed for MCPA followed by dimethenamid, MCPP and metamitron and to a lesser degree 13 other pesticides. MCPA and MCPP are widely used. Dimethenamid and metamitron are used for flower bulbs, the former also for field vegetables and the latter for sugar beets. In the catchment, non-compliance to the drinking water standard is typically observed during May-August for the pesticides. Metabolites were observed year-round but do not show non-compliance.

Targeted grab sampling shows that pesticides reach surface water during heavy rain storms in the summer by surface runoff and drainflow. This is a well recognised leaching mechanism for pesticides from agricultural fields. However, pesticides also became detected in river water in weeks with little or no rain. This may be attributed to drift despite mitigating measures to reduce drift to surface water. There is also evidence that irrigation of drained parcels leads to surface runoff and drainflow of pesticides to surface water. The erratic occurrence of several pesticides is thus explained by a combination of reasons: 1. heterogeneous application of pesticides in space and time, 2. non-uniform leaching partly due to surface runoff that shows catastrophic event behaviour and 3. limited success of the implementation of measures being implemented on a voluntarily basis and not to the full extent. The data also show that pesticides not only originate from agricultural activities but also from urbanised areas. Here, pesticides were found that were forbidden for non-agricultural purposes at the time of observation.

The monitoring results show an erratic spatio-temporal pattern and no trend-based improvement as required by the EU Water Framework Directive. The voluntarily measures are thus not sufficiently effective. Climate change with more frequent heavy rain storms and greater need for irrigation may worsen the situation. Thus, more stringent measures are required which implementation may be forced by new legislation under the Environmental Law that came into force at 1 January 2024.

How to cite: Griffioen, J.: The erratic problem of pesticide pollution of the Drentsche Aa river as resource for drinking water, EGU General Assembly 2024, Vienna, Austria, 14–19 Apr 2024, EGU24-8217, https://doi.org/10.5194/egusphere-egu24-8217, 2024.

EGU24-10405 | ECS | Orals | HS2.3.8

Transport behavior of organic micropollutants in sandy soils – a lysimeter study  

Mogens Thalmann, Sondra Klitzke, Aki Ruhl, and Andre Peters

Climate change leads to increased water scarcity in many regions worldwide and thus forces many farmers to irrigate with reclaimed water (RW). Yet, due to incomplete elimination of pollutants during the treatment process, pollutants contained in the RW (e.g. organic micropollutants) can be introduced to the soil and may possibly be further transferred to groundwater and/or into eatable plants. To better understand the associated risks, observations of transport and transformation of organic micropollutants in soils is mandatory.

Lysimeter experiments were conducted from June 2021 to November 2023. Four lysimeters  with 1 m² surface area and 1 m depth were filled with sandy soil obtained from an agricultural field (two undisturbed, two disturbed). They were equipped with 9 suction cups inserted every 10 cm. During the vegetation periods, lysimeters were irrigated with RW. Additionally, RW irrigation was done as simulated aquifer recharge during winter time. Regularly, soil pore water (extracted via suction cups) and drainage water were sampled and subsequently analyzed for concentrations of fifteen organic micropollutants.

In this contribution, we exemplary discuss the results for , as two candidates of very different transport behavior.

CBZ concentrations above the limit of quantification were found solely in the depth of 10 cm depth. These findings suggest, that CBZ is either strongly sorbed and/or microbially transformed within the first few centimeters of the soil. In general, these findings are rather contradictive to findings in literature describing CBZ as a mobile substance (e.g. Ternes et al. 2007, Paz et al. 2016).

DZA showed very mobile behavior in the lysimeter in contrast to CBZ and percolated through the start (after 130 – 150 L of percolating water, depending on the lysimeter). In summer, DZA concentrations were significantly higher than those of the inflow, which we attribute to high evaporation and root water uptake combined with no DZA uptake by the plant roots. In autumn and winter, the seepage rates increased and DZA was transported towards the lower boundary.

Results of this study show that the organic micropollutants contained in typical RW may show very different transport behavior. While for some substances enhanced contamination of groundwater might be possible, others might be greatly retarded or even decayed. 


References

Paz, Anat, Galit Tadmor, Tomer Malchi, Jens Blotevogel, Thomas Borch, Tamara Polubesova, and Benny Chefetz. 2016. “Fate of Carbamazepine, Its Metabolites, and Lamotrigine in Soils Irrigated with Reclaimed Wastewater: Sorption, Leaching and Plant Uptake.” Chemosphere 160 (October): 22–29. https://doi.org/10.1016/j.chemosphere.2016.06.048.

Ternes, Thomas A., Matthias Bonerz, Nadine Herrmann, Bernhard Teiser, and Henrik Rasmus Andersen. 2007. “Irrigation of Treated Wastewater in Braunschweig, Germany: An Option to Remove Pharmaceuticals and Musk Fragrances.” Chemosphere 66 (5): 894–904. https://doi.org/10.1016/j.chemosphere.2006.06.035.


How to cite: Thalmann, M., Klitzke, S., Ruhl, A., and Peters, A.: Transport behavior of organic micropollutants in sandy soils – a lysimeter study , EGU General Assembly 2024, Vienna, Austria, 14–19 Apr 2024, EGU24-10405, https://doi.org/10.5194/egusphere-egu24-10405, 2024.

EGU24-10453 | Orals | HS2.3.8

Fecal recontamination of infiltrated water in Dutch Managed Aquifer Research systems; 20 years of field research 

Gijsbert Cirkel, Lucas Borst, Jamal El Majjoui, and Martin van der Schans

The western part of the Netherlands depends largely on river water from the Meuse and Rhine rivers for drinking water supply, which is infiltrated into Managed Aquifer Recharge (MAR) systems in the Dutch coastal dunes. Pre-treated river water is infiltrated through open basins and recovered after soil passage for further treatment. This soil passage is a crucial step in drinking water treatment where unwanted microorganisms are efficiently removed. Field studies by Schijven et al (1998,1999), among others, showed that log removal during saturated transport in these systems is more than sufficient to produce microbiologically safe drinking water. Nevertheless, in subsequent years, fecal indicator organisms were still found with some regularity in the abstracted water. It was suspected that this (re)contamination was caused by short circuit flow with feces-contaminated water from ground level through the unsaturated zone. Conducting several field experiments confirmed this hypothesis and provided unique insight into transport behavior and log removal in the unsaturated zone and the role of preferential flow under field conditions. Results of the field trials have been implemented in guidelines for design and management of MAR systems and whether to allow grazing livestock near the MAR-systems for nature management. In this contribution we present the results of a series of field trials, spanning 20 years, providing unique insight in removal of fecal indicator bacteria in unsaturated dune soils and increasing insight in processes responsible for recontamination of infiltrated river water. 

How to cite: Cirkel, G., Borst, L., El Majjoui, J., and van der Schans, M.: Fecal recontamination of infiltrated water in Dutch Managed Aquifer Research systems; 20 years of field research, EGU General Assembly 2024, Vienna, Austria, 14–19 Apr 2024, EGU24-10453, https://doi.org/10.5194/egusphere-egu24-10453, 2024.

EGU24-10537 | ECS | Orals | HS2.3.8

Tracing and quantifying microbes in riverbank filtration sites combining online flow cytometry and integrated surface water – groundwater modelling 

Friederike Currle, René Therrien, Théo Blanc, Yama Tomonaga, Rolf Kipfer, Daniel Hunkeler, Philip Brunner, and Oliver S. Schilling

Understanding microbial transport behaviour in river-aquifer systems is crucial for drinking water management. Particularly after heavy rain and peak flow events, the quality of groundwater pumped near streams might be impacted by high microbial loads. Dissolved noble gases have been shown to be conservative tracers of river-aquifer interactions and provide information on pathways and travel times of alluvial groundwater. However, due to size exclusion, microbes appear to travel faster than solutes and dissolved gas tracers might therefore not provide insights representative for microbial transport. Recently, online flow cytometry (FCM) has been shown to be a promising tool to track on site, continuously, and in near-real time the movement of microbes in riverbank filtration settings (Besmer et al., 2016). Beyond direct cell counting, unique microbial community patterns such as high (HNA) and low (LNA) nucleic acid content microbes, often referred to as larger and smaller prokaryotes, can be distinguished by FCM.

Aiming to identify preferential transport pathways of microbes and develop a quantitative tool for riverbank filtration site modeling, we combine online FCM and noble gas analyses with integrated surface-subsurface hydrological modelling (ISSHM). We use a dual-permeability approach with a two-site kinetic deposition mode which enables the co-simulation of fast preferential microbial transport and slower bulk transport, along with attachment and detachment of the microbes in high and low permeability regions of the pore space (after Bradford et al., 2009). The formulation was implemented in the ISSHM HydroGeoSphere (HGS; Aquanty, Inc.) and enables multispecies transport, e.g., to represent HNA and LNA groups.

An 8-month measurement campaign at a riverbank filtration site in Switzerland showed that cell concentrations and microbial community patterns are sensitive to surface water infiltration and travel distance in the alluvial aquifer. Distinctly different changes in microbial patterns could be observed for peak flow events, river restoration activities, and spring snowmelt periods. The observed reactive microbial transport behaviour was reproduced and quantified by systematic numerical experiments on the wellfield scale using the transport of conservative dissolved noble gases as a benchmark.

In summary, the interdisciplinary approach combining online flow cytometry, dissolved (noble) gas analysis and explicit microbial transport simulations with an ISSHM is a promising tool to understand and quantify the reactive transport of microbes from rivers into and through alluvial aquifers.


REFERENCES

Besmer, M. D., Epting, J., Page, R. M., Sigrist, J. A., Huggenberger, P., & Hammes, F. (2016): Online flow cytometry reveals microbial dynamics influenced by concurrent natural and operational events in groundwater used for drinking water treatment. Sci. Rep., 6, Article 38462. https://doi.org/10.1038/srep38462

Bradford, S. A., Torkzaban, S., Leij, F., Šimůnek, J., & van Genuchten, M. T. (2009). Modeling the coupled effects of pore space geometry and velocity on colloid transport and retention. Water Resources Research, 45(2). https://doi.org/10.1029/2008WR007096

How to cite: Currle, F., Therrien, R., Blanc, T., Tomonaga, Y., Kipfer, R., Hunkeler, D., Brunner, P., and Schilling, O. S.: Tracing and quantifying microbes in riverbank filtration sites combining online flow cytometry and integrated surface water – groundwater modelling, EGU General Assembly 2024, Vienna, Austria, 14–19 Apr 2024, EGU24-10537, https://doi.org/10.5194/egusphere-egu24-10537, 2024.

The increasing worldwide release of anthropogenic chemicals compounds into the aquatic ecosystems has led serious contamination of freshwater resources.  This study investigated the chemical composition of the water and sediments of L'Albufera Natural Park, Valencia, Spain, an area heavily impacted by intensive agriculture, surrounded by an industrial belt, highly urbanized and historically polluted. The goal was to assess the different water sources and anthropogenic influence in this managed area using nontarget analysis (NTA) combined with high-resolution mass spectrometry (HRMS). Surface water and sediment samples were collected from 51 sites during two sampling events in the May/June 2019 and September/October 2019. These two periods were selected because the most relevant crop in the area are rice fields and these two periods coincides with the starting of the cultivation and the harvest. The HRMS data was processed using Compound Discoverer™ version 3.3, and the results were analyzed using Principal Component Analysis (PCA). Agricultural practices are one of the most important sources of contaminants (mostly pesticides) including at concentrations >100 ng L-1 acetamiprid, azoxystrobin, chlorfenvinfos, chlorpyrifos, difenoconazole, dimethoate, fluvalinate, imazalil, imidacloprid, omethoate, propazine, tebuconazole, terbumeton deethyl, terbuthylazine, thiabendazole and tricyclazole. Increased presence and intensity of organic contaminants along the waterway was observed, indicating significant anthropogenic influence in the area. The NTA and post-processing were evaluated for reproducibility, demonstrating robustness with a 71.2% average reproducibility for compounds detected the 2 sampling trips. A detection frequency of 80% was the set criterion for detected compounds suggested as tracers. To prioritize samples, hierarchical cluster analysis was employed, and potential tracers for each water source were determined. Additionally, urban-influenced contaminants such as insect repellents, pharmaceuticals, and non-agricultural herbicides were identified along the channels that transports treated wastewater to the Natural Park. This study highlights the impact of human activities on L’Albufera Natural Park and demonstrates the effectiveness of NTA in differentiating and tracking water sources. The results emphasize the importance of reproducibility in NTA and provide guidance on implementing monitoring strategies by prioritizing samples based on chemical compositions.

How to cite: Picó, Y., Soriano, Y., and Andreu, V.: Suspected and non-targeted analysis of environmental contaminants in water and sediments of L’Albufera Natural Park by liquid chromatography-high resolution mass spectrometry, EGU General Assembly 2024, Vienna, Austria, 14–19 Apr 2024, EGU24-10676, https://doi.org/10.5194/egusphere-egu24-10676, 2024.

EGU24-11102 | ECS | Orals | HS2.3.8

Green Remediation: Canna Indica for Sustainable Detoxification of Metals and Excess Nutrients 

Dikshant Bodana, Abhishek N Srivastava, Rajendran Vinnarasi, and Sharad K Jain

Rivers are susceptible to metal pollution arising from anthropogenic activities such as mining, industrial processes, and urban runoff. Metals from both natural and man-made sources enter the river system and either settle in the riverbed sediments or are distributed in the aqueous, floating matter. Under some environmental conditions, the accumulation of metals in river systems disrupts biological processes. Apart from metal pollution, the escalating concentrations of nutrients, specifically nitrogen and phosphorus into aquatic ecosystems are of growing concern. The excess concentartions of metals and nutrients pose severe environmental challenges such as lake eutrophication and groundwater pollution. Therefore, the sustainable solution to mitigate their adverse environmental effects is need of the hour.

Phytoremediation is a green remediation technology that employs plants to remove, detoxify, or immobilize toxins from soil, water, or air. The plants and their related microbial populations improve water quality by absorbing, adsorbing, and transforming contaminants like metals, nutrients, etc. In this research, a pot study was performed to investigate the efficacy of phytoremediation. In the controlled environment, small-scale tests were undertaken to examine the growth, pollutant removal capabilities, and effectiveness of using specific plants for larger-scale applications. The target pollutants were heavy metals (As, Al, Ca, Cd, Co, Cu, Fe, Pb, Mg, Hg, and Ni), macro-nutrients (Na, K, and Ca), and micro-nutrients (nitrates, ammonia nitrogen, and phosphates). Experimental setup included polyvinyl chloride containers (5 L capacity) as the vessel (pot) for growing Canna Indica plants. Water sample from Ratanpuri in Hindon river, one of the highly polluted rivers in north India, was used for the treatment. Initially, the containers were filled with 2.5 L of growing medium (soil, sand and gravels), arranged in a block design, and the experiment was performed for ten days (two runs), depending upon their treatment efficiency. Initial and final characterizations of water samples were performed as per standard methods.

The phytoremediation efficiency of all considered metal parameters through Canna Indica was observed in the range of 52-60 % which prospectively got absorbed via phytoextraction. Moreover, the efficacy of nutrient removal, was also obtained satisfactorily ranging from 60-78%. Considering removal efficiencies, phytoremediation using Canna Indica could be economically and environmentally sustainable for countering nutrient and metal pollution at field scale, provided its controlled monitoring is performed effectively. Pot-scale study results could be baseline that support usage of Canna Indica at field scale in wetland systems for detoxifying ecosystems and assuring soil and water quality restoration in the face of increasing anthropogenic demands.

How to cite: Bodana, D., N Srivastava, A., Vinnarasi, R., and K Jain, S.: Green Remediation: Canna Indica for Sustainable Detoxification of Metals and Excess Nutrients, EGU General Assembly 2024, Vienna, Austria, 14–19 Apr 2024, EGU24-11102, https://doi.org/10.5194/egusphere-egu24-11102, 2024.

EGU24-11480 | Posters on site | HS2.3.8

Coupled dynamics of indicator bacteria populations in water columns and bottom sediments of a mountain creek 

Yakov Pachepsky, M. Dana Harriger, Christina Panko Graf, and Matthew Stocker

Water columns and bottom sediments in freshwater bodies are two interacting environmental compartments that exchange microorganisms during both high-flow events and periods of base flow. The objective of this work was to quantify the coupled dynamics of FIB populations in water columns and bottom sediment using the three years of weekly monitoring E. coli and enterococci at forested, agricultural, and suburban land use locations along the montane creek in Pennsylvania, USA. Sediment was sampled in triplicate from the surface 0-1.5 cm layer. For both E. coli and enterococci, two population characteristics were used: (a) logarithm of concentrations in MPN per unit of mass of water or sediment, (logCwater and logCsediment) and (b) areal density in MPN cm-2. The annual cycle of logCwater and logCsediment annual cycle mimicked the sine-like changes in air temperature with amplitudes of 3 to 3.5 orders of magnitude. For both organism groups, relationships between water and sediment populations were convex; slopes of linear regressions of logCwatervs. logCsediment varied from 0.756 to 0.918 and from 0.274 to 0.533 for E. coli and enterococci, respectively; the least of the nonlinearity was observed at the forested site. Weekly increments of the E. Coli logCsediments nonlinearly increased with the total precipitation over the week with the rate of about 0.012 per mm precipitation. In the absence of precipitation during the week E. coli logCsediment decreased with weekly rates of 0.205±0.040 and 0.089 ±0.065 over warm and cold periods respectively. The ratio of the areal densities of FIB populations in water and sediment was overall large at the agricultural and suburban sites compared with the forested site.  The ratio tended to increase as the water stage increased. The bulk of the E. coli and enterococci populations was in the water column at agricultural and suburban sites and in the sedimentsat low flows. 

How to cite: Pachepsky, Y., Harriger, M. D., Panko Graf, C., and Stocker, M.: Coupled dynamics of indicator bacteria populations in water columns and bottom sediments of a mountain creek, EGU General Assembly 2024, Vienna, Austria, 14–19 Apr 2024, EGU24-11480, https://doi.org/10.5194/egusphere-egu24-11480, 2024.

EGU24-11802 | ECS | Orals | HS2.3.8

Drinking plastic: a study of microplastic concentrations in drinking water from rural and urban sources in Mali, Africa 

Liam Kelleher, Alice Phillips, Uwe Schneidewind, Telly Mobido, Lee Haverson, Evans Asamane, Cheick Sidibe, Youssouf Diarra, Ousmane Koilta, Semira Manaseki-Holland, and Stefan Krause

Drinking water (DW) is a necessity for life, and its pollution is of global concern for public health. Whilst the global occurrence of microplastic (MP) pollution in various environmental matrices is a focal point for research, the focus on microplastics in drinking water sources is somewhat less. Previous research has shown orders of magnitude difference in MP contamination of drinking water in residential areas, owing to local water source, water contamination, and container material.

Here we explore the exposure of residents living in rural and urban areas of Mali in Africa to microplastics in drinking water from varying sources. DW samples were taken from 83 homes, from urban residents in the city of Bamako and those in several rural settlements to the east of Bamako. These homes received their drinking water from traditional open wells, boreholes (narrower and deeper canals, often newer sources) and taps. Urban areas often had taps in each home, whereas rural areas had communal well and borehole water points.

A litre of DW was collected from each source which was subsequently sieved at 63 um and then washed with deionised water into a 20ml vial before shipping to the UK. Wet hydroxide digestion was carried out using 30% hydrogen peroxide at a minimum ratio of 1:1 sample to peroxide. After 24 hours the sample was filtered, and 80% of samples were mixed for 1 hour with Nile red, concentration 5 ug/ml, followed by filtering on glass fibre disk. These samples were assessed with fluorescence microscopy to assess polymer number and morphology. The remaining 20% were directly filtered onto Anodisc and assessed for polymer number and type using confocal Raman spectroscopy.

Our results capture a range of polymer types, morphological properties, and concentrations in the studied water samples. A statistically significant mean value of 9.9 mp/l (range 1-34 mp/l) for urban DW compared to 6.5 mp/l (range 0-15 mp/l) for rural DW was found. A range in distribution of MP concentration was found across the study sites regardless of geographic assignment. Morphologically fibres were most identified, 69% for rural and 72% for urban. The primary polymer types found were PMMA, PE, PS, PA/nylon, and PET.

The study sets the basis for a wider investigation of water sources in the region, followed by the perspective linking of health outcomes to the MP exposures found.

How to cite: Kelleher, L., Phillips, A., Schneidewind, U., Mobido, T., Haverson, L., Asamane, E., Sidibe, C., Diarra, Y., Koilta, O., Manaseki-Holland, S., and Krause, S.: Drinking plastic: a study of microplastic concentrations in drinking water from rural and urban sources in Mali, Africa, EGU General Assembly 2024, Vienna, Austria, 14–19 Apr 2024, EGU24-11802, https://doi.org/10.5194/egusphere-egu24-11802, 2024.

EGU24-12548 | ECS | Posters on site | HS2.3.8

Assessment of composite sampling for determining the levels of fecal indicator and antibiotic resistant bacteria in irrigation water 

Matthew Stocker, Jaclyn Smith, and Yakov Pachepsky

The microbial quality of irrigation water is a major worldwide health concern. Assessments of irrigation water quality are conducted via the measurement of the fecal indicator bacteria Escherichia coli. More recently, the levels of antibiotic resistant bacteria in irrigation water have been highlighted as an emerging concern as they may be spread from surface waters to crops and soils. Composite sampling has been recommended in cases when larger sample sets cannot be collected across a waterbody. However there have been no reports which have compared the results of composite sampling with the spatial means or medians of fecal and antibiotic resistant bacteria within irrigation waters. The objectives of this work were to evaluate the representativeness of composite samples for estimating the levels of fecal and antibiotic bacteria in several irrigation ponds. In August and September of 2022, water samples were collected from dense sampling grids within five irrigation ponds in Maryland and Georgia, USA. Concentrations of generic, tetracycline, and cefotaxime-resistant E. coli and total coliforms were enumerated in all samples. Three composite samples were created for each pond: a composite of the interior, bank, and full sample sets. In general, we found the distributions of generic and antibiotic resistant bacteria concentrations did not significantly differ between bank and interior samples. Concentrations of antibiotic resistant bacteria ranged substantially across all the waterbodies. On average, the composite samples fell between the 60th and 70th percentile of the concentration distributions. In only a 9 and 14.5 % of cases (n = 90) did the composite sample value significantly differ (p < 0.05) from the mean or median, respectively, of the entire sample sets. Results of this work indicate that composite sampling may accurately be used to estimate the spatial mean or median of generic and antibiotic resistant bacteria concentrations in irrigation waters. These results will be used to improve the estimation of fecal contamination of irrigation waters as well as the presence of antibiotic resistant bacteria. 

How to cite: Stocker, M., Smith, J., and Pachepsky, Y.: Assessment of composite sampling for determining the levels of fecal indicator and antibiotic resistant bacteria in irrigation water, EGU General Assembly 2024, Vienna, Austria, 14–19 Apr 2024, EGU24-12548, https://doi.org/10.5194/egusphere-egu24-12548, 2024.

An understanding of pathogen transport and fate in the environment is needed to assess the risk of contamination of water and food resources, and to develop control strategies and treatment options.  This presentation discusses advances to better understand and predict the fate of pathogens in the subsurface at different spatial and temporal scales.   Adhesive interactions of pathogens with surfaces are demonstrated to be strong functions of nanoscale and microscale heterogeneities, interface geometry, and solution and solid phase chemistries.   Pathogen retention and release are shown to be sensitive to these factors as well as spatial variability in hydrodynamic conditions. Pore-network models have been used to account for retention processes, including attachment, straining, and hydrodynamic bridging.  Alternatively, machine learning algorithms have been trained on extensive databases to predict retention parameters.  Steady-state and transient release from episodic changes in solution chemistry and water saturation can greatly impact the long-term fate of pathogens. Ongoing efforts to account for governing physicochemical factors into continuum scale models at the column, hillslope, and watershed scales are highlighted. 

How to cite: Bradford, S.: Pathogen Transport and Fate Processes in the Environment at Different Scales, EGU General Assembly 2024, Vienna, Austria, 14–19 Apr 2024, EGU24-12868, https://doi.org/10.5194/egusphere-egu24-12868, 2024.

This study investigated the pollution of per- and polyfluoroalkyl substances (PFASs)  in sediments from the main stream of the Yangtze River, the world's third-longest river. Totally, 13 of 15 PFASs were detected in the sediments and the total concentrations ranged from 0.058 ng/g to 0.89 ng/g dry weight (dw), with dominant contaminants by perfluorooctane sulfonic acid (PFOS) and perfluorooctanoic acid (PFOA). Concentrations of PFASs in the downstream were higher than those of upstream and midstream. Four main sources were analysed using the Unmix model, textile treatments and food packaging dominantly accounted for approximately half of the total sources, followed by metal electroplating (26.8%), fluoropolymer products (16.3%) and fluororesin coatings (7.4%). Total organic carbon (TOC), total nitrogen (TN) and grain size had significant correlation with the concentration of PFASs in sediments, indicating that the physical and chemical parameters could directly affect the adsorption process of PFASs. In addition, anthropogenic factors such as urbanization rate and per capita GDP also had a direct impact on the distribution of PFASs. Environmental risk assessment showed that PFOS posed medium to low risks to the Yangtze River, which might require further action to reduce their pollution level in the environment.

How to cite: Zhang, Z., Li, T., and Chen, Y.: Source apportionment and risk assessment of perfluorinated compounds in the world's third-longest river, EGU General Assembly 2024, Vienna, Austria, 14–19 Apr 2024, EGU24-12904, https://doi.org/10.5194/egusphere-egu24-12904, 2024.

EGU24-13136 | Posters on site | HS2.3.8

Biomonitoring of emerging contaminants in a river in southern Brazil 

Barbara Clasen, Tamiris Storck, Tadeu Tiecher, and Andressa Silveira

The Brazilian biomes degradation puts the quality and integrity of aquatic ecosystems at risk. The disorderly advancement of human activities such as industry, livestock and agriculture make water resources vulnerable to contamination. In this way, the use and occupation of land in the river catchment directly reflects the possible contaminants that may be detected in surface waters. The Uruguay River catchment comprises the Pampa and Atlantic Forest Biomes in southern Brazil, in addition to parts of Argentina and Uruguay. It is estimated that there is a small portion of vegetation remaining in relation to the initial vegetation cover in this catchment, with a high fragmentation degree, due to intense degradation. Therefore, the objective of this study is to evaluate the emerging contaminants presence in the Uruguay River and biomarkers in fish Astyanax sp. exposed to the mixture of these contaminants in situ. To this end, samples of water, sediment and fish were collected over a year in 5 locations distributed along the Uruguay River (around 300km). The occurrence of metals, pesticides, medicines for human and animal use and hormones in water samples was analyzed, and the presence of pesticides in sediments and fish muscles. The presence of 14 active pesticide ingredients was detected, the insecticide imidacloprid being the most common, 13 medicines, 1 female hormone and 7 metals in the water. The presence of 4 pesticides and 3 pesticides bioaccumulated in the fish muscles were detected in the sediments. The results obtained in this study are extremely important for evaluating the contamination of a river basin of international importance. With this, it is possible to determine the possible river contamination sources, and, thus, define or propose improvements in management and mitigation measures aimed at improving environmental quality.

How to cite: Clasen, B., Storck, T., Tiecher, T., and Silveira, A.: Biomonitoring of emerging contaminants in a river in southern Brazil, EGU General Assembly 2024, Vienna, Austria, 14–19 Apr 2024, EGU24-13136, https://doi.org/10.5194/egusphere-egu24-13136, 2024.

EGU24-13205 | ECS | Orals | HS2.3.8

Occurrence and ecological risk assessment of contrast agents in a highly polluted riverine-reservoir system in Central Mexico 

Jaime Dueñas-Moreno, Abrahan Mora, and Jürgen Mahlknecht

The Atoyac River Basin is the largest riverine-reservoir system in Central Mexico. Along its course, the Atoyac River is joined with the Zahuapan River (major tributary) and receives several inputs of untreated or poorly treated urban and industrial wastewaters before flowing to the Valsequillo reservoir in the lower basin. In addition, its contamination is a cause of concern, given the presence of several hospitals and health centers along the main watercourse in Puebla and Tlaxcala States. Water from the Atoyac River Basin serves as a source for irrigation in surrounding areas. Therefore, this study aimed to evaluate the occurrence and ecological risk of five contrast agents—amidotrizoate, iomeprol, iopamidol, iopromide, and gadolinium—through the Atoyac River Basin. For this purpose, a total of 29 surface water samples from this system were collected and analyzed by HPLC coupled to tandem mass spectrometry and ICP-MS (in the case of Gd) in April 2022.

Among the contrast agents, amidotrizoate was not detected in any of the water samples, and iomeprol was only found in the Zahuapan River, with concentrations ranging from 0.023 to 0.091 µg L-1. In addition, iopamidol and iopramide were detected in the Zahuapan River (up to 0.2 and 0.86 µg L-1), Atoyac River before the Zahuapan-Atoyac confluence (up to 0.15 and 0.21 µg L-1), Atoyac River after Zahuapan-Atoyac confluence (up to 1.3 and 3.7 µg L-1), and Valsequillo Reservoir (0.39 and 0.49 µg L-1). Although the Valsequillo Reservoir acts as an oxidation lagoon, both compounds were found in the dam curtain with concentrations between 0.2 and 0.35 µg L-1, respectively. These values were not far from their average concentration in nine water samples analyzed in this reservoir (0.26 and 0.41 µg L-1). Therefore, this demonstrates their recalcitrant nature, as well as their high persistence in the environment. On the other hand, anthropogenic gadolinium was only detected along the Atoyac River, with concentrations ranging between 9.97 × 10⁻³ and 0.35 µg L-1. The highest concentrations of most contrast agents were found in the urban area of Puebla, corresponding with the Atoyac River after the Zahuapan-Atoyac confluence.

The ecological risk assessment revealed that the analyzed aquatic organisms —fish, daphnids, and green algae— exposed to these contrast agents resulted below the safety limit. Although these contaminants are considered safe, it is important to highlight that this study does not consider temporal concentration changes; therefore, significant anomalous events related to wastewater discharges may occur. In addition, the presence of contrast agents in this basin is highly concerning because its waters are used for crop irrigation. Therefore, the accumulation of these contaminants in soils and plants may have negative impacts on the health of consumers, particularly causing nephropathies and heart diseases.

How to cite: Dueñas-Moreno, J., Mora, A., and Mahlknecht, J.: Occurrence and ecological risk assessment of contrast agents in a highly polluted riverine-reservoir system in Central Mexico, EGU General Assembly 2024, Vienna, Austria, 14–19 Apr 2024, EGU24-13205, https://doi.org/10.5194/egusphere-egu24-13205, 2024.

The magnitude of repulsive barriers is of primary importance in colloid transport and surface interaction.  Experimentally observed colloid retention typically decreases and increases with rises and falls of repulsive barriers in response to decreases and increases in solution ionic strength, respectively. However, despite the observation that colloid attachment increases as barriers decrease, the mean field barriers remain hundreds to thousands of times too large to explain attachment.  Incorporation of nanoscale charge heterogeneity amplifies the rise and fall of repulsive barriers via expansion and contraction of the zone of colloid-surface interaction around heterodomains in response to decreased and increased ionic strength, respectively. This amplified impact of nanoscale heterogeneity explains experimentally observed attachment and introduces a stochastic nature to attachment that underlies explanation of non-exponential decreases of colloid concentrations with distance from source.  This success in prediction highlights the need for further efforts to directly characterize nanoscale heterogeneity.

How to cite: Johnson, W.: Title: How Expansion and Contraction of Colloid-Surface Interactions Drives Rise and Fall of Repulsive Barriers and Stochastic Colloid Attachment, EGU General Assembly 2024, Vienna, Austria, 14–19 Apr 2024, EGU24-13551, https://doi.org/10.5194/egusphere-egu24-13551, 2024.

EGU24-14645 | ECS | Orals | HS2.3.8

Organic pollutants leaching in agricultural field: patterns in groundwater and subsurface water 

Shulamit Nussboim, Orah Felicia Rein Moshe, Elazar Volk, Jonathan B. Larrone, and Lea Wittenberg

Organic pollutants contain a variety of compounds that emerge from pest control as well as irrigation with treated effluents. Physico-chemical properties, as well as the history of application, determine distribution in flowpaths. Field-scale research, concentrated on common compounds or included many pesticides, yet analysis did not take the advantage of multiple behavior ranges of many compounds. Rarely short-term time series were collected for organopollutants.

In the current research subsurface and groundwater samples were collected from agricultural fields having subsurface drainage systems. Appling subsurface water in conditions of floods during winter required a demonstration of the subsurface unique composition, to avoid using samples including mixing with streamwater or groundwater. Samples were collected before, during, and after storm resulting in time series for subsurface and groundwater. No pest control intervention was taken thus results demonstrate authentic filed conditions. Analysis of time series in this study showed patterns indicating transport processes in the subsurface such as piston flow and leaching of stormwater, occurring in two stages of the storm. This result was supported as well in clustering analysis: clustering clearly showed different compositions of water samples taken in each stage. The clustering demonstrated as well differences between runoff, subsurface and, groundwater, as well as differences between adjacent fields.

How to cite: Nussboim, S., Rein Moshe, O. F., Volk, E., Larrone, J. B., and Wittenberg, L.: Organic pollutants leaching in agricultural field: patterns in groundwater and subsurface water, EGU General Assembly 2024, Vienna, Austria, 14–19 Apr 2024, EGU24-14645, https://doi.org/10.5194/egusphere-egu24-14645, 2024.

EGU24-15838 | Orals | HS2.3.8

Hydrology shapes the Danube River pollution in Vienna 

Astrid Harjung, Leo Chavanne, Bradley McGuire, Claudia Wenzel, and Yuliya Vystavna

The Danube at Vienna drains a catchment of ~100,000 km2 and is an alpine river with an average discharge of 1900 m3/s that can vary by orders of magnitude. Flood events commonly result from snowmelt during the spring and early summer, heavy rainfalls during late summer and autumn, and ice burst events during winter. The most important tributary is the Inn, draining a large portion of the Austrian Alps. This catchment consists of the northern Calcareous Alps, the Palaeozoic Greywacke zone, and the Crystalline zone; elevations range from 310 to 3800 m. The mean discharge of the Inn at the confluence is 750 m3/s. Downstream of the confluence, southern tributaries from high rainfall areas in the Calcareous Alps and northern tributaries from areas with less rainfall and granitic geology enter the Danube. The Danube catchment is not only geologically, topographically, and climatologically diverse, but also contains diverse land use: forests; intensive and extensive agriculture sites; industrial and urbanized centres. Along the Inn, agricultural activity is focused on the Inn valley. Flatter regions upstream of Vienna, are used for crops, horticulture, and intensive livestock farming. Nitrate concentrations in the groundwater of these areas is often near the Austrian drinking water limit of 50 mg/L. 

The International Commission for the Protection of the Danube carries out synoptic sampling campaigns every few years. Water stable isotopes trace water origin and mixing. Nitrogen and oxygen isotopes of nitrate together with compounds of emerging concern (CECs) can delineate pollution sources and biogeochemical cycling processes. Using these tools revealed that tributaries contributed nitrate from different sources and CECs, while the mainstem generally mixed and diluted these contributions. Snowmelt derived water fractions from the Inn catchment, controlled Danube water chemistry but also diluted pollutants and influenced nitrate processes. An international study on CECs documented high CEC cumulative concentrations in the Vienna Danube. These results, however, also included samples taken downstream from the Vienna Wastewater treatment plant.

None of these studies have investigated the temporal component, considering the highly variable flow regime of the upper Danube. Here we present the results of a monitoring program carried out in collaboration with a public high school located on the Vienna Danube. We took monthly field samples of the Danube together with the pupils and discussed the results. The hydrological year described here was exceptional from a historical point of view but might show how hydroclimatic circumstances could emerge in a global warming scenario: A very dry and warm winter in the Alps was reflected in isotope ratios and CEC concentrations from November-April. Variability in the isotopic ratios and CECs increased in May likely due to higher contributions from the Alps, as compared to local groundwater. A recorded flooding event in late summer showed completely different pattern with regards to CECs and isotopes. Some CECs were diluted, while previously not detected ones appeared. Besides the importance of monitoring to understand the impacts of an accelerated hydrological cycle on river, this study shows the fruitful integration of schools into environmental monitoring.

How to cite: Harjung, A., Chavanne, L., McGuire, B., Wenzel, C., and Vystavna, Y.: Hydrology shapes the Danube River pollution in Vienna, EGU General Assembly 2024, Vienna, Austria, 14–19 Apr 2024, EGU24-15838, https://doi.org/10.5194/egusphere-egu24-15838, 2024.

EGU24-16277 | ECS | Orals | HS2.3.8

An integrated modelling framework to predict the fate and transport of antimicrobial resistance in Singapore coastal waters 

Xuneng Tong, Luhua You, Shin Giek Goh, Shimin Charmaine Marie Ng, Jingjie Zhang, Kyaw Thu Aung, Wei Ching Khor, and Karina Yew Hoong Gin

Predicting the transport and fate of antimicrobial resistance (AMR) in aquatic environments is crucial for managing this pressing environmental issue. We proposed a hybrid modeling framework that couples process-based and data-driven models to predict the spatiotemporal distribution of antibiotics and their related antibiotic resistance genes (ARGs) in Singapore's coastal waters (SCW). In this study, Lincomycin and its related ARGs were selected for analysis. Firstly, this study provides valuable insights into the complex dynamics of ARGs in coastal waters through the application of a meticulously constructed Random Forest (RF) model. This model helps identify key environmental drivers of ARGs, specifically Lincomycin, pH, zinc, DO and temperature, thereby illuminating the factors influencing ARG levels. Subsequently, we applied a process-based model using the Delft 3D suite to simulate the fate and transport of these key environmental drivers. Finally, the outputs from the process-based model were integrated with the RF model to predict ARGs. The modelling framework was calibrated and validated against monthly data collected from 12 sampling points around SCW during 2022-2023. The results revealed that the simulation performance provided 'reasonable prediction' results, with all modeled targets showing an R² above 0.7 and an NSE greater than 0.8. The research presented in this study not only enhances our understanding of the intricate interplay between environmental variables and ARG levels but also has significant implications for environmental and public health management. By emphasizing the importance of specific environmental factors, these models offer a proactive approach to addressing the urgent challenge of antibiotic resistance in coastal ecosystems. This ultimately contributes to the preservation of both the environment and public health.

How to cite: Tong, X., You, L., Goh, S. G., Ng, S. C. M., Zhang, J., Aung, K. T., Khor, W. C., and Gin, K. Y. H.: An integrated modelling framework to predict the fate and transport of antimicrobial resistance in Singapore coastal waters, EGU General Assembly 2024, Vienna, Austria, 14–19 Apr 2024, EGU24-16277, https://doi.org/10.5194/egusphere-egu24-16277, 2024.

EGU24-16438 | Posters on site | HS2.3.8 | Highlight

Fate and behaviour of PFAS in natural resources: towards a safe circular economy 

Julie Lions, Anne Togola, Hans Groot, Martine Bakker, Eric D. van Hullebusch, Ulf Miehe, Veronika Zhiteneva, Valeria Dulio, Pierre Boucard, Julia Hartmann, Nicole Heine, Thomas Track, Alexander Sperlich, Matthias Zessner, Carme Bosch, Massimiliano Sgroi, Francesco Fatone, Sonia Jou Claus, and Stefan Colombano and the H2020 PROMISCES project partners

Resource scarcity has increased interest in the circular economy (CE) for environmental, economic, and social sustainability. The goal is to minimize waste generation and efficiently incorporate waste back into production processes without adversely impacting human health or the environment.

By recognising the importance of assessing the potential accumulation of chemicals and associated  risks within the CE, the Horizon 2020 project PROMISCES focuses specifically on the so-called "forever chemicals" such as per- and polyfluoroalkyl substances (PFAS) in five CE routes, including semi-closed water cycles for drinking water (DW), wastewater reuse in agriculture, nutrient recovery from sewage sludge, material recovery from dredged sediments, and groundwater and land remediation for safe reuse.

Based on the results from literature reviews, experiments and case studies, the project addresses the fate and transfer of PFAS across these CE routes. Despite the challenge of analysing PFAS in complex matrices such as sludge and wastewater, robust and sensitive methods have been developed and the following conclusions can be obtained:

Wastewater treatment provides a limited removal efficiency, especially when wastewater treatment plants receive large contributions from industrial wastewater streams. Advanced wastewater treatment technologies implemented for micro-pollutant removal are not fully effective for all PFAS. Additionally, degradation of precursors can result in increased PFAS concentrations in the effluent. Consequently, until new treatment solutions are implemented, PFAS hotspots may not be able to implement wastewater reuse (e.g. for irrigation).

Riverbank filtration, as a first DW treatment stage, demonstrates limited removal of PFAS. Accordingly, in the presence of an upstream emission source, DW providers may need to implement advanced water treatment technologies.

During wastewater and landfill leachate treatment, particularly long-chain PFAS may accumulate in sludge. Although low level of targeted PFAS compounds were quantified, the presence of precursors in sludge is suspected and may present a barrier to its agronomic valorization. To date, PFAS content in sewage sludge is not regulated and depending on the country, sludge may be spread on agricultural land, incinerated, or disposed in landfills. 

Valorisation of dredged sediment as secondary raw material has the advantage of limiting the cost of management and limiting the use of raw materials. Depending on the nature of the sediment (in particular organic matter content) and on the PFAS loads, different treatments result in different removal efficiencies. Moreover, treatments can result in the formation of new persistent PFAS from precursors. When initial loads are low, it seems possible to eliminate PFAS from the solid fraction. Nevertheless, the destruction of residual PFAS in the washing solution is necessary.

In situ and on-site treatments of water and soil are confronted with environmental realities. Even if treatment trains can help overcome the complexity of PFAS treatment, the process efficiency is highly dependent on the alkyl chain length and the functional groups. As for sediment, although various treatment techniques exist, such as PFAS immobilisation, these do not result in complete degradation or removal of PFAS. This stands in the way of achieving a CE, as only after full removal of PFAS, safe reuse of resources can be guaranteed.

How to cite: Lions, J., Togola, A., Groot, H., Bakker, M., van Hullebusch, E. D., Miehe, U., Zhiteneva, V., Dulio, V., Boucard, P., Hartmann, J., Heine, N., Track, T., Sperlich, A., Zessner, M., Bosch, C., Sgroi, M., Fatone, F., Jou Claus, S., and Colombano, S. and the H2020 PROMISCES project partners: Fate and behaviour of PFAS in natural resources: towards a safe circular economy, EGU General Assembly 2024, Vienna, Austria, 14–19 Apr 2024, EGU24-16438, https://doi.org/10.5194/egusphere-egu24-16438, 2024.

Persistent elevated levels of heavy metals in river water used for irrigation can accumulate in aquatic and terrestrial organisms, disrupting the food chain, altering species compositions, and leading to ecosystem instability. An integrated risk assessment is thus essential to comprehend the cumulative effects of ongoing contamination, offering insights into the severity of hazards associated with heavy metal containing river water. The present research aims to analyze the spatial and temporal variations in the hazard index (HI) and ecological risk index (ERI) based on surface water samples collected along the Kali River. Further, this study pinpoints major heavy metals posing heightened risks, aiming to identify hotspot zones within the river basin. Seasonal water quality monitoring revealed elevated concentrations of Cr, Mn, and Ni during the pre-monsoon. Conversely, in the post-monsoon period, Cr, Fe, Mn, Zn, Cd, and Pb exceeded the drinking water standards established by BIS 2012 across the entire stretch of the Kali River. The ERI findings indicated that during the post-monsoon season, none of the water samples fell into the low ecological risk, whereas about 80% of samples were classed as low ecological risk during the pre-monsoon season. The observed seasonal shift in the computed ecological risk is likely attributed to the wash-off effect and the discharge of agro-industrial waste during the post-monsoon period. Moreover, the values of the ecological risk are higher at the upstream water sampling locations compared to downstream, indicating the effect of the dilution caused by domestic sewage originating from economically developed districts in western Uttar Pradesh state. Similarly, the findings from HI associated with human health indicate that both adults and children face potential carcinogenic and non-carcinogenic risks at all water sampling locations during post-monsoon season. However, in pre-monsoon season, only 34% of water sampling sites reported non-carcinogenic risk. Finally, a correlation was established between predicted risk indices and the observed data encompassing human health, community feedback, and ecological survey results. The findings indicate a robust correlation of 76% among sampling locations along the Kali River, indicating elevated environmental vulnerability in the basin. This study highlights the degraded condition of the Kali River ecosystem, posing threats to both humans and ecology. This necessitates immediate action for effective mitigation strategies to safeguard public health, preserve ecosystems, ensure the safety of agricultural and aquatic resources, and adhere to regulations for sustainable water management in the basin.

How to cite: Dwivedi, P. and Yadav, B. K.: Assessment of Integrated Health and Ecological Risks linked with Heavy Metal Pollutants in the Agro-industrial basin of Kali River, India, EGU General Assembly 2024, Vienna, Austria, 14–19 Apr 2024, EGU24-16658, https://doi.org/10.5194/egusphere-egu24-16658, 2024.

EGU24-16975 | ECS | Posters on site | HS2.3.8

Longitudinal monitoring of Shiga toxin-producing Escherichia coli (STEC) concentrations in surface waters and groundwater supplies within an Irish catchment. 

Robert Hynes, Zina Alfahl, Louise O'Connor, Florence De Bock, Catherine Burgess, Paul D. Hynds, Jean O'Dwyer, and Liam P. Burke

Shiga toxin-producing Escherichia coli (STEC) are zoonotic agents causing human gastroenteritis, with symptoms ranging from asymptomatic/mild to bloody diarrhoea and in rare cases haemolytic uraemic syndrome (HUS) and death. STEC serogroups O157 and O26 are most commonly linked to infection. Waterborne transmission represents a key exposure route and occurs through contamination of drinking water sources with human or mammalian faeces. Ireland has consistently reported the highest STEC infection rates across the EU. This study sought to investigate STEC concentrations in surface water bodies and groundwater wells located in the Corrib catchment in western Ireland over the peak human infection periods.

From late May to early December 2023, 19 sites comprising river (n=5) and private groundwater wells (n=14) were sampled on a fortnightly basis in the Black River sub-catchment of the Corrib catchment. Colilert-18® and quantitative PCR were employed to monitor the presence of total coliforms, E. coli and STEC serogroups targets O157 (rfbE) and O26 (wzx). Measured physico-chemical parameters included pH, temperature, and dissolved oxygen content, in addition to river discharge and groundwater table. These were amalgamated with publicly available data, including groundwater vulnerability and rainfall data from Geological Survey Ireland (GSI) and Met Éireann, and continuous river level and discharge data from the Office of Public Works (OPW).

Overall, 265 samples were collected comprising 75 river samples and 190 groundwater samples. E. coli was detected in 178 samples (67%), including all 75 river samples and 103 (54%) of groundwater samples.

STEC was detected in 225 samples (85%) overall and in 119 (67%) of E. coli positive samples. A total of 168 samples (64%) tested positive for STEC O157, comprising 34 rivers (45%) and 134 groundwaters (71%). STEC O26 was detected in 56 samples overall (21%) and was more prevalent in rivers (n=22, 30%) than groundwater (n=34, 18%). Of 103 E. coli positive groundwaters, 86 were STEC positive, giving a STEC to generic E. coli detection ratio of 83.5%. STEC O157 was detected in 82 (80%) and STEC O26 was detected in 24 (23%) of E. coli positive groundwaters.

Rainfall peaked in July (224.1mm), leading to increases in river discharge (2.137 m3/s mean peaking at 6.058 m3/s in mid-July) and groundwater level (10.11m mean peaking at 9.77m two weeks after heavy rainfall). STEC O157 concentrations peaked in the river samples during August (80% positive, mean concentration of 1.3x10⁶ copies), and later in groundwaters (64% positive, mean concentration of 3.1x10⁵ copies) during September. STEC O26 concentrations peaked earlier in late July for river samples (10% positive samples, mean concentration of 3.58x10⁵copies) and early July for groundwater (22% positive, mean concentration of 2.9x10⁶ copies).

We describe the dynamics of STEC in surface and groundwaters of a catchment in western Ireland. The peaks for STEC serogroups O157 and O26 in groundwaters correlate with “traditional” human peaks of infection for these serogroups in Ireland and are preceded by peaks in surface water concentrations. Findings will be useful in designing strategies for source protection and risk management of drinking water supplies.

How to cite: Hynes, R., Alfahl, Z., O'Connor, L., De Bock, F., Burgess, C., Hynds, P. D., O'Dwyer, J., and Burke, L. P.: Longitudinal monitoring of Shiga toxin-producing Escherichia coli (STEC) concentrations in surface waters and groundwater supplies within an Irish catchment., EGU General Assembly 2024, Vienna, Austria, 14–19 Apr 2024, EGU24-16975, https://doi.org/10.5194/egusphere-egu24-16975, 2024.

EGU24-18329 | Orals | HS2.3.8

Drug analysis as a tracer of pesticide pollution from wastewater treatment plants in the Western Cape, South Africa 

Reynold Chow, Emma Davies, Samuel Fuhrimann, and Christian Stamm

South Africa has one of the most productive and diverse agricultural economies in Africa. Consequentially, it is the leading pesticide user in Sub-Saharan Africa. The Western Cape is a dominant agricultural region in South Africa, making it particularly vulnerable to pesticide pollution. After application, pesticides can be transported to rivers, potentially causing adverse ecological and human health effects. Thus, there is an urgent need to understand the sources and risk of aquatic pesticide pollution.

To achieve this, we deployed passive samplers for two-week intervals every month from February 2022 - March 2023 in three rivers within agricultural catchments (Piketberg, Grabouw, and the Hex River Valley) in the Western Cape. A control sample was deployed in Jonkershoek Nature Reserve. A pesticide monitoring campaign from 2017-2019 in the same agricultural catchments identified year-round detections despite few agricultural applications, making sources and drivers of pesticide pollution unclear. Thus, in addition to 44 pesticides, 20 drugs were analysed using LC-MS/MS as an indicator for wastewater treatment plant effluent. 22 pesticides and seven drugs were detected above the limit of quantification.

While some pesticides showed elevated concentrations and detections during the main pesticide application period which indicates rainfall and application as a contamination driver, some pesticides without year-round agricultural applications (e.g., imidacloprid) had high detection frequencies and concentrations out of the main application season. However, such compounds typically had high Groundwater Ubiquity Scores. This suggests constant leaching of pesticides into groundwater connected to rivers as a possible contamination source.

Piketberg had high cumulative drug concentrations which correlated strongly with cumulative pesticide concentrations, whereas Grabouw and Hex River Valley did not. This holds particularly true for carbendazim and terbuthylazine. This suggests that some pesticides in Piketberg are likely sourced from both wastewater treatment plants and agriculture, whereas the absence of drugs in Grabouw and Hex River Valley suggests that pesticides are more likely sourced from agriculture. Herbicide detections in Jonkershoek Nature Reserve (e.g., atrazine) indicate contamination possibly sourced from atmospheric transport or invasive plant control and trail maintenance.

A risk evaluation using European Environmental Quality Standards revealed that four pesticides were detected at concentrations exceeding their respective threshold levels, namely imidacloprid, chlorpyrifos, terbuthylazine, and spiroxamine. The omnipresence of imidacloprid in all agricultural catchments and monitoring campaigns are cause for concern. This highlights the need for distinct monitoring approaches and the implementation of tailored mitigation measures. Future sampling of groundwater and wastewater influent and effluent in all study catchments is key to improve our understanding of pesticide transport pathways.

How to cite: Chow, R., Davies, E., Fuhrimann, S., and Stamm, C.: Drug analysis as a tracer of pesticide pollution from wastewater treatment plants in the Western Cape, South Africa, EGU General Assembly 2024, Vienna, Austria, 14–19 Apr 2024, EGU24-18329, https://doi.org/10.5194/egusphere-egu24-18329, 2024.

Contaminants in nearshore coastal waters have far-reaching public health and economic implications, such as contaminated food from aquaculture, reduced tourism, and the associated economic losses. The US marine economy annually provides 2.4 million jobs and contributes £312 billion (US$397 billion) to the country’s Gross Domestic Product. Domestic overnight trips to coastal areas in Great Britain contributed £4.6 billion in year 2022. Faecal Indicator Organisms (FIOs) are a class of contaminants that are highly correlated with illnesses such as gastrointestinal, eye, nose and throat infections, and skin complaints. FIOs are commonly used to indicate pathogen levels in waterbodies and have been routinely monitored in bathing water sites. Numerical hydro-epidemiological models have been developed for water quality prediction and management. FIO decay modelling is an integral part of hydro-epidemiological models to simulate the die-off of FIOs after they have been injected into the waterbodies. While the Stapleton et al. (2007) FIO decay model has been successfully applied for Severn Estuary and Bristol Channel, UK, this research identified two model limitations. They were: (i) the modelled decay rates for dark or highly irradiated environments are not accurate, and (ii) the effect of salinity is not included. The Stapleton decay model was modified by (i) imposing a minimum decay rate (ClipStap model); and (ii) extrapolating the decay rate-irradiation slope at a reference irradiation (260 W/m2) down to lower irradiation regions (ModStap model). The modified models were tested with a TELEMAC-3D hydro-epidemiological model for Swansea Bay, UK. Buoyancy effects due to the salinity difference between river fresh water and saline seawater have been included as the effects are found to be critical for FIO transport. The model was validated and evaluated against the water level, velocity, salinity and FIO concentration data obtained in the “Smart Coasts – Sustainable Communities (SCSC)” research project in year 2011 and 2012. Results showed that while the ModStap model successfully reproduced the reported dark decay rates in the literature, it did not always give better FIO prediction results. In addition, this research demonstrated that the observed diurnal variations of FIO concentrations are caused by the combined action of riverine FIO inflows, tide action, and FIO decay. Given the unsuccessful model prediction, the effect of sediment-FIO interactions (Huang et al., 2015) will be tested with the hydro-epidemiological model. These insights on the effect of irradiation, diurnal FIO variations, and sediment-FIO interactions on bathing water quality are critical for the management of coastal human activities, and nearshore ecology.


Reference: (i) Stapleton et al. (2007). Link: https://assets.publishing.service.gov.uk/media/5a7c5af4ed915d696ccfc370/scho0307bmef-e-e.pdf; (ii) Huang et al. (2015). doi: 10.1080/15715124.2014.963863


Keywords: Nearshore coastal waters; FIO decay models; irradiation; diurnal variations; hydro-epidemiological models; Swansea Bay

How to cite: Ahmadian, R. and Lam, M. Y.: Modified Faecal Indicator Organism (FIO) decay models for nearshore coastal waters, EGU General Assembly 2024, Vienna, Austria, 14–19 Apr 2024, EGU24-19314, https://doi.org/10.5194/egusphere-egu24-19314, 2024.

EGU24-19365 | ECS | Orals | HS2.3.8

PFAS variable transport behavior: insights from soil sorption experiments 

Ali Obeid, Thomas James Oudega, Ottavia Zoboli, Claudia Gundacker, Alfred Paul Blaschke, Matthias Zessner, Ernis Saracevic, Nicolas Devau, Margaret E. Stevenson, Nikola Krlovic, Meiqi Liu, and Julia Derx

Per- and Polyfluoroalkyl Substances (PFAS) are extensively utilized chemicals owing to their desired physicochemical properties. Despite increasing efforts to limit their applications, they persist in the environment and pose a threat to drinking water production due to their persistence, mobility, and toxicity. Understanding their behavior in subsurface media is crucial for minimizing the risk of exposure in areas where groundwater is a significant source. Sorption is considered a pivotal mechanism in PFAS remediation. This study aims to explore the transport behavior of different PFAS groups in soil sorption experiments and establish a connection to field scenarios.
Miscible displacement experiments were conducted on a mixture of PFAS. A 50 cm long glass column filled with sand was injected with a 2.5 µg/l PFAS solution. Subsequently, the column was flushed with a PFAS-free solution to examine the desorption process. A conservative tracer test was performed to determine hydrogeological properties. Samples were analyzed using liquid chromatography-mass spectrometry. Breakthrough curves were then simulated using Hydrus 1D to obtain transport parameters.
The results revealed that different PFAS groups exhibit varying orders of magnitude of sorption. Some were conservative, while others were entirely retained. In addition to functional groups and chain length, hydrophobicity played a crucial role in PFAS behavior. The desorption process was inversely proportional to sorption; less desorption occurred with an increased sorption level.
To simulate these behaviors, different sorption modules in Hydrus were tested. Substances with higher sorption levels required more complex sorption terms and could not be accurately simulated by assuming equilibrium sorption.

How to cite: Obeid, A., Oudega, T. J., Zoboli, O., Gundacker, C., Blaschke, A. P., Zessner, M., Saracevic, E., Devau, N., Stevenson, M. E., Krlovic, N., Liu, M., and Derx, J.: PFAS variable transport behavior: insights from soil sorption experiments, EGU General Assembly 2024, Vienna, Austria, 14–19 Apr 2024, EGU24-19365, https://doi.org/10.5194/egusphere-egu24-19365, 2024.

EGU24-20853 | Posters on site | HS2.3.8

The occurence of pharmaceuticals and other micropollutants in wastewater treatment plant in the aspect of interaction with microplastics 

Katarzyna Styszko, Wioleta Bolesta, Jagoda Worek, Daniel Kaleta, Adam Nalepa, Justyna Pyssa, Karolina Cwynar, Zuzanna Prus, and Laura Frydel

The presence of pharmaceuticals in the aquatic environment is known to scientists and is constantly being investigated. Such micropollutants with bactericidal, virucidal, or fungicidal properties are commonly used in households, which results in their presence in raw sewage flowing to wastewater treatment plants. The content of pharmaceuticals may vary depending on the lifestyle of the inhabitants or the intensity of drug consumption. This study analysed the content of antibiotics, virucidal and fungicidal substances in raw and treated sewage from one of city located in southern Poland with a population equivalent of 680,000. Furthermore, the study was conducted in the summer and autumn-winter seasons.

Microplastics are one of the largest pollutants in the world. Since the 1970s, it has already existed, but there has been no better alternative than plastic. It is related to easy and cheap production, high availability, and specific properties of plastics, such as plasticity, chemical resistance, and lightness.

In the research, samples of stabilized sewage sludge were analyzed in terms of quantitative and qualitative analysis. The separation of microplastics was carried out in two stages. First, the sample matrix was digested with 15% hydrogen peroxide. The next step was density separation, where a saturated solution of calcium chloride was used. Separated microplastics were counted and their sources of origin were analyzed using a Raman confocal microscope and ATR FT-IR spectrometer. The samples were divided according to the month of their collection.
The production of organic-mineral fertilizers from sewage sludge is one of the ecological possibilities of their management. Pharmaceuticals and their derivatives, as well other micropollutants which get in the sludge during the treatment of wastewater, can be a problem. The negative impact of these micropollutants on the environment has been scientifically proven, and the pharmaceuticals and microplastics contained in the sludge may also be detected in fertiliser products.

Acknowledgments: Research supported by the Polish National Agency for Academic Exchange in the Bekker programme (no. PPN/BEK/2020/1/00243/) as well by the Polish National Science Centre (grant no. 2022/45/B/ST10/02108). Research was partially supported by the program ‘Initiative for Excellence – Research University’ for the AGH University of Krakow. Research supported under the Implementation Doctorate in the program of the Ministry of Science and Higher Education.

How to cite: Styszko, K., Bolesta, W., Worek, J., Kaleta, D., Nalepa, A., Pyssa, J., Cwynar, K., Prus, Z., and Frydel, L.: The occurence of pharmaceuticals and other micropollutants in wastewater treatment plant in the aspect of interaction with microplastics, EGU General Assembly 2024, Vienna, Austria, 14–19 Apr 2024, EGU24-20853, https://doi.org/10.5194/egusphere-egu24-20853, 2024.

EGU24-21920 | ECS | Posters on site | HS2.3.8

Mechanistic study of the adsorption of Iodinated Contrast Media agents on monolayer Graphene surface 

Ashfeen Ubaid Khan, Giovanni Michele Porta, Monica Riva, and Alberto Guadagnini

Iodinated Contrast Media agents (ICMs), essential in diagnostic imaging, have seen a surge in usage within the healthcare sector. This rise has sparked significant environmental concerns, primarily due to the fact that ICMs can evade capture by standard wastewater treatment facilities, subsequently accumulating in environmental waters [1]. This situation underscores the urgent necessity to develop more sustainable and effective methods for the removal and recovery of ICMs from aquatic systems. Over the past ten years, the scientific community has been actively exploring various materials that could serve as potential adsorbents to extract ICMs from natural waters [2]. Although practical experiments have demonstrated the effectiveness of different adsorbents in removing ICMs, there is a pressing need for a detailed mechanistic understanding of the adsorption process. In response to this need, our research delves into the mechanistic adsorption behaviour of ICMs using a model of activated carbon, represented by a monolayer graphene surface. By focusing on the interactions at the molecular level, we aim to advance the predictive modelling of ICM adsorption and contribute to the development of more targeted and efficient removal strategies for these pervasive substances in our water systems. We utilized molecular docking and Density Functional Theory (DFT) simulations to scrutinize the adsorption process on a molecular level [3]. Additionally, we applied Quantitative Structure-Activity Relationship (QSAR) modelling to link molecular characteristics with adsorption energy, aiding in understanding the influential factors in the adsorption process and building a predictive model [4]. We developed a variety of QSAR models through the combination of Multiple Linear Regression and genetic algorithm. To evaluate and prioritize these models, our study employs Maximum Likelihood estimation alongside established evaluative criteria. These criteria aid in determining the probability for model accuracy of each model, thereby refining the QSAR methodologies. Based on our results for 24 ICMs involved in this study we observed the varying adsorption energies from -4.40 Kcal/mol (Methiodal) to -40.35 Kcal/mol (Iobitiridol) suggesting a selective adsorption of ICMs. We observed that van der Waals interactions such as π-π stacking to be the primary mechanism of adsorption. Our DFT results also highlighted a significant correlation between adsorption energy and the Molecular weight of the ICMs. Furthermore, based on our final QSAR model, we observed that structural properties such as molecular complexity, presence/absence of Iodine atoms and molecular complexity play a strong role in the adsorption of ICMs on the adsorbent.

References:

1. Sengar, A., Vijayanandan, A., 2021. Comprehensive review on iodinated X-ray contrast media: Complete fate, occurrence, and formation of disinfection byproducts. Science of the total environment 769, 144846.

2. Dekker, H.M., Stroomberg, G.J., Prokop, M., 2022. Tackling the increasing contamination of the water supply by iodinated contrast media. Insights into Imaging 13, 30.

3. Orio, M., Pantazis, D.A., Neese, F., 2009. Density functional theory. Photosynthesis research 102, 443–453.

4. Roy, K., 2017. Advances in QSAR modeling. Applications in Pharmaceutical, Chemical, Food, Agricultural and Environmental Sciences; Springer: Cham, Switzerland 555, 39.

How to cite: Khan, A. U., Porta, G. M., Riva, M., and Guadagnini, A.: Mechanistic study of the adsorption of Iodinated Contrast Media agents on monolayer Graphene surface, EGU General Assembly 2024, Vienna, Austria, 14–19 Apr 2024, EGU24-21920, https://doi.org/10.5194/egusphere-egu24-21920, 2024.

HS2.4 – Hydrologic variability and change at multiple scales

EGU24-58 | ECS | Orals | HS2.4.2

Unveiling Hydrological Dynamics in Data-Scarce Regions:A Comprehensive Integrated Approach 

Ayenew Desalegn Ayalew, Paul D. Wagner, Dejene Sahlu, and Nicola Fohrer

The hydrological system of Rift Valley Lakes in Ethiopia has recently experienced changes since the past two decades. Potential causes for these changes include anthropogenic, hydro-climatic and geological factors. The main objective of this study was to utilize an integrated methodology to gain a comprehensive understanding of the hydrological systems and potential driving factors within a complex and data-scarce region. To this end, we integrated a hydrologic model, change point analysis, indicators of hydrological alteration (IHA), and bathymetry survey to investigate hydrological dynamics and potential causes. A hydrologic model (SWAT+) was parameterized for the gauged watersheds and extended to the ungauged watersheds using multisite regionalization techniques. The SWAT+ model performed very good to satisfactory for daily streamflow in all watersheds with respect to the objective functions, Kling–Gupta efficiency (KGE), the Nash–Sutcliffe efficiency (NSE), Percent bias (PBIAS). The findings reveal notable changes of lake inflows and lake levels over the past two decades. Chamo Lake experienced an increase in area by 11.86 km², in depth by 4.4 m, and in volume by 7.8 x 10⁸ m³. In contrast, Lake Abijata witnessed an extraordinary 68% decrease in area and a depth decrease of 1.6 m. During the impact period, the mean annual rainfall experienced a decrease of 6.5% and 2.7% over the Abijata Lake and the Chamo Lake, respectively. Actual evapotranspiration decreased by 2.9% in Abijata Lake but increased by up to 0.5% in Chamo Lake. Surface inflow to Abijata Lake decreased by 12.5%, while Lake Chamo experienced an 80.5% increase in surface inflow. Sediment depth in Chamo Lake also increased by 0.6 m. The results highlight that the changing hydrological regime in Chamo Lake is driven by increased surface runoff and sediment intrusion associated with anthropogenic influences. The hydrological regime of Abijata Lake is affected by water abstraction from feeding rivers and lakes for industrial and irrigation purposes. This integrated methodology provides a holistic understanding of complex data-scarce hydrological systems and potential driving factors in the Rift Valley Lakes in Ethiopia, which could have global applicability.

How to cite: Ayalew, A. D., Wagner, P. D., Sahlu, D., and Fohrer, N.: Unveiling Hydrological Dynamics in Data-Scarce Regions:A Comprehensive Integrated Approach, EGU General Assembly 2024, Vienna, Austria, 14–19 Apr 2024, EGU24-58, https://doi.org/10.5194/egusphere-egu24-58, 2024.

EGU24-95 | ECS | Orals | HS2.4.2

Flood prediction based on weather parameters using advanced machine learning-metaheuristic approaches 

Sandeep Samantaray, Abinash Sahoo, and Deba P Satapathy

Flood prediction has become more popular worldwide because of the devastating socioeconomic effects of this hazard and the predicted rise in its frequency in the near future. In India, public health, civil engineering, and agriculture are all greatly affected by flooding. Anything can be flooded, with levels ranging from a few inches to many feet. They may appear suddenly or develop gradually. The intensity and frequency of flooding will frequently increase due to human modifications to the environment. More frequent and severe weather occurrences could lead to more violent floods. Utilizing data-driven and machine-learning models to solve flow- and flood-related problems has lately gained traction as a subject of study. ML model shows two key advantages over traditional physically-based models controlled by differential equation systems. Firstly, without requiring a complete a priori understanding of the phenomenon, data-driven models are able to generate reasonably accurate predictions. The quantity, quality, and variety of data that are accessible all affect how accurate the model is. This feature shows that we can avoid the complexity of problems faced by physical-based models caused by the growing number of important components by learning from observational data. Second, data-driven flood models replace numerical integration of differential equations, which is an iterative process, with non-iterative procedures like forward propagation of neural networks.

We chose to study the floods in the Barak River basin (BRB), India, a high-elevation and quickly urbanized river basin that is prone to frequent flooding because of recent evidence of the impacts of regional climate change on the hydrological cycle. Using principal component analysis (PCA), the optimal inputs were found. Decision-makers in the hydrological field of research need accurate information regarding effective predictors. This study looks into the viability of using weather input data (rainfall, humidity, evapotranspiration, temperature) to predict monthly floods using a support vector machine customized with Manta-Ray foraging optimization (SVM-MRFO). The accuracy of SVM-MRFO was assessed by comparing it against SVM tuned by the Firefly algorithm, whale optimization algorithm, Salp swarm algorithm based on mean absolute errors (MAE), root mean square errors (RMSE), determination coefficient (R2), and Nash-Sutcliffe Efficiency (NSE). Implementing the FFA, WOA, SSA, and MRFO algorithms enhances the accuracy of the SVM.

The best performance metrics, NSE of 0.9914, RMSE of 0.0182, MAE of 0.0073, and BIAS of were obtained by the SVM model constructed using the MRFO training procedure, suggesting the model's potential for use in flood forecasting. The flood models in this study are significant since they were created using a mix of different inputs and AI algorithms. In conclusion, this study demonstrated the ability of AI algorithm-based models to forecast floods and produced a number of practical methods that the flood control departments of different states, regions, and nations might employ to estimate the likelihood of floods.

How to cite: Samantaray, S., Sahoo, A., and Satapathy, D. P.: Flood prediction based on weather parameters using advanced machine learning-metaheuristic approaches, EGU General Assembly 2024, Vienna, Austria, 14–19 Apr 2024, EGU24-95, https://doi.org/10.5194/egusphere-egu24-95, 2024.

Despite rising rainfall constraints on global climate-resilient agriculture, there is no clear consensus on the quantification of the wet season, leading to contentious issues in rainfall regime evolution and subsequent impacts on phenology and vegetation productivity. Hence, we conducted a comprehensive assessment of rainfall regimes between 1982 and 2020 by using a modified anomalous accumulation method on a daily scale at the pixel level. We observed divergent patterns of “wet areas becoming drier, and dry areas becoming wetter” with rainfall amount and rainy days increasing in dry regions, and decreasing in humid regions. The length of the wet season was extended in the dry regions and shortened in the wet regions, and the trends were linearly related on dryness. Simultaneously, as dryness increased, so did the length, number, and cumulative number of dry days. Concurrent increases in rainy days and dry spells indicated a seasonal rainfall regime trend toward more frequent extreme conditions in drier areas, which was not entirely consistent with a global intensification pattern of “dry getting drier and wet getting wetter”, implying increased potential risks of both floods and droughts in dry areas. For climate risk prediction, water resource allocation, and agricultural management, we advocate for a finer and more precise dynamic assessment of the wetting-drying pattern.

How to cite: Hu, Y.: Divergent patterns of rainfall regimes in dry and humid areas of China, EGU General Assembly 2024, Vienna, Austria, 14–19 Apr 2024, EGU24-126, https://doi.org/10.5194/egusphere-egu24-126, 2024.

Long-term variations in catchment evapotranspiration control water availability for human societies and freshwater ecosystems, with potential negative impacts particularly during low-flow conditions. Previous studies reported increases in water balance-derived evapotranspiration for parts of Central Europe, mostly between 1980s and 2010s. However, knowledge gaps still remain around (i) the extent of these increases in space and time, and (ii) uncertainties from the catchment water balance. Here we analyse trends in water balance-derived evapotranspiration for 461 German near-natural catchments, over multiple time windows in the last six decades. We constrain uncertainties through estimates of storage changes derived from recession analysis and the use of multiple precipitation products. Results show wide-spread, significant increases in catchment evapotranspiration during 1970s–2000s (for example, average regional trends of 3.2 mm year-2 with an uncertainty from precipitation of ±1 mm year-2 for the period 1970–2002). Yet, catchment evapotranspiration shows no significant changes or rather a tendency to the decrease after 2000s (-3.6±1.4 mm year-2 for Pre-Alpine catchments over 2000–2019). The directions of these variations are robust to the considered uncertainties and consistent with sparse in-situ data. We further discuss implications of these variations with respect to low-flow conditions.  This study offers a comprehensive synthesis on past variations in catchment evapotranspiration and their uncertainties, which is critical for a proper understanding of recent hydrological changes.   

How to cite: Bruno, G. and Duethmann, D.: Inter-decadal variations in water balance-derived catchment evapotranspiration in Central Europe and their uncertainties, EGU General Assembly 2024, Vienna, Austria, 14–19 Apr 2024, EGU24-1145, https://doi.org/10.5194/egusphere-egu24-1145, 2024.

EGU24-1420 | Orals | HS2.4.2 | Highlight

Storylines of climate variability for hydrological impact studies 

Theodore Shepherd

Physical climate storylines (physically-based unfoldings of past climate or weather events, or of plausible future events or pathways) are increasingly being used to represent the epistemic uncertainty in the forced response to climate change. But storylines can also be used to systematically explore the uncertainty space of climate variability, e.g. to construct plausible worst-case events. Their use in this latter context is perhaps less obvious since variability is generally considered to be an aleatoric rather than an epistemic uncertainty. However, for impact studies, variability is often hugely undersampled, which is a serious problem that storylines can help address. In this talk I will review the rationale behind the use of storylines, discuss some of the concerns and questions about storylines that continue to arise, and provide some examples of their use in this particular context and of how storyline and probabilistic representations of uncertainty can be usefully combined.

How to cite: Shepherd, T.: Storylines of climate variability for hydrological impact studies, EGU General Assembly 2024, Vienna, Austria, 14–19 Apr 2024, EGU24-1420, https://doi.org/10.5194/egusphere-egu24-1420, 2024.

EGU24-1538 | ECS | Posters on site | HS2.4.2

Small, flashy catchments response to variation in rainfall profile shape 

Alexandra Seawell

Flash flooding has the potential for severe consequences but is much less well understood or predictable than longer duration flooding. It is important to improve understanding of patterns of rainfall and behaviour of responding catchments in order to manage flash flooding effectively. One aspect of rainfall that could potentially affect flood hydrographs is the temporal shape of rainfall profiles.

Design flood estimation in the UK is principally based on the FSR /FEH/ReFH methodology, which uses a symmetrical centre-loaded profile for rainfall. However, recent research undertaken during Roberto Villalobos Herrera’s PhD is that front-loaded and back-loaded rainstorms occur just as frequently as centre-loaded. My PhD seeks to test how different rain profile shapes change the river flow hydrograph and flooding across the catchment.

My PhD concentrates on small catchments which have typically been less studied and because they are likely to be responsive to short, intense rainfall that can cause flash flooding. Hydrological modelling has been undertaken for 24 identified study catchments using ReFH2.3 software, which is the standard flood estimation design software in the UK. Results indicate that use of symmetrical profiles risks underestimating potential flood peaks compared to back-loaded storms. Meanwhile, time-to-peak is typically shorter for frontloaded storms indicating the hydrograph rises faster, but lagtime is shorter for back-loaded storms indicating the peak flow occurs more quickly after the peak rain. As well as modelled responses, I have also begun identifying and analysing observed hydrographs for selected study catchments to see if these show any pattern in their response to rainfall profile shapes.

How to cite: Seawell, A.: Small, flashy catchments response to variation in rainfall profile shape, EGU General Assembly 2024, Vienna, Austria, 14–19 Apr 2024, EGU24-1538, https://doi.org/10.5194/egusphere-egu24-1538, 2024.

EGU24-1918 | ECS | Posters on site | HS2.4.2

Evaporation and hydrology of the Orinoco and Amazon basins modulated by the Atlantic 

Nicolas Duque-Gardeazabal, Andrew R. Friedman, and Stefan Brönnimann

El Niño/Southern Oscillation (ENSO) strongly impacts the hydroclimate of tropical South America. However, other ocean-atmospheric oscillations in the Atlantic also have teleconnections over the continent with the most extensive tropical rainforest; these oscillations influence hydroclimate extremes (i.e. droughts and floods). Our research focuses on the physical mechanisms that link the Atlantic Sea Surface Temperature conditions with the hydrological anomalies, i.e. soil moisture, streamflow and evaporation.

This research is grounded on the consistency of a multi-evidence approach between datasets. We use independent observations of land-surface and atmospheric variables whose robustness comes from gauges, physically consistent interpolations (i.e. reanalysis), simulations or satellite-based observations. The research focuses on the satellite era (1980-) to compare several datasets. Apart from the Amazon, other important basins such as the Orinoco, Magdalena and Tocantis have received little attention; hence, we also focused on them.

The Atlantic Meridional Mode (AMM) consists of cross-equatorial Sea Level Pressure anomalies that deflect climatological winds northward or southward. Hence, the seesaw of wind anomalies produces anomalous atmospheric transport, convergence and precipitation. When dividing the analysis by independent seasons, the results show changing impacts over different subbasins of the Orinoco and Amazon. On the other hand, the Atlantic El Niño/La Niña (Atl3) weakens or strengthens the trade winds from June to August, producing moisture convergence or divergence over the Guianas and eastern Orinoco.

The SST impact on evaporation is a complex consequence of the anomalous atmospheric circulation. The cascade of abnormal atmospheric circulation modifies not just the surface water but also the radiation availability, causing hydrological anomalies. The radiation anomalies combined with the soil moisture memory control the evaporation anomalies. This dynamic also depends on the season analysed.

How to cite: Duque-Gardeazabal, N., Friedman, A. R., and Brönnimann, S.: Evaporation and hydrology of the Orinoco and Amazon basins modulated by the Atlantic, EGU General Assembly 2024, Vienna, Austria, 14–19 Apr 2024, EGU24-1918, https://doi.org/10.5194/egusphere-egu24-1918, 2024.

EGU24-2089 | ECS | Orals | HS2.4.2

Groundwater level reconstruction using long-term climate reanalysis data and deep neural networks  

Sivarama Krishna Reddy Chidepudi, Nicolas Massei, Abderrahim Jardani, and Abel Henriot

Assessing long-term changes in groundwater is crucial for understanding the impacts of climate change on aquifers and for managing water resources. However, long-term groundwater level (GWL) records are often scarce, limiting understanding of historical trends and variability. In this study, we present a deep learning approach to reconstruct GWLs up to several decades back in time using recurrent-based neural networks with wavelet pre-processing and climate reanalysis data as inputs. GWLs are reconstructed using two different reanalysis datasets with distinct spatial resolutions (ERA5: 0.25◦ x 0.25◦ & ERA20C: 1◦ x 1◦) and monthly time resolution, and the performance of the simulations was evaluated.  Long term GWL timeseries are now available for northern France, corresponding to extended versions of observational timeseries back to the early 20th century. All three types of piezometric behaviors could be reconstructed reliably and consistently capture the multidecadal variability even at coarser resolutions, which is crucial for understanding long-term hydroclimatic trends and cycles. GWLs’multidecadal variability was consistent with the Atlantic multidecadal oscillation. From a synthetic experiment involving a modified long-term observational time series, we highlighted the need for longer training datasets for some low frequency signals. Nevertheless, our study demonstrated the potential of using DL models together with reanalysis data to extend GWL observations and improve our understanding of groundwater variability and climate interactions. 

How to cite: Chidepudi, S. K. R., Massei, N., Jardani, A., and Henriot, A.: Groundwater level reconstruction using long-term climate reanalysis data and deep neural networks , EGU General Assembly 2024, Vienna, Austria, 14–19 Apr 2024, EGU24-2089, https://doi.org/10.5194/egusphere-egu24-2089, 2024.

EGU24-3925 | ECS | Orals | HS2.4.2

Multi-decadal changes in root zone water storage capacity through vegetation adaptation to hydro-climatic variability 

Siyuan Wang, Markus Hrachowitz, and Gerrit Schoups

Climate change can considerably affect catchment-scale root zone storage capacity (Sumax) which may further influence the moisture exchange between land and atmosphere, as well as stream flow and biogeochemical processes in terrestrial hydrological systems. However, direct quantification of the evolution of Sumax over multi-decadal time periods at the catchment scale has so far been rare. As a consequence, it remains unclear how climate change affects Sumax (e.g., precipitation regime, canopy water demand) and how changes in Sumax may control the partitioning of water fluxes as well as the hydrological response at catchment scale. The objectives of this study in the upper Neckar river basin in Germany are therefore to provide an analysis of muti-decadal changes in Sumax that can be observed as a result of changing climatic conditions over the past century and how this has further affected hydrological dynamics. More specifically, we test the hypotheses that (1) Sumax significantly changes over multiple decades reflecting vegetation adaptation to climate variability, (2) changes in Sumax control water availability for evapotranspiration and thus multi-decadal deviations from long-term average positions in the Budyko framework, (3) a time-dynamic implementation of Sumax affects the hydrological response, which in return can improve the performance of a hydrological model.

We found that, indeed, a hydroclimatic condition considerably changed over time in the 1953 to 2022 study period, which was reflected by related fluctuations in the values of Sumax derived directly from observed water balance data These ΔSumax values varied by up to -20% in relatively wet decades to +20% in drier decades, which was very similar to ΔSumax obtained from calibration of a hydrological model (R2=0.95, p<0.05) in individual decades. However, evaporation estimated by the hydrological model using a long-term average Sumax for the study period was almost the same as that reproduced by the model when allowing dynamically changing root-zone storage capacities over multiple decades. In addition, no significant improvement in the reproduction of the hydrological response was observed when implementing a time-variant representation of decadally varying Sumax in the model compared with the implementation of a stationary Sumax irrespective of the hydroclimatic conditions in the individual decades.

Overall, this study provides quantitative evidence that Sumax significantly changes over multiple decades reflecting vegetation adaptation to climate variability. However, these changes are not responsible for deviations from the Budyko curves in different climatic conditions, in other words, the temporal evolution of Sumax in the study region is not a major control on the partitioning of water fluxes into evapotranspiration and drainage and does have therefore no significant effects on fundamental hydrological response characteristics of the upper Neckar catchment. This suggests that model predictions of future stream flows remain rather insensitive to uncertainties introduced by the use of time-invariant long-term average values of Sumax as model parameters.

How to cite: Wang, S., Hrachowitz, M., and Schoups, G.: Multi-decadal changes in root zone water storage capacity through vegetation adaptation to hydro-climatic variability, EGU General Assembly 2024, Vienna, Austria, 14–19 Apr 2024, EGU24-3925, https://doi.org/10.5194/egusphere-egu24-3925, 2024.

EGU24-6799 | ECS | Orals | HS2.4.2

Identification of extreme climatic events using SMOS 

Nitu Ojha, Yann Kerr, and Arnaud Mialon

Soil moisture (SM) is a crucial parameter in the hydrological cycle. SM wet and dry trends help to identify extreme weather events, with a rapid increase in SM suggesting heavy rainfall or flood events and a significant or prolonged decrease in SM representing drought events. SMOS and SMAP remote sensing satellites provide surface SM data globally. The surface SM is highly variable in terms of space and time. In contrast, root zone soil moisture (RZSM) is stable and retains long-term information, making it a better indicator of prolonged drought/wet conditions. In this context, SMOS RZSM is computed from the SMOS surface SM using a simple physical model to integrate surface SM information to a root zone. The study benefits from the availability of long-term series data of the SMOS RZSM on a global scale from 2010 to 2023 (approximately 14 years). Then, the SM index is developed using long-time series data of the SMOS RZSM for a better understanding of the distribution of wet and dry SM and its link to extreme events. The study primarily focuses on Australia and Europe. The results show that the developed SMOS SM index captures heavy rainfall/flood and drought conditions. The analysis determines the occurrence of floods due to La Niña and El Niño effects over Australia and the existence of drought in Europe due to the North Atlantic oscillation. This study can help to understand the interconnected factors that influence extreme climatic conditions, ranging from natural climatic phenomena to human-induced activities.

How to cite: Ojha, N., Kerr, Y., and Mialon, A.: Identification of extreme climatic events using SMOS, EGU General Assembly 2024, Vienna, Austria, 14–19 Apr 2024, EGU24-6799, https://doi.org/10.5194/egusphere-egu24-6799, 2024.

EGU24-7568 | Posters on site | HS2.4.2

Mapping UK Drought Teleconnections from Ocean to Land 

Amulya Chevuturi, Marilena Oltmanns, Maliko Tanguy, Ben Harvey, Cecilia Svensson, and Jamie Hannaford

Given the anticipated changes in future UK drought occurrences attributable to climate change, there is an imminent requirement for a thorough understanding of the underlying influences behind UK drought events, particularly the most extreme events. In this context, our study aims to understand the North Atlantic oceanic drivers responsible for drought events in the UK, subsequently tracing the teleconnection pathways that connect these drivers to meteorological and hydrological droughts within the region. We examine the teleconnection pathways associated with drought conditions by assessing the concurrent and lagged statistical links between the UK's standardized precipitation index (SPI) and standardized streamflow index (SSI) and two distinct North Atlantic Sea surface temperature (SST) patterns, which are associated with freshening events. Our findings reveal that these North Atlantic SST patterns exert varying influences on two distinct regions of the UK (northwest and southeast), each of which have distinct hydrometeorological characteristics. The identified SST patterns are linked to the dominant modes of SST variability in the North Atlantic, thereby contributing to the predictability of drought occurrences across seasonal to multi-annual timescales, including at some very long lead times. Our research therefore has significant potential in practical applications for quantifying and managing drought risk, and for advancing drought forecasting and early warning systems through the identification of novel, skilful predictors. Ultimately, our work endeavours to contribute to the progress of sustainable water resource management amidst the escalating drought risks in the UK.

How to cite: Chevuturi, A., Oltmanns, M., Tanguy, M., Harvey, B., Svensson, C., and Hannaford, J.: Mapping UK Drought Teleconnections from Ocean to Land, EGU General Assembly 2024, Vienna, Austria, 14–19 Apr 2024, EGU24-7568, https://doi.org/10.5194/egusphere-egu24-7568, 2024.

EGU24-7930 | Posters on site | HS2.4.2

An increasing role of subsurface processes in the water circulation in the High Arctic catchment – the results from Fuglebekken, SW Spitsbergen 

Marzena Osuch, Abhishek Alphonse, Nicole Hanselmann, and Tomasz Wawrzyniak

Changes in the depth of the active layer thickness (ALT) in Arctic and permafrost regions significantly impact the transformation of rainfall into runoff. Due to climate change, permafrost thawing and ALT alterations modify how water is transported and stored within catchments, affecting surface and subsurface hydrological processes. This study investigates the associations between temporal changes in active layer thickness, hydrological model parameters, and variations in catchment responses.

The study area covers the unglaciated catchment Fuglebekken, located near the Polish Polar Station Hornsund on Spitsbergen. For hydrological modelling, the conceptual rainfall-runoff HBV model was used. Model calibration and validation were carried out on runoff data within subperiods. A moving window approach (3-week duration) using data from the summer seasons 2014-2023 was applied to derive temporal variations of parameters. Model calibration, along with an evaluation of parametric uncertainty, was performed using the Shuffled Complex Evolution Metropolis algorithm.

A comprehensive investigation of the temporal variability of HBV model parameters demonstrated consistency in the results. The smallest parametric uncertainty and the largest temporal changes were estimated for the parameter KS representing a slow runoff reservoir. Temporal variability of the KS parameter is characterized by the presence of two maxima, the first maximum at the beginning of the ablation season (due to snowmelt and ice-rich permafrost thawing) and the second maximum in September (a result of high precipitation). The temporal variability of other parameters was smaller and usually within their parametric uncertainty.

In addition, the use of the HBV model allowed for the assessment of water storage in five conceptual reservoirs characterizing catchment processes. The outcomes highlighted large changes in slow runoff reservoir, demonstrating an increasing significance of subsurface processes in the water circulation in the High Arctic catchment. 

The study was supported by the Polish National Science Centre (grant no. 2020/38/E/ST10/00139).

How to cite: Osuch, M., Alphonse, A., Hanselmann, N., and Wawrzyniak, T.: An increasing role of subsurface processes in the water circulation in the High Arctic catchment – the results from Fuglebekken, SW Spitsbergen, EGU General Assembly 2024, Vienna, Austria, 14–19 Apr 2024, EGU24-7930, https://doi.org/10.5194/egusphere-egu24-7930, 2024.

Ice-induced winter flooding, intensified by sustained low temperatures, holds the potential for severe natural disasters, but is seldom explored probabilistically considering warming climate impacts. This study established both marginal and copula-based joint probability distributions of the upstream (QH) and downstream (QL) ice-induced floods in the Lower Yellow River, a hanging river above the ground, under four parametric scenarios (constant, time as covariates, mean air temperature as covariates, and accumulated negative air temperature as covariates), to compare historical and design flood regimes using six inference methods (UNI, OR, AND, KEN, SKEN, and COND) under air temperature changes. The results show that the Lognormal and Weibull marginal distribution models with accumulated negative air temperature as covariate parameters were optimal for QH and QL, respectively and the positive dependence between QH and QL was best described by the Gumbel-Hougaard copula. Impacts of increasing air temperature on flood downtrends and yearly change-points (1990 for QH and 1985 for QL) reduced both historical QH-QL flood magnitude combinations and projected return periods, thus denoting declining flood severities over time. Due to such flood downtrends, the most probable composition (MPC) values of 100-year design floods varied from the highest (1656 m3/s for QH and 1645 m3/s for QL using the OR method) to the lowest (624 m3/s for QH and 342m3/s for QL using the SKEN method). The average decreasing rates of MPC values before and after the discerned flood change-points were 17.4% for QH and 39.6% for QL. When conditioned on the occurrence of upstream QH having flood magnitudes less than 100-year design floods, large floods downstream exceeding a 50-year return period were inferred as improbable. This study can provide a paradigm of flood projections to meet diverse flood control objectives under changing climate.

How to cite: Li, L. and Xu, C.-Y.: Probabilistic projections of winter floods considering cumulative effect of air temperature changes, EGU General Assembly 2024, Vienna, Austria, 14–19 Apr 2024, EGU24-8371, https://doi.org/10.5194/egusphere-egu24-8371, 2024.

EGU24-10340 | ECS | Orals | HS2.4.2

The Impact of GRACE Data Assimilation on Water Storage Dynamics in CLM3.5 and CLM5 

Yorck Ewerdwalbesloh, Anne Springer, and Jürgen Kusche

The GRACE (Gravity Recovery And Climate Experiment) satellite mission as well as its successor GRACE Follow-On have monitored global and regional variability of total water storage (TWS) for the past two decades. Assimilating observations from these missions into hydrological models helps to improve modeled water storages and fluxes, to overcome deficits arising from simplifications or processes that are not considered in the model (e.g. unmodeled anthropogenic impacts), and to disaggregate GRACE observations temporally and spatially. Determining the optimal approach for assimilating these observations into hydrological models remains an ongoing area of research. The choice often depends on specific applications and the characteristics of the model itself.

In this study, we analyze the water storage dynamics of two versions of the Community Land Model (CLM) - versions 3.5 and 5 - within a GRACE data assimilation framework over a 12.5 km grid covering Europe. The analysis focuses on assessing (i) the skill of both models without data assimilation, (ii) the impact of GRACE data assimilation on the model performance and (iii) the distribution of assimilation increments to different storage compartments. We evaluate water storages and fluxes simulated by both models against independent observations such as discharge from river gauges and satellite derived soil moisture. The results offer valuable insights into the impact of advancements made in biophysical processes and the representation of the carbon cycle in CLM5. Furthermore, we discuss the effectiveness of GRACE data assimilation and its influence on the behavior of CLM3.5 and CLM5, analyzing whether the assimilation helps to address differences between the two model versions - particularly considering the advancements in CLM5 - which would underline the ability of GRACE data assimilation in mitigating model deficits.

How to cite: Ewerdwalbesloh, Y., Springer, A., and Kusche, J.: The Impact of GRACE Data Assimilation on Water Storage Dynamics in CLM3.5 and CLM5, EGU General Assembly 2024, Vienna, Austria, 14–19 Apr 2024, EGU24-10340, https://doi.org/10.5194/egusphere-egu24-10340, 2024.

EGU24-10459 | ECS | Posters on site | HS2.4.2

Past, Present, and Future Impacts of Climate Change and Variability on Flood Hazards in Sub-Saharan Africa 

Job Ekolu, Bastien Dieppois, Yves Tramblay, Jonathan Eden, Moussa Sidibe, Gabriele Villarini, Simon Moulds, Louise Slater, Stefania Grimaldi, Peter Salamon, Pierre Camberlin, Benjamin Pohl, Gil Mahé, and Marco van de Wiel

Sub-Saharan Africa (SSA) is strongly affected by flood hazards, which endanger human lives and disrupt economic stability. It is therefore critical to further understand the potential impact of climate change and variability on historical and future flood hazards in SSA. To do so, we first reconstructed a complete 65-yearlong daily streamflow, presenting over 600 stations distributed throughout SSA. Using this new dataset, we found that historical trends in flood frequency, duration, and intensity were strongly modulated by decadal to multidecadal variability. We then identified internal modes of climate variability in the Pacific and Indian Oceans as primary drivers of decadal variations in flood occurrence in southern and eastern Africa. Meanwhile, decadal sea-surface temperature anomalies (SSTa) over the eastern Mediterranean region and the North Atlantic were primarily driving decadal trends in floods occurring over western and central Africa. Using 12 climate model large ensembles from the Coupled Model Intercomparison Project Phases 5 and 6 (CMIP5 and 6), we also found such decadal variations in SSTa in the Mediterranean Atlantic, Pacific, and Indian oceans could modulate the occurrence of flood hazards by up to 50% in SSA during the 21st century. Finally, combining bias-corrected CMIP6 data and the open-source hydrological model LISFLOOD, we examine the potential impact of climate change on future trends affecting the intensity, frequency, and duration of floods in West Africa. This study therefore enabled us to compare for the first time the relative importance of climate change and climate variability on future changes affecting flood hazards in SSA.

How to cite: Ekolu, J., Dieppois, B., Tramblay, Y., Eden, J., Sidibe, M., Villarini, G., Moulds, S., Slater, L., Grimaldi, S., Salamon, P., Camberlin, P., Pohl, B., Mahé, G., and van de Wiel, M.: Past, Present, and Future Impacts of Climate Change and Variability on Flood Hazards in Sub-Saharan Africa, EGU General Assembly 2024, Vienna, Austria, 14–19 Apr 2024, EGU24-10459, https://doi.org/10.5194/egusphere-egu24-10459, 2024.

EGU24-10963 | ECS | Orals | HS2.4.2

Future changes in tropical vertical velocity variance and precipitation variability 

Zhenghe Xuan, Clarissa Kroll, and Robert Jnglin Wills

Understanding precipitation variability on subseasonal-to-decadal timescales is important because of its influence on regional water resources and hydrological extremes. The response of precipitation to global warming can be understood in terms of a superposition of thermodynamic and dynamic effects. The former has been studied on a range of timescales, including ENSO variability and precipitation extremes, and is strongly constrained by Clausius-Clapeyron scaling. Changes in dynamics, however, modulate the overall change significantly and represent an important source of uncertainty in projected changes of hydrological cycle variability.

Here, we investigate changes in the variance of vertical velocity in the tropics based on monthly outputs from the Community Earth System Model 2 Large Ensemble. We find a robust decrease in the tropical vertical velocity variance under the SSP3-7.0 scenario, even in periods where the underlying ENSO-related SST variance increases. This reduction in vertical velocity variance can be explained by the deepening of the troposphere, which increases the gross moist stability and thus the energetic demands for vertical motion. Finally, we investigate the influence of reduced vertical velocity variance on precipitation probability distribution and intensity.

How to cite: Xuan, Z., Kroll, C., and Jnglin Wills, R.: Future changes in tropical vertical velocity variance and precipitation variability, EGU General Assembly 2024, Vienna, Austria, 14–19 Apr 2024, EGU24-10963, https://doi.org/10.5194/egusphere-egu24-10963, 2024.

EGU24-11244 | ECS | Orals | HS2.4.2

Inter-annual and long-term variability in streamflow elasticity to precipitation reveal bias in estimates of hydrological sensitivity 

Bailey Anderson, Louise Slater, Jessica Rapson, Manuela Brunner, Simon Dadson, Jiabo Yin, and Marcus Buechel

Empirically derived sensitivities of streamflow to precipitation are often assumed to be temporally unchanging. This assumption may be unrealistic because changes in climate and storage are known to alter this relationship. We present a non-stationary regional regression approach which is functionally similar to typical elasticity estimation approaches. This is applied to 2967 catchments in the United States to estimate variability in interannual, and trends in long-term, streamflow elasticity to precipitation over a 39-year period. We show that interannual elasticity is highly variable in water-limited catchments, indicating that these are especially sensitive to year-to-year climate variability, as compared to other regions. Interannual elasticity is more often correlated with the one-year lagged standardized precipitation index than with temperature or in-phase standardized precipitation index, suggesting that antecedent soil moisture, groundwater storage, and precipitation seasonality influence streamflow sensitivity. Finally, statistically significant long-term trends in elasticity exist in some regions, but trend magnitude is generally small. These findings suggest that an assumption of stationarity in long-term average elasticity may still be appropriate at the regional scale, however, year-to-year variation in streamflow responsiveness to precipitation is often substantial.    

How to cite: Anderson, B., Slater, L., Rapson, J., Brunner, M., Dadson, S., Yin, J., and Buechel, M.: Inter-annual and long-term variability in streamflow elasticity to precipitation reveal bias in estimates of hydrological sensitivity, EGU General Assembly 2024, Vienna, Austria, 14–19 Apr 2024, EGU24-11244, https://doi.org/10.5194/egusphere-egu24-11244, 2024.

EGU24-12189 | ECS | Orals | HS2.4.2

Surface and groundwater drought impact on natural vegetation growth and drought recovery. 

Jorge Vega Briones, Steven De Jong, Wiebe Nijland, and Niko Wanders

Droughts' persistent impact and growing use of surface water and groundwater will likely exacerbate hydrological droughts. Variations in precipitation patterns worsen the effects in particular catchment regions as a result to climate change. The end result is less groundwater recharge and multi-year droughts that impact vegetation and rivers.

An essential factor to better understand the recovery in catchments affected by drought is to understand the interaction between water availability and vegetation dynamics. At the same time, the vegetation recovery in terms of growth and productivity can also be assessed with this framework. In this study, we focus on natural catchments of central Chile which have experienced drought and multi-year drought periods with severe impacts on surface water and groundwater.

We collected 250 tree ring samples of 5 species that are susceptible to droughts in central Chile in natural catchments, and used CAMELS-CL for statistical analysis. Cross correlation analysis between surface, groundwater and vegetation dynamics was performed for each catchment to quantify the interaction between these factors. To further determine the influence of drought events on vegetation, the compound NDVI correlation and SPEI at a catchment level were used. Finally, the drought termination framework was applied to understand the recovery response of surface, groundwater and vegetation.

Our analysis identifies the typical time lag between droughts in surface water, groundwater and  their impact on vegetation growth. This is done on an annual time scale as we are looking at multi-year events. We find that the typical response time varies throughout the country, depending on the local natural water availability. These findings highlight that the multi-year drought impact on vegetation and its recovery is not uniform and should be better understand in light of climate change and the global increase in multi-year drought events.

How to cite: Vega Briones, J., De Jong, S., Nijland, W., and Wanders, N.: Surface and groundwater drought impact on natural vegetation growth and drought recovery., EGU General Assembly 2024, Vienna, Austria, 14–19 Apr 2024, EGU24-12189, https://doi.org/10.5194/egusphere-egu24-12189, 2024.

EGU24-14039 | ECS | Orals | HS2.4.2

Historical changes in the seasonality and timing of extreme precipitation events 

Gaby Gründemann, Enrico Zorzetto, Nick van de Giesen, and Ruud van der Ent
Global warming alters the hydrological cycle, influencing the seasonality and timing of extreme precipitation events. Understanding historical changes in the occurrence of extreme precipitation is important for assessing their effects. This study examines the timing and seasonality of extreme precipitation using 63 years of ERA5 data. By using relative entropy, we can assess changes in extreme daily precipitation occurrence on the global domain. Findings show notable regional differences. In the second half of the 20th century, Africa and Asia had high clustering of extreme precipitation events. Over 60 years, clustering intensified in Africa but became more spread out in Asia. North America and Australia, initially with less clustering, saw slight increases. Extreme precipitation events in extra-tropical land regions mainly occurred in summer, with minor shifts in timing. These results are important for improving risk management for hazards like flash floods and landslides and highlight the need for region-specific strategies in adapting to these changes.

How to cite: Gründemann, G., Zorzetto, E., van de Giesen, N., and van der Ent, R.: Historical changes in the seasonality and timing of extreme precipitation events, EGU General Assembly 2024, Vienna, Austria, 14–19 Apr 2024, EGU24-14039, https://doi.org/10.5194/egusphere-egu24-14039, 2024.

EGU24-14414 | ECS | Orals | HS2.4.2

Navigating Hydroclimatic Extremes: Understanding the Interplay of Climate Change and Variability 

Achala Singh, Priyank J. Sharma, and Ramesh S. V. Teegavarapu

Increased frequency of extreme and rare hydroclimatic events leading to substantial disruptions in hydrological patterns worldwide can be attributed to climate variability and change. The stationarity assumption routinely used for hydrologic design and water resources planning is no longer valid under an evolving climate. Conventional notions about hydrological stability are now challenged, considering the intricate connection between climate fluctuations and the rising prevalence of extreme weather events. High spatial and temporal variability of extreme events in tropical and semi-arid climatic regions pose challenges in assessing non-stationarity considering available data and understanding processing contributing to short and long-term changes in regional climate. This study proposes and evaluates a novel approach using nonparametric statistical tests to explore the presence of non-stationarity in hydroclimatic extremes for a tropical river basin. Further, changes in the return levels of hydroclimatic extremes under stationary and non-stationary conditions will be carried out using statistical modelling approaches. Using the proposed approach, the identification of pivotal climatic drivers, such as oceanic oscillations and atmospheric circulation patterns, and their roles in influencing hydroclimatic extremes is possible. Long-term observational data is assessed in this work to discern trends and patterns in frequency, intensity, and spatial distribution of extremes and their links to climate change and variability. The impact of shifting precipitation patterns, temperature extremes, and seasonal variations is evaluated. This research study helps to investigate the implications of climate-induced hydroclimatic extremes under diverse geographical and climatic settings. This research can help understand the impact of climate change in river basins driven by the shifts in precipitation, temperature patterns, and extremes and address water availability and management issues.

Keywords: Non-stationarity, Hydroclimatic extremes, Climatic drivers, Statistical modelling, Tropical River basin.

How to cite: Singh, A., Sharma, P. J., and Teegavarapu, R. S. V.: Navigating Hydroclimatic Extremes: Understanding the Interplay of Climate Change and Variability, EGU General Assembly 2024, Vienna, Austria, 14–19 Apr 2024, EGU24-14414, https://doi.org/10.5194/egusphere-egu24-14414, 2024.

EGU24-15120 | ECS | Orals | HS2.4.2

Groundwater storage trends in northern Italy as observed by GRACE, well measurements, and vertical land motion 

Grace Carlson, Christian Massari, Marco Rotiroti, Elisabetta Preziosi, Tullia Bonomi, Andrew Wilder, Susanna Werth, Destinee Whitaker, Tianxin Wang, Marianne Cowherd, and Manuela Girotto

Geodetic observations of the Earth’s gravitational and deformational response to changes in terrestrial water storage (∆TWS) have been essential measurements to identify regions experiencing long-term wetting and drying driven by a combination of climate and anthropogenic forces. The northern Italian Plains, home to a third of the country’s population and contributing more than half of the agricultural output, have experienced a dryer-than-normal two decades. Here, we investigate what impact these dry conditions have on the long-term groundwater storage (GWS) using observations of change in terrestrial water storage (∆TWS) from the Gravity Recovery and Climate Experiment (GRACE) and the second-generation follow-on (GRACE-FO) missions and in-situ groundwater level time series from 820 wells over the period of 2003-2022. We use a wavelet time-frequency analysis to deconstruct each signal into seasonal and long-term components and identify multi-year dry and wet epochs. We find two long periods of declining groundwater storage (2003-2007, 2015-2022), two short periods of groundwater recovery (2008-2009, 2012-2014), and one period of near-zero ∆GWS (2010-2011). We find a net volume loss of 12.0 km3 from 2003-2022. Further, we validate these ∆GWS trends and total volume loss estimates using a combination of in-situ groundwater level variations and vertical land motion observed at nearly 500 Global Navigation Satellite System (GNSS) stations. These stations show poroelastic deformation over aquifers related to groundwater storage changes and elastic loading deformation that is highly correlated with predicted elastic loading displacements from GRACE(-FO) ∆TWS outside of aquifer areas. To calculate groundwater storage from groundwater level, we estimate spatially- and depth-variable aquifer storage coefficients using a combination of lithologic information and co-located well and GNSS observations. By analyzing all three datasets in combination we can evaluate the impacts of multi-year dry- and wet- periods on groundwater resources, providing essential contextual information for future water management.

How to cite: Carlson, G., Massari, C., Rotiroti, M., Preziosi, E., Bonomi, T., Wilder, A., Werth, S., Whitaker, D., Wang, T., Cowherd, M., and Girotto, M.: Groundwater storage trends in northern Italy as observed by GRACE, well measurements, and vertical land motion, EGU General Assembly 2024, Vienna, Austria, 14–19 Apr 2024, EGU24-15120, https://doi.org/10.5194/egusphere-egu24-15120, 2024.

EGU24-15252 | ECS | Orals | HS2.4.2

Spatiotemporal Variability in Hydrological Drought Recovery Time Estimations from GRACE and GRACE-FO Data  

Çağatay Çakan, M. Tuğrul Yılmaz, Henryk Dobslaw, Fatih Evrendilek, Christoph Förste, E. Sinem Ince, and Ali L. Yağcı

This study aimed to explore the global spatiotemporal variability in hydrological drought recovery time (DRT) estimated using terrestrial water storage (TWS) and station-based precipitation data. TWS data were gathered from the Gravity Recovery and Climate Experiment (GRACE) between April 2002 and June 2017 and GRACE Follow-On (GRACE-FO) between June 2018 and September 2023. The GRACE and GRACE-FO mascon (RL06) solution were used. Precipitation data were obtained from the Global Precipitation Climatology Project (GPCP) monthly analysis product. DRT was derived from the following two approaches: (1) TWS data via storage deficit and (2) TWS and precipitation data via absolute required precipitation. Storage deficit was computed as the negative deviation of detrended TWS from climatological values. Absolute required precipitation to fill the storage deficit was estimated from the linear relationship between the cumulative detrended smoothed precipitation anomalies (cdPA) and detrended smoothed TWS anomalies (dTWSA). The end of hydrological drought was assumed as when TWS deviation turned positive for the first methodology and as when observed precipitation exceeded absolute required precipitation for the second one. Mean DRT values across continents were obtained for both the GRACE and GRACE-FO periods, and the temporal variability between these periods was explored across different continents. On average, DRT estimate was 29% higher during the GRACE period (11.2 months) than during the GRACE-FO period (8.6 months). The TWS-based method (11.5 months) yielded 38% higher DRT than did the TWS- and precipitation-based one (8.3 months). Overall, Australia exhibited the highest DRT estimate (averaging 11.3 months) among all continents for both methods, whereas Europe showed the lowest one (averaging 8.6 months), with a global average of 9.9 months. Analysis of the temporal consistency between DRT estimates from both methods revealed that 28% of estimates aligned during the GRACE period, increasing to 49% during the GRACE-FO period. In particular, the highest consistency (61%) was observed over Africa during GRACE-FO period, contrasting with the lowest consistency (17%) over Australia during the GRACE period. Overall, the consistency between the DRT estimates from the two methods increased from the GRACE period to the GRACE-FO period across all the continents by 18% to 40%, except for Europe, where consistency dropped by 3%. These findings provide insights not only into the potential of TWS data in globally estimating DRT with significant consistency but also into understanding the dynamics of global hydrological droughts, thus proving beneficial in devising management strategies for water resources.

How to cite: Çakan, Ç., Yılmaz, M. T., Dobslaw, H., Evrendilek, F., Förste, C., Ince, E. S., and Yağcı, A. L.: Spatiotemporal Variability in Hydrological Drought Recovery Time Estimations from GRACE and GRACE-FO Data , EGU General Assembly 2024, Vienna, Austria, 14–19 Apr 2024, EGU24-15252, https://doi.org/10.5194/egusphere-egu24-15252, 2024.

EGU24-19475 | ECS | Orals | HS2.4.2

Long-term changes in water resources: the challenge of disentangling water management, climate change, and natural variability 

Vincent Humphrey, Marius Egli, Johanna Wittholm, Laura Jensen, Sebastian Sippel, Annette Eicker, Gionata Ghiggi, and Reto Knutti

Every year, natural climate variability leads to droughts and floods which have significant impacts for ecosystems and societies. Water reservoirs like soil moisture, lakes, and groundwater act as natural buffers and balance these fluctuations by providing water supply during dry conditions and by storing water surplus after rain and snow events. Such natural fluctuations unfold over time scales that can reach several decades, making it challenging to assess the extent to which trends in water reservoirs observed over the recent past are caused by anthropogenic modifications. Such modifications can themselves be further partitioned into different terms. For instance, one can contrast the contribution of regional land and water management on the one hand, and the contribution of climate change on the other. Another frequent framework is to causally relate changes in water storage to individual changes in precipitation, evapotranspiration, and runoff.

In this contribution, we review the strengths and weaknesses of recent approaches used to causally attribute observed as well as projected changes in water availability. Ensembles of model simulations and factorial experiments typically represent a powerful way of assessing individual responses to drivers and developing a plausible and mechanistic understanding. However, contradictions also quickly emerge between global hydrological model simulations, which typically represent water reservoirs and water management more thoroughly, and Earth system (climate) model simulations, which include biogeochemical effects, like CO2 fertilization, that are typically neglected by hydrological models. We will show that these two incomplete modeling worlds can be reconciled with large-scale satellite observations in only a few regions, while very large uncertainties remain in other parts of the world and in particular over tropical areas.

How to cite: Humphrey, V., Egli, M., Wittholm, J., Jensen, L., Sippel, S., Eicker, A., Ghiggi, G., and Knutti, R.: Long-term changes in water resources: the challenge of disentangling water management, climate change, and natural variability, EGU General Assembly 2024, Vienna, Austria, 14–19 Apr 2024, EGU24-19475, https://doi.org/10.5194/egusphere-egu24-19475, 2024.

Several continental regions on Earth are getting wetter, while others are drying out not only in terms of precipitation but also measured by the increase or decrease in surface water, water stored in the soils, the plant root zone, and in groundwater. Drying and wetting as seen in terrestrial, space-geodetic and remote sensing data are generally ascribed to combined effects of global warming due to greenhouse gas forcing, natural variability, and anthropogenic modification of the water cycle. Existing climate models that account for these effects fail to explain observed patterns of hydrological change sufficiently. Contrary to common beliefs, observations also do not support a simple dry-gets-dryer and wet-gets-wetter logic. Instead, the observed trends, e.g. in precipitation, soil moisture, water storage, or flood discharge, differ considerably from a simplified logic.
The CRC 1502 DETECT, a collaborative research centre of the Universities of Bonn and Göttingen, the Geomar, the Research Centre Jülich and the German National Meteorological Service DWD, has been established by the German Research Foundation DFG with the objective of closing this gap of understanding. To better comprehend the origin of these patterns, DETECT  is developing a regional coupled modeling framework further that explains past observations as realistically as possible, accounts for potential drivers of change that may have been understudied in the past, and that can predict future changes. Our modelling framework is based on the TerrSysMP platform (i.e. the coupling of ICON/COSMO, CLM and ParFlow with/without data assimilation) and it ingests various conventional and new satellite and terrestrial data sets.
By applying this modelling framework to both historical and IPCC-type simulations, DETECT will test the hypothesis that humans – through several decades of land use change, and intensified water use and management – have caused persistent modifications in the coupled land and atmospheric water and energy cycles. It is hypothesized that (1) these human-induced modifications contribute considerably, compared to greenhouse gas (GHG) forcing and natural variability, to the observed trends in water storage at the regional scale, (2) land management and land and water use changes have modified the regional atmospheric circulation and related water transports and (3) these changes in the spatial patterns of the water balance have created and magnified imbalances that lead to excessive drying or wetting in more remote regions.
We test this hypothesis for the Euro-CORDEX region. In later phases, we evaluate the transferability of our approach for regions with different environmental conditions. We will develop evidence-based sustainability criteria for land and water use activities. The presentation will provide an overview on the central hypotheses and objectives of our research programme, the study logic and common approach, as well as anticipated results and contributions to the community. After two years, we highlight some first  findings.

How to cite: Siegismund, F. and Kusche, J.: Collaborative Research Centre 1502 DETECT: 'Regional Climate Change: Disentangling the Role of Land Use and Water Management', EGU General Assembly 2024, Vienna, Austria, 14–19 Apr 2024, EGU24-20232, https://doi.org/10.5194/egusphere-egu24-20232, 2024.

EGU24-20247 | Posters on site | HS2.4.2

Towards a coupled km-scale Atmosphere-Land Reanalysis for Europe 

Bernd Schalge, Jane Roque Mamani, Olaf Stein, Stefan Poll, Klaus Görgen, Jan Keller, and Arianna Valmassoi

Modelling studies in hydrology depend on a good representation of forcing data, in particular precipitation, for a good process representation, especially at the catchment  or sub-catchment scale. Forcing data is often provided through reanalysis, that use observations to obtain model states with the smallest possible errors and biases. Here, we present a prototype convection-permitting reanalysis system using a coupled atmosphere-land model system utilizing ICON-eCLM for the EURO-CORDEX domain at a resolution of 3km. Due to the high resolution it is expected that in particular precipitation will be better represented than in existing reanalyses, leading to more realistic forcing data. We analyzed precipitation and other near-surface observables from preliminary model runs and evaluated them in comparison to other widely used reanalysis products such as ERA-5 as well as to output of an ICON standalone simulation to assess potential improvements of the new reanalysis. We show potential use cases of the new reanalysis and discuss limitations of this dataset, which are related to the currently short available time series.

How to cite: Schalge, B., Mamani, J. R., Stein, O., Poll, S., Görgen, K., Keller, J., and Valmassoi, A.: Towards a coupled km-scale Atmosphere-Land Reanalysis for Europe, EGU General Assembly 2024, Vienna, Austria, 14–19 Apr 2024, EGU24-20247, https://doi.org/10.5194/egusphere-egu24-20247, 2024.

EGU24-21583 | ECS | Posters on site | HS2.4.2 | Highlight

Influence of ENSO on extreme precipitation and peak river flow in the US 

Natalie Lord, Simbi Hatchard, Jorge Sebastian Moraga, Nans Addor, and Pete Uhe

Flooding in the US results in billions of dollars of losses every year. This is projected to increase further in many regions as the climate warms, due to a combination of more frequent and severe extreme rainfall events, with resulting impacts on flooding, and increased exposure as the population increases and development in flood-prone areas continues. Superimposed on this warming signal are the impacts of different internal cycles operating within the climate system on various timescales, such as El Niño Southern Oscillation (ENSO). These cycles may act to either exacerbate or reduce the severity of extreme precipitation and flooding, and on interannual timescales, ENSO is a dominant mode of variability. A better understanding of the influence of ENSO and other modes of variability on extreme precipitation and flooding, including under climate change, is important for a number of applications. These include climate change impact assessments, policy and decision-making, early warning systems for flooding and disaster response planning, and climate-related risk planning in the (re)insurance sector.

Here, we investigate the influence of ENSO on extreme precipitation and peak river flow in the US, under both historical and future climate conditions. For the historical period, we calculate annual maximum (AMAX) daily precipitation and flow, from the Multi-Source Weighted-Ensemble Precipitation (MSWEP) precipitation and USGS river gauge datasets, respectively. To assess whether positive, neutral, or negative phases of ENSO have a significant impact on extreme precipitation and flood magnitude, we calculate the correlation between AMAX and different ENSO phases. We use a number of different ENSO indices, including the Oceanic Niño Index (ONI) used operationally by NOAA, in order to test the sensitivity of these relationships to the method used to characterise ENSO.

We also assess the impacts of ENSO on projected future changes in AMAX precipitation, using climate model data from the Community Earth System Model Large Ensemble Project Phase 2 (CESM2-LENS). For this, we calculate the relative change in AMAX daily precipitation for positive, neutral, and negative phases of ENSO, to determine how projected extreme precipitation changes differ between the phases, and how this varies spatially across the US.

How to cite: Lord, N., Hatchard, S., Moraga, J. S., Addor, N., and Uhe, P.: Influence of ENSO on extreme precipitation and peak river flow in the US, EGU General Assembly 2024, Vienna, Austria, 14–19 Apr 2024, EGU24-21583, https://doi.org/10.5194/egusphere-egu24-21583, 2024.

EGU24-18 | ECS | Posters on site | HS2.4.3

Non-stationary design rainfalls for Australia 

Lalani Jayaweera, Conrad Wasko, Rory Nathan, and Fiona Johnson

Action needs to be taken in response to the changes in future flood risk due to the impact of global warming on the magnitude and frequency of extreme rainfalls. Projected changes in extreme rainfalls can be used to estimate the associated changes in design flood estimates using Intensity-Frequency-Duration (IFD) curves in combination with event-based flood models. IFD curves are estimated from records of historical annual maxima across different storm durations and exceedance probabilities. Past studies investigating changes in extreme rainfall across Australia have been limited in scope as they have focused on single durations, single exceedance probabilities, or limited regional extents. This means that we do not yet have a comprehensive understanding of how projected changes in extreme rainfalls impact on IFD curves.

Here, to fill this gap, we investigate the changes in extreme rainfall changes across different storm durations and exceedance probabilities across 42 stations which span the entire continent of Australia. We begin with examining the trend in annual maximum rainfall across 16 different storm durations (6 min to 7 day) using the Theil-Sen slope estimator, testing for statistical significance using the Mann-Kendall test. To extrapolate 1% annual exceedance probability, we fit non-stationary Generalized Extreme Value Distributions (GEVs) at each site. Non-stationarity was assessed by varying the location parameter, varying the scale parameter, and varying both the location and scale parameters as a linear trend in time.

We find that the short duration (<1 hr) annual maximum rainfalls have increased across Australia, but longer duration annual maxima (>1 hr and 1 day) show fewer positive trends with some sites exhibiting negative trends. Based on Akaike Information Criteria, the GEV models which varied either the location parameter, or both the scale and location parameters, were found to be superior. However, when changes in quantile estimates were examined for rare exceedance probabilities (up to the 1 in 100 AEP), it was found the GEV model which only varied the location parameter was unable to capture the increased rate of change in extreme rainfalls. Accordingly, we conclude that changes in extreme rainfalls is best represented by non-stationary models that incorporate changes in both location and scale parameters.

How to cite: Jayaweera, L., Wasko, C., Nathan, R., and Johnson, F.: Non-stationary design rainfalls for Australia, EGU General Assembly 2024, Vienna, Austria, 14–19 Apr 2024, EGU24-18, https://doi.org/10.5194/egusphere-egu24-18, 2024.

EGU24-361 | ECS | Orals | HS2.4.3

Evolution of Hydro-Meteorological Whiplash Events (Compound Floods and Droughts) over India 

Debankana Bhattacharjee and Chandrika Thulaseedharan Dhanya

In recent decades, the heightened frequency of extreme hydro-meteorological events such as floods and droughts has emerged as a global concern. These events not only pose a significant threat to individual societies but also exert lasting impacts on entire ecosystems. Of particular concern is the occurrence of whiplash events, where rapid transitions from wet to dry spells or vice versa amplify the already substantial impacts on various spatial and temporal scales. This study delves into the potential risks associated with the immediate succession of dry spells following wet spells and the heightened likelihood of intense compound occurrences fueled by concentrated rainfall distribution. Spanning 7 decades from 1951 to 2019, this research employs Event Coincidence Analysis or ECA to examine the aggregated whiplash behaviour in the Indian subcontinent. Our investigation focuses on the frequency of compound whiplash events, specifically dry spells followed by wet spells. Intriguingly, the findings reveal that, on average, 45 to 60% of dry spells across the majority of India are followed by wet spells within a 3-month window or 90 days. Moreover, our analysis demonstrates that the rate of wet spells triggering subsequent dry spells surpasses the reverse scenario. Consistent with the overall trend, compound flash floods and droughts, categorised by high intensity but brief duration, have been notably prevalent from 1951 to 2019. Although the spatial coverage of these events remains relatively small, recent decades have witnessed a discernible increase of 7–9%, primarily in arid, semi-arid, and tropical monsoon regions. Limited occurrences in tropical savannahs and humid subtropical regions were also noted. While the spatial structures associated with increased whiplash frequency appear less organised compared to individual dry and wet spells, the study underscores significantly higher ratios. This suggests that, despite the modest spatial coverage, whiplash events have experienced a notable increase in frequency over the past three decades. This comprehensive analysis contributes valuable insights into the evolving landscape of hydro-meteorological extremes, emphasising the growing importance of understanding compound events for effective climate resilience and adaptation strategies.

How to cite: Bhattacharjee, D. and Dhanya, C. T.: Evolution of Hydro-Meteorological Whiplash Events (Compound Floods and Droughts) over India, EGU General Assembly 2024, Vienna, Austria, 14–19 Apr 2024, EGU24-361, https://doi.org/10.5194/egusphere-egu24-361, 2024.

The global hydrological cycle is substantially influenced by climate change, leading to notable alterations in hydroclimatic extremes. This encompasses extreme precipitation and temperature events, ultimately amplifying the frequency and intensity of floods. Analyzing the trends in floods and the related covariates provides insight into regional patterns of flood changes and shifts in flood generation mechanisms within the selected catchments. An improved understanding of the processes driving the historical changes in this natural hazard can provide basic information to enhance our preparation and mitigation efforts. Differences in significant trends (non-stationarities) in the magnitude and frequency of flood-related characteristics are determined for the river basins of Peninsular India through analysis of AMS (Annual Maximum Series) and POT (Peaks Over Threshold) series of streamflow over the period 1979–2019. Scrutiny of the trend detection results provided a better understanding of the strengths and limitations of AMS and PDS approaches in analyzing flood characteristics. Non-stationarity in the flood peaks is attributed to precipitation and temperature dynamics. This is accomplished by developing Generalised Pareto regression models to establish a relationship between the flood peaks and basin-averaged precipitation and temperature at different time scales preceding the flood events. Our findings emphasize the importance of understanding climatic conditions driving flood events and incorporating the same for assessing hydroclimatic risks with changing climate patterns, ultimately fostering more resilient and sustainable strategies.

How to cite: K.v., A. and V.v., S.: Detection and attribution of non-stationarity of flood characteristics across the Peninsular Basins of India, EGU General Assembly 2024, Vienna, Austria, 14–19 Apr 2024, EGU24-445, https://doi.org/10.5194/egusphere-egu24-445, 2024.

EGU24-855 | ECS | Orals | HS2.4.3

Meteorological Droughts in India under Climate Change Conditions: A Complex Networks-based Approach 

Devika Chandrababu Salini and Bellie Sivakumar

Droughts pose substantial challenges to water resources, ecosystems, and agriculture. Climate change is anticipated to result in more frequent and greater magnitude droughts in the future. The present study assesses meteorological droughts in India under climate change conditions using a complex networks-based approach. The Standardized Precipitation Index (SPI) values at a duration of 1, 3, 6, and 12 months are used to assess the meteorological droughts. Observed precipitation data from the India Meteorological Department (IMD) and precipitation outputs from 53 GCMs participating in the Coupled Model Intercomparison Project Phase 6 (CMIP6) are used. The data considered are at a spatial resolution of 1° x 1°, covering a total of 288 grids across India. The Shortest Path Length is used as a network measure to rank the GCMs. First, the network is constructed by treating each grid as a node and identifying the links between any pair of grids according to certain threshold conditions in correlations in SPI values. Next, the GCMs are individually ranked for each of the 288 grids based on the difference in the shortest path length between the observed and GCM-simulated SPI networks. Then, the Group Decision-Making (GDM) approach is applied toidentify the top-performing GCMs across all the 288 grids. Finally, the inclusion of a comprehensive rating metric (RM) value provides a unified approach to combine the ranks obtained for GCMs across various duration (1, 3, 6, and 12 months). The results indicate that NorESM2-MM, CESM2-FV2, KACE-1-0-G, SAM0-UNICON, and CMCC-CM2-SR5 are the top five models in terms of performance. Data from these five models are then studied using Event Synchronization (ES) to uncover the spatial connections in drought events across space. This novel approach contributes to a better understanding of the spatial dynamics of meteorological droughts, especially under climate change.

How to cite: Chandrababu Salini, D. and Sivakumar, B.: Meteorological Droughts in India under Climate Change Conditions: A Complex Networks-based Approach, EGU General Assembly 2024, Vienna, Austria, 14–19 Apr 2024, EGU24-855, https://doi.org/10.5194/egusphere-egu24-855, 2024.

EGU24-960 | Posters virtual | HS2.4.3

Examining the spatial and temporal characteristics of hydrological drought in the largest basin of the Indian Peninsula 

Meghomala Ghosal, Somil Swarnkar, and Soumya Kundu

The intensified warming conditions have substantially impacted the occurrence, duration, and magnitude of severe hydroclimatic events worldwide. Consequently, economic conditions have experienced considerable influence in the past decades. Droughts, in particular, are complex catastrophic events, rendering them extremely unpredictable and hard to comprehend. It is a gradual and prolonged catastrophe marked by insufficient rainfall, leading to a scarcity of water. In addition, drought is often defined as a period of reduced rainfall resulting in water shortage. It is frequently assessed by examining combinations of many factors, such as precipitation, temperature, and soil moisture. Specifically, hydrological droughts are precisely characterized as prolonged periods when water levels in rivers and streams fall below a preset threshold value. Furthermore, frequent occurrences of hydrological drought pose a significant threat to freshwater resources. Thus, identifying the spatiotemporal characteristics of preceding droughts is crucial for the effective management of future water resources. Hence, this work focuses on analyzing the spatial and temporal patterns of hydrological drought events that occurred between 1964 and 2020 in the Godavari River Basin (GRB) located in the peninsular area of India. The GRB has an area of roughly 0.3 million square kilometers, making it the biggest river basin in peninsular India. Over the last several decades, the GRB has been confronted with severe drought conditions. Therefore, the present analysis utilized the dataset of daily observed water discharge data collected at 21 gauging stations by the Central Water Commission (CWC). In addition to eliminating minor droughts and aggregating droughts, the 'Variable Threshold' concept is utilized to derive hydrological drought characteristics at various stations, including intensity, deficit, and duration. According to our findings, significant spatial and temporal variation is evident in the regional hydrological drought characteristics of the GRB. Additionally, flash drought conditions have been reported at multiple stations. The results derived from this research contribute to the advancement of knowledge regarding the spatiotemporal patterns of droughts in the GRB.

How to cite: Ghosal, M., Swarnkar, S., and Kundu, S.: Examining the spatial and temporal characteristics of hydrological drought in the largest basin of the Indian Peninsula, EGU General Assembly 2024, Vienna, Austria, 14–19 Apr 2024, EGU24-960, https://doi.org/10.5194/egusphere-egu24-960, 2024.

EGU24-980 | ECS | Posters virtual | HS2.4.3

Spatio-temporal characteristics of floods in the largest basin of the Indian Peninsula 

Shreejit Pandey, Somil Swarnkar, and Soumya Kundu

The intensification of the hydrological cycle is a consequence of the rising global temperatures caused by global warming. This has worsened extreme hydrological occurrences, including floods. Flooding is a substantial global hazard that endangers human livelihoods, infrastructure, and economies. Furthermore, the combination of rising temperatures and human activities has significantly modified the flood patterns that have been documented worldwide by several scientists. More precisely, a substantial area of the Indian sub-continent is greatly impacted by regular instances of flooding. Previous studies have indicated an increase in both the magnitude and frequency of flood events in the Indian river basins during the past several decades. The Godavari River Basin (GRB), which is the biggest peninsular basin in India with an area of 312,812 square kilometers, has been prone to frequent and devastating flood events in recent decades. Nevertheless, the comprehensive flood attributes, such as the maximum intensity, total amount, and length, in the GRB remain unidentified. Hence, in this study, we have employed the peak-over-threshold and Master Recession Curve (MRC) techniques to evaluate the flood features in the GRB. We have utilized the daily recorded water flow information obtained from the Central Water Commission (CWC) from 21 gauging stations in the Godavari River Basin (GRB). The 21 gauging stations are categorized into four main geographical zones. The results of our research indicate that there are notable differences in the regional flood characteristics of the GRB in terms of both spatial and temporal scales. The majority of stations in the GRB exhibit substantial fluctuations in flood characteristics after 1995. More precisely, the western GRB exhibits a notable decrease in the amount, length, and intensity of floods after 1995. The data suggest that human actions have a significant role in the flood generation process in the western GRB area. The conclusions derived from this research will be valuable to policymakers and many stakeholders in their efforts to reduce flooding and promote equitable growth in the GRB.

How to cite: Pandey, S., Swarnkar, S., and Kundu, S.: Spatio-temporal characteristics of floods in the largest basin of the Indian Peninsula, EGU General Assembly 2024, Vienna, Austria, 14–19 Apr 2024, EGU24-980, https://doi.org/10.5194/egusphere-egu24-980, 2024.

EGU24-1108 | Orals | HS2.4.3

Climate Change Effects on Flood Hazard and Risk in Harami̇dere Basin 

Egemen Firat, Buse Özer, Koray K. Yılmaz, Gülçin Türkkan Karaoğlu, and Esra Fitoz

In flood hazard and risk assessment studies, modeling is generally done by examining the hydrometeorological events that have developed by using past datasets. Recently, increasing rainfall per unit time due to climate change may cause flash floods. Hydrographs, which are input to 1D/2D hydrodynamic models, are also likely to change as a result of climate change. Hydrological calculations based on past data may underestimate the predicted values. Therefore, flood risks produced from the results of flood depth and hazard models may also remain at low values. In this study, firstly, a hydrological modeling study was carried out on the streams in Haramdere Basin by using hydrometeorological measurements between 2010-2022 and hydrographs were produced for Q2, Q5, Q10, Q25, Q50, Q100, Q500 and Q1000 returning periods. In mapping studies, river structures, stream geometry, digital surface and terrain model were determined using ground measurements and flight data. Then, flood depth and hazard maps were created with 1D and 2D hydrodynamic models. Economic risk calculation was made using these maps. Then, RCP8.5 scenarios known as having high precipitation anomalies for all climate models included in CMIP6 were re-run in the hydrological model. In this way, flow data were generated for each climate model RCP8.5 scenario. Then, 3 different climate change impacts (worst, medium and best) for Haramidere Basin in regards to flood hazard and risk will be revealed by analyzing the rainfall and runoff extremes produced from the hydrological model for all climate models. In the worst case scenario, the climate model with the highest rainfall and runoff extremes, in the medium case, the average of the values calculated from all climate models and in the best case scenario, the climate model with the lowest extremes will be selected. In this way, climate models specific to this basin will be determined for these 3 different Scenarios. Then, from these selected climate models, coefficients will be determined to be used in hydrological calculations for the effect of climate change on flooding events. Finally, flood risk calculations will be made for these 3 scenarios and the economic value of climate change in terms of flood risk will be quantified by comparing with the flood risk calculated with the measurements between 2010-2022.

How to cite: Firat, E., Özer, B., Yılmaz, K. K., Türkkan Karaoğlu, G., and Fitoz, E.: Climate Change Effects on Flood Hazard and Risk in Harami̇dere Basin, EGU General Assembly 2024, Vienna, Austria, 14–19 Apr 2024, EGU24-1108, https://doi.org/10.5194/egusphere-egu24-1108, 2024.

EGU24-1125 | ECS | Posters on site | HS2.4.3

Climate-Informed-Seasonal Mixing Approach to Estimate Flood Quantiles 

Abinesh Ganapathy, Bruno Merz, Sergiy Vorogushyn, and Ankit Agarwal

Traditional flood frequency analysis assumes that the probability distribution is stationary over time. However, this assumption has been challenged, given widespread changes in catchments and climate. One of the inherent handicaps of the stationarity assumption is its non-inclusion of changes in extremes associated with future climatic conditions. To overcome this handicap, climate covariates can be incorporated into the estimation of flood probability through the non-stationary Climate-Informed Flood Frequency Analysis (CIFFA). The CIFFA methodology comprises 1) selection of predictands (usually seasonal maxima), 2) identification of suitable predictors (large-scale climate indices), and 3) derivation of a statistical link between predictands and predictors. Since CIFFA typically considers the flood peaks in the dominant season, its applicability to gauges, where flood extremes occur in several seasons, is limited. Here, we develop and test a novel non-stationary Climate-Informed-Seasonal-Mixing approach across various European basins. In the proposed Climate-Informed-Seasonal-Mixing approach, we fit the seasonal peak distribution (boreal seasons) with the location parameter conditioned on the selected covariate using the Bayesian Inference. The best climate covariates for each season among a set of predictors are identified based on widely applicable information criterion (WAIC), which computes log posterior predictive density and adjusts the overfitting using the effective number of parameters. Even the traditional stationary model could be a preferred model for any season if it has a minimum WAIC value. Following the estimation of seasonal distribution parameters, the annual flood quantiles are derived by multiplicatively mixing all the seasonal distributions. In order to demonstrate the performance of the proposed approach, we split the entire period into calibration and validation sets, fitting the model based only on calibration samples. The projected quantiles during the validation period are then compared with a benchmark model (traditional model fitted solely with validation samples). Our results suggest that for many gauges, the flood quantiles estimated by the proposed Climate-Informed-Seasonal-Mixing approach align with the baseline estimates where the traditional approaches fall short.

How to cite: Ganapathy, A., Merz, B., Vorogushyn, S., and Agarwal, A.: Climate-Informed-Seasonal Mixing Approach to Estimate Flood Quantiles, EGU General Assembly 2024, Vienna, Austria, 14–19 Apr 2024, EGU24-1125, https://doi.org/10.5194/egusphere-egu24-1125, 2024.

EGU24-1235 | ECS | Posters on site | HS2.4.3

How unusual was Australia's 2017-2019 Tinderbox Drought? 

Georgina Falster and Sloan Coats

Australia’s Murray-Darling Basin experienced three consecutive years of meteorological drought across 2017–2019, collectively named the ‘Tinderbox Drought’. Rainfall deficits during the three-year drought were focussed in the Australian cool season (April to September), and deficits in both the cool season and the annual total were unprecedented in the instrumental record. However, at ~120 years long, Australian rainfall records are not long enough to have captured the full possible range of variability, particularly for multi-year extreme events. That is, observations are an incomplete sampling of the full possible range of rainfall variability. Climate model simulations may provide longer timeseries, however climate models have known biases in Australian rainfall (Grose et al. 2020). Therefore, to determine if the Tinderbox Drought was outside the expected range of internal variability, we constructed Linear Inverse Models (LIMs) that simulate internal variability in Australian rainfall and associated global sea surface temperature (SST) anomalies. We used the LIMs to produce 10000-year-long rainfall records that emulate the stationary statistics of observed Australian rainfall, hence reflecting more of the full possible range of variability.


Overall, we find that rainfall deficits were most severe 1) in the northern Murray-Darling Basin; and 2) during the final year of the drought (2019). Global SST anomalies during the drought mostly did not resemble the pattern that is most reliably associated with low rainfall over the Murray-Darling Basin (warm anomalies in the central tropical Pacific and the western Indian Ocean). In fact, global SST anomalies observed during the Tinderbox Drought are not reliably associated with negative rainfall anomalies across the Murray-Darling Basin—this is particularly the case for the first two years of the drought. In terms of single-year rainfall anomalies, the only aspect of the Tinderbox Drought that was beyond the expected natural range was annual-total rainfall over the northern Murray-Darling Basin during 2019. However, when considered in terms of basin-wide rainfall over the full three years, negative anomalies during the Tinderbox Drought were beyond the expected natural range in terms of both cool season and annual rainfall. This suggests an anthropogenic contribution to the severity of the drought. Additionally, we find that Linear Inverse Models are a valuable tool for estimating whether or not an observed extreme rainfall event falls within the expected natural range.

References

Grose, M. R., Narsey, S., Delage, F. P., Dowdy, A. J., Bador, M., Boschat, G., et al. (2020). Insights from CMIP6 for Australia's future climate. Earth's Future, 8, e2019EF001469.

How to cite: Falster, G. and Coats, S.: How unusual was Australia's 2017-2019 Tinderbox Drought?, EGU General Assembly 2024, Vienna, Austria, 14–19 Apr 2024, EGU24-1235, https://doi.org/10.5194/egusphere-egu24-1235, 2024.

EGU24-1256 | ECS | Posters virtual | HS2.4.3

Runoff variation and progressive aridity during drought in catchments in southern-central Chile 

Guillermo Barrientos, Rafael Rubilar, Efrain Duarte, and Alberto Paredes

Persistent drought events frequently intensify the aridity of ecosystems and cause catchments runoff depletion. Here, using large and long-term data sets of meteorological and hydrologic variables (precipitation, runoff, temperature and potential evapotranspiration) investigated the major causes that modulated catchment runoff depletion between years 1980 and 2020 in southern central Chile. We identify the hydrological years where aridity index intensified and analyzed its relationship with annual runoff, and evaluated the effect of annual evaporation index and annual aridity index on water balance of 44 catchments with different precipitation regimes located between 35° and 40°S. Our results showed that observed precipitation and runoff significantly decreased between 1980 and 2020 in 64% of the catchments in the study area. Potential evapotranspiration increased significantly in 39% of the catchments. The runoff value decreased as the aridity index increased from 0.3 to 6.7, and the Budyko curve captured 98.5% of the annual variability of all catchments. Furthermore, for an extreme aridity index (e.g. 6.5), potential evapotranspiration far exceeds mean annual runoff and precipitation. Catchment runoff is modulated by the aridity index, which is a key indicator of insufficient precipitation. As expected, for any type of drought, precipitation and evapotranspiration are key factors modulating catchment runoff response. Hydrological years in which precipitation decreased, showed a decreased runoff trend. This result suggest that meteorological droughts tend to significantly decrease observed runoff. However, our results suggest that runoff in catchments, under consecutive years of water stress, will suffer from an even more severe water deficit in today’s rapidly changing global climate with negative impacts on ecosystem services and human activities.

How to cite: Barrientos, G., Rubilar, R., Duarte, E., and Paredes, A.: Runoff variation and progressive aridity during drought in catchments in southern-central Chile, EGU General Assembly 2024, Vienna, Austria, 14–19 Apr 2024, EGU24-1256, https://doi.org/10.5194/egusphere-egu24-1256, 2024.

EGU24-1738 | ECS | Orals | HS2.4.3

Understanding past changes in Australian droughts and their drivers 

Matt Grant, Anna Ukkola, Elisabeth Vogel, Sanaa Hobeichi, Andy Pitman, and Andrew Hartley

Australia is frequently exposed to considerable impacts from severe and widespread droughts. Despite this, a comprehensive understanding of the past trends and drivers of Australian droughts remains elusive. Existing studies have often characterised past trends based on changes in mean values rather than the extremes. However, given Australia’s exceptionally variable climate, this may fail to capture the full nature of the country’s drought trends. Furthermore, studies often rely on a limited number of drought indicators and may not encompass the diverse meteorological, hydrological and ecological conditions contributing to drought.

This work explores past drought trends in Australia using multiple drought indicators. We analyse changes in traditional drought metrics, including precipitation, runoff and soil moisture, defining droughts as time periods below the 15th percentile. We complement these metrics with an impacts-based drought indicator built from government drought reports using machine learning. We explore the drivers of drought trends using explainable machine learning methods, and consider multiple drivers including large-scale climate features, land surface properties and past conditions. Using a diverse range of metrics allows for a more comprehensive analysis of drought changes experienced over the past decades and will provide greater insight into the main drivers behind Australian droughts.

How to cite: Grant, M., Ukkola, A., Vogel, E., Hobeichi, S., Pitman, A., and Hartley, A.: Understanding past changes in Australian droughts and their drivers, EGU General Assembly 2024, Vienna, Austria, 14–19 Apr 2024, EGU24-1738, https://doi.org/10.5194/egusphere-egu24-1738, 2024.

EGU24-3964 | Orals | HS2.4.3

Extreme flood analysis on the Garonne river at Agen, using historical information since 1435 

Michel Lang, Jérôme Le Coz, Felipe Mendez-Rios, Perrine Guillemin, David Penot, and Didier Scopel

The safety of nuclear power plants in France is assessed based on 1000-year flood estimates, with a safety factor accounting for uncertainty. Previous studies on the Garonne River near Agen, France, used threshold exceedance values from a continuous 85 year-long series at two hydrometric stations: Malause (1915-1966) and Lamagistère (1967-2000), and historical data at Agen since 1770. The estimate of the design flood was very sensitive to the choice of an Exponential or of a Generalized Pareto distribution, yielding 12 600 and 16 000 m3/s, respectively. This communication presents a more comprehensive study based on a GEV distribution fitted from the annual maximum values of a continuous series since 1852 (adding Agen 1852-1914) and historical data at Agen since 1435. The statistical framework accounts for both discharge and sampling uncertainty components. The first uncertainty component is about 3% for the recent years and 35% for the oldest years. The statistical framework is able to account for a multiplicative error on rating curves. This leads to corrections in peak discharge values, with better agreement between historical data at Agen and hydrometric data at Malause-Lamagistère. The final estimate of the design flood is around 10 500-11 600 m3/s, without or with the largest known historical flood of 1435. It confirms the safety of the nuclear plant, based on extensive historical information.

How to cite: Lang, M., Le Coz, J., Mendez-Rios, F., Guillemin, P., Penot, D., and Scopel, D.: Extreme flood analysis on the Garonne river at Agen, using historical information since 1435, EGU General Assembly 2024, Vienna, Austria, 14–19 Apr 2024, EGU24-3964, https://doi.org/10.5194/egusphere-egu24-3964, 2024.

EGU24-4044 | Posters on site | HS2.4.3

HYDROLOGICAL DROUGHT – Processes and Estimation Methods for Streamflow and Groundwater 

Lena M. Tallaksen, Henny A.J. Van Lanen, Jamie Hannaford, Hege Hisdal, Daniel G. Kingston, Gregor Laaha, Christel Prudhomme, James H. Stagge, Kerstin Stahl, Anne F. Van Loon, and Niko Wanders

Drought is a worldwide phenomenon that originates from a prolonged deficiency in precipitation, often combined with high evaporation, over an extended region. The resultant meteorological water balance deficiency may cause a hydrological drought to develop into below normal levels of streamflow, lakes, and groundwater. Contemporary knowledge and experiences from an international team of drought experts are consolidated in a textbook (Tallaksen and van Lanen et al., 2023), which builds on an earlier edition from 2004 (URL 1), with significant new material added. An updated synthesis was requested given the high relevance and severe impacts of drought seen in many regions of the world in recent years, along with the increasing knowledge gained over the last two decades. A majority of these studies focus on climate and climatology approaches, whereas the textbook addresses hydrological drought in particular. The textbook consists of three parts; Part I (Drought as a natural hazard) discusses the drought phenomenon, its main features, regional diversity and controlling processes. Part II (Estimation methods) presents contemporary approaches to drought estimation, including data and hydrological drought characteristics, statistical analysis of drought series, incl. frequency analysis, time series analysis and regionalisation procedures, as well as process-based modelling. Part III (Living with drought) addresses aspects related to the interactions between water and people. Topics include historical and future drought, how human interventions influence drought, drought impacts and Drought Early Warning Systems. Knowledge and experiences shared in the book are from regions all over the world although somewhat biased to Europe and rivers that flow most of the year.

This presentation aims to introduce the textbook, its motivation and content to a wide audience. The textbook is supported with worked examples and self-guided tours that are elaborated more extensively on GitHub. Worked examples include online procedures, code, and details of the calculation procedures that enable readers to repeat calculations in a stepwise manner, either with their own data or by using online datasets, and we encourage user’s feedbacks and experiences in testing these. Self-guided tours are demonstrations of advanced methodologies that involve several calculation steps and are given as online presentations. Four datasets are included on GitHub; an international, a regional and two local datasets. The international dataset illustrates the drought phenomenon and its diversity across the world, whereas regional data and local aspects of drought are studied using a combination of hydroclimatological time series and catchment information. Hopefully, the textbook will contribute to an increased awareness of one of our main natural hazards, and thereby increase the preparedness and resilience of society to drought.

How to cite: Tallaksen, L. M., Van Lanen, H. A. J., Hannaford, J., Hisdal, H., Kingston, D. G., Laaha, G., Prudhomme, C., Stagge, J. H., Stahl, K., Van Loon, A. F., and Wanders, N.: HYDROLOGICAL DROUGHT – Processes and Estimation Methods for Streamflow and Groundwater, EGU General Assembly 2024, Vienna, Austria, 14–19 Apr 2024, EGU24-4044, https://doi.org/10.5194/egusphere-egu24-4044, 2024.

EGU24-4127 | ECS | Orals | HS2.4.3

Emerging river flow and hydrological drought trends in Great Britain 

Wilson Chan, Maliko Tanguy, Amulya Chevuturi, and Jamie Hannaford

Hydrological drought frequency and severity is projected to increase for the UK. However, there is not yet robust observational evidence for decreasing river flows and increasing hydrological drought severity. This lack of evidence may stem from short observational records, human influences on river flows and internal climate variability. As a result, river flow trends in the past and in the near-term may be different to the trend induced by long-term climate change. This lack of congruency poses significant challenges for decision-makers faced with uncertain future projections on the one hand and an apparent lack of observed changes on the other: underscoring the need for approaches that bridge this gap. Single-Model-Initial-Condition-Large Ensembles (SMILEs) provide an ideal opportunity to reconcile past observations and future projections as they isolate the effect of internal climate variability. Here, we use the 50-member CRCM5 12km SMILE to drive GR6J catchment hydrological models for 190 catchments across Great Britain. Results show that observed trends in precipitation and river flows are within the spread of the large ensemble, which includes both robust wetting and drying trends over the historical period that could have arisen from internal climate variability. We further estimate the time of emergence for each catchment, i.e. the decade at which river flow changes exceed natural climate variability. Winter river flows increase with warming and are estimated to exceed natural climate variability before the 2050s for many catchments, with implications for flood risk. Summer river flows are estimated to reduce with warming, including hotspots in southwest Britain with an early time of emergence, exacerbating existing pressures on water resources. Autumn flows for catchments in southeast England are estimated to decrease but are not estimated to exceed natural climate variability until late 21st century. Establishing water management and adaptation strategies is crucial well in advance of catchments reaching their time of emergence (i.e. before a statistically significant trend is detectable). These results highlight the potential to use SMILEs to explore plausible alternative realisations and explore storylines of low-likelihood, high-impact hydrological extremes.

How to cite: Chan, W., Tanguy, M., Chevuturi, A., and Hannaford, J.: Emerging river flow and hydrological drought trends in Great Britain, EGU General Assembly 2024, Vienna, Austria, 14–19 Apr 2024, EGU24-4127, https://doi.org/10.5194/egusphere-egu24-4127, 2024.

Several severe drought events occurred in the past years and droughts will likely occur more frequent and be more intense in the future. Hydrological drought, which reflects the shortage of water in the river system, can lead to economic losses and can have severe negative impacts on aquatic ecosystems. Therefore being able to predict and increase insights in which rivers are more vulnerable to hydrological droughts, based on catchment characteristics and human interactions, can be of relevance for water managers. In this analysis, the drought sensitivity of rivers is predicted at a regional scale (Flanders, Belgium). Hereby the interests of multiple stakeholders is taken into account by considering four drought metrics, namely the yearly summer volume, the number of dry days, the drought intensity and drought severity. Whereby the latter three are based on the ecological flow. To predict each of these drought metrics, five models ranging from statistical to tree-based methods are applied using twelve input variables ranging from catchment characteristics to human interactions. Hereby random forest without bootstrap and XGBoost outperforms the other methods. To increase the interpretability of the results, the XGBoost models are used to calculate the SHAP and SHAP interaction values. As a result, the impact of the different input variables on the model results is assessed.

From this analysis, some general conclusions can be drawn. Irrigation is the most important variable for each of the considered drought metrics. However, not for every drought metric a clear, unique dependence between the irrigation and the drought sensitivity of a river could be observed. Rivers which have sand as dominant soil texture in their drainage area are less vulnerable to drought. When there are more human interaction in the drainage area, the river is more vulnerable to drought. Beside this, several other dependencies are observed of which many can be explained by the difference in ease of water transferability between sandy soils and clay soils. Next to this, it became clear that the impact of forest and agricultural area on the drought sensitivity of a river is complex, whereby especially its interaction with soil texture and human activities needs further investigation. The applied method can predict the drought sensitivity of a river based on catchment characteristics and human interactions, and therefore define rivers that are more vulnerable to drought. They moreover can provide additional insights in the importance of catchment characteristics and human interactions, and their relation to the drought sensitivity of a river.

How to cite: De Meester, J. and Willems, P.: Analysing spatial variability in drought sensitivity of rivers using explainable artificial intelligence, EGU General Assembly 2024, Vienna, Austria, 14–19 Apr 2024, EGU24-4758, https://doi.org/10.5194/egusphere-egu24-4758, 2024.

EGU24-5903 | Orals | HS2.4.3

The expansion of forests and the practice of irrigated agriculture contribute to reduced river flows in southern Europe during dry years 

Sergio Martín Vicente Serrano, Ahmed El Kenawy, Dhais Peña-Angulo, Jorge Lorenzo-Lacruz, Conor Murphy, Jamie Hannaford, Simon Dadson, Kerstin Stahl, Iván Noguera, Magí Franquesa, Beatriz Fernández-Duque, and Fernando Domínguez-Castro

This research examines the changes in annual streamflow across Europe from 1962 to 2017, with a specific focus on the correlation between streamflow trends and climate dynamics, as well as physiographic and land cover characteristics. The spatial distribution of streamflow trends aligns closely with climate patterns, suggesting a climate-related influence. However, a detailed analysis at the basin scale reveals that the significant decline in streamflow in southern Europe cannot be solely attributed to climate dynamics. Instead, a discernible negative trend linked to non-climate factors becomes apparent. Specifically, our study indicates that the primary drivers of negative streamflow trends in southern Europe, especially during dry years, are forest growth and irrigated agriculture. This is attributed to the higher proportion of green water consumption compared to blue water generation. These findings hold substantial implications, particularly in the context of widely adopted nature-based solutions for addressing climate change. This includes concerns about carbon sequestration through forests and the planned expansion of irrigated agricultural lands in central and northern European countries to meet growing crop water demands. Such developments may potentially reduce the availability of water resources, leading to an increased frequency and severity of low flow periods.

How to cite: Vicente Serrano, S. M., El Kenawy, A., Peña-Angulo, D., Lorenzo-Lacruz, J., Murphy, C., Hannaford, J., Dadson, S., Stahl, K., Noguera, I., Franquesa, M., Fernández-Duque, B., and Domínguez-Castro, F.: The expansion of forests and the practice of irrigated agriculture contribute to reduced river flows in southern Europe during dry years, EGU General Assembly 2024, Vienna, Austria, 14–19 Apr 2024, EGU24-5903, https://doi.org/10.5194/egusphere-egu24-5903, 2024.

EGU24-5969 | ECS | Posters on site | HS2.4.3

New estimation models for determining the Q347 

Yanick Dups, Daniela Pavia Santolamazza, Philipp Staufer, and Henning Lebrenz

In Switzerland, low flows are described by the five percent quantile denoted by Q347. This threshold value not only has consequences for the planning, but also necessitates authorities to adjust the operation of pertinent infrastructure to mitigate ecological impacts on watercourses. Given a discharge timeseries spanning at least a ten-year period, determination of the Q347 can be done using the duration curve. Typically, said timeseries are not available for smaller catchments necessitating the estimation of the threshold value Q347. In Switzerland, the utilization of multiple linear regression has been established to estimate the area-specific discharge q347.

The primary objective of these investigations is to estimate the Q347 value for 383 ungauged catchments in the Canton of Solothurn, each covering an area less than 100 km². Daily discharge, precipitation and temperature timeseries ranging from 1990 to 2020 were collected from 56 gauged catchments smaller than 500 km² surrounding the target area. 30 “static” parameters delineating geometry, topography, geology, land use, and drainage along with nine “climatic” parameters describing temperatures, precipitation distributions, and potential evapotranspiration were defined and computed to characterize gauged and ungauged catchments. Alongside comparing three regression methods, coupled with two adjustment techniques supplementing truncated discharge timeseries, three parameter selection methods are evaluated. The validation of the proposed models shows reduced errors and increased linear correlations between estimated and observed values compared to currently applied models. Notably, a spatially more homogeneous yet catchment-specific distribution of estimated values is observable. Particularly when timeseries remain unadjusted or adjustment is done using the Antecedent Precipitation Index (API) and the flow duration curve from a donor basin (Ridolfi, E.; Kumar, H.; Bárdossy, A., 2020), the proposed models yield promising results.

Furthermore, the temporal variability of low flow events for the glacier-free catchments in the study area has been analysed. The frequency of low flow events below the threshold systematically increased over the last 30 years, while the 10-year Q347 value of said catchments has systematically decreased in the same period. The increase in low flow days leads to large errors in the estimation of the Q347 value, especially when its estimation is based on truncated timeseries. As further changes in runoff behaviour are to be expected due to climate change, extending the definition of "low flow" to include event duration and intensity alongside a fixed threshold value could offer a more suitable description.

How to cite: Dups, Y., Pavia Santolamazza, D., Staufer, P., and Lebrenz, H.: New estimation models for determining the Q347, EGU General Assembly 2024, Vienna, Austria, 14–19 Apr 2024, EGU24-5969, https://doi.org/10.5194/egusphere-egu24-5969, 2024.

EGU24-5997 | ECS | Orals | HS2.4.3 | Highlight

Surprising megafloods in Europe – learning from the big picture 

Miriam Bertola and Günter Blöschl and the Team members

Megafloods that far exceed previously observed records at a given location can take citizens and flood managers by surprise. Existing methods based on local and regional information rarely go beyond national borders and cannot predict these floods well because of limited data on megafloods, and because flood generation processes of such extremes differ from those of smaller, more frequently observed events. Here we analyse the most comprehensive dataset of annual maximum discharges in Europe available to date, to assess whether recent locally surprising megafloods could have been anticipated using observations in hydrologically similar catchments across the continent.

We base our analysis on annual maximum river discharge observations from 8023 gauging stations for the period 1810–2021. We identify about 500 “target” catchments where recent (i.e., after 1999) megafloods have occurred that are surprising based on local data. We perform a hindcast experiment of predicting their peak discharge with regional envelope curves, using flood observations from similar “donor” catchments up to the year before their occurrence. From this group of donor catchments we construct an envelope curve which we compare with the megaflood that occurred later in the target catchments. We repeat this analysis for all the detected megafloods in the target catchments.

Our analysis shows that, in 95.5% of the target catchments, the discharge of the envelope is larger than that of the observed megaflood, suggesting that, from a European perspective, almost none of the events can be considered a regional surprise. Similar results are obtained by repeating the analysis on two consecutive sub-periods, indicating that megafloods have not changed much in time relative to their spatial variability. In conclusion, our findings show that recent megafloods could have been anticipated from observations in other parts of Europe, which would not be possible using only national data.

How to cite: Bertola, M. and Blöschl, G. and the Team members: Surprising megafloods in Europe – learning from the big picture, EGU General Assembly 2024, Vienna, Austria, 14–19 Apr 2024, EGU24-5997, https://doi.org/10.5194/egusphere-egu24-5997, 2024.

Droughts are recurrent phenomena that present a large variety of space and time patterns making rather difficult the assessment of their rarity and the comparison between events. Our study focuses on the space-time “memory effect” of meteorological drought over France using gridded precipitation from the SAFRAN reanalysis over 1950-2022. The proposed easy tool of rarity matrix analyzes how drought events build and persist across time and space. The approach is purely statistic, assuming that drought consequences over a given area depend on the probability of non exceedance (“rarity”) of antecedent rainfall accumulations. In order to cover a large spectrum of “memory effects”, we consider a continuum of accumulation periods ranging from a few weeks to several years and moving windows of size 80x80 to 480x480 km2 over France. The rarity matrix of a given year displays the most severe rarity values encountered during the year as a function of the various accumulation periods and the various spatial scales.

Over the study period of 1950-2022 we show how the shape of rarity matrix discriminate short- and long-term historical droughts, as well as regional to national droughts.

As an additional asset, the rarity matrix is also able to analyze the rarity of precipitation excess over several weeks to months or years, as it was the case in fall 2023 in France.

How to cite: Blanchet, J., Chagnaud, G., and Creutin, J.-D.: The multi-scale rarity matrix – a comprehensive tool to analyze the space-time severity of meteorological drought, with application to France, EGU General Assembly 2024, Vienna, Austria, 14–19 Apr 2024, EGU24-6086, https://doi.org/10.5194/egusphere-egu24-6086, 2024.

EGU24-6166 | ECS | Orals | HS2.4.3

Heavy-tailed flood peak distributions: What is the effect of the spatial variability of rainfall and runoff generation? 

Elena Macdonald, Bruno Merz, Viet Dung Nguyen, and Sergiy Vorogushyn

The distributions of many observed time series of daily precipitation and streamflow show heavy tail behaviour. This means that the occurrence of extreme events has a higher probability than would be the case if the tail was receding exponentially. To avoid underestimating extreme flood events in their occurrence probability or their magnitude, a robust estimation of the tail behaviour is required. However, this is often hindered due to the limited length of time series. One way of overcoming this is to enhance the understanding of the processes that govern the tail behaviour of flood peak distributions. Here, we analyse how the spatial variability of rainfall and runoff generation along with the tail behaviour of rainfall affect the flood peak tail behaviour in catchments of various size. To do so, a modelling chain consisting of a stochastic weather generator and a conceptual rainfall-runoff model is used. For a large synthetic catchment (>100,000 km²), long time series of daily rainfall with varying tail behaviour and varying degree of spatial variability are generated and used as input for the rainfall-runoff model. In the rainfall-runoff model, spatially variable runoff is generated by setting respective model parameters accordingly. The tail behaviour of the simulated precipitation and streamflow time series is characterized with the shape parameter of the Generalized Extreme Value (GEV) distribution.

Our analysis shows that heavy-tailed rainfall tends to result in heavy-tailed flood peak distributions, independent of the catchment size. In contrast, first results regarding the effect of the spatial variability of rainfall on flood peak tail behaviour indicate that this relation varies with the size of the catchment. In large catchments, attenuating effects, for example through river routing, might have a stronger impact than in small basins. Regarding the runoff generation, the tail of flood peak distributions tends to be heavier when a fast runoff component is triggered simultaneously in a larger share of the catchment rather than when this is the case only very localized. This in turn is linked to more homogeneous catchment characteristics and rainfall patterns. The results of this study can help with improving the estimation of occurrence probabilities of extreme flood events.

How to cite: Macdonald, E., Merz, B., Nguyen, V. D., and Vorogushyn, S.: Heavy-tailed flood peak distributions: What is the effect of the spatial variability of rainfall and runoff generation?, EGU General Assembly 2024, Vienna, Austria, 14–19 Apr 2024, EGU24-6166, https://doi.org/10.5194/egusphere-egu24-6166, 2024.

There seem to be two contrasting views on flooding after drought. Subsurface hydrologists pose that with dry antecedent conditions there is more storage available, which leads to lower flood peaks. Surface hydrologists pose that dry, hydrophobic soils support less infiltration and more surface runoff, which leads to higher flood peaks. But which theory is true? Or can both be true? And what happens if you put people and their actions in the mix? In this presentation is discuss the scientific and empirical evidence related to drought-flood events. I draw on scientific literature, global data analysis, a review of reports and news articles, qualitative case studies, and science communication examples. I will mostly focus on hydrological processes, but also highlight some meteorological and anthropogenic aspects.

How to cite: Van Loon, A. and the PerfectSTORM team: On the drought-flood conundrum: do droughts cause more or less flooding? Let’s discuss the science, EGU General Assembly 2024, Vienna, Austria, 14–19 Apr 2024, EGU24-7811, https://doi.org/10.5194/egusphere-egu24-7811, 2024.

EGU24-8302 | ECS | Posters virtual | HS2.4.3

Projected changes in extreme precipitation and floods in central India 

Nikhil Kumar, Evan G.R. Davies, Manish Kumar Goyal, and Monireh Faramarzi

Precipitation extremes are expected to rise in a warming climate; however, the corresponding increases in flood magnitudes remain a complex and underexplored issue. This study employs the annual maxima approach to assess the relationship between extreme precipitation and floods, using a process-based hydrological model, the Soil & Water Assessment Tool (SWAT), in four river basins of central India (Brahmani and Baitarni, Subarnarekha, Mahanadi and Narmada) for past (1984-2014) and future (2030-2060 and 2070-2100). First, the SWAT models underwent rigorous data selection (climate and land cover data), calibration and validation to ensure a reliable representation of the hydrologic conditions of these basins at a daily scale, based on observations from 26 hydrometric stations for the 1988–2019 period. Second, climate projections from four CMIP6 GCMs were statistically downscaled using Bias Correction/Constructed Analogues with Quantile mapping reordering (BCCAQ) for the SSP245 and SSP585 scenarios. Finally, the SWAT models were used to project future changes in extreme precipitation and flood characteristics in the selected river basins. Considering both daily model performance (Nash-Sutcliffe Efficiency-NSE > 0.60) and catchment representativeness, we selected 10 from 26 hydrometric stations for the extreme value analysis. The analysis of the ensemble mean of the 95th percentile of four GCMs and the modelled 20-year return levels show a future increase in both precipitation (0.27 to 27.93 % and 6.19 to 50.06 %) and discharge (1.31 to 50.35 % and 5.42 to 100.73 %) at 6 out of 10 selected stations, with a more significant increase under the SSP585 scenario than the SSP245 scenario, highlighting a clear link between increased precipitation and discharge The modelling framework developed in this study will improve understanding of processes involved and the thresholds at which the central Indian catchments correspond to extreme precipitation. The findings will help the projection of future flood risks and could help to shape effective adaptation strategies in the region.

How to cite: Kumar, N., G.R. Davies, E., Kumar Goyal, M., and Faramarzi, M.: Projected changes in extreme precipitation and floods in central India, EGU General Assembly 2024, Vienna, Austria, 14–19 Apr 2024, EGU24-8302, https://doi.org/10.5194/egusphere-egu24-8302, 2024.

EGU24-8320 | Orals | HS2.4.3

Agricultural Drought Propagation over India: A Complex Network Theory Approach  

Kasi Venkatesh and Bellie Sivakumar

Agricultural drought has emerged as a significant threat to global food security and sustainable development. Despite the progress made in the identification and analysis of various characteristics for the assessment and early warning of agricultural drought, our knowledge of the mechanisms governing agricultural drought propagation remains limited. This study aims to address this gap by employing complex network theory. Specifically, the study uses complex network measures to investigate the spatial propagation of agricultural drought propagation across India during 1950–2014. Spatial drought networks are constructed using event synchronization (ES) for mild drought conditions derived from the Standardized Soil Moisture Index (SSMI) at a 3-month aggregated scale (SSMI-3). The investigation delves into the mechanisms of spatial propagation of drought, including propagation source and sink, distance and orientation using directed networks. Several metrics, including network divergence, in-degree, and out-degree, inward and outward distance, inward and outward orientation are used. These metrics play a crucial role in identifying specific locations, namely source and sink regions, propagation distance and orientation, where drought onsets extend to other areas within the regional spatial networks. The results indicate that the northwest India acts as the source region and the west central India and peninsular India act as sinks. The central and east India are identified as vulnerable regions playing crucial roles in spatial drought propagation. The results also reveal that the dominant directions of propagation lead towards the northwestern parts of India. For inward distances, shorter propagation distances of less than 50 km are observed in the peninsular, central, and some parts of the northeastern regions, while longer propagation distances are observed in the western parts of India, exceeding 150 km. For outward distances, shorter propagation distances below 20 km are observed in hilly regions, while longer propagation distances are observed in the peninsular regions of India, exceeding 80 km. These results suggest that most regions propagate droughts inward and outward, covering distances of even hundreds of kilometres. Understanding the dominant inward and outward orientation of drought propagation could play a crucial role in developing early warning systems for droughts.

How to cite: Venkatesh, K. and Sivakumar, B.: Agricultural Drought Propagation over India: A Complex Network Theory Approach , EGU General Assembly 2024, Vienna, Austria, 14–19 Apr 2024, EGU24-8320, https://doi.org/10.5194/egusphere-egu24-8320, 2024.

EGU24-8350 | Posters on site | HS2.4.3

Subway Flooding Simulation with US EPA SWMM: A Case Study of the Tamsui-Xindian Line During Taiwan's 2001 Typhoon Nari 

Yong-Jun Lin, Hsiang-Kuan Chang, Jihn-Sung Lai, and Yih-Chi Tan

There have been frequent reports of subway station flooding incidents in recent years. For instance, on October 30, 2012, Hurricane Sandy in the United States caused a storm surge combined with astronomical tide that submerged seven subway lines in New York City. It was the most severe disaster in the New York City subway system. On July 20, 2021, a flooding incident occurred in Zhengzhou, Henan Province, China, with a record hourly rainfall of 201.9mm. The heavy rain caused severe water accumulation at the Wulongkou yard of Zhengzhou Metro Line 5 and its surrounding areas. The temporary flood barrier was breached, allowing water to flood into the subway, with a maximum water depth of 1.75 meters inside the carriages and the flooding length extending approximately 1 kilometer.

In 2001, Typhoon Nari caused flooding at the Taipei Station, with 16 MRT stations also inundated. Surface roads were extensively flooded, and the Taiwan Railways Administration stations in Taipei, Wanhua, and Banqiao were submerged, resulting in a 90-day suspension of the Taipei MRT station. How to quickly evaluate the impacts of subway station flooding is crucial for the extreme weather in the future.

Therefore, this study utilized the US EPA SWMM to simulate the flooding situation of the Tamsui-Xindian line during Typhoon Nari in 2001. The SWMM calculations showed varying degrees of flooding at different stations at different times. For example, Guting Station was not affected by human intervention, while the simulated flooding depth at Taipei Station was only 0.09 m different from the actual depth. Additionally, the September 17, 2001 flood profile at 17:34 showed that Taipei Station was submerged, with water flowing to Zhongshan and Shuanglian stations. The National Taiwan University Hospital station experienced minimal flooding due to its higher elevation. The simulation also displayed the water ingress situation at different stations at various times. However, there were some inaccuracies due to the lack of detailed flood progression and inflow data and the use of a simplified station model. Nonetheless, the overall simulation results reflected the related flooding process.

How to cite: Lin, Y.-J., Chang, H.-K., Lai, J.-S., and Tan, Y.-C.: Subway Flooding Simulation with US EPA SWMM: A Case Study of the Tamsui-Xindian Line During Taiwan's 2001 Typhoon Nari, EGU General Assembly 2024, Vienna, Austria, 14–19 Apr 2024, EGU24-8350, https://doi.org/10.5194/egusphere-egu24-8350, 2024.

The aridity of a region plays a pivotal role in shaping a diverse range of hydrological processes, encompassing critical aspects such as the sensitivity of evaporation to variations in temperature and precipitation, water use efficiency, and the intricate interactions between precipitation, soil moisture, and evaporation. These processes, in turn, influence the response of hydrological extremes, such as drought and flood, to global warming. Understanding the impact of aridity on these extreme events in the context of changing climate conditions across global terrestrial ecosystems is essential for comprehending water availability and ecological resilience in different regions. This study investigates the relationships of changes in drought and flood intensities for the end of the twenty-first century with background aridity across global terrestrial ecosystems. Background aridity is quantified using an aridity index, calculated as the ratio between precipitation and evaporation. Drought is characterized by the standardized precipitation index (SPI), and flood by fitting a generalized extreme value distribution (GEV) to the annual maxima flow time series of the Inter-Sectoral Impact Model Intercomparison Project models. The results show opposite responses of drought and floods to background aridity under climate change across global terrestrial ecosystems. As aridity decreases from dry to wet regions, the intensification of flood events in the future is expected to increase. In contrast, drought intensification is more pronounced in dry and semi-dry regions. These findings hold significant implications for developing effective and region-specific water resource management policies to address hydrological extremes in a changing climate.

How to cite: Tabari, H.: Contrasting responses of drought and floods to background aridity in a changing climate across global terrestrial ecosystems, EGU General Assembly 2024, Vienna, Austria, 14–19 Apr 2024, EGU24-8460, https://doi.org/10.5194/egusphere-egu24-8460, 2024.

EGU24-9058 | ECS | Posters on site | HS2.4.3

Evaluation of soil moisture droughts under climate change in Germany 

Friedrich Boeing, Andreas Marx, Thorsten Wagener, Luis Samaniego, Oldrich Rakovec, Rohini Kumar, and Sabine Attinger

It is projected that the likelyhood and duration of extreme soil moisture (SM) droughts will increase in Germany under future warming scenarios. Annual precipitation changes are small under climate change in Germany with increases in winter and decreasing precipitation in summer for some parts of Germany. Generally, the climate ensemble spread in the future precipitation signal is large. Furthermore, impacts of SM droughts depend largely on the soil volume evaluated. We identified a gradient of stronger soil drying in shallow SM compared to deeper SM under global warming, leading to different effects on shallow-rooted vegetation compared to deep-rooted vegetation (agriculture versus forestry). In addition, spatial characteristics such as soil properties can strongly influence the dynamics of SM and thus shape the response of SM drought to changing meteorological conditions. 
In this work we evaluate the impact of the considered soil depth and spatial features on simulated changes in SM droughts in Germany. We compare this influence to the uncertainty in meteorological changes. We use a large climate ensemble based on Euro-Cordex regional climate model simulations, which were bias-adjusted and spatially disaggregated to run the mesoscale hydrological model (mHM) (mhm-ufz.org) with a high spatial resolution of 1.2x1.2km. 
This work aims to expand the picture of climate change impacts on SM droughts in Germany. The results can contribute to an improved definition of sector-specific drought indicators that will support national efforts to ensure climate change resilient water management.

How to cite: Boeing, F., Marx, A., Wagener, T., Samaniego, L., Rakovec, O., Kumar, R., and Attinger, S.: Evaluation of soil moisture droughts under climate change in Germany, EGU General Assembly 2024, Vienna, Austria, 14–19 Apr 2024, EGU24-9058, https://doi.org/10.5194/egusphere-egu24-9058, 2024.

EGU24-9081 | ECS | Posters on site | HS2.4.3

Suitability Mapping for Subsurface Floodwater Storage Schemes 

Lea Augustin and Thomas Baumann

Co-management strategies for floods and droughts offer a promising solution for dealing with two extremes that are increasingly close in time and space. Techniques originally developed for drought prevention, such as managed groundwater recharge (MAR), could use floods as a source of water (Flood-MAR) to simultaneously protect against flooding.

The project Smart-SWS aims to develop this concept further by capturing the flood waves in a river and infiltrating them into aquifers nearby. Subsurface storage is created through geotechnical measures in the aquifer. This storage could secure the seasonal water supply while protecting downstream settlements from flooding.

The main attributes of Smart-SWS sites mirror the overall objective: On the one hand, potential sites for such a system are located in areas that are regularly flooded and, at the same time, have problems with groundwater scarcity. In order to infiltrate large volumes of water into the aquifer and store this water for extended periods, the characteristics of the aquifer, the surface, and the water source must be taken into account to assess the suitability of these sites.

In this work, we have identified suitable sites for such an underground flood storage system by applying a GIS-based multi-criteria decision analysis (MCDA). The workflow for the suitability mapping is based on publicly available data and implemented in Python. The results are shown for the administrative district of Swabia in Bavaria, Germany, where approximately 35% of the study area was identified as having varying degrees of suitability. The robustness of the MCDA is validated with a sensitivity analysis, and the results are checked against expert opinions based on field data.

How to cite: Augustin, L. and Baumann, T.: Suitability Mapping for Subsurface Floodwater Storage Schemes, EGU General Assembly 2024, Vienna, Austria, 14–19 Apr 2024, EGU24-9081, https://doi.org/10.5194/egusphere-egu24-9081, 2024.

EGU24-9215 | ECS | Posters on site | HS2.4.3

Exploring extreme flow events and associated patterns in Switzerland: a Dense feed-forward Neural Network approach 

Maria Grazia Zanoni, Marius Floriancic, Hansjörg Seybold, and James W. Kirchner

Switzerland relies significantly on sustainable water management to meet its diverse socio-economic and environmental needs. As climate change introduces heightened uncertainty in weather patterns, accurate forecasting of extreme flows from climatic data has become essential for efficient water resource management in the country. Furthermore, these events are likely shaped by nonlinear hydroclimatic and compound conditions distinct from typical average cases. A thorough understanding of these phenomena is therefore crucial for effective adaptation to changing climatic conditions. In this regard, data-driven techniques, such as Machine Learning algorithms, have proven capable of extracting knowledge from vast amounts of data, providing valuable insights into the underlying climate and societal dynamics driving extreme flow events.

The aim of the present study is therefore twofold. First, we evaluate the ability of a Dense feed-forward Neural Network (DNN) model to predict drought and peak flow events in Switzerland based on anthropogenic, environmental and climatic data. On the other side, we investigate the role of each driver in the prediction and we study the temporal trends of the target and the features. The analysis was conducted on a large dataset consisting of daily discharge data from more than 400 sites across the country, from 1999 to 2019.  First, we evaluated the flow distribution at each individual site, considering only the extreme events and developing two distinct DNN models for droughts and for peaks. The DNN performed better in modeling droughts, achieving in the test set a mean Nash-Sutcliffe efficiency coefficient of 0.6 and a mean Kling-Gupta efficiency coefficient of 0.8, compared to 0.1 and 0.38, respectively, for the peaks.  A sensitivity analysis of the features, such as the cumulative precipitation and mean air temperature in the preceding weeks of the event, was performed. In addition, we delved into a detailed examination of the temporal trends of the climatic drivers and the extreme flow rates over the 20 years of the study. In the subsequent phase of the project, we explored a multi-site modeling approach to address the issue of the DNN model's poor performance in predicting peak flows.  We introduced geographic, land use and other anthropogenic factors specific to each watershed. 

By revealing the predictive potential of data-driven models, this study serves as a valuable foundation and resource for addressing extreme flow events and the hydroclimatic and anthropogenic patterns behind them.

How to cite: Zanoni, M. G., Floriancic, M., Seybold, H., and Kirchner, J. W.: Exploring extreme flow events and associated patterns in Switzerland: a Dense feed-forward Neural Network approach, EGU General Assembly 2024, Vienna, Austria, 14–19 Apr 2024, EGU24-9215, https://doi.org/10.5194/egusphere-egu24-9215, 2024.

Climate change affects several sectors and environmental conditions, in particular the statistical characteristics of the runoff processes of a certain watershed. As a consequence of the higher temperature values and the altered precipitation distribution, the intensity and timing of floods and droughts, as well as their severity, may change in the coming decades. In order to develop adaptation strategies and implement an adequate water management, it is necessary to project the future trends of variables that can essentially influence water management, taking into account possible climate change scenarios, including the quantification of uncertainty.

Our aim is to investigate the runoff conditions with a special focus on the frequency of critical low water levels and the different levels of flood warnings for selected river sections (i.e. Tiszabecs, Uszti Csorna, Rahiv) in the Uppest-Tisza Basin, located in Central-Eastern Europe. For this purpose, simulations with the physically based, distributed DIWA hydrological model driven by a regional climate model simulation are completed. In order to analyse the projected changes, simulations are made for a historical period (1972–2001) as well as for two future periods (2021–2050 and 2069–2098). We also investigate how the choice of the RCP scenario (i.e. RCP2.6, RCP4.5 or RCP8.5) affects the output of the hydrological simulation. In order to assess uncertainty, time series of meteorological parameters (providing inputs for the hydrological model) are generated by a weather-generator embedded in a Monte-Carlo cycle. Therefore, several hundreds of scenarios with equal probability are available, by using only one climate model. Furthermore, a bias-correction of the climate model simulation is implemented for which the weather-generator is used by fitting the crucial distribution parameters to the reference, i.e. the so-called CARPATCLIM database.

How to cite: Kis, A., Pongrácz, R., and Szabó, J. A.: Analysis of the frequency of critical low water levels and flood warning water levels for the Uppest-Tisza catchment for the 21st century, EGU General Assembly 2024, Vienna, Austria, 14–19 Apr 2024, EGU24-9343, https://doi.org/10.5194/egusphere-egu24-9343, 2024.

EGU24-9553 | ECS | Orals | HS2.4.3

Climate adaptation to change in high-flows: Comparison of high-resolution climate model projections 

Aparna Chandrasekar, Friedrich Boeing, Andreas Marx, Oldrich Rakovec, Sebastian Mueller, Ehsan Sharifi, Jeisson Javier Leal Rojas, Luis Samaniego, and Stephan Thober

Climate change is altering the water cycle from the global to the local scale. The increase in temperatures and changing precipitation patterns intensify not only mean values, but also the frequency and severity of extreme weather events, leading to alterations in water availability and distribution.

This study assesses the impact of climate change on flood patterns (maximum annual river discharge) in Germany. Climate models ranging from different spatial scales will be compared for the five largest German catchments outlets (including headwaters). The climate model ensembles from the EURO-CORDEX initiative, and the ICON climate model from the Destination Earth Initiative / NextGEMS project will be used along with the mHM (mhm-ufz.org) model. The river discharge values produced from the mHM model will be used to calculate the Q90 (90th percentile of daily discharge) and the Qmax (maximum annual discharge) parameters.

Initial results from the EURO-CORDEX initiative predict a 5-15% reduction in Q90 and Qmax in the summer half year, and a 5-30% increase in Q90 and Qmax in the winter half year, in the alpine regions in Germany. In the Elbe and Oder catchments (north-eastern part of Germany) there in a greater increase in Q90 and Qmax in the summer half year than the winter half year. This increase becomes more prominent with increasing warming. However, there is a large spread in the ensemble predictions, with uncertainty reducing with increasing warming. These parameters and results will be compared with the results from the ICON climate model to understand the contribution of spatial and/or temporal resoltion towards flood prediction.

How to cite: Chandrasekar, A., Boeing, F., Marx, A., Rakovec, O., Mueller, S., Sharifi, E., Leal Rojas, J. J., Samaniego, L., and Thober, S.: Climate adaptation to change in high-flows: Comparison of high-resolution climate model projections, EGU General Assembly 2024, Vienna, Austria, 14–19 Apr 2024, EGU24-9553, https://doi.org/10.5194/egusphere-egu24-9553, 2024.

EGU24-9626 | ECS | Orals | HS2.4.3

From drought to Storm Daniel: an overall assessment on the fragility of the Mediterranean region 

Junliang Qiu, Wei Zhao, Luca Brocca, and Paolo Tarolli

In 2022, Europe experienced an unprecedented drought. 2023 marked the warmest year globally on meteorological records, leading to droughts and wildfires in Greece during the summer. In July 2023, certain areas of the Mediterranean experienced sea surface temperatures 5.5°C higher than the annual average, contributing to severe summer heatwaves and wildfires in the Greek region. These conditions also provided ample thermal energy for the formation of Storm Daniel. From September 4th to 6th, Storm Daniel struck Greece, resulting in significant rainfall and flooding. Coordinated satellite monitoring revealed that the flooded area in central Greece reached 875.28 km². On September 10th, Storm Daniel hit Libya, leading to dam collapses and claiming the lives of over 11,000 people. Concurrently, the flood area in the northern deserts of Libya exceeded 1,000 km². From a global perspective, Europe has witnessed an increased frequency of extreme droughts and floods in recent years, while North Africa grapples with geopolitical instability. Climate change-induced natural disasters are further heightening the vulnerability of the Mediterranean region. Consequently, this study underscores the importance of (1) enhancing hydrological monitoring in arid and semi-arid regions of the Mediterranean, (2) developing a Mediterranean scale early warning system, and (3) stressing the imperative for the European Union and North African countries to collaboratively establish climate change adaptation strategies, aiming to avert humanitarian disasters triggered by climate crises.

How to cite: Qiu, J., Zhao, W., Brocca, L., and Tarolli, P.: From drought to Storm Daniel: an overall assessment on the fragility of the Mediterranean region, EGU General Assembly 2024, Vienna, Austria, 14–19 Apr 2024, EGU24-9626, https://doi.org/10.5194/egusphere-egu24-9626, 2024.

EGU24-9639 | ECS | Orals | HS2.4.3

Interpretable Machine Learning to Uncover Key Compound Drivers of Hydrological Droughts 

Georgios Blougouras, Markus Reichstein, Mirco Migliavacca, Alexander Brenning, and Shijie Jiang

Hydrological drought (negative streamflow anomalies) can have significant societal and ecosystem impacts, and understanding its drivers is crucial for interpreting past and present droughts, as well as assessing future drought risk. However, despite recent research advancements, a comprehensive multivariate perspective on the drivers of hydrological drought remains elusive, particularly in the context of global warming, where distributional changes in drivers could result in an increased frequency of complex, compound events. In order to address this, quantifying the contribution of each driver is necessary. In our research, we devise an interpretable machine learning framework that can explain which hydrometeorological variables contribute to streamflow predictions. This is done by encoding a conceptual hydrological model into a neural network architecture, creating a physics-encoded hybrid model that allows us to maintain physical consistency and ensure a more causal understanding. We apply our framework to numerous North American basins across spatiotemporal scales and quantify the contribution of each potential driver to identified streamflow deficit events. We also investigate the mechanisms associated with compound drivers and assess if drought drivers are becoming increasingly complex due to climate change based on the defined compoundness index.  Overall, our framework has managed to capture the contribution of diverse drought drivers to events across different hydroclimatological regimes. The results demonstrate the effectiveness of our novel method in improving hydrological drought process understanding, especially the mechanisms and severity of droughts associated with compound drivers, thereby facilitating increased preparedness for future drought risks.

How to cite: Blougouras, G., Reichstein, M., Migliavacca, M., Brenning, A., and Jiang, S.: Interpretable Machine Learning to Uncover Key Compound Drivers of Hydrological Droughts, EGU General Assembly 2024, Vienna, Austria, 14–19 Apr 2024, EGU24-9639, https://doi.org/10.5194/egusphere-egu24-9639, 2024.

Understanding and quantifying severe low flows is crucial for the management of hydropower or thermal power plants. Moreover, low flows are strongly related to the climatic regime and will be affected by climate change. Therefore, we propose a modelling chain to estimate severe low flow values for several human-influenced catchments in France, both under current and future climate.

Firstly, a bivariate weather generator (Touron, 2019) of daily temperature and precipitation, representing the average of 28 catchments spread out over France, was trained, and used to generate 1000 meteorological time series over a 30-year period. Average daily precipitation and temperature are then spatially disaggregated to produce 1000 local time series for each of the 28 catchments using an analogue approach. Thirdly, MORDOR-SD a lumped conceptual rainfall-runoff model, developed and used at EDF (Garavaglia et al. 2017), combined with upstream-downstream propagation and water management module was forced by the 1000 local meteorological time series. The resulting 1000 time series of simulated river flows are then used to calculate an empirical rare percentile estimate of low flows across 12 large catchments of interest.

The methodology is applied on historical period (1981-2010) using precipitation and temperature observations to train the weather generator. The robustness of the method is evaluated by comparing return levels of low flows obtained through the proposed method and the ones estimated through river flow observations available. Finally, to assess the impact of climate change, the weather generator is also trained/used with 5 downscaled climate projections from the CMIP5 experiments corresponding to: (1) the historical period (1981-2010) and, (2) 4 storylines representing different levels of warming/drying (2036-2065).

The comparison over the historical period has shown the relative agreement between simulated and observed severe low flows. Furthermore, under future conditions, the climatic differences between the 4 storylines lead to logical differences in the estimation of severe low flows, i.e. warmer/drier storylines lead to lower estimation of severe low flows.

How to cite: Devers, A., Gailhard, J., Parey, S., and Froidurot, S.: Estimating severe low flows on human-influenced catchments by combining weather generator, analogue spatial disaggregation, and hydrological modelling under historical and future climate., EGU General Assembly 2024, Vienna, Austria, 14–19 Apr 2024, EGU24-10393, https://doi.org/10.5194/egusphere-egu24-10393, 2024.

EGU24-10718 | ECS | Orals | HS2.4.3

Exploring Extreme Climate Transitions in Kerala, India: A Multi-Decadal Investigation (1980-2020) 

Meera G Mohan, Arathy Nair Geetha Raveendran Nair, and Adarsh Sankaran

In response to the escalating challenges posed by climate change, this study addresses the critical need to understand the dynamics of extreme climatic events within Kerala, India. Focusing on the years spanning 1980 to 2020, specifically during 12 identified drought years within, we meticulously examine transitions between droughts and floods, recognizing the profound impact on the region's hydrological landscape. With a strategic selection of 17 stream gauge locations covering high, mid, and low lands, representing varied climatic zones, our investigation delves into the intricacies of climatic shifts. The study deals with the analysis of discernible trend of increasing frequency in extreme events over time, by employing a thorough approach incorporating statistical significance testing, frequency analysis of extreme events, and lag analysis and then to unravel the intricate relationships between streamflow and precipitation during distinct phases such as pre-drought, drought, and post-drought years. The research findings illustrate an erratic pattern in the occurrence of contradictory extremes, such as transitions between drought and flood. The timing and duration of these transitions are also found to be inconsistent, showing varying periods in-between and occasionally consecutive occurrences of the same extremes, which in turn highlights the complexity and irregularity of extreme event patterns present in Kerala. Notably, our analysis reveals a concerning trend where the frequency of extreme events is progressively increasing, indicating a higher occurrence of climatic extremes over the years. Specifically, from 2015 to 2020, the observed transitions are striking, in the case that, the total incidences of heavy rain (64.5-115.5 mm per day) were 360 across 10 months in 2015 whereas in the succeeding year (2016), followed by an unprecedented 100-year return period drought. The year 2017 again saw incidences of heavy rain climbing to a total of 360 events. Astonishingly, the anomaly continued with the recurrence of devastating floods in 2018, which persisted for a broadened period up to 2020. While extending the future dynamics for the coming decade, the study predicted the frequency and patterns of extreme events in Kerala by incorporating future General Circulation Model (GCM) precipitation data. The results indicate a substantial increase in the frequency of extreme events, coupled with the anticipated emergence of prolonged dry periods in Kerala's future hydroclimatic landscape. The integration of this data into the analysis enabled the estimation of variations in future streamflow, providing valuable insights into the evolving climatic scenario. This forward-looking approach allowed for the inference of potential patterns of extreme events over the past decade in Kerala, contributing to proactive strategies for climate resilience and adaptive water resource management in the region.

How to cite: G Mohan, M., Geetha Raveendran Nair, A. N., and Sankaran, A.: Exploring Extreme Climate Transitions in Kerala, India: A Multi-Decadal Investigation (1980-2020), EGU General Assembly 2024, Vienna, Austria, 14–19 Apr 2024, EGU24-10718, https://doi.org/10.5194/egusphere-egu24-10718, 2024.

EGU24-11083 | ECS | Orals | HS2.4.3

Evidence of Flash/ Rapid Drought in India based on Precipitation Deficit- A new Climatic Threat 

Pallavi Kumari and Rajendran Vinnarasi

Rapid intense droughts (Flash Drought) under climatic warming are of widespread concern owing to their catastrophic impacts on agricultural production, eco-system, and nation’s economy. Several studies highlight the need to develop an improved understanding of flash drought to manage its effect better, However the lack of consistent definitions have limited progress toward its assessments. A number of variables, climatic drivers are generally linked to flash drought development thus it is possible that no single description might adequately capture the flash drought. However, it is crucial to make sure that the rapid onset, fast intensification, and severe nature of flash drought can be identified and distinguished from more conventional drought (longer duration) events. With the increasing use of flash drought term within the scientific community, this study presents an evidence-based result by identifying flash droughts using pentad-scale precipitation series across India. The results demonstrate that one of the factors causing and accelerating the flash drought – rapid drought intensification and lasts for shorter duration (3 pentads to 18 pentads) is the meteorological variable precipitation. The results of this study can be further utilised in the accurate characterization of flash drought and its assessment with the strong evidence of precipitation series in finding of flash drought events across the nation.

How to cite: Kumari, P. and Vinnarasi, R.: Evidence of Flash/ Rapid Drought in India based on Precipitation Deficit- A new Climatic Threat, EGU General Assembly 2024, Vienna, Austria, 14–19 Apr 2024, EGU24-11083, https://doi.org/10.5194/egusphere-egu24-11083, 2024.

EGU24-11404 | ECS | Orals | HS2.4.3

On the use of weather generators for the estimation oflow-frequency floods under climate change scenarios 

Carles Beneyto, José Ángel Aranda, and Félix Francés

The present work presents a novel methodology based on the use of stochastic Weather Generators (WG) for the estimation of high return period floods under climate change scenarios. Starting from the premise that the 30-years climate projections, commonly used for future flood studies, do not provide enough information to obtain accurate extreme quantile estimations (especially in arid and semi-arid climates), we propose to exploit the available information by performing a regional study of maximum precipitation of the bias-corrected climate projections (mid-term and long-term), the outputs of which will improve the WG implementation.

This methodology has been applied in a case study, Rambla de la Viuda (Spain), a typical Mediterranean ephemeral river located in eastern Spain. The river is ca. 36 km in length and 1513 km2 in catchment surface, with a remarked variability: large floods are a significant element of this irregular hydrological regime, producing up to 80% of annual discharge volume. Precipitation and temperatures were obtained from the EUROCORDEX project: twelve combinations of Global Circulation Models and Regional Circulation Models were evaluated for a RCP8.5 emissions scenario.

The results obtained shown a clear increase in maximum and minimum temperatures for both projections (up to 3.6ºC), this increase being greater for the long-term projection, where the heat waves intensify importantly in both magnitude and frequency. In terms of precipitation, the results are similar, with precipitation quantiles increasing for practically all models and for both projections, although slightly reducing the annual amount of precipitation. The long synthetic series of precipitation that fed a fully-distributed hydrological model translated into substantial shifts in the river flows regimes, presenting, in general, lower flows during the year but increasing the frequency and magnitude of extreme flood events, reaching 100 years return period quantile values up to 58% higher at the river outlet and up to 130% at a smaller upper subcatchment. 

These results have demonstrated the solidity and effectiveness of the proposed methodology. In the field of meteorological modeling, the results have been consistent and satisfactory, demonstrating the methodology's ability to accurately represent the complexities of extreme climate patterns. Likewise, in the hydrological field, the methodology has exhibited an effective capacity to represent and simulate the processes related to the water cycle, offering coherent and satisfactory results in the estimation of low frequency flood events under climate change scenarios. This consistency in the robustness of the methodology, both in meteorological and hydrological modeling, supports its applicability and reliability in diverse environments and climatic conditions.

How to cite: Beneyto, C., Aranda, J. Á., and Francés, F.: On the use of weather generators for the estimation oflow-frequency floods under climate change scenarios, EGU General Assembly 2024, Vienna, Austria, 14–19 Apr 2024, EGU24-11404, https://doi.org/10.5194/egusphere-egu24-11404, 2024.

EGU24-11499 | ECS | Posters on site | HS2.4.3

The role of meteorological drivers and initial hydrologic conditions on streamflow drought-to-flood transition events 

Eduardo Muñoz-Castro, Bailey Anderson, Paul Astagneau, Joren Janzing, Pablo A. Mendoza, and Manuela I. Brunner

Extreme hydrometeorological events such as streamflow droughts and floods may have severe impacts on infrastructure, agriculture, water supply, and hydropower generation, as well as social and political systems. Even though such impacts can be enhanced if the two types of events occur consecutively, the occurrence and drivers of drought-to-flood transitions are not well understood. Here, we ask: ‘How do the properties of drought-to-flood transitions change with different meteorological drivers and initial hydrologic conditions?’ To address this question, we configure the PCR-GlobWB hydrological model in a suite of near-natural gauged catchments, included in the quasi-global large sample dataset CARAVAN, that comprise different hydroclimatic conditions and physiographic characteristics. We run numerical experiments to understand the sensitivity of consecutive drought-to-flood properties (e.g., duration, extension, intensity, etc.) to different driver scenarios. Additionally, we perform, for each catchment, a flux-mapping analysis to explore whether different combinations of drivers can lead to a similar catchment response through different combinations of fluxes. Finally, we define clusters of catchments with similar drivers and sensitivities of consecutive hydrological extremes to the different stress tests. Ongoing analyses suggest that the drivers of drought-to-flood transitions vary substantially across catchments.

How to cite: Muñoz-Castro, E., Anderson, B., Astagneau, P., Janzing, J., Mendoza, P. A., and Brunner, M. I.: The role of meteorological drivers and initial hydrologic conditions on streamflow drought-to-flood transition events, EGU General Assembly 2024, Vienna, Austria, 14–19 Apr 2024, EGU24-11499, https://doi.org/10.5194/egusphere-egu24-11499, 2024.

EGU24-12331 | Orals | HS2.4.3

The recent European droughts within the nudged storyline context 

Oldrich Rakovec, Antonio Sanchez Benitez, Helge Gößling, and Luis Samaniego

Europe has experienced a series of hot and dry weather conditions with significant socioeconomic and environmental consequences over the past decade. Here, using a novel storyline approach, we examine the extremity of the recent European droughts, and we aim to isolate the thermodynamical component of climate change from changes in atmospheric patterns, which remain controversial in climate model simulations. Our climate analysis is currently based on an ensemble (n=5) of three storyline scenarios (pre-industrial, PI; PD, present-day; 4K warming) using a CMIP6 model (AWI-CM1) with the free-troposphere winds, including the jet stream, constrained toward ERA5 data. The meteorological variables at the land surface are further used as input to a hydrological impact modelling framework using the mesoscale Hydrologic Model (mHM). 

Regarding the 2022 drought analysis, first, using our experiments, we quantify the extremity of the present-day (PD) European drought against pre-industrial (PI) simulations. The potential evapotranspiration shows an apparent increase across the entire ensemble between the PD and PI periods in all of Europe. The same increase holds for actual evapotranspiration in northern Europe and most of central Europe, while the Mediterranean shows a relative decrease of 15%; however, there is no clear separation between PD and PI ensembles. The river runoff exhibits significant reductions of 35-50% in the Mediterranean regions, while changes between -15% and 15% occur over the rest of Europe (with less agreement on the signal). 

Second, we compare how the present 2022 droughts will be further amplified under different warming-level climate scenarios. Our results suggest that the 2022 river runoff drought would be much more strongly pronounced for the 4K world concerning the PD period, by up to 50% in the Mediterranean. A clear decline, although of slightly less extremity (-15% up to -40%), would also be projected across the majority of Central Europe. These changes align with observed trends associated with anthropogenic climate change. Our ongoing efforts aim to quantify possible stress on water resources and ecosystems, by providing insights into the potential future hydrological impact of different global warming levels. The aforementioned results will be further extended to address the multi-year drought perspective during the 2018-2022 periods. 

This work was supported by funding from the Federal Ministry of Education and Research (BMBF) and the Helmholtz Research Field Earth & Environment for the Innovation Pool Project SCENIC.

How to cite: Rakovec, O., Sanchez Benitez, A., Gößling, H., and Samaniego, L.: The recent European droughts within the nudged storyline context, EGU General Assembly 2024, Vienna, Austria, 14–19 Apr 2024, EGU24-12331, https://doi.org/10.5194/egusphere-egu24-12331, 2024.

EGU24-12387 | Posters on site | HS2.4.3

Drought and flood episodes during the 19th Century in Catalonia (NE Iberian Peninsula)  

David Pino, Josep Barriendos, Mariano Barriendos, Carles Balasch, Jordi Tuset, and Laia Andreu-Hayles

The current context of climate change is leading to an increase in hydroclimate variability in the Mediterranean region. This situation is resulting in more frequent and longer dry periods but also in an increase of torrential rainfall events. Current situation justifies the study of the behaviour of droughts and floods from an integrated long-term perspective.

This study aims to study droughts, floods and their interaction during the 19th century in Catalonia using historical and administrative documentary sources. The 19th century corresponds to a climatic period of transition between the Little Ice Age and the current climatic period that includes the appearance of different climatic forcing factors such as solar minimums and extraordinary volcanic eruptions.

In Catalonia 19th century stands out for having some of the most important droughts recorded in the instrumental series of Barcelona (1812-1825), along with experiencing some notable catastrophic flood events. Administrative documentary data allowed us to study at daily resolution flood episodes such as in August 1842, May 1853, September 1874 and January 1898, together with the duration and frequency of drought episodes. Complementarily, in order to characterize the atmospheric general patterns during these episodes, we also generated daily barometric synoptic maps using old instrumental pressure data from different points of Europe. This approach provided the identification of different atmospheric anomalies driving these extreme hydrometeorological events.

How to cite: Pino, D., Barriendos, J., Barriendos, M., Balasch, C., Tuset, J., and Andreu-Hayles, L.: Drought and flood episodes during the 19th Century in Catalonia (NE Iberian Peninsula) , EGU General Assembly 2024, Vienna, Austria, 14–19 Apr 2024, EGU24-12387, https://doi.org/10.5194/egusphere-egu24-12387, 2024.

EGU24-12436 | ECS | Orals | HS2.4.3

Detecting Trends In Hydrological Extremes And Non-Stationary Extreme Value Analysis Of Flood Data In Kwazulu-Natal, South Africa 

Demian Vusimusi Mukansi, Jeff Smithers, Katelyn Johnson, Thomas Kjeldsen, and Macdex Mutema

In this study, the annual maximum streamflow from 14 stations in KwaZulu-Natal, along the East Coast of South Africa, were analysed. Trends were investigated using the non-parametric Mann-Kendall test and the Sen Slope tests, and the results indicate that the annual maximum streamflow has been decreasing in magnitude at 78 % of stations. Extreme value analysis was performed using both stationary and non-stationary models using time and rainfall as covariates. The results show that the stationary models are superior to non-stationary models at most stations with time as a covariate. Where possible, streamflow stations were linked with rainfall stations to determine the impact of rainfall on annual maximum streamflow. The results indicate that the non-stationary model incorporating observed rainfall as a covariate performed better than the stationary and non-stationary models with only time as a covariate. Therefore, incorporating rainfall in design flood estimation should be considered to account for non-stationary trends and to mitigate the risk of failure of hydraulic structures. Regional magnification factors to account for non-stationarity were not investigated further in this study as the majority of the stations showed a negative trend, which means the application of a regional magnification factor will result in a reduction of the magnitude of the estimated design floods.

How to cite: Mukansi, D. V., Smithers, J., Johnson, K., Kjeldsen, T., and Mutema, M.: Detecting Trends In Hydrological Extremes And Non-Stationary Extreme Value Analysis Of Flood Data In Kwazulu-Natal, South Africa, EGU General Assembly 2024, Vienna, Austria, 14–19 Apr 2024, EGU24-12436, https://doi.org/10.5194/egusphere-egu24-12436, 2024.

EGU24-13019 | ECS | Orals | HS2.4.3

Analyzing drought legacy effects on streamflow with machine learning 

Anne Hoek van Dijke, Sungmin Oh, Xin Yu, and Rene Orth

Prolonged periods of below-average precipitation decrease streamflow, deplete soil moisture and groundwater reservoirs, and affect vegetation health. These effects can last for several years even after precipitation returns to normal. This way, droughts can decrease or increase streamflow for post-drought years. These drought legacy effects were found in a few local studies, but they have not yet been studied at global scale. 
Here, we study drought legacy effects on streamflow in > 1100 catchments distributed across the globe using Long-Short Term Memory (LSTM) models. This type of data-driven model is very suitable for time-series predictions with long-term dependencies, and LSTMs are therefore frequently used to model streamflow. We train our LSTM model for each catchment to predict streamflow based on meteorological forcing data. For training, we include all available data between 1980 – 2019, but we exclude the drought legacy years (the two years after each drought year). We assume that our models do therefore not know about the drought legacy effects. After training we use the LSTM models to predict streamflow for drought legacy years. We then define the legacy effects as the difference between model errors (the difference between the predicted and measured streamflow) for drought legacy years, in comparison to the model errors for normal years.
Using this methodology, we find catchments that show no, positive, or negative drought legacy effects. In the next step we will study if these legacy effects vary along climate or land cover gradients. And we additionally include satellite data of vegetation greenness, evaporation, and terrestrial water storage in the LSTM training to study two hypotheses: 1) we find negative drought legacy effects due to a depletion of groundwater, and 2) we find positive drought legacy effects, because vegetation mortality leads to decreased evaporation after the drought.
Our study offers a new perspective on understanding drought legacy effects on streamflow using observational data and demonstrates the usefulness of machine learning in uncovering complex drought impacts. 

How to cite: Hoek van Dijke, A., Oh, S., Yu, X., and Orth, R.: Analyzing drought legacy effects on streamflow with machine learning, EGU General Assembly 2024, Vienna, Austria, 14–19 Apr 2024, EGU24-13019, https://doi.org/10.5194/egusphere-egu24-13019, 2024.

EGU24-13029 | ECS | Posters on site | HS2.4.3

Variable Drought Threshold Method for Low-Flow Behavior Reveals Distinct Clustering Across the Continental United States 

Ryan van der Heijden, Ali Dadkhah, Amin Aghababaei, Xueyi Li, Eniola Webster-Esho, Prabhakar Clement, Mandar Dewoolkar, Ehsan Ghazanfari, Norm Jones, Gustavious Williams, and Donna Rizzo

Groundwater and surface water are interconnected in most climatic regions. Baseflow, the contribution of streamflow not directly associated with precipitation forcing, is a critical component of streamflow prediction and water resource allocation. Baseflow is often considered to be a low-frequency component of streamflow and many of the methods for estimating it are based on this premise. The climatic and physiographic attributes of a region will contribute to the low-flow behavior of its surface waterways. For example, baseflow in a snowmelt-driven basin may produce a distinct hydrologic signature compared to baseflow in a precipitation-driven basin.

In this study, we developed a unique metric based on the variable drought threshold method (VDTM) for characterizing historical streamflow timeseries and performed cluster analysis on a large set of gages in the continental United States (CONUS). Our study goal was to observe correlations between low-flow characteristics and distinct hydrologic, physiographic, and climatic regions to provide insight into the underlying mechanisms influencing baseflow.

The VDTM applies a non-exceedance percentile (NEP) computed based on the distribution of flow recorded at a stream gage over a given time frame (i.e., month, season) throughout the complete record of measurement. This study used daily streamflow records for 1,462 reference quality gages across the CONUS from the USGS GAGES-II data set; each gage contained at least 20 years of complete daily streamflow measurements. We computed the 10th NEP for each month at all 1,462 gages and normalized this value by the mean streamflow to develop the parameter r10. We performed K-means clustering on the monthly r10 values, forming seven clusters of low-flow behavior.

We observed clusters with distinct low-flow behavior across different ecoregions related to possible mechanisms driving streamflow and baseflow in those regions. For example, a cluster located in the intermountain-west shows unique behavior largely seen nowhere else in the CONUS, possibly a result of the predominantly snowmelt-driven shallow subsurface flow that contributes to baseflow seen in that region. Conversely, clusters located in the Pacific Northwest and parts of the Appalachians show a different behavior, possibly a result of the predominantly rainfall-driven streamflow observed in those regions. Principal components analysis suggests that the critical months associated with clustered gages are during the summer (June, July) and winter (January, February).

The spatial distribution of the clusters largely adheres to the defined physiographic and climatic regions of the CONUS despite the absence of any physiographic or climatic variables used for clustering, suggesting a possible linkage between these attributes and the low-flow behavior of surface waterways. Analysis of the trend and magnitude of r10 may provide insight into whether (and when) a stream is losing water to or gaining water from groundwater as well as the magnitude of the transfer. The results of this study suggest that using NEPs and the r10 metric may be an effective method for defining regionalization based on low-flow metrics.

How to cite: van der Heijden, R., Dadkhah, A., Aghababaei, A., Li, X., Webster-Esho, E., Clement, P., Dewoolkar, M., Ghazanfari, E., Jones, N., Williams, G., and Rizzo, D.: Variable Drought Threshold Method for Low-Flow Behavior Reveals Distinct Clustering Across the Continental United States, EGU General Assembly 2024, Vienna, Austria, 14–19 Apr 2024, EGU24-13029, https://doi.org/10.5194/egusphere-egu24-13029, 2024.

EGU24-13741 | Orals | HS2.4.3

Compound events and hydro-climate extremes – how they are impacting Australia, now and in the future 

Wendy Sharples, Sur Sharmila, Bende-Michl Ulrike, Navid Ghajarnia, Katayoon Bharamian, Jiawei Hou, Christopher Pickett-Heaps, and Elisabetta Carrara

Many natural disasters in Australia are the result of compound events, where the assessment of single climate system drivers in isolation do not fully capture hydro-climate extremes. Multivariate compound events such as ‘hot and dry’ and ‘wet and windy’ events, portend a multitude of hazards from heatwaves and bushfires through to coastal inundation and floods. The multiple drivers compounding together in these events, lead to extreme conditions ripe for natural disasters to occur. Presently, compound events are negatively impacting Australia’s ability to protect its population and environmental and economic assets, as Australia tries to adjust to the greenhouse gas driven climatic shifts, with potential projected increases in hazard severity. We aim to understand the change in frequency, duration and intensity of ‘hot and dry’ and ‘wet and windy’ compound events, at current and increased global warming levels. The ‘hot and dry’ compound event is defined as the co-occurrence of SPI drought conditions, and at least 3 consecutive days of hot temperatures. The ‘wet and windy’ compound event is defined as the co-occurrence of both extreme wind and precipitation. These two compound events were chosen to begin with due to the historic severity of their associated impacts. However further research is planned to understand all types of compound events including preconditioned, and, spatially and temporally compounding, in order to fully gauge Australia’s potential vulnerability to natural disasters now and in the future.

How to cite: Sharples, W., Sharmila, S., Ulrike, B.-M., Ghajarnia, N., Bharamian, K., Hou, J., Pickett-Heaps, C., and Carrara, E.: Compound events and hydro-climate extremes – how they are impacting Australia, now and in the future, EGU General Assembly 2024, Vienna, Austria, 14–19 Apr 2024, EGU24-13741, https://doi.org/10.5194/egusphere-egu24-13741, 2024.

The Harz mountains in Germany have experienced floods and droughts in recent years. On the one hand, a major flood event affected the city of Goslar in 2017, and on the other hand, drought conditions since 2018 have led to tree mortality in the forested catchment area upstream. The frequency of such extreme events is expected to increase as a result of climate change. Here, we aim at assessing the impacts of the ongoing tree mortality on hydrology. To this end, we employ the ecohydrological model SWAT+ to assess changes in water balance components. The model is specifically calibrated for extreme conditions by evaluating the model performance for different segments of the flow duration curve. Satellite-derived changes in forest cover are used to assess the impact on water balance components. The analysis of the model performance indicates that the calibration strategy improved model performance for drought conditions. Furthermore, first model results indicate that tree mortality led to a decrease in evapotranspiration and an increase in surface runoff. The spatial assessment suggests stronger effects at the sub-catchment scale than at the catchment scale. However, the faster response of the catchment due to tree mortality potentially increases the severity of flood events and the flood risk in downstream areas. Therefore, afforestation with climate-resilient trees is needed to improve both flood and drought resilience in the Harz mountains.

How to cite: Wagner, P. and Fohrer, N.: Impacts of hydrological extremes in a mountainous forest catchment: Experiences from the Harz mountains, Germany, EGU General Assembly 2024, Vienna, Austria, 14–19 Apr 2024, EGU24-14209, https://doi.org/10.5194/egusphere-egu24-14209, 2024.

EGU24-14703 | Posters on site | HS2.4.3

Evaluating the seasonal patterns of low flow in  Nakdong River basin using SWAT 

Wonjin Kim, Si Jung Choi, and Seong Kyu Kang

ABSTRACT

This study focuses on the seasonal patterns of low flow in the Nakdong River basin (23,635 km2), considering its vital role as a seasonal phenomenon and integral component of the flow regime. Low flow, derived from groundwater discharge or surface discharge from lakes and reservoirs, exhibits varying magnitudes and durations under seasonal changes, thereby holding significant implications for agricultural activities, aquatic species, and water quality. In the absence of gauge stations for small streams, Soil and Water Assessment Tool (SWAT) was employed to ensure reliable simulation for low flow along the target watershed, and the model was calibrated for the period of ten years (2010~2019) using observed data from multipurpose dams and multifunctional weirs within the target watershed. Based on the model results, spatio-temporal variations of low flow were estimated, and seasonality indices were adopted by means of understanding and analysing low flow characteristics. The indices include seasonlity histograms (SHs) depicting the monthly distribution of low flows, seasonlity index (SI) representing the average timing of low flows within a year, and seasonality ratio (SR) showing the ratio of summer to winter low flows. Subsequently, seasonal patterns of low flow in target watershed were evaluated under three indices to figure out the response of low flow in relation to watershed characteristics and climate variability.


Acknowledgements

Research for this paper was carried out under the KICT Research Program, Development of IWRM-Korea Technical Convergence Platform Based on Digital New Deal) funded by the Ministry of Science and ICT.

How to cite: Kim, W., Choi, S. J., and Kang, S. K.: Evaluating the seasonal patterns of low flow in  Nakdong River basin using SWAT, EGU General Assembly 2024, Vienna, Austria, 14–19 Apr 2024, EGU24-14703, https://doi.org/10.5194/egusphere-egu24-14703, 2024.

EGU24-14737 | ECS | Posters on site | HS2.4.3

Identifying Flash Flood-Prone Subbasins in India Using Geomorphological and Meteorological Parameters  

Nandana Dilip K, Urmin Vegad, and Vimal Mishra

Flash Floods are one of the crucial disasters in India which causes high mortality and damage due to its sudden onset and devastating impact. These events are projected to increase in India due to the warming climate and increasing unplanned urbanization.  However, India still lacks a robust analysis on flash flood susceptibility at a subbasin scale. In our study, we have considered meteorological and geomorphological factors to improve the susceptibility mapping, as flash floods are the result of high intensity rainfall in a short period of time and the geomorphology of the basin. We analyzed 17 different geomorphological factors of drainage, relief and areal aspects. Further, we calculated the flashiness index for all the subbasins within India using the model simulated streamflow. We forced a hydrodynamic routing model with reanalysis data to simulate streamflow at the subbasin outlets. We prepared subbasin-level flash flood susceptibility maps based on geomorphology, flashiness index and a combination of both. The integrated use of geomorphology and meteorology will provide a more robust framework for identifying the flash flood prone subbasins in India. This will help the authorities in focusing on the probable regions to plan mitigation strategies.  

How to cite: Dilip K, N., Vegad, U., and Mishra, V.: Identifying Flash Flood-Prone Subbasins in India Using Geomorphological and Meteorological Parameters , EGU General Assembly 2024, Vienna, Austria, 14–19 Apr 2024, EGU24-14737, https://doi.org/10.5194/egusphere-egu24-14737, 2024.

EGU24-14818 | ECS | Posters virtual | HS2.4.3

Beyond the Extremes: Interpretable insights based on Attention framework  

Ashish Pathania and Vivek Gupta

Extreme weather events significantly impact the economy, agriculture, infrastructure, and ecosystems of a region. According to the Center for Science and Environment (CSE), extreme weather events caused the loss of nearly 3000 lives, 2 million hectares of crops, and the death of 90,000 cattle in India in 2023 alone. Effective mitigation and adaptation strategies for the region necessitate a reliable forecasting system. The spatiotemporal interactions of several hydroclimatic components at different scales make it difficult to provide reliable forecasts for a region with multiple climate zones. The present research proposes an encoder-decoder-based deep learning framework with an attention mechanism to develop a reliable forecasting model. Attention frameworks have exhibited considerable potential in learning contextual awareness within the time series domain which will help in identifying the temporal dependencies between the meteorological variables and extreme events. The proposed architecture of the forecasting model is made interpretable as it is crucial to comprehend the underlying mechanism of climatic extremes. It recognizes the contributing variables influencing the intensity and frequency of extreme events. The study employed 0.12° × 0.12° high-resolution IMDAA (Indian Monsoon Data Assimilation and Analysis) dataset encompassing climatic variables like precipitation and temperature.

Various studies have supported the association of the ENSO parameters with the anomalous climatic conditions over India. The present study also aims to ascertain the distinct contributions of ENSO variables through the implementation of an interpretable framework. Explainability results underscore the significance of precipitation patterns while forecasting drought conditions in the region. Moreover, the results highlight the complex interaction of climatic variables that affect the intensity of the extremes.

How to cite: Pathania, A. and Gupta, V.: Beyond the Extremes: Interpretable insights based on Attention framework , EGU General Assembly 2024, Vienna, Austria, 14–19 Apr 2024, EGU24-14818, https://doi.org/10.5194/egusphere-egu24-14818, 2024.

Reliable Tropical Cyclone (TC) precipitation and flood nowcasting play an important role in disaster prevention and mitigation. Especially for small-scale reservoirs, timely and accurate inflow forecasts are required to provide safe space for capturing high flows without having to resort to hazardous and damaging releases. Numerous studies have investigated the ability of deep learning in TC precipitation nowcasts. However, few of them focus on the skill of deep-learned TC precipitation forecasts in inflow flood forecasts. In this study, a novel framework is developed by introducing TC track information together with antecedent precipitation in the Convolution LSTM model (PTC-ConvLSTM). The ConvLSTM forecast precipitation is then input to an event-based Xinanjiang hydrological model for inflow flood forecasting, and the propagation of errors from TC track forecasts to inflow forecasts is further analyzed. The results show that TC track information enables a further 5% improvement compared to outputs from ConvLSTM with only precipitation information. PTC-ConvLSTM precipitation nowcasts present a probability of detection (POD) greater than 0.34 for a threshold of 5mm/h in a lead time of 6h. The nowcasts-driven flood forecasts have an NSE greater than 0 with a lead time of 5h at least. It is also indicated that the 100km error in TC track forecasts could generally result in a 10% degradation in precipitation forecasts and a further 8% deterioration in the driven flood forecasts. The effectiveness of our model indicates that the precipitation nowcasts from deep learning have strong applicability in disaster mitigation.

How to cite: Liu, L., Xu, Y.-P., and Gu, H.: Enhanced tropical cyclone inflow flood forecasts by using deep learning and spatial‑temporal information, EGU General Assembly 2024, Vienna, Austria, 14–19 Apr 2024, EGU24-14963, https://doi.org/10.5194/egusphere-egu24-14963, 2024.

Heatwaves and droughts are among the natural hazards with frequencies and severities expected to increase due to climate change. Furthermore, they are responsible for a large range of social and economic impacts, such as agricultural losses, energy shortages, heat related mortality, etc. Previous works have shown that co-occurring drought and heatwave events lead to higher significant socio-economic damages compared to independent events. However, limited knowledge is available on quantifying spatial patterns of co-occurring droughts and heatwaves events, their severity, and frequency of occurrence, especially at high spatial and temporal resolution.

The aim of this study is to quantify spatio-temporal changes of compound drought and heat wave events in a large anthropized alpine Italian basin, the Adige basin, located in the North of Italy, with area greater than 10,000km2 and containing a wide range of elevation from 160m to 3905m. We quantify changes in single and multiple drought and heat wave hazards during the period 1980-2018, based on hydrological simulations performed using a recently produced hydrological digital twin model at high spatial (5 km2) and temporal (daily) resolution. The model also includes artificial reservoirs and the combination of high resolution hydrological modeling and compound hazard estimation framework has a key advantage that: i) it captures single hazard evolution at daily time scale and ii) explicitly estimate the dependence between co-occurred events directly mapping critical susceptible regions.

Preliminary results show increasing trends in number and severity of compound heat waves and drought events. Ongoing work aim to quantify the spatial distribution of the analysed compound events and the exposure in terms of population impacted and main land cover types. The proposed modeling framework may help improve the prediction and assessment of occurrences of compound heat waves and droughts events and the possible implementation of mitigation actions. The authors are supported by the WATERSTEM MUR PRIN 2020 (Prot. Number 20202WF53Z) and the COACH-WAT PRIN 2022 (Prot. Number 2022FXJ3NN).

How to cite: Formetta, G. and Morlot, M.: Compound heatwave and drought hazard quantification in a large anthropized alpine basin., EGU General Assembly 2024, Vienna, Austria, 14–19 Apr 2024, EGU24-15136, https://doi.org/10.5194/egusphere-egu24-15136, 2024.

EGU24-15522 | ECS | Orals | HS2.4.3

Flood control capacity of a large reservoir under moderate and extreme flood conditions 

Pratik Chakraborty, Sophie De Kock, Pierre Archambeau, Michel Pirotton, Sébastien Erpicum, and Benjamin Dewals

Dams, prevalent globally as major hydraulic structures, play essential roles in water supply, hydroelectric power, and flood management. However, they are known to significantly transform hydrological regimes by, among others, regulating flood and base flow dynamics. This, in turn, necessitates a meticulous understanding of the nature of these alterations.

Focused on the Eupen dam in Belgium, this study examines its storage dynamics in relation to moderate and extreme flood events. The study analyses time-series of inflow and outflow discharges at the dam for the period from 1995 to 2023. The inclusion of the July 2021 extreme event provides valuable insights into the dam’s performance (or lack thereof) during such mega-events. Notable aspects of the methodology include adjustments for an ungauged sub-basin, the use of a Savitsky-Golay filter to refine (field-)data quality without compromising peak details and a fundamental mass-balance approach to compute outflow data from the inflow time-series.

The examination of 18 flood events during this period reveals significant findings: the dam's ability to reduce peak discharge by 8.6 to 91%, delay peak discharge by up to 68 hours, decrease flood volume by 2 to 94%, and reduce the rising rate by 1.09 to 11.16 times. Distinctly, the study also reveals a strong correlation between the damping ratio of the flood wave and the ratio of the volumes of the incoming flood to that available in the reservoir (at the start of an event). The outcomes of the flood frequency analysis are also presented and interpreted in detail.

The present study features a marked shift from existing dam-effects research, wherein the analysis is often focused on mean annual flow characteristics or aggregated data across numerous dams. It highlights the rewards of such a singular case study, in terms of being able to scrutinise individual flood events. This, in turn, provides the scope to understand more complex underlying conditions that prompt a dam's effects on streamflow characteristics. Finally, this research evidences the benefits provided by dam reservoirs on flood wave damping, but also their limits in doing so.

How to cite: Chakraborty, P., De Kock, S., Archambeau, P., Pirotton, M., Erpicum, S., and Dewals, B.: Flood control capacity of a large reservoir under moderate and extreme flood conditions, EGU General Assembly 2024, Vienna, Austria, 14–19 Apr 2024, EGU24-15522, https://doi.org/10.5194/egusphere-egu24-15522, 2024.

EGU24-15968 | ECS | Posters virtual | HS2.4.3

Regional Flood Frequency Analysis Utilizing LH-moment based framework for Godavari River Basin 

Amit Singh and Sagar Chavan

Regional flood frequency analysis (RFFA) helps in estimating the design flood at ungauged locations within a hydrologically homogeneous region. LH moment is a statistical method often used in hydrology for estimating distribution parameter. The LH moment are the linear combination of higher probability weighted moment. It offers an alternative to traditional moments and is particularly useful when dealing with skewed distributions. The Godavari River, one of the major river systems in India, experiences varying hydro climatic conditions across the basin. This study presents a comprehensive regional flood frequency analysis (RFFA) conducted in the Godavari River basin employing LH moment as a robust statistical tool. The present study incorporates the formation of region using region of Influence approach (ROI) approach. In this study, five probability distributions namely generalized extreme value (GEV), generalized logistic (GLO), Pearson Type III (PE3), Generalized Normal (GNO) and generalized Pareto (GPA) are considered for performing RFFA for estimating ungauged flood quantiles corresponding to various return periods (e.g., 50, 100, and, 200 years) in the Godavari River basin. The discordancy measure and heterogeneity measure in LH-Moment framework are considered for screening of peak flow data and checking the heterogeneity of the region formed using ROI. The suitability of GEV, GLO, PE3, GNO, and GPA distribution is judged through the LH-moment ratio diagram and the Z-statistic criteria. The performance of LH-moment based RFFA is evaluated through Leave-One-Out Cross Validation (LOOCV). Results indicate that the LH-moment based RFFA yields more reliable estimates of flood quantiles.

How to cite: Singh, A. and Chavan, S.: Regional Flood Frequency Analysis Utilizing LH-moment based framework for Godavari River Basin, EGU General Assembly 2024, Vienna, Austria, 14–19 Apr 2024, EGU24-15968, https://doi.org/10.5194/egusphere-egu24-15968, 2024.

Three homogeneity tests were carried out on the lower Columbia River basin namely, Standard normal homogeneity test, Pettit test and Buishand test for daily gridded rainfall data having spatial resolution of 0.5o spanning a period of 43 years from 1980 to 2022. These tests were employed to estimate the breakpoint year for each grid and plotted on a map for spatial visualization. It was observed that a close relation follows between the elevation of a place, its changepoint year and the land use land cover of that area. The elevation of an area affects the direction of propagation of moisture laden winds that are developed over the Southwestern part of US from Pacific Ocean and gulf of California. And eventually governing where and how much precipitation they will bring. Additionally, the land cover of an area governs the amount of evapotranspiration and hence the pressure difference between the moisture laden winds and the atmosphere over that land cover. When the daily precipitation records of 4 decades were analysed for homogeneity and changepoint year observed spatially, it was noted that a particular elevation and land cover showed similar breakpoint and a trend is being followed. This study provides a novel way of understanding the behaviour of changing precipitation patterns taking into account the long-term variability of 4 decades.

Keywords: Homogeneity test, Change point analysis, Land use land cover, Lower Columbia River basin

How to cite: Hamid, I. and Jothiprakash, V.: Analysing the relation between changepoint year, elevation, and land cover over lower Columbia River basin in North America, EGU General Assembly 2024, Vienna, Austria, 14–19 Apr 2024, EGU24-16296, https://doi.org/10.5194/egusphere-egu24-16296, 2024.

EGU24-16427 | ECS | Posters on site | HS2.4.3

Development of a river breakup prediction model 

Marie Sæteren, Kolbjørn Engeland, Ånund S. Kvambekk, and Lena M. Tallaksen

The dynamic breakup of river ice can initiate ice runs where large masses of ice floes accumulate as ice jams. These ice jams can cause severe inundation and infrastructure damage. Several Norwegian rivers are prone to ice run events, however there are currently no models available in Norway for predicting this specific hydrological phenomenon. Ice-related problems are often dealt with on a site-to-site basis and rely heavily on local knowledge. Other countries, such as Canada and Sweden, have implemented statistical, machine learning and process-based modelling approaches. Being able to accurately predict the timing and severity of ice run and ice jam events improves the ability to take suitable mitigation measures and limit negative consequences. The aim of this work is to develop a model to predict ice run events in two Norwegian rivers, the Beiarn River and the Stjørdal River, and thereby address the need for predicting this hydrological hazard.

The work presented here is part of a master thesis study that will be completed by May 2023. Both Stjørdal and Beiarn River have been monitored by NVE in the latter half of the 20th century, and the timing and severity of historical ice run events are obtained from this data. The predictors are given by hydrometeorological and ice thickness data, both observed and modelled. The Distance Distribution Dynamics (DDD) model developed by NVE is used for simulating daily discharge, and a simple ice growth model from NVE is used for modelling ice thickness. The prediction model itself is a work in progress, initially taking a logistic regression approach. If time allows, other approaches within machine learning such as random forest will be attempted. The dataset is severely imbalanced given the rarity of ice run events and the limited length of the observed series. Different methods are evaluated in terms of their ability to deal with this issue. The ultimate objective of this project is to develop a model providing daily probabilistic forecasts of the likelihood of ice run events in the coming days.

How to cite: Sæteren, M., Engeland, K., Kvambekk, Å. S., and Tallaksen, L. M.: Development of a river breakup prediction model, EGU General Assembly 2024, Vienna, Austria, 14–19 Apr 2024, EGU24-16427, https://doi.org/10.5194/egusphere-egu24-16427, 2024.

EGU24-17185 | Posters on site | HS2.4.3

Using ERA-5 reanalysis to characterize extreme rainfall in Italy 

Francesco Chiaravalloti, Roberto Coscarelli, and Tommaso Caloiero

Heavy precipitation events are likely to become more frequent in most parts of Europe; yet, records of hourly precipitation are often insufficient to study trends and changes in heavy rainfall. Atmospheric reanalyses are an important source of long-term meteorological data, often considered as a solution to overcome the unavailability of direct measurements. The reanalysis procedure makes use of a large amount of heterogeneous historical observations, both sensed and remotely measured (in situ, satellite, etc), assimilated within a dynamical model to reconstruct the state of the atmosphere, land surface and oceans in the past. Among the available reanalyses, the ERA5 dataset released by the ECMWF, can be considered one of the state-of-the-art products. Atmospheric and surface variables are provided hourly, from 1950 to almost real time, with a horizontal resolution of 31 km. The land model of the ERA5, driven by the downscaled meteorological forcing from the lowest ERA5 model level, and with an elevation correction for the thermodynamic near-surface state, is also used to derive the ERA5-land dataset, characterized by a higher spatial resolution (9 km) and finer precipitation distribution details.

In this paper, data from the ERA5-land reanalysis dataset were used to characterize the 1-hour maximum yearly rainfall values in Italy. Specifically, 3215 grid series of 1-hour rainfall for the period 1950-2020 have been first extracted. Then, for each grid series the 71 1-hour maximum yearly rainfall values have been evaluated. Moreover, the time frame 1950-2020 has been divided into several intervals, and for each one, the frequency distribution of the months recording the annual maxima was calculated. Finally, a cluster analysis has been performed to evaluate the area with a similar monthly distribution of these values. Results showed that, considering the data over the whole of Italy, the monthly distribution of occurrences of annual maxima of 1-hr rainfall is characterized by a peak in September occurring in all the time windows considered. Furthermore, clustering cells with a similar distribution of annual hourly rainfall maxima, using k-means, allowed to identify three groups characterised by different months with the highest frequency of occurrence of the maximum.

This work was funded by the Next Generation EU - Italian NRRP, Mission 4, Component 2, Investment 1.5, call for the creation and strengthening of 'Innovation Ecosystems', building 'Territorial R&D Leaders' (Directorial Decree n. 2021/3277) - project Tech4You - Technologies for climate change adaptation and quality of life improvement, n. ECS0000009. This work reflects only the authors’ views and opinions, neither the Ministry for University and Research nor the European Commission can be considered responsible for them.

How to cite: Chiaravalloti, F., Coscarelli, R., and Caloiero, T.: Using ERA-5 reanalysis to characterize extreme rainfall in Italy, EGU General Assembly 2024, Vienna, Austria, 14–19 Apr 2024, EGU24-17185, https://doi.org/10.5194/egusphere-egu24-17185, 2024.

EGU24-17249 | ECS | Posters on site | HS2.4.3

Global trend and drought analysis of near-natural river flows: The ROBIN Initiative 

Amit Kumar, Jamie Hannaford, Stephen Turner, Lucy J. Barker, Harry Dixon, Adam Griffin, Gayatri Suman, and Rachael Armitage

With hydrological extremes becoming more frequent and intense in a changing world, the impact on livelihoods, infrastructure, and economies is crucial. River flow data is a valuable resource and can be used to understand and analyse trends in both flow and extreme events. It is essential to systematically examine trends and anomalies within river flow across the globe. To capture the true natural trends, the river flow data should be from natural catchments and free from anthropogenic influences, such as the construction of dams, alterations in land use, and extraction of water from rivers. Special attention must be directed towards delineating these factors to enhance our understanding of the complex dynamics governing river systems. 

Existing challenges in attributing trends in river flows to climate change demands for a comprehensive, worldwide Reference Hydrometric Network (RHN) with minimal human impacts, to ensure integrity of climate change signals in river flow data. This global initiative, the Reference Observatory of Basins for INternational hydrological climate change detection (ROBIN) is a global collaboration to bring together the first global RHN. Currently consisting of partners from almost 30 countries spanning every continent, the first iteration of the ROBIN dataset is now available – a consistently defined network of over 3,000 near-natural catchments. 

The ROBIN team estimated the first truly global analysis of trends in river flows using near-natural catchments for periods of 40 (1975-2016) and 60 (1956-2016) years. This research showcases the first global drought assessment using the subset of ROBIN network, investigating variations in river flow trends and their impact on drought events, and trends at a global scale. The research focused on the spatial and temporal variability of trends and drought characteristics in different countries and hydro-belts across the ROBIN network. It also shows the great potential of serving as benchmark for future hydrological trend assessments. 

Efforts are ongoing to broaden the ROBIN network to bring together more countries, incorporating additional catchments representing diverse geographical characteristics. With the support of international organizations such as WMO, UNESCO, and IPCC, ROBIN establishes the groundwork for a sustainable network of catchments, enabling comprehensive assessments of climate-induced trends, variability, and occurrences of drought on a global scale. This initiative makes a substantial contribution to enhancing our understanding of the impact of climate change on river flows and the corresponding global patterns of drought. 

How to cite: Kumar, A., Hannaford, J., Turner, S., Barker, L. J., Dixon, H., Griffin, A., Suman, G., and Armitage, R.: Global trend and drought analysis of near-natural river flows: The ROBIN Initiative, EGU General Assembly 2024, Vienna, Austria, 14–19 Apr 2024, EGU24-17249, https://doi.org/10.5194/egusphere-egu24-17249, 2024.

EGU24-17464 | Orals | HS2.4.3

Patterns of extreme high flows in relation to their dominant generating processes across Sweden 

Yeshewatesfa Hundecha, Jonas Olsson, Lennart Simonsson, and Jörgen Rosberg

Understanding the nature of flooding of a region is key for flood management. The impact of flooding depends on how spatially extensive it is and this, in turn, is influenced by the processes generating the flood. In this study, we investigated the relative importance of rainfall and snowmelt in the generation of floods of different magnitudes and characterized their spatial patterns in different climate regions of Sweden. We generated a large number of spatially diverse extreme river flow scenarios across Sweden that are statistically consistent with the observations by employing a multi-site weather generator and a highly resolved semi-distributed hydrological model. The extreme flows within each of the main rivers were classified based on their generating meteorological forcing and the spatial distribution of the flow magnitudes was assessed. The results reveal that rainfall is the main contributor of extreme flows of all magnitudes in the southern part followed by rain-on-snow, while in the northern part, rain-on-snow is the main process resulting in extreme flows followed by rainfall. Pure snowmelt is the least contributor of extremes in all regions and its contribution decreases with increasing magnitude of the flow. The proportion of events generated by rainfall increases with the magnitude of the flow in all regions. Extremes of lower magnitudes are generally more spatially widespread than the higher extremes and events generated by snowmelt and rain-on-snow are spatially more widespread than events generated by rainfall.

The possible impact of climate change was also assessed by generating extreme flows for end-of-century climate change scenarios by perturbing the weather inputs generated by the weather generator using data from a set of regional climate models and using them to force the hydrologic model. The results show that the main generating processes in each region remain the same. However, the proportion of rainfall generated events will be markedly higher than under the present climate. 

How to cite: Hundecha, Y., Olsson, J., Simonsson, L., and Rosberg, J.: Patterns of extreme high flows in relation to their dominant generating processes across Sweden, EGU General Assembly 2024, Vienna, Austria, 14–19 Apr 2024, EGU24-17464, https://doi.org/10.5194/egusphere-egu24-17464, 2024.

EGU24-17479 | Posters on site | HS2.4.3

MAKAHO: An interactive cartographic Tool for Trend Analysis of hydrological extremes in France  

Louis Héraut, Michel Lang, Benjamin Renard, Éric Sauquet, and Jean-Philippe Vidal

Analysing the significance of trends in hydrological variables across different components of the streamflow regime, from low flows to high flows, provides an overview of the state of a region in the context of ongoing global changes. This information is crucial for decision-making regarding adaptation but also for evaluating hydrological projections.


MAKAHO (MAnn-Kendall Analysis of Hydrological Observations) is an interactive cartographic visualization system designed to examine trends in hydrometric observations from the 232 stations belonging to the French Reference Hydrometric Network (Giuntoli et al., 2013). These stations show a high measurement quality, time series with a historical depth of over 30 years, and they crucially gauge near-natural catchments. The statistical test used for trend detection is a variant of the Mann-Kendall test accounting for first-order autocorrelation. The trend slope is provided by the Theil-Sen estimator.


The hydrological situation in France shows a marked contrast between the northern and southern regions. Between 1968 and 2020, 22 % of stations show a significantly trend in the annual maximum daily streamflow at the 90 % confidence level. Of these stations, 27 % exhibit an upward trend, with an average increase of 13 % per decade. Almost all of these stations are located in the northern part of the country.


This north-south divide is also visible for low flows, with the demarcation line extending further north. 39 % of stations show a decreasing trend in the annual minimum monthly discharge, with an average intensity of about 11 % per decade. The signal in the northern part of the country is less significant. The duration of low flows has significantly increased in the south, particularly in the southwest, with an average of more than ten days per decade, reaching almost a month in extreme cases.


The tool, developed using the R Shiny library, takes the form of an online graphical interface (https://makaho.sk8.inrae.fr/). It enables direct communication with the R Exstat package (https://github.com/super-lou/EXstat), which is essential for data aggregation and trend analysis. Calculations are performed on the fly, allowing greater customisation of analyses. MAKAHO users can choose the analysis period, the hydrological variable (from low flows to high flows), display time series for the variable of interest and extract summary sheets for a set of hydrometric stations. The interactive map and graphs allow switching from an overview to a detailed view of the results for each station. MAKAHO has been designed based on previous research projects involving stakeholders to encourage water managers to develop robust strategies for adapting to climate change and has received financial support from the French Ministry of Ecology.


Giuntoli, I., Renard, B., Vidal, J.-P., and Bard, A. (2013). Low flows in france and their relationship to large-scale climate indices. Journal of Hydrology, 482:105–118. https:/doi.org/10.1016/j.jhydrol.2012.12.038

How to cite: Héraut, L., Lang, M., Renard, B., Sauquet, É., and Vidal, J.-P.: MAKAHO: An interactive cartographic Tool for Trend Analysis of hydrological extremes in France , EGU General Assembly 2024, Vienna, Austria, 14–19 Apr 2024, EGU24-17479, https://doi.org/10.5194/egusphere-egu24-17479, 2024.

EGU24-18032 | ECS | Orals | HS2.4.3

Challenges in analysing and modelling extreme floods: The case study of Ahr catchment 

Bora Shehu and Axel Bronstert

The extreme weather conditions of July 2021 caused major flooding’s in multiple tributaries of the Meuse and Rhine rivers. Particularly the Ahr Valley in Germany was greatly affected, where exceptional damage and severe human loss was registered. Since then, several studies have been conducted to understand the extremity, the major driving forces, the particular mechanisms of this flood and the possible impacts of climate change on the generation of such an event. Here the main objective is to perform a hydrological analysis of the July 2021 Ahr event and discuss the challenges in modelling or analysing this event.

First, we show that particularly the rainfall field is associated with high uncertainty, as seen by the high variability between the different rainfall products available. The average areal rainfall volume can differ between products with as much as 50mm/day, which constitutes almost 55% of the rainfall volume estimated by Radolan. To capture the full uncertainty-range of the rainfall field, rainfall simulations conditioned both on radar and station observations are implemented.  

Next, based on rainfall simulations and reconstructed discharge data, runoff coefficients (Rc) are shown to be ranging between 0.6 to 1.2 (median 0.7). These values are clearly higher than expected in continental climate (Rc ~ 0.20-0.51) and the latest 100-year return flood observed in 2016 (with Rc ~ 0.4). The high lower range suggests, that the dominant processes have changed, with slower components of surface runoff shifting to faster ones. This agrees well with the observed traces of erosion, surface water and flow paths in parts of the catchment.

Lastly, the reconstructed discharge data are also subjected to uncertainty due to lack of observations and the non-representativeness of the stage-discharge curve during the flood wave. Hence, high Rc values do not only originate from underestimated rainfall but as well from possible overestimated flood volume. For this purpose, discharge was estimated with the Larsim model. As expected due to the change of the dominant processes, the pre-event parameter set underestimates considerably the flood volume, while the post-calibration one agrees better with the reconstructed data. On both cases, the computed runoff coefficient ranges between 0.4 to 0.7.

To conclude, extraordinary events such as the July 2021 in Ahr Catchment, are accompanied with high uncertainty and as such are difficult to be analysed or modelled. Nevertheless, the results dictate that the surface runoff played an important role in July 2021. At the same time, it is clear that the landscape still has a considerable retention effect, between 30% and 50%, even for such a heavy rainfall.

How to cite: Shehu, B. and Bronstert, A.: Challenges in analysing and modelling extreme floods: The case study of Ahr catchment, EGU General Assembly 2024, Vienna, Austria, 14–19 Apr 2024, EGU24-18032, https://doi.org/10.5194/egusphere-egu24-18032, 2024.

EGU24-18080 | ECS | Posters on site | HS2.4.3

Investigation of combined regional trends of extreme precipitation and temperature in southern Italy 

Gholamreza Nikravesh, Alfonso Senatore, and Giuseppe Mendicino

This contribution proposes an integrated analysis of climate regime trends in southern Italy (Calabria Region), focusing on both extreme precipitation and temperature events. Provided several precipitation and temperature observations available in the period 1955-2023 for a relatively dense monitoring network (approximately a rain gauge station per 110 km2 and a temperature station per 100 km2), four precipitation-related variables like total precipitation (PRCPTOT), maximum one-day precipitation (RX1day), maximum five-day precipitation (RX5day) and Consecutive Dry Days (CDD) were chosen. Also, three temperature-based variables were selected, i.e., the maximum of the maximum daily temperatures (TXx), the mean of the mean daily temperatures (Tmean), and the minimum of the minimum daily temperatures (TNn). The trends of these seven selected variables were assessed and combined through three approaches at the annual and seasonal scales, considering each available monitoring station (namely, 134 precipitation and 148 temperature stations). First, we combined PRCPTOT and RX1day to highlight which stations have an increased probability of both drought and flood risks, developing a novel integrated climate regime index (ICRI). Then, we considered the three temperature indices, TXx, Tmean, and TNn, to pinpoint stations that have experienced more robust rising trends. The third analysis combined PRCPTOT, RX1day and temperature (using alternatively TXx, TNn and Tmean) to investigate the compound risk of flood, drought and, to a certain extent, wildfires. The results indicate a rather homogeneous increase of all temperature-related variables, especially starting from 1990, and that since 1955, a considerable number of stations have experienced increasing trends for RX1day and falling trends for PRCTOT. Therefore, most of the territory of the region is more likely to confront water stress, flood and forest fires.

How to cite: Nikravesh, G., Senatore, A., and Mendicino, G.: Investigation of combined regional trends of extreme precipitation and temperature in southern Italy, EGU General Assembly 2024, Vienna, Austria, 14–19 Apr 2024, EGU24-18080, https://doi.org/10.5194/egusphere-egu24-18080, 2024.

EGU24-18942 | Orals | HS2.4.3

Changes in maximum and minimum runoff of Eurasian Arctic rivers during the climate change epoch 

Maria Kireeva, Dmitriy Magritskiy, and Natalia Frolova

The study is devoted to the analysis of daily time series of river runoff in the Arctic zone of Eurasia. Unique data on daily water discharges in the closing gauges of Arctic rivers were collected and processed in the package grwat (https://cloud.r-project.org/web/packages/grwat/index.html ), which identifies genetic components of runoff. As a result, 53 runoff characteristics were obtained for each of the 25 rivers flowing into the Arctic Ocean and the contribution of snowmelt, rainfall, and groundwater components to the total runoff was analyzed. Particular attention was paid to extreme characteristics - maximum water discharges of spring freshet, rain events and minimum 1, 5, 10-averaged discharges during summer and winter.
The study of maximum water discharges has shown that, in general there are trends of decreasing annual maximums for both large and medium-sized Arctic rivers. This trend, however, is not yet statistically significant everywhere. The most intensive decrease in maximums localized in the Northern Dvina, Ob, and Yenisei rivers, for which flow regulation by reservoirs has a significant impact. For the Kolyma, Yana and Indigirka rivers, there are periods of increase in maximums and their decrease lasting 5-7 years, with a general tendency to increase during 1960-2001 up to 15-20%.
In contrast, the minimum discharges with different averaging intervals increases by 25-56 % everywhere; this trend is presumably related to the general climate warming, increased infiltration and the role of groundwater flow, and for the rivers in the eastern part of the Arctic zone - to the degradation of permafrost.
The study also included analysis of the runoff signature transformation in Arctic zone by every year, as well as on average for the modern and historical period. The typing methodology consisted in classifying hydrographs according to two main features: a) exceedance of maximum discharge relative to the average annual discharge b) the share of flood runoff volume in the total annual runoff. The analysis showed a noticeable increase in the frequency of occurrence of smoothed hydrographs on the rivers of the Arctic zone of the Asia-Pacific region, for some basins the number of such years increased by 1.5-2 times (Polui, Turukhan, Ob rivers).

How to cite: Kireeva, M., Magritskiy, D., and Frolova, N.: Changes in maximum and minimum runoff of Eurasian Arctic rivers during the climate change epoch, EGU General Assembly 2024, Vienna, Austria, 14–19 Apr 2024, EGU24-18942, https://doi.org/10.5194/egusphere-egu24-18942, 2024.

EGU24-19269 | ECS | Posters on site | HS2.4.3

Dynamics of Intraseasonal Compound Whiplash Event: A Retrospective Analysis in India 

Aman Kumar and Dhyan Singh Arya

Hydroclimatic Whiplash events refer to the extreme variability characterising the rapid transitions from one hydroclimatic extreme to another, occurring in consecutive periods. Rapid transition from one extreme to the other. The compound consecutive extremes impact often exceeds the magnitude of individual events given their occurrence at distinct times. This study introduces a comprehensive investigation into Intraseasonal compound whiplash occurrences in India, focusing on the rapid shifts between drought/heat and pluvial conditions. The data used in the study is taken from IMD precipitation of 0.25˚ x 0.25˚ and temperature at 1˚x 1˚ for the time span 1901 to 2022. This study involves distinct thresholds for duration and intensity to identify the heat dry and wet events. Dry events are characterised by prolonged low rainfall and sustained minimum temperatures throughout the dry period. Conversely, wet events exhibit high intensity within relatively shorter durations. Emphasising the 70th percentile for temperature thresholds acknowledges that extreme conditions in each component aren't mandatory for a compound event's occurrence. Our study delves into the frequency of individual extremes and compound whiplash occurrences, calculating swing severity using mean temperature quantiles for warm/dry spells alongside precipitation anomalies. The Mann-Kendall test and Sen’s slope is used for the check frequency and severity evolution at the grid level. Results highlight diverse regions witnessing increasing trends in wet and dry events, signifying a notable surge in compound whiplash incidents. This is especially worrying in areas that have typically been dry because the increase in rain can disrupt the usual climate there. This concerning trend raises alarms for local ecosystems, water resources, and socio-economic activities. Recognising these evolving patterns is critical for making strategies and long-term planning in the recent climate variability.

How to cite: Kumar, A. and Arya, D. S.: Dynamics of Intraseasonal Compound Whiplash Event: A Retrospective Analysis in India, EGU General Assembly 2024, Vienna, Austria, 14–19 Apr 2024, EGU24-19269, https://doi.org/10.5194/egusphere-egu24-19269, 2024.

Hydroclimatic whiplash, a lagged compound hazard combined with preceding drought (flood) and following flood (drought), may induce significant environmental, hydrological, and socio-economic impacts worldwide. North America is one of the hot spots becoming susceptible to the transitions or shifts between two extremes. These compound events are also expected to become more frequent and intense in the future under climate change. To better understand the climate influence, overall decadal changes in climate variables and related hydroclimatic swing events need to be analyzed considering two components: anthropogenic external forcing and natural internal variability. External forcing is induced by anthropogenic activities imposing greenhouse gas emissions on the climate system, resulting in the signal of global warming. Internal climate variability (ICV), also termed climate noise, is an irreducible uncertainty induced by the chaotic nature thus unpredictable evolution of the climate system. In this study, we use four single-model initial-condition large ensembles (SMILEs) under historical and future forcing scenarios (RCP8.5), CanLEAD-EWEMBI, CanLEAD-S14FD, CanRCM4-LE, and GFDL-SPEAR, to quantify the relative role of external forcing and ICV on variations in compound dry-wet swing events across North America. The SMILE enables the robust quantification of the externally forced response and internal variability via computation of ensemble statistics, provided the ensemble size is large enough. On the virtue of this advantage, the standardized precipitation evaporation index is estimated to identify dry and wet spells and their transitions based on ensemble pooling and threshold-based event extraction methods. Frequency, intensity, transition time, transition intensity, and relative role of preceding and following spells, etc. are quantified for each warming period (1.5°C-4 °C global warming levels) and compared with those of the baseline period to investigate their projected changes and trends. The relative contribution of ACC and ICV to compound dry-wet spells is quantified by the ratio of changes and trends in the ensemble mean and the spread (standard deviation) among the ensemble members of each SMILE, respectively. The results of this study suggest that hydroclimatic swing events across North America are expected to become more frequent and intensified in a warmer climate, which is induced by significant emergence of external forcing. In addition, the transition time and transition intensity are projected to be more dominated by anthropogenic forcing over ICV than other characteristics indicating that more abrupt and severe shifts can occur in the future. The findings of this study support the necessity of developing appropriate measures for mitigating the anthropogenic forcing impact because it increases the risk of lagged compound floods and droughts that can lead to severe disasters in North America.

How to cite: Najafi, M. R., Na, W., and Grgas-Svirac, A.: Relative Contribution of External Forcing and Internal Climate Variability to Lagged Dry-Wet Swing Projections in North America, EGU General Assembly 2024, Vienna, Austria, 14–19 Apr 2024, EGU24-20728, https://doi.org/10.5194/egusphere-egu24-20728, 2024.

Desertification is a worldwide issue receiving broad attention due to deforestation, climate change, and land abuse. In India, nearly 81.4 million ha are undergoing the desertification process. A long-term assessment of the key drivers of desertification and land degradation (DLD) was done over the state of Jharkhand in the central highlands of India. The region is highly vulnerable to desertification and land degradation due to its unique geographical and climatic features, with 68.77% (5.48 Mha) of the total geographical area of 7.97 Mha undergoing DLD. This study aims to quantify desertification in Jharkhand using various satellite imageries and supervised classification using machine learning (ML) techniques. The results showed five distinct classes of DLD cases, i.e., severe, intense, moderate, light, and no desertification. The severe and intense class areas make up about 5.11 Mha (64.43%) of the total geographic area (TGA). The moderate and light classes of DLD make up 0.93 Mha (11.79%) and 1.40 Mha (17.73%) of TGA, respectively. Remarkably, the districts of Giridih, Gumla, Ranchi, Dumka, Jamtara, Deoghar, Garhwa, and Palamu are considered to be the most prone regions to DLD. This study will help to demonstrate the application of remote sensing techniques to quantify DLD-prone regions and severity over the regions, which can help policymakers manage the local administrative bodies and state government departments to demarcate the region to continuously monitor and lay policies to tackle desertification.

Keywords: Desertification, Central Highlands, GEE, Random Forest, Vulnerability, Machine Learning

How to cite: Mahato, T. and Kumar, M.: Understanding the Drivers of Desertification and Land Degradation (DLD) over the Central Highlands of India, EGU General Assembly 2024, Vienna, Austria, 14–19 Apr 2024, EGU24-20795, https://doi.org/10.5194/egusphere-egu24-20795, 2024.

EGU24-184 | Orals | HS2.4.4

Data Assimilation Informed model Structure Improvement (DAISI) to improve prediction under climate change 

Julien Lerat, Francis Chiew, David Robertson, Vazken Andreassian, and Hongxing Zheng

Estimation of future streamflows is generally done using rainfall-runoff models to generate streamflow projections based on future climate inputs. Unfortunately, the performance of these models degrades significantly when predicting values outside of their calibration range, which undermines the credibility of projected scenarios. This abstract presents a method to analyze and improve the equations constituting a rainfall-runoff model structure in the context of climate change scenario modelling demonstrated with an application to the GR2M model and 201 catchments in South-East Australia. The method, termed "Data Assimilation Informed model Structure Improvement" (DAISI), enhances a rainfall-runoff model by combining data assimilation with polynomial updates of the state equations. The method is generic and modular, and consistently improves model performance across various metrics, including KGE, NSE on log-transformed flow, and flow duration curve bias. The updated model exhibits higher elasticity of runoff to rainfall, indicating potential significance for climate change simulations. The DAISI diagnostic identifies a reduced number of update configurations in the GR2M structure, with distinct regional patterns in three sub-regions (Western Victoria, central region, and Northern New South Wales). We suggest potential improvements for DAISI, such as incorporating additional observed variables like actual evapotranspiration to better constrain internal model fluxes.

How to cite: Lerat, J., Chiew, F., Robertson, D., Andreassian, V., and Zheng, H.: Data Assimilation Informed model Structure Improvement (DAISI) to improve prediction under climate change, EGU General Assembly 2024, Vienna, Austria, 14–19 Apr 2024, EGU24-184, https://doi.org/10.5194/egusphere-egu24-184, 2024.

EGU24-457 | ECS | Posters on site | HS2.4.4

Exploration of a Unified Process Interpretation for Seasonal and Annual Water Balances in Snowy Catchments 

Zeqiang Wang, Wouter R. Berghuijs, Nicholas Howden, and Ross Woods

Snow accumulation and melt dynamics provide influences on streamflow seasonality and mean annual flow which are not present in snow-free areas. Most studies of snow hydrology focus on one timescale, which limits and fragments the understanding of catchment behaviour. Establishing which process controls on hydrological responses act across multiple time scales is still challenging due to the wide range of climates and landscape conditions that may affect the catchments’ hydrological functioning. Here, we build upon prior research that showed how climate and soil drainage effects both shape seasonal and mean annual water balances in humid, snow-free catchments. We establish process controls on seasonal and mean-annual hydrological responses to unify the process interpretation across time scales for diverse snow-influenced catchments. We use observed streamflow, climate and catchment attributes data in snow-affected catchments from the CAMELS_US dataset to assess the impacts of climate and landscape on catchment responses. We use a conceptual model to unify the mechanistic explanation for seasonal and mean annual water balances. We hypothesize that the interaction between climate aridity, the fraction of precipitation falling as snow, and landscape properties (soil, geology and topography) in snow-affected catchments shapes both streamflow seasonality and mean annual flow.

How to cite: Wang, Z., Berghuijs, W. R., Howden, N., and Woods, R.: Exploration of a Unified Process Interpretation for Seasonal and Annual Water Balances in Snowy Catchments, EGU General Assembly 2024, Vienna, Austria, 14–19 Apr 2024, EGU24-457, https://doi.org/10.5194/egusphere-egu24-457, 2024.

EGU24-937 | ECS | Posters on site | HS2.4.4

Changes in potential evaporation over the last four decades in Hornsund SW Spitsbergen 

Nicole Hanselmann, Marzena Osuch, Abhishek Bamby Alphonse, and Tomasz Wawrzyniak

Svalbard is one of the fastest warming regions of the earth, over the last 40 years SW Spitsbergen has experienced large changes in hydrological and meteorological conditions. Evaporation is an important component of the hydrological cycle but remains understudied in High Arctic Svalbard. Cold climate evaporation in Spitsbergen is often neglected and commonly used evaporation estimates date to the early 2000’s. In this study, potential evaporation (PET) estimates for the period 1982 to 2023 were calculated using ten different PET models and meteorological data from the Polish Polar Station Hornsund (SW Spitsbergen). The ten potential evaporation methods includes radiation-based (Abtew), temperature-based (Hamon), radiation-temperature based (Hargreaves Samani) and combined models (Penman Montheit) and more. Trends in annual and interannual potential evaporation have been analyzed and compared to changes in meteorological conditions. The study evaluates the influence of the choice of PET model and the derived changes in potential evaporation estimates. The results of the study show a large spread in the amount of annual PET estimates ranging from ~30mm/y (Kharrufa) through ~300mm/y (Penman-Monteith) up to ~450mm/y (Abtew). Trends analysis shows different outcomes depending on the length of the averaging period. Using a daily timescale, PET models tend to show more similar patterns of changes than using monthly timescales. That corresponds well with changes in the meteorological conditions.

How to cite: Hanselmann, N., Osuch, M., Alphonse, A. B., and Wawrzyniak, T.: Changes in potential evaporation over the last four decades in Hornsund SW Spitsbergen, EGU General Assembly 2024, Vienna, Austria, 14–19 Apr 2024, EGU24-937, https://doi.org/10.5194/egusphere-egu24-937, 2024.

The Budyko hypothesis provides a useful framework for comprehending the behaviour of long-term water balance for a natural and closed catchment. It is widely used for partitioning precipitation into other water-cycle components, characterising hydrological response, and assessing long-term water availability.

Since, Budyko framework was developed for natural catchments assuming no storage change, its suitability for studying catchments with human-intervention in a changing climate is debated. This study aims to contribute to this debate by assessing appropriateness of Budyko framework for studying and predicting long-term water cycle changes stemming from climate change and human-driven storage changes. We simulate various climate and anthropogenic scenarios in a closed-loop environment using SWAT (Soil and Water Assessment Tool) model across three climate zones (humid, semi-arid, and arid) for more than 70 years. The scenarios reflect secular changes in climatic variables such as precipitation and temperature, and anthropogenic changes such as change in storage. The long-term time-series data for climatic variables were synthetically generated by obtaining the best-fit probability distribution, which were used to create various scenarios by trend-injection method. The model outputs were used for both steady and unsteady-state conditions to get the Budyko plots and to understand the deviation from the Budyko curve for various climate and storage change scenarios from the reference scenario.

We found that for small changes in precipitation and temperature, catchments translate along the reference Budyko curve but deviates away from the curve for a large climatic change and even a small storage change. The Budyko framework is more sensitive to precipitation change compared to temperature change. For realistic long-term storage change, particularly in arid or semi-arid regions, Budyko points in the traditional framework breach water limit. We observed that when the storage change is considered in the Budyko framework, the points again constrain itself in the Budyko space. Therefore, we developed a generalised Budyko framework by incorporating storage change in a mathematical equation considering water and energy balance. The traditional Budyko framework is a special case within it. The novel generalised Budyko framework proposed here could prove to be an indispensable tool for effective water resources management and studying catchment response to various climate change projections.

How to cite: Shaw, B., Sharma, P., and Vishwakarma, B. D.: Towards a novel water budget partitioning framework to better characterize the impact of climate and storage change on water fluxes., EGU General Assembly 2024, Vienna, Austria, 14–19 Apr 2024, EGU24-958, https://doi.org/10.5194/egusphere-egu24-958, 2024.

EGU24-2832 | Posters on site | HS2.4.4

Understanding and disentangling of flood generation mechanisms 

Hadush Meresa, Adam Griffin, and Alison Kay

Extreme rainfalls and floods have caused severe socio-economic and environmental losses in most parts of the world and are predicted to exacerbate due to the changing climate. Highly saturated soil, extreme rainfall, and heavy snowmelt are the most common flood triggers. However, the relative contributions of extreme, long rainfall, antecedent soil moisture, and snowmelt and how they are vary with time and change from catchment to catchment are not fully understood. This information is critical for a better understanding of flood generation mechanisms and can improve flood risk management plans and strategies. We examined precipitation, streamflow, and estimated anticipated soil moisture (anticipated precipitation index) from more than 146 hydrological stations across the UK. Our main objectives were: creating flood type classes according to hydrometeorological characteristics, identifying the contribution of independent variables (soil moisture, snow, rainfall) and understanding the spatial and temporal variability of mutual information.

A simple empirical relationship between the peak flow and precipitation was used to estimate the anticipated precipitation index, used as a proxy for antecedent soil moisture. The relative importance of each variable and its respective flood-generating processes were identified using multilinear regression and decision tree approaches. Based on catchment average rainfall, gauged streamflow, and estimated anticipated soil moisture data across the UK, we confirm that most of peak flows are strongly associated with both the extreme rainfall and antecedent soil moisture conditions above the 90th percentile. There is a clear difference in flood magnitude and their respective generating mechanisms between regions, and regions with an expected decrease in anticipated soil moisture into the future were highly statistically correlated with a decrease in annual average peak flood magnitude. The role of extreme rainfall is the most dominant factor across the UK; however, seasonal total rainfall is not a strong influencing factor of peak floods in the southern UK. Extreme rainfall and peak floods are positively corrected with catchment drainage area. This linkage between drainage area and the most common flood generation mechanisms is crucial to quantifying the magnitude and level of flood risk in ungauged catchments.

How to cite: Meresa, H., Griffin, A., and Kay, A.: Understanding and disentangling of flood generation mechanisms, EGU General Assembly 2024, Vienna, Austria, 14–19 Apr 2024, EGU24-2832, https://doi.org/10.5194/egusphere-egu24-2832, 2024.

EGU24-3583 | Orals | HS2.4.4

Making hydrological science fit for climate change: The underrated soil-groundwater-stream continuum 

Gunnar Lischeid, Jörg Steidl, Justus Weyers, and Jenny Kröcher

Numerous studies have been performed to assess climate change impacts on hydrological processes. However, a number of recent studies have pointed to some generic shortcomings of actual approaches, e.g.

  • Many models have severe problems to map observed trends in groundwater head (Scanlon et al. 2018);
  • Rainfall-runoff models often need to be re-calibrated after extended drought periods (Peterson et al. 2021, Fowler et al. 2022);
  • Models tend to disregard the positive relationship between groundwater head and flood risk (Berghuijs and Slater 2023).

We hypothesize that these problems are related to a current underrating of the soil-groundwater-stream continuum, particularly of the role of the deep vadose zone. We combined principal component analysis, spectrum analysis and vadose zone modelling applied to more than 500 time series of groundwater head, lake level, and stream discharge in Germany, covering an area of about 90,000 km2 in total, and up to 42 years.

Principal component analysis confirmed that groundwater head, lake water level and stream discharge were closely interrelated. Thus the data were merged for subsequent analyses. First order control of the spatial variability of the temporal dynamics was the degree of damping of the hydrological input signal within the vadose zone (Lischeid et al. 2021). Contrary to common assumptions especially the deeper soil layers underneath the rooting zone played an outstanding role in his regard. The degree of damping in groundwater head time series was very closely related to direction and strength of long-term trends. In contrast, there was no clear correlation, e.g., with climatic or land-use trends.

Spectrum analysis allowed to draw generalizable conclusions. From the spectrum analysis perspective the vadose zone acts as a low-pass filter of the input signal. The degree of low-pass filtering can be quantified, e.g., via spectrum analysis of the respective time series. That approach does neither require any additional site specific information nor does it depend on the specific calibration of single models. Damping of a time series via low-pass filtering inevitably results in increasing probability of significant trends even for very long periods, thus explaining the increase of probability of significant trends with thickness of the vadose zone. Another consequence of low-pass filtering is an increase of hydrological memory. For example groundwater head at a depth of 20 m below surface exhibited a memory of roughly 50 years which is massively underestimated by current models.

Groundwater head dynamics had a clear effect on discharge dynamics as well. Similarly as observed for groundwater dynamics hydrographs differed primarily with respect to the degree of damping of the hydrological input signal. Moreover, the degree of damping varied over time and reflected local groundwater head dynamics. It is remarkable that the shape coefficient of the extreme value distribution depends on the degree of damping. Consequently, not only drought risk assessment but flood risk assessment as well needs to consider explicitly deep vadose zone processes and groundwater head dynamics.

References:

Berghuijs and Slater (2023), Environ. Res. Lett., https://doi.org/10.1088/1748-9326/acbecc

Fowler et al. (2022), WRR, https://doi.org/10.1029/2021WR031210

Lischeid et al. (2021), JHyd, https://doi.org/10.1016/j.jhydrol.2021.126096

Peterson et al. (2021), Science, https://doi.org/10.1126/science.abd5085

Scanlon et al. (2018), PNAS, http://ww.pnas.org/cgi/doi/10.1073/pnas.1704665115

How to cite: Lischeid, G., Steidl, J., Weyers, J., and Kröcher, J.: Making hydrological science fit for climate change: The underrated soil-groundwater-stream continuum, EGU General Assembly 2024, Vienna, Austria, 14–19 Apr 2024, EGU24-3583, https://doi.org/10.5194/egusphere-egu24-3583, 2024.

EGU24-3597 | Orals | HS2.4.4

Greening mediates climate and CO2 induced water use efficiency effects on freshwater yield 

Taehee Hwang, Lawrence Band, Irena Creed, and Mark Green

Forests are crucial for the production of high-quality freshwater resources. Complex interactions between climate change and forest processes can result in uncertainty in the availability of freshwater to downstream communities and the environment. Previous studies reported consistent increasing trends in global river discharge during the last century, which has been explained by either climate factors (usually called “hydrological intensification”) or suppressed transpiration due to CO2-induced stomatal closure. In this study, we study long-term changes in hydrological partitioning of precipitation between evapotranspiration and runoff generation (as mm per year) along a gradient of forested watershed along the eastern temperate forest biome. The precipitation is increasing at faster rates than runoff at most of these study catchments, which suggests long-term increases in evapotranspiration. These divergent trends in precipitation versus runoff rates are significantly correlated to long-term trends in NDVI and growing season length at the watershed scale, while climate variables cannot provided significant explanation. These findings suggest that the combined effect of increased temperatures and CO2 fertilization have led to increased leaf area and lengthened growing season, which may counteract the effect of the CO2-induced stomatal closure across the eastern US. This study emphasizes the importance of understanding vegetation responses to climate change to predict future flow regimes in forested watersheds.

How to cite: Hwang, T., Band, L., Creed, I., and Green, M.: Greening mediates climate and CO2 induced water use efficiency effects on freshwater yield, EGU General Assembly 2024, Vienna, Austria, 14–19 Apr 2024, EGU24-3597, https://doi.org/10.5194/egusphere-egu24-3597, 2024.

Large-scale cross-site scientific synthesis on low-flow storage–discharge relation can promote developing transferable hypotheses on the interactions among critical zone attributes and on how such interactions affect catchments’ water vulnerabilities. This study leverages cross-site empirical and theoretical analyses and develops a similarity index, based on the interactions among critical zone attributes, to help determine the less-explored influence of upland hillslope groundwater subsidy on storage–discharge relation. We show that an increase in the relative extent of upland hillslope groundwater subsidy to low-flow discharge, occurring through deep slow low-moving (e.g., bedrock) storage unit, leads to (a) an increase in the nonlinearity of low-flow discharge sensitivity to storage (β1) and (b) an increase in the convexity of low-flow storage–discharge relation. Our findings also raise new hypotheses on the applicability of Boussinesq-based hydraulic groundwater theory at low-flow condition. Empirical results show that in a portion of our study catchments, particularly in those with a relatively small extent of upland hillslope groundwater subsidy, the theory’s proposed range of nonlinearity sufficiently explains the nonlinearity of low-flow storage–discharge relation. However, in catchments with a strong influence of upland hillslope groundwater subsidy through deep slow-moving storage unit, the current state of hydraulic groundwater theory, using one single (non)linear representative storage unit, may not be sufficient to explain the large nonlinearity and convexity of low-flow storage–discharge relation (or the long tail of hydrograph late recession). Considering β1 informs the low-flow vulnerability of catchments, the findings of this study deepen and generalize our understanding of where low-flow discharge is vulnerable to storage’s change.

How to cite: Ameli, A. and Li, H.: Upland Hillslope Groundwater Subsidy Affects Low-Flow Storage–Discharge Relationship, EGU General Assembly 2024, Vienna, Austria, 14–19 Apr 2024, EGU24-4801, https://doi.org/10.5194/egusphere-egu24-4801, 2024.

The instantaneous rate of glacier melt depends strongly on the surface albedo. For example, snowfall increases surface albedo and reduces melt rate, while dark impurities deposited on the surface enhances melt. We discuss two interesting consequences of this feedback, which lead to simplifications in models describing the runoff of glacierised catchments. 


We investigated the interannual variability of modelled streamflow on two Himalayan catchments. On an excess-precipitation year, glaciers receives more snow, which reduces melt. In contrast, on a precipitation-deficient year, glaciers have less snowcover and they produce more meltwater. This behaviour makes the annual runoff contribution from the glaciers in any given catchment to be either weakly sensitive or insensitive to the interannual variability in precipitation. Further, this characteristic is shown to be independent of the climate setting of the glacier, or the models used. A general linear-response expression for the streamflow response to climatic perturbations is proposed, where the glacierised parts respond to temperature variability and the non-glacierised parts respond to precipitation variability. This simple expression reproduces several well known characteristics of the variability of the runoff of glacierised catchments, e.g., glacier-compensation effect, buffering effect, peak-water effect etc. 


The melt enhancing effects of dark supraglacial impurities lead to the formation of tiny cylindrical cryoconite holes that are commonly seen on glacier surfaces across the globe. Their contribution to glacier mass balance and runoff generation is debated. We build an idealised model of the evolution of these holes on sunny days, and show that the holes of a given diameter reach a steady depth, which scales linearly with the diameter. The predicted depth-diameter scaling is consistent with available global-scale observations. This scaling imply that the total melt contribution of the holes to glacier runoff is likely to be negligible, and that the formation of these holes provides an effective mechanism for restricting excess melt when supraglacial impurities are present.  

How to cite: Banerjee, A.: Simplifying properties of glacier runoff resulting from Ice-albedo feedback, EGU General Assembly 2024, Vienna, Austria, 14–19 Apr 2024, EGU24-5092, https://doi.org/10.5194/egusphere-egu24-5092, 2024.

EGU24-5358 | ECS | Posters on site | HS2.4.4

Quantifying global water cycle—CO2 feedbacks from Earth system models 

Xuanze Zhang and Yongqiang Zhang

Large uncertainty in predicting surface water availability (precipitation minus evaporation) in a CO2-enriched climate is associated to rising CO2-related hydrological feedbacks to the global water cycle, primarily including hydrological sensitivity to CO2-physiological and -radiative effects. Using the 1pctCO2 experiments of twelve CMIP6 models, we first decoupled and quantified the magnitudes of these sensitivities at global and regional scales. Results show that under a 140-year transient 4×CO2 scenario, the global hydrological sensitivity (precipitation or evaporation) for CO2-physiological effect feedback is -0.09 ±0.07 % (100 ppm)1 and for CO2 radiative effect feedback is 1.54 ±0.24 % K1. The latter is about 10% larger than the global apparent hydrological sensitivity ( = 1.39 ±0.22 % K1), as estimated from the fully coupled simulations. These hydrological sensitivities are relatively stable over transient 2× to 4×CO2 scenarios. The CMIP6 models project that global precipitation or evaporation increases at 4×CO2 are dominated by the CO2 radiative effect feedback (79 ±12%) and positively contributed by the interaction between the two feedbacks (6 ±12%) but are reduced by the CO2 physiological effect feedback (-10 ±8%). This underlines the importance of CO2 vegetation physiology in global water cycle projections under a CO2-enriched and warming climate.

How to cite: Zhang, X. and Zhang, Y.: Quantifying global water cycle—CO2 feedbacks from Earth system models, EGU General Assembly 2024, Vienna, Austria, 14–19 Apr 2024, EGU24-5358, https://doi.org/10.5194/egusphere-egu24-5358, 2024.

EGU24-5634 * | Orals | HS2.4.4 | Highlight

From snow to socio-hydrology: mechanisms behind the 2022 drought in the Alps 

Francesco Avanzi, Francesca Munerol, Massimo Milelli, Simone Gabellani, Christian Massari, Manuela Girotto, Edoardo Cremonese, Marta Galvagno, Giulia Bruno, Umberto Morra di Cella, Lauro Rossi, Marco Altamura, and Luca Ferraris

Our study delves into the intricate relationship between the 2021-2022 snow deficit in the Italian Alps and subsequent socio-hydrologic repercussions during the ensuing summer drought across the Po river basin, thus elucidating socio-hydrologic response from headwaters to lowlands in an era of change. Starting from early 2022, a high-pressure ridge led to a -88% anomaly in peak Snow Water Equivalent (SWE), which was compounded by episodes of intraseasonal snowmelt and earlier melt-out dates. As a result of this low SWE, a further -10% in summer precipitation, and +1.9°C summer temperature anomaly, terrestrial water storage measured through GRACE hit its all-time low. Meanwhile, we observed an intensification of both anomalies in SWE and in streamflow compared to other recent droughts. Municipal emergency water-use restrictions were issued in correspondence to the peak in snowmelt deficit, rather than the peak in precipitation deficit, with a spatial signature that clearly points to missed snowmelt as a key contributing factor in the escalation of this emergency. This archetypal event, along with the multi-decadal decline in terrestrial water storage, highlights the contributing role of snowmelt deficit in driving socio-hydrologic impacts of droughts in Alpine regions in the context of a warming climate. 

How to cite: Avanzi, F., Munerol, F., Milelli, M., Gabellani, S., Massari, C., Girotto, M., Cremonese, E., Galvagno, M., Bruno, G., Morra di Cella, U., Rossi, L., Altamura, M., and Ferraris, L.: From snow to socio-hydrology: mechanisms behind the 2022 drought in the Alps, EGU General Assembly 2024, Vienna, Austria, 14–19 Apr 2024, EGU24-5634, https://doi.org/10.5194/egusphere-egu24-5634, 2024.

EGU24-6982 | ECS | Orals | HS2.4.4

Potential evapotranspiration depends on precipitation and runoff in a catchment at the mean annual scale 

Changwu Cheng, Wenzhao Liu, Zhi Li, Zhaotao Mu, and Hao Feng

As a proxy for atmospheric evaporative demand, potential evapotranspiration (EP) is usually estimated by meteorologic elements such as radiation, temperature, and vapor pressure. We investigate the controlling factors of EP from the perspective of catchment water balance. Through analyzing the relationships and constraint conditions of the variables in the Budyko framework and the generalized proportionality hypothesis (GPH), we demonstrate that the mean annual EP depends on precipitation (P) and runoff (Q) and the information of EP is contained in the water balance process. Further, we propose the Budyko-based and GPH-based hydrological approaches for EP estimation and obtain the hydrological EP for the MOPEX catchments. Significant linear relationships exist between the hydrological EP and the commonly used meteorological EP, i.e., the Penman EP (EP-Pen), Priestley-Taylor EP (EP-PT), and Hargreaves-Samani EP (EP-HS). Specifically, four hydrological EP are more consistent with EP-Pen among three meteorological EP, and the Budyko-based hydrological EP are more closely related to meteorological EP than the GPH-based one. This study enriches the EP estimation methods and provides new insight into the catchment water balance from the connection between EP and hydrologic elements. (Supported by Project 41971049 of NSFC).

How to cite: Cheng, C., Liu, W., Li, Z., Mu, Z., and Feng, H.: Potential evapotranspiration depends on precipitation and runoff in a catchment at the mean annual scale, EGU General Assembly 2024, Vienna, Austria, 14–19 Apr 2024, EGU24-6982, https://doi.org/10.5194/egusphere-egu24-6982, 2024.

EGU24-7612 | ECS | Orals | HS2.4.4

Catchment coevolution and the geomorphic origins of variable source area hydrology 

David Litwin, Gregory Tucker, Katherine Barnhart, and Ciaran Harman

Aspects of landscape morphology including slope, curvature, and drainage dissection are important controls on runoff generation in upland landscapes. Over long timescales, runoff plays an essential and modifying role in shaping these same features through surface erosion. These feedbacks suggest that modeling long-term landscape evolution while accounting for hydrology could provide insight into hydrological function. Here we examine the hydrological features that emerge when runoff is equilibrated with topography, focusing particularly on the emergence and persistence of saturated areas. We use a new coupled hydro-geomorphic model that captures saturated and unsaturated zone storage and water balance partitioning between surface flow, subsurface flow, and evapotranspiration, but has numerical efficiency sufficient to drive a landscape evolution model over millions of years. Our results reveal the emergence of perennial and ephemeral stream networks, variable source areas, and even non-dendritic drainage networks under certain circumstances. When capacity for water storage and lateral drainage relative to climate are low, lower relief landscapes emerge with greater variability in the extent of saturated areas, while greater relief and less variability in saturated areas emerge as soil storage and lateral drainage capacity increase. Results from a case study suggest that emergent topography and runoff generation patterns reflect this coevolution in some places.

How to cite: Litwin, D., Tucker, G., Barnhart, K., and Harman, C.: Catchment coevolution and the geomorphic origins of variable source area hydrology, EGU General Assembly 2024, Vienna, Austria, 14–19 Apr 2024, EGU24-7612, https://doi.org/10.5194/egusphere-egu24-7612, 2024.

EGU24-8242 | ECS | Orals | HS2.4.4

Towards a metabolic theory of catchments: scaling of water and carbon fluxes with size 

Francesca Bassani, Simone Fatichi, and Sara Bonetti

Allometric scaling relations are widely used to link biological processes in nature. They are typically expressed as power laws, postulating that the metabolic rate of an organism scales as its mass to the power of an allometric exponent, which ranges between 2/3 and 3/4. Several studies have shown that such scaling laws hold also for natural ecosystems, including individual trees and forests, riverine metabolism, and river network organization. Here, we focus on allometric relations at watershed scale to investigate “catchment metabolism”, defined as the set of ecohydrological and biogeochemical processes through which the catchment maintains its structure and reacts to the environment. By revising existing plant size-density relationships and integrating them across large-scale domains, we show that the ecohydrological fluxes (representative of metabolic rates of a large and diverse vegetation assemblage) occurring at the catchment scale are invariant with respect to its average above-ground biomass, while they scale linearly with the basin size. We verify our theory with hyper-resolution ecohydrological simulations across the European Alps, which represent an ideal case study due to the large elevation gradient affecting the availability of energy and water resources. Deviations from the isometric scaling are observed and ascribable to energy limitations at high elevations. Remote sensing data from semiarid and tropical basins are also used to show that the observed scaling of water and carbon fluxes with size holds across a broad spectrum of climatic conditions.

How to cite: Bassani, F., Fatichi, S., and Bonetti, S.: Towards a metabolic theory of catchments: scaling of water and carbon fluxes with size, EGU General Assembly 2024, Vienna, Austria, 14–19 Apr 2024, EGU24-8242, https://doi.org/10.5194/egusphere-egu24-8242, 2024.

EGU24-10151 | ECS | Posters on site | HS2.4.4

Critical zone modelling for alpine catchments : towards a calibration-light model of snow hydrology 

Alix Reverdy, Aniket Gupta, Matthieu Le Lay, Jean-Martial Cohard, Didier Voisin, Matthieu Lafaysse, and Lucie Rapp-Henry

The current operational hydrological modelling of mountainous catchments mostly relies on conceptual and semi-distributed models, which are calibrated based on historical discharge measurements. As a consequence, in spite of their good performance in seasonal river runoff prediction, they often fail to project the impact of climate change on the hydrological cycle over decades. This is due to a limited representation of physical processes and their inability to simulate water paths and their modification.

To overcome such limitations, we applied the data-intensive and calibration-light critical zone model ParFlow-CLM, to a highly instrumented mid-elevation catchment (0.15 km² area between 1950 and 2150 m.a.s.l) close to the Lautaret Pass, in the French Alps. Our setup showed promising results with good correlation when compared to the observed discharge (KGEnp = 0.91), consistent evapotranspiration compared to local Eddy-Covariance measurements and realistic snow disappearance patterns. This simulation served as the proof of concept towards the feasibility of physical-based critical zone hydrological modeling in alpine terrain. It highlighted the necessity of a careful redistribution of the locally observed meteorological forcing including solid precipitation and incoming radiations. It also pointed out the necessity of well simulating the snow aging and albedo to represent streamflow regimes all along the snow period. It was achieved through manually incorporating the impact of grain growth, refreezing and dust in the albedo parameterization (snow age) within the current CLM version of ParFlow (CLM 3.5).

In this presentation we will introduce our strategy for a calibration-light model of mountain watersheds by developing realistic but data-parsimonious strategies of data collection and processing. Specifically, we aim at taking into account the impact of complex topography on meteorological forcing (shading, radiation incidence angle, wind acceleration, snow redistribution, altitude gradient). In this framework we will compare several land surface snow schemes (CLM3.5, CLM5, Crocus and MORDOR) using ESM-SnowMIP data. This will help to quantify the improvement expected for moving from CLM3.5 to CLM5 and compare it further with a complex snow scheme (Crocus) and an advanced degree-day approach (MORDOR snow module). Implementation of CLM5 in ParFlow will also enable the representation of dynamic vegetation processes. This will be the first step towards a functional critical zone modeling for a mid-elevation alpine catchment, which will allow the reanalysis and projection of hydrological conditions with minimum calibration.

How to cite: Reverdy, A., Gupta, A., Le Lay, M., Cohard, J.-M., Voisin, D., Lafaysse, M., and Rapp-Henry, L.: Critical zone modelling for alpine catchments : towards a calibration-light model of snow hydrology, EGU General Assembly 2024, Vienna, Austria, 14–19 Apr 2024, EGU24-10151, https://doi.org/10.5194/egusphere-egu24-10151, 2024.

EGU24-11068 | ECS | Posters on site | HS2.4.4

Climate Change impacts on hydrological and plant resources in the agro-pastoral Sahel 

Lena Collet, Jérôme Demarty, Jordi Etchanchu, Chloé Ollivier, Ibrahim Maïnassara, Nesrine Farhani, Brune Raynaud-Schell, and Nanée Chahinian

The Sahel is a semi-arid region where the majority of the population depends on subsistence farming. This region is considered as a hotspot for climate change with an expected warming of 3 to 4°C by 2100. Indeed, climate projections show that dry periods are likely to be longer and extreme rainfall will be more frequent. These changes could have a major impact on hydrological and vegetal resources. This study aims to assess these impacts on a typical Sahelian agro-pastoral ecosystem dominated by millet crops and shrubby savannah in South-Western Niger. Climate scenarios are constructed from a local set of observed climate data combined with CMIP6 and other climate scenarios dedicated to Sahelian region. These scenarios are used to constrain SiSPAT SVAT (soil-vegetation-atmosphere transfer) model in order to simulate the surface water and energy fluxes. Results show that both energy and water balances are deeply influenced by temperature and air humidity changes. Temperature increase mainly affects the sensible heat flux (H), e.g., H decreases by 38% for a 3°C of temperature increase. Moreover, results show that the impact of temperature and humidity changes on evapotranspiration, partly compensate each other; higher temperature in the rainy season, leads to higher evapotranspiration values, contrarily to the impact of humidity increase. The surface water balance is mostly influenced by the rainfall regime modification, e.g., intensification of extreme rainfall leads to 59% increase in drainage. It also generates more runoff (+ 500 %), that would increase the risk of flooding but could cause a rise in groundwater levels, which is called the Sahelian paradox. Finally, it also increases the soil water storage, which could lead to a longer vegetation cycle. For this aim, coupling with crop and/or hydrological modelling would be useful to quantify the impacts of climate evolution on vegetal and water resources dynamics. It would allow to find efficiently adapted strategies for crop and water management.

How to cite: Collet, L., Demarty, J., Etchanchu, J., Ollivier, C., Maïnassara, I., Farhani, N., Raynaud-Schell, B., and Chahinian, N.: Climate Change impacts on hydrological and plant resources in the agro-pastoral Sahel, EGU General Assembly 2024, Vienna, Austria, 14–19 Apr 2024, EGU24-11068, https://doi.org/10.5194/egusphere-egu24-11068, 2024.

EGU24-11078 | ECS | Posters on site | HS2.4.4

Future water resource changes in the Yangtze River Basin under the influences of climate change and human activities 

Han Cheng, Taihua Wang, and Dawen Yang

The Yangtze River Basin is the largest basin in China, covering an area of 1.8 million square kilometers and possessing very abundant water resources. The water resources in this basin play a crucial role in the ecological environment and socio-economic development. Understanding the future hydrological changes in the Yangtze River Basin is crucial for China's water resource allocation and planning. However, many studies have indicated that, under the influence of complex climate change and intense human activities, the hydrological cycle in the Yangtze River Basin has become more complex. This research utilized a distributed hydrological model to investigate the hydrological changes in the Yangtze River Basin during the historical period (1961-2019) and the future period (2021-2100). Historical observed data and CMIP6 data are used to drive the model. Meanwhile, machine learning methods are applied to process the output results of the hydrological model, simulating the impact of human activities within the corresponding regions. The results indicate that, during the historical period, machine learning methods could enhance the simulation accuracy of areas which are significantly influenced by human activities. The historical data show that, despite an upward trend in precipitation in the historical period, the runoff at the main hydrological stations of the Yangtze River mainstream continues to decline due to increasing evapotranspiration. Under future conditions, the total runoff in the Yangtze River Basin will further decrease compared with historical runoff, intensifying water resource risks within the basin and posing new challenges for water resource management.

How to cite: Cheng, H., Wang, T., and Yang, D.: Future water resource changes in the Yangtze River Basin under the influences of climate change and human activities, EGU General Assembly 2024, Vienna, Austria, 14–19 Apr 2024, EGU24-11078, https://doi.org/10.5194/egusphere-egu24-11078, 2024.

The hydroelectrical potential is derived from the hydraulic head and the available water discharge. In certain hydroclimatic regions, the water discharge is only a small part of the regional precipitation and the water cycle. This is particularly true when evaporation accounts for a large proportion of the regional water balance. Such conditions prevail, for example, in the catchment area of Lake Malawi and the Shire River in Malawi in south-east Africa. The country produces over 95% of its electricity from hydropower plants in the Shire River. This river is the outlet of Lake Malawi. Our study examines the sensitivity of regional water resources and hydropower generation to climate change, covering various aspects:

  • Processing of rainfall, runoff and evaporation data for this tropical region, with particular attention to data scarcity.
  • Hydrological simulation of the water balance and water level of Lake Malawi as well as runoff.
  • Calculation of possible hydropower generation in the Shire River.
  • Performing scenario calculations for climate change conditions and associated sensitivity analyses.

The most important results of these analyses are

  • Between 1970 and 2013, meteorological droughts have increased in intensity and duration. This can be attributed to a decrease in precipitation and an increase in temperatures and evaporation rates.
  • The hydrological system of Lake Malawi reacts to meteorological droughts with a time lag (up to 24 months), so that hydrological droughts can be predicted up to 10 months in advance by meteorological drought parameters.
  • Despite the uncertainties in the regional climate projections, it is clear that the water level of Lake Malawi, as a residual of the catchment water balance, is very sensitive to changes in precipitation and evaporation.
  • The discharge from the lake is a direct function of the lake's water level, and the combination of the projected decrease in precipitation and increase in temperature leads to a significantly lower flow in the Shire River.
  • This suggests a future decline in annual hydropower production of between 1 % and 2.5 % (2021-2050) and 5 % and 24 % (2071-2100)
  • Some projections even result that the outflow of Lake Malawi would temporarily dry up and the country's electricity supply would be interrupted.
  • It is shown that regional evaporation and its changes are the key variable for assessing future water availability. This process is characterized by a particularly high degree of uncertainty.

The example of Lake Malawi basin shows that a careful hydro-climatic analysis is required to assess such sensitive hydro-systems. Global-scale analyses do not have sufficient predictive power and explanatory potential.

How to cite: Bronstert, A., Mtilatila, L., and Vormoor, K.: Hydro-electrical potential at risk und climate change: the case of Lake Malawi basin and the Shire River in Malawi / Southeast Africa, EGU General Assembly 2024, Vienna, Austria, 14–19 Apr 2024, EGU24-11698, https://doi.org/10.5194/egusphere-egu24-11698, 2024.

The quest for generalizable insights in hydrology begins with quantifying hydrological behavior in ways that are widely applicable (and thus potentially generalizable) and that also reflect key characteristics of hydrological processes.  Rainfall-runoff data sets are widely available, but runoff responses to individual precipitation events are rarely generalizable, because each mm of rain may affect streamflow differently, depending on how it fits into the sequence of past and future precipitation.  A longstanding approach to this problem is the unit hydrograph and its many variants, but these typically assume linearity (runoff response is proportional to precipitation) and stationarity (runoff response to a given unit of rainfall is identical, regardless of when it falls).  By contrast, landscape responses to precipitation are typically nonlinear and nonstationary, and quantifying this nonlinearity and nonstationarity is essential to unraveling the mechanisms and subsurface properties controlling hydrological behavior.


Here I show how the nonlinearity and nonstationarity of rainfall-runoff behavior can be quantified, directly from data, using Ensemble Rainfall-Runoff Analysis (ERRA), a data-driven, model-independent method for quantifying rainfall-runoff relationships across a spectrum of time lags.  ERRA combines least-squares deconvolution (to un-scramble each input's temporally overlapping effects) with demixing techniques (to separate the effects of individual inputs, or inputs occurring under different antecedent conditions) and broken-stick regression (to quantify nonlinear dependencies).


Applications of ERRA to experimental catchments and large multi-catchment data sets reveal that some catchments exhibit substantially greater nonstationarity and nonlinearity than others do.  ERRA also reveals that some catchments exhibit strong spatial heterogeneity in their response to precipitation, resulting from spatial heterogeneity in land use and subsurface characteristics. Results from this approach may be informative for catchment characterization and runoff forecasting; they may also lead to a better understanding of short-term storage dynamics and landscape-scale connectivity. 


How to cite: Kirchner, J.: Generalizable insights for nonlinear, nonstationary hydrological behavior using Ensemble Rainfall-Runoff Analysis (ERRA), EGU General Assembly 2024, Vienna, Austria, 14–19 Apr 2024, EGU24-12219, https://doi.org/10.5194/egusphere-egu24-12219, 2024.

EGU24-13400 | Orals | HS2.4.4

Interpolation vs. Extrapolation in Flood Forecasting: Exploring the Predictive Capability of Conceptual and Machine Learning Tools in Non-Stationary Scenarios 

Ricardo Mantilla, Janet Barco, Faruk Gurbuz, Shaoping Xiao, David Muñoz, Kavindra Lewkebandara, and Vimal Sharma

Recently published literature has confirmed time and time again that machine learning (ML) algorithms (including LSTMs, GRUs, and Transformers) and conceptual lumped hydrological models (such as SAC-SMA and HBV) perform more reliably in hindcast and forecast flood prediction intercomparison experiments than more sophisticated high-resolution hydrological models. These provocative results have challenged decades of development of physics-based hydrological models for streamflow prediction, which seem more sensitive to the errors in forcing precipitation data, and the spatial description of landscape attributes. Thus, the long-standing promise that a better and more detailed understanding and description of hydrological processes would yield better predictions of streamflow fluctuations (including floods, droughts, etc.) is yet to be fulfilled. In a recently published study by our research group, we proposed and tested a methodology to benchmark ML algorithms using artificially generated data using physically-based hydrological models under very controlled conditions. Our approach combined the implementation of the hillslope-link distributed hydrological model (HLM) on a 4,500 km2 basin driven by precipitation fields created using the stochastic storm transposition (SST) framework. We demonstrated that ML algorithms could effectively identify the input-output relations between the average rainfall over a basin and streamflows (as time series) at multiple sub-basin outlets under very general conditions of space-time variability of flood-generating storm systems. This result matches the reported performance by ML algorithms under a great variety of conditions.

We are extending our work to ask a new question: How reliable are trained ML algorithms and calibrated lumped hydrological models at predicting floods that have never been observed in the “historical” record? This question goes to the heart of what these black/grey-box and conceptual types of tools represent mathematically: a deterministic estimate for the input-output relationship between rainfall and streamflow. Therefore, when any of these black-box models predicts a flood there are two possible scenarios, 1) interpolation, which means that the hydrograph and peak flow being predicted are within the range of floods observed in the past, and 2) extrapolation, the case when the event being predicted is significantly larger than anything observed in the past.  In this study, we will present the results of controlled experiments to investigate this question and show which class of algorithms are less susceptible to over or under-estimation when extrapolating beyond the range of the “historical record”. We will present results for hourly and daily prediction timescales. This investigation is very relevant in the current environment of climate change where the water-holding capacity of the atmosphere increases with every degree of warming leading to storms that seem to constantly break every record in terms of intensity, duration, and spatial coverage.

How to cite: Mantilla, R., Barco, J., Gurbuz, F., Xiao, S., Muñoz, D., Lewkebandara, K., and Sharma, V.: Interpolation vs. Extrapolation in Flood Forecasting: Exploring the Predictive Capability of Conceptual and Machine Learning Tools in Non-Stationary Scenarios, EGU General Assembly 2024, Vienna, Austria, 14–19 Apr 2024, EGU24-13400, https://doi.org/10.5194/egusphere-egu24-13400, 2024.

EGU24-13742 | Posters on site | HS2.4.4

Resilient Waters: Exploring Hydrological Response in Evolving Mountain Systems of the Southern Andes 

Marcelo Somos-Valenzuela, Bastian Morales, Elizabet Lizama, Mario Lillo, Alfonso Fernandez, and Diego Rivera

Mountain systems have experienced significant changes due to variations in precipitation and temperature. These changes have affected natural water reservoirs, such as glaciers and snow. There is a high probability that glaciers will disappear entirely in some mountain ranges during this century, with current impacts evident on the flows and ecosystems dependent on them. The reduction in snow cover has also been observed globally, especially in lower altitude areas, due to the increase in liquid rain. The increase in temperature has accelerated the melting of snow before the season of most significant water demand. This transformation in mountain basin hydrology raises global concerns about the sustainability of water resources.

Despite the evident loss of storage in glaciers and snow, numerous studies have highlighted the importance of mountain aquifers, quaternary deposits, wetlands, and fractured basements in groundwater storage. However, these elements are often ignored in studies that project changes in flow in mountainous areas.

Mountain catchments will play a crucial role in the response of Earth systems to climate change. Given the loss of glaciers and decreases in solid precipitation, these systems will activate alternative mechanisms to provide water in times of less rainfall, acting as hydrological refuges. Identifying these refuges is crucial for the conservation and management of watersheds.

Although there are studies on climate change refugia for species habitat, there is no defined conceptual framework for hydrological refugia in the Southern Andes of Chile. This work seeks to review elements within the basins that could mitigate or delay the effects of climate change on flows, proposing indexes to identify potential refuges and validate their usefulness in multiple basins throughout the Southern Andes of Chile.

How to cite: Somos-Valenzuela, M., Morales, B., Lizama, E., Lillo, M., Fernandez, A., and Rivera, D.: Resilient Waters: Exploring Hydrological Response in Evolving Mountain Systems of the Southern Andes, EGU General Assembly 2024, Vienna, Austria, 14–19 Apr 2024, EGU24-13742, https://doi.org/10.5194/egusphere-egu24-13742, 2024.

EGU24-14704 | ECS | Orals | HS2.4.4

Drought influences on hydrological regimes 

Alessia Matano, Marlies Barendrecht, Manuela Brunner, Raed Hamed, and Anne F. Van Loon

Persistent drought conditions may alter catchment response to precipitation, both during and after the drought period. Drought impacts on vegetation and hydrological dynamics may persist beyond the drought event, challenging accurate streamflow forecasting especially under flooding conditions. Yet, the influence of drought characteristics on the catchment response to precipitation remains unclear. In this study, we use a comprehensive dataset consisting of observations and remote sensing data of streamflow, precipitation, soil moisture, and total water storage for 3957 catchments worldwide. By employing multivariate statistical analysis, we identify significant abrupt shifts in the precipitation-streamflow relationship and examine the role of drought in driving these shifts. Our analysis shows that drought events may generally lead to significantly lower streamflow than expected from the historical norm during and after drought conditions. While warm-temperate and equatorial regions generally experience a slight decrease in streamflow during drought compared to expected values, arid regions predominantly exhibit an unexpected increase during soil moisture drought. In snow-influenced regions both increases and decreases of streamflow compared to expected were found. Notably, soil moisture drought events emerge as main drivers of hydrological regime shifts, particularly in snow-influenced and arid regions.  This study sheds light on the importance of considering regional characteristics in predicting dynamic catchment response to precipitation under and after persistent drought conditions.

How to cite: Matano, A., Barendrecht, M., Brunner, M., Hamed, R., and Van Loon, A. F.: Drought influences on hydrological regimes, EGU General Assembly 2024, Vienna, Austria, 14–19 Apr 2024, EGU24-14704, https://doi.org/10.5194/egusphere-egu24-14704, 2024.

EGU24-14902 | ECS | Posters on site | HS2.4.4

Changes in Hydrological Extremes for Sub-Arctic catchment in Finland 

Christine Kaggwa Nakigudde, Ritesh Patro, and Ali Torabi Haghighi

Climate change has been associated with increased frequency in the occurrence of extreme precipitation. These extreme events are in turn linked to peak discharges and flood events. In the Nordic region, peak discharges in unregulated rivers occur during spring snowmelt thereby posing a challenge in attributing extreme precipitation events to peak discharges. This study aims to assess the effect of extreme events on hydrological river flows by analysing the timing and intensity of extreme precipitation events (highest 1-day precipitation RX1day, highest 5-day precipitation RX5day and maximum consecutive wet days (CWD)) with river discharges using a sub-Arctic catchment. Using a calibrated Hydrologiska Byråns Vattenbalansavdelning (HBV) model, we analyse changes in discharge occurring as a result of these extremes. By analysing the relationship between extreme precipitation, and the resulting river discharges, findings from the study provide a valuable insights and basis to predict the effect of extreme precipitation events on river flows.

How to cite: Nakigudde, C. K., Patro, R., and Haghighi, A. T.: Changes in Hydrological Extremes for Sub-Arctic catchment in Finland, EGU General Assembly 2024, Vienna, Austria, 14–19 Apr 2024, EGU24-14902, https://doi.org/10.5194/egusphere-egu24-14902, 2024.

Assessing the hydrological impacts of climate change is rather challenging, particularly due to the discrepancies between climate and hydrological models used for such assessments. The reliability and robustness of climate models, downscaling techniques, and bias-adjustment procedures are typically judged based on their ability to reproduce distributions of climate variables. On the other hand, hydrological models are developed to reproduce complete series of hydrological variables, primarily flows. Although climate change impact studies focus exclusively on pertinent hydrological signatures, such as mean flows or annual maxima/minima of varying durations, these aspects of hydrological models’ performance are generally limited to investigative research studies. Since hydrological models are neither developed nor evaluated according to their performance in reproducing hydrological signatures and their distributions, they often yield poor performance in this regard, especially when it comes to signatures related to extreme flows. One approach to improving model performance is the application of multi-model combination methods (MMCMs).

This study is aimed at evaluating the effects of the application of MMCMs in improving performance in reproducing numerous signatures relevant for climate change impact assessments in high-latitude catchments. To this end, ten MMCMs are applied with an ensemble of 29 spatially-lumped, bucket-style models in 50 Swedish catchments that span a wide range of hydroclimatic regimes. All selected MMCMs are point-estimate methods (i.e., they result in a single flow estimate, referred to as a model combination), and they are mainly based on the information criteria. The selected methods also include the equal weights method, Bates-Granger- and Granger-Ramanathan methods, the Mallows method, and its simplex version. The MMCMs outputs are used to compute numerous commonly used performance indicators and distributions of the selected signatures (following Todorović et al. (2022)), which are compared to the results of a reference model. The reference model is selected as the on-average best-performing individual model across the 50 selected catchments. Additional computations are performed to infer whether (1) the selection of the candidate models, or (2) targeting specific signatures, such as annual maxima or minima, can improve the performance of the model combinations.

The results suggest that the application of MMCMs can improve efficiency in terms of traditionally used performance indicators; however, no improvement is obtained when it comes to the distributions of the signatures. Neither omitting the poor-performing candidate models from the ensemble, nor applying the MMCMs with the series of targeted signatures, can improve this aspect of performance. These results clearly reveal the need for further improvement of hydrological models so that they can properly reproduce distributions of hydrologic signatures, which is crucial for climate change impact studies.


References

Todorović, A., Grabs, T., and Teutschbein, C.: Advancing traditional strategies for testing hydrological model fitness in a changing climate, Hydrological Sciences Journal, 1–22, https://doi.org/10.1080/02626667.2022.2104646, 2022.

How to cite: Todorović, A., Grabs, T., and Teutschbein, C.: Performance of Multi-Model Combinations in Reproducing Hydrological Signatures Relevant for Climate Change Impact Studies in High Latitudes, EGU General Assembly 2024, Vienna, Austria, 14–19 Apr 2024, EGU24-15671, https://doi.org/10.5194/egusphere-egu24-15671, 2024.

EGU24-16914 | Posters on site | HS2.4.4

Building an operational drought framework  

Arianna Di Paola, Edmondo Di Giuseppe, Ramona Magno, Sara Quaresima, Leandro Rocchi, Elena Rapisardi, Valentina Pavan, and Massimiliano Pasqui

As the frequency of drought events continues to rise, there is an urgent demand for swift adaptive capabilities, coupled with a growing scientific knowledge base to effectively develop and implement them. To address this need, effective Climate Services are crucial for decision-makers to navigate and respond to the challenges posed by drought. In this context, drawing upon the experience gained from the CNR-IBE climate service 'Drought Observatory' and insights gained from direct engagement with decision-makers, we introduce a novel operational drought framework (ODF) providing a synoptic overview of drought at the basin scale. The aim of the ODF is twofold: on one site to increase the understanding of the underlying dynamics of severe droughts, including triggers, and drought onset and propagation to other components of the water cycle; on the flip side to support decision-makers' adaptive capacities by offering concise yet comprehensive and timely insights, ultimately improving their ability to make informed choices in the face of increasing drought occurrences.  

The ODF is based on three pillars: i) a critical lecture of a set of Standardized Precipitation Index (or whatever SPI-like index) estimated across a continuous range of month-scales; this step allows for a better understanding of drought development and dynamics; ii) the computation of the Standardized Integrated Drought Index (𝕯), as a standardized multi-scale ensemble mean of the SPI set, for the identification and effective communication of severe phases of droughts; iii) the contextualization of severe droughts into the surrounding water supplies, here accounted by means of the cumulative deviation of SPI1 from the normal (CDN), where the CDN serves to gain insights into whether the system has received an adequate supply of water resources to cope with upcoming drought events;  

We present a conceptual demonstration of the ODF for monitoring various types of droughts, showcasing its efficacy and versatility over the Po River basin, the hydrographic basin of the longest Italian river. To this end, we introduce the ODF from the Standardized Precipitation Index (SPI), aggregated at the river basin scale, and the Standardized Streamflow Index (SQI), both estimated across continuous 1–36 month-scales (i.e., SPI1-36, SQI1-36) for the 1964-2023 period.   

The resulting ODFs highlight multi-years precipitation patterns that drive the system under alternating periods of relatively wetness and dryness; during prolonged dry periods, single or cumulative occurrence of meteorological drought (drought triggers) could propagate into hydrological severe droughts. Vice versa, the hydrological response is largely absent under wet conditions, indicating a lack of propagation. Based on these outcomes, the ODF could serve as an effective tool to improve the understanding of hydrological responses to meteorological droughts and to develop risk-reducing policies and preparedness planning to face the future severe droughts. 


How to cite: Di Paola, A., Di Giuseppe, E., Magno, R., Quaresima, S., Rocchi, L., Rapisardi, E., Pavan, V., and Pasqui, M.: Building an operational drought framework , EGU General Assembly 2024, Vienna, Austria, 14–19 Apr 2024, EGU24-16914, https://doi.org/10.5194/egusphere-egu24-16914, 2024.

EGU24-19512 | ECS | Posters on site | HS2.4.4

The implementation of the GEOframe system in the Po River District – analysis of water availability and scarcity in the Piemonte region 

Gaia Roati, Giuseppe Formetta, Marco Brian, Paolo Leoni, John Mohd Wani, Silvano Pecora, Matteo Dall'Amico, Stefano Tasin, and Riccardo Rigon

In the last years, Italy observed more frequent and intense drought events, with a particularly severe drought in 2022, leading to significant environmental, social and economic damages.

Also at a global scale extreme events, floods and droughts, have been reported to be more likely due to climate change and environmental modification.

For this reason, already in 2021, the Po River District Authority (AdbPo) started the implementation of the GEOframe modelling system on the whole territory of the district to update the existing numerical modelling for water resource management, and then to improve the planning activity of the Authority itself, producing a better quantification and forecast of the spatial and temporal water availability.

The GEOframe system was developed by a scientific international community, led by the University of Trento, and is a semi-distributed conceptual model, with high modularity and flexibility, completely open-source.

After a starting phase of data collection, validation, spatial interpolation (for the reference period 1991-2020), and geomorphological analysis, all the components of the hydrological balance (evapotranspiration, snow accumulation, water storage and discharge) have been simulated.

Consequently, the “zonal calibration” phase was carried out on a 4 years period basis with the KGE method, consisting of the research of the values of the characteristic model parameters which fit the discharge evolution recorded in the hydrometers of the region in the best possible way, comparing the modelled discharge trend with the measured one.

With the completion of the calibration process in the Piemonte region, one of the biggest regions of Italy, which contains more than 100 hydrometers, an analysis of the water balance components was undertaken, focusing especially on hydrological and agricultural drought events.

In particular, water availability has been modelled in the whole regional territory, evaluating its impact on agriculture, namely studying how and when a hydrological drought affects agricultural drought according to the data collected in the last 30 years.

Attention has been taken also to the snow precipitation contribution, which has a major impact in alpine regions, dominating local and regional hydrology, strongly influencing vegetation growth and the utilization of water resources (Wu et al., 2015), like the one of the Po River basin, characterized by the presence of the Alps along all of its route.

In conclusion, it was possible to carry on a historical analysis of water availability in Piemonte, assessing the capacity of GEOframe to simulate all the components of the water cycle (evapotranspiration, water storage,  snow accumulation and water discharge). Furthermore, implementing GEOframe in a mountainous area underlines the importance and the influence that snow and glaciers, especially in a higher temperature scenario due to climate change, can have on water availability and, therefore, a better modelling component of these elements will be implemented in the future developments of GEOframe.


How to cite: Roati, G., Formetta, G., Brian, M., Leoni, P., Wani, J. M., Pecora, S., Dall'Amico, M., Tasin, S., and Rigon, R.: The implementation of the GEOframe system in the Po River District – analysis of water availability and scarcity in the Piemonte region, EGU General Assembly 2024, Vienna, Austria, 14–19 Apr 2024, EGU24-19512, https://doi.org/10.5194/egusphere-egu24-19512, 2024.

EGU24-19889 | ECS | Orals | HS2.4.4

An integrated modelling framework for exploring the root causes of flood and drought risk amplification by climate change 

Virginia Rosa Coletta, Irene Pluchinotta, Alessandro Pagano, Raffaele Giordano, Umberto Fratino, and Alberto Montanari

Recent disasters have highlighted a concerning possibility: the escalation of climate extremes leading to megafloods and megadroughts, commonly known as "black swans". This phenomenon, called "flood and drought risk amplification", is giving rise to impactful disasters at an increasing frequency, which is beyond our current understanding and modelling capabilities. The lack of comprehension poses a scientific challenge in pinpointing the drivers behind these amplifications.

This scenario prompts a crucial research question about the unexpected increase in flood and drought risks due to climate variability — why, where, and when it may occur. In response, this work aims to create a new modelling framework capable of unravelling the complex interplay of processes and factors contributing to flood and drought risk amplification.

Grounded in the hypothesis that local conditions play a pivotal role in risk amplification, this study focuses on identifying specific elements, known as "leverage points", where a small change or action can significantly impact the investigated system. These leverage points can be quantitatively analysed and classified based e.g. on the level of complexity of the implementation of such changes and their potential for sustainability transformation. To achieve this, this work adopts an integrated modelling approach, combining System Dynamics (SD) modelling with elements from Graph Theory and stochastic methods. SD modelling, increasingly applied in water resources planning and management, supports the mapping of the system’s feedback structure and has the potential to describe and analyse its complexity. As SD models can be represented as a directed graph of variables and their connections, Centrality Measures (e.g., degree centrality, eingenvector centrality, etc.) based on Graph Theory can help quickly and objectively pinpoint important mechanisms regardless of the size or complexity of the map. In addition, to handle uncertainty arising from the incomplete understanding of processes that contribute to risk amplification (especially the counterintuitive ones), the recent concept of Process Based Stochastic modelling will be introduced. This novel approach to uncertainty assessment involves converting the deterministic SD model into a stochastic formulation.

The proposed modelling framework will be applied to different case studies in Europe and other continents, relevant for unexplained flood and drought risk amplification, at regional and local scales. To compensate for the absence of quantitative data on some technical and non-technical factors, local stakeholders will be actively involved throughout various stages of the modelling process. Their engagement not only supplements the data gap but also aids modellers in identifying critical system components, feedback loops, and vulnerabilities.

How to cite: Coletta, V. R., Pluchinotta, I., Pagano, A., Giordano, R., Fratino, U., and Montanari, A.: An integrated modelling framework for exploring the root causes of flood and drought risk amplification by climate change, EGU General Assembly 2024, Vienna, Austria, 14–19 Apr 2024, EGU24-19889, https://doi.org/10.5194/egusphere-egu24-19889, 2024.

EGU24-22387 | Orals | HS2.4.4

When rivers change their tune: unraveling streamflow regime shift after multi-year droughts in south-eastern Australia 

Ulrike Bende-Michl, Katayoon Bahramian, Steven Thomas, Irina Rudeva, Wendy Sharples, and Elisabetta Carrara

Prolonged droughts have led to impacts on streamflow by strongly reducing flows, and in some cases gives rise to permanent shifts in streamflow regimes, despite rainfall recovery. Understanding changes from perennial to non-perennial regimes is crucial for water management, such as the allocation of available water for crop irrigation to environmental flows. Furthermore, given the prospect of a drier and warmer future, to combat increasing water scarcity and environmental degradation, understanding regime changes will help decision makers develop water-related mitigation and adaptation strategies.

In this study we investigate streamflow regime change from perennial to non-perennial flow, combining well established metrics using both climatic and hydrologic indices.  A case study of the Victorian region in south-eastern Australia will be presented applying our analysis to pre-, during and post Millennium drought conditions. We analysed streamflow from 116 Hydrological Reference Sites in Victoria and period from 1970-2019 with respect to changes in the magnitude, duration, frequency, and timing of flow conditions.  In this region, we identified rivers which remained in the non-perennial regime despite rainfall totals returning to pre drought levels. Additionally, we explored attributing for the permanent streamflow regime shift and implications for water management including interacting changes to observed rainfall intensities, vegetation responses and modelled surface and sub-surface components.

How to cite: Bende-Michl, U., Bahramian, K., Thomas, S., Rudeva, I., Sharples, W., and Carrara, E.: When rivers change their tune: unraveling streamflow regime shift after multi-year droughts in south-eastern Australia, EGU General Assembly 2024, Vienna, Austria, 14–19 Apr 2024, EGU24-22387, https://doi.org/10.5194/egusphere-egu24-22387, 2024.

HS2.5 – Global and (sub)continental hydrology

EGU24-623 | ECS | Posters on site | HS2.5.1

Sensitivity of Evapotranspiration, Total Water Storage Change and Discharge to different Potential Evapotranspiration Methods 

Vishal Thakur, Oldrich Rakovec, Rohini Kumar, and Yannis Markonis
Hydrological models are effective tools for understanding and quantifying changes in water
availability over time. These models excel in quantifying various hydrological components such
as runoff (Q), total water storage (TWS), evapotranspiration (ET) . Precipitation (P) and Po-
tential Evapotranspiration (PET) are the most important required inputs for modeling these
components. In modeling, sensitivity of P is well-acknowledged. However, a notable gap exists
in assessing the sensitivity of PET methods in hydrological models. This study systematically
examines the sensitivity in terms of slopes, of 12 distinct PET methods spanning different
classes (temperature-based, radiation-based and their combinations) on ET, total water stor-
age change (TWSC) and Q. More than 100 European catchments were studied using mesoscale
Hydrological Model (mHM). Our results show that PET methods differ significantly at annual
and seasonal scales. For instance, overall annual PET ranges from approximately 250-2200
mm/year across European catchments. PET increases from energy-limited to water-limited
catchments. Temperature-based PET methods is higher in magnitude than radiation and com-
binational type at summer, spring-season, and annual scale. No clear pattern was observed for
the winter and autumn season. We also examined ET, Q, and TWSC slopes and compared
them with PET’s slopes. Our study illuminates the pivotal role of PET methods in hydrological
modeling, emphasizing the need for researchers to select PET methods judiciously according
to the specific objectives of their studies.

How to cite: Thakur, V., Rakovec, O., Kumar, R., and Markonis, Y.: Sensitivity of Evapotranspiration, Total Water Storage Change and Discharge to different Potential Evapotranspiration Methods, EGU General Assembly 2024, Vienna, Austria, 14–19 Apr 2024, EGU24-623, https://doi.org/10.5194/egusphere-egu24-623, 2024.

EGU24-1501 | ECS | Orals | HS2.5.1

An elucidation on the distribution of arsenic safe aquifers: Introspection from the Gangetic basin 

Tridip Bhowmik, Oindrila Bose, Kanhaiya Kumar, Ankit Dipta Dutta, Maya Jha, Nupur Bose, Ashok Ghosh, Chander Kumar Singh, Probal Sengupta, and Abhijit Mukherjee

The obscurity in the distribution of arsenic safe aquifers poses critical challenges in devising mitigation strategies. This study attempts to bridge this knowledge gap by providing insights on the distribution of redox distinct sediments, hydrogeochemical characteristics and the plausible controls that govern As distribution in the safe and unsafe aquifers. In this study, a total of 75 drillings have been conducted in 3 study sites (2 in West Bengal and 1 in Bihar, India) across ~25 km2 of area in each of the sites. The results revealed that in the case of North 24 Parganas (NP) in West Bengal, a continuous layer of brown-colored sand was observed at a depth between 40 and 60 m overlain by a grey-colored sand layer, whereas in the case of Nadia (ND) in West Bengal and Bhagalpur (BHG) in Bihar, the grey-colored sand layer was prominent. The brown-colored/brownish-grey-colored sand layer was fragmentary in both ND and BHG, with small lenses found in some parts of the study area. In the case of NP, the brown sand layer was protected by an aquitard layer. Groundwater chemical analysis revealed that the majority of the grey sand aquifers in both NP and ND yielded water with a high As concentration, while >80% of the wells installed in the brown sand layers exhibited a low As concentration (<10 µg/L). However, in the case of BHG, only 56% of the wells installed in brown or brownish-grey sand were As safe. Besides, 32% of the water samples from grey sand aquifers exhibited As safe concentrations in BHG, among which most of them had high Cl/Br, SO4, and NO3 concentrations. This states that the ingression of surficial contaminants may have suppressed the release of As concentrations due to the availability of other potential terminal electron acceptors at the BHG study site. Overall, the continuous brown sand layer observed in NP study site can be utilized as a suitable drinking water source however the intermittent layers as observed in ND and BHG study site may not serve as a potent source in terms of safe drinking water supply.

How to cite: Bhowmik, T., Bose, O., Kumar, K., Dutta, A. D., Jha, M., Bose, N., Ghosh, A., Singh, C. K., Sengupta, P., and Mukherjee, A.: An elucidation on the distribution of arsenic safe aquifers: Introspection from the Gangetic basin, EGU General Assembly 2024, Vienna, Austria, 14–19 Apr 2024, EGU24-1501, https://doi.org/10.5194/egusphere-egu24-1501, 2024.

We revisit the classic problem of determining economically optimal groundwater withdrawal rates for irrigation. The novelty compared to previous mathematical analyses is the inclusion of non-linear groundwater-surface water interaction that allows for incorporating the impact of capture, i.e. the fact that all or part of the pumped groundwater comes out of reduced surface water flow or increased recharge. We additionally included the option to internalize environmental externalities (e.g. streamflow depletion) and maximize social welfare rather than farmer’s profit. This analysis results in a fixed optimal groundwater withdrawal rate qopt when withdrawal q remains smaller than some critical withdrawal rate (maximum capture) qcrit and provides depletion trajectories, either under competition or optimal control, if q is larger than qcrit. Based on the relative value of q, qcrit and qopt it also yields four quadrants of distinct withdrawal strategies. Using global hydrogeological and hydroeconomic datasets we map the global occurrence of these four quadrants and provide global estimates of optimal groundwater withdrawal rates and depletion trajectories. For the quadrants with groundwater depletion (q >qcrit) we derive and compare depletion trajectories under competition, optimal control and optimal control including environmental externalities, and assessed globally where the differences between these depletion modes are small, which is known as the Gisser-Sánchez effect. We find that the Gisser-Sánchez effect is globally ubiquitous, but only if environmental externalities are ignored. The inclusion of environmental externalities in optimal control withdrawal result in notably reduced groundwater decline and larger values of social welfare in many of the major depletion areas.

How to cite: Bierkens, M., van Beek, R., and Wanders, N.: Gisser-Sánchez revisited: optimal groundwater withdrawal under irrigation including groundwater-surface water interaction and externalities., EGU General Assembly 2024, Vienna, Austria, 14–19 Apr 2024, EGU24-1679, https://doi.org/10.5194/egusphere-egu24-1679, 2024.

Groundwater, a critical component of the Earth's hydrological cycle, plays a pivotal role in sustaining ecosystems, supporting agriculture, and ensuring water security worldwide. Understanding the dynamics of groundwater is crucial for effective water resource management, especially in addressing the interconnected challenges of water scarcity and climate change impacts.

Groundwater monitoring data, including levels, are frequently dispersed among institutions, even within a single country, presenting challenges in accessibility and availability. The process of harmonizing this data is intricate and often demands a substantial investment of time. Moreover, the data quality is dependent on the particular source and may exhibit considerable variability.

The Global Groundwater Monitoring Network (GGMN) Programme, managed by the International Groundwater Resources Assessment Centre (IGRAC), is dedicated to collecting and disseminating updated groundwater level data from national authorities. The mission of GGMN is to facilitate the accessibility of groundwater monitoring data and information, supporting IGRAC’s efforts to provide valuable insights into the global groundwater status and trends.

In 2023, data from GGMN played a pivotal role in assessing the status and trends of groundwater in ten countries, contributing for the first time to a preliminary assessment of groundwater for the World Meteorological Organization's (WMO) "State of Global Water Resources 2022" report. In 2024, these efforts continue with an enhanced methodology to understand trends, encompassing a broader range of countries for a more comprehensive assessment.

The collective effort of collecting data for GGMN and utilizing it for the WMO report aims to produce a robust global groundwater assessment based on in-situ data. This assessment will serve as a valuable benchmark for comparison against global models and other products, such as those derived from satellite data like GRACE. The in-situ data also holds immense utility for the scientific community, providing a means to validate and strengthen existing models, ultimately contributing to a more accurate understanding of global groundwater dynamics.

How to cite: Ruz Vargas, C., Sterckx, A., and Gerges, E.: The role of the Global Groundwater Monitoring Network (GGMN) in advancing a global groundwater assessment based on in-situ data, EGU General Assembly 2024, Vienna, Austria, 14–19 Apr 2024, EGU24-2016, https://doi.org/10.5194/egusphere-egu24-2016, 2024.

Land surface models are useful tools in investigating water and energy cycle. Soil hydraulic properties (SHP) play a major role in the hydrological and ecological processes crossing scales. However, many land models determine SHP only based on land use and soil types, neglecting the heterogeneity of SHP. We hypnotize that using distributed SHP, both horizontally and vertically, could further improve the physics and performance of land surface models.

This study evaluates the performance of Noah-MP land model using distributed SHP. We first perform variance-based Sobol sensitivity analysis to detect the global sensitivity of nine of the Noah-MP parameters to output water and energy variables. Based on the sensitivity analysis, we carry out regional simulation to evaluate the effects of spatial SHP on Noah-MP simulated water and energy cycle, we mainly focus on pore size distribution index, saturated water content, saturate hydraulic conductivity, which can be obtained from various soil datasets. The simulation is configured for the mainland of China and run at 3-hourly 0.1°×0.1°resolution between 1981 and 2018. Results show that, when compared to the lookup table soil parameterization schemes, using distributed SHP not only improves the accuracy of simulated runoff and evapotranspiration, but also enhances Noah-MP in characterizing the reliability of soil moisture spatial pattern in six major river basins of China. In addition, the vertical heterogeneity to the SHP further increases NSE of runoff and lowers RMSE of soil moisture.

This study suggests that Noah-MP performance can be improved by using value of distributed and vertical heterogeneity of soil properties as input of soil hydraulic parameters.

How to cite: qian, R.: The impacts of Soil Properties on the water and energy cycles modeling of Noah-mp in China, EGU General Assembly 2024, Vienna, Austria, 14–19 Apr 2024, EGU24-2864, https://doi.org/10.5194/egusphere-egu24-2864, 2024.

EGU24-3176 | ECS | Posters on site | HS2.5.1

Runoff change point detection and its association with monsoons in the Lancang-Mekong River Basin 

Hong Wang, Junguo Liu, Aifang Chen, and He Chen

Climate change has substantially altered the variability of runoff in the Lancang-Mekong River Basin (LMRB) over the last few decades. Previous studies have analysed the trend of runoff in the LMRB in detail. However, little is known about the spatial distribution of runoff change points and its association with the attribution analysis, in which change point plays a key role when assessing the impacts of climate change and human interventions on runoff. In this study, the spatial distribution of change points for runoff and precipitation as well as their relation to monsoon indices in the LMRB are investigated. We found that the change points for both runoff and precipitation show a trend of occurring earlier from upstream to downstream in the lower LMRB. In addition, the hydrological processes were significantly influenced by monsoon fluctuation. The western North Pacific summer monsoon has significantly influenced runoff (precipitation) over the southeastern basin with 39.6% (34.6%) explained variance, whereas the Indian summer monsoon has predominantly influenced the mid-low area of the basin with 48.4% (40.8%) explained variance. The comprehensive effects of the change points of monsoon indices contributed greatly to the abrupt change of precipitation in the overlapped region such as the mid-low LMRB. Our findings indicate that understanding the mechanism of monsoon fluctuation on abrupt changes in streamflow, runoff, and precipitation in the basin will offer a better understanding of climate change impacts on water resources, which can provide support for optimizing forecasting and improving water resources management in the basin.

How to cite: Wang, H., Liu, J., Chen, A., and Chen, H.: Runoff change point detection and its association with monsoons in the Lancang-Mekong River Basin, EGU General Assembly 2024, Vienna, Austria, 14–19 Apr 2024, EGU24-3176, https://doi.org/10.5194/egusphere-egu24-3176, 2024.

Land use and land cover change (LULCC) significantly affects the drainage characteristics of catchments. Consequently, this may alter both the availability of surface water and groundwater and the vulnerability of certain areas to extreme hydrological events (e.g. pluvial flash floods due to the altered catchment hydrological response). These effects of LULCC can vary considerably from place to place, thus site-specific studies are required to investigate their impact in combination with those effects produced by other stressors (Mensah et al., 2022). Nevertheless, conducting such detailed studies will require considerable resources and time. Therefore, it is relevant to identify patterns and hotpots to better inform decision making when it is necessary to focus or save efforts in this regard. Considering this, a strategy has been proposed to be implemented for analysing the impact of LULCC processes on the hydrology of small watersheds in several European countries over the last three decades.

The impact on the drainage characteristics are determined using a hydrological model based on the SCS Curve Number (CN) approach. This approach and methods based on CN are widely used to analyse the impact of LULCC; and indeed, it has been successfully used to analyse the impacts of urbanisation on surface runoff in the contiguous United States (Chen et al., 2017).  Unlike other studies, where the main unit of analysis was administrative units, this research focusses on small watersheds. Consequently, watersheds in which LULCC has occurred can be selected and modelled independently. This approach helps to reduce the masking of effects that may be present when modelling LULCC-affected watersheds together with non-affected watersheds. Although impacts on runoff were analysed, the discussion focusses on the variation of the CN, since the SCS-CN method has limitations and it has shown slightly less accurate results than other alternative and derived methods (Walega & Salata, 2019).

For the analysis of LULCC processes, categories of change processes were defined on the basis of the 44 CORINE’s thematic classes around sub-groups of interest, considering their hydrological characteristics (expected level of water retention). For classes that suppose a more intense anthropogenic intervention (artificial surfaces and agricultural areas), the discretisation of LULCC processes were defined in more detail. Discussions and conclusions were drawn on how processes such as deforestation, regeneration and reforestation/revegetation of burnt areas, urban densification, green urbanisation or changes in crop types have affected the different drainage areas analysed around Europe.


References

Chen, J., Theller, L., Gitau, M. W., Engel, B. A., & Harbor, J. M. (2017). Urbanization impacts on surface runoff of the contiguous United States. Journal of Environmental Management, 187, 470-481, doi: https://doi.org/10.1016/j.jenvman.2016.11.017

Mensah, J. K., Ofosu, E. A., Yidana, S. M., Akpoti, K., & Kabo-bah, A. T. (2022). Integrated modeling of hydrological processes and groundwater recharge based on land use land cover, and climate changes: A systematic review. Environmental Advances, 8, 100224, doi: https://doi.org/10.1016/j.envadv.2022.100224

Walega, A., & Salata, T. (2019). Influence of land cover data sources on estimation of direct runoff according to SCS-CN and modified SME methods. CATENA, 172, 232-242, doi: https://doi.org/10.1016/j.catena.2018.08.032

How to cite: García Montealegre, J. P. and Del Jesus Peñil, M.: Land use and land cover change processes in small watersheds: A strategy for identifying patterns and hotspots at continental scale, EGU General Assembly 2024, Vienna, Austria, 14–19 Apr 2024, EGU24-3549, https://doi.org/10.5194/egusphere-egu24-3549, 2024.

Even in Europe, rivers and streams cease to flow during some time of the year. Little is known about these intermittent waterways at the continental scale because the spatial distribution of streamflow gauges is biased in favor of perennial river reaches. In our study, undertaken in two phases, we initially employed a two-step Random Forest (RF) modeling approach to predict the monthly time series of streamflow intermittence at a high spatial resolution across approximately 1.5 million European river reaches spanning the period from 1981 to 2019. Important predictors were computed from time series of monthly streamflow in 15 arc-sec (high-resolution HR) cells that were derived by downscaling the 0.5° (low-resolution LR) output of the global hydrological model WaterGAP. To set up the RF model, we utilized daily time series data of observed streamflow from 3706 gauging stations as the target variable, and incorporated a comprehensive set of 23 dynamic and static hydro-environmental variables as predictors. We computed that 3.8% of all European reach-months and 17.2% of all reaches were intermittent during 1981-2019.

In the subsequent phase, we implemented the developed RF model to quantify alterations in streamflow intermittence that may occur due to future climate change. This involved utilizing the bias-adjusted output of five Global Climate Models (GCMs) from the Inter-Sectoral Impact Model Intercomparison Project (ISIMIP3b) and two Representative Concentration Pathway (RCP)-specific runs (ssp126 and ssp585). The reference period spans from 1985 to 2014, with projections for two future periods (2041-2070, 2071-2100).

We downscaled the LR output of WaterGAP runs driven by the different climate model output and recomputed the predictors that depend on WaterGAP output to generate predictor for the climate change impact assessment. Subsequently, we computed the intermittence status (classified as 0, 1-5, 6-15, 16-29, and 30-31 no-flow days in a month) for each reach-month across Europe by applying the developed RF models.

Finally, we established various indicators, such as changes from intermittent to perennial or vice versa, changes in the average annual number of intermittent months or changes in the in the inter-annual variability. Additionally, we incorporated the uncertainty associated with the utilization of five GCMs into our analysis.

How to cite: Abbasi, M. and Döll, P.: Quantifying the potential impacts of climate change on streamflow intermittence in Europe, EGU General Assembly 2024, Vienna, Austria, 14–19 Apr 2024, EGU24-3816, https://doi.org/10.5194/egusphere-egu24-3816, 2024.

EGU24-3968 | ECS | Orals | HS2.5.1

The value of functional relationships for large scale hydrology 

Sebastian Gnann and Thorsten Wagener

We increasingly rely on complex models to understand the functioning and fate of our planet. But what hydrological theory underlies these models and thus the conclusions we draw from them? How do old and rapidly increasing new observations help to advance both theory and models? In this contribution, we discuss the importance of functional relationships for (large-scale) hydrology. We define functional relationships as relationships between two or more variables that characterize the functioning of hydrological systems, such as relationships between forcing and response variables (e.g. precipitation and runoff). Functional relationships are not only a central part of hydrological theory, but they also inform how we contextualize and make measurements, and they help us to build, constrain, and evaluate models. To illustrate their value, we first provide an overview of some relationships in large-scale hydrology. We then show how such relationships can be used to evaluate global water models. We conclude by discussing what our current state of knowledge can tell us about what we should explore next, in particular the need for mechanistic explanations of empirical relationships and the potential of linking multiple hydrological fluxes within a unified framework.

How to cite: Gnann, S. and Wagener, T.: The value of functional relationships for large scale hydrology, EGU General Assembly 2024, Vienna, Austria, 14–19 Apr 2024, EGU24-3968, https://doi.org/10.5194/egusphere-egu24-3968, 2024.

EGU24-5157 | ECS | Posters on site | HS2.5.1

Global groundwater environmental flow violations 

Bryan Marinelli, Chinchu Mohan, Tom Gleeson, Fulco Ludwig, and Inge de Graaf

Groundwater serves as a vital resource to meet growing freshwater demands, particularly for the irrigation sector, driven by population growth and socioeconomic development. Apart from this application, however, groundwater also supports surface water bodies through groundwater discharge. While irrigation demands are important, environmentally safe levels of groundwater discharge must also be maintained.

We applied two methods of calculating groundwater environmental flows using modelled groundwater discharge. The first, Presumptive Standard1, stipulates that 90% of naturally occurring groundwater discharge should be maintained. The second, Q902, considers the 90th percent exceedance from a 60-month moving window as the environmental flow. We then calculated violations when the human-impacted groundwater discharge, accounting for sectoral water use, dropped below the environmental flows.

At the river basin scale, we assessed violation frequency and severity. Notably, despite Presumptive Standard violations occurring more frequently than Q90 violations, both methods identified the same spatial trends: basins in intensively irrigated regions experienced the most frequent and severe violations.

Similarly, we assessed the frequency and severity of violations during low-flow periods, isolated using the Q90 as a low-flow threshold, when the role of groundwater to support surface water bodies increases. During these critical instances, the Presumptive Standard and Q90 estimated nearly identical violation schemes.

The groundwater environmental flow violations were further compared to surface water environmental flow violations, following the methodology of Variable Monthly Flow3. This comparison highlighted the importance of including groundwater in environmental flow assessments, as many regions experience high levels of groundwater violations compared to surface water violations.

In addition to frequency and severity, we assessed the timing of violations in select basins with high levels irrigated agriculture. Timing refers to the specific instances when violations occurred. This analysis showed the progression of violation trends over time and emphasized the driving force of groundwater abstractions on environmental flow violations.

Our study shows that including groundwater in assessments of environmental flows is vital, as groundwater is a finite source which plays a crucial role in supporting surface water bodies. When conducting such an assessment, however, the selected groundwater environmental flow threshold may have an effect. If all timesteps are to be considered, the choice of methodology between the Presumptive Standard and Q90 will make a difference. If the focus is on low-flows, however, the choice of methodology will not greatly impact the assessment.

1. Gleeson, T. & Richter, B. How much groundwater can we pump and protect environmental flows through time? Presumptive standards for conjunctive management of aquifers and rivers. River Res Appl 34, 83-92 (2018).

2. de Graaf, I. E. M., Gleeson, T., (Rens) van Beek, L. P. H., Sutanudjaja, E. H. & Bierkens, M. F. P. Environmental flow limits to global groundwater pumping. Nature 574, 90-94 (2019).

3. Pastor, A. V., Ludwig, F., Biemans, H., Hoff, H. & Kabat, P. Accounting for environmental flow requirements in global water assessments. Hydrol Earth Syst Sci 18, 5041-5059 (2014).

How to cite: Marinelli, B., Mohan, C., Gleeson, T., Ludwig, F., and de Graaf, I.: Global groundwater environmental flow violations, EGU General Assembly 2024, Vienna, Austria, 14–19 Apr 2024, EGU24-5157, https://doi.org/10.5194/egusphere-egu24-5157, 2024.

EGU24-5402 | ECS | Orals | HS2.5.1

Efficient and systematic evaluation of the global hydrological model WaterGAP against multiple types of observation data  

Ezatullah Rabanizada, Hannes Müller Schmied, and Petra Döll

Global hydrological models (GHMs) play a crucial role in understanding Earth's water resources. To evaluate the strengths and limitations of these models, and how their performance changes with parameter modification or calibration, model outputs are compared against observational data. Traditionally, hydrological models have been evaluated against in-situ streamflow observations. However, this can lead to incomplete assessments of models because models might simulate streamflow well while failing in other aspects, such as overall terrestrial water storage anomaly (TWSA) or the dynamics of specific storage compartments. Nowadays, geodetic and remote sensing data (time series) have become available and are suitable for model evaluation in addition to streamflow. This study takes a comprehensive look at the GHM WaterGAP2.2e by extending the evaluation beyond streamflow observations by integrating different GRAC TWSA products, snow cover fraction, and the dynamics of lake and reservoir surface areas, and the corresponding storage anomalies. The multi-variable evaluation approach is particularly valuable in identifying areas where the model might need improvement. As an example, by comparing the model against GRACE TWSA and streamflow observation, we can test the effect of increasing water storage capacity in soils or decreasing the groundwater discharge coefficient. These parameters govern the flow from groundwater to surface water bodies, offering viable options to address, for example, underestimation or overestimation of the temporal variability of GRACE TWSA when using models like WaterGAP. Evaluating the snow cover fraction model output against observed data improves the model’s ability to simulate snowpack dynamics, a crucial element for estimating seasonal water supply in areas that depend on snowfall. Furthermore, comparing the model output with observed surface areas and storage anomalies of lakes and artificial reservoirs helps to improve, for example, the estimation of surface water use and the simulation of reservoir management. Ultimately, the multi-variable evaluation approach could pave the way for creating models better suited to address the complex questions in global water research.

How to cite: Rabanizada, E., Müller Schmied, H., and Döll, P.: Efficient and systematic evaluation of the global hydrological model WaterGAP against multiple types of observation data , EGU General Assembly 2024, Vienna, Austria, 14–19 Apr 2024, EGU24-5402, https://doi.org/10.5194/egusphere-egu24-5402, 2024.

Nearly 80% of the global population faces severe water stress, yet changes in global water availability are not well quantified. Two essential factors for identifying water stress and promoting sustainable development include runoff, a flux variable reflecting water use, and freshwater storage, representing the potentially maximum water resources. Despite their importance, integrated analysis of changes in runoff/storage and their impacts on society remains in its infancy at the global scale. By leveraging the strengths of remote sensing techniques, advanced land surface models, and reanalysis data, here we quantified global changes in total water storage (TWS) and runoff over the past two decades. In addition, we proposed new indices to evaluate the relative vulnerability in water availability normalized at the global scale. The results show that 80% of global areas experienced declines in TWS and/or runoff for the past two decades, and 39% of areas suffered from water loss in both storage and runoff. The joint effects of storage-runoff limitation amplified vulnerability in water availability, reflected by not only a larger spatial domain but also higher severity relative to individual stress caused by either TWS or runoff changes. The most vulnerable regions in water availability were found across the north and central South America, south Asia, and Europe. Specific threats include the loss of solid water storage, groundwater extraction for irrigation, and climate-induced extreme heat and drought over the past two decades. Our findings provide valuable insights not only for understanding hydrologic responses to a changing climate and fast-developing society, but also for developing adaptive strategies for water-stressed hotspots.

How to cite: Li, X. and Peng, J.: Joint effects of storage-runoff limitation amplify global stress in water availability, EGU General Assembly 2024, Vienna, Austria, 14–19 Apr 2024, EGU24-5652, https://doi.org/10.5194/egusphere-egu24-5652, 2024.

EGU24-5869 | ECS | Orals | HS2.5.1

Mapping the spatio-temporal dynamics of groundwater-dependent ecosystems (GDEs) with a global groundwater model.  

Nicole Gyakowah Otoo, Edwin H. Sutanudjaja, Michelle T.H van Vliet, Aafke M Schipper, and Marc F.P Bierkens

Groundwater-dependent ecosystems (GDEs) are ecosystems that rely on subsurface or surface expressions of groundwater. These ecosystems host a wide array of unique flora and fauna and provide **important** ecosystem services. However, GDEs are threatened by the unsustainable extraction of groundwater as well as climate change. Mapping the spatio-temporal dynamics of GDEs and **potential** changes therein under climate change and socio-economic developments is an essential step towards their conservation. To this end, **we have** developed a methodological framework for mapping groundwater-dependent ecosystems using the global groundwater model GLOBGM [1], run at 30 arc sec (~1 km) resolution. The advantage of a physically-based groundwater model over statistical or machine learning methods is that it allows for the reconstruction and projection of impacts of changes in climate, land use, and human water use on GDEs.

We distinguish three categories of GDEs: aquatic (rivers and lakes), (inland) wetland, and terrestrial (phreatophyte) GDEs. For each GDE category, we defined a set of criteria for identifying their distribution and degree of groundwater dependence based on groundwater levels, groundwater discharge, and land surface parameters (e.g., saturated area fraction). After calibrating the groundwater model with groundwater heads, we ran the model in both steady and transient states, applying the set of criteria to the model outputs to map the different types of GDEs, their degree of groundwater dependency, and their spatio-temporal dynamics.

We validated the model in two ways. First, we compared our simulated groundwater depths against observed groundwater depths. Our model was able to represent observed conditions for about 75% of the groundwater depth locations. Second, we validated the simulated occurrence of GDEs based on the steady-state model runs against the GDE atlas available for Australia [2], where we found a hit rate above 80%. For Australia, our transient runs revealed an overall decline in groundwater dependency between the periods 1979-1998 and 1999-2019, as measured by the average number of months that GDEs are fed by groundwater. This is corroborated by an increase in groundwater depth at the observation wells, indicating that Australian GDEs have become increasingly threatened over the past decades.

For the next step, we envision upscaling our approach to the entire globe and projecting the fate of GDEs under different global change scenarios. This, in turn, is a key step towards identifying sustainable groundwater management strategies that contribute to the conservation of GDEs and their unique biodiversity.

References

  • Verkaik, J., et al., GLOBGM v1. 0: a parallel implementation of a 30 arcsec PCR-GLOBWB-MODFLOW global-scale groundwater model. Geoscientific Model Development Discussions, 2022. 2022: p. 1-27.
  • Doody, T.M., et al., Continental mapping of groundwater dependent ecosystems: A methodological framework to integrate diverse data and expert opinion. Journal of Hydrology: Regional Studies, 2017. 10: p. 61-81.

How to cite: Otoo, N. G., Sutanudjaja, E. H., van Vliet, M. T. H., Schipper, A. M., and Bierkens, M. F. P.: Mapping the spatio-temporal dynamics of groundwater-dependent ecosystems (GDEs) with a global groundwater model. , EGU General Assembly 2024, Vienna, Austria, 14–19 Apr 2024, EGU24-5869, https://doi.org/10.5194/egusphere-egu24-5869, 2024.

An inevitable challenge faced during calibration of large-scale hydrological models is the task of reducing equifinality of various model structures and parameter sets. HYPE (Hydrological Predictions for the Environment) is a semi-distributed, continuous simulation hydrological model which provides alternative routines for many simulated processes and utilizes both domain-wide parameters and parameters tied to physiography. The fourth-generation HYPE model for the pan-European domain, E-HYPE4, was calibrated for discharge and sediments within a framework which allowed for the evaluation of factors limiting model performance. Calibration was performed using a multi-phase approach in which an initial multi-objective calibration for discharge and sediments was followed by an exhaustive sediment calibration to evaluate combinations of erosion and sedimentation/resuspension routines. During each calibration phase, ensembles of parameter sets and model routines were simultaneously evaluated against discharge, evapotranspiration, and sediment observations. In total, 20,000 candidate parameter sets were evaluated during the discharge calibration, and a further 20,000 candidate model setups were assessed during the sediment calibration. Model performance was best with a highly regionalized model, and the largest drop in achievable model performance occurred when transitioning from an ensemble of candidates to a single model setup for the full model domain. However, much of the gains in performance with a highly regionalized model could be achieved with a much less regionalized model. Inclusion of sediments in the discharge calibration process reduced equifinality, and evaluation of the erosion routines indicated that a simple index-based routine performed equally well as a more complex, process-based routine . Finally, analysis of model performance by subbasin attributes revealed the dominant factors — such as landuse, glaciers, abstractions/regulations, groundwater, and lakes/wetlands — affecting model biases for different geographical regions.

How to cite: Brendel, C., Capell, R., and Bartosova, A.: Limiting factors in model performance for the multi-objective calibration of a pan-European, semi-distributed hydrological model for discharge and sediments, EGU General Assembly 2024, Vienna, Austria, 14–19 Apr 2024, EGU24-6115, https://doi.org/10.5194/egusphere-egu24-6115, 2024.

EGU24-6462 | ECS | Posters on site | HS2.5.1

Graphical representation of global water models participating in the Inter-Sectoral Impact Model Intercomparison Project (ISIMIP2b) 

Hannes Müller Schmied, Laura Müller, and Simon N. Gosling and the ISIMIP2b water model diagram team

Numerical models are simplified representations of the real world at a finite level of complexity, which means they are not exhaustive in the number of processes they include. Global water models are used to simulate the global water cycle and their outputs are used to estimate important natural and societal issues, including water availability, flood risk, and ecological functioning.

Whilst global water modelling is an area of science that has developed over several decades, and individual model-specific descriptions exist for some models, there has to date been no attempt to visualize how several models work, using a standardized visualization framework. Here, we address this gap, by presenting a set of visualizations of several global water models participating in the Inter-Sectoral Impact Model Intercomparison Project phase 2b.

The diagrams were co-produced between a graphics designer and in total 16 modelling teams, based on extensive discussions and pragmatic decision-making that balanced the need for accuracy and detail against the need for effective visualization. The model diagrams are based on a standardized "ideal" global water model that represents what is theoretically possible to model with the current generation of state-of-the-art global water models. Model-specific diagrams are then copies of the "ideal" model diagram, with individual processes either included or greyed out.

As well as serving an educational purpose, we envisage that the diagrams will help researchers in and outside of the global water model community to select the right model(s) for specific applications, stimulate a community learning process, and identify missing components to help direct future model developments.

How to cite: Müller Schmied, H., Müller, L., and Gosling, S. N. and the ISIMIP2b water model diagram team: Graphical representation of global water models participating in the Inter-Sectoral Impact Model Intercomparison Project (ISIMIP2b), EGU General Assembly 2024, Vienna, Austria, 14–19 Apr 2024, EGU24-6462, https://doi.org/10.5194/egusphere-egu24-6462, 2024.

EGU24-6825 | ECS | Posters on site | HS2.5.1

A GIS-based Methodology for Groundwater Potential Recharge Assessment in Sicily (Italy) through Multi Criteria Approach 

Iolanda Borzì, Crisostomo Navarra, Francesco Gregorio, and Stefania Lanza

Groundwater resources plays a key role in supporting human well-being, agricultural productivity, and ecological balance. Worldwide, groundwater resource represents a primary source of water supply for drinking purpose, irrigation and for supporting a variety of aquatic ecosystems, including wetlands, springs, and riparian zones. Sicily Island (Italy) relies heavily on groundwater resources, providing drinking water in different cities and water for the main island's agriculturally productive areas. 
In a context where climate change is expected to affect precipitation patterns and groundwater recharge rates, evaluating potential groundwater recharge areas represents an important issue for sustainable water management and for planning a proper protection of groundwater resources. For the above-mentioned reasons, we propose here a Multi-Criteria Approach (MCA) to assess potential groundwater recharge. 
The methodology is here implemented through geographic information system (GIS) and uses a large dataset of information for the whole Sicily Island, consisting in spatial distributed data on rainfall, evapotranspiration, aridity index, lithological characteristics of the exposed terrains, density of thrust faults and rock fractures, stream density, land uses and slope.  All the factors are firstly normalized and then used in the MCA for evaluating potential groundwater recharge areas of the entire Sicily Island through the use of different groundwater recharge rates. Results are then validated against a large dataset of wells and boreholes information for the entire region. 


How to cite: Borzì, I., Navarra, C., Gregorio, F., and Lanza, S.: A GIS-based Methodology for Groundwater Potential Recharge Assessment in Sicily (Italy) through Multi Criteria Approach, EGU General Assembly 2024, Vienna, Austria, 14–19 Apr 2024, EGU24-6825, https://doi.org/10.5194/egusphere-egu24-6825, 2024.

EGU24-8127 | ECS | Posters on site | HS2.5.1

Revealing dominant controls in a continental-scale model of submarine groundwater discharge and seawater intrusion by utilizing intrinsic model variability 

Daniel Kretschmer, Nils Moosdorf, Holly Michael, Thorsten Wagener, and Robert Reinecke

Groundwater is vital to sustain coastal freshwater consumption and agricultural activities around the globe. In the US, groundwater withdrawal has more than doubled from 1950 to 2015. In 2015, almost half of the coastal counties in the US relied on groundwater as their primary water source. Large volumes of groundwater withdrawal at the coast have caused groundwater level declines: almost half (44%) of the well water level observations made within 1 km of the coast are below sea level. We know that such reduction of groundwater reduces the amount of fresh submarine groundwater discharge (SGD) - fresh groundwater flowing into the ocean - and may trigger seawater intrusion (SWI), harming coastal ecosystems and deteriorating groundwater quality for domestic and agricultural use. Previous continental-scale and global models of SGD and SWI have simulated steady state conditions. To understand which factors drive these two fluxes and how coastal aquifers are impacted by sea level rise and changes in groundwater recharge, we have developed a MODFLOW-like modeling framework that can simulate transient density-driven groundwater fluxes on large scales (G³M-D). For our investigation, we focus on a simulation of North America. The model simulates SWI as an interface between potable and non-potable (i.e., too saline) groundwater. Established sensitivity-analysis methods that would allow pinpointing dominant controls inside a model often require hundreds to thousands of model simulations. Here, we utilize the intrinsic variability of the model to analyze drivers of coastal groundwater exchange. We show which factors drive the exchange fluxes between groundwater and ocean for different model domains. We also discuss whether the large-scale representation fits our perceptual model of coastal processes.

How to cite: Kretschmer, D., Moosdorf, N., Michael, H., Wagener, T., and Reinecke, R.: Revealing dominant controls in a continental-scale model of submarine groundwater discharge and seawater intrusion by utilizing intrinsic model variability, EGU General Assembly 2024, Vienna, Austria, 14–19 Apr 2024, EGU24-8127, https://doi.org/10.5194/egusphere-egu24-8127, 2024.

EGU24-8839 | ECS | Orals | HS2.5.1

Everywhere and Locally Relevant Streamflow Simulations in Hydrological Modeling 

Pallav Kumar Shrestha, Luis Samaniego, Rohini Kumar, and Stephan Thober

Contemporary initiatives such as the Digital Twins and paradigms like the Hyper-resolution Modeling are pushing the boundaries of high-performance computing, bringing resolutions of large-scale hydrological models (HM) down to sub-kilometer, in attempts of making "Locally Relevant Hydrological Models Everywhere" a reality. As global water models converge towards this hyper-resolution, we notice the insufficient attention given to model scalability i.e., consistent simulations across different resolutions using the same set of model parameters. Besides, the way distributed HMs have been resolving the stream network with grids requires high resolution model runs to offset the errors, especially at locations with smaller catchment area, hence the calling of the hyper-resolution modeling.

We equip the mesoscale hydrological model (mHM, https://mhm-ufz.org) with a novel stream network upscaling scheme called subgrid catchment conservation or SCC. We hypothesize the conservation of the subgrid catchment area to have threefold effect in distributed HMs: 1) improvement in the consistency of model performance across modeling resolutions, 2) streamflow simulations become both plausible everywhere and locally relevant, and 3) the long-standing conundrum of streamflow estimation at multiple gauging stations within a grid cell will be solved.

The experimental setup is a single modeling domain encompassing 187 GRDC streamflow stations in the Rhine river basin. The wide range of catchment sizes at the gauges (1 km2 to more than 150,000 km2), notable presence of proximate clusters of gauges, and good data availability (average availability of 30 years) makes Rhine an apt case for the hypotheses testing. We compare streamflow simulated by the SCC with the D8 stream network upscaling scheme, both with default parameter set. SCC shows remarkable streamflow scalability with nine out of 10 stations exceeding the mean flow benchmark across 1 km to 100 km model resolutions. In comparison, D8 shows poor scalability where the percentage of stations exceeding the benchmark reduces drastically from ≈80 % at 1 km to 50 % at 12 km to <5 % at 100 km. SCC performs significantly better than D8 at smaller catchments (<100 km2) e.g., KGE of 0.34 (±0.02) at Rappengraben (1 km2), at all model resolutions. This demonstrates, for the first time, the ability of a distributed HM to produce locally relevant streamflow everywhere, irrespective of model resolution. The Rhine's 25 km configuration encompasses grid cells featuring as many as 10 gauges within a single grid. The mean annual streamflow at these stations unrealistically exhibit identical values with the D8, whereas the SCC simulations yield values close to the observations at each station.

SCC requires the locations of interest (e.g., gauges) in the model configuration i.e., the catchment area conservation can not be achieved post-process. Still, SCC remains a significant advancement over the older (EAM, DMM) as well as the state-of-the-art (FLOW, IHU) stream network upscaling schemes. SCC finds practical application in switchable systems that require consistent simulations across resolutions demanded by end-users. The opportunity to improve hydrological forecasts using SCC also remains to be explored. But most importantly, the outcome of this research reminds us about "the overlooked hallmark of model reliability i.e., scalability".

How to cite: Shrestha, P. K., Samaniego, L., Kumar, R., and Thober, S.: Everywhere and Locally Relevant Streamflow Simulations in Hydrological Modeling, EGU General Assembly 2024, Vienna, Austria, 14–19 Apr 2024, EGU24-8839, https://doi.org/10.5194/egusphere-egu24-8839, 2024.

EGU24-9280 | Posters on site | HS2.5.1

Evaluation of river discharge simulated with CTRIP forced by the CERRA-Land regional reanalysis over Europe. 

Patrick Le Moigne, Anaïs Barella-Ortiz, and Simon Munier

The study and understanding of the water cycle is vital, and especially significant due to challenges like climate change and effective water management, among others.  

The work herein presents a comparison designed in such a way that it covers different spatial scales (at European, basin, and gauging station levels), as well as providing results that offer a characterization of discharge as complete as possible. For this, standard and well known metrics, like NSE and KGE are given, but also low, medium, and high flows are considered through percentile analysis and specific metrics.


Observations used in this study belong to the Global Runoff Data Centre (GRDC), which provides data over the globe, and French and Spanish public databases. An offline simulation of the CTRIP routing model was used to simulate river discharge over the period 1993 to 2019. It was forced with surface and subsurface runoff from the CERRA-Land European regional reanalysis at a spatial resolution of 5.5 km.

This study is conducted within the framework of the CERISE project (grant agreement No101082139). The results will enable us to evaluate the hydrological quality of the CERRA-Land reanalysis. Additionally, our contributions aim to enhance future reanalyses, thereby improving the next generation of Copernicus Climate Change Service (C3S) Earth system reanalyses.

How to cite: Le Moigne, P., Barella-Ortiz, A., and Munier, S.: Evaluation of river discharge simulated with CTRIP forced by the CERRA-Land regional reanalysis over Europe., EGU General Assembly 2024, Vienna, Austria, 14–19 Apr 2024, EGU24-9280, https://doi.org/10.5194/egusphere-egu24-9280, 2024.

EGU24-9792 | ECS | Orals | HS2.5.1

High and dry: model development to improve simulations of large-scale hydrological droughts in the Alps   

Joren Janzing, Niko Wanders, and Manuela Brunner

Hydrological droughts are often not limited to a single river basin but affect several basins simultaneously. The co-occurrence of droughts in different basins is influenced by meteorological processes, catchment characteristics and surface processes such as soil moisture and snow cover, the latter of which is particularly important in mountain regions.
Large-scale hydrological models are a useful tool to study the drivers of large-scale droughts and to understand their evolution in a changing climate. In recent years, these models have moved towards increasingly high spatial resolutions, making them more applicable in regions with complex heterogenous mountain topography. However, large-scale hydrological models often have simplified representations of snow and glacier processes.

Here, we set up the PCR-GLOBWB 2.0 global hydrological model, which represents snow cover by using a temperature index model with a constant degree-day factor and which has no explicit representation of glaciers, at a resolution of 30 arcseconds (approximately 1 km) over the Alps. We adapted the model to make it more suitable for mountain regions. Specifically, we (1)  improved the snow module and compare different implementations of temperature-index models and (2) implemented a new dynamic glacier module. In the new model set-up, we calibrated snow water equivalent and glacier elevation changes against observations and reanalysis products and evaluated the model over the Alps, with specific emphasis on the representation of spatial patterns in hydrological extremes. With this new set-up, we are able to tackle model issues related to excess snow accumulation and improve discharge simulations, particularly in glacierized catchments. We apply this new model set-up to the larger Alpine region to study the drivers of large-scale hydrological droughts.

How to cite: Janzing, J., Wanders, N., and Brunner, M.: High and dry: model development to improve simulations of large-scale hydrological droughts in the Alps  , EGU General Assembly 2024, Vienna, Austria, 14–19 Apr 2024, EGU24-9792, https://doi.org/10.5194/egusphere-egu24-9792, 2024.

EGU24-10346 | Posters on site | HS2.5.1

Building Drought Resilience: Earth Observation for Groundwater Management in Botswana 

Èlia Cantoni, Beatriz Revilla-Romero, Homero Paltán, Diego Juan Rodriguez, and Marc Paganini

Botswana is one of the world’s most drought-prone countries, with multiple, multi-year droughts recorded since the 1950s. Drought frequency in Botswana has increased progressively passing from a single drought during the 80s to recording six droughts from 2006 to 2016. The country faces critical challenges in ensuring a sustainable water supply for its growing population and its agricultural, mining and industrial sectors. Groundwater is the lifeline of Botswana, accounting for approximately 80% of the country's total water supply, with this percentage increasing in Western Botswana and rural areas, where most villages and the mining industry are entirely dependent on groundwater. This reliance is undermined by recurring droughts, low and unreliable rainfall, the overexploitation of groundwater resources, and the limited operational hydrological data monitoring network in recent years.  

A collaboration between GMV and the World Bank, through the European Space Agency (ESA) Global Development Assistance (GDA) thematic area of Water Resources, is implementing Earth Observation-based services for groundwater quantification, monitoring, and resilient groundwater resources management in Botswana. Firstly, an initial groundwater recharge assessment was conducted by calculating the potential groundwater recharge at national scale for the 2003-2023 period. More specifically, the soil moisture balance was calculated using CHIRPS (precipitation) and MODIS (potential evapotranspiration) as inputs at daily resolution. The results show low annual potential recharge values, with a clear aridity gradient from southwest to northeast and a strong seasonality where most of recharge occurs between December and February.


Secondly, the Global Land Data Assimilation System (GLDAS) datasets (NASA) have been used to evaluate the groundwater availability and storage variations across Botswana through the study period. GLDAS is a modelling system which combines satellite and field station measurements to generate uniform land surface models (LSMs) outputs.  The resulting groundwater storage variations display similar gradients and seasonal patterns than those observed with the potential groundwater recharge as well as large interannual variability. These data are then used to identify hotspots of ongoing significant groundwater through trend extractions and the calculation of the GRACE groundwater drought index (GGDI) among other indicators. Results from this study will be used to communicate groundwater and drought conditions with relevant local stakeholders. Thus, these findings support the development of comprehensive groundwater and water security strategies in Botswana. Further work will be undertaken to contrast these results with catchment-scale groundwater recharge estimations and investigating the correlation between groundwater resources with other elements of the water cycle (e.g., rainfall, runoff) as well as large-scale circulation patterns. This work also evidences the way that bringing in earth observation products and land assimilation systems supports the design of resilient policies in countries with data scarcity and challenging climatic conditions.

How to cite: Cantoni, È., Revilla-Romero, B., Paltán, H., Rodriguez, D. J., and Paganini, M.: Building Drought Resilience: Earth Observation for Groundwater Management in Botswana, EGU General Assembly 2024, Vienna, Austria, 14–19 Apr 2024, EGU24-10346, https://doi.org/10.5194/egusphere-egu24-10346, 2024.

The influence of climate change on the level and recharge of groundwater has yet to be well understood. In countries with low cumulative rainfall, such as the Czech Republic, groundwater is an essential source of water supply. In the Czech Republic, between 1990 and 2020, 366 million m$^{3}$ of water from aquifers was used for public water supply networks. Although the air temperature in the Czech Republic continues to rise slowly, from 1981 to 2010, an increase of +1.6°C has been identified in all Czech territories, affecting evaporation and infiltration dynamics. On average, 634 mm of precipitation fell in the country (92% of the long-term average for 1981-2010). These conditions aggravate droughts caused by several consecutive years of below-average rainfall, directly affecting water infiltration, groundwater recharge, and groundwater table fluctuations.

This contribution aims to simulate rainwater infiltration according to evapotranspiration heat, simulating the excess water that can infiltrate and cross the unsaturated zone until it reaches the saturated zone. This research is carried out in non-carbon confined aquifers, where infiltration is assumed to be the primary recharge mechanism in the western Central Bohemian region, Czech Republic. The climate data consists of 2-meter total precipitation and temperature data from the ERA5 reanalysis (provided by ECMWF). On an hourly scale, the analysis is run using disaggregated data from the Amalie Lany region (Central Bohemia). Data disaggregation was achieved through ArcMap and Rstudio.

Water infiltration was achieved using DRUtES (Dual Richards Unsaturated Equation Solver). DRUtES is a free software. It uses Richards's and heat transport equations to describe hydrodynamical processes in variable saturated porous media with surface and subsurface evaporation, surface energy balance and root water uptake.  This model was built to represent over ten observation boreholes in a compacted sedimentary layer followed by fractured layers in the Lany Amalie Watershed. Van Genuchten's median porous parameters, anisotropy description, thermal conductivity, and root zone parameters have been used in this model. Over the past period (1990 - 2020), the infiltration shows a mean of 0.05 mm per hour for each soil profile. Infiltration simulation correlates quantitatively with climate time series data from 1990 to 2020. This first approach evaluates climate change's impact in the last 30 years on aquifer recharge from surface heat in the western Central Bohemian region, where precipitation is an essential resource to supply ponds, energy production, aquifer recharge, and drinking water. 

Keywords: Climate change, Infiltration, Aquifer recharge, Precipitation, Temperature, DRUtES.

How to cite: Cárdenas-Castillero, G. and Kuráž, M.: Evaluation of Aquifer Recharge Infiltration through Richards equation–based Approach in Non-carbon Confined Aquifers in Central Bohemian, Czech Republic from 1990 to 2020, EGU General Assembly 2024, Vienna, Austria, 14–19 Apr 2024, EGU24-10698, https://doi.org/10.5194/egusphere-egu24-10698, 2024.

EGU24-11522 | ECS | Orals | HS2.5.1

Assessing the Impact of Climate Change on Global Wetland Extent using CMIP6 multi-model analysis. 

Lucas Hardouin, Bertrand Decharme, Jeanne Colin, and Christine Delire

Wetlands play a crucial role in the Earth's system, interacting with various processes such as the hydrological cycle, energy and water exchange with the atmosphere, and global nitrogen and carbon cycles. However, the historical extent of wetlands has suffered significant losses, primarily driven by human activities, particularly in Europe, North America, China, and Southeast Asia. Because of their remote locations, northern Canada and Siberia remain relatively untouched, while South America and Central Africa face current threats. The future trajectory of wetlands is anticipated to be influenced not only by direct human actions but also by climate change. Here we present our assessment of climate-driven global change in wetland extend, focusing on the main wetland complexes. We used an approach based on the Topographic Hydrological model (TOPMODEL), and soil liquid water content projections from 14 models of the Coupled Model Intercomparison Project phase 6 (CMIP6). Our analysis reveals a consistent decrease in wetland extent in the Mediterranean, Central America, and Northern South America, with a substantial long-term loss of 28% in the western Amazon Basin under high radiative forcing (SSP370). Conversely, Central and Western Africa exhibit an increase in wetland extent, excluding the Congo Basin. Nevertheless, most of the area studied (80%) presents uncertain results, due to conflicting projection of changes between the models. Notably, we show that there is significant uncertainty among CMIP6 models regarding liquid soil water content in high latitudes, due to permafrost representation and its thawing. By narrowing our focus to 10 models that seem to best represent the thawing of permafrost, we find modest decline in the overall global area (< 5%), yet significant spatial diversity, with better model agreement. Beyond 50°N, long-term losses of 13% are noted globally, with specific areas like the Hudson Bay Lowlands experiencing a 21% decrease and the Western Siberian Lowlands a 15% decrease under high radiative forcing.

How to cite: Hardouin, L., Decharme, B., Colin, J., and Delire, C.: Assessing the Impact of Climate Change on Global Wetland Extent using CMIP6 multi-model analysis., EGU General Assembly 2024, Vienna, Austria, 14–19 Apr 2024, EGU24-11522, https://doi.org/10.5194/egusphere-egu24-11522, 2024.

EGU24-11627 | ECS | Orals | HS2.5.1

Improving the representation of surface-groundwater and human-water interactions in a coupled surface-subsurface water model 

Yanchen Zheng, Gemma Coxon, Mostaquimur Rahman, Ross Woods, Saskia Salwey, and Doris Wendt

Groundwater is a vital component of the hydrologic cycle and also the largest human and ecosystem accessible freshwater storage, which plays an important role in many hydrological processes. However, in groundwater-dominated catchments where inter-catchment groundwater flow through subsurface flow pathways, most hydrological models lack explicit representations of these transboundary surface-subsurface interactions, resulting poor performance in hydrological predictions. Additional complexity introduced by intense groundwater abstractions and management schemes are also poorly represented in current hydrological models, which hinders accurate hydrological simulations. Therefore, developing integrated modelling frameworks for simulating the interactions between surface water, groundwater and human influences is needed for accurate hydrological predictions in these regions.

DECIPHeR is a flexible hydrological modelling framework, which has demonstrated its good performance across a diverse range of catchments in Great Britain. However, in groundwater-dominated catchments, enhancements are needed in representing surface-subsurface water interactions for better model performance. This study integrates a national-scale groundwater model into DECIPHeR. We will utilize observational hydro-meteorological data to calibrate and validate the coupled model across 475 catchments. Additionally, a large sample of groundwater level data (over 3000 sites) in England will be used to further evaluate the model. Initial tests show that the coupled model outperforms DECIPHeR in Chalk catchments and also performs well (KGE>0.6) in other geology. The coupled models enable the assessment of surface-groundwater impacts, facilitating the potential quantification of human-water interactions, i.e. groundwater abstractions, on hydrological simulations. This analysis aims to support effective water supply and demand management strategies across Great Britain by providing insights into the influence of surface-groundwater interactions on the hydrological system.

How to cite: Zheng, Y., Coxon, G., Rahman, M., Woods, R., Salwey, S., and Wendt, D.: Improving the representation of surface-groundwater and human-water interactions in a coupled surface-subsurface water model, EGU General Assembly 2024, Vienna, Austria, 14–19 Apr 2024, EGU24-11627, https://doi.org/10.5194/egusphere-egu24-11627, 2024.

EGU24-12547 | ECS | Orals | HS2.5.1

A Multi-Scale Scheme for Simulating Subsurface Dynamics in Land Surface Models using HydroBlocks 

Daniel Guyumus, Laura Torres-Rojas, Luiz Bacelar, and Nathaniel Chaney

Over recent years, considerable advances have been made in Land Surface Models (LSM) to enhance the representation of small-scale heterogeneity while maintaining reasonable computational efficiency. Such is the case of HydroBlocks, which employs fine-scale clustering to define Hydrologic Response Units (HRUs) or tiles as its core modeling element. These innovations have facilitated a better representation of water and energy balances over large-scale domains by capturing local dynamics and their signature over continental processes.

While the benefits of these advances are substantial, there is still a growing need to understand surface and subsurface dynamics under these novel approaches. In our current study, we propose a novel multi-scale scheme designed to capture subsurface interactions within an LSM. This approach builds upon the abstraction introduced in HydroBlocks and addresses the lateral contributions of soil columns for local, intermediate, and regional subsurface flows. Importantly, this is achieved without compromising the computational efficiency of the already efficient HydroBlocks model. Our approach enables us to capture complex fine-scale interactions between surface and subsurface hydrological processes over continental extents, potentially providing insights that traditional models cannot achieve.

To implement this, we decompose the domain into regional units and compute the subsurface flux exchange, efficiently updating the one-dimensional vertical solution of Richard’s equation within the LSM. A convergence analysis is performed by comparing the efficiency of our framework to that of the quasi-fully distributed solution. The methodology has been tested within a 1.0°x1.0° domain in the United States to evaluate its performance. The inclusion of intermediate and regional groundwater representation led to significant shifts in soil moisture redistribution and streamflow patterns. Notably, we uncover regional water flow patterns from ridges to valleys, often underrepresented in the traditional model. Additionally, we explore the impact of spatial scale on water redistribution, offering profound insights into the uncertainties associated with groundwater structure and its influence on surface fluxes.

Our findings reveal that the multi-scale scheme converges towards a quasi-fully distributed solution for the LSM HydroBlocks emphasizing the efficacy of our method in achieving a comprehensive representation of subsurface dynamics while maintaining computational cost.

How to cite: Guyumus, D., Torres-Rojas, L., Bacelar, L., and Chaney, N.: A Multi-Scale Scheme for Simulating Subsurface Dynamics in Land Surface Models using HydroBlocks, EGU General Assembly 2024, Vienna, Austria, 14–19 Apr 2024, EGU24-12547, https://doi.org/10.5194/egusphere-egu24-12547, 2024.

EGU24-12603 | Orals | HS2.5.1

How do precipitation trends propagate through the terrestrial water cycle? 

Ruth Stephan, Josephin Kroll, and Rene Orth

Climate Change involves changes in precipitation. The propagation of precipitation changes into the water cycle is complex and dependent on e.g. aridity and land cover which are themselves affected by climate change. As a result, estimating effects on water fluxes such as evaporation and runoff as well as water resources such as soil moisture is not straightforward. This study maps future changes in the seasonal cycle of precipitation across the globe, as projected by Earth system models from the Coupled Model Intercomparison Project Phase 6 (CMIP6). Additionally, we analyse the propagation of the detected seasonal precipitation surpluses and deficits into the water cycle, and determine the main underlying controls. For this purpose we determine and compare seasonal changes in precipitation, evapotranspiration, runoff and soil moisture across the next decades. While this yields a first indication of the propagation of increasing or decreasing precipitation, we furthermore calculate correlations between the considered variables in each decade as an independent measure of the relation between precipitation and the water cycle components. In this context we use partial correlations to better separate water cycle couplings from the impact of other meteorological forcings such as radiation. A particular focus of our analysis will be on uncertainties of (i) precipitation trends and (ii) their projected propagation into the water cycle across the CMIP6 model ensemble to distinguish robust patterns from areas with high uncertainties. Our analysis helps to understand changes in future water fluxes and resources and the underlying robustness, which can inform the development of Earth system models as well as water resources management.

How to cite: Stephan, R., Kroll, J., and Orth, R.: How do precipitation trends propagate through the terrestrial water cycle?, EGU General Assembly 2024, Vienna, Austria, 14–19 Apr 2024, EGU24-12603, https://doi.org/10.5194/egusphere-egu24-12603, 2024.

EGU24-12724 | ECS | Posters on site | HS2.5.1

Influence of soil depth on global high-resolution LISFLOOD model experiments 

Laura Jensen, Robert Dill, Julian Haas, Henryk Dobslaw, Stefania Grimaldi, and Peter Salamon

The global hydrological model LISFLOOD (https://ec-jrc.github.io/lisflood/) is in operational use for, e.g., the Global Flood Awareness System (GloFAS) of the Copernicus Emergency Management Service. Due to its continuous development and open source availability, it is also a valuable tool for other geoscientific applications, like the assessment of terrestrial water storage (TWS) variations that can be also observed with geodetic techniques. Since TWS is understood as the sum of all hydrological storages from the surface to the deepest aquifers, it is sensitive to various aspects of the terrestrial water cycle, including surface water dynamics, soil infiltration, and groundwater flow. The current global configuration of LISFLOOD (GloFAS v4.0) has a spatial resolution of 0.05° (~5km), and utilizes a set of implementation maps that is based on various remote sensing products describing morphological conditions, soil physics, and land use characteristics.

Here we investigate the influence of the soil depth parameterization on the LISFLOOD model results. We perform different model runs (for the time period 2000 – 2022) by exchanging the input soil depth map, and evaluate modeled discharge and TWS on different time scales (long-term trend, interannual and subseasonal signal) against observations. As a reference for TWS we use satellite gravimetry data from the Gravity Recovery and Climate Experiment (GRACE) and its follow-on mission (GRACE-FO), which provides monthly global maps of TWS since 2002. Due to the relatively coarse resolution of the GRACE/-FO observation method, we perform the comparison at basin scale for some of the World’s largest river basins. Discharge is compared with data from gauging stations at the corresponding model grid cells.

Results indicate an overall good match between modelled and satellite based TWS. Furthermore, we demonstrate the significant impact of soil depth on TWS simulations. When running the model with the standard soil map, long-term trends and interannual signals deviate from observations more strongly compared to using an adjusted soil map which is limited by the water table depth. Such findings may be valuable also for the parameterization of other hydrological models.

How to cite: Jensen, L., Dill, R., Haas, J., Dobslaw, H., Grimaldi, S., and Salamon, P.: Influence of soil depth on global high-resolution LISFLOOD model experiments, EGU General Assembly 2024, Vienna, Austria, 14–19 Apr 2024, EGU24-12724, https://doi.org/10.5194/egusphere-egu24-12724, 2024.

EGU24-12903 | ECS | Posters on site | HS2.5.1

Global 30 arcsecond PCR-GLOBWB: Challenges and Opportunities.  

Barry van Jaarsveld, Frances Dunn, Edwin H. Sutanudjaja, Joren Janzing, Rens L.P.H. van Beek, Bram Droppers, Marc F. P. Bierkens, and Niko Wanders

Land surface characteristics play an important role in shaping hydrological response and groundwater-surface water interactions. It is therefore paramount to model the terrestrial hydrological at cycle spatial resolutions which incorporate appropriate land surface heterogeneities.

Our objective is to enable modelling of the global terrestrial hydrological cycle at very high spatial resolution. As a first step towards this goal, we present the first global application of PCR-GLOBWB at 30 arcseconds (~1 km) resolution. In this global 30 arcseconds PCR-GLOBWB model we implement  a new statistical downscaling routine for meteorological forcing that relies on CHELSA high resolution climatologies to provide an improved spatial distributions of precipitation, temperature and reference evapotranspiration. To better capture snow and ice dynamics, we have embedded an improved snow and ice distribution scheme, which is critital for high mountain regions. Finally, we improve on the method of parralisation used when running the model at a global scale to overcome computational limitations.

We simulated the global terrestrial hydrological cycle from 1985 – 2019 at the daily timestep and validate simulated river discharge, evaporation, total water storage anomalies and snow cover against observed data. The model outputs are also compared to previous more coarse scale global PCR-GLOBWB model at 5 arcminute and 30 arcminute resolutions as well as simulations with the lower resolution meteorological forcing to separately quantify the impact of increasing the spatial resolution in the land surface and meteorological forcing. Furthermore, we discuss the computational challenges encountered along the way and outline future directions and opportunities in high-resolution global hydrological modelling.

How to cite: van Jaarsveld, B., Dunn, F., Sutanudjaja, E. H., Janzing, J., van Beek, R. L. P. H., Droppers, B., Bierkens, M. F. P., and Wanders, N.: Global 30 arcsecond PCR-GLOBWB: Challenges and Opportunities. , EGU General Assembly 2024, Vienna, Austria, 14–19 Apr 2024, EGU24-12903, https://doi.org/10.5194/egusphere-egu24-12903, 2024.

EGU24-12960 | ECS | Posters on site | HS2.5.1

CMIP6 multi-model estimation of non-renewable groundwater abstractions during the 21st century 

Maya Costantini, Bertrand Decharme, and Jeanne Colin

The global water resource is composed of all the exploitable freshwater on Earth and is mainly stored in groundwater, which accounts for approximately one-third of the human freshwater withdrawals. One of the main indicators of groundwater water availability is its recharge (water flux entering groundwater). Indeed, knowledge of groundwater recharge dynamics is crucial to estimate the amount of water that can be withdrawn without depleting its reserves over the long term (renewable abstractions). Whether alone or combined with climate change, groundwater withdrawals can lead to non-renewable abstractions, increasing the risks of water scarcity and food insecurity in some regions.

Here, the current and future non-renewable groundwater abstractions are estimated using climate-driven projections of groundwater recharge from an ensemble of 22 fully coupled global climate models participating in the CMIP6 exercise (without representation of groundwater withdrawals), and projections of irrigation water withdrawals from hydrological models. The projections cover the 1970-2100 period and follow three of the latest IPCC scenarios of greenhouse gas future evolution. Results show non-renewable groundwater abstractions for irrigation in heavily irrigated or arid regions. Despite an increase in global groundwater recharge due to climate change, this evolution is not uniform and presents large regional disparities. In addition, the number and size of the regions with non-renewable groundwater abstractions increase with climate change. These results are put in perspective with current agricultural production maps for the main cereals (data from FAO). This analysis highlights that regions experiencing the strongest non-renewable groundwater abstractions supply a large part of the world agricultural production.

How to cite: Costantini, M., Decharme, B., and Colin, J.: CMIP6 multi-model estimation of non-renewable groundwater abstractions during the 21st century, EGU General Assembly 2024, Vienna, Austria, 14–19 Apr 2024, EGU24-12960, https://doi.org/10.5194/egusphere-egu24-12960, 2024.

EGU24-13069 | ECS | Posters on site | HS2.5.1

Cities and global hydrological models the next frontier 

Tijana Jovanovic and Andrew Hughes

Global Hydrological Models (GHMs) are now being used to evaluate freshwater availability for water supply and estimate competition between sectors (municipal, agricultural, industrial water withdrawals, etc.) under the projected population increase and climate change. While becoming more complex and versatile GHMs are still fundamentally undervaluing cities. Over past decades, urban hydrological research has documented numerous changes to hydrological cycle beyond faster and flashier hydrographs. Cities alter rainfall patterns, create subsurface preferential pathways, so-called urban karst, can increase local recharge, to name a few. By using global datasets on water withdrawals, cities, permeability, and non-revenue water we show how current conceptualization of cities within GHMs could be improved to account for key urban complexities at scale. We identify regions where such improvement should be implemented and call for the creation of urban global hydrological modelling community, a community which will help to evaluate local model performance and creation of fundamental urban global datasets.     

How to cite: Jovanovic, T. and Hughes, A.: Cities and global hydrological models the next frontier, EGU General Assembly 2024, Vienna, Austria, 14–19 Apr 2024, EGU24-13069, https://doi.org/10.5194/egusphere-egu24-13069, 2024.

EGU24-13154 | Orals | HS2.5.1

Integrated surface–subsurface hydrological modeling for the assessment of groundwater recharge in the Venetian high plain, Italy 

Matteo Camporese, Beatrice Gatto, Davide Furlanetto, Tommaso Trentin, and Paolo Salandin

Groundwater accounts for almost 99% of the available liquid freshwater present on Earth and it is the main source of drinking water. It is recharged not only by rainwater (including losing streams) and snowmelt, but also by infiltration of water used for irrigation. In this study, CATHY (CATchment Hydrology), an integrated surface–subsurface hydrological model (ISSHM), is used to quantify current and future recharge fluxes in the Venetian high plain between the Brenta and Piave Rivers. This area, with a size of around 900 km2, represents an important source of drinking water supply for the Veneto region, Northeast Italy. In compliance with European directive indications, to decrease water withdrawals from the Piave River and preserve its ecological flow, the irrigation management must be reviewed. First, we calibrated CATHY through a combination of FePEST and the Shuffled Complex Evolution algorithm, whereby both the bottom of the unconfined aquifer and the hydraulic conductivity field were estimated. After validation, the model was used to simulate a scenario in which the flood irrigation method, currently the most widespread in the study area, is fully replaced by sprinkler irrigation. The results show that in response to a 50% decrease in water abstraction from the Piave River, the total recharge decreases by about 10%, with a local decrease in the groundwater level, mainly limited to wells located in areas directly affected by the change in irrigation technique and where hydraulic conductivity is higher. Overall, this work demonstrates that ISSHMs are capable of reproducing groundwater dynamics and its drivers at high resolution and regional scales, representing useful tools to investigate possible responses of hydrosystems to future land use and climate change.

How to cite: Camporese, M., Gatto, B., Furlanetto, D., Trentin, T., and Salandin, P.: Integrated surface–subsurface hydrological modeling for the assessment of groundwater recharge in the Venetian high plain, Italy, EGU General Assembly 2024, Vienna, Austria, 14–19 Apr 2024, EGU24-13154, https://doi.org/10.5194/egusphere-egu24-13154, 2024.

EGU24-13287 | ECS | Orals | HS2.5.1

From Field to Flow: Assessing River-Aquifer Dynamics in Tropical Regions with In-Situ Dataset Insights 

José Gescilam Sousa Mota Uchôa, Paulo Tarso S. Oliveira, André S. Ballarin, André Almagro, Antônio A. Meira Neto, Didier Gastmans, Scott Jasechko, Ying Fan, and Edson C. Wendland

In recent years, the scientific community has directed significant attention towards understanding river-aquifer interactions due to their pivotal role in hydrological and biogeochemical processes with implications for solving diverse engineering challenges. Despite the growing focus on these interactions, most studies remain confined to local scales, hindering their incorporation into comprehensive continental-scale water resources management. Addressing this gap, our study pioneers the empirical verification of river-aquifer flow directions (characterizing losing or gaining rivers) in a tropical context. We leveraged an extensive database comprising approximately 150 thousand wells spanning the entirety of Brazil, and we developed empirical power equations using data from around 500 river gauge stations to estimate river water levels under low-flow conditions. To ascertain the flow direction of river-aquifer interactions, we compared hydraulic gradients between groundwater levels of wells and their nearest rivers. A river was classified as losing when its water levels were above those of neighboring wells, indicating potential water loss to underlying aquifers. Stringent connectivity criteria were applied, including a maximum distance of 1 km between wells and rivers, well depth not exceeding 100 meters, and exclusion of wells in confined aquifers. Our study conducted systematic robustness checks, exploring the sensitivity of the data to chosen time intervals, variations in river water levels under low-flow conditions, and the inclusion of confined aquifers. Our findings reveal that more than half of Brazilian rivers are prone to losing water to underlying aquifers. The results underscore the significance of our in-situ data-driven methodology, indicating that losing rivers, widespread throughout Brazilian territory, may serve as potential points of groundwater contamination. Particularly crucial in tropical regions with elevated organic matter input into rivers, given the inadequate wastewater treatment. The findings emphasize the critical necessity of analyzing river-aquifer interactions for effective water resource management on both local and continental scales.

How to cite: Sousa Mota Uchôa, J. G., Tarso S. Oliveira, P., S. Ballarin, A., Almagro, A., A. Meira Neto, A., Gastmans, D., Jasechko, S., Fan, Y., and C. Wendland, E.: From Field to Flow: Assessing River-Aquifer Dynamics in Tropical Regions with In-Situ Dataset Insights, EGU General Assembly 2024, Vienna, Austria, 14–19 Apr 2024, EGU24-13287, https://doi.org/10.5194/egusphere-egu24-13287, 2024.

EGU24-13728 | ECS | Posters virtual | HS2.5.1

Characterizing uncertainty in sea level rise from 900 future groundwater depletion scenarios 

Jacob Wessel, Jonathan Lamontagne, and Andrew Kemp

Sea level change is driven by numerous processes which vary across scales both spatially and temporally. Data-driven model abstractions for the natural and anthropogenic processes governing sea level are used to make future sea level projections through the remainder of the 21st century and beyond, both globally and by region. In addition to the primary drivers of sea level rise (mass loss of terrestrial ice and thermal expansion of seawater), changes in terrestrial water storage, namely groundwater extraction and reservoir impoundment, have also been identified as contributors. Uncertainty surrounding future projections of groundwater depletion and its implications on global and relative sea level have thus far been inadequately characterized and underexplored, and rely on a small number of studies based on simple methods with little or no scenario dependence or spatial variability. We use a 900-member large ensemble of basin-level groundwater depletion simulations through 2100 from a global integrated assessment model to explore a wide outcome space of groundwater futures and characterize their critical drivers from among six systematically varied inputs: socioeconomics (SSPs), climate forcing (RCPs), climate model (GCM), groundwater availability, surface water storage, and hydrological model. The large ensemble of simulations enables a more robust discussion of uncertainty and scenario dependence than previously available. We find the median global mean sea level (GMSL) rise by 2100 due to groundwater depletion in our model ensemble to be 83 (17-205) mm. We also find that the greatest concentrations of groundwater depletions take place in the Western US, the Nile Basin, the Middle East, and Central and South Asia, though the correlation between basins can vary widely. This basin-level dataset also enables sea level fingerprinting to assess the spatially variable effects of groundwater depletion on relative sea level (RSL). Uncertainty in this fingerprinting can then be compared with the uncertainty bounds traced by the large ensemble of model runs.

How to cite: Wessel, J., Lamontagne, J., and Kemp, A.: Characterizing uncertainty in sea level rise from 900 future groundwater depletion scenarios, EGU General Assembly 2024, Vienna, Austria, 14–19 Apr 2024, EGU24-13728, https://doi.org/10.5194/egusphere-egu24-13728, 2024.

EGU24-15217 | ECS | Orals | HS2.5.1

Potential Groundwater Recharge at the Scale of France:  Characterization and Future Trends in the Context of Climate Change 

Olivier Robelin, Sandra Lanini, Yvan Caballero, and Éric Sauquet

The quantification of present and future groundwater resources at regional scale is necessary for the implementation of national climate change adaptation plans. We present a method to compute the potential groundwater recharge (PGR) by precipitation applied specifically to the scale of France.

A simple water balance approach taking into account the maximum soil water content capacity and the land use is first applied to derive the effective rainfall estimation from the SAFRAN national meteorological reanalysis. The BaseFlow Index (BFI) computed over 611 French river basins with minor human influence on discharge is then used to assess the effective rainfall infiltration ratio for watershed with homogeneous geological lithologies. This infiltration ratio is finally applied to convert effective rainfall into potential recharge at the scale of each groundwater body in France.

A sensitivity analysis of BFI (to the automated BF separation method, the length of discharge time series, etc.) was performed. The low annual variability and uncertainty on BFI estimates allow us to consider, as an initial approximation, that the infiltration ratio remains constant over time.

To validate this global approach, in the framework of the Explore2 project, we compared computed effective rainfall and potential recharge with alternative potential recharge estimates simulated by a set of hydrological models under current condition (1976-2005). Previous computed variables have been compared with SURFEX physical surface model solving energy balance over the entire re-analysis (1958-2020). Additionally, we used Euro-Cordex climatic projections as input of our model to evaluate the future potential groundwater recharge (2021-2100). Future evolution of potential recharge shows contrasting situations between the North and the South of France which were not highlighted by previous assessments.

How to cite: Robelin, O., Lanini, S., Caballero, Y., and Sauquet, É.: Potential Groundwater Recharge at the Scale of France:  Characterization and Future Trends in the Context of Climate Change, EGU General Assembly 2024, Vienna, Austria, 14–19 Apr 2024, EGU24-15217, https://doi.org/10.5194/egusphere-egu24-15217, 2024.

EGU24-15359 | ECS | Posters on site | HS2.5.1

GLEAM4: Improving global terrestrial evaporation estimates with hybrid modelling  

Olivier Bonte, Diego G. Miralles, Akash Koppa, Oscar M. Baez-Villanueva, Emma Tronquo, Feng Zhong, Petra Hulsman, Hylke Beck, Wouter Dorigo, and Niko E.C. Verhoest

Terrestrial evaporation (E) is a keystone flux linking water, energy and carbon cycles. Consequently, monitoring of E at high temporal and spatial resolution over an extended period is crucial to diagnose climate change and its influence on the acceleration of the global hydrological cycle. As E cannot be directly observed from space, a modelling approach is required to derive E  from global, observational remote sensing and meteorological datasets1. The array of available approaches ranges from purely data-driven E retrievals2 to physically-based estimates from traditional land surface models.

In this presentation, we introduce the fourth version of the Global Land Evaporation Amsterdam Model (GLEAM), a hybrid evaporation model that harnesses the synergy between process-based modelling and machine learning. The conceptual backbone of the model, a soil–vegetation water balance module, is updated from earlier GLEAM versions with new representations of interception loss3, plant access to groundwater4 and potential evaporation. Additionally, earlier empirical evaporative stress functions are replaced by deep neural networks trained on eddy-covariance and sapflow data to better represent the complex physiological response of vegetation to multiple environmental stressors5. Future research directions include the increase in temporal resolution to sub-daily and the training of the stress functions in an end-to-end differentiable modelling framework6.

GLEAM4 continuous, daily datasets at 0.1° spatial resolution covering the period 1980–2023 — including evaporation and its components, soil moisture, potential evaporation and evaporative stress estimates — will be openly available via www.gleam.eu upon publication.


References

1Fisher, J. B., et al., The future of evapotranspiration: Global requirements for ecosystem functioning, carbon and climate feedbacks, agricultural management, and water resources, Water Resour. Res., 53, 2618–2626, 2017, https://doi.org/0.1002/2016WR020175.

2 Jung, M., Koirala, S., Weber, U. et al. The FLUXCOM ensemble of global land-atmosphere energy fluxes, Sci. Data, 6, 74, 2019, https://doi.org/10.1038/s41597-019-0076-8

3Zhong, F., Jiang, S., van Dijk, A. I. J. M., Ren, L., Schellekens, J., and Miralles, D. G.: Revisiting large-scale interception patterns constrained by a synthesis of global experimental data, Hydrol. Earth Syst. Sci., 26, 5647–5667, 2022, https://doi.org/10.5194/hess-26-5647-2022

4Hulsman, P., Keune, J., Koppa, A., Schellekens, J., & Miralles, D. G., Incorporating plant access to groundwater in existing global, satellite-based evaporation estimates, Water Resour. Res., 59, e2022WR033731, 2023, https://doi.org/10.1029/2022WR033731

5Koppa, A., Rains, D., Hulsman, P. et al., A deep learning-based hybrid model of global terrestrial evaporation, Nat. Commun., 13, 1912, 2022, https://doi.org/10.1038/s41467-022-29543-7

6Shen, C., Appling, A.P., Gentine, P. et al., Differentiable modelling to unify machine learning and physical models for geosciences, Nat. Rev. Earth. Environ., 4, 552–567, 2023, https://doi.org/10.1038/s43017-023-00450-9

How to cite: Bonte, O., Miralles, D. G., Koppa, A., Baez-Villanueva, O. M., Tronquo, E., Zhong, F., Hulsman, P., Beck, H., Dorigo, W., and Verhoest, N. E. C.: GLEAM4: Improving global terrestrial evaporation estimates with hybrid modelling , EGU General Assembly 2024, Vienna, Austria, 14–19 Apr 2024, EGU24-15359, https://doi.org/10.5194/egusphere-egu24-15359, 2024.

EGU24-15685 | ECS | Posters virtual | HS2.5.1

River Temperature Gradients from Foreland to High-Mountain Environments 

Taylor Smith and Bodo Bookhagen

Temperature lapse rates are a key parameter describing how topography influences surface temperatures along elevation gradients. These rates have long been used to estimate ambient temperatures in unmonitored regions, as well as in climate and ecosystem modeling. In this work, we extend the concept of a lapse rate to alpine and peri-alpine rivers to examine variability in downstream temperature changes over steep mountains and their foreland areas.

Rivers in the Himalaya vary from glaciated to rain-fed, and have a large east-west gradient in water source, with the western regions receiving far more winter snowfall and the eastern regions monsoonal rain. Over the past decades, there has been an extreme build-up of hydropower, irrigation, and groundwater pumping infrastructure in the region, which has drastically altered the way water moves through the landscape; there remain, however, significant unmanaged and high-altitude catchments throughout the Himalaya. By comparing these diverse river reaches, we aim to decipher the role of both climate and anthropogenic influence in driving river temperature gradients at the regional scale.

Using Landsat data from 1983-2023, we first quantify how quickly temperatures change through different segments of rivers in varied geomorphic settings. We then further examine whether those downstream temperature change rates are constant through time or have shifted over the past decades, and to what degree anthropogenic influences (e.g., dams, irrigation) have changed these rates. We find that climate patterns – e.g., summer vs winter precipitation – play a strong role in controlling the rate of river temperature change along stream. We further note distinct spatial patterns in the rate of change (1983-2023), with strong differences in temperature trends between high- and low-elevation river reaches.

How to cite: Smith, T. and Bookhagen, B.: River Temperature Gradients from Foreland to High-Mountain Environments, EGU General Assembly 2024, Vienna, Austria, 14–19 Apr 2024, EGU24-15685, https://doi.org/10.5194/egusphere-egu24-15685, 2024.

EGU24-16487 | ECS | Posters on site | HS2.5.1

Routing climate model runoff from CMIP6 to project future changes in global river discharge 

Pauline Seubert, Stephan Thober, Dominik Schumacher, Sonia I. Seneviratne, and Lukas Gudmundsson

Hydrological extreme events are expected to change in frequency and magnitude due to anthropogenic climate change. Climate impact studies investigating effects on floods and hydrological droughts require knowledge on discharge along river networks. However, global climate models (GCMs) focus on runoff at the grid cell level, have only a coarse resolution, and typically address runoff routing externally. To bridge this gap, atmospheric data (e.g., precipitation, temperature) from GCMs are fed into global hydrology models (GHMs). While this approach can benefit from the additional detail of GHMs, which are dedicated to resolve the terrestrial water balance, it can only consider a limited number of GCM projections. This implies that the substantial spread imposed by both GCM uncertainty and internal climate variability may be underestimated. To overcome this limitation, we route daily runoff from multiple models contributing to the 6th phase of the Coupled Model Intercomparison Project (CMIP6) along the river network. For this we use the multiscale routing model mRM which can be flexibly adapted on a range of spatial scales by deriving an upscaled river network from high-resolution morphological data. The fidelity of the considered modelling chain is carefully evaluated in light of the underlying assumptions and the scale mismatch between the spatial resolution of the GCMs and the routing model. The new global discharge projections are used to explore the effects of anthropogenic climate change on mean and extreme river flow considering the uncertainty imposed by models contributing to the CMIP6 archive.

How to cite: Seubert, P., Thober, S., Schumacher, D., Seneviratne, S. I., and Gudmundsson, L.: Routing climate model runoff from CMIP6 to project future changes in global river discharge, EGU General Assembly 2024, Vienna, Austria, 14–19 Apr 2024, EGU24-16487, https://doi.org/10.5194/egusphere-egu24-16487, 2024.

EGU24-16541 | ECS | Orals | HS2.5.1

Exploring the utility of GRACE measurements for characterizing large regional karst systems 

Chibuike Orazulike, Andreas Hartmann, Julian Xanke, and Zhao Chen

In the face of climate change and human activities, Groundwater Storage (GWS) in karst aquifers of the Euro-Mediterranean region has experienced a significant decline, particularly across 60-80 percent of its terrain. We undertook a spatiotemporal characterization of karst aquifer dynamics in this region by integrating satellite observations (GRACE) and the process-based model VarKarst that simulates potential groundwater recharge in karst terrain. Utilizing the GLDAS and ERA5-Land datasets, we independently obtained Groundwater Storage Anomalies (GWSA) and Subsurface Water Storage Anomalies (SWSA) by decomposing the terrestrial water storage anomaly (TWSA) detected by GRACE. GWSA focuses explicitly on the saturated part of aquifers, while SWSA considers both the saturated and unsaturated parts. This approach is adopted to better understand the role of soil and epikarst in the groundwater recharge processes in large karst regions. Comparisons of GRACE-derived GWSA and the potential groundwater recharge calculated by the model VarKarst for the period 2002-2019 revealed the steepest GWS declines in the polar(tundra) climate zone of the Alpine region. Recharge trends were mixed, with the strongest decline in polar climates (-3.0mm/year) linked to rising temperatures (evapotranspiration). Incorporating gridded sectoral water withdrawal information is imperative for interpreting the observed spatial patterns of GWSA/SWSA. The temperate climate zones show a strong correlation between SWSA and lagged recharge, which should be due to the flow-regulating role of soil/epikarst. In addition, the current study incorporates spring discharge data from selected karst catchments to evaluate the previous analysis. Spatial scale limitations were identified for small karst catchments, as evidenced by poor correlations with spring discharge, while larger karst catchments show stronger correlations. This research highlights the importance of considering groundwater recharge processes and the epikarst dynamics when using GRACE data to assess regional karst hydrogeology. Such an integrated method will provide a clearer picture of the impacts on GWS under current climatic and anthropogenic stressors.

How to cite: Orazulike, C., Hartmann, A., Xanke, J., and Chen, Z.: Exploring the utility of GRACE measurements for characterizing large regional karst systems, EGU General Assembly 2024, Vienna, Austria, 14–19 Apr 2024, EGU24-16541, https://doi.org/10.5194/egusphere-egu24-16541, 2024.

EGU24-16699 | ECS | Posters on site | HS2.5.1

A top-down modeling approach to assess regional scale groundwater vulnerability: a case study for Berlin-Brandenburg 

Márk Somogyvári, Fabio Brill, Michael Tsypin, and Tobias Krueger

Regional scale groundwater vulnerability models are urgently needed to cope with the challenges presented by climate change. Traditional modeling approaches in hydrology and hydrogeology however often require detailed process understanding, and geological information to reliably simulate the hydrological system. In this study we present an alternative, top-down model development framework, starting from the big picture of the hydrology of the region, then focusing on the smaller details and complexities in a gradual way.

Groundwater vulnerability of the Brandenburg region is assessed by investigating the response of the groundwater table to different weather patterns. In order to achieve this a regional dataset for Brandenburg is prepared, using monthly groundwater and surface water data from the time period 1990-2022. This data is then reflected to weather timeseries taken from the Central European Refined analysis dataset, a gridded climate reanalysis dataset for the same time period. The datasets are aggregated on a subcatchment scale, which allows closing the water balance for the individual hydrological response units. Both water balance, linear regression and non-linear regression models are used with automatic calibration, because of the large number of modelled subcatchments.

Due to the big-data nature of the modeling approach, the interpretation of the results is also done in an automatized way. We delineate regions of different vulnerability characteristics by unsupervised methods based on their response dynamics. We also try to identify major turning points in the climatic water balance timeseries. The presented framework produces models that can be used towards deriving actionable insights for groundwater management.

How to cite: Somogyvári, M., Brill, F., Tsypin, M., and Krueger, T.: A top-down modeling approach to assess regional scale groundwater vulnerability: a case study for Berlin-Brandenburg, EGU General Assembly 2024, Vienna, Austria, 14–19 Apr 2024, EGU24-16699, https://doi.org/10.5194/egusphere-egu24-16699, 2024.

The GEMStat database, under the auspices of the UN Environment Programme and hosted by the GEMS/Water Data Centre at the International Centre for Water Resources and Global Change, currently holds over 29 million measurements for over 600 water quality parameters, from more than 18,000 stations in 91 countries and covering the time period from 1906 to 2023. The data is available via an online platform. Furthermore, the measurements under the GEMStat „open“ data policy are currently being compiled to be made available in an online repository.

The corresponding publication focusses on long-term timeseries, with continuous data records of at least 10 years, for the five parameter groups that can be included in submissions for the UN SDG 6.3.2 Level 1 indicator (acidification, nitrogen, oxygen, phosphorus, and salinity). The incentive behind this course of action is to support the use of modelling approaches for future data submission on the SDG 6.3.2 indicator.

Overall, 1,082 timeseries stations were identified providing data for at least one parameter group, with 2,904,185 data points in total. At most stations (405), data for four of the selected parameter groups are available, followed by stations where data on five parameter groups are available (285 stations). River stations make up the largest part of the stations (978 or 90%). In addition, lake stations (84 or 7.8%), groundwater stations (17 or 1.6%) and reservoir stations (3 or 0.3%) contribute to the total number of stations.

Timeseries length ranges from 10 to 114 years with a mean duration between 23.7 (Oxygen) and 30.5 years (Salinity).

The number of measurements per year ranges from 3 to 233, with a mean frequency between 9.4 (oxygen) and 14.1 (pH), indicating an overall tendency of monthly measurements for many timeseries.

Timeseries were also analyzed for significant trends in the data using prewhitened nonlinear trend analysis.

In total, 4,050 of 7,019 timeseries (57.70%) showed significant trends (p<0.05). The fraction of significant timeseries stations within a parameter group was highest for nitrogen (1,299 of 2,094 stations or 62.03%), followed by phosphorus (587 of 978 stations or 60.02%), acidification (546 of 914 stations or 59.74%), salinity (1,158 of 1,995 stations or 58.05%), and oxygen (460 of 1,038 stations or 44.32%).

The length of these timeseries together with the high sampling frequency predestines their application for model forcing in support of the SDG 6.3.2 indicator. Furthermore, this study looked at one fairly specific application of GEMStat timeseries data and more timeseries are available for other water quality parameters and could advance model development with a range of other foci. The additional trend analysis indicated potential effects of global change in more than 50% of the timeseries, highlighting regional hotspots for further in-depth analysis.

How to cite: Heinle, M., Saile, P., and Lisniak, D.: Long-term timeseries in the GEMStat Water Quality Database - temporal trends and potential for model forcing with a focus on the UN SDG 6.3.2 indicator., EGU General Assembly 2024, Vienna, Austria, 14–19 Apr 2024, EGU24-16817, https://doi.org/10.5194/egusphere-egu24-16817, 2024.

EGU24-17001 | Posters on site | HS2.5.1

Spatial partitioning of precipitation in the terrestrial water cycle and the role of dataset agreement 

Yannis Markonis, Mijael Rodrigo Vargas Godoy, Rajani Kumar Pradhan, Shailendra Pratap, Johanna Ruth Thompson, Martin Hanel, Athanasios Paschalis, Efthymios Nikolopoulos, and Simon Michael Papalexiou

The study of the water cycle at planetary scale is crucial for our understanding of large-scale climatic processes. There have been numerous studies that quantified the water cycle and its components, i.e., precipitation, evaporation, and runoff, over the land and the ocean. However, very little is known about how water fluxes are distributed across regions with different climatic or land properties. Here, we address this gap by providing robust estimates for terrestrial precipitation over a suite of land cover types, biomes, elevation zones, and precipitation intensity classes. We achieve this by estimating the mean annual precipitation of a 17-dataset ensemble between 2000 and 2019 at 0.25° spatial resolution. Our estimate of annual terrestrial precipitation is at approximately 114 000 ± 9 400 km3, with about 70% falling over one third of the grid cells, 80% over the 0 – 800 elevation zone, and two-thirds over forested regions. Our results also highlight that despite the current progress in the development of global scale data products there are still substantial uncertainties over the arid and/or high-elevation areas.  Bigger discrepancies appear within the reanalysis data products, while remote sensing estimates show a better agreement with the in-situ ground truth. These results help to detect regions of high observational fidelity and pave the way to further explore and improve observational uncertainties. At the same time, we provide consistent estimates that can be used for benchmarking the precipitation partition in the climate models, and most importantly that can be used to assess future changes in global precipitation.

How to cite: Markonis, Y., Vargas Godoy, M. R., Kumar Pradhan, R., Pratap, S., Thompson, J. R., Hanel, M., Paschalis, A., Nikolopoulos, E., and Papalexiou, S. M.: Spatial partitioning of precipitation in the terrestrial water cycle and the role of dataset agreement, EGU General Assembly 2024, Vienna, Austria, 14–19 Apr 2024, EGU24-17001, https://doi.org/10.5194/egusphere-egu24-17001, 2024.

EGU24-17637 | Orals | HS2.5.1

G3P v1.12: Advancements of a Global Groundwater Storage Anomaly Dataset from Satellite Gravimetry 

Julian Haas, Ehsan Sharifi, Wouter Dorigo, Adrian Jäggi, Claudia Ruz Vargas, Eva Boergens, Christoph Dahle, Henryk Dobslaw, Inés Dussaillant, Frank Flechtner, Elisabeth Lictevout, Miriam Kosmale, Kari Luojus, Torsten Mayer-Gürr, Ulrich Meyer, Frank Paul, Wolfgang Preimersberger, Sven Reißland, Michael Zemp, and Andreas Güntner

The Global Gravity-based Groundwater Product (G3P) has evolved with a new version (V1.12), bringing substantial enhancements to our satellite-based groundwater storage anomaly dataset—a prototype for a future product within the EU Copernicus Climate Change Service. Groundwater as the world's largest distributed freshwater storage, is a vital resource for human, industrial, and agricultural needs. Despite its significance, Copernicus lacks a service delivering operational, observation-based, and globally comprehensive data on changing groundwater resources. G3P could serve as a pivotal extension to the Copernicus portfolio. Leveraging the unique capabilities of GRACE and GRACE-FO satellite gravimetry, G3P monitors subsurface mass variations employing a mass balance approach. This involves subtracting the satellite-based and partly model-based water storage compartments (WSCs) snow water equivalent, root-zone soil moisture, glacier mass and surface water storage from GRACE/GRACE-FO monthly terrestrial water storage anomalies (TWSA). Ensuring a consistent subtraction of individual WSCs from GRACE-TWSA involves filtering them similarly to GRACE-TWSA, using filters whose type and parametrization had to be derived by spatial correlation analyses. The G3P dataset spans more than two decades (from 2002 to 2023) with a monthly resolution and global coverage at 0.5-degree spatial resolution. Notable updates in V1.12 compared to previous versions include an extended data time period until September 2023, modifications of the methodology of several WSCs, and the incorporation of new evaluation results.

This study has received funding from the European Union’s Horizon 2020 research and innovation programme for G3P (Global Gravity-based Groundwater Product) under grant agreement nº 870353.

How to cite: Haas, J., Sharifi, E., Dorigo, W., Jäggi, A., Ruz Vargas, C., Boergens, E., Dahle, C., Dobslaw, H., Dussaillant, I., Flechtner, F., Lictevout, E., Kosmale, M., Luojus, K., Mayer-Gürr, T., Meyer, U., Paul, F., Preimersberger, W., Reißland, S., Zemp, M., and Güntner, A.: G3P v1.12: Advancements of a Global Groundwater Storage Anomaly Dataset from Satellite Gravimetry, EGU General Assembly 2024, Vienna, Austria, 14–19 Apr 2024, EGU24-17637, https://doi.org/10.5194/egusphere-egu24-17637, 2024.

EGU24-18299 | ECS | Orals | HS2.5.1

Statistical analysis of global river streamflow regime changes and their alignment with trends in human drivers 

Vili Virkki, Reetik Kumar Sahu, Mikhail Smilovic, Josias Láng-Ritter, Miina Porkka, and Matti Kummu

Climate change, land cover change, water use, and flow regulation are driving river streamflow changes globally, and it is crucial to understand the varying contributions of these drivers to prevent and mitigate harmful impacts caused by streamflow alteration. However, previous, scenario-based approaches on this are notably uncertain and may miss interdependencies between different drivers. Here, to overcome these shortcomings, we use a large sample of observed streamflow data globally to quantify flow regime changes and align those against trends in precipitation, evapotranspiration, water use, and damming. With this study, we achieve unprecedented coverage and detail in analysing how varying streamflow regime changes may be linked to different drivers.

We queried the Global Streamflow Indices and Metadata (GSIM) database to yield 5,220 catchments across all continents (surface area greater than than 1,000 km2 and more than ten years of record available). Each catchment was assigned a flow regime change (FRC) class based on linear trends in four streamflow metrics: mean, standard deviation, high flows (95th percentile) and low flows (5th percentile). Within FRC classes, we further separated between catchments in which precipitation shows a decreasing or an increasing trend. Finally, within groups formed by FRCs and precipitation trends, we analysed linear trends in total evapotranspiration and water use, and increases in damming (by degree of regulation; DOR).

We find that shift down (mean, low, and high flows decreasing) and shrink (standard deviation and high flows decreasing, low flows increasing) are more common FRCs than shift up (mean, low, and high flows increasing) and expand (standard deviation and high flows increasing, low flows decreasing). Most commonly, precipitation trends are parallel to the FRC – decreasing in the shift down and shrink FRCs and increasing in the shift up and expand FRCs. This is more likely in FRCs describing a shift than in FRCs indicating a change in variability, which suggests that drivers beyond precipitation are more likely to exist in catchments that belong to the shrink and expand FRC classes. Water use trends are comparatively strong between shift down, shrink and expand FRCs but nearly nonexistent in the shift up FRC. The general direction of evapotranspiration trends agrees with precipitation trend direction in all four FRCs. When the FRC class and precipitation trend contradict (e.g. shift down FRC & increasing precipitation trend), we find that changes in water use and damming are often strong. Damming mostly affects streamflow by decreasing and homogenising flow because strongly increasing DOR is also associated with the shrink FRC but changes in DOR are minor within the shift up and expand FRCs 

Our global large-sample statistical insights agree with process-based understanding on how different human drivers affect streamflow, which provides a promising outlook on identifying the dominant drivers of streamflow change at large scales.

How to cite: Virkki, V., Sahu, R. K., Smilovic, M., Láng-Ritter, J., Porkka, M., and Kummu, M.: Statistical analysis of global river streamflow regime changes and their alignment with trends in human drivers, EGU General Assembly 2024, Vienna, Austria, 14–19 Apr 2024, EGU24-18299, https://doi.org/10.5194/egusphere-egu24-18299, 2024.

EGU24-18454 | ECS | Posters on site | HS2.5.1

Dynamic Mode Decomposition enables decoding dominant spatiotemporal structures in global scale hydrological datasets 

Giulia Libero, Daniel M. Tartakovsky, and Valentina Ciriello

As climate change and human activities impact water availability worldwide, a better understanding of large-scale hydrologic phenomena is crucial to identify and design appropriate strategies for adaptation and mitigation. While decoding the interactions and evolution of the climate, human activities, and the water cycle can ease the assessment and forecasting of water resource availability, the complexity, and the computational demand limit the feasibility of these analyses on a global scale. Data-driven techniques are often used to gain physical insights in global hydrological phenomena and build efficient and computationally efficient models for future state prediction. One such technique, dynamic mode decomposition (DMD), enables one to capture the hidden information embedded in large hydrological datasets. This data-driven and equation-free technique is suitable for identifying spatiotemporal features of both observational and simulated data. DMD performs a low-dimensional spectral decomposition of the data to obtain a reduced-order model of the system behavior directly from temporal snapshots. DMD provides low-cost reconstructions and predictions of the observed variable, and its structure contains information about the temporal and spatial patterns of the system evolution. It provides a set of spatial modes whose contribution evolves in time according to a specific time dynamic which defines the frequency, the growth rate, and a related amplitude. Trend and seasonal variations are identified, and a physically meaningful interpretation are sought for the most important modes. We test the ability of a suite of different DMD algorithms to model and interpret the 20-year-long series of monthly total water storage anomalies provided by the Gravity Recovery and Climate Experiment (GRACE) satellite missions. The scope is twofold: learn directly from satellite observations and build efficient DMD-based models to ease forecasts and reconstructions, and at the same time, unveil the system’s leading order behavior and derive insights on Earth’s water cycle evolution.

How to cite: Libero, G., Tartakovsky, D. M., and Ciriello, V.: Dynamic Mode Decomposition enables decoding dominant spatiotemporal structures in global scale hydrological datasets, EGU General Assembly 2024, Vienna, Austria, 14–19 Apr 2024, EGU24-18454, https://doi.org/10.5194/egusphere-egu24-18454, 2024.

EGU24-18846 | Posters on site | HS2.5.1

Unprecedented Aquifer Mapping of Arid Region, NW India for Groundwater Sustainability  

Virendra Tiwari, Subash Chandra, Sunil Ambast, and Team Ngri-cgwb

The Arid region, NW India spreads over the great Thar deserts, Precambrian of Aravalli’s, recent alluvium, Deccan basalts and so on, and inhabits ~ 80 million people. Freshwater resources in the region are scarce and contaminated at places, which threaten long term availability of water for agriculture, domestic, and environmental needs therefore, requires a good plan for groundwater exploration and the sustainable management of water resources. The subsurface hydrostratigraphy and conceptual models of the aquifer systems are crucial for developing a sustainable groundwater management plan in these challenging environments. Considering, the constraints of accessibility and traditional methods of aquifer mapping, state of art heliborne geophysical methods are utilized which are supplemented by ground TEM, EVRI, ERT, and drilling information to map subsurface hydrostratigraphy of about 100,000 sq. km area in the diverse geological terrains of the region. These extensive studies have provided 3D geophysical model of principal aquifer with delineation of de-saturated and saturated aquifers, and aquifer system with relatively fresh and saline water zones with unprecedented spatial resolution of a few hundred meter along the flight lines spaced at 2-5 kms. On the basis of information’s of geometries and properties of the aquifer systems, places for potential drilling wells and sites for managed aquifer recharge are demarcated which can enable better management plan for groundwater sustainability.

+ Team NGRI-CGWB


How to cite: Tiwari, V., Chandra, S., Ambast, S., and Ngri-cgwb, T.: Unprecedented Aquifer Mapping of Arid Region, NW India for Groundwater Sustainability , EGU General Assembly 2024, Vienna, Austria, 14–19 Apr 2024, EGU24-18846, https://doi.org/10.5194/egusphere-egu24-18846, 2024.

EGU24-19178 | ECS | Orals | HS2.5.1

Assessment of total water storage and other variables over the Indus, Ganga, and Brahmaputra River basins 

Mohit Yadav, Ashok Priyadarshan Dimri, Suraj Mal, and Pyarimohan Maharana

In the present study, assessment of the abating total water storage (TWS) in the three river basins viz Indus (IRB), Ganga (GRB), and Brahmaputra (BRB) and its associated changes in precipitation across the Indian Himalayan Region (IHR) are examined. Time lead and lag relationship among TWS and other contributory factors viz., precipitation, evaporation, runoff, snow water equivalent (SWE), soil moisture, groundwater, etc., are assessed. In the present study precipitation dataset and TWS available from Global Precipitation Measurement Mission (GPM) and Gravity Recovery and Climate Experiment (GRACE) is used respectively while other variables were extracted from ERA5. Mann-Kendall and Theil Sen estimator test is used for calculating trend of precipitation and TWS during different seasons (winter, pre-monsoon, monsoon, post-monsoon). Our study supports, there is a decreasing trend of TWS over the Indus Ganga Brahmaputra (IGB) basin, though all the basins are drying but slower during monsoon. IRB shows maximum decrease in TWS in postmonsoon whereas over GRB and BRB it is observed in premonsoon. In all seasons, heat flux distributions suggested drying, especially over the higher reaches of the IHR and certain areas of the IRB. The changes in temporal and spatial distribution of TWS over IRB indicate a rapid drop in monsoonal moisture flux. More evaporation and runoff during the monsoon season reduce the TWS process. Present work will be of utmost importance for the policy or planning for state-level governance for societal benefit.

How to cite: Yadav, M., Dimri, A. P., Mal, S., and Maharana, P.: Assessment of total water storage and other variables over the Indus, Ganga, and Brahmaputra River basins, EGU General Assembly 2024, Vienna, Austria, 14–19 Apr 2024, EGU24-19178, https://doi.org/10.5194/egusphere-egu24-19178, 2024.

EGU24-19489 | ECS | Orals | HS2.5.1

Reconstructing daily and seasonal surface water dynamics in Lake Chad with Global WaterPack Time Series  

Reeves Fokeng Meli, Felix Bachofer, Patrick Sogno, Igor Klein, Soner Üreyen, and Claudia Künzer

The Lake Chad is an endorheic lake in Sahelian Africa, with an extension to hyper arid areas. The lake basin is not exempt from global environmental changes which significantly affect fresh water resources across the globe. Despite a plethora of research on lake Chad, the daily and seasonal surface water dynamics is not clearly understood. This study probes to reconstruct the daily and seasonal surface water dynamics, change points and trends in lake Chad with a novel global daily surface water time series dataset (2003 – 2022). The key methods involved time series decomposition and filtering, trends analysis with Mann Kendall Tau and Sen’s Slope, and change point detection of abrupt shifts in daily and seasonal surface water time series. The results showed that lake Chad water depicts marked seasonal patterns. The maximum water area in all the pools is registered between the months of December – January and the inter-seasonal surface water area varies between ~1500 km2 to ~3800 - 4000 km2. On daily time scale, the southern pool shows high water area above 2400 km2 at the start and end of each year with the exception of drought years (2006 – 2017). For wet years (2004, 2018, 2019, 2020, 2021), surface water area between day 1 to around day 66, and 301 to 365/6 ranges between 2200km2 to about 2400km2. With the exception of extreme dry years, the water area between the rest of 67 – 300 days of the year is between 1600km2 – 2000km2. In contrast, the northern pool’s maximum water area ranges between 1600km2 to ~1700km2. With the exception of 2004, 2012, 2013, 2015, 2020 and 2021, the northern pool only fluctuates between ≤ 200km2 to ~800km2, which only stays for few days of the year. While surface water area coverage is quasi-stable across all seasons in the southern pool, the northern pool only has minimal water coverage from April to October yearly. Mean annual water coverage in lake Chad varied from 2953km2 to 3114km2 between 2004 and 2021 respectively. Meanwhile between 2005 – 2012 and 2016 – 2019, surface water area is below 2500km2. While the southern pool remains somewhat stable, the northern pool shows recovery and dwindling phases. Within the monitoring period, two abrupt changes were identified on the cycle of lake Chad, a decreasing trend between 2003 – 2012 (2275km2) and an increasing trend from 2013 to 2022 (2745km2), p = 0.000. In conclusion, the study found that lake Chad is slowly recovering as revealed by statistical trend analysis (Tau = 0.157, Sen’s slope = 0.0782 and p = 0.012), with an annual average increase of 28.543km2.

How to cite: Fokeng Meli, R., Bachofer, F., Sogno, P., Klein, I., Üreyen, S., and Künzer, C.: Reconstructing daily and seasonal surface water dynamics in Lake Chad with Global WaterPack Time Series , EGU General Assembly 2024, Vienna, Austria, 14–19 Apr 2024, EGU24-19489, https://doi.org/10.5194/egusphere-egu24-19489, 2024.

EGU24-19997 | ECS | Orals | HS2.5.1

First global estimation of bankfull river discharge 

Yinxue Liu, Michel Wortmann, Louise Slater, Laurence Hawker, Jeff Neal, Jiabo Yin, Richard Boothroyd, Solomon Gebrechorkos, Julian Leyland, Stephen Darby, Daniel Parsons, Helen Griffith, Hannah Cloke, Ellie Vahidi, Andrew Nicholas, Pauline Delorme, and Stuart McLelland

The accurate estimation of bankfull discharge (QBF) plays a central role in multiple disciplines including geomorphology, hydrology, and ecology. For example, bankfull discharge is an essential input in many large-scale flood models which are widely used in understanding flood risk across large scales. However, in the context of extremely limited bankfull discharge observations, these Global Flood Models (GFMs) typically assume that bankfull discharge has a spatially uniform recurrence interval, with a value of 1-2 years widely adopted. In reality, many studies have found that the recurrence of bankfull discharge is highly variable. Therefore, more reliable estimates of bankfull discharge that account for river variability across different regions and climate zones are vital. Here, we train a random forest model to estimate bankfull discharge from global datasets encompassing river catchment characteristics, river geometry, topography, reservoir capacity, hydrological and climate indicators, alongside a newly compiled bankfull discharge database with over two thousand observations. The trained machine learning model is then used to develop the first estimate of bankfull discharge for 22 million km of rivers globally, using a newly developed, high-resolution, multi-threaded river network, Global River Topology (GRIT, Wortmann et al., 2023). Independent testing against observed values of QBF shows that the random forest model has good performance (R2=0.79), and the estimated QBF has better accuracy compared to the use of uniform recurrence-interval flows. This is the first study to estimate bankfull discharge for rivers at the global scale. Our dataset aims to improve bankfull representation in large-scale flood modelling, and to support river and water resources research more generally.

Wortmann, M., Slater, L., Hawker, L., Liu, Y., & Neal, J. (2023). Global River Topology (GRIT) (0.4) [Data set]. Zenodo. 10.5281/zenodo.7629907

How to cite: Liu, Y., Wortmann, M., Slater, L., Hawker, L., Neal, J., Yin, J., Boothroyd, R., Gebrechorkos, S., Leyland, J., Darby, S., Parsons, D., Griffith, H., Cloke, H., Vahidi, E., Nicholas, A., Delorme, P., and McLelland, S.: First global estimation of bankfull river discharge, EGU General Assembly 2024, Vienna, Austria, 14–19 Apr 2024, EGU24-19997, https://doi.org/10.5194/egusphere-egu24-19997, 2024.

EGU24-19999 | Orals | HS2.5.1

45 years of global satellite soil moisture for hydrological and climate applications 

Wouter Dorigo, Pietro Stradiotti, Wolfgang Preimesberger, Alexander Gruber, Maud Formanek, Thomas Frederikse, Robin Van der Schalie, Nemesio Rodriguez-Fernandez, and Martin Hirschi

ESA CCI Soil Moisture (SM) is a long-term global Climate Data Record of water content stored in the surface soil layer, derived from satellite observations in the microwave domain. To make it suitable for long-term analyses in climate and hydrological applications, ESA CCI SM merges observations from a total of 19 satellite microwave radiometers and scatterometers into harmonized records covering a 45 year period (from 1978 onwards). Within the Copernicus Climate Change Service (C3S), the soil moisture data records are extended every ten days to provide input data for time-critical applications like monitoring or data assimilation.  

The data sets have been widely used to study the water, energy, and carbon cycles over land, understand land surface-atmosphere hydrological feedbacks, assess the impact of climate change on the occurrence of climatic extremes, and for the evaluation and improvement of model simulations. ESA CCI SM has been the main input for assessing global soil moisture conditions as presented in the BAMS “State of the Climate” reports for more than 10 years, while C3S has been used in the yearly “European State of the Climate” reports for several years now 

In this presentation we give an overview of the methodology and characteristics of the ESA CCI SM and C3S products with a focus on recent scientific developments, intended to make the data analysis-ready for climate and hydrological studies, such as filling spatial and temporal gaps, providing estimates of root-zone soil moisture, and making the dataset entirely independent of any model data. We show how both ESA CCI and C3S have been used in recent years to monitor dry and wet spells, and to gain deeper understanding of the Earth system. 

The development of ESA CCI and C3S SM has been supported by ESA’s Climate Change Initiative for Soil Moisture (Contract No. 4000104814/11/I-NB & 4000112226/14/I-NB) and the Copernicus Climate Change Service implemented by ECMWF through C3S 312a Lot 7 & C3S2 312a Lot 4 Soil Moisture. 

How to cite: Dorigo, W., Stradiotti, P., Preimesberger, W., Gruber, A., Formanek, M., Frederikse, T., Van der Schalie, R., Rodriguez-Fernandez, N., and Hirschi, M.: 45 years of global satellite soil moisture for hydrological and climate applications, EGU General Assembly 2024, Vienna, Austria, 14–19 Apr 2024, EGU24-19999, https://doi.org/10.5194/egusphere-egu24-19999, 2024.

EGU24-577 | ECS | PICO | HS2.5.3

evapoRe: An R-based application for exploratory data analysis of evapotranspiration  

Akbar Rahmati Ziveh, Mijael Rodrigo Vargas Godoy, Vishal Thakur, Johanna R. Thomson, Martin Hanel, and Yannis Markonis

Evapotranspiration (ET) is a key climate indicator closely related to the water, energy, and carbon cycles. ET datasets are produced using various methods, including satellite-based observations, hydrological models, and reanalysis. However, relying on a single ET product might lead to high uncertainty due to the spatio-temporal inhomogeneity of the dataset, highlighting the crucial need for multiple available options. evapoRe addresses the pressing issue of inhomogeneous ET datasets. This package (available at https://CRAN.R-project.org/package=evapoRe) is a pivotal tool in a landscape where diverse organizations and data providers implement varying criteria, resulting in inconsistent ET datasets. evapoRe facilitates the downloading, exploration, visualization, and analysis of ET data at monthly time step and 0.25 resolution (BESS v2.0, CAMELE, ERA5, ERA5-Land, GLEAM v3.7a, JRA-55, FLDAS, GLDAS-CLSM v2.1, GLDAS-NOAH v2.1, GLDAS-VIC v2.1, TerraClimate, MERRA-2, and ETMonitor). Further, with evapoRe, Potential ET (PET) can be calculated using temperature-based methods. In this way, evapoRe enhances ET and PET analysis by integrating diverse datasets, empowering researchers to understand water cycle change and refine models for predicting droughts and climate impacts, fundamentally advancing hydrological and climate science. 

How to cite: Rahmati Ziveh, A., Rodrigo Vargas Godoy, M., Thakur, V., R. Thomson, J., Hanel, M., and Markonis, Y.: evapoRe: An R-based application for exploratory data analysis of evapotranspiration , EGU General Assembly 2024, Vienna, Austria, 14–19 Apr 2024, EGU24-577, https://doi.org/10.5194/egusphere-egu24-577, 2024.

EGU24-917 | ECS | PICO | HS2.5.3 | Highlight

Multi-source analysis of recent changes in global terrestrial evapotranspiration 

Johanna Thomson and Yannis Markonis

With rising temperatures, we can expect significant changes in the terrestrial water cycle (TWC).  Evapotranspiration (ET) represents a significant component of the TWC, linking the water, energy, and carbon cycle of the land and atmosphere. Although recent reviews showed that ET has been increasing and even accelerating since the 1980s due to an increase in the LAI (Yang et al., 2023), some studies suggest that ET might be declining (Kim et al., 2021). So, is the increase of ET product dependent? Where in the world do we find disagreement?

We processed 13 global ET products derived from reanalysis, remote sensing, synthesis, and land surface models thereby representing a wide variety of available data. For 2000-2019, we analyzed the ET slope per grid (0.25 deg 0.25 deg), and meaningful regions including biomes, land cover classes, Koeppen-Geiger regions, elevation classes, evaporation quantiles, and IPCC reference regions. Using indices for dataset similitude and concurrence, we created probability maps, which allow us to pinpoint hotspots of uncertainty and regions with a high likelihood of change.

We confirm that ET has increased for 37 % of the terrestrial land from 2000-2019. However, the direction of change in ET for 36 % of the global land area was uncertain with various products showing significant (p > 0.05) negative and positive trends. The spatial distribution of uncertainty varies greatly spatially. For example, over 60% of the area of mangroves and tropical/subtropical moist broadleaf forests and over 40 % of the area of tropical/subtropical, flooded, and montane grass- and shrublands resulted in uncertain ET changes. Some IPCC reference regions (NWS, CAF, SAM, and NSA) resulted in over 70 % of the area in uncertain ET changes. This indicates that estimating changes in ET is still product dependent.

By pinpointing the regions in which the ET products disagree on the magnitude and direction of change, we can lay the ground for the further improvement of TWC estimates.  On the other hand, dataset consensus can help to increase the credibility of hydrological and climate model evaluations and attribution studies. Overall, there is an urgent need to further constrain ET.   


Kim, S., Anabalón, A., & Sharma, A. (2021). An Assessment of Concurrency in Evapotranspiration Trends across Multiple Global Datasets. Journal of Hydrometeorology, 22(1), 231–244. https://doi.org/10.1175/JHM-D-20-0059.1

Yang, Y., Roderick, M. L., Guo, H., Miralles, D. G., Zhang, L., Fatichi, S., Luo, X., Zhang, Y., McVicar, T. R., Tu, Z., Keenan, T. F., Fisher, J. B., Gan, R., Zhang, X., Piao, S., Zhang, B., & Yang, D. (2023). Evapotranspiration on a greening Earth. Nature Reviews Earth & Environment, 4(9), Article 9. https://doi.org/10.1038/s43017-023-00464-3

How to cite: Thomson, J. and Markonis, Y.: Multi-source analysis of recent changes in global terrestrial evapotranspiration, EGU General Assembly 2024, Vienna, Austria, 14–19 Apr 2024, EGU24-917, https://doi.org/10.5194/egusphere-egu24-917, 2024.

Efficient management of water resources is imperative for sustainable development, necessitating a meticulous partitioning of evapotranspiration into blue and green components. Our study focuses on the Upper Cauvery region, examining water utilization from both rainfed and irrigated sources. Modifying the Hoekstra framework in the context of employing geospatial data and machine learning techniques, we partitioned water resources into blue (ETb) and green (ETg) evapotranspiration, unravelling valuable insights. Results from the decade-long analysis (2010-2020) reveal that ETb significantly outweighs ETg in this region. Examining the temporal trends, both ETb and ETg exhibit a consistent upward trajectory over the specified period, illustrating the evolving water consumption dynamics from 2010 to 2020. The implications of our study extend to potential applications in sustainable water resource utilization and management practices, providing a valuable contribution to the scientific community and policymakers alike. The findings will also raise awareness about the importance of using water resources responsibly in this vital geographical area.

How to cite: Vasala, S. and Hassan Rangaswamy, S.: Unveiling the Sustainability Quotient: Blue and Green Evapotranspiration Dynamics Analysis in the Upper Cauvery Basin, EGU General Assembly 2024, Vienna, Austria, 14–19 Apr 2024, EGU24-1048, https://doi.org/10.5194/egusphere-egu24-1048, 2024.

Evapotranspiration is an important process in the water balance. It accounts for water transported from the surface of the Earth to the atmosphere. For practical applications, the estimation of evapotranspiration is limited by the potential evapotranspiration (PET), which is the maximum evapotranspiration that occurs when the availability of water on the surface is unlimited. PET can be estimated based on different climate variables. When assessing climate change projections, different climate models often project different change directions for such variables. Furthermore, the reliability of the climate model projections varies for each variable. Therefore, the uncertainty associated with the estimation of PET can be large. This study assesses this uncertainty by employing ten methods commonly used to estimate PET for ten different locations across Europe, capturing different climate and physical conditions. An ensemble of ten Euro-CORDEX climate models is used to assess projected PET changes through the century under the RCP 8.5 scenario. Different climate model bias correction methods are employed to reduce the biases in the climate model outputs when compared to the reference climate. A pseudo-reality experiment is set where each climate model acts as reference to train the correction methods, which are applied to the climate models that remain in the ensemble. The uncertainty of the projected PET is compared to the reference-climate-PET using evaluation metrics. Results are relevant for decision and policy makers and professionals developing impact studies.

How to cite: Pastén Zapata, E. and Lotsari, E.: Assessing the uncertainty of the estimation of potential evapotranspiration under climate change using a pseudo-reality approach, EGU General Assembly 2024, Vienna, Austria, 14–19 Apr 2024, EGU24-2417, https://doi.org/10.5194/egusphere-egu24-2417, 2024.

EGU24-3402 | ECS | PICO | HS2.5.3

Effects of climate and land use on water balance and water quality in selected European lakes 

Ma Cristina Mercado, Ruben Rabaneda-Bueno, Petr Porcal, Marek Kopacek, Frederic Huneau, and Yuliya Vystavna

Lakes, natural or artificial, are important sources of freshwater and are frequently managed to provide ecosystem services. Consequently, the water balance and water quality in lake ecosystems could be subject to different stressors associated to physical, chemical, or anthropogenic activities. Therefore, this study provides insights into the factors that influence the water balance of selected European lakes and their implications on water quality. An analysis of isotopic, chemical, and land use data using statistical and artificial intelligence models showed that climate, in particular air temperature and precipitation, played a key role in intensifying evaporation losses from lakes. Groundwater table depth and other catchment factors also had an impact on the water balance. The study also highlights that lakes at lower altitudes with shallow depths and catchments dominated by urban or crop cover were more sensitive to water balance changes. These lakes had higher evaporation-to-inflow ratios and increased levels of total nitrogen concentration in the water. However, lakes at higher elevations with deeper depths and a predominantly forested catchment area are less sensitive to changes in the water balance. These lakes, which are often of glacial origin, were characterized by lower evaporation losses and, thus, better water quality in terms of total nitrogen concentration. Overall, understanding the relationship between water balance and water quality is crucial for effective lake management and the preservation of freshwater ecosystems.

How to cite: Mercado, M. C., Rabaneda-Bueno, R., Porcal, P., Kopacek, M., Huneau, F., and Vystavna, Y.: Effects of climate and land use on water balance and water quality in selected European lakes, EGU General Assembly 2024, Vienna, Austria, 14–19 Apr 2024, EGU24-3402, https://doi.org/10.5194/egusphere-egu24-3402, 2024.

EGU24-3945 | ECS | PICO | HS2.5.3

GTWS-MLrec: global terrestrial water storage reconstruction by machine learning from 1940 to present 

Jiabo Yin, Louise Slater, Abdou Khouakhi, Pan Liu, Yadu Pokhrel, Dedi Liu, and Pierre Gentine

Terrestrial water storage (TWS) includes all forms of water stored on and below the land surface, and is a key determinant of global water and energy budgets. However, TWS data from measurements by the Gravity Recovery and Climate Experiment (GRACE) satellite mission are only available from 2002, limiting global and regional understanding of the long-term trends and variabilities in the terrestrial water cycle under climate change. This study presents long-term (i.e., 1940-2022) and relatively high-resolution (i.e., 0.25°) monthly time series of TWS anomalies over the global land surface. The reconstruction is achieved by using a set of machine learning models with a large number of predictors, including climatic and hydrological variables, land use/land cover data, and vegetation indicators (e.g., leaf area index). The outcome, machine learning-reconstructed TWS estimates (i.e., GTWS-MLrec), fits well with the GRACE/GRACE-FO measurements, showing high correlation coefficients and low biases in the GRACE era. We also evaluate GTWS-MLrec with other independent products such as the land-ocean mass budget, atmospheric and terrestrial water budget in 341 large river basins, and streamflow measurements at 10,168 gauges. The results show that our proposed GTWS-MLrec performs overall as well as or is more reliable than previous TWS datasets. Moreover, our reconstructions successfully reproduce the consequences of climate variability, such as strong El Niño events. GTWS-MLrec dataset consists of three reconstructions based on JPL, CSR and GSFC mascons, three detrended and de-seasonalized reconstructions, and six global average TWS series over land areas, both with and without Greenland and Antarctica. Along with its extensive attributes, GTWS_MLrec can support a wide range of geoscience applications such as better understanding the global water budget, constraining and evaluating hydrological models, climate-carbon coupling, and water resources management.

GTWS-MLrec is available on Zenodo through https://zenodo.org/records/10040927.

How to cite: Yin, J., Slater, L., Khouakhi, A., Liu, P., Pokhrel, Y., Liu, D., and Gentine, P.: GTWS-MLrec: global terrestrial water storage reconstruction by machine learning from 1940 to present, EGU General Assembly 2024, Vienna, Austria, 14–19 Apr 2024, EGU24-3945, https://doi.org/10.5194/egusphere-egu24-3945, 2024.

Regional water resource management requires adaptation measures to cope with a changing environment and climate. Large- and regional-scale hydrological models can provide information on water cycle components and their future projections for designing these measures. Here, the plausible and consistent spatial distribution of the simulated water balance components is essential, not only when communicating the results to the relevant stakeholders.

Spatially consistent simulation results depend on the spatially distributed parameters estimated for the hydrological model. This task, however, remains a challenging step in the model set-up, especially for larger modeling domains with varying hydrometeorological conditions like Austria, ranging from high alpine areas with high rainfall sums, snow, and glaciers to low-lying areas, with semi-arid conditions exhibiting negative climatic water balances.

The main objective of this study is to analyze the impact of different objective functions (OFs) on the simulated water balance components of a regional hydrological model. The distributed rainfall-runoff model COSERO is set up for the area of Austria (89 000 km²) with a monthly temporal resolution and a target spatial resolution of 1 x 1 km². Initially estimated spatially distributed model parameters are optimized using different OFs, e.g., Nash-Sutcliffe efficiency (NSE), log-transformed NSE, Kling-Gupta efficiency (KGE), and combinations thereof.

The resulting simulations are analyzed based on the spatial distribution of simulated runoff, evapotranspiration, and groundwater recharge across the study area. Furthermore, time-series analysis of the water cycle components is performed, and selected statistical characteristics are derived.

How to cite: Zeitfogel, H., Herrnegger, M., and Schulz, K.: On the sensitivity and robustness of Austrian-wide water balance components & groundwater recharge: A regional-scale evaluation of objective functions in calibration , EGU General Assembly 2024, Vienna, Austria, 14–19 Apr 2024, EGU24-7476, https://doi.org/10.5194/egusphere-egu24-7476, 2024.

EGU24-10530 * | ECS | PICO | HS2.5.3 | Highlight

Glaciers – an overlooked water balance component in global hydrological modeling 

Sarah Hanus, Lilian Schuster, Peter Burek, Fabien Maussion, Yoshihide Wada, and Daniel Viviroli

Although the share of glacier coverage is generally limited in large river basins, glaciers act as large water storages and contribute to runoff in the summer months. Due to climate change, glacier runoff is undergoing considerable change and is expected to decrease significantly by the end of the century. Thus, glaciers are a water balance component with a strong seasonal pattern which is rapidly changing in the future. However, glaciers have been mostly omitted in large-scale hydrological models so far, which limits climate impact studies on global water resources.

We aimed to improve the glacier representation in regional and global hydrological modelling and assess the contribution of glaciers to runoff. Therefore, we sequentially coupled the global glacier model OGGM (Maussion et al., 2019) with the large-scale hydrological model CWatM (Burek et al., 2020).

Coupling a glacier model with a hydrological model for global application comes with multiple challenges, such as precipitation data adjustment, different spatial and temporal resolutions, different snow process representations and model calibration. Here we elaborate on our experience of combining glacier and hydrological modelling, its challenges and uncertainties.

Moreover, we show results of glacier contributions to runoff in the past and under future scenarios. Glacier contributions to runoff are largest close to the glaciers and decrease downstream. Nevertheless, the runoff contribution from glaciers at the outlet of large river basins often remains important, especially in dry periods. We analyzed projected changes in glacier contribution to discharge at the outlet of 56 glacierized river basins globally. Our analysis suggests that the relative glacier contributions to discharge will decrease drastically towards the end of the century, also under the low-emission scenario SSP1-2.6.

Thus, including glaciers in regional and global assessments of water availability is especially relevant when assessing future changes, particularly on seasonal or shorter timescales. Otherwise, future changes in discharge are likely underestimated in glacierized basins.

The hydrological and glacier modelling communities should foster continued collaborations to include glaciers in the modelling of the water cycle and address the associated challenges.

Burek, P., Satoh, Y., Kahil, T., Tang, T., Greve, P., Smilovic, M., Guillaumot, L., Zhao, F., and Wada, Y.: Development of the Community Water Model (CWatM v1.04) – a high-resolution hydrological model for global and regional assessment of integrated water resources management, Geosci. Model Dev., 13, 3267–3298, https://doi.org/10.5194/gmd-13-3267-2020, 2020.

Maussion, F., Butenko, A., Champollion, N., Dusch, M., Eis, J., Fourteau, K. et al..: The Open Global Glacier Model (OGGM) v1.1, Geosci. Model Dev., 12, 909–931, https://doi.org/10.5194/gmd-12-909-2019, 2019.

How to cite: Hanus, S., Schuster, L., Burek, P., Maussion, F., Wada, Y., and Viviroli, D.: Glaciers – an overlooked water balance component in global hydrological modeling, EGU General Assembly 2024, Vienna, Austria, 14–19 Apr 2024, EGU24-10530, https://doi.org/10.5194/egusphere-egu24-10530, 2024.

EGU24-13855 | ECS | PICO | HS2.5.3

Integrated water scarcity index reveals increased exposures of populations and areas to water scarcity 

Zhonghao Fu, Wenfeng Liu, Yawei Bai, Michelle T. H. van Vliet, Philippe Ciais, Kyle Frankel Davis, and Yoshihide Wada

Freshwater resources are fundamental to supporting humanity, and measures of water scarcity have been critical for identifying where human water requirements and water availability are imbalanced. Traditional metrics for water scarcity primarily focus on actual blue water withdrawal, while the contribution of rain-fed water requirements (RWR) and water quality – dimensions with important implications for multiple societal sectors – to overall water scarcity remains unclear. Here we address this gap by explicitly merging the three dimensions of water scarcity into an integrated index (iWSI). Specifically, combining a process-based crop water model with spatially detailed information on water pollution and sector-specific withdrawals, we first develop global gridded (30 arcminute) estimates of iWSI and its individual dimensions (blue water, RWR, and water quality) averaged over the period 2001–2010. We then perform a quantitative comparison of water scarcity indices that consider different combinations of the three water scarcity dimensions, together or in isolation, and estimate their water withdrawals and associated global land area and population under conditions of monthly and annual water scarcity. We find that the global land area and population under water scarcity increases by 126% (119–133%) and 53% (49–57%) using this integrated index relative to assessments focusing only on blue water. These effects are most pronounced for populations in Africa and Asia. Examining seasonal water scarcity, we estimate that 4.4 billion people are exposed to integrated water scarcity at least one month per year – 31% more people than under blue water scarcity alone. Our research highlights that water scarcity challenges are more widespread than previously understood. As such, our findings underscore the need for actions to bring human pressure on freshwater resources into balance with both water quantity and quality, addressing previously overlooked blindspots in global water sustainability.

How to cite: Fu, Z., Liu, W., Bai, Y., van Vliet, M. T. H., Ciais, P., Davis, K. F., and Wada, Y.: Integrated water scarcity index reveals increased exposures of populations and areas to water scarcity, EGU General Assembly 2024, Vienna, Austria, 14–19 Apr 2024, EGU24-13855, https://doi.org/10.5194/egusphere-egu24-13855, 2024.

EGU24-15706 | ECS | PICO | HS2.5.3

Global Evaluation of Terrestrial Evapotranspiration Trend from Diagnostic Products 

Fangzheng Ruan and Yuting Yang

Evapotranspiration (ET) represents a pivotal process interlinking the water, energy, and carbon cycles within the Earth's environmental systems. In the context of global climate change, the discernible escalation in global ET has been extensively documented since the early 1980s. Nevertheless, considerable uncertainties persist in appraising the trajectory of estimated ET trends, with the magnitude of the global ET trends revealed by individual estimates differing by over an order of magnitude. Here, we present a comprehensive comparison of 11 state-of-the-art global ET products, comparing them with water balance-inferred ET across 69 major global basins, and contrasting them with direct, long-term ET observations from 20 eddy covariance sites. Our findings underscore a generally inadequate performance of existing ET products in replicating global and regional ET trends. A notable revelation is that the majority of ET products falter in correctly identifying the sign of water balance-derived and/or eddy covariance-observed ET trends in over 50% of catchments/flux sites. For catchment/flux sites where the signs of ET trends are accurately identified by the products, there is a prevalent tendency towards underestimating the magnitude of these trends. In addition, we find these ET products generally perform better in estimating ET trends in relatively arid climates and in croplands where the vegetation cover is more uniform. Finally, we elucidate that misclassification of land use types and insufficient representation of human activities, such as irrigation, groundwater extraction, and large-scale water diversion, constitute primary sources of uncertainty in the estimated ET. These insights are poised to advance future data assimilation efforts and foster the development of more reliable ET products at both basin and ecosystem scales, offering decision-makers an informed basis for selecting appropriate ET products.

How to cite: Ruan, F. and Yang, Y.: Global Evaluation of Terrestrial Evapotranspiration Trend from Diagnostic Products, EGU General Assembly 2024, Vienna, Austria, 14–19 Apr 2024, EGU24-15706, https://doi.org/10.5194/egusphere-egu24-15706, 2024.

EGU24-16194 | ECS | PICO | HS2.5.3

A data-driven reconstruction of spatially contiguous daily small catchment runoff for flood and drought monitoring in Switzerland 

Basil Kraft, William Aeberhard, Michael Schirmer, Sonia I. Seneviratne, Massimilano Zappa, and Lukas Gudmundsson

Runoff observations are critical for the monitoring and understanding of droughts and floods. Traditional methods for estimating runoff rely on physically-based hydrological models, which, while detailed, are often complex and computationally intensive. In contrast, recent advancements in deep learning have shown potential for more efficient and accurate runoff modeling. This study explores the efficacy of temporal neural networks for daily catchment-level runoff reconstruction in Switzerland from 1962 to 2023.

Our model, based on the long short-term memory (LSTM) architecture, is optimized on 87 catchments minimally affected by human activities. It is evaluated in an 8-fold cross validation setup and demonstrates similar performance compared to PREVAH, a distributed hydrological model that is used operationally in Switzerland. Notably, our model requires only precipitation and temperature as meteorological inputs, allowing for an extended reconstruction period back to 1962, unlike PREVAH's 1980 limitation due to its dependency on additional atmospheric forcings. In terms of Kling-Gupta efficiency, our model matches PREVAH's performance, despite its reduced data needs. We evaluate the quality of our reconstruction in terms of extreme events and trends based on the available observations and in comparison to the PREVAH simulations on the national level.

A key advantage of our neural network approach is its computational efficiency, enabling the reconstruction of daily runoff for 307 catchments that cover the entirety of Switzerland in under a minute on a high-performance GPU. This would facilitate real-time droughts and floods monitoring and support environmental scenario simulations. The findings underscore the potential of data-driven models in environmental monitoring and point towards future research in refining these models for broader applications in climate change impact assessments.

How to cite: Kraft, B., Aeberhard, W., Schirmer, M., Seneviratne, S. I., Zappa, M., and Gudmundsson, L.: A data-driven reconstruction of spatially contiguous daily small catchment runoff for flood and drought monitoring in Switzerland, EGU General Assembly 2024, Vienna, Austria, 14–19 Apr 2024, EGU24-16194, https://doi.org/10.5194/egusphere-egu24-16194, 2024.

EGU24-17588 | PICO | HS2.5.3

Improving global evaporation estimation using GRACE and GRACE-FO satellite data assimilation 

Shekoofeh Haghdoost, Akash Koppa, Hans Lievens, and Diego G. Miralles

The accurate monitoring and prediction of land water cycle components are crucial for applications in climate, hydrology, and agriculture. However, the remote sensing of ecohydrological variables, though essential, still faces challenges, especially in estimating non-directly observable factors like evaporation. Utilizing GRACE and GRACE-FO satellite data has the potential to improve global evaporation estimates and therefore to enhance our ability to understand and manage these components. Such advancements in global evaporation estimation can furthermore contribute to addressing future water management challenges, including mitigating the impacts of drought and potential groundwater reductions. To date, several remote sensing assets have been underused within the context of global evaporation estimation, such as the Gravity Recovery and Climate Experiment (GRACE) and GRACE Follow-On (GRACE-FO) missions, active since 2002 and 2018, respectively. These missions can play a key role in representing surface and subsurface processes related to water redistribution, providing estimates of Terrestrial Water Storage (TWS), and enriching our ability to navigate global water resource complexities.

The goal of this research is to improve the estimates of evaporation from the Global Land Evaporation Amsterdam Model (GLEAM) by using GRACE and GRACE-FO observations. GLEAM is a set of algorithms dedicated to estimating terrestrial evaporation based on satellite observations of meteorological drivers of terrestrial evaporation, vegetation characteristics, and soil moisture (Miralles et al. 2011). In this regard, we use GRACE observations in a data assimilation approach, based on Newtonian Nudging with model and observation errors defined by triple collocation, to improve the evaporation estimates of GLEAM. The study period comprises 20 years, between January 2003 and December 2022. Preliminary results indicate that the data assimilation output is closer to reality, for instance for estimating evaporation changes in Brazil and South America.  

How to cite: Haghdoost, S., Koppa, A., Lievens, H., and Miralles, D. G.: Improving global evaporation estimation using GRACE and GRACE-FO satellite data assimilation, EGU General Assembly 2024, Vienna, Austria, 14–19 Apr 2024, EGU24-17588, https://doi.org/10.5194/egusphere-egu24-17588, 2024.

EGU24-17758 | ECS | PICO | HS2.5.3

Understanding Hydrological Model Performance through Variability Analysis of Observed Water Balance Components and Meteorological Forcings 

Ehsan Modiri, Luis Samaniego, Robert Schweppe, Pallav Kumar Shrestha, Oldrich Rakovec, Matthias Kelbling, Rohini Kumar, Jeisson Javier Leal Rojas, Alberto Martínez-de La Torre, Emma L. Robinson, Amulya Chevuturi, Katie Facer-Childs, Eleanor Blyth, Edwin Sutanudjaja, Niko Wanders, and Stephan Thober

Hydrological modelling forms a pivotal component in assessing water balance closure and providing valuable seasonal forecasts for essential climate variables such as soil moisture and streamflow. In the pursuit of enhancing forecasting capabilities, this study employs four land surface and hydrological models (HTESSEL, JULES, mHM, and PCR-GLOBWB) driven by four distinct meteorological forcings (ERA5LAND, EM-EARTH, MSWEP, and WE5E). The investigation spans the reference period from 1993 to 2019, focusing on a comprehensive evaluation of streamflow, latent heat, runoff flux, and terrestrial water storage as integral components of the water balance equation.

The assessment begins by scrutinising the performance of observation datasets globally, aiming to discern areas of robust agreement and potential limitations. Subsequently, the simulations, generated by diverse meteorological forcings, are analysed to gauge the individual skill of each hydrological model and forcing combination.
The study then delves into a variability analysis to determine the impact of forcings on hydrological model performance. Furthermore, exploring the elasticity of runoff and streamflow to changes in precipitation adds an additional layer to understanding system dynamics. This multi-faceted approach seeks to quantify the relative contributions of meteorological forcings and hydrological models, providing insights into the intricacies of their interactions and their collective influence on model performance.

In conclusion, this research offers a  differentiated perspective on the global applicability and performance of these four hydrological models under four meteorological forcings. By systematically assessing the impacts of forcing variability and model structure, the study contributes valuable information for refining hydrological modelling practices and enhancing the accuracy of seasonal forecasts. Observational datasets are inconsistent in certain regions, where no single meteorological forcing stands out as the best performance. These areas are predominantly arid regions such as the Sahara, South Western Australia, and Eastern Brazil, in addition to mountainous regions like the Himalayas, where water balance closure poses a challenge.

How to cite: Modiri, E., Samaniego, L., Schweppe, R., Shrestha, P. K., Rakovec, O., Kelbling, M., Kumar, R., Javier Leal Rojas, J., Martínez-de La Torre, A., Robinson, E. L., Chevuturi, A., Facer-Childs, K., Blyth, E., Sutanudjaja, E., Wanders, N., and Thober, S.: Understanding Hydrological Model Performance through Variability Analysis of Observed Water Balance Components and Meteorological Forcings, EGU General Assembly 2024, Vienna, Austria, 14–19 Apr 2024, EGU24-17758, https://doi.org/10.5194/egusphere-egu24-17758, 2024.

Accurate estimation of terrestrial water storage anomalies (TWSA) is essential for the assessment of hydrological extreme events, managing water resources, and evaluating climate change impacts. In this study, a two-step method is applied for the reconstruction of a gridded TWSA product in two study basins: Godavari (GRB), a tropical river basin in India, and the Murray-Darling river basin (MDRB) in Australia. In the first step, the probabilistic dependence structure of the target TWSA and 15 potential predictor variables is developed through Bayesian Network technique to obtain the optimal features which strongly influence the target. In the second step, the potential of Machine Learning (ML) algorithms is utilized to obtain TWSA values, considering the grid-specific features selected in the first step as input. The input set of potential predictors includes monthly TWSA simulations from Global Land Data Assimilation System (GLDAS) Catchment Land Surface Model (i.e., CTWSA) and the GLDAS Noah Land Surface Model (i.e., NTWSA) as well as meteorological variables such as precipitation and temperature for a lead time of up to 2 months and large scale climate indices such as Dipole Mode Index, North Atlantic Oscillation index, and Oceanic Niño Index (ONI). For both study basins, CTWSA and ONI are prominent features selected by the Bayesian Network that influence TWSA. After obtaining the optimal features, Machine Learning (ML) algorithms such as Convolutional Neural Network (CNN), Support Vector Regression (SVR), Extra Trees Regressor (ETR), and Stacking Ensemble Regression (SER) are employed to derive TWSA values (henceforth named as BNML_TWSA). The performances of BNML_TWSA, as well as CTWSA and NTWSA, are evaluated against GRACE TWSA for both study basins using performance metrics such as the Correlation Coefficient (R), Nash–Sutcliffe Efficiency (NSE), and Root Mean Square Error (RMSE). At GRB, ETR demonstrates superior performance at most of the grids (74.3%), followed by SVR (21.1%). In contrast, at MDRB, all four ML algorithms show similar performance: CNN, SVR, ETR, and SER, each being selected as the best models at 25.9%, 21.4%, 26.1%, and 26.6% of the grids respectively. When evaluated against GRACE TWSA, the median values of R for NTWSA, CTWSA, and BNML_TWSA across all grids are 0.78, 0.90, and 0.93, respectively, at the GRB. Similarly, for the MDRB, these values are 0.79, 0.85, and 0.87, respectively. At the GRB, the best NSE value is obtained for BNML_TWSA (0.84), while the lowest performance is observed for NTWSA (0.475). At the MDRB also, the least performance is shown by NTWSA with an RMSE value of 57.3 mm/month, and the best performance is achieved by BNML_TWSA with an RMSE of 35.0 mm/month. The proposed two-step method offers dependable estimates of TWSA compared to land surface models and hydrological models. Hence, the reconstructed TWSA (1960-2022) proves valuable during the data gap period between GRACE and GRACE-FO and the pre-GRACE period.

How to cite: Mandal, N., Das, P., and Chanda, K.: Performance of two-step technique for gap-filling and reconstruction of basin-scale Terrestrial Water Storage Anomalies (TWSA) , EGU General Assembly 2024, Vienna, Austria, 14–19 Apr 2024, EGU24-18755, https://doi.org/10.5194/egusphere-egu24-18755, 2024.

HS3 – Hydroinformatics

EGU24-128 | Orals | HS3.1

Numeraical twins and deep neural network to predict groundwater flow  

Erwan Gloaguen, Xiao Xia Liang, Maxime Claprood, and Daniel Paradis

Groundwater is and will increasingly be under threat due to many anthropic stresses like climate changes, population growth in coastal cities, pollution,... It is known that realistic 3D numerical twins of aquifers allows forecasting their groundwater flow and permits to forecast their behavior in regards to different hydrogeological changes. In this project, we built an ensemble of numerical twins of an aquifer located south-east to Montreal, Qc, Canada, using a nested geostatistical workflow in order to optimize a pump and treat plant constrain by multiple environmental indicators. The ensemble permits to obtain a quantitative measure of the uncertainty for each indicator base on the optimization of the ensemble. While these models have proved to be useful operationally speaking, any changes or scenarios that must be tested requires the managers of the resources to hire qualified companies. This prevents the long term use of the numerical twins and reduce their democratisation to the resource management. This motivates the training of a deep neural graph network on the numerical twins. The trained network is able to forecast short term changes of the groundwater flow due to new pumping rates or new pumping wells in less than a minute. 

How to cite: Gloaguen, E., Liang, X. X., Claprood, M., and Paradis, D.: Numeraical twins and deep neural network to predict groundwater flow , EGU General Assembly 2024, Vienna, Austria, 14–19 Apr 2024, EGU24-128, https://doi.org/10.5194/egusphere-egu24-128, 2024.

EGU24-555 | ECS | Orals | HS3.1

Towards understanding dominant controls on Earth system processes across observations and models 

Robert Reinecke, Francesca Pianosi, and Thorsten Wagener

We are in a simultaneous state of exuberance and starvation of Earth system data. Model ensembles of increasing complexity provide petabytes of output, while remote sensing products offer terabytes of new data every day. On the other hand, we still lack data on some key processes that are more challenging to observe, like groundwater recharge, or only from particular regions of the world (often regions already heavily impacted by anthropogenic change). This leaves us with highly imbalanced datasets. Our ability to produce and collect mountains of data contrasts with our progress in improving scientific process understanding. How can we harness model simulations and data alike to enhance our knowledge and test scientific hypotheses about process relationships despite data gaps and poorly known biases in modelled and observational datasets? Our talk discusses methods to approach this problem while being agnostic to the data source (model simulations or observations). We present a new approach to interrogate a given dataset and identify correlational and possibly causal relationships between its variables. We test the method on an ensemble of complex global hydrological model simulations and observations from the ISIMIP experiments, and demonstrate its usefulness and limitations. We show that our approach can provide powerful insights into dominant process controls while scaling with large amounts of data.

How to cite: Reinecke, R., Pianosi, F., and Wagener, T.: Towards understanding dominant controls on Earth system processes across observations and models, EGU General Assembly 2024, Vienna, Austria, 14–19 Apr 2024, EGU24-555, https://doi.org/10.5194/egusphere-egu24-555, 2024.

EGU24-1477 | ECS | Orals | HS3.1

Enhancing Reproducibility in Soil Water Balance Environmental Studies: The WaterpyBal Framework 

Ashkan Hassanzadeh, Enric Vázquez-Suñé, and Sonia Valdivielso

This research introduces WaterpyBal, a dynamic tool tailored for spatiotemporal modeling of water balance, emphasizing diffuse precipitation and recharge dynamics. WaterpyBal demonstrates adaptability through its incorporation of diverse input datasets and flexible temporal intervals for model simulations. The tool seamlessly integrates critical stages of water balance assessment, encompassing data interpolation, evapotranspiration, and infiltration computations, accounting for soil attributes and urban hydrological intricacies. It delivers comprehensive water budget parameters, including recharge, deficit, and runoff, accompanied by the generation of informative maps, datasheets, and raster archives.

WaterpyBal modular architecture establishes a versatile foundation, positioning it as an open-source Python library exclusively dedicated to Soil Water Balance computations. Supporting temporal variations at hourly, daily, and monthly scales, WaterpyBal accommodates a spectrum of data formats, consolidating disparate stages of SWB calculations into an integrated library. Leveraging the NetCDF data format, widely recognized in scientific toolsets, WaterpyBal streamlines the workflow from spatial interpolation to result visualization, enhancing its applicability across diverse environmental investigations.

User engagement is facilitated through the WaterpyBal Studio, an intuitive graphical interface that guides users through each stage of the modelling process. WaterpyBal Studio has a user-centric design and is efficient in supporting sustainable groundwater management initiatives.

In summary, WaterpyBal and WaterpyBal Studio emerge as an inclusive solution for water balance modelling, embodying an integrated approach and adhering to the principles of open-source methodologies in environmental research.

How to cite: Hassanzadeh, A., Vázquez-Suñé, E., and Valdivielso, S.: Enhancing Reproducibility in Soil Water Balance Environmental Studies: The WaterpyBal Framework, EGU General Assembly 2024, Vienna, Austria, 14–19 Apr 2024, EGU24-1477, https://doi.org/10.5194/egusphere-egu24-1477, 2024.

Perusahaan Umum Jasa Tirta I (PJT-I) is a State-Owned Enterprise in Indonesia that focuses on Water Resources Management. Currently, PJT-I manages and utilizes water resources in five river basins under the jurisdiction of the Public Works and Housing Ministry. In conducting its business processes, PJT-I is highly influenced by hydroclimatic conditions, water availability, river basin conditions, and water quality. Therefore, the operational activities of PJT-I heavily rely on accurate data and information related to water resources. It is crucial for PJT-I to have the capability to access, analyze, and manage accurate and timely information to enhance the efficiency of water resource management. Hence, the company has implemented the AQUARIUS software as a decision support tool. The four main modules of AQUARIUS—Connect, Time-Series, Forecast, and WebPortal—are integrated into PJT-I to provide timely and reliable data for decision-makers. The AQ Connect module is responsible for managing the automatic extraction of time-series data from external sources. Meanwhile, the AQ Time-Series system is the core of AQUARIUS, serving as the primary platform for managing water resource data, including quantity and quality data, as well as meteorological information and other sensors. This system includes components such as the Time-Series Server, Database, Springboard, and Tools that work together to handle time-series data corrections without affecting raw data, the development of rating curves, derivation, and automatic data computation, as well as the production workflow and data publication from various data sources. AQUARIUS Forecast, as a flexible modeling environment, is specifically designed for river system modeling, processing, and time-series simulation. This module can incorporate complex operational rules into the model, replicating specific operational requirements such as reservoir rules, environmental releases, and water allocation. Finally, AQUARIUS WebPortal is a browser-based information and data presentation system that integrates various aspects of data collection, data storage, reporting, data computation, and data management, providing an efficient real-time information display. With this implementation, PJT-I can be more effective and efficient in managing water resources, enhancing the overall performance of the company. The implementation of AQUARIUS currently provides real-time information on 16 parameters of water resource from a total of 324 sensors and observations managed by PJT-I. Graphical customization of all observation data and its derivatives serves as a decision support tool. Real-time alert notifications from forecasts and monitoring of parameter conditions prepare PJT-I to handle disaster actions. Thus, the implementation of AQUARIUS has improved the effectiveness and efficiency of water resource management by PJT-I overall.

How to cite: nugrahany, A., Amirul Muttaqin, R. M., and hidayat, F.: Utilizing AQUARIUS as Water Resource Management Software: A Decision Support Tool in the Operational Area of Jasa Tirta I State-Owned Enterprise, Indonesia, EGU General Assembly 2024, Vienna, Austria, 14–19 Apr 2024, EGU24-1506, https://doi.org/10.5194/egusphere-egu24-1506, 2024.

EGU24-1743 | ECS | Orals | HS3.1

Hybrid approaches to model salinity in Gatun Lake 

María Gabriela Castrellón, Zheng Bing Wang, Dimitri Solomatine, and Ioana Popescu

Gatun Lake, located in central Panama, is the main source of freshwater for the operations of the Panama Canal. It also provides drinking water for nearly 600,000 people which is about 15% of Panama’s population. Historically, the lake has maintained a salinity well below 0.1 PSU, but since the inauguration of the Neo-Panamax locks in 2016, salinity in the lake has rapidly increased. This is a concern not only for drinking water supply and human health but for biodiversity as well. Accurately modelling salinity concentration and transport mechanisms in Gatun Lake is crucial for understanding its response to climate change and anthropogenic activities and to design effective management and mitigation strategies. However, current modelling techniques, both process-based (PB) and data-driven (DD), are limited in their ability to provide fast and accurate results with small amounts of data, especially in situations when boundary conditions are unknown or uncertain. Therefore, hybrid models have emerged as a potential solution to bridge the gap between these two approaches. The work presented here explores hybrid modelling approaches to estimate the magnitude of saltwater intrusion through the Neo-Panamax locks and calculate a salinity mass balance for Gatun Lake. Understanding these processes is useful for personnel at the Panama Canal Authority as it will inform their decision-making regarding management of Gatun Lake’s water quality and quantity.

How to cite: Castrellón, M. G., Wang, Z. B., Solomatine, D., and Popescu, I.: Hybrid approaches to model salinity in Gatun Lake, EGU General Assembly 2024, Vienna, Austria, 14–19 Apr 2024, EGU24-1743, https://doi.org/10.5194/egusphere-egu24-1743, 2024.

EGU24-2599 | ECS | Orals | HS3.1

Web application for supporting assessment of climate change adaptation strategies in Aa of Weerijs catchment, the Netherlands 

Andreja Jonoski, Muhammad Haris Ali, Claudia Bertini, Ioana Popescu, and Schalk Jan van Andel

The escalating urgency and severity of climate change (CC) consequences are intensifying the importance of science-informed decision making. Despite the rapid advancements in climate research, directed towards finding solutions for society, there persists a notable gap between the knowledge generated by scientists and its application by resource managers, policymakers, and other decision-makers. The observed gap is partly attributed to communication and mismatch between how researchers formulate scientific information and how stakeholders perceive its usability and legitimacy.

Within the European Union H2020 project 'EIFFEL’ (www.eiffel4climate.eu), the impact of CC on the surface-subsurface hydrology of the Aa of Weerijs catchment, situated between Belgium and the Netherlands, has been modelled and analysed, and nature-based (Nb) adaptive strategies have been developed, specifically targeting drought conditions and water shortages during summer. Recognizing the above-mentioned gap, a web application has been designed to support participatory planning and dissemination of results. The application enables stakeholders to visualize the potential impact of CC on drought conditions in near future (2050) and assess the potential of adaptive strategies to cope with such CC threat. This assessment is carried out by making use of drought-related Key Performance Indicators (KPIs), developed in consultation with the main stakeholders in the area. The underlying principle is that the adaptive strategies are co-created in a transparent, multi-stakeholder and participatory context, streamlining their implementation in landscape planning.

The web app has a 3-tier architecture and ingests the pre-processed output of physically based, fully distributed hydrological model developed using the MIKE-SHE modelling system of DHI, Denmark. In the first (presentation) tier, each tab on the top-level navigation bar leads to interactive user interfaces with embedded maps, designed with careful consideration of human-computer interactions (HCI) and user experience (UX) principles using standard web technologies, such as HTML, CSS, and JavaScript. The second (logic) tier contains the web server and dedicated map server for providing spatial data to the map interface. Python has been used to handle dynamic request by the user for display of data on presentation tier. The third (data) tier contains pre-processed model outputs that are displayed on the front tier through the logic tier.

For testing and validation of technical performance of the web app, a first demonstration and testing workshop was held in November 2023 with water expertise stakeholders. The web app successfully guided users through the storyline towards the research findings. Overall the work was appreciated and encouraged by positive feedbacks. Future workshops are planned with broader group of stakeholders, which will hopefully further validate its value as a support tool for assessing climate adaptation strategies, jointly used by domain scientists, modellers and stakeholders.

How to cite: Jonoski, A., Ali, M. H., Bertini, C., Popescu, I., and van Andel, S. J.: Web application for supporting assessment of climate change adaptation strategies in Aa of Weerijs catchment, the Netherlands, EGU General Assembly 2024, Vienna, Austria, 14–19 Apr 2024, EGU24-2599, https://doi.org/10.5194/egusphere-egu24-2599, 2024.

EGU24-3531 | ECS | Posters on site | HS3.1

Integration of hydrological models with data-driven techniques in cold regions 

Babak Mohammadi, Hongkai Gao, Petter Pilesjö, Ye Tuo, and Zheng Duan

The complex interaction among meteorological, glaciological, and hydrological variables presents challenges for glacio-hydrological modeling, necessitating advanced methodologies to capture the intertwined system. This study aimed to combine the traditional process-based hydrological model and data-driven techniques to enhance hydrological predictions in glacierized catchments. One glacierized catchment in northern Sweden was used as the testing site. We used a process-based glacio-hydrological model (FLEXG) and a machine learning approach (the M5Tree model) to assess and enhance the predictive capabilities of hydrological simulations. A suite of meteorological variables, such as air temperature, precipitation, evapotranspiration, relative humidity, sunshine hours, solar radiation, and wind speed, in combination with glacio-hydrological outputs from the FLEXG model, including snow cover area, snow water equivalent, and glacier mass balance, were used as inputs to the M5Tree model. Nine distinct scenarios were examined to explore the individual and cumulative impacts of these variables on the accuracy of runoff simulation. We started with the first scenario (named as M5Tree1) in which all meteorological and glacio-hydrological variables were used; this scenario serves as a benchmark for comparison against the other scenarios. Sequentially, each scenario omitted one variable to elucidate its specific contribution to runoff modeling. The final scenario (M5Tree9) used only air temperature and precipitation as inputs, reflecting their fundamental role in hydrological processes. The Variable Mode Decomposition (VMD), as a signal decomposition technique, was employed to enhance runoff modelling accuracy. This technique facilitated the dissection of each meteorological and glacio-hydrological variable into five distinct sub-signals, offering a more nuanced understanding of their contributions to runoff dynamics. Subsequently, the scenarios were re-evaluated with inputs derived from the VMD-decomposed variables (VMD-M5Tree1 to VMD-M5Tree9). The results showed remarkable improvements in the accuracy of runoff simulation with the incorporation of VMD. Our study demonstrated the significance of meticulous variable selection and decomposition techniques (particularly VMD) in improving model accuracy. We identified the optimal combination of meteorological and glacio-hydrological variables for robust runoff simulation. This study explored a singular approach among various methods to integrate traditional models and machine learning techniques for combining their respective strengths. Future research could explore other different ways in combining traditional models and machine learning techniques to improve runoff simulation. Additionally, given the vulnerability of glacierized catchments to climate change, future studies should incorporate future climate projections to assess the adaptability of the proposed integrated modelling framework and to understand the impact of climate change on runoff in cold regions.

How to cite: Mohammadi, B., Gao, H., Pilesjö, P., Tuo, Y., and Duan, Z.: Integration of hydrological models with data-driven techniques in cold regions, EGU General Assembly 2024, Vienna, Austria, 14–19 Apr 2024, EGU24-3531, https://doi.org/10.5194/egusphere-egu24-3531, 2024.

The accurate estimation of catchment response time is crucial for understanding hydrological processes and making informed water resource management decisions. In the rainfall-runoff model with linear reservoir equation, the time parameter, Tc, represents the time delay of catchment routing. Recent studies have shown that the Detrending Moving Cross-Correlation Analysis (DMCA) method can provide a more practical and direct determination of catchment response time, surpassing the limitations of the linear reservoir model.

This study aims to investigate whether the catchment response time obtained through the DMCA method can be effectively utilized as a replacement for the catchment timescale in the rainfall-runoff model with linear reservoir equation. The DMCA method is employed to analyze hydrological time series data from the CAMELS GB (Catchment Attributes and Meteorology for Large-sample Studies in Great Britain) hourly time series data. The calculated catchment response times are then compared with the catchment timescales estimated using the linear reservoir equation.

Our results indicate that the catchment response time derived from the DMCA method exhibits a closer correspondence with the catchment timescale estimated by the linear reservoir equation.

In conclusion, this study demonstrates the potential of replacing the catchment timescales in the rainfall-runoff model with linear reservoir equation with catchment response times obtained through the DMCA method. This substitution leads to more robust and accurate hydrological modeling, particularly in ungauged catchments or catchments with limited timeseries data.. The research findings indicate that the DMCA method offers a valuable tool for hydrologists and water resource managers seeking to enhance their understanding and management of catchment dynamics. However, further research is warranted to explore its application across catchments from different regions.

How to cite: Yin, Y., Woods, R., and Rosolem, R.: Replacing Catchment Timescale (Tc) in the rainfall-runoff model based on the linear reservoir equation with Catchment Response Time Obtained via Detrending Moving Cross-Correlation Analysis (DMCA) Method , EGU General Assembly 2024, Vienna, Austria, 14–19 Apr 2024, EGU24-4177, https://doi.org/10.5194/egusphere-egu24-4177, 2024.

EGU24-4390 | Orals | HS3.1

Harnessing Heterogeneous Sources of Data and Artificial Intelligence for Hydrologic Monitoring 

Erfan Goharian, Seyed Mohammad Hassan Erfani, and Mehdi Hatami Goloujeh

The persistent global threat of water-related challenges, particularly floods, necessitates a paradigm shift towards harnessing new technologies, heterogeneous sources of data, and novel techniques to enhance data availability and innovative sensing techniques in hydrology. Emerging data sources, including ground-based cameras, smart hydrologic monitoring systems, citizen observatories, and crowdsourcing, along with innovative techniques like Artificial Intelligence (AI), provide diverse yet novel data sources for more effective monitoring, modeling, and management. This research contributes to this transformative journey by exploring the integration of real-time imagery data from different tools and sources into hydrologic monitoring. Highlighting our efforts is the development of ATLANTIS, the first comprehensive image dataset for semantic segmentation of water bodies and associated objects. We introduce AQUANet, a state-of-the-art deep neural network crafted for precise waterbody segmentation, addressing challenges such as flood detection and inundation mapping. The study further demonstrates flood modeling using cutting-edge deep learning networks, including PSPNet, TransUNet, and SegFormer. Rigorous comparisons against reference data collected through field instruments and sensors underscore the superior performance of SegFormer, achieving an impressive 99.55% Intersection over Union (IoU) and 99.81% accuracy in hydrological monitoring, specifically in water level estimation at our testbed rivers and channels. In conclusion, this presentation not only showcases achievements in flood monitoring using innovative AI techniques and diverse data sources but also discusses how future studies can contribute to the ongoing discourse on the application of advanced technology in hydrologic monitoring systems, paving the way for further innovation and improvements in flood management.

How to cite: Goharian, E., Erfani, S. M. H., and Hatami Goloujeh, M.: Harnessing Heterogeneous Sources of Data and Artificial Intelligence for Hydrologic Monitoring, EGU General Assembly 2024, Vienna, Austria, 14–19 Apr 2024, EGU24-4390, https://doi.org/10.5194/egusphere-egu24-4390, 2024.

Local observations can drive machine learning (ML) based post-processors for improving hydrological model accuracy and reliability, and further ensuring that model outputs represent the local hydrological conditions. However, post-processing large-scale hydrological models is not straightforward and remains particularly challenging in ungauged basins. This study presents an ML-based post-processing approach which allows streamflow regionalization based on the hydrological characteristics of the river systems. We employed Long Short-Term Memory (LSTM) models to tailor the simulated streamflow obtained from the E-HYPE hydrological model to local observations across the pan-European domain. Here, we took advantage of the European hydrologically similar regions identified in Pechlivanidis et al. (2020), while LSTM was trained to map the simulated and observed runoff for each hydrologically similar cluster. The catchments in each cluster were divided into training and testing datasets under a K-fold cross validation approach. We compared the raw and post-processed simulations using different evaluation metrics capturing general bias (Mean Absolute Error), high flows (Nash-Sutcliffe Efficiency; NSE), and low flows (log-NSE). The results indicate that the regionalized LSTM approach enhances the hydrological model performance, evidenced not only at the stations incorporated within the training set, but also at those excluded from the training set. Overall, this study highlights the potential of ML in post-processing hydrological model outputs, especially in ungauged basins, setting a promising framework for AI-enhanced large-scale hydro-climate services.


References

Pechlivanidis, I. G., Crochemore, L., Rosberg, J., & Bosshard, T. (2020). What are the key drivers controlling the quality of seasonal streamflow forecasts? Water Resources Research, 56, e2019WR026987. https://doi.org/10.1029/2019WR026987

How to cite: Du, Y. and G. Pechlivanidis, I.: Enhancing Large-Scale Hydro-Climate Services Through a Regionalized Machine Learning Approach, EGU General Assembly 2024, Vienna, Austria, 14–19 Apr 2024, EGU24-5057, https://doi.org/10.5194/egusphere-egu24-5057, 2024.

EGU24-5298 | ECS | Posters on site | HS3.1

Introducing a fully differentiable, fully distributed Rainfall-Runoff Model 

Fedor Scholz, Manuel Traub, Thomas Scholten, Christiane Zarfl, and Martin Butz

Traditional hydrology simulates rainfall-runoff dynamics by means of process-
based models (PBMs), which are derived from physical laws. The models exhibit
realistic behavior. Their internal states can by directly interpreted, because they
reflect the modeled current state of the hydrological dynamics. Natural processes
in general are very complex, though, such that is is simply impossible to model
every aspect in detail. In the case of hydrology, for example, anthropological in-
fluences, such as the exact influence of the sewer system, as well as natural factors,
such as soil and rock types and structures, are extremely hard to model in all their
details. As a result, high uncertainty remains about the models’ necessary compo-
nents and their parameterizations, leaving room for improvement Sit et al. [2020],
Nearing et al. [2021]. Data-driven approaches, like deep neural networks (DNNs),
offer an alternative. They are trained on large amounts of data by gradient descent
via automatic differentiation. This enables them to automatically discover rela-
tionships in the training data, which often leads to superior performance Kratzert
et al. [2018], Shen [2018]. Due to the DNNs’ complexity, however, these rela-
tionships are hard to investigate and often fail to respect physical laws. Hybrid
modeling combines both approaches in order to benefit from their respective ad-
vantages. In this work, we present a physics-inspired, fully differentiable and fully
distributed rainfall-runoff model to predict river discharge from precipitation. Our
DNN architecture consists of a land module and a river module. The land mod-
ule receives RADOLAN-based precipitation data and propagates runoff laterally
over a regular grid (1km2 grid size) taking land surface structure information into
account. Runoff is then captured as input to the river module, which mimics the
actual river network by means of a graph neural network. Due to the involved,
physically motivated inductive biases, our model can be trained end-to-end from
the RADOLAN data as the main input and sparse discharge data as output. We
showcase our model on the Neckar river catchment in South Germany, achiev-
ing NSE values of 0.88 and 0.84 when we predict 1 and 10 days into the future,
respectively. In contrast, persistence yields NSE values of 0.5 and 0.06 for the cor-
responding forecast horizons. Due to our model’s differentiability we expect to be
able to infer the origin of measured discharge or turbidity—and thus erosion—in
the near future. We thus hope that this information could be used to create policies
that mitigate both the danger of floods and extreme erosion.

How to cite: Scholz, F., Traub, M., Scholten, T., Zarfl, C., and Butz, M.: Introducing a fully differentiable, fully distributed Rainfall-Runoff Model, EGU General Assembly 2024, Vienna, Austria, 14–19 Apr 2024, EGU24-5298, https://doi.org/10.5194/egusphere-egu24-5298, 2024.

Hybrid machine learning (ML) models have exhibited great forecasting accuracy across all water-related fields, often showing promising greater performance and computational power over standalone ML algorithms. Meanwhile, transformers have demonstrated remarkable capabilities in natural language processing tasks due to their attention mechanism; their application to time series forecasting, particularly in hydrology or streamflow prediction, is an evolving area. This study compared the performance of Transformers to various hybrid deep learning models in forecasting river streamflow data in Syr Daria. The hybrid models included LSTM with attention mechanism (LSTM-AM), LSTM with Arima (LSTM-AR), and Convolutional Neural Networks combined with LSTM (ConvLSTM). The forecasting performance of each model was tested at three hydrological stations located upstream, midstream, and downstream along the Syr Darya River, respectively. The forecasting performance was evaluated by comparing RMSE, MAE, NSE and KGE values achieved by each model. The streamflow datasets exhibit short-term dependencies that LSTM models can capture effectively, while transformers are more parameter-intensive than LSTMs. Simpler models like LSTMs perform relatively well and achieve comparable predictive accuracy to hybrid models. While LSTM-based models are found to be better suited for short-term forecasting, the transformer model tends to excel in longer-term predictions as they are better at capturing long-range dependencies in sequences. Nonetheless, all the models exhibit a decrement in predictive performance with an increasing forecasting horizon. The findings of this study evidence the suitability of transformers for high-performance and budget-wise river flow forecast applications while minimising data processing time.

How to cite: Ahmed, A. and Abdoulhalik, A.: The Application of Transformers and Hybrid Deep Learning Models for Streamflow Forecasting , EGU General Assembly 2024, Vienna, Austria, 14–19 Apr 2024, EGU24-5798, https://doi.org/10.5194/egusphere-egu24-5798, 2024.

EGU24-6548 | ECS | Orals | HS3.1

Modeling suspended sediment concentration using artificial neural networks, an effort towards global sediment flux observations in rivers from space 

Luisa Vieira Lucchese, Rangel Daroya, Travis Simmons, Punwath Prum, Subhransu Maji, Tamlin Pavelsky, Colin Gleason, and John Gardner

Harmonized Landsat Sentinel-2 (HLS) provides high-quality images every 2-3 days across Earth. However, HLS has not been widely used to measure Suspended Sediment Concentration (SSC) in rivers. Here, we used HLS to generate a fully open-source, open-architecture, and scalable image processing workflow and Neural Network algorithm to estimate SSC in global rivers. The extracted HLS surface reflectance was joined with global in-situ SSC measurements and used to train an ensemble of Artificial Neural Networks (ANN). Two ANNs were developed: one trained based on the lower SSC values (up to 20.08 mg/L) and the other one trained based on higher SSC values (up to 403.43 mg/L). The ANNs were able to achieve satisfactory performances for a global SSC model, with a median absolute error of 5.10 mg/L, pairwise correlation of 0.457, absolute E90 of 46.85 mg/L and absolute E95 of 84.9 mg/L. The preprocessing module and the ANN models were optimized to have few dependencies and finish execution within a reasonable timeframe (the ANN models are executed in approximately 1 second per node). These characteristics make the model suitable for implementation on Amazon Web Services (AWS) cloud, where they are planned to automatically generate SSC data on-the-fly. We will combine the global SSC model with Surface Water and Ocean Topography (SWOT) discharge data to generate a self-updating, global sediment flux dataset to be made available in the National Aeronautics and Space Administration (NASA) PO.DAAC portal.

How to cite: Vieira Lucchese, L., Daroya, R., Simmons, T., Prum, P., Maji, S., Pavelsky, T., Gleason, C., and Gardner, J.: Modeling suspended sediment concentration using artificial neural networks, an effort towards global sediment flux observations in rivers from space, EGU General Assembly 2024, Vienna, Austria, 14–19 Apr 2024, EGU24-6548, https://doi.org/10.5194/egusphere-egu24-6548, 2024.

Chlorophyll-a is an essential component for assessing nutrient content in water resources. Its concentration is influenced by various parameters, including Total Phosphorus (TP), Total Nitrogen (TN), Turbidity (TB), Total Suspended Solids (TSS), temperature, pH and so on. Accurate estimation of chlorophyll-a concentration across different spatial and temporal variations is crucial for assessing the condition of surface water bodies, concerning bacterial and nutrient levels. High chlorophyll-a concentration may compromise aquatic animal health, leading to disease due to increased bacterial concentrations in water.

This study aims to develop an estimation model for chlorophyll-a concentration by integrating artificial intelligence models, remote sensing data and field data. The study area includes Gorgan Bay and its contributing rivers. Initially, field data, including water quality parameters, from the water bodies and nearby rivers is analyzed. In addition to field data, remote sensing data, including chlorophyll-a concentration in the Bay, is obtained from the MODIS satellite sensors. As an artificial intelligence technique, the Random Forest (RF) is selected. The input data of the RF model are, therefore, the climate data, water quality data of the incoming rivers and the Bay and the flow of the incoming rivers. The model output is the chlorophyll-a concentration in the Gorgan Bay. The performance of the model is evaluated using different statistical measures. The different techniques are applied to find the most influential input variables for simulating the chlorophyll-a concentration in the Bay. The developed model is capable of predicting chlorophyll-a concentration, supporting improved water quality management of reservoirs (like bays). It can be utilized in locating optimal natural fish farming areas, managing, preserving aquatic ecosystems and enhancing reservoirs water quality.

Key words: Chlorophyll-a concentration, Artificial intelligence, Random forest, Remote sensing data, Field data.

How to cite: Khorashadi Zadeh, F. and Fatemi, M.: Integration of artificial intelligence techniques, remote sensing data and field data for simulation of chlorophyll-a concentration in Gorgan Bay, EGU General Assembly 2024, Vienna, Austria, 14–19 Apr 2024, EGU24-6762, https://doi.org/10.5194/egusphere-egu24-6762, 2024.

As climate change continues to impact stream systems worldwide, water temperature is an increasingly important indicator of distribution patterns and mortality rates among fish, amphibians, and macroinvertebrates. Technological advances tracing back to the 1960s have improved our ability to measure stream water temperature (SWT) at varying spatial and temporal resolutions, for the fundamental goal of better understanding stream function and ensuring ecosystem health. Despite significant advances, there continue to be a large number of stream reaches, stream segments and entire catchments that are difficult to access for a myriad of reasons, including but not limited to physical limitations. Moreover, there are noted access issues, financial constraints, and temporal and spatial inconsistencies or failures within situ instrumentation.

Over the last few decades and in response to these limitations, statistical methods and physically-based computer models have been steadily employed to examine SWT dynamics and controls. Most recently, the use of artificial intelligence, specifically machine learning (M.L.) algorithms, has garnered significant attention and utility in hydrologic sciences, specifically as a novel tool to learn yet-to-be-discovered patterns from complex data and attempt to fill data streams and knowledge gaps. Our review of publications focusing on stream water temperature modeling and prediction identified a similar number (~26) of publications utilizing M.L. in the previous four years (2020-2023), as were published in the previous 19 years, (2000-2019).  

The objective of this work is three-fold: first, to provide a concise review of the utilization of M.L. algorithms in stream water temperature modeling and prediction. Second, to review M.L. performance evaluation metrics as it pertains to SWT modeling and prediction and identify the commonly-used metrics as well as suggest guidelines for easier comparison of M.L. performance across SWT studies. Finally, we examine where progress has been made in our understanding of the physical system from the use of M.L. in SWT modeling and prediction, and identify where progress is still needed to advance our understanding of spatial and temporal patterns of stream water temperature.

How to cite: Corona, C. and Hogue, T.: A Critical Look at Machine Learning Algorithms in River/Stream Water Temperature Modeling , EGU General Assembly 2024, Vienna, Austria, 14–19 Apr 2024, EGU24-7003, https://doi.org/10.5194/egusphere-egu24-7003, 2024.

EGU24-8191 | ECS | Orals | HS3.1

Comparison of cloud-to-cloud distance calculation methods for change detection in spatio-temporal point clouds 

Vitali Diaz, Peter van Oosterom, Martijn Meijers, Edward Verbree, Nauman Ahmed, and Thijs van Lankveld

The advantages of using point clouds for change detection analysis include comprehensive spatial and temporal representation, as well as high precision and accuracy in the calculations. These benefits make point clouds a powerful data type for spatio-temporal analysis. Nevertheless, most current change detection methods have been specifically designed and utilized for raster data. This research aims to identify the most suitable cloud-to-cloud (c2c) distance calculation algorithm for further implementation in change detection for spatio-temporal point clouds. Eight different methods, varying in complexity and execution time, are compared without converting the point cloud data into rasters. Hourly point cloud data from monitoring a beach-dune system's dynamics is used to carry out the comparison. The c2c distance methods are (1) the nearest neighbor, (2) least squares plane, (3) linear interpolation, (4) quadratic (height function), (5) 2.5D triangulation, (6) natural neighbor interpolation (NNI), (7) inverse distance weight (IDW) and (8) multiscale model to model cloud comparison (M3C2). We evaluate these algorithms, considering both the accuracy of the calculated distance and the execution time. The results can be valuable for analyzing and monitoring the (build) environment with spatio-temporal point cloud data.

Key terms: point cloud, spatio-temporal analysis, c2c distance, beach-dune system

References

Van Oosterom, P., van Oosterom, S., Liu, H., Thompson, R., Meijers, M. and Verbree, E. Organizing and visualizing point clouds with continuous levels of detail. ISPRS J. Photogramm. Remote Sens. 194 (2022) 119. https://doi.org/10.1016/J.ISPRSJPRS.2022.10.004

Vos, S., Anders, K., Kuschnerus, M., Lindenbergh, R., Höfle, B., Aarninkhof, S. and de Vries, S. A high-resolution 4D terrestrial laser scan dataset of the Kijkduin beach-dune system, The Netherlands. Sci Data 9, 191 (2022). https://doi-org.tudelft.idm.oclc.org/10.1038/s41597-022-01291-9

How to cite: Diaz, V., van Oosterom, P., Meijers, M., Verbree, E., Ahmed, N., and van Lankveld, T.: Comparison of cloud-to-cloud distance calculation methods for change detection in spatio-temporal point clouds, EGU General Assembly 2024, Vienna, Austria, 14–19 Apr 2024, EGU24-8191, https://doi.org/10.5194/egusphere-egu24-8191, 2024.

EGU24-8410 | ECS | Orals | HS3.1

Leveraging the Power of Graph Neural Networks in Environmental Time Series Anomaly Detection  

Elżbieta Lasota, Julius Polz, Timo Houben, Lennart Schmidt, David Schäfer, Jan Bumberger, and Christian Chwala

Efficient quality control (QC) of time series data from environmental sensors is crucial for ensuring data accuracy and reliability. In this work, we turn to machine learning, specifically Graph Neural Networks (GNN), to elevate QC efficiency for large datasets originating from sparsely distributed sensors. Our proposed model, specifically tailored for anomaly detection as a vital aspect of QC, combines graph convolution (GC) and Long Short-Term Memory (LSTM) layers to capture both spatial dependencies and temporal patterns in the time series data. The focus on anomaly detection enables the identification of deviations or irregularities in the signal, providing insights into important events, faults, or disturbances within the data.

We conducted experiments using two distinct types of labeled data: three months of data in 2019 from 20 Commercial Microwave Links (CML) distributed around Germany and a 2.5-year period (June 2014 to December 2016) of soil moisture data from the TERENO SoilNet network in Hohes Holz, Germany. These datasets, encompassing an impressive 2.5 million samples, pose challenges in QC due to diverse dynamics, signal anomalies, and variations in temporal resolution and spatial densities of observations. 

The classification results demonstrated satisfactory performance, with Matthews Correlation Coefficients of over 0.6 and 0.8 for the CML and SoilNet datasets, respectively. To evaluate the added value of processing the spatial information provided by neighboring sensors, we also compared the results of our final GNN with a baseline model that uses the same LSTM layers but disregards the GC layer, which integrates the neighboring information. The GNN model exhibited improved performance, as evidenced by 5-fold cross-validation mean Area Under the Receiver Operating Characteristic Curve (AUC) values of 0.934 and 0.971 for the CML and SoilNet data, respectively. In contrast, the baseline model yielded mean AUC values of 0.877 and 0.950, highlighting the effectiveness of incorporating the information from neighboring sensors via the GC layers to enhance anomaly detection for environmental sensor time series data.

How to cite: Lasota, E., Polz, J., Houben, T., Schmidt, L., Schäfer, D., Bumberger, J., and Chwala, C.: Leveraging the Power of Graph Neural Networks in Environmental Time Series Anomaly Detection , EGU General Assembly 2024, Vienna, Austria, 14–19 Apr 2024, EGU24-8410, https://doi.org/10.5194/egusphere-egu24-8410, 2024.

EGU24-8516 | ECS | Posters on site | HS3.1

Pluvial Flooding Risk Mitigation: a machine learning approach for optimal management of an urban drainage system 

Sabrina Lanciotti, Leonardo Alfonso, Elena Ridolfi, Fabio Russo, and Francesco Napolitano

According to the Intergovernmental Panel on Climate Change (IPCC), the variability of extreme rainfall events is increasing in many locations. The continuous expansion of urban areas makes urban flooding more common, thus increasing the need for improved management of drainage systems in large cities. Urban pluvial flooding (UPF) occurs when surface runoff cannot be efficiently conveyed into the drainage system, due to intense rainfall events exceeding the capacity of stormwater drainage systems, or due to inlets' poor maintenance which are often either partially or fully blocked. Many drainage systems may not be efficient due to outdated design approaches that do not consider these aspects. Therefore, there is a need to improve the design of structures and to prioritize risk adaptation and mitigation strategies to build resilient cities against the effects of pluvial flooding. During extreme rainfall events generating pluvial flooding, discharges exceeding the sewer system capacity are diverted by sewer overflows. For this reason, the objective of this work consists of defining a methodology to determine the optimal management strategy to mitigate sewer overflows using machine learning techniques. Here we simulate pluvial flooding within a large urban area by using the freely available Storm Water Management Model EPA-SWMM, based on a detailed reproduction of the geometric characteristics of a branch of the drainage network in a large city. By simulating the different propagation effects of synthetic hyetographs in the pipelines and artefacts, the dynamic operating conditions of the actual network are performed using machine learning techniques, by applying Python to the SWMM data model (PySWMM). The project, which is ongoing, thus aims at the optimal management of the combined overflow devices of a sewer system through their real time control during a flood event to mitigate pluvial flooding risk in urban areas.

How to cite: Lanciotti, S., Alfonso, L., Ridolfi, E., Russo, F., and Napolitano, F.: Pluvial Flooding Risk Mitigation: a machine learning approach for optimal management of an urban drainage system, EGU General Assembly 2024, Vienna, Austria, 14–19 Apr 2024, EGU24-8516, https://doi.org/10.5194/egusphere-egu24-8516, 2024.

EGU24-8537 | ECS | Orals | HS3.1

A multi-resolution deep-learning surrogate framework for global hydrological models 

Bram Droppers, Marc Bierkens, and Niko Wanders

Global hydrological models (GHMs) are an important tool for sustainable development making in today’s water-scarce world. These models enable assessment of water scarcity by estimating both the natural water cycle and human activities around the world. Moreover, their process-based structure allows for projections under diverse climate change and socio-economic scenarios; information that is essential to support sustainable water management. Nevertheless, the need for better, higher resolution and larger ensemble simulations is reaching the limit of what is computationally feasible.
Recently, the deep-learning community has shown the potential of neural networks in providing highly accurate and computationally cheap hydrological predictions. This development has let to the emergence of deep-learning model surrogates that mimic process-based hydrological simulations using neural networks. Yet, the majority of these surrogates are restricted to assessing land-surface water fluxes at a singular spatial resolution, thereby limiting their application for global hydrological models.
We present a novel framework to create deep-learning global hydrological surrogates, with two salient features. First, our surrogate framework integrates spatially-distributed runoff routing that is essential to estimate water availability and human water withdrawals. Second, our surrogate framework offers scalability across various spatial resolutions and can match the wide variety of resolutions at which global hydrological models are applied.
To test our framework, we developed a deep-learning surrogate of the PCRaster Global Water Balance (PCR-GLOBWB) global hydrological model. The surrogate encompasses all water-balance components, including the impact of human activities on the water system. The PCR-GLOBWB surrogate runs faster than its process-based counterpart and performs well when compared to the original model’s output at different spatial resolutions. Interestingly, the multi-resolution surrogate actually outperforms model surrogates trained for a single resolution, even on their target resolution.
Deep-learning surrogates are a useful tool for the global hydrological modeling community, enabling enhanced model calibration (through parameter learning and flux matching) and more detailed model simulations. Our framework provides an excellent foundation for the community to create their own multi-scale deep-learning model surrogates.

How to cite: Droppers, B., Bierkens, M., and Wanders, N.: A multi-resolution deep-learning surrogate framework for global hydrological models, EGU General Assembly 2024, Vienna, Austria, 14–19 Apr 2024, EGU24-8537, https://doi.org/10.5194/egusphere-egu24-8537, 2024.

EGU24-8899 | ECS | Orals | HS3.1

Deep Learning for Spatially Distributed Rainfall–Runoff Modeling 

Martin Gauch, Frederik Kratzert, Vusumuzi Dube, Oren Gilon, Daniel Klotz, Asher Metzger, Grey Nearing, Florence Ofori, Guy Shalev, Shlomo Shenzis, Tadele Tekalign, Dana Weitzner, Oleg Zlydenko, and Deborah Cohen

Deep learning approaches have emerged as the state of the art for rainfall–runoff modeling. Yet—until now—the best-performing models have typically been used with inputs that are averaged across possibly large catchment areas, modeling each (sub-)basin independently. This lumped modeling approach is in contrast to reality, where rivers form networks of connected subbasins. This discrepancy limits our ability to accurately and interpretably predict certain types of rivers. Here, we present recent work to build graph-based deep learning models that explicitly account for this network structure. These models promise to unlock improvements in both the quality and interpretability of predictions:

Catchment size: Lumped models lack information about spatial heterogeneity, i.e., they do not know where inside a basin events (such as precipitation) occur. This makes it hard to model large basins, especially at high temporal resolution. Spatially distributed models can explicitly learn to account for travel times between subbasins inside a larger catchment, which also allows to analyze runoff generation separately from routing behavior.

Data assimilation: In lumped models, it is hard to include (real-time) measurements from upstream river sections that could improve predictions at downstream locations. In a graph-based model of connected subbasins, any downstream prediction can benefit from upstream information that is propagated along the river network.

Human intervention: It is unclear how to explicitly represent human water extraction, reservoirs, or dams in lumped models. Graph-based models provide more flexibility, as we can account for the spatial location of human interventions explicitly in the graph structure and learn to represent their influence on runoff.

In this work, we compare different types of spatially distributed deep learning models with lumped deep learning models and traditional physics-based hydrologic modeling and routing approaches on >600 gauges of the LamaH dataset [1].


[1] Klingler, C., Schulz, K., and Herrnegger, M.: LamaH-CE: LArge-SaMple DAta for Hydrology and Environmental Sciences for Central Europe, Earth Syst. Sci. Data, 13, 2021.

How to cite: Gauch, M., Kratzert, F., Dube, V., Gilon, O., Klotz, D., Metzger, A., Nearing, G., Ofori, F., Shalev, G., Shenzis, S., Tekalign, T., Weitzner, D., Zlydenko, O., and Cohen, D.: Deep Learning for Spatially Distributed Rainfall–Runoff Modeling, EGU General Assembly 2024, Vienna, Austria, 14–19 Apr 2024, EGU24-8899, https://doi.org/10.5194/egusphere-egu24-8899, 2024.

EGU24-9931 | ECS | Posters on site | HS3.1

Using neural networks for predicting soil water storage based in situ soil moisture observations 

Balazs Bischof, Erwin Zehe, and Ralf Loritz

Previous studies have shown that Long-Short Term Memory networks (LSTMs) offer a large potential for data-based learning and hydrological predictions. This study focuses on exploring the largely untapped potential of such modeling approach using a large sample of in-situ soil moisture data based on Time-Domain Reflectometry (TDR) measurements, collected across the Attert experimental basins in Luxembourg. Soil moisture plays a critical role in various hydrological processes, influencing groundwater recharge, governing infiltration dynamics, and contributing significantly to the generation of overland flow. Additionally, it stands as a key determinant for the water supply essential for sustaining vegetation and agricultural crops. Here we introduce an LSTM model that has been trained on extensive long-term in-situ soil moisture observations with the objective of extrapolating the dynamics of soil moisture across spatial dimensions, temporal scales, and depths. A key challenge in this context is how to deal with multiscale variability of TDR observations, which arising from small scale variations in soil texture scales as well as larger scale spatial variability of physiographic and meteorological characteristics. Acknowledging, that this multiscale variability of soil moisture is difficult to disentangle by standard available predictors and their gradients, we place particular emphasis on data processing and understanding of such variability. This emphasis is crucial to mitigate potential confusion within the model, ensuring a more accurate representation of soil moisture dynamics. For this purpose, we evaluate the efficacy of LSTMs in capturing soil moisture dynamics, while concurrently aiming to clarify variability and address uncertainty. Furthermore, employing clustering techniques and network theory approaches, our aim is to discern systematic variability and patterns, considering model performance and the relationships within soil moisture measurement time series. As a result, we demonstrate the advantages of employing LSTMs to assess soil moisture dynamics at the catchment scale, while emphasizing the exploration of drawbacks and limitations inherent in purely data-based learning. This analysis provides a valuable guide for future modeling attempts, offering an opportunity to depict spatial and temporal variations in soil water storage. Such representations prove beneficial in the development of early-warning systems for potential dry events.

How to cite: Bischof, B., Zehe, E., and Loritz, R.: Using neural networks for predicting soil water storage based in situ soil moisture observations, EGU General Assembly 2024, Vienna, Austria, 14–19 Apr 2024, EGU24-9931, https://doi.org/10.5194/egusphere-egu24-9931, 2024.

EGU24-10765 | Orals | HS3.1

Benchmarking physics-based, machine learning, and hybrid hydrology models at multiple catchments in Southern Norway. 

Bernt Viggo Matheussen, Rajeev Shrestha, and Bjarte Beil-Myhre

Accurate inflow forecasts play a crucial role in the daily operations of hydropower reservoirs. Practitioners in the hydropower industry typically combine physically based models coupled with weather forecasts to produce inflow forecasts to the reservoirs. Despite the emergence of physically-based hydrological models since the early 1960s, their growing complexity has posed challenges in usage and calibration. Recent work by Kratzert et al. (2018) suggests that non-linear regression models such as LSTM neural networks (Hochreiter & Schmidhuber, 1997) may outperform traditional physically based models. Given the plethora of hydrology models, it is crucial to identify the most effective configurations within a diverse range of catchments using objective quantitative performance criteria.

This research aims to evaluate various model configurations across multiple catchments, determining the optimal hydrological model for streamflow prediction. Two physics-based models, the Distributed Regression hydrological Model (DRM) by Matheussen at Å Energi and the Statkraft Hydrology Forecasting Toolbox (SHyFT) from Statkraft, were applied alongside two versions of LSTM models tested as standalone and hybrid models with different input and model configurations. Thirteen model configurations underwent testing in sixty-five catchments in southern Norway. The models, including LSTM networks, were trained on either one catchment (Local) or all catchments (Regional) and tested using two train/test periods and two objective criteria: Nash-Sutcliffe Efficiency (NSE) and Kling Gupta Efficiency (KGE). The validation scores for NSE and KGE during the two train-test periods were used for benchmarking. 

Daily observed climate and streamflow data stems from The Norwegian Water Resources and Energy Directorate (NVE), The Norwegian Meteorological Institute, Å Energi's internal databases and ECMWF (ERA5). We extracted digital elevation data, land cover types, and vegetation information from 
www.hoydedata.no and the CORINE Land Cover inventory. The key findings of the study shows that the data-driven model outperformed physically based models (SHyFT, DRM). Hybrid models, incorporating output from physics models and meteorological data, surpassed purely data-driven models. The most successful configuration involved two hybrid models, utilizing an LSTM network forced with outputs from physically based models and climate  forcings. The results clearly demonstrates that information about the physical hydrological processes enhance the LSTM model performance.

How to cite: Matheussen, B. V., Shrestha, R., and Beil-Myhre, B.: Benchmarking physics-based, machine learning, and hybrid hydrology models at multiple catchments in Southern Norway., EGU General Assembly 2024, Vienna, Austria, 14–19 Apr 2024, EGU24-10765, https://doi.org/10.5194/egusphere-egu24-10765, 2024.

EGU24-11137 | ECS | Posters on site | HS3.1

Rainfall nowcasting with machine-learning for landslide early warning  

Fereshteh Taromideh, Giovanni Francesco Santonastaso, and Roberto Greco

Real-time data plays a crucial role in predicting short-duration rainfall. These predictions have a significant impact on our daily life, especially in emergencies that can imperil human safety and the environment. A tragic example of this occurred on November 26, 2022, in Casamicciola, island of Ischia, in the Gulf of Naples (Italy), when heavy rainfall triggered landslides, resulting in loss of lives and extensive damage to buildings and infrastructure. Such destructive consequences highlight the urgent need for accurate short-term rainfall forecasts.

In fact, it is very important to have reliable short-term rainfall forecasting for early warning purposes. This can help save lives and property by preventing the effects of flooding, landslides, and other hazards caused by heavy rainfall . It is hard to understand and model how rainfall changes over time, and therefore, predicting rainfall in the short term is a complex challenge. Many of the current models use complicated statistical methods that are often too expensive and time consuming. In contrast, machine-learning (ML) models can find hidden patterns in rainfall data and predict the hourly or sub hourly amount of rain with limited computational burden.

In this study, a novel ML model is developed for nowcasting rainfall, to explore how it can make effective and quick short-term forecasts of precipitation. Specifically, the random forest (RF) algorithm is used, as recent studies have found this ML approach to be suitable (Mdegela et al., 2023). The study area is located on the island of Ischia, where 4 rain gauges (Ischia, Monte Epomeo, Forio, Piano Liguori) with a temporal resolution of 10 minutes are installed. The proposed model uses both the precipitation time series of the rain gauges and surface rainfall intensity provided by radar managed by the Civil Protection agency with temporal resolution of 5 minutes and a spatial resolution of 1 km, to predict the future precipitation. Different grid sizes (20x20, 30x30, 40x40 and 50x50 km) centred on the island of Ischia are considered to select the best radar input data (features) for the RF algorithm. The datasets were randomly selected for RF model training (70% of the data) and validation (30% of the data). The Minimum Inter-arrival Time (MIT) criterion was adapted for the definition of rainfall events within the rain gauge precipitation records (Heneker et al., 2001). A rainfall event is defined as a rainfall period preceded and followed by dry periods longer than MIT.

The results indicate that the RF model provides reliable short-term precipitation forecasts using only observed values as input, making it a fast, simple, and convenient method for nowcasting. The resulting precipitation forecast has the potential to be used in an early warning system to mitigate the impact of landslides.


References

Heneker, T.M., Lambert, M.F., Kuczera, G., 2001. A point rainfall model for risk-based design. J. Hydrol. 247, 54–71.

Mdegela, L., Municio, E., De Bock, Y., Luhanga, E., Leo, J. and Mannens, E., 2023. Extreme Rainfall Event Classification Using Machine Learning for Kikuletwa River Floods. Water15(6), p.1021.


How to cite: Taromideh, F., Santonastaso, G. F., and Greco, R.: Rainfall nowcasting with machine-learning for landslide early warning , EGU General Assembly 2024, Vienna, Austria, 14–19 Apr 2024, EGU24-11137, https://doi.org/10.5194/egusphere-egu24-11137, 2024.

EGU24-12131 | Orals | HS3.1

Leveraging climate data at different spatial scales via machine learning to improve sub-seasonal drought predictions 

Matteo Giuliani, Francesco Bosso, Claudia Bertini, Dimitri Solomatine, and Schalk Jan van Andel

Droughts are one of the most dangerous natural hazards affecting today societies, with an economic impact amounting to over 9 billion euros per year in Europe. Drought events usually originate from a precipitation deficit, which can then cause water shortages, agricultural losses, and environmental degradation. Despite the numerous efforts and recent advances in extreme events forecasting, the sub-seasonal time scale still represents a challenging lead time for state-of-the-art hydroclimatic predictions. In this case, the reference period is short enough for the atmosphere to retain a memory of its initial conditions, but also long enough for oceanic variability to affect atmospheric circulation. However, the relative contribution of climate teleconnections and local atmospheric conditions to the genesis of total precipitation at sub-seasonal scale remains unclear.

In this work, we aim to address this gap by using Machine Learning (ML) to combine the information extracted from teleconnection patterns, global climate variables, and local atmospheric conditions to produce sub-seasonal drought forecasts. Specifically, we implemented a first ML pipeline that uses correlation maps to select relevant grids of global Sea Surface Temperature, Mean Sea Level Pressure, and geopotential height at 500 hPa from the ERA5 reanalysis dataset, which are spatially aggregated via Principal Component Analysis and combined with a set of local variables in the considered region. The second ML approach extends our analysis by explicitly considering the potential role of teleconnection patterns, including North Atlantic Oscillation, Scandinavian oscillation, East Atlantic oscillation, and El Niño Southern Oscillation, to identify different forecast models - in terms of both input variables and model parameters – for the different phases of the climate oscillations and for each month of the year. The resulting combination of global and local variables is then used as input in different ML models, including both feedforward neural networks and extreme learning machines.

Our framework is developed within the CLImate INTelligence (CLINT) project and tested in the task of predicting the total monthly precipitation in the Rijnland area (Netherlands). The resulting ML-based forecasts are then benchmarked against state-of-the-art dynamic forecast products, i.e. the ECMWF Extended Range forecasts. Our findings indicate that combining global and local climate information into ML-based forecast models significantly improves state-of-the-art drought forecast accuracy, thus representing a promising option to timely prompt anticipatory drought management measures.

How to cite: Giuliani, M., Bosso, F., Bertini, C., Solomatine, D., and van Andel, S. J.: Leveraging climate data at different spatial scales via machine learning to improve sub-seasonal drought predictions, EGU General Assembly 2024, Vienna, Austria, 14–19 Apr 2024, EGU24-12131, https://doi.org/10.5194/egusphere-egu24-12131, 2024.

EGU24-12982 | ECS | Orals | HS3.1

Virtual Delta: a digital twin for real-time forecasting and management of saltwater intrusion in the Rhine-Meuse delta 

Chanoknun Wannasin, Bouke Biemond, Bas Wullems, Thies Blokhuijsen, Meinard Tiessen, Fedor Baart, and Jaap Kwadijk

Estuarine saltwater intrusion poses a significant hydrological and environmental challenge in the Rhine-Meuse delta, amplified by human interventions (e.g., river engineering) and climate change impacts (e.g., droughts, storm surges, and sea-level rise). The more frequent and severe salt intrusion events, especially during droughts in 2018, 2020, and 2022, emphasize the need for accurate forecasting and effective management. This research aims to develop a digital twin for real-time forecasting and management of salt intrusion. The digital twin is part of the Virtual Delta, one of the main outputs that the SALTISolutions research project is working towards. As an operational modelling toolbox, this digital twin consists of four components: observed data analysis, real-time forecasting, early warning, and exploratory simulations. The observed data analysis component includes statistical information, such as return periods and exceedance exceedance probabilities of chloride concentration, river discharge, and water level. The forecasting component employs currently available salt intrusion models within the SALTISolutions project, including 1D, 2D, statistical, and machine learning models. The early warning component utilizes thresholds (e.g., maximum chloride concentrations at freshwater inlets). Exploratory simulations consider what-if scenarios (e.g., lower river discharge) and management options (e.g., combinations of different real-time measures). The research is ongoing, and the current development will be demonstrated. The digital twin is expected to assist water managers and stakeholders (e.g., drinking water companies) in decision-making, addressing impacts of saltwater intrusion, and ensuring a continuous supply of freshwater in the delta.

How to cite: Wannasin, C., Biemond, B., Wullems, B., Blokhuijsen, T., Tiessen, M., Baart, F., and Kwadijk, J.: Virtual Delta: a digital twin for real-time forecasting and management of saltwater intrusion in the Rhine-Meuse delta, EGU General Assembly 2024, Vienna, Austria, 14–19 Apr 2024, EGU24-12982, https://doi.org/10.5194/egusphere-egu24-12982, 2024.

EGU24-13369 | ECS | Posters on site | HS3.1

Application of Discrete Exterior Calculus Method to the Heat Transport Equation in Porous Aquifers 

Rubén Carrillo and Diana Núñez

The numerical analysis of partial differential equations (PDEs) is a classic and highly active investigation area. In this area, there is a wide variety of established methods such as finite differences, finite elements, finite volume, spectral, etc. Furthermore, we can affirm that all of them have an analytical origin.

In recent decades, geometric methods based on Exterior Calculus have been proposed. This is due to the geometric content of many Physics theories. In this group, we can highlight the Finite Exterior Element Calculus, or FEEC, a theoretical approach to designing and understanding finite element methods for the numerical solution of various PDEs. This method is substantiated by the traditional finite element functional analysis techniques, but it is accompanied by topology and homological algebra tools.

An alternative method in this field is Discrete Exterior Calculus (DEC). Exterior Calculus generalizes vector calculus to high dimensions and differential manifolds. Discrete Exterior Calculus (DEC) is one of their discretizations, producing a numerical method for solving PDEs on simplicial complexes.

In DEC, geometric operators on simplicial complexes are used in any dimension, and equivalent discrete versions are proposed for objects and differential operators, such as differential forms, vector fields, etc. DEC is proposed as a method for solving partial differential equations that consider the geometric and analytical characteristics of the operators and the domains over which that applies.

Mathematical heat transfer models in porous media have recently received considerable attention. Second-order partial differential equations give these for heat and flow energy conservation. To study the thermal characteristics of conduction and advection within porous media, thermal equilibrium, and non-thermal equilibrium models. This work analyzes 2D numerical models of heat transport in porous aquifers with DEC.

How to cite: Carrillo, R. and Núñez, D.: Application of Discrete Exterior Calculus Method to the Heat Transport Equation in Porous Aquifers, EGU General Assembly 2024, Vienna, Austria, 14–19 Apr 2024, EGU24-13369, https://doi.org/10.5194/egusphere-egu24-13369, 2024.

Transformer Neural Networks (TNNs) have caused a paradigm shift in deep learning domains like natural language processing and gathered immense interest due to their versatility in other fields such as time series forecasting (TSF). Most current TSF applications of TNNs use only historic observations to predict future events, ignoring information available in weather forecasts to inform better predictions, and with little attention given to the interpretability of the model’s use of environmental input factors. This work explores the potential for TNNs to perform TSF across multiple environmental variables (streamflow, stage, water temperature, and salinity) in two ecologically important regions: the Peace River watershed (Florida) and the northern Gulf of Mexico (Louisiana). The TNN was tested (and uncertainty quantified) for each response variable from one- to fourteen-day-ahead forecasts using past observations and spatially distributed weather forecasts. Additionally, a sensitivity analysis was performed on the trained TNNs’ attention weights to identify the relative influence of each input variable on each response variable’s prediction. Overall model performance ranged from good to very good (0.78<NSE<0.99 for all variables and forecast horizons). Through the sensitivity analysis, we found that the TNN was able to learn the physical patterns behind the data, adapt the use of the input variables to each forecast, and increasingly use weather forecast information as forecasting windows increased. The TNN excellent performance and flexibility, along with the intuitive interpretability highlighting the logic behind the models’ forecasting decision-making process, provide evidence for the applicability of this architecture to other TSF variables and locations.

How to cite: Orozco Lopez, E. and Kaplan, D.: Interpretable Transformer Neural Network Prediction of Diverse Environmental Time Series Using Weather Forecasts, EGU General Assembly 2024, Vienna, Austria, 14–19 Apr 2024, EGU24-13702, https://doi.org/10.5194/egusphere-egu24-13702, 2024.

EGU24-14375 | ECS | Posters on site | HS3.1

Hybrid Deep Learning Approach for Simultaneous Feature Engineering and Explanation of Water Quality Sensor Data  

Jihoon Shin, YoungWoo Kim, Taeseung Park, and YoonKyung Cha

Water quality monitoring plays a crucial role in establishing effective management strategies for ensuring the safety and sustainability of water resources. Recently, with advances in sensor technologies, autonomous water quality monitoring has been increasingly used to obtain detailed temporal variations of water quality in the river network. However, irregular time series data are prevalent in multi-sensor monitoring systems and the resulting missing values limit the ability of data to serve as a decision basis. A modeling tool that can efficiently handle irregular time series data is required to derive useful insights from the sensor data. The combined use of feature engineering and attention mechanisms has shown benefits in dealing with irregular time series data from improved performance and explainability. In this study, hybrid deep learning that incorporates reverse time attention and trainable decay mechanisms (RETAIN-D) was used to analyze sensor data collected from multiple sites located in the upper section of the Geum River, South Korea. RETAIN-D was developed to predict the variations in the level of chlorophyll-a (Chl-a) concentrations and to analyze spatiotemporal associations between its influencing factors at different monitoring sites. RETAIN-D showed a high degree of accuracy (Accuracy = 0.81–0.90, AUC = 0.67–0.90, F1 score = 0.87–0.88 for test sets) for various chlorophyll-a standards. Trainable decay mechanism in RETAIN-D allowed predictions of Chl-a level in missing periods without manual feature engineering. Chl-a concentrations from the nearest adjacent tributary had high importance in predicting Chl-a levels for the target site. The contribution of input features among different time steps was generally higher in the recent time steps. These results demonstrate the usefulness of the hybrid deep learning approach as an efficient Big Data analysis tool for water quality and resource management.

How to cite: Shin, J., Kim, Y., Park, T., and Cha, Y.: Hybrid Deep Learning Approach for Simultaneous Feature Engineering and Explanation of Water Quality Sensor Data , EGU General Assembly 2024, Vienna, Austria, 14–19 Apr 2024, EGU24-14375, https://doi.org/10.5194/egusphere-egu24-14375, 2024.

Urban stormwater poses significant challenges related to flooding and water quality. Cities utilize 311 service request platforms for residents to report incidents, enabling governmental attention. Existing studies have explored socioeconomic and climatic factors' impact on the submission of requests, but a comprehensive understanding of how socioeconomic, climatic, and physical parameters collectively influence flooding and sanitation reporting remains unexplored. This study analyzes four years of 311 service requests for flooding stoppages and raw sewage concerns in Norfolk, VA, employing two Zero-Inflation Negative Binomial mixed effects models. These models identify statistically significant predictors for flooding stoppage and raw sewage concern request counts. The 311 service request data was geo-aggregated to the census tract level and temporally aggregated into weekly sums to account for possible lags in event occurrence and reporting of flooding stoppage or raw sewage. Duplicate service requests were also removed from the dataset. This study incorporates a wide range of explanatory variables, including socioeconomic factors (race, income, gender, education level), climatic factors (precipitation, tide level, groundwater level), and physical factors (topographic wetness index, impervious cover, distance from water bodies). All explanatory variables were aggregated to census tract level and weekly values where appropriate. Results reveal precipitation as a robust predictor in both flooding stoppages and raw sewage concerns. The conditional model for flooding stoppages identifies additional predictors such as educational attainment, race, and groundwater level. For raw sewage concerns, tide emerges as a significant predictor in the conditional and zero-inflation models, with the zero-inflation model identifying precipitation and groundwater level as well. Models were tested through nested cross-validation to validate their robustness. The study underscores the importance of climatic scenarios in predicting service requests, emphasizing their reliability in directing municipal funds for addressing community-identified flooding and sewage problems. Physical parameters like the topographic wetness index show weak predictability in low-relief coastal plains, such as Norfolk, VA. Moreover, the study sheds light on the limited relationship between flooding stoppages and raw sewage service requests, where the combined presence of these reports may indicate potential water quality and health concerns. This research contributes to a nuanced understanding of the multifaceted influences on urban stormwater reporting, facilitating targeted strategies for effective stormwater management.

How to cite: Lerma, N. and Goodall, J.: Understanding socioeconomic, climatic, and physical factors on 311 flooding and raw sewage reports in Norfolk, VA, EGU General Assembly 2024, Vienna, Austria, 14–19 Apr 2024, EGU24-14464, https://doi.org/10.5194/egusphere-egu24-14464, 2024.

Periods detected by an advanced, systematic technology can provide reliable basis for water resources prediction and management. One of the main challenges of period mining is getting rid of the effects of climate change and noise. This study presents the hierarchical discrete-continuous wavelet decomposition (HDCWD) model. The method provides a three-layer identification framework of detrending, denoising and mining by combining discrete wavelet transform and continuous wavelet transform. The dominating periods and their spatiotemporal features of precipitation in the Yellow River Basin are identified by applying HDCWD to different catchments. Results show the following: (1) Noise exists in the precipitation series in the Yellow River Basin and leads to overlooked period. (2) Precipitation in the Yellow River Basin has the dominating periods of 2–4 years and 7–9 years from 1956 to 1984, and period of 2 years from 1998 to 2002. (3) The periodicity of precipitation in the Yellow River Basin varies among different catchments that the ones in higher latitude exhibit a longer period and those in the lower east exhibit a shorter period.

How to cite: Wang, W., Dong, Z., and Ren, L.: Spatiotemporal variations of the precipitation in the Yellow River Basin using a novel hierarchical discrete-continuous wavelet decomposition model, EGU General Assembly 2024, Vienna, Austria, 14–19 Apr 2024, EGU24-14801, https://doi.org/10.5194/egusphere-egu24-14801, 2024.

Physics-informed neural networks (PINNs) have recently been developed as a novel solution approach for physical problems governed by partial differential equations (PDEs). Compared to purely data-driven methods, PINNs have the advantage of embedding physical constraints in the training process, thus increasing their reliability. Compared to traditional numerical methods for PDEs, PINNs have the advantage of being “meshless”; they are in general less accurate and more computationally expensive, but also more suitable to sparse-data assimilation and to inverse modelling, which is increasing their popularity in many scientific fields. However, hydraulic applications of PINNs in the context of free-surface flows are still in their infancy.

In this work, the effectiveness of PINNs to model one-dimensional free-surface flows over non-horizontal bottom is tested. The governing PDEs are the shallow water equations (SWEs), which represent the mass and momentum conservation in free-surface flows. The inclusion of a spatially variable topography in a meshless method such as PINNs is not trivial. Here, the idea of solving the augmented system of SWEs with topography is exploited. Augmentation consists in treating the bed elevation as a conserved variable (together with water depth and unit discharge) and adding a fictitious equation to the system, which states that this variable is constant in time (i.e., its time derivative is null), while it can be variable in space (its space derivative is included in the bed slope source term). In this way, bed elevation can be easily provided with other initial conditions, and the fixed-bed constraint preserves its value in time.

Different cases of unsteady flows with flat and non-flat bottom are considered, and the accuracy obtained using PINNs with augmented SWEs is checked by comparing PINNs predictions with analytical solutions. Results show that a fair accuracy for depth and velocity can be obtained, even for some challenging test cases such as the dam-break over a bottom step and the planar flow over a parabolic basin (Thacker’s test case). Moreover, it is shown that, if PINNs are applied to a case with horizontal bottom, for which topography is not strictly necessary, similar accuracy and computational time are obtained when PINNs solve standard SWEs or augmented SWEs. It can therefore be concluded that the augmentation of SWEs is a simple but promising strategy to deal with flows over complex bathymetries using PINNs, which paves the way for applications to flows over more realistic topographies.

How to cite: Dazzi, S.: Solving Shallow Water Equations with Topography using Physics-Informed Neural Networks , EGU General Assembly 2024, Vienna, Austria, 14–19 Apr 2024, EGU24-15690, https://doi.org/10.5194/egusphere-egu24-15690, 2024.

Understanding morphological changes in river basins is important for efficient river basin management. Such studies on morphological changes can be efficiently carried out by processing remote sensing images. In this respect Google Earth Engine (GEE) provides an efficient platform for processing of such images. In this research an automatic identification of land and water from satellite imageries was carried out by using the water index based unsupervised classification approach. Multiple water indices were compared for the Brahmaputra River (Assam reach). Landsat images from 1990 to 2020 were used in the study. Various thresholding approaches available in the literature were applied to determine which particular index in combination with which thresholding approach provides the best classification. We found the Normalized Difference Water Index (NDWI) as the best index for unsupervised classification. Subsequently, a supervised classification approach was adopted to classify land and water from satellite images. In particular, three classification methods were used, namely: Classification and Regression Tree (CART), Random Forest (RF) and Support Vector Machine (SVM). The classifiers were trained with B2, B3, B5 and B6 (Blue, Green, NIR and SWIR1) bands as the input and the pre-classified pixel class as the output. The resulting classified images were compared with the Joint Research Centre (JRC) monthly water maps and a good accuracy was observed. Among the three methods RF gave the best results. For the Brahmaputra basin we noticed a lot of morphological changes during 1990 and 2020. This research showed that given good quality training data classifiers can be built, which can automatically extract water bodies from Landsat or similar images and can be used in morphological assessment of any river basin.

Keywords: Surface water extraction, supervised classification, Brahmaputra, Google Earth Engine (GEE).

How to cite: Bhattacharya, B., Rahman, M., and Alfonso, L.: Machine learning in classifying morphological changes in the Brahmaputra River using multi-spectral Landsat images in the Google Earth Engine, EGU General Assembly 2024, Vienna, Austria, 14–19 Apr 2024, EGU24-16560, https://doi.org/10.5194/egusphere-egu24-16560, 2024.

EGU24-17807 | ECS | Orals | HS3.1

Flood Forecasting with Deep Learning LSTM-Networks: Relevance of Catchment Attributes in Regional Network Training 

Tanja Morgenstern, Jens Grundmann, and Niels Schütze

Floods present one of the most frequent natural hazards in Germany. In order to efficiently and successfully deal with instances of floods we need timely and reliable forecasts of the expected runoff. During the last decades, several deep learning methods proved to be valuable for rainfall-runoff modelling in many larger catchments, especially Long Short-Term Memory (LSTM) networks. One of the core challenges of data-driven models is the provision of an extensive and informative training database, implicitly describing the cause-effect relationships for different catchment conditions. However, the data basis of individual catchments regarding flood events may be limited due to short observation time series as well as a general lack in flood events during the observation period, which may cause flawed data-driven models for flood forecasting. These problems become even more pronounced in hourly flood forecasts for small-scale, fast responding catchments.

In this study with the purpose of hourly forecasting runoff events in small-scale Saxon catchments, we solved aforementioned dilemma through an extension of the training database from single-catchment datasets (“local network training”) to one dataset containing multiple catchments from one bigger region (“regional network training”). In consequence, we trained our LSTM networks on hourly rainfall and runoff time series of preselected rainfall-runoff-events from 52 Saxon catchments. Alongside these time series, we included a selection of attributes regarding the catchment’s characteristics and its climate, which allows the model to differentiate between catchments and to condition the runoff generation according to the catchment characteristics. In this contribution, we show that our regional network training facilitates rainfall-runoff simulations even at gauging sites with short observation periods – too short to enable local network training – and in in extreme cases even at ungauged catchments during flood events. We further discuss the following questions:

  • Which catchment attributes have the highest influence on the quality of hourly flood forecasting in regional network training? The selection of attributes contains topography (e.g. area, catchment shape, elevation, slope & river length), land use (e.g. sealing of the ground & vegetation) as well as climatic conditions (e.g. aridity, yearly potential evapotranspiration and rainfall).
  • In which case may the catchment attributes be omitted in regional network training?
  • When do local and regional network trainings result in flood forecasts of similar quality?

How to cite: Morgenstern, T., Grundmann, J., and Schütze, N.: Flood Forecasting with Deep Learning LSTM-Networks: Relevance of Catchment Attributes in Regional Network Training, EGU General Assembly 2024, Vienna, Austria, 14–19 Apr 2024, EGU24-17807, https://doi.org/10.5194/egusphere-egu24-17807, 2024.

EGU24-18400 | ECS | Orals | HS3.1

Developing a mobile app for adopting efficient irrigation technologies for cotton production in India 

Mario Alberto Ponce Pacheco, Soham Adla, Ramesh Guntha, Aiswarya Aravindakshan, Maya Presannakumar, Ashray Tyagi, Anukool Nagi, Prashant Pastore, and Saket Pande

Smallholder farmers are critical to global food production and natural resource management. Due to increased competition for water resources and variability in rainfall due to climate change, chronic irrigation water scarcity is rising particularly in drought-prone regions like Vidarbha, Maharashtra (India). Improving irrigation water efficiency is critical to sustainable agricultural intensification; however, adopting a new technology represents a certain level of risk for the farmers, who invest time and economic resources in changing their practices. Because of the uncertainties in the rainfall (monsoon onset and dry spells), in addition to the upcoming global change, the expected yield is unsure and variable; so, a paradigm comparison between different irrigation technologies is not clear.  We have developed software that allows farmers to make decisions in real time based on the implemented practices (fertilisation and irrigation) in their crops, mainly cotton. By implementing a socio-hydrological dynamic model, the software provides a risk forecast of the yield and profit the user can expect at the end of the season under the current practices; in addition, the software computes the forecast of the production under a provided best practices scenario, so the users can compare and improve their practices. The model also considers state variables the water storage water and biomass production, providing an understanding of the impact of the executed practices in the natural resources. Finally, we implemented a kernel principal component analysis (KPCA) to consider the impact of socioeconomic factors on the yearly outcome, based on previous surveys performed in the area. We’ve focused on object-oriented programming (OOP) approach in order to optimise the management of the information. The app not only processes social and agricultural information provided by the user but also retrieves and continually updates climate datasets from the web, as well as market prices. The farmers can request the execution of the social-hydrological model to our servers from their own mobile devices, helping to the adoption of technologies. By following an agile methodology, the mobile app has been tested with farmers in order to get feedback from real users; this brought the opportunity to redesign the functionality based on the correct understanding of information and, a fast and clear management of the tool. In addition, this software represents a useful tool to capture and follow information about the use of water by farmers.

How to cite: Ponce Pacheco, M. A., Adla, S., Guntha, R., Aravindakshan, A., Presannakumar, M., Tyagi, A., Nagi, A., Pastore, P., and Pande, S.: Developing a mobile app for adopting efficient irrigation technologies for cotton production in India, EGU General Assembly 2024, Vienna, Austria, 14–19 Apr 2024, EGU24-18400, https://doi.org/10.5194/egusphere-egu24-18400, 2024.

EGU24-19399 | ECS | Posters on site | HS3.1

Development and Evaluation of Machine Learning Models for Vortex Tube Sediment Ejector 

Sanjeev Kumar and Chandra Shekhar Prasad Ojha

The vortex tube silt ejector (VTSE) is an important hydraulic device for reducing sediment deposits in canals, providing a very effective alternative to manual sediment removal. The complex nature of the silt removal process occurs from the spatially varied flow (SVF) in the channel and the rotational flow within the tube. Conventional models often struggle to accurately predict silt removal efficiency due to these complexities. However, recent advancements in machine learning (ML) present robust alternatives for understanding and modelling such complex hydraulic processes. In this study, we explore the application of various ML models, i.e. Support vector machine (SVM), Random forest (RF), and Random tree (RT) to quantify the efficiency of vortex tube silt ejector using laboratory datasets. Comparative analysis are conducted with conventional models to predict the efficacy of ML based models. The findings of the study reveal that the RT model, exhibiting a Root Mean Square Error ( RMSE) of 2.165 and Nash-Sutcliffe Efficiency (NSE) of 0.98 outperforms the other applied ML models, demonstrating suppier accuracy with fewer errors. Sensitivity analysis focuses on the extraction ratio as a critical parameter in computing vortex tube silt ejector removal efficiency. The outcomes derived from the ML- based moldes presented in this study hold effective implications for hydraulic engineers and researchers involved in assessing the sediment removal efficiency of vortex tube silt ejectors. Nevertheless, to formulate a more universally application models for the comprehensive research, both within the same field and in related areas, may be imperative.

How to cite: Kumar, S. and Ojha, C. S. P.: Development and Evaluation of Machine Learning Models for Vortex Tube Sediment Ejector, EGU General Assembly 2024, Vienna, Austria, 14–19 Apr 2024, EGU24-19399, https://doi.org/10.5194/egusphere-egu24-19399, 2024.

EGU24-19450 | ECS | Orals | HS3.1

WOLFHydro: a modular framework for multi-model hydrological simulations 

Christophe Dessers, Pierre Archambeau, Benjamin Dewals, Sébastien Erpicum, and Michel Pirotton

In hydrology, a plethora of modelling approaches exist. They differ in several aspects, including the underlying hypotheses (empirical, conceptual vs. physically based) and the spatial discretisation (lumped, semi-distributed, gridded). The advent of machine learning or AI techniques further expands the spectrum of available modelling options. In this context, there is a growing scientific interest in systematically comparing existing models, understanding the reasons behind their relative performance, and applying multi-model approaches to increase the reliability of the outcomes. However, few research has been carried out so far to compare all these types of models in the same framework, namely using similar input data, pre-processing procedures, parameter optimisation algorithms and strategy, objective function, etc.


WOLFHydro, developed by the HECE group at the University of Liège, offers such a framework. It addresses a flexible simulation tool organised in ‘modules’ and capable of representing any catchment, thus keeping a tuneable level of complexity and details in the description of all the physical processes at work, while remaining in the same modelling environment and starting from exactly the same input data. The software parcels out a catchment into sub-catchments or evaluation points, which are arranged in a topology network. Each module can contain a chosen type of model (physically based, conceptual, empirical) with the desired spatial representation (lumped, gridded, semi-distributed) to be assembled and facilitate the creation of hybrid models. The software also accommodates anthropogenic structures, such as dams, storage basins, or any other hydraulic structure defined by a set of operation rules customable by the user.


The software currently contains a number of models developed in-house, as well as widely accepted ones (GR4H, VHM, etc). They have been validated and tested on several Belgian catchments, in particular for the 2021 extreme floods in the Vesdre and Amblève valleys. The software also features post-processing tools and a GUI interface to facilitate inspection of the results.


Thanks to its versatility, WOLFHydro aims at reducing biases in model comparisons conducted in separated frameworks, improving our understanding of dominant hydrological processes, improving the evaluation of the influence model structure complexity, and carry out ensemble modelling.

How to cite: Dessers, C., Archambeau, P., Dewals, B., Erpicum, S., and Pirotton, M.: WOLFHydro: a modular framework for multi-model hydrological simulations, EGU General Assembly 2024, Vienna, Austria, 14–19 Apr 2024, EGU24-19450, https://doi.org/10.5194/egusphere-egu24-19450, 2024.

EGU24-19697 | ECS | Posters on site | HS3.1

Comprehensive Hydrological Modeling Tool for Flood Discharge Estimation in Sicilian Watersheds 

Giuseppe Cipolla, Antonio Francipane, Dario Treppiedi, Calogero Mattina, and Leonardo Valerio Noto

Designing hydraulic infrastructures and/or carry out a flood risk assessment analysis, as mandated by Directive 2007/60/EC of the European Parliament regarding the assessment and management of flood risk, needs estimating flood discharges for different return periods. In the current era, Geographic Information Systems (GIS) make more efficient the integration of spatially distributed data and advanced analytical tools for hydrological applications.

This work introduces a Python-based tool that merges GIS functionalities (i.e., open-source geospatial libraries, such as native QGIS plugins, GDAL, SAGA) with hydrological modeling techniques, providing a comprehensive framework for watershed analysis aimed to derive synthetic flood hydrographs for specified return periods. The tool is composed of different modules, performing different operations: following the delineation of the watershed based on a user-specified outlet, the tool uses a regionalized approach to establish Depth-Duration-Frequency (DDF) curves and derives the synthetic Chicago hyetographs for specified return periods. The tool comprises a module for calculating runoff depths using the Curve Number method and another module where flow hydrographs are derived by using distributed unit hydrograph (D-UH) through a spatial representation of times of concentration, accounting for varying flow velocities within the watershed. Additionally, the tool allows for the simulation of the basin response to historical precipitation. In the present study, the tool underwent testing on catchments of Sicily (Italy) even if it is worth noting that the tool can be customized for application in various regions worldwide.

How to cite: Cipolla, G., Francipane, A., Treppiedi, D., Mattina, C., and Noto, L. V.: Comprehensive Hydrological Modeling Tool for Flood Discharge Estimation in Sicilian Watersheds, EGU General Assembly 2024, Vienna, Austria, 14–19 Apr 2024, EGU24-19697, https://doi.org/10.5194/egusphere-egu24-19697, 2024.

EGU24-21973 | Orals | HS3.1

Back Propagation (BP) Neural Network for a Short-term Forecasting Tool in Wastewater Treatment Plant Influent 

Wenchuang Zhang, Eoghan Clifford, and Páraic Ryan

Influent flow volumes play a crucial role in the management and operation of wastewater treatment plants (WWTP). In regions like Europe, characterized by abundant rainfall and aging wastewater systems, it is common to discharge stormwater into the sewerage system, i.e.  the use of combined sewer systems in urban areas, employing a single pipe for transporting both rainfall and wastewater. Consequently, large amounts of rainfall can cause WWTP to become overloaded, which can lead to wastewater overflows i.e. discharge of untreated wastewater into receiving water bodies. This can have a significant impact on the surrounding environment, damaging ecological systems hindering the use of public amenities such as beaches. Recently researchers have used machining learning methods to predict WWTP influent volumes to help manage these issues. There are however a number of outstanding challenges such as a lack of parameter selection processes, high likelihood of incorporating noise information with the intervention of more input data and the existence of model uncertainty.  This study aims to use Back Propagation Neural Network (BPNN) combined with a sensitivity analysis to help address these existing shortcomings, and provide a short-term forecasting tool which seeks to provide WWTP managers and operators ban eastly warning of potential overflow events. Gaussian Process Regression (GPR) has also been applied herein to provide probabilistic estimates of predictions. This provides information on the level of confidence associated with the predicted values by assessing the uncertainty of the model.

In this research, the input variables from five aspects have been considered: i) an energy-water balance model; ii) infiltration; iii) the effect of seasonal variation; iv) the influence of changes in tidal and river level; v) lag effects. Different combinations of input variables were used using recorded weather data and wastewater influent data for a WWTP in Ireland. In Group 1, daily precipitation, previous daily precipitation, max air temperature, soil moisture deficit, groundwater level and seasonal index have been used to predict WWTP influent, with a resulting   value of 0.68. Group 2 considers daily precipitation, previous daily precipitation, soil moisture deficit, tidal level and river level, with an  of 0.79. Then we added previous daily influent into group 1 and 2, respectively, having the same result, with the value of  equalling to 0.88. These results provide new insights for timely warning of influent variations and potential overflow, improve the practicality of machine learning in WWTP.

How to cite: Zhang, W., Clifford, E., and Ryan, P.: Back Propagation (BP) Neural Network for a Short-term Forecasting Tool in Wastewater Treatment Plant Influent, EGU General Assembly 2024, Vienna, Austria, 14–19 Apr 2024, EGU24-21973, https://doi.org/10.5194/egusphere-egu24-21973, 2024.

EGU24-1313 | ECS | Posters on site | HS3.2

Research on Data Mining-Based Precision Flood Control Scheduling Strategy for Reservoirs 

Ningning Li, Chao Tan, Bikui Zhao, Jing Huang, and Yehongping Qin

The accurate assessment of the relationship between reservoir outflow and downstream floods is often challenging in flood control scheduling of upstream reservoirs aimed at downstream flood protection. In this research, the Fengshuba Reservoir in the Dongjiang River Basin, China, is taken as the subject of study. Utilizing a dataset encompassing 62 years of daily measured flood processes, the MIC coefficient is employed to determine the correlation between the reservoir outflow process at different lag times and the flow at the downstream section. The flood propagation time is determined by identifying the lag time associated with the maximum MIC value. By utilizing the BPANN model, which incorporates the reservoir outflow process and the interval flood process as inputs, an accurate prediction of the downstream flood process is achieved, resulting in a closer approximation to reality in flood estimation at the downstream section. The model has been validated in the district between Fengshuba and Longchuan, exhibiting a certainty coefficient of 97% and a prediction qualification rate of nearly 90%. In comparison with the conventional Maskingen evolution method, the calculated outcomes provide enhanced support for flood control safety, enabling precise hourly control of downstream flood processes and upstream reservoir outflow processes.

How to cite: Li, N., Tan, C., Zhao, B., Huang, J., and Qin, Y.: Research on Data Mining-Based Precision Flood Control Scheduling Strategy for Reservoirs, EGU General Assembly 2024, Vienna, Austria, 14–19 Apr 2024, EGU24-1313, https://doi.org/10.5194/egusphere-egu24-1313, 2024.

In recent years, heavy rainfall and flash flood events have occurred worldwide, leading to wide damage on technical and social infrastructure. Due to climate change, it can be assumed that these water extreme events will increase in future. A water-sensitive urban development is one strategy to address these flash floods and to minimize their consequences. For this purpose, emergency drainage routes are required in order to divert the water masses through urban areas with as little damage as possible. The research project “Urban Flood Resilience – Smart Tools” (FloReST), funded by the German Federal Ministry of Education and Research (BMBF), focuses on the assessment of emergency drainage routes and flow paths with the aim to increase the resilience of infrastructures against flash floods within the context of a water-sensitive urban development.

In this study, both load-independent and load-dependent grid-based analyses for flow path identification were conducted on digital terrain models (DTM) of varying spatial resolutions. The objective is to assess the impact of spatial resolution on modelling results and derive the potential vulnerability of infrastructure to flash floods. To achieve this, freely available geospatial data generated through airborne laser scanning, as well as additional geospatial data collected through terrestrial surveying, are utilized.

Identifying emergency drainage routes requires information on flow paths, water depths, and potential flooding extents. Both one-dimensional analysis and two-dimensional hydrodynamic modelling are typically based on digital terrain models with a resolution of 1 m x 1 m (DTM1). However, for precise planning of emergency drainage routes, the DTM1 is inadequate due to its limited spatial resolution.

In our study area in the Ahr Valley (Germany), various flow path analyses were conducted on DTMs with different spatial resolutions. Analyses based on state-of-the-art methods using the DTM1 showed that the calculated flow paths align with the actual flow paths in rural areas but significantly deviate in urban areas. Local, runoff-relevant structures, such as curbs and smaller walls, were either not covered or inadequately represented with this resolution. However, these structures can have a significant impact on flow paths and flood vulnerability in urban areas.

To simulate water movement more accurately the DTM was refined. Higher-resolution terrain models are generated by processing raw data from freely available geospatial sources and used for 2D hydrodynamic modelling. This approach, allows to identify more detailed flow paths and water depths especially in urban areas. Depending on local conditions, additional surveying may be necessary to capture all runoff-relevant structures. In a further step, a combined DTM is created using both terrestrial surveying and freely available geospatial data generated through airborne laser scanning. Flow path analyses based on this combined DTM enable a detailed assessment of urban infrastructure vulnerability to flash floods as well as a high-resolution planning of measures. 

How to cite: Stratmann, G., Kirschbauer, P. Dr.-Ing. L., and Hörter, L.: Grid-based 2D hydrodynamic modelling for heavy rainfall prevention: Impact of geospatial resolution and the assessment of urban infrastructure vulnerability to flash floods, EGU General Assembly 2024, Vienna, Austria, 14–19 Apr 2024, EGU24-1950, https://doi.org/10.5194/egusphere-egu24-1950, 2024.

The escalating challenges posed by rapid urbanization and climate change have intensified the quest for sustainable stormwater management strategies. Permeable pavement practices have emerged as a pivotal solution to effectively control stormwater runoff and address the associated flooding issues. This study delves into the comparative analysis of three prevalent permeable pavement types—permeable asphalts (PA), permeable concretes (PC), and permeable interlocking concrete pavers (PICP)—with the overarching goal of identifying the most efficient solution for alleviating the negative impacts of surface runoff.

In pursuit of this objective, the study conducts simulations for three distinct scenarios, each representing different extreme storm events within a designated catchment area. The evaluation encompasses the performance of PA, PC, and PICP, both with and without the integration of permeable pavements, utilizing the sophisticated Personal Computer Stormwater Management Model (PCSWMM). The selected catchment area is situated in King County, Washington, USA, providing a real-world context for the investigation.

The validation of the PCSWMM model attests to its reliability in predicting peak discharges within the study reach, establishing a robust foundation for subsequent analyses. The outcomes reveal that all three forms of permeable pavement effectively prevent flooding, with PA emerging as the most formidable solution, showcasing a remarkable average reduction of 51.25% in peak flow and 65% in total flow. In contrast, PC demonstrates a slightly more modest improvement, with average reductions of 21.75% in peak flow and 34.25% in overall flow. Furthermore, PICP exhibits the lowest reduction in peak flow (7.0%) and total runoff volume (15.75%). In conclusion, this study offers valuable insights into the comparative effectiveness of permeable pavements in urban stormwater management, emphasizing the critical role of thoughtful pavement selection in sustainable urban planning endeavors.

How to cite: Salem, A., Abduljaleel, Y., and Amen, E. M.: Enhancing Urban Stormwater Resilience: A Comparative Study of Permeable Asphalt, Concrete, and Interlocking Pavers for Sustainable Flood Mitigation, EGU General Assembly 2024, Vienna, Austria, 14–19 Apr 2024, EGU24-2209, https://doi.org/10.5194/egusphere-egu24-2209, 2024.

EGU24-2706 | ECS | Posters on site | HS3.2

Quantifying predictive uncertainty in satellite precipitation data correction using ensemble learning 

Georgia Papacharalampous, Hristos Tyralis, Nikolaos Doulamis, and Anastasios Doulamis

We present the first ensemble learning methods for quantifying predictive uncertainty in satellite precipitation data correction, as well as the large-scale comparison of these methods. Ensemble learning was performed by combining in multiple ways a variety of machine learning algorithms that are particularly suited for the task of interest. Monthly precipitation data from across the contiguous United States supported the comparison, which predominantly relied on skill scores and referred to the ability of the ensemble learning methods in delivering predictive quantiles at many levels. The results allow the ordering from the best to the worst of the ensemble learning methods.


Acknowledgements: The research project was supported by the Hellenic Foundation for Research and Innovation (H.F.R.I.) under the “3rd Call for H.F.R.I. Research Projects to support Post-Doctoral Researchers” (Project Number: 7368).

How to cite: Papacharalampous, G., Tyralis, H., Doulamis, N., and Doulamis, A.: Quantifying predictive uncertainty in satellite precipitation data correction using ensemble learning, EGU General Assembly 2024, Vienna, Austria, 14–19 Apr 2024, EGU24-2706, https://doi.org/10.5194/egusphere-egu24-2706, 2024.

EGU24-2707 | Posters on site | HS3.2

Predictive uncertainty estimation in satellite precipitation data correction using machine learning 

Hristos Tyralis, Georgia Papacharalampous, Nikolaos Doulamis, and Anastasios Doulamis

Predictive uncertainty estimates for precipitation data acquired through merging satellite and ground-based observations are usually not provided. Here, we present the first benchmark experiments on the use of machine learning algorithms for fulfilling the task of delivering such estimates. These experiments compared six machine learning algorithms (i.e., quantile regression, quantile regression forests, generalized random forests, gradient boosting machines, light gradient boosting machines and quantile regression neural networks) and relied on 15-year-long monthly data that originate from across the contiguous United States. The comparison referred to the ability of the machine learning algorithms in delivering predictive quantiles at various levels. The results allow the ordering from the best to the worst of the machine learning algorithms for the problem of interest.


Acknowledgements: The research project was supported by the Hellenic Foundation for Research and Innovation (H.F.R.I.) under the “3rd Call for H.F.R.I. Research Projects to support Post-Doctoral Researchers” (Project Number: 7368).

How to cite: Tyralis, H., Papacharalampous, G., Doulamis, N., and Doulamis, A.: Predictive uncertainty estimation in satellite precipitation data correction using machine learning, EGU General Assembly 2024, Vienna, Austria, 14–19 Apr 2024, EGU24-2707, https://doi.org/10.5194/egusphere-egu24-2707, 2024.

EGU24-2901 | ECS | Posters on site | HS3.2

Development and sensitivity analysis of a tool to generate synthetic urban drainage models globally 

Barnaby Dobson, Tijana Jovanovic, and Taher Chegini

Continual improvements in the quality, coverage, and accessibility of global geospatial datasets now mean that it is feasible to derive hydraulically plausible urban drainage networks and simulation models of these networks in cities worldwide. Privacy concerns, coupled with the cost and uncertainties in developing traditional network models, have fuelled the demand for such synthetic alternatives. We present SWMManywhere, which can create a hydraulically plausible Storm Water Management Model (SWMM) simulation model for a city using only the boundary coordinates of the target area. The datasets used in SWMManywhere are global, although their quality varies from country to country. We assess the utility of a SWMManywhere model by comparing pluvial flooding, in-pipe flows, and drainage network outflows in known networks. A previously unexplored difficulty with the use of synthetic network generation in urban environments is delineating the network’s boundaries when there are multiple and competing plausible outfalls, which is typical of most large cities. By using a sensitivity analysis approach, we explore how changing parameters associated with the network topology and boundaries can alter simulations. Assessing the uncertainty in our method helps to understand whether synthetically generated network models can produce meaningful simulations in their presumed most common use case: a dense urban environment where little is known about the network’s boundaries or outfalls.  

How to cite: Dobson, B., Jovanovic, T., and Chegini, T.: Development and sensitivity analysis of a tool to generate synthetic urban drainage models globally, EGU General Assembly 2024, Vienna, Austria, 14–19 Apr 2024, EGU24-2901, https://doi.org/10.5194/egusphere-egu24-2901, 2024.

EGU24-4950 | ECS | Posters on site | HS3.2

Enhancing Flood Resilience through Integrated Models in a Streamflow-Scarce Watershed 

Yong Jung, Mun Ju Shin, and Seong Jae Jeon

A watershed with insufficient streamflow data faces challenges in mitigating flood damages through infrastructure. Many small/middle-size watersheds adopt data from nearby watersheds with sufficient measurements, based on the similarity of watershed characteristics and weather conditions. However, not many areas have optimal conditions to utilize data from nearby sources. To generate streamflow, we employ a regional weather model (the Weather Research and Forecasting model or WRF) and a rainfall-runoff model known as Génie Rural à 4 paramètres Horaires (GR4H). The WRF model generated rainfall data for past years base on the globally simulated data (Final (FNL) data from NCEP) with possible physical atmospheric conditions. The optimally conditioned GR4H produced streamflow data using rainfall data from WRF. All produced streamflow data is statistically tested for the applicability as basic data for background information to decrease the flood damages.

How to cite: Jung, Y., Shin, M. J., and Jeon, S. J.: Enhancing Flood Resilience through Integrated Models in a Streamflow-Scarce Watershed, EGU General Assembly 2024, Vienna, Austria, 14–19 Apr 2024, EGU24-4950, https://doi.org/10.5194/egusphere-egu24-4950, 2024.

EGU24-8166 | ECS | Posters on site | HS3.2

Conformal Prediction Intervals For Water Demand Forecasting 

Christiaan Wewer and Riccardo Taormina

In a world with accelerating climate change, rapid population increase and urbanization, urban water systems are under a growing stress. Precise short- and medium-term water demand forecasting are needed to optimize water supply operations. While machine learning methods are commonly used for this task, most studies rely on point predictions which lack a robust characterization of prediction errors. This undermines decision making under uncertainty and related applications. In this work, we employ real data to demonstrate the advantages of probabilistic water demand forecasting up to a week ahead. In particular, we explore the benefits of conformal predictions, a set of novel techniques providing distribution-free prediction intervals. Conformal predictions are model agnostic and may guarantee the validity of the prediction intervals under some assumptions. We apply the conformal prediction framework on several ML models, including tree-based methods, deep neural network models and classical time series analysis. We compare these conformalized approaches against traditional probabilistic methods such as quantile regression and Monte-Carlo dropout.

How to cite: Wewer, C. and Taormina, R.: Conformal Prediction Intervals For Water Demand Forecasting, EGU General Assembly 2024, Vienna, Austria, 14–19 Apr 2024, EGU24-8166, https://doi.org/10.5194/egusphere-egu24-8166, 2024.

EGU24-9589 | ECS | Posters on site | HS3.2

Enhancing Agricultural Drought Assessment through the Standardized Irrigation Water Deficit Index 

Shijia Wang, Yongqiang Zhang, and Jing Tian

Irrigation plays a crucial role in bolstering crop productivity and ameliorating the adverse impacts of drought. Despite its significance, existing studies have not extensively incorporated irrigation into agricultural drought indicators. In this study, we introduce a novel agricultural drought index, the Standardized Irrigation Water Deficit Index (SIWDI) that is quantified using meteorological, phenological, and runoff inputs. To test its robustness, we calculated the irrigation water deficit for three major crops across various time scales in the Yangtze River Basin over the past 23 years. Our analysis reveals that the irrigation water deficit in this region follows a norminvgauss probability distribution. Drawing a mathematical parallel to the Standardized Precipitation Evapotranspiration Index (SPEI), the SIWDI is compared to the SPEI across the Yangtze River Basin. Results underscore the SIWDI’s notable advantage in evaluating drought conditions in agriculturally concentrated regions, alleviating the impact of non-growing season droughts by incorporating crop growth processes and spatial distribution. This innovative index provides monitoring outcomes closely aligned with actual conditions, empowering farmers to respond more effectively to the looming threat of drought.

How to cite: Wang, S., Zhang, Y., and Tian, J.: Enhancing Agricultural Drought Assessment through the Standardized Irrigation Water Deficit Index, EGU General Assembly 2024, Vienna, Austria, 14–19 Apr 2024, EGU24-9589, https://doi.org/10.5194/egusphere-egu24-9589, 2024.

EGU24-10654 | Orals | HS3.2

A Gaussian anamorphosis model for asymmetrically distributed data 

Emmanouil A Varouchakis, Andreas Pavlides, and Dionissios T Hristopulos

Environmental mining and exploration present a challenge for spatial analysis due to small sample sizes and data clustering near mining sites. Additionally, the properties of the covariance function may vary across different mines within the same region, necessitating adaptable geostatistical techniques. A novel approach to analyzing mining data spatial dependence introduces the use of Gaussian Anamorphosis, employing the recently proposed Kernel Cumulative Density (KCDE) method. This technique is particularly effective for data sets that exhibit non-Gaussian distributions, such as the typically asymmetrically distributed natural resources data. Gaussian Anamorphosis through KCDE enables the transformation of skewed probability density functions (PDFs) into the normal distribution. KCDE converts the original data distribution into a continuous cumulative density function (CDF), smoothing out the discontinuities inherent in the traditional staircase CDF estimation approach.
We extend our analysis by conducting Kriging interpolation on the transformed data. Since the transformed data distribution closely approximates the normal distribution, it is possible to use the Kriging variance to reliably estimate prediction intervals before the results are inversely transformed back to their original scale for practical interpretation.
To explore the variability of our results, we implemented Monte Carlo simulations based on the transformed data. The simulations provide insights into the potential outcomes and their variabilities, which were then inversely transformed back to their original scale for practical interpretation.
The findings of this study underscore the effectiveness of Gaussian Anamorphosis using KCDE transformation in dealing with non-Gaussian data distributions in geostatistical analyses. The approach enhances the reliability of spatial predictions and offers robust confidence intervals. Our research demonstrates the potential of combining advanced transformation techniques with geostatistical models to address complex spatial dependencies of natural resources data.

The research project is implemented in the framework of H.F.R.I call “Basic research Financing (Horizontal support of all Sciences)” under the National Recovery and Resilience Plan “Greece 2.0” funded by the European Union – NextGenerationEU (H.F.R.I. Project Number: 16537).

How to cite: Varouchakis, E. A., Pavlides, A., and Hristopulos, D. T.: A Gaussian anamorphosis model for asymmetrically distributed data, EGU General Assembly 2024, Vienna, Austria, 14–19 Apr 2024, EGU24-10654, https://doi.org/10.5194/egusphere-egu24-10654, 2024.

EGU24-11302 | ECS | Posters on site | HS3.2

Developing Physical Flood Risk in the face of Climate Change: A Case Study for South Korea and South-Eastern China 

Eunbeen Park, Hyun-Woo Jo, Jiwon Son, Florian Kraxner, and Woo-Kyun Lee

The impact of climate change and extreme weather events, such as heatwaves and heavy rainfall, poses a severe environmental crisis, affecting both natural and socioeconomic systems, including governments and businesses. Responding to this, the Task Force on Climate-related Financial Disclosures (TCFD) emphasizes the need for organizations to quantitatively announce their physical risks and opportunities under climate change, highlighting proactive management of their risks.

With its seasonal concentrated rainfall and topographical influences, East Asia faces escalating vulnerabilities to droughts and floods. Collaborative disaster response efforts at governmental and corporate levels are crucial. This study focused on the data availability in South Korea and China's southeastern region to develop flood risk models to support reporting by the TCFD.

For South Korea, a model was developed by using time-series flood traces from 2006 to 2018 as training data, incorporating monthly maximum consecutive 5-day precipitation, topography, soil, and land cover maps into a random forest model. In China, a model was developed by combining monthly maximum consecutive 5-day precipitation and topographic information. Results highlight flood risks, particularly in South Korea's low-lying agricultural areas and southeastern China's lowland and coastal regions. Both countries experience increased flood risk under SSP1-2.6 and SSP5-8.5 scenarios from 2030s to 2050s, corresponding to rising future maximum rainfall.

Given the tendency for floods to persist in previously affected areas, disaster preparedness through predictive measures becomes imperative, shifting the focus from post-disaster recovery to proactive disaster prevention. Additionally, guidelines for government and corporate-level utilization of available data and establishing action priorities in the event of a disaster are necessary.

How to cite: Park, E., Jo, H.-W., Son, J., Kraxner, F., and Lee, W.-K.: Developing Physical Flood Risk in the face of Climate Change: A Case Study for South Korea and South-Eastern China, EGU General Assembly 2024, Vienna, Austria, 14–19 Apr 2024, EGU24-11302, https://doi.org/10.5194/egusphere-egu24-11302, 2024.

EGU24-12604 | ECS | Orals | HS3.2

Optimizing hydrological modeling on real urban catchment: impact of calibration data selection 

Mohammed N. Assaf, Nicolo Salis, Enrico Creaco, Lorenzo Tamellini, Manenti Sauro, and Sara Todeschini

Hydrological models are crucial in various engineering applications, including streamflow forecasting and flood risk estimation. Tools like the Stormwater Management Model (SWMM) are indispensable for efficacious water resource management. Calibrating these models is a necessary step to minimize parameter uncertainties and ensure accurate representation of a catchment area's hydrological response. However, the calibration process often faces challenges due to the need for extensive parameter adjustments. Sensitivity analysis (SA) is employed to mitigate these challenges by identifying and focusing on the most influential parameters, thereby streamlining the calibration process. In this work, the Morris method was applied to identify the sensitive parameters in the SWMM model, which were subsequently considered in the optimization process using Genetic Algorithms (GA). The results of the sensitivity analysis highly depend on the model output targets, such as total runoff volume and peak flow rate.

The traditional approach of dividing data into calibration and evaluation subsets is a fundamental practice in model development. Nevertheless, the impact of data allocation on model evaluation performance has not received sufficient attention in the literature. This study investigates the influence of calibration data selection on model performance, utilizing high-resolution experimental rainfall-runoff data from the urban catchment of Cascina Scala in Pavia, Italy. Four criteria—rainfall depth, mean intensity, hydrograph's center of mass, and maximum rainfall depth over five minutes—were employed to select the calibration set. From a total of 24 events, the four criteria were employed to select 8 events from 16 for calibration, while the remaining 8 events were designated for validation. The findings underscore that the selection of the calibration dataset substantially influences the optimally calibrated parameters, subsequently altering model performance.

How to cite: Assaf, M. N., Salis, N., Creaco, E., Tamellini, L., Sauro, M., and Todeschini, S.: Optimizing hydrological modeling on real urban catchment: impact of calibration data selection, EGU General Assembly 2024, Vienna, Austria, 14–19 Apr 2024, EGU24-12604, https://doi.org/10.5194/egusphere-egu24-12604, 2024.

EGU24-13490 | ECS | Orals | HS3.2

Enhancing Reservoir Management for Sustainable Hydropower Generation: A Machine Learning-Driven Approach in Response to Increasing Extreme Events in Ecuador 

María José Merizalde, Gerald Corzo, Paul Muñoz, Pablo Guzmán, Esteban Samaniego, and Rolando Célleri

In recent years, frequent climate extreme events have significantly impacted various sectors, especially critical ones like hydropower generation. In Latin America and the Caribbean, hydropower constitutes a pivotal element, contributing 45% to the electricity supply. Among the countries in the region, Ecuador heavily relies on hydropower generation (80%). However, since October 2023, Ecuador has faced unprecedented challenges marked by significant deficits in energy production, not witnessed in the last few decades. This crisis, attributed to severe drought events in the Amazon region, directly impacts one of Ecuador's most crucial hydropower systems—the Paute system. In addition to the crisis, suboptimal reservoir management practices exacerbate these impacts due to the lack of provision for extreme events. The resultant energy deficits are currently causing extensive power outages throughout the country, highlighting the urgency of addressing the issues in reservoir management.

In this research, we introduce an innovative approach to enhance reservoir management efficiency. This approach involves integrating hydrometeorological in-situ and satellite-based data to develop forecasting models for reservoir water levels. We use Ecuador’s largest reservoir, the Mazar reservoir belonging to the Paute system, as a case study. The modeling will employ advanced machine learning (ML) techniques, such as the proven-effective Long-Short Term Memory (LSTM), with the aim of identifying key influencers that significantly impact reservoir level forecasting. Furthermore, we will complement the modeling with the Shapley Additive Explanation method to enhance interpretability, providing insights into hydrological processes. This is intended not only to deepen our understanding of the relationship between hydrometeorological variables and reservoir water levels but also to enrich the input space for our reservoir level forecasting models, contributing to a more accurate and comprehensive predictive framework.

The results of the innovative approach will be then used to develop a methodological framework named ML-Driven Reservoir Management with Integrated Extreme Events Forecasting for the Mazar reservoir, aimed at enhancing reservoir management efficiency during extreme events. The expected results include the identification of crucial hydrometeorological variables for Mazar level forecasting, with models capable of predicting reservoir levels at 15-day to monthly intervals based on dominant variables. This will provide a tangible demonstration of its application to improve management in future extreme event scenarios. Beyond optimizing reservoir management for enhanced hydropower generation efficiency, this approach aims to mitigate adverse impacts on Ecuador's developing sectors, fostering sustainability. By addressing inefficiencies in reservoir management, our study contributes to a more resilient and sustainable hydropower sector in Ecuador.

How to cite: Merizalde, M. J., Corzo, G., Muñoz, P., Guzmán, P., Samaniego, E., and Célleri, R.: Enhancing Reservoir Management for Sustainable Hydropower Generation: A Machine Learning-Driven Approach in Response to Increasing Extreme Events in Ecuador, EGU General Assembly 2024, Vienna, Austria, 14–19 Apr 2024, EGU24-13490, https://doi.org/10.5194/egusphere-egu24-13490, 2024.

Past studies on weather and climate extremes have focused on individual extremes. These studies cannot effectively track/model compound extreme events. The major objective of this study is to evaluate the changing risk of compound precipitation and temperature extreme events based on historical observed period (1964–2014) and the future period (2045-2054 and 2085-2094). We explored four different compound extreme event impacts of temperature and precipitation (dry-warm, dry-cold, wet-cold, and wet-warm) at the United States Department of Energy Office of Environmental Management (DOE-EM) sites. 25% and 75% quantile thresholds were used to define extreme climate conditions. The empirical approach for the analysis of compound extremes was conducted by counting the number of concurrent occurrences of multiple extremes during the same month (year). The empirical probability density function of compound events was constructed using nonparametric kernel density estimators to compare the seasonal distribution of four different compound event modes. Our results show slightly increasing trends in both Wet-Cold Mode and Wet-Warm Mode, and slightly decreasing trends in Dry-Cold Mode. Results from our study provide better understanding of the impact of climate extremes on mission-critical assets at EM cleanup sites.

How to cite: Dhakal, N.: Evaluation of compound precipitation and temperature extremes in a changing climate , EGU General Assembly 2024, Vienna, Austria, 14–19 Apr 2024, EGU24-14045, https://doi.org/10.5194/egusphere-egu24-14045, 2024.

In the realm of scientific water supply and the vigilant monitoring of advancing marine geohazards, the importance of sustainable aquifer management in coastal cities cannot be overstated. Investigating aquifer heterogeneity and the characteristics of coastal groundwater fluctuations serves as an effective approach to unveil the dynamic nature of aquifers. In this study, we simulated discrete geological variables using SISIM and T-PROGS, leveraging data from 8629 sample points across 111 boreholes in Beihai city, southern China. The results demonstrate heightened accuracy in depicting both lateral sediment distribution driven by river dynamics and vertical processes governing hydraulic conductivity coefficients within the aquifer. Our analysis underscores effectiveness of SISIM in reducing initial data requirements without necessitating Gaussian transformation, ensuring broad applicability, while T-PROGS proves suitable in environments characterized by prevalent lateral accumulation. This study employed the fractal method and wavelet analysis to investigate coastal zone groundwater fluctuations. Daily groundwater fluctuations displayed a distinct periodic variation, indicating a biased stochastic traveling pattern and potential short-term predictability. Notably, time-frequency characteristics exhibited a strong correlation with tidal fluctuations at smaller scales (12-24 hours). Additionally, the study provides initial modeling insights into the impact of heterogeneity on groundwater fluctuations.

How to cite: Gong, K., Wen, Z., Li, Q., and Zhu, Q.: Geostatistical Stochastic Simulation of Hydraulic Conductivity and  Groundwater Dynamics Interpretation in an Alluvial-Marine Sedimentary System: A Case Study in Beihai City, China, EGU General Assembly 2024, Vienna, Austria, 14–19 Apr 2024, EGU24-14513, https://doi.org/10.5194/egusphere-egu24-14513, 2024.

EGU24-14731 | ECS | Orals | HS3.2

Probabilistic topology-based analysis of water age at terminal areas in water distribution networks 

Sarai Díaz García and Javier González Pérez

The quality of water supplied through water distribution systems is traditionally assured through sampling of different physical, chemical, and biological parameters at the exit of water treatment works and at different locations within the network. However, sampling is periodic and does not capture the complex processes that take place within the network over time and space. The time of residence of the resource within the network (also called water age) has been used in the past as surrogate indicator for water quality (Machell and Boxall, 2012). As water age increases, water quality parameters tend to worsen (Machell and Boxall, 2013). This is more likely in terminal and meshed areas with low renovation rates (high water age). This work presents a detailed analysis of residence times at a terminal branch. This benchwork branch is inspired in the real topology of water connections at several dead ends in a water supply network in Spain. Stochastic demands are simulated per water connection thanks to a demand model inspired in SIMDEUM (Blokker et al., 2010). Demands are then used to run a hydraulic and water quality model with high resolution. Different metrics are then computed to probabilistically assess water age within the branch. These metrics are useful to identify topologies that are especially problematic.

Acknowledgements:

The authors would like to thank the financial support provided by the Spanish Ministry of Science and Innovation - State Research Agency (Grant PID2019-111506RB-I00 funded by MCIN/AEI/10.13039/ 501100011033; Grant TED2021-131136B-100 funded by MCIN/AEI/10.13039/501100011033) and Junta de Comunidades de Castilla-La Mancha (Grant No. SBPLY/19/180501/000162, funded by Junta de Comunidades de Castilla-La Mancha and ERDF A way of making Europe).

References:

Machell, J. and Boxall, J. (2012) Field studies and modeling exploring mean and maximum water age association to water quality in a drinking water distribution network. Journal of Water Resources Planning and Management, 138(6), 624-638, https://doi.org/10.1061/(ASCE)WR.1943-5452.0000220

Machell, J. and Boxall, J. (2013) Modeling and field work to investigate the relationship between age and quality of tap water. Journal of Water Resources Planning and Management, 140(9), 04014020, https://doi.org/10.1061/(ASCE)WR.1943-5452.0000383

Blokker, E.J.M., Vreeburg, J.H.G. and van Dijk, J.C. (2010) Simulating residential water demand with a stochastic end-use model. Journal of Water Resources Planning and Management, 136(1), 19-26, https://doi.org/10.1061/(ASCE)WR.1943-5452.0000002

How to cite: Díaz García, S. and González Pérez, J.: Probabilistic topology-based analysis of water age at terminal areas in water distribution networks, EGU General Assembly 2024, Vienna, Austria, 14–19 Apr 2024, EGU24-14731, https://doi.org/10.5194/egusphere-egu24-14731, 2024.

EGU24-17276 | Orals | HS3.2

Spatio-temporal analysis of drought: A multidecadal study of European groundwater systems 

Bentje Brauns, John Bloomfield, David Hannah, Ben Marchant, and Anne van Loon

Groundwater, constituting approximately 65 percent of Europe's drinking water sources, plays a crucial role in sustaining both urban and agricultural needs. Particularly during periods of drought, groundwater abstraction becomes a key resource, alleviating adverse impacts on people's livelihoods. Recent European drought events, for example in 2003 and 2015, exhibited spatial coherence in surface water deficits across European regions, hinting at potential impacts on groundwater levels. However, the unique hydrogeological settings and recharge patterns of groundwater systems, coupled with diverse meteorological influences, can also lead to distinct spatial coherence in groundwater droughts. Despite these complexities, no comprehensive, decadal pan-European analysis of historic groundwater level data has been conducted until now.

To bridge this gap, we conducted a continent-wide assessment of groundwater drought responses, based on over 3000 groundwater level timeseries spanning from 1986 to 2015, and providing the first extensive overview of historic groundwater droughts across Europe. Utilizing the Standardised Groundwater Index (SGI), the spatio-temporal analysis allowed for consistent comparisons of sites across disparate regions. Impulse response functions were used to identify differences in response times of the aquifers and cluster analysis of the standardized hydrographs allowed for the identification of spatially coherent 'type' groundwater hydrographs, characterized by differences in autocorrelation and reflective of continental-scale variations.

Initial findings highlighted variations in groundwater system responses to meteorological drivers, distinctions between fast and slow responding sites and their spatial coherence. For example, differences in response times of the aquifers in Northern Germany produced local differences in the effects of the 2015 drought in this region and droughts in the late 90s showed good spatial coherence across large areas of Europe, but with distinctly smaller impact on groundwater levels in Balkan region.


This analysis, coupled with an examination of driving factors, promises to enhance our understanding of how catchment and local characteristics influence groundwater responses. Additionally, areas particularly vulnerable to groundwater droughts will be identified, thus allowing for improved groundwater management.  

How to cite: Brauns, B., Bloomfield, J., Hannah, D., Marchant, B., and van Loon, A.: Spatio-temporal analysis of drought: A multidecadal study of European groundwater systems, EGU General Assembly 2024, Vienna, Austria, 14–19 Apr 2024, EGU24-17276, https://doi.org/10.5194/egusphere-egu24-17276, 2024.

EGU24-18117 | ECS | Posters virtual | HS3.2

Assessment of Compound Drought and Hot Extreme Conditions Over West Rajasthan, India 

Nishant Gaur, Sagar Chavan, and Amit Singh

Compound extremes characterized by simultaneous or consecutive incidence of multiple
extreme events (i.e. dry and hot extremes), or fusion of extreme events amplifying their
individual impacts, or amalgamation of non-extreme events resulting in an extreme impact
when combined. Our key focus was on understanding compound extremes, particularly the
interaction between prolonged dry spells and intense heat waves. We explored the individual
extremes of drought (dry extreme) and high temperatures (hot extreme) using some essential
indices like SPI, STI, WSDI and CDD. Also to better understand these complex events, we
employed two specialized tool, the Compound Drought and Hot Extreme Index (CDHI) and
one of the Joint extreme index (JEI) i.e. WDS (Warm and Dry Spell) for meteorological
subdivision-17 i.e. west Rajasthan region. Both CDHI and JEIs are used to characterize the
joint occurrence of extreme precipitation and temperature. In this study, we employed
temperature data from the Indian Meteorological Department (IMD), recorded at a resolution
of 1 degree, covering the years 1951 to 2019. Additionally, we gathered monthly
precipitation data, which was observed at a finer resolution of 0.25 degrees, spanning from
1901 to 2019. Moreover, to seamlessly integrate and refine our analyses, we applied 2D
bilinear interpolation, using Euclidean interpolation principles, to align the 0.25-degree
gridded precipitation data with the 1-degree gridded framework of temperature. For instance,
the SPI values of -1.77 and -2.28 for the monsoon seasons of 1987 and 2002, respectively,
suggests that the meteorological drought in 1987 was less severe than in 2002. Conversely,
the STI values indicate that 1987 was hotter than 2002, with STI values of 3.15 and 1.91,
respectively. Consequently, comparing Compound dry and hot extremes based solely on SPI
and STI data proves challenging. Therefore, CDHI served as a valuable metric for comparing
the overall severity of compound drought and hot extremes. A lower CDHI value indicates
more severe compound drought and hot extremes, and vice versa. The CDHI values for the
years 1987 and 2002 were -2.91 and -2.51, respectively, suggesting severe compound drought
and hot extremes in 1987. Also, as we plotted the time series plot for the meteorological
subdivision 17, i.e., west Rajasthan region, it was observed that when the time periods were
tiny (1, 3, or 6 months), the SPI, STI, and CDHI frequently moves above or below zero. But
as the time periods were lengthened or increased (12, 24, 36, or 48 months), the SPI, STI, and
CDHI responded dilatorily to changes in precipitation, i.e., overall periods with positive and
negative values of indices reduced, but the ones which appeared were longer in duration.

How to cite: Gaur, N., Chavan, S., and Singh, A.: Assessment of Compound Drought and Hot Extreme Conditions Over West Rajasthan, India, EGU General Assembly 2024, Vienna, Austria, 14–19 Apr 2024, EGU24-18117, https://doi.org/10.5194/egusphere-egu24-18117, 2024.

EGU24-18665 | ECS | Orals | HS3.2 | Highlight

A modeller’s compass: how modellers navigate dozens of decisions 

Janneke Remmers, Ryan Teuling, and Lieke Melsen

The usage of hydrological models is diverse and omnipresent. For practical purposes, these models are applied to, for example, flood forecasting, water allocation, and climate change impacts. Numerous methods exist to execute any modelling study. Choosing a method creates a narrative behind each model result, which implies that models are not neutral. So, how do modellers make these decisions? What motivates them to choose a certain method? We conducted fourteen semi-structured interviews between September and December 2021 with nine modellers from six different water authorities and five modellers from four different consultancy companies in the Netherlands. The interviewees are hydrodynamic modellers executing decision-support modelling. The interviews were all recorded and transcribed. We executed an inductive content analysis on the transcriptions. We will discuss how the interviewees motivate the decisions they have made in the modelling process, exploring the non-neutrality of the modelling process. With these insights, we aim to contribute to a discussion on how models, despite their unavoidable non-neutrality, can be robust and dependable to support decision making. Understanding the social aspects behind the modelling process is necessary to create a more complete picture of all the uncertainties involved in modelling, which should include sharing and reflecting on the narrative behind the modelling results.

How to cite: Remmers, J., Teuling, R., and Melsen, L.: A modeller’s compass: how modellers navigate dozens of decisions, EGU General Assembly 2024, Vienna, Austria, 14–19 Apr 2024, EGU24-18665, https://doi.org/10.5194/egusphere-egu24-18665, 2024.

EGU24-18700 | ECS | Posters virtual | HS3.2

Bivariate Flood Frequency Analysis of Krishna River using Copula Theory 

Aditya Badoni and Sagar Chavan

Copula theory has received attention in the field of hydrology. Copula function is used to
derive the multivariate distribution of variables. Using copula have an advantage that
marginal distribution of independent variables can be of any form and the variables can be
correlated. Flood frequency analysis (FFA) help us to quantify the risk associated with flood.
In this study copula theory is used for flood frequency analysis of Krishna River in India.
Four stations (i.e., Kurundwad, Huvinhedigi, K. Agrharam, and Wadenpally) was selected on
Krishna river basin. Peak over threshold method (POT-method) was used to select the
independent events for analysis. Using methodology provided in Flood Estimation Handbook
(FEH), Volume and Duration data is extracted from the selected events. The joint
dependence structure of flood variables is derived, for frequency analysis of Peak Flow (P),
Flood Volume (V), and Flood Duration (D). Best fit marginal distributions of these flood
variables are determined using five parametric (Normal, Exponential, Extreme value,
Lognormal, and Gamma distribution) and one non-parametric (Kernel distribution)
probability distributions. Kolmogorov-Smirnov & Anderson-Darling test was performed to
find out the best fit distribution for flood variables. For modelling of the joint dependence
structure of peak flow-volume (P-V), flood volume-duration (V-D), peak flow-duration (P-
D), five Archimedean family of copulas, namely Independence, Clayton, Frank, Gumbel-
Hougaard, and Ali-Mikhail-Haq Copulas are evaluated. Goodness-of-fit (GOF) test using
Rosenblatt’s probability integral transformation was used to find out the best fitted copula for
bivariate models. Clayton copula has been identified as the best fitted copula for all the
bivariate models considered. Clayton copula function is used to obtain conditional return
periods, Conditional return periods of flood characteristics can be useful for risk based design
of water resource projects.

How to cite: Badoni, A. and Chavan, S.: Bivariate Flood Frequency Analysis of Krishna River using Copula Theory, EGU General Assembly 2024, Vienna, Austria, 14–19 Apr 2024, EGU24-18700, https://doi.org/10.5194/egusphere-egu24-18700, 2024.

EGU24-19471 | ECS | Posters on site | HS3.2

Short-term water demand forecast considering SPEI and climate indices 

Anika Stelzl and Daniela Fuchs-Hanusch

Water demand is influenced by a number of factors with temperature and precipitation being among the key elements. Especially during longer dry and heat periods, water demand changes due to changes in consumption patterns, filling of swimming pools and increased garden irrigation. 

Therefore, a reliable water demand forecast is very important for Austrian water utilities in order to be able to react to increasing water demand peaks. In a previous study (Stelzl A.; Fuchs-Hanusch D.), long-term forecasting models were developed using climate indices. The developed modeling approach achieved satisfactory results in terms of prediction accuracy. However, it was found that the effect of dry and hot periods could not yet be modeled with sufficient accuracy. For this reason, this study attempts to improve the modeling approach by adding the Standardised Precipitation Evapotranspiration Index (SPEI) as an additional parameter into the model. In addition, the new work targets short-term water demand forecasts to provide water utilities with a basis for taking timely action to cope with peak water demand or inform customers about necessary water saving measures. Current short-term forecasts of the meteorological situation (e.g. SPEI) are provided by Land Steiermark (Land Steiermark, 2024). The water demand forecasting model developed in this study can be applied to these short-term forecasts.

In a first step, the relationship between SPEI, climate indices and water demand was determined. The SPEI and the climate indices are calculated from historical weather records for the selected study sites. During the model building process, a stepwise forward variable selection process is carried out to determine the significant parameters. The SPEI was found to be a significant parameter for water demand forecasting. The model building process and evaluation is still ongoing. It is expected that the use of the SPEI will improve the accuracy of peak water demand forecasting model. The final results will be available at the conference.

References:

Stelzl, A.; Fuchs-Hanusch, D. Forecasting Urban Peak Water Demand Based on Climate Indices and Demographic Trends. Water 2024, 16, 127. https://doi.org/10.3390/w16010127

Land Steiermark, A 14 (2024) Dürreindex - Wasserversrogung. [online] https://www.wasserwirtschaft.steiermark.at/cms/beitrag/12903795/173854972. (Accessed:  10. January 2024)


How to cite: Stelzl, A. and Fuchs-Hanusch, D.: Short-term water demand forecast considering SPEI and climate indices, EGU General Assembly 2024, Vienna, Austria, 14–19 Apr 2024, EGU24-19471, https://doi.org/10.5194/egusphere-egu24-19471, 2024.

EGU24-20683 | ECS | Orals | HS3.2

Understanding the Amazon's Atmospheric Hydrology: Insights from ERA5 Data and Directional Transport Analysis  

Karel Aldrin Sanchez Hernandez, Gerald Augusto Corzo Perez, German Ricardo Santos Granados, Juan Manuel Gacharna Gonzalez, Carlos Alfredo Tami Riveros, Guillermo Hernandez Torres, Gustavo Herran, Diego Gutierrez, and Fabio Rubiano

The atmospheric dynamics of the Amazon, critical for global environmental stability, have faced increasing influence from numerous El Niño and La Niña events in recent decades. While reanalysis data has incorporated these events through models and measurements, the intricate mechanics of spatial and temporal water vapor transport remain unclear. In this study, we present a preliminary analysis of these dynamics, utilizing over twenty years of ERA5 monthly data over atmospheric layer. Our investigation was constructed on two primary scales, each offering unique insights. The first scale aims to replicate and validate the system's seasonality concerning the Intertropical Convergence Zone (ITCZ), those patterns allow evaluating some patterns and its effects in land hydrological process observed along the basin integrating specific methods and models to clarify how the seasonality was replicated and validated. On the second scale, we delve into smaller hydrological sub-units of the Amazon, identifying their contribution to water recycling, and net fluxes across the basin boundaries. We provide an innovative estimation of transport paths using a 4 cardinal directional approach (brubaker box scheme modified) that makes possible identificate, analyse and understanding, water sources and sinks and its relevance in the normal hydrological production and synergically systems 

The findings indicate the system's relatively stable dynamics in terms of water vapor sources and altitudinal variation across atmospheric layers. Our methodology introduces a novel framework for calculating comprehensive trajectories of water vapor transport from a hybrid lagrangian-eulerian approach, significantly enhancing our understanding of the Amazon's hydrological cycle from an atmospheric perspective. 

To provide more precision, we specify that the stability observed in the system pertains to water vapor sources and altitudinal variation. These stable dynamics contribute valuable insights into the intricate water vapor transport mechanisms in the Amazon. Additionally, we highlight the implications of our findings for future research in understanding how to create alternatives to mitigate some impacts of El Niño and La Niña events on the Amazon's atmospheric dynamics. 

How to cite: Sanchez Hernandez, K. A., Corzo Perez, G. A., Santos Granados, G. R., Gacharna Gonzalez, J. M., Tami Riveros, C. A., Hernandez Torres, G., Herran, G., Gutierrez, D., and Rubiano, F.: Understanding the Amazon's Atmospheric Hydrology: Insights from ERA5 Data and Directional Transport Analysis , EGU General Assembly 2024, Vienna, Austria, 14–19 Apr 2024, EGU24-20683, https://doi.org/10.5194/egusphere-egu24-20683, 2024.

EGU24-20800 | ECS | Orals | HS3.2

Machine Learning Modelling for Future Hydroclimatic Extremes Under Climate Change: A Review 

Marcela Antunes Meira and Yunqing Xuan

Hydroclimatic extremes, such as droughts, floods, and extreme rainfall have been increasing worldwide leading to severe impacts on society and ecosystems. For that reason, hydrological modelling research has advanced to improve flood and rainfall prediction and control.  This estimation has been traditionally carried out using physical and process-based hydroclimatic models, however, they have limitations due to their physical-based nature. They often require a large amount of different hydro-geomorphological monitoring datasets, as well as in-depth knowledge and expertise regarding hydrological parameters, which must be correctly selected, calibrated, and further interpreted to ensure the reliability of the model. In recent years, data-driven hydrological modelling, such as Machine Learning (ML), Artificial Intelligence (AI), and Deep Learning (DL) methods have demonstrated a great deal of promise for enhancing the forecasting of hydroclimatic extremes. In data-driven modelling, the models use a generalized relationship between input and output disregarding the physical mechanism behind the process, built based on historical data. ML methods have some advantages over physical-based models, such as not requiring an understanding of internal specific mechanisms, which can be highly complex to reproduce, as well as having a higher calculation efficiency which may provide a quicker response to extreme events of high-intensity and short duration such as urban flash floods. Although there have been significant advances from the scientific community toward understanding and testing different ML and AI models for various hydrological applications, there are still limitations in their applications. A huge challenge that remains in ML modelling for future extreme floods, is its ‘black-box’ nature where the interactions among various components are unknown, which hinders its further use in supporting important decision-making. Along with that, other challenges in the current hydroclimatic modelling approaches presented by the hydrological community are data availability and assimilation, uncertainty analysis, and model generalisation. Some studies have addressed these issues, showing satisfactory results, especially for hybrid models between ML and traditional process-based approaches and ensembles of multiple methods. However, in light of so many new methodologies and algorithms, we must address their benefits and drawbacks, through an interdisciplinary effort. Understanding the best way to select appropriate methodologies for different settings of data availability, climate variability, and uncertainty, generating rapid and interpretable responses to urgent hydrologic hazards.

How to cite: Antunes Meira, M. and Xuan, Y.: Machine Learning Modelling for Future Hydroclimatic Extremes Under Climate Change: A Review, EGU General Assembly 2024, Vienna, Austria, 14–19 Apr 2024, EGU24-20800, https://doi.org/10.5194/egusphere-egu24-20800, 2024.

EGU24-20802 | ECS | Posters virtual | HS3.2

Spatial-temporal analysis of the impact of deforestation on the hydrological variability of the Amazon basin. 

Juan Manuel Gacharna Gonzalez, Gerald Augusto Corzo Perez, German Ricardo Santos Granados, Karel Aldrin Sanchez Hernandez, Carlos Alfredo Tami Riveros, Guillermo Hernandez Torres, Gustavo Herran, Diego Gutierrez, and Fabio Rubiano

In recent years, there has been growing concern about deforestation in the Amazon River basin, particularly in relation to its impact on regional water resources. This study performs a spatial and temporal analysis of deforestation variations between 2001 and 2020, using MODIS and Sentinel data. Using supervised classification techniques, we classified land changes into afforestation, deforestation and reforestation and analyzed the transitions between different land uses including forest, pasture, shrubland, crops and urbanization. Our findings show an annual forest loss of about 5,726 square kilometers, much of this deforestation is localized to specific subregions, although the overall size of the watershed suggests a lack of sensitivity.

These results show a significant correlation with variations in evapotranspiration, estimated through a model calibrated with data from the ERA5 reanalysis. This dataset was used to analyze the standardized precipitation and evapotranspiration indexes (SPEI), revealing that, during the last 20 years under study, the region experienced an increase in both the magnitude and intensity of drought compared to the previous 20 years.

In particular, a direct relationship is observed between aggressive agricultural policies in Brazil and Bolivia and increased deforestation rates. In addition, this study serves as the basis for complementary research work assessing the implications of these land use changes on river discharge and estimated groundwater recharge in the Amazon basin.

How to cite: Gacharna Gonzalez, J. M., Corzo Perez, G. A., Santos Granados, G. R., Sanchez Hernandez, K. A., Tami Riveros, C. A., Hernandez Torres, G., Herran, G., Gutierrez, D., and Rubiano, F.: Spatial-temporal analysis of the impact of deforestation on the hydrological variability of the Amazon basin., EGU General Assembly 2024, Vienna, Austria, 14–19 Apr 2024, EGU24-20802, https://doi.org/10.5194/egusphere-egu24-20802, 2024.

Water distribution networks (WDNs) are essential systems that supply water for the most basic normal activities of our society. Their design is a complex problem because WDNs must function properly, permanently responding to consumer needs and taking into account many different technical and social issues.

In recent decades, they have been extensively studied considering only a single demand setting. Therefore, the pipe sizes obtained using this approach are unreliable to address a wide spectrum of situations that WDNs face during their service life. Water demand is one of the most important sources of uncertainty for the design of WDNs.

In fact, water demand is affected by different types of uncertainty (Walker et al., 2003). It can be the result of users' behavioural variability on a daily and seasonal scale (which can be classified as 'statistical uncertainty’) and can also be related to "social variability" due to the unpredictable nature of social, economic, and cultural dynamics (a more challenging level of uncertainty, 'scenario uncertainty').  'Statistical uncertainty’ can be addressed by extracting information from available data and making assumptions about the statistical parameters of water demand distribution (Magini et al., 2019). 'Scenario uncertainty’ may be handled through various approaches for creating plausible future demand changes i.e., likely assumptions about the future hypotheses on demand change that can concern the number of users, socio-economic situation, changes in technology, tariffs, cultural dynamics and users' behaviour (Cunha. 2023).

Robust optimization models may embrace scenarios with different levels of demand uncertainty. It is essential to generate demand scenarios to develop robust WDNs, in multi-objective environments, including issues such as their reliability and the level of service they provide (Cunha et al., 2023). Thorough comparisons of the robustness of WDNs sized either using deterministic approaches or considering different levels of uncertainty are vital to understand the benefits of these last ones.

This presentation will provide an overview of the key issues and challenges in defining robust WDNs to cope with multiple states of the world.


REFERENCES

Cunha, M. C. (2023). Water and Environmental Systems Management Under Uncertainty: From Scenario Construction to Robust Solutions and Adaptation. Water Resources Management, 1–15

Cunha, M. C., Magini, R., & Marques, J. (2023).  Multi-objective optimization models for the design of water distribution networks by exploring scenario-based approaches. Water Resources Research, 59, e2023WR034867. https://doi. org/10.1029/2023WR034867

Magini, R., Boniforti, M. A., & Guercio, R. (2019). Generating scenarios of cross-correlated demands for modelling water distribution networks. Water (Switzerland), 11(3), 493.

Walker, W. E., Harremoës, P., Rotmans, J., van der Sluijs, J. P., van Asselt, M. B. A., Janssen, P., & Krayer von Krauss, M. P. (2003). Defining Uncertainty: A Conceptual Basis for Uncertainty Management in Model-Based Decision Support. Integrated Assessment, 4(1), 5–17.

Acknowledgments: The author thanks the Portuguese public agency “Fundação para a Ciência e a Tecnologia” (FCT) the support of national funds under the project UIDB/ 00285/2020. 

How to cite: Cunha, M. C.: Key issues and challenges for  managing water distribution networks under uncertainty , EGU General Assembly 2024, Vienna, Austria, 14–19 Apr 2024, EGU24-21604, https://doi.org/10.5194/egusphere-egu24-21604, 2024.

EGU24-566 | ECS | Orals | HS3.4

A Transformer-Based Data-Driven Model for Real-Time Spatio-Temporal Flood Prediction 

Matteo Pianforini, Susanna Dazzi, Andrea Pilzer, and Renato Vacondio

Among the non-structural strategies for mitigating the huge economic losses and casualties caused by floods, the implementation of early-warning systems based on real-time forecasting of flood maps is one of the most effective. The high computational cost associated with two-dimensional (2D) hydrodynamic models, however, prevents their practical application in this context. To overcome this drawback, “data-driven” models are gaining considerable popularity due to their high computational efficiency for predictions. In this work, we introduce a novel surrogate model based on the Transformer architecture, named FloodSformer (FS), that efficiently predicts the temporal evolution of inundation maps, with the aim of providing real-time flood forecasts. The FS model combines an encoder-decoder (2D Convolutional Neural Network) with a Transformer block that handles temporal information. This architecture extracts the spatiotemporal information from a sequence of consecutive water depth maps and predicts the water depth map at one subsequent instant. An autoregressive procedure, based on the trained surrogate model, is employed to forecast tens of future maps.

As a case study, we investigated the hypothetical inundation due to the collapse of the flood-control dam on the Parma River (Italy). Due to the absence of real inundation maps, the training/testing dataset for the FS model was generated from numerical simulations performed through a 2D shallow‐water code (PARFLOOD). Results show that the FS model is able to recursively forecast the next 90 water depth maps (corresponding to 3 hours for this case study, in which maps are sampled at 2-minute intervals) in less than 1 minute. This is achieved while maintaining an accuracy deemed entirely acceptable for real-time applications: the average Root Mean Square Error (RMSE) is about 10 cm, and the differences between ground-truth and predicted maps are generally lower than 25 cm in the floodable area for the first 60 predicted frames. In conclusion, the short computational time and the good accuracy ensured by the autoregressive procedure make the FS model suitable for early-warning systems.

How to cite: Pianforini, M., Dazzi, S., Pilzer, A., and Vacondio, R.: A Transformer-Based Data-Driven Model for Real-Time Spatio-Temporal Flood Prediction, EGU General Assembly 2024, Vienna, Austria, 14–19 Apr 2024, EGU24-566, https://doi.org/10.5194/egusphere-egu24-566, 2024.

EGU24-571 | ECS | Posters on site | HS3.4

Hydrological Significance of Input Sequence Lengths in LSTM-Based Streamflow Prediction 

Farzad Hosseini Hossein Abadi, Cristina Prieto Sierra, Grey Nearing, Cesar Alvarez Diaz, and Martin Gauch

Abstract

Hydrological modeling of flashy catchments, susceptible to floods, represents a significant practical challenge.  Recent application of deep learning, specifically Long Short-Term Memory networks (LSTMs), have demonstrated notable capability in delivering accurate hydrological predictions at daily and hourly time intervals (Gauch et al., 2021; Kratzert et al., 2018).

In this study, we leverage a multi-timescale LSTM (MTS-LSTM (Gauch et al., 2021)) model to predict hydrographs in flashy catchments at hourly time scales. Our primary focus is to investigate the influence of model hyperparameters on the performance of regional streamflow models. We present methodological advancements using a practical application to predict streamflow in 40 catchments within the Basque Country (North of Spain).

Our findings show that 1) hourly and daily streamflow predictions exhibit high accuracy, with Nash-Sutcliffe Efficiency (NSE) reaching values as high as 0.941 and 0.966 for daily and hourly data, respectively; and 2) hyperparameters associated with the length of the input sequence exert a substantial influence on the performance of a regional model. Consistently optimal regional values, following a systematic hyperparameter tuning, were identified as 3 years for daily data and 12 weeks for hourly data. Principal component analysis (PCA) shows that the first principal component explains 12.36% of the variance among the 12 hyperparameters. Within this set of hyperparameters, the input sequence lengths for hourly data exhibit the highest load in PC1, with a value of -0.523; the load of the input sequence length for daily data is also very high (-0.36). This suggests that these hyperparameters strongly contribute to the model performance.

Furthermore, when utilizing a catchment-scale magnifier to determine optimal hyperparameter settings for each catchment, distinctive sequence lengths emerge for individual basins. This underscores the necessity of customizing input sequence lengths based on the “uniqueness of the place” (Beven, 2020), suggesting that each catchment may demand specific hydrologically meaningful daily and hourly input sequence lengths tailored to its unique characteristics. In essence, the true input sequence length of a catchment may encapsulate hydrological information pertaining to water transit over short and long-term periods within the basin. Notably, the regional daily sequence length aligns with the highest local daily sequence values across all catchments.

In summary, our investigation stresses the critical role of the input sequence length as a hyperparameter in LSTM networks. More broadly, this work is a step towards a better understanding and achieving accurate hourly predictions using deep learning models.


Keywords

Hydrological modeling; Streamflow Prediction; LSTM networks; Hyperparameters configurations; Input sequence lengths


References:

Beven, K. (2020). Deep learning, hydrological processes and the uniqueness of place. Hydrological Processes, 34(16), 3608–3613. doi:10.1002/hyp.13805

Gauch, M., Kratzert, F., Klotz, D., Nearing, G., Lin, J., and Hochreiter, S. (2021). Rainfall–runoff prediction at multiple timescales with a single Long Short-Term Memory network, Hydrol. Earth Syst. Sci., 25, 2045–2062, DOI:10.5194/hess-25-2045-2021.

Kratzert, F., Klotz, D., Brenner, C., Schulz, K., & Herrnegger, M. (2018). Rainfall--runoff modelling using Long Short-Term Memory (LSTM) networks. Hydrology and Earth System Sciences, 22(11), 6005–6022. DOI:10.5194/hess-22-6005-2018.


How to cite: Hosseini Hossein Abadi, F., Prieto Sierra, C., Nearing, G., Alvarez Diaz, C., and Gauch, M.: Hydrological Significance of Input Sequence Lengths in LSTM-Based Streamflow Prediction, EGU General Assembly 2024, Vienna, Austria, 14–19 Apr 2024, EGU24-571, https://doi.org/10.5194/egusphere-egu24-571, 2024.

EGU24-811 | ECS | Orals | HS3.4

A deep learning approach for spatio-temporal prediction of stable water isotopes in soil moisture 

Hyekyeng Jung, Chris Soulsby, and Dörthe Tetzlaff

Water flows and related mixing dynamics in the unsaturated zone are difficult to measure directly, so stable water isotope tracers have been used successfully to quantify flux and storage dynamics and to constrain process-based hydrological models as proxy data. In this study, a data-driven model based on deep learning was adapted to interpolate and extrapolate spatio-temporal isotope signals of δ18O and δ2H in soil water in three dimensions. Further, this was also used to help quantify evapotranspiration and groundwater recharge processes in the unsaturated zone. To consider both spatial and temporal dependencies of water isotope signals in the model design, the output space was decomposed into temporal basis functions and spatial coefficients using singular value decomposition. Then, temporal functions and spatial coefficients were predicted separately by specialized deep learning models in interdependencies among target data, such as the LSTM model and convolutional neural network. Finally, the predictions by the models were integrated and analyzed post-hoc using XAI tools.

Such an integrated framework has the potential to improve understanding of model behavior based on features (e.g., climate, hydrological component) connected to either temporal or spatial information. Furthermore, the model can serve as a surrogate model for process-based hydrological models, improving the use of process-based models as learning tools.

How to cite: Jung, H., Soulsby, C., and Tetzlaff, D.: A deep learning approach for spatio-temporal prediction of stable water isotopes in soil moisture, EGU General Assembly 2024, Vienna, Austria, 14–19 Apr 2024, EGU24-811, https://doi.org/10.5194/egusphere-egu24-811, 2024.

EGU24-2872 | ECS | Posters on site | HS3.4

Runoff coefficient modelling using Long Short-Term Memory (LSTM) in the Rur catchment, Germany 

Arash Rahi, Mehdi Rahmati, Jacopo Dari, and Renato Morbidelli

This research examines the effectiveness of Long Short-Term Memory (LSTM) models in predicting runoff coefficient (Rc) within the Rur basin at the Stah outlet (Germany) during the period from 1961 to 2021; monthly data of temperature (T), precipitation (P), soil water storage (SWS), and total evaporation (ETA) are used as an input. Because of the complexity in predicting undecomposed Rc time series due to noise, a novel approach incorporating discrete wavelet transform (DWT) to decompose the original Rc at five levels is proposed.

The investigation identifies overfitting challenges at level-1, gradually mitigated in subsequent decomposition levels, particularly in level-2, while other levels remain tuned. Reconstructing Rc using modelled decomposition coefficients yielded Nash-Sutcliffe efficacy (NSE) values of 0.88, 0.79, and 0.74 for the training, validation, and test sets, respectively. Comparative analysis highlights that modelling undecomposed Rc with LSTM yields to a minor accuracy, emphasizing the pivotal role of decomposition techniques in tandem with LSTM for enhanced model performances.

This study provides novel insights to address challenges related to noise effects and temporal dependencies in Rc modelling; through a comprehensive analysis of the interplay between atmospheric conditions and observed data, the research contributes in advancing predictive modelling in hydrology.

How to cite: Rahi, A., Rahmati, M., Dari, J., and Morbidelli, R.: Runoff coefficient modelling using Long Short-Term Memory (LSTM) in the Rur catchment, Germany, EGU General Assembly 2024, Vienna, Austria, 14–19 Apr 2024, EGU24-2872, https://doi.org/10.5194/egusphere-egu24-2872, 2024.

EGU24-2939 | ECS | Orals | HS3.4

Probabilistic streamflow forecasting using generative deep learning models 

Mohammad Sina Jahangir and John Quilty

The significance of probabilistic hydrological forecasting has grown in recent years, offering crucial insights for risk-based decision-making and effective flood management. This study explores generative deep learning models, specifically the conditional variational autoencoder (CVAE), for probabilistic streamflow forecasting. This innovative approach is applied for forecasting streamflow one to seven days (s) ahead in 75 Canadian basins included in the open-source Canadian model parameter experiment (CANOPEX) database. CVAE is compared against two benchmark quantile-based deep learning models: the quantile-based encoder-decoder (ED) and the quantile-based CVAE (QCVAE).

Over 9000 deep learning models are developed based on different input variables, basin characteristics, and model structures and evaluated regarding point forecast accuracy and forecast reliability. Results highlight CVAE‘s superior reliability, showing a median reliability of 92.49% compared to 87.35% for ED and 84.59% for QCVAE (considering a desired 90% confidence level). However, quantile-based forecast models exhibit marginally better point forecasts, as evidenced by Kling-Gupta efficiency (KGE), with a median KGE of 0.90 for ED and QCVAE (compared to 0.88 for CVAE). Notably, the CVAE model provides reliable probabilistic forecasts in basins with low point forecast accuracy.

The developed generative deep learning models can be used as a benchmark for probabilistic streamflow forecasting due to the use of the open-source CANOPEX dataset. Overall, the results of this study contribute to the expanding field of generative deep learning models in hydrological forecasting, offering a general framework that applies to forecasting other hydrological variables as well (precipitation and soil moisture).

How to cite: Jahangir, M. S. and Quilty, J.: Probabilistic streamflow forecasting using generative deep learning models, EGU General Assembly 2024, Vienna, Austria, 14–19 Apr 2024, EGU24-2939, https://doi.org/10.5194/egusphere-egu24-2939, 2024.

EGU24-6432 | ECS | Orals | HS3.4

A Step Towards Global Hydrologic Modelling: Accurate Streamflow Predictions In Pseudo-Ungauged Basins of Japan 

Hemant Servia, Frauke Albrecht, Samuel Saxe, Nicolas Bierti, Masatoshi Kawasaki, and Shun Kurihara

In addressing the challenge of streamflow prediction in ungauged basins, this study leveraged deep learning (DL) models, especially long short-term memory (LSTM) networks, to predict streamflow for pseudo ungauged basins in Japan. The motivation stems from the recognized limitations of traditional hydrological models in transferring their performance beyond the calibrated basins. Recent research suggests that DL models, especially those trained on multiple catchments, demonstrate improved predictive capabilities utilizing the concept of streamflow regionalization. However, the majority of these studies were confined to geographic regions within the United States.

For this study, a total number of 211 catchments were delineated and investigated, distributed across all four primary islands of Japan (Kyushu - 32, Shikoku - 13, Honshu - 127, and Hokkaido - 39) encompassing a comprehensive sample of hydrological systems within the region. The catchments were obtained corresponding to the streamflow observation points and their combined area represented more than 43% of Japan's total land area, after accounting for overlaps. After cleaning and refining the streamflow dataset, the remaining catchments (198) were divided into training (~70%), validation (~20%), and holdout test (~10%) sets. A combination of dynamic (time-varying) and static (constant) variables were obtained on a daily basis corresponding to the daily streamflow data and provided to the models as input features. However, the final model accorded higher significance to dynamic features in comparison to the static ones. Although the models were trained on daily time steps, the results were aggregated to monthly timescale. The main evaluation metrics included the Nash-Sutcliffe Efficiency (NSE) and Pearson’s correlation coefficient (r). The final model achieved a median NSE of 0.96, 0.83, & 0.78, and a median correlation of 0.98, 0.92, & 0.91 corresponding to the training, validation, and test catchments, respectively. For the validation catchments, 90% exhibited NSE values greater than 0.50, and 97% demonstrated a correlation surpassing 0.70. Correspondingly, these proportions were observed at 77% and 91% for the test catchments.

The results presented in this study demonstrate the feasibility and efficacy of developing a data-driven model for streamflow prediction in ungauged basins utilizing streamflow regionalization. The final model exhibits commendable performance, as evidenced by high NSE and correlation coefficients across the majority of the catchments. Importantly, the model's ability to generalize to unseen data is highlighted by its remarkable performance on the holdout test set, with only a few instances of lower NSE values (< 0.50) and correlation coefficients (< 0.70).

How to cite: Servia, H., Albrecht, F., Saxe, S., Bierti, N., Kawasaki, M., and Kurihara, S.: A Step Towards Global Hydrologic Modelling: Accurate Streamflow Predictions In Pseudo-Ungauged Basins of Japan, EGU General Assembly 2024, Vienna, Austria, 14–19 Apr 2024, EGU24-6432, https://doi.org/10.5194/egusphere-egu24-6432, 2024.

EGU24-6846 | ECS | Orals | HS3.4

Towards Fully Distributed Rainfall-Runoff Modelling with Graph Neural Networks 

Peter Nelemans, Roberto Bentivoglio, Joost Buitink, Ali Meshgi, Markus Hrachowitz, Ruben Dahm, and Riccardo Taormina

Fully distributed hydrological models take into account the spatial variability of a catchment, allowing for a more accurate representation of its heterogeneity, and assessing its hydrological response at multiple locations. However, physics-based fully distributed models can be time-consuming when it comes to model runtime and calibration, especially for large-scale catchments. On the other hand, deep learning models have shown great potential in the field of hydrological modelling, outperforming lumped rainfall-runoff conceptual models, and improving prediction in ungauged basins via catchment transferability. Despite these advances, the field still lacks a multivariable, fully distributed hydrological deep learning model capable of generalizing to unseen catchments. To address the aforementioned challenges associated with physics-based distributed models and deep learning models, we explore the possibility of developing a fully distributed deep learning model by using Graph Neural Networks (GNN), an extension of deep learning methods to non-Euclidean topologies including graphs and meshes.

We develop a surrogate model of wflow_sbm, a fully distributed, physics-based hydrological model, by exploiting the similarities between its underlying functioning and GNNs. The GNN uses the same input as wflow_sbm: distributed static parameters based on physical characteristics of the catchment and gridded dynamic forcings. The GNN is trained to produce the same output as wflow_sbm, predicting multiple gridded variables related to rainfall-runoff, such as streamflow, actual evapotranspiration, subsurface flow, saturated and unsaturated groundwater storage, snow storage, and runoff. We show that our GNN model achieves high performance in unseen catchments, indicating that GNNs are a viable option for fully distributed multivariable hydrological models capable of generalizing to unseen regions. Furthermore, the GNN model achieves a significant computational speedup compared to wflow_sbm. We will continue this research, using the GNN-based surrogate models as pre-trained backbones to be fine-tuned with measured data, ensuring accurate model adaptation, and enhancing their practical applicability in diverse hydrological scenarios.

How to cite: Nelemans, P., Bentivoglio, R., Buitink, J., Meshgi, A., Hrachowitz, M., Dahm, R., and Taormina, R.: Towards Fully Distributed Rainfall-Runoff Modelling with Graph Neural Networks, EGU General Assembly 2024, Vienna, Austria, 14–19 Apr 2024, EGU24-6846, https://doi.org/10.5194/egusphere-egu24-6846, 2024.

This research created a deep neural network (DNN)-based hydrologic model for an urban watershed in South Korea using multiple LSTM (long short-term memory) units and a fully connected layer. The model utilized 10-minute intervals of radar-gauge composite precipitation and temperature data across 239 grid cells, each 1 km in resolution, to simulate watershed flow discharge every 10 minutes. It showed high accuracy during both the calibration (2013–2016) and validation (2017–2019) periods, with Nash–Sutcliffe efficiency coefficient values of 0.99 and 0.67, respectively. Key findings include: 1) the DNN model's runoff–precipitation ratio map closely matched the imperviousness ratio map from land cover data, demonstrating the model's ability to learn precipitation partitioning without prior hydrological information; 2) it effectively mimicked soil moisture-dependent runoff processes, crucial for continuous hydrologic models; and 3) the LSTM units displayed varying temporal responses to precipitation, with units near the watershed outlet responding faster, indicating the model's capability to differentiate between hydrological components like direct runoff and groundwater-driven baseflow.

How to cite: Kim, D.: Exploring How Machines Model Water Flow: Predicting Small-Scale Watershed Behavior in a Distributed Setting, EGU General Assembly 2024, Vienna, Austria, 14–19 Apr 2024, EGU24-7186, https://doi.org/10.5194/egusphere-egu24-7186, 2024.

EGU24-8102 | ECS | Orals | HS3.4

Improving the Generalizability of Urban Pluvial Flood Emulators by Contextualizing High-Resolution Patches 

Tabea Cache, Milton S. Gomez, Jovan Blagojević, Tom Beucler, João P. Leitão, and Nadav Peleg

Predicting future flood hazards in a changing climate requires adopting a stochastic framework due to the multiple sources of uncertainties (e.g., from climate change scenarios, climate models, or natural variability). This requires performing multiple flood inundation simulations which are computationally costly. Data-driven models can help overcome this issue as they can emulate urban flood maps considerably faster than traditional flood simulation models. However, their lack of generalizability to both terrain and rainfall events still limits their application. Additionally, these models face the challenge of not having sufficient training data. This led state-of-the-art models to adopt a patch-based framework, where the study area is first divided into local patches (i.e., broken into smaller terrain images) that are subsequently merged to reconstruct the whole study area prediction. The main drawback of this method is that the model is blind to the surroundings of the local patch. To overcome this bottleneck, we developed a new deep learning model that includes patches' contextual information while keeping high-resolution information of the local patch. We trained and tested the model in the city of Zurich, at spatial resolution of 1 m. The evaluation focused on 1-hour rainfall events at 5 min temporal resolution and encompassing extreme precipitation return periods from 2- to 100-year. The results show that the proposed CNN-attention model outperforms the state-of-the-art patch-based urban flood emulator. First, our model can faithfully represent flood depths for a wide range of extreme rainfall events (peak rainfall intensities ranging from 42.5 mm h-1 to 161.4 mm h-1). Second, the model's terrain generalizability was assessed in distinct urban settings, namely Luzern and Singapore. Our model accurately identifies water accumulation locations, which constitutes an improvement compared to current models. Using transfer learning, the model was successfully retrained in the new cities, requiring only a single rainfall event to adapt the model to new terrains while preserving adaptability across diverse rainfall conditions. Our results suggest that by integrating contextual terrain information with local terrain patches, our proposed model effectively generates high-resolution urban pluvial flood maps, demonstrating applicability across varied terrains and rainfall events.

How to cite: Cache, T., Gomez, M. S., Blagojević, J., Beucler, T., Leitão, J. P., and Peleg, N.: Improving the Generalizability of Urban Pluvial Flood Emulators by Contextualizing High-Resolution Patches, EGU General Assembly 2024, Vienna, Austria, 14–19 Apr 2024, EGU24-8102, https://doi.org/10.5194/egusphere-egu24-8102, 2024.

EGU24-9190 | ECS | Orals | HS3.4

Learning Catchment Features with Autoencoders 

Alberto Bassi, Antonietta Mira, Marvin Höge, Fabrizio Fenicia, and Carlo Albert

By employing Machine Learning techniques on the US-CAMELS dataset, we discern a minimal number of streamflow features. Together with meteorological forcing, these features enable an approximate reconstruction of the entire streamflow time-series. This task is achieved through the application of an explicit noise conditional autoencoder, wherein the meteorological forcing is inputted to the decoder to encourage the encoder to learn streamflow features exclusively related to landscape properties. The optimal number of encoded features is determined with an intrinsic dimension estimator. The accuracy of reconstruction is then compared with models that take a subset of static catchment attributes (both climate and landscape attributes) in addition to meteorological forcing variables. Our findings suggest that attributes gathered by experts encompass nearly all pertinent information regarding the input/output relationship. This information can be succinctly summarized with merely three independent streamflow features. These features exhibit a strong correlation with the baseflow index and aridity indicators, aligning with the observation that predicting streamflow in dry catchments or with a high baseflow index is more challenging. Furthermore, correlation analysis underscores the significance of soil-related and vegetation attributes. These learned features can also be associated with parameters in conceptual hydrological models such as the GR model family.

How to cite: Bassi, A., Mira, A., Höge, M., Fenicia, F., and Albert, C.: Learning Catchment Features with Autoencoders, EGU General Assembly 2024, Vienna, Austria, 14–19 Apr 2024, EGU24-9190, https://doi.org/10.5194/egusphere-egu24-9190, 2024.

EGU24-9446 | ECS | Orals | HS3.4

Skilful prediction of mid-term sea surface temperature using 3D self-attention-based neural network 

Longhao Wang, Yongqiang Zhang, and Xuanze Zhang

Sea surface temperature (SST) is a critical parameter in the global ocean-atmospheric system, exerting a substantial impact on climate change and extreme weather events like droughts and floods. The precise forecasting of future SSTs is thus vital for identifying such weather anomalies. Here we present a novel three-dimensional (3D) neural network model based on self-attention mechanisms and Swin-Transformer for mid-term SST predictions. This model, integrating both climatic and temporal features, employs self-attention to proficiently capture the temporal dynamics and global patterns in SST. This approach significantly enhances the model's capability to detect and analyze spatiotemporal changes, offering a more nuanced understanding of SST variations. Trained on 59 years of global monthly ERA5-Land reanalysis data, our model demonstrates strong deterministic forecast capabilities in the test period. It employs a convolution strategy and global attention mechanism, resulting in faster and more accurate training compared to traditional methods, such as Convolutional Neural Network with Long short-term memory (CNN-LSTM). The effectiveness of this SST prediction model highlights its potential for extensive multidimensional modelling applications in geosciences.

How to cite: Wang, L., Zhang, Y., and Zhang, X.: Skilful prediction of mid-term sea surface temperature using 3D self-attention-based neural network, EGU General Assembly 2024, Vienna, Austria, 14–19 Apr 2024, EGU24-9446, https://doi.org/10.5194/egusphere-egu24-9446, 2024.

Traditional hydrological models have long served as the standard for predicting streamflow across temporal and spatial domains. However, a persistent challenge in modelling lies in mitigating bias inherent in streamflow estimation due to both random and systemic errors in the employed model. Removal of this bias is pivotal for effective water resources management and resilience against extreme events, especially amidst evolving climate conditions. An innovative solution to address this challenge involves the integration of hydrological models with deep learning methods, known as hybridisation. Long Short-Term Memory networks (LSTM), have emerged as a promising and efficient approach to enhancing streamflow estimation. This study focuses on coupling LSTM with a physically distributed model, Wflow_sbm, to serve as a post-processor aimed at reducing modelling errors. The coupled Wflow_sbm-LSTM model was applied to the Boyne catchment in Ireland, utilising a dataset spanning two decades, divided into training, validation, and testing sets to ensure robust model evaluation. Predictive performance was rigorously assessed using metrics like Modified Kling-Gupta Efficiency (MKGE) and Nash-Sutcliffe Efficiency (NSE), with observed streamflow discharges as the target variable. Results demonstrated that the coupled model outperformed the best-calibrated Wflow_sbm model in the study catchment based on the performance measures. The enhanced prediction of extreme events by the coupled Wflow_sbm-LSTM model strengthens the case for its integration into an operational river flow forecasting framework. Significantly, Wflow is endorsed by the National Flood Forecast Warning Service (NFFWS) in Ireland as a recommended model for streamflow simulations, specifically designed for fluvial flood forecasting. Consequently, our proposed Wflow_sbm-LSTM coupled model presents a compelling opportunity for integration into the NFFWS. With demonstrated potential to achieve precise streamflow estimations, this integration holds promise for significantly enhancing the accuracy and effectiveness of flood predictions in Ireland.

How to cite: Mohammed, S. and Nasr, A.: Advancing Streamflow Modelling: Bias Removal in Physically-Based Models with the Long Short-Term Memory Networks (LSTM) Algorithm, EGU General Assembly 2024, Vienna, Austria, 14–19 Apr 2024, EGU24-9573, https://doi.org/10.5194/egusphere-egu24-9573, 2024.

EGU24-10506 | Posters on site | HS3.4

Enhancing Hydrological Predictions: Feature-Driven Streamflow Forecasting with Sparse Autoencoder-based Long Short-Term Memory Networks 

Neha Vinod, Arathy Nair Geetha Raveendran, Adarsh Sankaran, and Anandu Kochukattil Ajith

In response to the critical demand for accurate streamflow predictions in hydrology, this study introduces a Sparse Autoencoder-based Long Short-Term Memory (SA-LSTM) framework applied to daily streamflow data from three-gauge stations within the Greater Pamba River Basin of Kerala, India, which was the worst affected region by the devastating floods of 2018. The SA-LSTM model addresses the challenge of feature selection from an extensive set of corresponding 1 to 7 days lagged climatic variables, such as precipitation, maximum and minimum temperatures, by incorporating a sparsity constraint. This constraint strategically guides the autoencoder to focus on the most influential features for the prediction analysis. The prediction process involves training the SA-LSTM model on historical streamflow data and climatic variables, allowing the model to learn intricate patterns and relationships. Furthermore, this study includes a comparative analysis featuring the Random Forest (RF)-LSTM model, where the RF model is employed for feature extraction, and a separate LSTM model is used for streamflow prediction. While the RF-LSTM combination demonstrates competitive performance, it is noteworthy that the SA-LSTM model consistently outperforms in terms of predictive accuracy. Rigorous evaluation metrics, including Correlation Coefficient (R2), Root Mean Square Error (RMSE), Mean Square Error (MSE), and Mean Absolute Error (MAE), highlight the SA-LSTM's forecasting accuracy across the three stations. Notably, the R2 values surpass 0.85, RMSE values remain under 12 cubic meters per second (m³/s), MSE values are below 70 (m³/s), and MAE values approach 8 m³/s. The detailed comparison between the above models underscores the superior capabilities of the SA-LSTM framework in capturing complex temporal patterns, emphasizing its potential for advancing hydrological modeling and flood risk management in flood-prone regions.


Key words : Streamflow, LSTM, Sparse Autoencoder, Flood, Greater Pamba

How to cite: Vinod, N., Geetha Raveendran, A. N., Sankaran, A., and Kochukattil Ajith, A.: Enhancing Hydrological Predictions: Feature-Driven Streamflow Forecasting with Sparse Autoencoder-based Long Short-Term Memory Networks, EGU General Assembly 2024, Vienna, Austria, 14–19 Apr 2024, EGU24-10506, https://doi.org/10.5194/egusphere-egu24-10506, 2024.

EGU24-11506 | ECS | Posters on site | HS3.4

Forecasting reservoir inflows with Long Short-Term Memory models 

Laura Soncin, Claudia Bertini, Schalk Jan van Andel, Elena Ridolfi, Francesco Napolitano, Fabio Russo, and Celia Ramos Sánchez

The increased variability of water resources and the escalating water consumption contribute to the risk of stress and water scarcity in reservoirs that are typically designed based on historical conditions. Therefore, it is relevant to provide accurate forecasts of reservoir inflow to optimize sustainable water management as conditions change, especially during extreme events, such as flooding and drought. However, accurate forecasting the inflow is not straightforward, due the uncertainty of the hydrological inputs and the strong non-linearity of the system. Numerous recent studies have employed approaches based on Machine Learning (ML) techniques, such as Artificial Neural Networks (ANN), Long Short-Term Memory (LSTM), and Random Forest (RF), with successful examples of providing skilful site-specific predictions. In particular, LSTM have emerged among the pool of ML models for their performance in simulating rainfall-runoff processes, thanks to their ability to learn long-term dependencies from time series. 
Here we propose an LSTM-based approach for inflow prediction in the Barrios de Luna reservoir, located in the Spanish part of the Douro River Basin. The reservoir has a dual role, as its water is used for irrigation during dry summer periods, and its storage volume is used to mitigate floods. Therefore, in order to operate the reservoir in the short-term, Barrios de Luna reservoir operators need accurate forecast to support water management decisions in the daily and weekly time horizons. In our work, we explore the potential of a LSTM model to predict inflow in the reservoir at varying lead times, ranging from 1 day up to 4 weeks. Initially, we use as inputs past inflow, precipitation and temperature observations, and then we include meteorological forecasts of precipitation and temperature from ECMWF Extended Range. For the latter experiments, different configurations of the LSTM are tested, i.e. training the model with observations and forecasts together and training the model with observations only and fine tune it with forecasts.
Our preliminary results show that precipitation, temperature and inflow observations are all crucial inputs to the LSTM for predicting inflow, and meteorological forecast inputs seem to improve performance for the longer lead-times of one week up to a month.
Predictions developed will contribute to the Douro case study of the CLImate INTelligence (CLINT) H2020 project.

How to cite: Soncin, L., Bertini, C., van Andel, S. J., Ridolfi, E., Napolitano, F., Russo, F., and Ramos Sánchez, C.: Forecasting reservoir inflows with Long Short-Term Memory models, EGU General Assembly 2024, Vienna, Austria, 14–19 Apr 2024, EGU24-11506, https://doi.org/10.5194/egusphere-egu24-11506, 2024.

EGU24-11768 | ECS | Posters on site | HS3.4

High-Efficiency Rainfall Data Compression Using Binarized Convolutional Autoencoder 

Manuel Traub, Fedor Scholz, Thomas Scholten, Christiane Zarfl, and Martin V. Butz

In the era of big data, managing and storing large-scale meteorological datasets is a critical challenge. We focus on high-resolution rainfall data, which is crucial to atmospheric sciences, climate research, and real-time weather forecasting. This study introduces a deep learning-based approach to compress the German Radar-Online-Aneichung (RADOLAN) rainfall dataset. We achieve a compression ratio of 200:1 while maintaining a minimal mean squared reconstruction error (MSE). Our method combines a convolutional autoencoder with a novel binarization mechanism, to compress data from a resolution of 900x900 pixels at 32-bit depth to 180x180 pixels at 4-bit depth. Leveraging the ConvNeXt architecture (Zhuang Liu, et al., 'A ConvNet for the 2020s'), our method learns a convolutional autoencoder for enhanced meteorological data compression. ConvNeXt introduces key architectural modifications, such as revised layer normalization and expanded receptive fields, taking inspiration from Vision Transformer to form a modern ConvNet. Our novel binarization mechanism, pivotal for achieving the high compression ratio, operates by dynamically quantizing the latent space representations using a novel magnitude specific noise injection technique. This quantization not only reduces the data size but also preserves crucial meteorological information as our low reconstruction MSE demonstrates. Beyond rainfall data, our approach shows promise for other types of high-resolution meteorological datasets, such as temperature, humidity, etc. Adapting our method to these modalities could further streamline the data management processes in meteorological deep learning scenarios and thus facilitate efficient storage and processing of diverse meteorological datasets.

How to cite: Traub, M., Scholz, F., Scholten, T., Zarfl, C., and Butz, M. V.: High-Efficiency Rainfall Data Compression Using Binarized Convolutional Autoencoder, EGU General Assembly 2024, Vienna, Austria, 14–19 Apr 2024, EGU24-11768, https://doi.org/10.5194/egusphere-egu24-11768, 2024.

Machine learning has extensively been applied to for flow forecasting in gauged basins. Increasingly, models generating forecasts in some basin(s) of interest are trained using data from beyond the study region. With increasingly large hydrological datasets, a new challenge emerges: given some region of interest, how do you select which basins to include among the training dataset?

There is currently little guidance on selecting data from outside the basin(s) under study. An intuitive approach might be to select data from neighbouring basins, or basins with similar hydrological characteristics. However, a growing body of research suggests that including hydrologically dissimilar basins can in fact produce greater improvements to model generalisation. In this study, we use clustering as a simple yet effective method for identifying temporal and spatial hydrological diversity within a large hydrological dataset. The clustering results are used to generate information-rich subsets of data, that are used for model training. We compare the effects that basin subsets, that represent various hydrological characteristics, have on model generalisation.
Our study shows that data within individual basins, and between hydrologically similar basins, contain high degrees of redundancy. In such cases, training data can be heavily undersampled with no adverse effects – or even moderate improvements to model performance. We also show that spatial hydrological diversity can hugely benefit model training, providing improved generalisation and a regularisation effect.

How to cite: Snieder, E. and Khan, U.: Towards improved spatio-temporal selection of training data for LSTM-based flow forecasting models in Canadian basins, EGU General Assembly 2024, Vienna, Austria, 14–19 Apr 2024, EGU24-12293, https://doi.org/10.5194/egusphere-egu24-12293, 2024.

We propose a hybrid deep learning model that combines long short-term memory networks (LSTMs) to capture both spatial and temporal dependencies in the river system. The LSTM component processes spatial information derived from topographical data and river network characteristics, allowing the model to understand the physical layout of the river basin. Simultaneously, the LSTM component exploits temporal patterns in historical dam release and rainfall data, enabling the model to discern the dynamics of flood propagation. In comparison of previous study, previous results accepted only hydrological models such as HECRAS, FLDWAV, FLUMEN. But, this study accept combination of HECRAS and Deep Learning algorithm, LSTM. The goal of this study is to predict the river highest level and travel time by dam release 3 to 6 hours in advance throughout the Seomjin river basin. In order to achieve, this study conducted hydrological modeling (HECRAS) and developed a deep learning algorithm (LSTM). Afterward, the developed model combining HECRAS and LSTM was verified at six flood alert stations. Finally, the models will provide the river highest level and travel time information up to 6 hours in advance at six flood alert stations. To train and validate the model, we compile a comprehensive dataset of historical dam release events and corresponding flood travel times from a range of river basins. The dataset includes various hydrological and meteorological features to ensure the model's robustness in handling diverse scenarios. The deep learning model is then trained using a subset of the data and validated against unseen events to assess its generalization capabilities. Preliminary results indicate that the hybrid HECRAS-LSTM model outperforms traditional hydrological models in predicting flood travel times. The model exhibits improved accuracy, particularly in cases of complex river geometries and extreme weather events. Additionally, the model demonstrates its potential for real-time forecasting, as it can efficiently process and assimilate incoming data. In conclusion, our study showcases the effectiveness of using a hybrid HECRAS-LSTM model for forecasting flood travel time by dam release. By leveraging the power of deep learning, we pave the way for more precise and reliable flood predictions, contributing to the overall resilience and safety of communities located downstream of dam-controlled river systems.

How to cite: Kang, J., Lee, G., Park, S., Jung, C., and Yu, J.: The Development of Forecasting System Flood Travel Time by Dam Release for Supplying Flood Information Using Deep Learning at Flood Alert Stations in the Seomjin River Basin, EGU General Assembly 2024, Vienna, Austria, 14–19 Apr 2024, EGU24-13848, https://doi.org/10.5194/egusphere-egu24-13848, 2024.

EGU24-14765 | ECS | Posters virtual | HS3.4

Optimizing Groundwater Forecasting: Comparative Analysis of MLP Models Using Global and Regional Precipitation Data 

Akanksha Soni, Surajit Deb Barma, and Amai Mahesha

This study investigates the efficacy of Multi-Layer Perceptron (MLP) models in groundwater level modeling, specifically emphasizing the pivotal role of input data quality, particularly precipitation data. Unlike prior research that primarily focused on regional datasets like those from the India Meteorological Department (IMD), our research explores the integration of global precipitation data, specifically leveraging the Integrated Multi-satellitE Retrievals for Global Precipitation Measurement (IMERG) dataset for MLP-based modeling. The assessment was conducted using two wells in Dakshina Kannada, evaluating four MLP models (GA-MLP, EFO-MLP, PSO-MLP, AAEO-MLP) with IMERG and IMD precipitation data. Performance metrics were employed, including mean absolute error, root mean square error, normalized Nash-Sutcliffe efficiency, and Pearson's correlation index. The study also includes convergence analysis and stability assessments, revealing the significant impact of the precipitation dataset on model performance. Noteworthy findings include the superior performance of the AAEO-MLP model in training with IMD data and the GA-MLP model's outperformance in testing at the Bajpe well with both datasets. The stability of the GA-MLP model, indicated by the lowest standard deviation values in convergence analysis, underscores its reliability. Moreover, transitioning to the IMERG dataset improved model performance and reduced variability, providing valuable insights into the strengths and limitations of MLP models in groundwater-level modeling. These results advance the precision and dependability of groundwater level forecasts, thereby supporting more effective strategies for international groundwater resource management.

How to cite: Soni, A., Barma, S. D., and Mahesha, A.: Optimizing Groundwater Forecasting: Comparative Analysis of MLP Models Using Global and Regional Precipitation Data, EGU General Assembly 2024, Vienna, Austria, 14–19 Apr 2024, EGU24-14765, https://doi.org/10.5194/egusphere-egu24-14765, 2024.

EGU24-15248 | ECS | Orals | HS3.4

Estimation of Small Stream Water Surface Elevation Using UAV Photogrammetry and Deep Learning 

Radosław Szostak, Mirosław Zimnoch, Przemysław Wachniew, Marcin Pietroń, and Paweł Ćwiąkała

Unmanned aerial vehicle (UAV) photogrammetry allows the generation of orthophoto and digital surface model (DSM) rasters of a terrain. However, DSMs of water bodies mapped using this technique often reveal distortions in the water surface, thereby impeding the accurate sampling of water surface elevation (WSE) from DSMs. This study investigates the capability of deep neural networks to accommodate the aforementioned perturbations and effectively estimate WSE from photogrammetric rasters. Convolutional neural networks (CNNs) were employed for this purpose. Three regression approaches utilizing CNNs were explored: i) direct regression employing an encoder, ii) prediction of the weight mask using an encoder-decoder architecture, subsequently used to sample values from the photogrammetric DSM, and iii) a solution based on the fusion of the two approaches. The dataset employed in this study comprises data collected from five case studies of small lowland streams in Poland and Denmark, consisting of 322 DSM and orthophoto raster samples. Each sample corresponds to a 10 by 10 meter area of the stream channel and adjacent land. A grid search was employed to identify the optimal combination of encoder, mask generation architecture, and batch size among multiple candidates. Solutions were evaluated using two cross-validation methods: stratified k-fold cross-validation, where validation subsets maintained the same proportion of samples from all case studies, and leave-one-case-out cross-validation, where the validation dataset originates entirely from a single case study, and the training set consists of samples from other case studies. The proposed solution was compared with existing methods for measuring water levels in small streams using a drone. The results indicate that the solution outperforms previous photogrammetry-based methods and is second only to the radar-based method, which is considered the most accurate method available.

This research was funded by National Science Centre, Poland, project WATERLINE (2020/02/Y/ST10/00065), under the CHISTERA IV programme of the EU Horizon 2020 (Grant no 857925).

How to cite: Szostak, R., Zimnoch, M., Wachniew, P., Pietroń, M., and Ćwiąkała, P.: Estimation of Small Stream Water Surface Elevation Using UAV Photogrammetry and Deep Learning, EGU General Assembly 2024, Vienna, Austria, 14–19 Apr 2024, EGU24-15248, https://doi.org/10.5194/egusphere-egu24-15248, 2024.

EGU24-16234 | ECS | Posters on site | HS3.4

A bottom-up approach to identify important hydrological processes by evaluating a national scale EA-LSTM model for Denmark 

Grith Martinsen, Niels Agertoft, and Phillip Aarestrup

The utilization of data-driven models in hydrology has witnessed a significant increase in recent years. The open-source philosophy underpinning much of the code developed and research being conducted has facilitated widespread access to the the hydrological community to sophisticated machine learning models and technology (Reichstein 2019). These data driven approaches to hydrological modelling has witnessed growing interest after multiple studies has shown how machine-learning models were able to outperform nationwide traditional physics-based hydrological models (Kratzerts et al. 2019). The latter often demands substantial man-hours for development, calibration and fine-tuning to accurately represent relevant hydrological processes.

In this national-scale explorative study we undertake an in-depth examination of Danish catchment hydrology. Our objective is to understand what processes and dynamics are well captured by a purely data driven model without physical constraints, namely the Entity-Aware Long Short-Term Model (EA-LSTM). The model code was developed by Kratzerts et al. (2019) and the analysis build on top of a newly published national CAMELS data set covering 301 catchments in Denmark (Koch and Schneider, 2022), with an average resolution of 130 km2.

Denmark, spanning an area of around 43 000 km2, demonstrates a relatively high data coverage. Presently more than 400 stations record water level measurements in the Danish stream network, while a network of 243 stations have collected meteorological data since 2011. These datasets maintained by the Danish Environmental Protection Agency and the Danish Meteorological Institute, respectively, and are publicly available.

Despite Denmark’s data abundance, Koch and Schneider (2022) demonstrated that the data-driven EA-LSTM model, trained with the CAMELS dataset for Denmark (from now on referred to as the DK-LSTM) were not able to outperform the traditional physics-based hydrological model, against which it was benchmarked. Consequently, performance of the DK-LSTM model could be increased by pre-training it with simulations from a national physics-based model indicating that dominating hydrological processes are not described by the readily available input data in the CAMELS dataset.

This study conducts a comprehensive analysis of Danish catchment hydrology aiming to explore three aspects: 1) the common characteristics of the catchments where the DK-LSTM performs well or encounters challenges, 2) the identification of hydrological characteristics, that exhibit improvement when informing the data-driven model with physics-based model simulations, and 3) an exploration of whether the aforementioned findings can guide us in determining necessary physical constraints and/or input variables that explains the hydrological processes for the data-driven model approach at a national scale, using the example of DK-LSTM.


Koch, J., and Schneider, R. Long short-term memory networks enhance rainfall-runoff modelling at the national scale of Denmark. GEUS Bulletin49. https://doi.org/10.34194/geusb.v49.8292, 2022.

Kratzert, F., Klotz, D., Shalev, G., Klambauer, G., Hochreiter, S., and Nearing, G.: Towards learning universal, regional, and local hydrological behaviors via machine learning applied to large-sample datasets, Hydrol. Earth Syst. Sci., 23, 5089-5110, https://doi.org/10.5194/hess-23-5089-2019, 2019.

Reichstein, M., Camps-Valls, G., Stevens, B. et al. Deep learning and process understanding for data-driven Earth system science. Nature 566, 195–204. https://doi.org/10.1038/s41586-019-0912-1, 2019.

How to cite: Martinsen, G., Agertoft, N., and Aarestrup, P.: A bottom-up approach to identify important hydrological processes by evaluating a national scale EA-LSTM model for Denmark, EGU General Assembly 2024, Vienna, Austria, 14–19 Apr 2024, EGU24-16234, https://doi.org/10.5194/egusphere-egu24-16234, 2024.

EGU24-16474 | ECS | Orals | HS3.4

Short- and mid-term discharge forecasts combining machine learning and data assimilation for operational purpose 

Bob E Saint Fleur, Eric Gaume, Michaël Savary, Nicolas Akil, and Dominique Theriez

In recent years, machine learning models, particularly Long Short-Term Memory (LSTM), have proven to be effective alternatives for rainfall-runoff modeling, surpassing traditional hydrological modeling approaches 1. These models have predominantly been implemented and evaluated for rainfall-runoff simulations. However, operational hydrology often requires short- and mid-term forecasts. To be effective, such forecasts must consider past observed values of the predicted variables, requiring a data assimilation procedure 2,3,4. This presentation will evaluate several approaches based on the combination of open-source machine learning tools and data assimilation strategies for short- and mid-term discharge forecasting of flood and/or drought events. The evaluation is based on the rich and well-documented CAMELS dataset 5,6,7. The tested approaches include: (1) coupling pre-trained LSTMs on the CAMELS database with a Multilayer Perceptron (MLP) for prediction error corrections, (2) direct discharge MLP forecasting models specific for each lead time, including past observed discharges as input variables, and (3) option 2, including the LSTM-predicted discharges as input variables. In the absence of historical archives of weather forecasts (rainfall, temperatures, etc.), the different forecasting approaches will be tested in two configurations: (1) weather forecasts assumed to be perfect (using observed meteorological variables over the forecast horizon in place of predicted variables or ensembles) and (2) use of ensembles reflecting climatological variability over the forecast horizons for meteorological variables ensembles made up of time series randomly selected from the past. The forecast horizons considered range from 1 to 10 days, and the results are analyzed in light of the time of concentration of the watersheds.


References

1. Kratzert F, Klotz D, Brenner C, Schulz K, Herrnegger M. Rainfall–runoff modelling using Long Short-Term Memory (LSTM) networks. Hydrol Earth Syst Sci. 2018;22(11):6005-6022. doi:10.5194/hess-22-6005-2018

2. Bourgin F, Ramos MH, Thirel G, Andréassian V. Investigating the interactions between data assimilation and post-processing in hydrological ensemble forecasting. J Hydrol (Amst). 2014;519:2775-2784. doi:10.1016/j.jhydrol.2014.07.054

3. Boucher M ‐A., Quilty J, Adamowski J. Data Assimilation for Streamflow Forecasting Using Extreme Learning Machines and Multilayer Perceptrons. Water Resour Res. 2020;56(6). doi:10.1029/2019WR026226

4. Piazzi G, Thirel G, Perrin C, Delaigue O. Sequential Data Assimilation for Streamflow Forecasting: Assessing the Sensitivity to Uncertainties and Updated Variables of a Conceptual Hydrological Model at Basin Scale. Water Resour Res. 2021;57(4). doi:10.1029/2020WR028390

5. Newman AJ, Clark MP, Sampson K, et al. Development of a large-sample watershed-scale hydrometeorological data set for the contiguous USA: data set characteristics and assessment of regional variability in hydrologic model performance. Hydrol Earth Syst Sci. 2015;19(1):209-223. doi:10.5194/hess-19-209-2015

6. Kratzert, F. (2019). Pretrained models + simulations for our HESSD submission "Towards learning universal, regional, and local hydrological behaviors via machine learning applied to large-sample datasets", HydroShare, https://doi.org/10.4211/hs.83ea5312635e44dc824eeb99eda12f06

7. Kratzert, F. (2019). CAMELS Extended Maurer Forcing Data, HydroShare, https://doi.org/10.4211/hs.17c896843cf940339c3c3496d0c1c077

How to cite: Saint Fleur, B. E., Gaume, E., Savary, M., Akil, N., and Theriez, D.: Short- and mid-term discharge forecasts combining machine learning and data assimilation for operational purpose, EGU General Assembly 2024, Vienna, Austria, 14–19 Apr 2024, EGU24-16474, https://doi.org/10.5194/egusphere-egu24-16474, 2024.

EGU24-17502 | ECS | Posters on site | HS3.4

Towards improved Water Quality Modelling using Neural ODE models 

Marvin Höge, Florian Wenk, Andreas Scheidegger, Carlo Albert, and Andreas Frömelt

Neural Ordinary Differential Equations (ODEs) fuse neural networks with a mechanistic equation framework. This hybrid structure offers both traceability of model states and processes, as it is typical for physics-based models, and the ability of machine learning to encode new functional relations. Neural ODE models have demonstrated high potential in hydrologic predictions and scientific investigation of the related process in the hydrologic cycle, i.e. tasks of water quantity estimation (Höge et al., 2022).

This explicit representation of state variables is key to water quality modelling. There, we typically have several interrelated state variables like nitrate, nitrite, phosphorous, organic matter,…  Traditionally, these states are modelled based on mechanistic kinetic rate expressions that are often only rough approximations of the underlying dynamics. At the same time, this domain of water research suffers from data scarcity and therefore solely data-driven methods struggle to provide accurate predictions reliably. We show how to improve predictions of state dynamics and to foster knowledge gain about the processes in such interrelated systems with multiple states using Neural ODEs. 

Höge, M., Scheidegger, A., Baity-Jesi, M., Albert, C., & Fenicia, F.: Improving hydrologic models for predictions and process understanding using Neural ODEs. Hydrol. Earth Syst. Sci., 26, 5085-5102, https://hess.copernicus.org/articles/26/5085/2022/

How to cite: Höge, M., Wenk, F., Scheidegger, A., Albert, C., and Frömelt, A.: Towards improved Water Quality Modelling using Neural ODE models, EGU General Assembly 2024, Vienna, Austria, 14–19 Apr 2024, EGU24-17502, https://doi.org/10.5194/egusphere-egu24-17502, 2024.

EGU24-17543 | Orals | HS3.4

Deep-learning-based prediction of damages related to surface water floods for impact-based warning 

Pascal Horton, Markus Mosimann, Severin Kaderli, Olivia Martius, Andreas Paul Zischg, and Daniel Steinfeld

Surface water floods are responsible for a substantial amount of damage to buildings, yet they have received less attention than fluvial floods. Nowadays, both research and insurance companies are increasingly focusing on these phenomena to enhance knowledge and prevention efforts. This study builds upon pluvial-related damage data provided by the Swiss Mobiliar Insurance Company and the Building Insurance of Canton Zurich (GVZ) with the goal of developing a data-driven model for predicting potential damages in future precipitation events.

This work is a continuation of a previous method applied to Swiss data, relying on thresholds based on the quantiles of precipitation intensity and event volume, which, however, resulted in an excessive number of false alarms. First, a logistic regression has been assessed using different characteristics of the precipitation event. Subsequently, a random forest was established, incorporating terrain attributes to better characterize local conditions. Finally, a deep learning model was developed to account for the spatio-temporal properties of the precipitation fields on a domain larger than the targeted 1 km cell. The deep learning model comprises a convolutional neural network (CNN) for 4D precipitation data and subsequent dense layers, incorporating static attributes. The model has been applied to predict the probability of damage occurrence, as well as the damage degree quantified by the number of claims relative to the number of insured buildings.

How to cite: Horton, P., Mosimann, M., Kaderli, S., Martius, O., Zischg, A. P., and Steinfeld, D.: Deep-learning-based prediction of damages related to surface water floods for impact-based warning, EGU General Assembly 2024, Vienna, Austria, 14–19 Apr 2024, EGU24-17543, https://doi.org/10.5194/egusphere-egu24-17543, 2024.

EGU24-18073 | ECS | Orals | HS3.4

Operational stream water temperature forecasting with a temporal fusion transformer model 

Ryan S. Padrón, Massimiliano Zappa, and Konrad Bogner

Stream water temperatures influence aquatic biodiversity, agriculture, tourism, electricity production, and water quality. Therefore, stakeholders would benefit from an operational forecasting service that would support timely action. Deep Learning methods are well-suited for this task as they can provide probabilistic forecasts at individual stations of a monitoring network. Here we train and evaluate several state-of-the-art models using 10 years of data from 55 stations across Switzerland. Static features (e.g. station coordinates, catchment mean elevation, area, and glacierized fraction), time indices, meteorological and/or hydrological observations from the past 64 days, and their ensemble forecasts for the following 32 days are included as predictors in the models to estimate daily maximum water temperature for the next 32 days. We find that the Temporal Fusion Transformer (TFT) model performs best for all lead times with a cumulative rank probability score (CRPS) of 0.73 ºC averaged over all stations, lead times and 90 forecasts distributed over 1 full year. The TFT is followed by the Recurrent Neural Network (CRPS = 0.77 ºC), Neural Hierarchical Interpolation for Time Series (CRPS = 0.80 ºC), and Multi-layer Perceptron (CRPS = 0.85 ºC). All models outperform the benchmark ARX model. When factoring out the uncertainty stemming from the meteorological ensemble forecasts by using observations instead, the TFT improves to a CRPS of 0.43 ºC, and it remains the best of all models. In addition, the TFT model identifies air temperature and time of the year as the most relevant predictors. Furthermore, its attention feature suggests a dominant response to more recent information in the summer, and to information from the previous month during spring and autumn. Currently, daily maximum water temperature probabilistic forecasts are produced twice per week and made available at https://drought.ch/de/allgemeine-lage/wassertemperatur/fliessgewaesser-1-1.html. 

How to cite: Padrón, R. S., Zappa, M., and Bogner, K.: Operational stream water temperature forecasting with a temporal fusion transformer model, EGU General Assembly 2024, Vienna, Austria, 14–19 Apr 2024, EGU24-18073, https://doi.org/10.5194/egusphere-egu24-18073, 2024.

EGU24-18154 | ECS | Orals | HS3.4

Can Blended Model Improve Streamflow Simulation In Diverse Catchments ? 

Daneti Arun Sourya and Maheswaran Rathinasamy

Streamflow simulation or rainfall-runoff modelling has been a topic of research for the past few decades which has resulted in a plethora of modelling approaches ranging from physics models to empirical or data driven approaches. There are many physics-based (PB) models available to estimate streamflow, but still there exists uncertainty in model outputs due to incomplete representations of physical processes. Further, with advancements in machine learning (ML) concepts, there have been several attempts but with no/little physical consistency. As a result, models based on ML algorithms may be unreliable if applied to provide future hydroclimate projections where climates and land use patterns are outside the range of training data. 

Here we test blended models built by combining PB model state variables (specifically soil moisture) with ML algorithms on their ability to simulate streamflow in 671 catchments representing diverse conditions across the conterminous United States.

For this purpose, we develop a suite of blended hydrological models by pairing different PB models (Catchment Wetness Index, Catchment Moisture Deficit, GR4J, Australian Water Balance, Single-bucket Soil Moisture Accounting, and Sacramento Soil Moisture Accounting models) with different ML methods such as Long Short Term Memory network (LSTM), eXtreme Gradient Boosting (XGB).

The results indicate that the blended models provide significant improvement in catchments where PB models are underperforming. Furthermore, the accuracy of streamflow estimation is improved in catchments where the ML models failed to estimate streamflow accurately.

How to cite: Sourya, D. A. and Rathinasamy, M.: Can Blended Model Improve Streamflow Simulation In Diverse Catchments ?, EGU General Assembly 2024, Vienna, Austria, 14–19 Apr 2024, EGU24-18154, https://doi.org/10.5194/egusphere-egu24-18154, 2024.

EGU24-18762 | Orals | HS3.4

Benchmarking hydrological models for national scale climate impact assessment 

Elizabeth Lewis, Ben Smith, Stephen Birkinshaw, Helen He, and David Pritchard

National scale hydrological models are required for many types of water sector applications, for example water resources planning. Existing UK national-scale model frameworks are based on conceptual numerical schemes, with an emerging trend towards incorporating deep learning models. Existing literature has shown that groundwater/surface water interactions are key for accurately representing future flows, and these processes are most accurately represented with physically-based hydrological models.

In response to this, our study undertakes a comparative analysis of three national model frameworks (Neural Hydrology, HBV, SHETRAN) to investigate the necessity for physically-based hydrological modelling. The models were run with the full ensemble of bias-corrected UKCP18 12km RCM data which enabled a direct comparison of future flow projections. We show that whilst many national frameworks perform well for the historical period, physically-based models can give substantially different projections of future flows, particularly low flows. Moreover, our study illustrates that the physically-based model exhibits a consistent trajectory in Budyko space between the baseline and future simulations, a characteristic not shared by conceptual and deep learning models. To provide context for these results, we incorporate insights from other national model frameworks, including the eFlag project.

How to cite: Lewis, E., Smith, B., Birkinshaw, S., He, H., and Pritchard, D.: Benchmarking hydrological models for national scale climate impact assessment, EGU General Assembly 2024, Vienna, Austria, 14–19 Apr 2024, EGU24-18762, https://doi.org/10.5194/egusphere-egu24-18762, 2024.

EGU24-20636 | ECS | Orals | HS3.4

Can Attention Models Surpass LSTM in Hydrology? 

Jiangtao Liu, Chaopeng Shen, and Tadd Bindas

Accurate modeling of various hydrological variables is important for water resource management, flood forecasting, and pest control. Deep learning models, especially Long Short-Term Memory (LSTM) models based on Recurrent Neural Network (RNN) structures, have shown significant success in simulating streamflow, soil moisture, and model parameter assessment. With the development of large language models (LLMs) based on attention mechanisms, such as ChatGPT and Bard, we have observed significant advancements in fields like natural language processing (NLP), computer vision (CV), and time series prediction. Despite achieving advancements across various domains, the application of attention-based models in hydrology remains relatively limited, with LSTM models maintaining a dominant position in this field. This study evaluates the performance of 18 state-of-the-art attention-based models and their variants in hydrology. We focus on their performance in streamflow, soil moisture, snowmelt, and dissolved oxygen (DO) datasets, comparing them to LSTM models in both long-term and short-term regression and forecasting. We also examine these models' performance in spatial cross-validation. Our findings indicate that while LSTM models maintain strong competitiveness in various hydrological datasets, Attention models offer potential advantages in specific metrics and time lengths, providing valuable insights into applying attention-based models in hydrology. Finally, we discuss the potential applications of foundation models and how these methods can contribute to the sustainable use of water resources and the challenges of climate change.

How to cite: Liu, J., Shen, C., and Bindas, T.: Can Attention Models Surpass LSTM in Hydrology?, EGU General Assembly 2024, Vienna, Austria, 14–19 Apr 2024, EGU24-20636, https://doi.org/10.5194/egusphere-egu24-20636, 2024.

EGU24-20907 | Orals | HS3.4

Revolutionizing Flood Forecasting with a Generalized Deep Learning Model 

Julian Hofmann and Adrian Holt

The domain of spatial flood prediction is dominated by hydrodynamic models, which, while robust and adaptable, are often constrained by computational requirements and slow processing times. To address these limitations, the integration of Deep Learning (DL) models has emerged as a promising solution, offering the potential for rapid prediction capabilities, while maintaining a high output quality. However, a critical challenge with DL models lies in their requirement for retraining for each new domain area, based on the outputs of hydrodynamic simulations generated for that specific region. This need for domain-specific retraining hampers the scalability and quick deployment of DL models in diverse settings. Our research focuses on bridging this gap by developing a fully generalized DL model for flood prediction.

FloodWaive's approach pivots on creating a DL model that can predict flood events rapidly and accurately across various regions without requiring retraining for each new domain area. The model is trained on a rich dataset derived from numerous hydrodynamic simulations, encompassing a wide spectrum of topographical conditions. This training is designed to enable the model to generalize its predictive capabilities across different domains and weather patterns, thus overcoming the traditional limitation of DL models in this field.

Initial findings from the development phase are promising, showcasing the model's capability to process complex data and provide quick, accurate flood predictions. The success of this fully generalized DL modeling approach could revolutionize applications of flood predictions such as flood forecasting and risk analysis. Regarding the later, real-time evaluation of flood protection measures could become a reality. This would empower urban planners, emergency response teams, and environmental agencies with the ability to make informed decisions quickly, potentially saving lives and reducing economic losses.

While this project is still in its developmental stages, the preliminary results point towards a significant leap in flood forecasting technology. The ultimate goal is to offer a universally deployable, real-time flood prediction tool, significantly enhancing our ability to mitigate the impact of floods worldwide.


How to cite: Hofmann, J. and Holt, A.: Revolutionizing Flood Forecasting with a Generalized Deep Learning Model, EGU General Assembly 2024, Vienna, Austria, 14–19 Apr 2024, EGU24-20907, https://doi.org/10.5194/egusphere-egu24-20907, 2024.

One of the latent difficulties in the fields of climatology, meteorology, and hydrology is the scarce rainfall information available due to the limited or nonexistent instrumentation of river basins, especially in developing countries where the establishment and maintenance of equipment entail high costs relative to the available budget. Hence, the importance of generating alternatives that seek to improve spatial precipitation estimation has been increasing, given the advances in the implementation of computational algorithms that involve Machine Learning techniques. In this study, a multitask convolutional neural network was implemented, composed of an encoder-decoder architecture (U-Net), which simultaneously estimates the probability of rain through a classification model and the precipitation rate through a regression model at a spatial resolution of 2 km2 and a temporal resolution of 10 minutes. The input modalities included data from rain gauge stations, weather radar, and satellite information (GOES 16). For model training,  validation, and testing, a dataset was consolidated with 3 months of information (February to April 2021) with a distribution of 70/15/15 percent, covering the effective coverage range of the Munchique weather radar located in the Andean region of Colombia. The obtained results show a Probability of Detection (POD) of 0.59 and a False Alarm Rate (FAR) of 0.39. Regarding precipitation rate estimation, it is assessed with a Root Mean  Square Error (RMSE) of 1.13 mm/10min. This research highlights the significant capability of deep learning algorithms in reconstructing and reproducing the spatial pattern of rainfall in tropical regions with limited instrumentation. However, there is a need to continue strengthening climatological monitoring networks to achieve significant spatial representativeness, thereby reducing potential biases in model estimations. 

How to cite: Barrios, M., Rubiano, H., and Guevara-Ochoa, C.: Implementation of deep learning algorithms in the sub-hourly rainfall fields estimation from remote sensors and rainfall gauge information in the tropical Andes, EGU General Assembly 2024, Vienna, Austria, 14–19 Apr 2024, EGU24-21431, https://doi.org/10.5194/egusphere-egu24-21431, 2024.

EGU24-262 | Orals | HS3.5

Differentiable modeling for global water resources under global change 

Chaopeng Shen, Yalan Song, Farshid Rahmani, Tadd Bindas, Doaa Aboelyazeed, Kamlesh Sawadekar, Martyn Clark, and Wouter Knoben

Process-based modeling offers interpretability and physical consistency in many domains of geosciences but struggles to leverage large datasets efficiently. Machine-learning methods, especially deep networks, have strong predictive skills yet are unable to answer specific scientific questions. A recently proposed genre of physics-informed machine learning, called “differentiable” modeling (DM, https://t.co/qyuAzYPA6Y), trains neural networks (NNs) with process-based equations (priors) together in one stage (so-called “end-to-end”) to benefit from the best of both NNs and process-based paradigms. The NNs do not need target variables for training but can be indirectly supervised by observations matching the outputs of the combined model, and differentiability critically supports learning from big data. We propose that differentiable models are especially suitable as global hydrologic models because they can harvest information from big earth observations to produce state-of-the-art predictions (https://mhpi.github.io/benchmarks/), enable physical interpretation naturally, extrapolate well (due to physical constraints) in space and time, enforce known physical laws and sensitivities, and leverage progress in modern AI computing architecture and infrastructure. Differentiable models can also synergize with existing global hydrologic models (GHMs) and learn from the lessons of the community. Differentiable GHMs to answer pressing societal questions on water resources availability, climate change impact assessment, water management, and disaster risk mitigation, among others. We demonstrate the power of differentiable modeling using computational examples in rainfall-runoff modeling, river routing, forcing fusion, as well applications in water-related domains such as ecosystem modeling and water quality modeling. We discuss how to address potential challenges such as implementing gradient tracking for implicit numerical schemes and addressing process tradeoffs. Furthermore, we show how differentiable modeling can enable us to ask fundamental questions in hydrologic sciences and get robust answers from big global data.

How to cite: Shen, C., Song, Y., Rahmani, F., Bindas, T., Aboelyazeed, D., Sawadekar, K., Clark, M., and Knoben, W.: Differentiable modeling for global water resources under global change, EGU General Assembly 2024, Vienna, Austria, 14–19 Apr 2024, EGU24-262, https://doi.org/10.5194/egusphere-egu24-262, 2024.

Streamflow can be affected by numerous factors, such as solar radiation, underlying surface conditions, and atmospheric circulation which results in nonlinearity, uncertainty, and randomness in streamflow time series. Diverse conventional and Deep Learning (DL) models have been applied to recognize the complex patterns and discover nonlinear relationships in the hydrological time series and incorporating multi-variables in deep learning can match or improve streamflow forecasts and hopes to improve extreme value predictions. Multivariate approaches surpass univariate ones by including additional time series as explanatory variables. Deep neural networks (DNNs) excel in multi-horizon time series forecasting, outperforming classical models. However, determining the relative contribution of each variable in streamflow remains challenging due to the black-box nature of DL models.


We propose utilizing the advanced Temporal Fusion Transformers (TFT) deep-learning technique to model streamflow values across various temporal scales, incorporating multiple variables. TFT's attention-based architecture enables high-performance multi-horizon forecasting with interpretable insights into temporal dynamics. Additionally, the model identifies the significance of each input variable, recognizes persistent temporal patterns, and highlights extreme events. Despite its application in a few studies across different domains, the full potential of this model remains largely unexplored. The study focused on Sundargarh, an upper catchment of the Mahanadi basin in India, aiming to capture pristine flow conditions. QGIS was employed to delineate the catchment, and daily streamflow data from 1982 to 2020 were obtained from the Central Water Commission. Input variables included precipitation, potential evaporation, temperature, and soil water volume at different depths. Precipitation and temperature datasets were obtained from India Meteorological Department (IMD) datasets, while other variables were sourced from the ECMWF fifth-generation reanalysis (ERA-5). Hyperparameter tuning was conducted using the Optuna optimization framework, known for its efficiency and easy parallelization. The model trained using quantile loss function with different combinations of quantiles, demonstrated superior performance with upper quantiles. Evaluations using R2 and NSE indicated good performance in monthly streamflow predictions for testing sets, particularly in confidently predicting low and medium flows. While peak flows were well predicted at certain timesteps, there were instances of underperformance. Unlike other ML algorithms, TFT can learn seasonality and lag analysis patterns directly from raw training data, including the identification of crucial variables. The model underwent training for different time periods, checking for performance improvement with increased length of data. To gain a better understanding of how distinct sub-processes affect streamflow patterns at various time scales, the model was applied at pentad and daily scales. Evaluation at extreme values prompted an investigation into improving predictions through quantile loss function adjustments. Given the computational expense of daily streamflow forecasting using TFT with multiple variables, parallel computing is employed. Results demonstrated considerable accuracy, but validating TFT's interpretive abilities require testing alternative ML models.


How to cite: Mohan, M. and Kumar D, N.: Multivariate multi-horizon streamflow forecasting for extremes and their interpretation using an explainable deep learning architecture, EGU General Assembly 2024, Vienna, Austria, 14–19 Apr 2024, EGU24-451, https://doi.org/10.5194/egusphere-egu24-451, 2024.

EGU24-2211 | ECS | Posters on site | HS3.5

Staged Learning in Physics-Informed Neural Networks to Model Contaminant Transport under Parametric Uncertainty 

Milad Panahi, Giovanni Porta, Monica Riva, and Alberto Guadagnini

Addressing the complexities of groundwater modeling, especially under the veil of uncertain physical parameters and limited observational data, poses significant challenges. This study introduces an approach using Physics-Informed Neural Network (PINN) framework to unravel these uncertainties. Termed PINN under uncertainty, PINN-UU, adeptly integrates uncertain parameters within spatio-temporal domains, focusing on hydrological systems. This approach, exclusively built on underlying physical equations, leverages a staged training methodology, effectively navigating high-dimensional solution spaces. We demonstrate our approach through application of reactive transport modeling in porous media, a problem setting relevant to contaminant transport in soil and groundwater. PINN-UU shows promising capabilities in enhancing model reliability and efficiency, and in conducting sensitivity analysis. Our approach is designed to be accessible and engaging, offering insightful contributions to environmental engineering, and hydrological modeling. It represents a step toward deciphering complex geohydrological systems, with broad implications for resource management and environmental science.

How to cite: Panahi, M., Porta, G., Riva, M., and Guadagnini, A.: Staged Learning in Physics-Informed Neural Networks to Model Contaminant Transport under Parametric Uncertainty, EGU General Assembly 2024, Vienna, Austria, 14–19 Apr 2024, EGU24-2211, https://doi.org/10.5194/egusphere-egu24-2211, 2024.

EGU24-2850 | ECS | Orals | HS3.5

Development of a Distributed Physics-informed Deep Learning Hydrological Model for Data-scarce Regions 

Liangjin Zhong, Huimin Lei, and JIngjing Yang

Climate change has exacerbated water stress and water-related disasters, necessitating more precise runoff simulations. However, in the majority of global regions, a deficiency of runoff data constitutes a significant constraint on modeling endeavors. Traditional distributed hydrological models and regionalization approaches have shown suboptimal performance. While current data-driven models trained on large datasets excel in spatial extrapolation, the direct applicability of these models in certain regions with unique hydrological processes may be challenging due to the limited representativeness within the training dataset. Furthermore, transfer learning deep learning models pre-trained on large datasets still necessitate local data for retraining, thereby constraining their applicability. To address these challenges, we present a physics-informed deep learning model based on a distributed framework. It involves spatial discretization and the establishment of differentiable hydrological models for discrete sub-basins, coupled with a differentiable Muskingum method for channel routing. By introducing upstream-downstream relationships, model errors in sub-basins propagate through the river network to the watershed outlet, enabling the optimization using limited downstream runoff data, thereby achieving spatial simulation of ungauged internal sub-basins. The model, when trained solely on the downstream-most station, outperforms the distributed hydrological model in runoff simulation at both the training station and upstream stations, as well as evapotranspiration spatial patterns. Compared to transfer learning, our model requires less training data, yet achieves higher precision in simulating runoff on spatially hold-out stations and provides more accurate estimates of spatial evapotranspiration. Consequently, this model offers a novel approach to hydrological simulation in data-scarce regions with unique processes.

How to cite: Zhong, L., Lei, H., and Yang, J.: Development of a Distributed Physics-informed Deep Learning Hydrological Model for Data-scarce Regions, EGU General Assembly 2024, Vienna, Austria, 14–19 Apr 2024, EGU24-2850, https://doi.org/10.5194/egusphere-egu24-2850, 2024.

EGU24-3028 | Orals | HS3.5 | Highlight

Spatial sensitivity of river flooding to changes in climate and land cover through explainable AI 

Louise Slater, Gemma Coxon, Manuela Brunner, Hilary McMillan, Le Yu, Yanchen Zheng, Abdou Khouakhi, Simon Moulds, and Wouter Berghuijs

Explaining the spatially variable impacts of flood-generating mechanisms is a longstanding challenge in hydrology, with increasing and decreasing temporal flood trends often found in close regional proximity. Here, we develop a machine learning-informed approach to unravel the drivers of seasonal flood magnitude and explain the spatial variability of their effects in a temperate climate. We employ 11 observed meteorological and land cover time series variables alongside 8 static catchment attributes to model flood magnitude in 1268 catchments across Great Britain over four decades. We then perform a sensitivity analysis to understand how +10% precipitation, +1°C air temperature, or +10 percentage points of urbanisation or afforestation affect flood magnitude in catchments with varying characteristics. Our simulations show that increasing precipitation and urbanisation both tend to amplify flood magnitude significantly more in catchments with high baseflow contribution and low runoff ratio, which tend to have lower values of specific discharge on average. In contrast, rising air temperature (in the absence of changing precipitation) decreases flood magnitudes, with the largest effects in dry catchments with low baseflow index. Afforestation also tends to decrease floods more in catchments with low groundwater contribution, and in dry catchments in the summer. These reported associations are significant at p<0.001. Our approach may be used to further disentangle the joint effects of multiple flood drivers in individual catchments.

How to cite: Slater, L., Coxon, G., Brunner, M., McMillan, H., Yu, L., Zheng, Y., Khouakhi, A., Moulds, S., and Berghuijs, W.: Spatial sensitivity of river flooding to changes in climate and land cover through explainable AI, EGU General Assembly 2024, Vienna, Austria, 14–19 Apr 2024, EGU24-3028, https://doi.org/10.5194/egusphere-egu24-3028, 2024.

EGU24-4105 | ECS | Orals | HS3.5

Global flood projection and socioeconomic implications under a physics-constrained deep learning framework 

Shengyu Kang, Jiabo Yin, Louise Slater, Pan Liu, and Dedi Liu

As the planet warms, the frequency and severity of weather-related hazards such as floods are intensifying, posing substantial threats to communities around the globe. Rising flood peaks and volumes can claim lives, damage infrastructure, and compromise access to essential services. However, the physical mechanisms behind global flood evolution are still uncertain, and their implications for socioeconomic systems remain unclear. In this study, we leverage a supervised machine learning technique to identify the dominant factors influencing daily streamflow. We then propose a physics-constrained cascade model chain which assimilates water and heat transport processes to project bivariate risk (i.e. flood peak and volume together), along with its socioeconomic consequences. To achieve this, we drive a hybrid deep learning-hydrological model with bias-corrected outputs from twenty global climate models (GCMs) under four shared socioeconomic pathways (SSPs). Our results project considerable increases in flood risk under the medium to high-end emission scenario (SSP3-7.0) over most catchments of the globe. The median future joint return period decreases from 50 years to around 27.6 years, with 186 trillion dollars and 4 billion people exposed. Downwelling shortwave radiation is identified as the dominant factor driving changes in daily streamflow, accelerating both terrestrial evapotranspiration and snowmelt. As future scenarios project enhanced radiation levels along with an increase in precipitation extremes, a heightened risk of widespread flooding is foreseen. This study aims to provide valuable insights for policymakers developing strategies to mitigate the risks associated with river flooding under climate change.

How to cite: Kang, S., Yin, J., Slater, L., Liu, P., and Liu, D.: Global flood projection and socioeconomic implications under a physics-constrained deep learning framework, EGU General Assembly 2024, Vienna, Austria, 14–19 Apr 2024, EGU24-4105, https://doi.org/10.5194/egusphere-egu24-4105, 2024.

EGU24-4238 | ECS | Posters on site | HS3.5

Letting neural networks talk: exploring two probabilistic neural network models for input variable selection 

John Quilty and Mohammad Sina Jahangir

Input variable selection (IVS) is an integral part of building data-driven models for hydrological applications. Carefully chosen input variables enable data-driven models to discern relevant patterns and relationships within data, improving their predictive accuracy. Moreover, the optimal choice of input variables can enhance the computational efficiency of data-driven models, reduce overfitting, and contribute to a more interpretable and parsimonious model. Meanwhile, including irrelevant and/or redundant input variables can introduce noise to the model and hinder its generalization ability.

Three probabilistic IVS methods, namely Edgeworth approximation-based conditional mutual information (EA), double-layer extreme learning machine (DLELM), and gradient mapping (GM), were used for IVS and then coupled with a long short-term memory (LSTM)-based probabilistic deep learning model for daily streamflow prediction. While the EA method is an effective IVS method, DLELM and GM are examples of probabilistic neural network-based IVS methods that have not yet been explored for hydrological prediction. DLELM selects input variables through sparse Bayesian learning, pruning both input and output layer weights of a committee of neural networks. GM is based on saliency mapping, an explainable AI technique commonly used in computer vision that can be coupled with probabilistic neural networks. Both DLELM and GM involve randomization during parameter initialization and/or training thereby introducing stochasticity into the IVS procedure, which has been shown to improve the predictive performance of data-driven models.

The IVS methods were coupled with a LSTM-based probabilistic deep learning model and applied to a streamflow prediction case study using 420 basins spread across the continental United States. The dataset includes 37 candidate input variables derived from the daily-averaged ERA-5 reanalysis data.

Comparing the most frequently selected input variables by EA, DLELM, and GM across the 420 basins revealed that all three models select a similar number of input variables. For example, the top 15 input variables selected by all methods included nine variables that were similar.

The input variables selected by EA, DLELM, and GM were then used in the LSTM-based probabilistic deep learning models for streamflow prediction across the 420 basins. The probabilistic deep learning models were developed and optimized using the top 10 variables selected by each IVS method. The results were compared to a benchmark scenario that used all 37 ERA-5 variables in the prediction model. Overall, the findings show that the GM method results in higher prediction accuracy (Kling-Gupta efficiency; KGE) compared to the other two IVS methods. A median KGE of 0.63 was obtained for GM, whereas for the EA, DLELM, and all input variables’ scenario, KGE scores of 0.61, 0.60, and 0.62 were obtained, respectively.

DLELM and GM are two AI-based techniques that introduce elements of interpretability and stochasticity to the IVS process. The results of the current study are expected to contribute to the evolving landscape of data-driven hydrological modeling by introducing hitherto unexplored neural network-based IVS to pursue more parsimonious, efficient, and interpretable probabilistic deep learning models.

How to cite: Quilty, J. and Jahangir, M. S.: Letting neural networks talk: exploring two probabilistic neural network models for input variable selection, EGU General Assembly 2024, Vienna, Austria, 14–19 Apr 2024, EGU24-4238, https://doi.org/10.5194/egusphere-egu24-4238, 2024.

EGU24-4325 | ECS | Posters on site | HS3.5

Towards learning human influences in a highly regulated basin using a hybrid DL-process based framework 

Liangkun Deng, Xiang Zhang, and Louise Slater

Hybrid models have shown impressive performance for streamflow simulation, offering better accuracy than process-based hydrological models (PBMs) and superior interpretability than deep learning models (DLMs). A recent paradigm for streamflow modeling, integrating DLMs and PBMs within a differentiable framework, presents considerable potential to match the performance of DLMs while simultaneously generating untrained variables that describe the entire water cycle. However, the potential of this framework has mostly been verified in small and unregulated headwater basins and has not been explored in large and highly regulated basins. Human activities, such as reservoir operations and water transfer projects, have greatly changed natural hydrological regimes. Given the limited access to operational water management records, PBMs generally fail to achieve satisfactory performance and DLMs are challenging to train directly. This study proposes a coupled hybrid framework to address these problems. This framework is based on a distributed PBM, the Xin'anjiang (XAJ) model, and adopts embedded deep learning neural networks to learn the physical parameters and replace the modules of the XAJ model reflecting human influences through a differentiable structure. Streamflow observations alone are used as training targets, eliminating the need for operational records to supervise the training process. The Hanjiang River basin (HRB), one of the largest subbasins of the Yangtze River basin, disturbed by large reservoirs and national water transfer projects, is selected to test the effectiveness of the framework. The results show that the hybrid framework can learn the best parameter sets of the XAJ model depicting natural and human influences to improve streamflow simulation. It performs better than a standalone XAJ model and achieves similar performance to a standalone LSTM model. This framework sheds new light on assimilating human influences to improve simulation performance in disturbed river basins with limited operational records.

How to cite: Deng, L., Zhang, X., and Slater, L.: Towards learning human influences in a highly regulated basin using a hybrid DL-process based framework, EGU General Assembly 2024, Vienna, Austria, 14–19 Apr 2024, EGU24-4325, https://doi.org/10.5194/egusphere-egu24-4325, 2024.

EGU24-4768 | ECS | Orals | HS3.5

HydroPML: Towards Unified Scientific Paradigms for Machine Learning and Process-based Hydrology 

Qingsong Xu, Yilei Shi, Jonathan Bamber, Ye Tuo, Ralf Ludwig, and Xiao Xiang Zhu

Accurate hydrological understanding and water cycle prediction are crucial for addressing scientific and societal challenges associated with the management of water resources, particularly under the dynamic influence of anthropogenic climate change. Existing work predominantly concentrates on the development of machine learning (ML) in this field, yet there is a clear distinction between hydrology and ML as separate paradigms. Here, we introduce physics-aware ML as a transformative approach to overcome the perceived barrier and revolutionize both fields. Specifically, we present a comprehensive review of the physics-aware ML methods, building a structured community (PaML) of existing methodologies that integrate prior physical knowledge or physics-based modeling into ML. We systematically analyze these PaML methodologies with respect to four aspects: physical data-guided ML, physics-informed ML, physics-embedded ML, and physics-aware hybrid learning. PaML facilitates ML-aided hypotheses, accelerating insights from big data and fostering scientific discoveries. We initiate a systematic exploration of hydrology in PaML, including rainfall-runoff and hydrodynamic processes, and highlight the most promising and challenging directions for different objectives and PaML methods. Finally, a new PaML-based hydrology platform, termed HydroPML, is released as a foundation for applications based on hydrological processes [1]. HydroPML presents a range of hydrology applications, including but not limited to rainfall-runoff-inundation modeling, real-time flood forecasting (FloodCast), rainfall-induced landslide forecasting (LandslideCast), and cutting-edge PaML methods, to enhance the explainability and causality of ML and lay the groundwork for the digital water cycle's realization. The HydroPML platform is publicly available at https://hydropml.github.io/.

[1] Xu, Qingsong, et al. "Physics-aware Machine Learning Revolutionizes Scientific Paradigm for Machine Learning and Process-based Hydrology." arXiv preprint arXiv:2310.05227 (2023).

How to cite: Xu, Q., Shi, Y., Bamber, J., Tuo, Y., Ludwig, R., and Zhu, X. X.: HydroPML: Towards Unified Scientific Paradigms for Machine Learning and Process-based Hydrology, EGU General Assembly 2024, Vienna, Austria, 14–19 Apr 2024, EGU24-4768, https://doi.org/10.5194/egusphere-egu24-4768, 2024.

EGU24-6378 | ECS | Posters on site | HS3.5

Seasonal forecasts of hydrological droughts over the Alps: advancing hybrid modelling applications 

Iacopo F. Ferrario, Mariapina Castelli, Alasawedah M. Hussein, Usman M. Liaqat, Albrecht Weerts, and Alexander Jacob

The Alpine region is often called the Water Tower of Europe, alluding to its water richness and its function of supplying water through several important European rivers flowing well beyond its geographical boundaries. Climate change projections show that the region will likely experience rising temperatures and changes in precipitation type, frequency, and intensity, with consequences on the spatiotemporal pattern of water availability. Seasonal forecasts could supply timely information for planning water allocation a few months in advance, reducing potential conflicts under conditions of scarce water resources. The overall goal of this study is to improve the seasonal forecasts of hydrological droughts over the entire Alpine region at a spatial resolution (~1 km) that matches the information need by local water agencies, e.g., resolving headwaters and small valleys. In this study we present the progress on the following key objectives:

  • Improving the estimation of distributed model (Wflow_sbm) parameters by finding the optimal transfer function from geophysical attributes to model parameters and upscaling the information to model resolution.
  • Combining physical-hydrological knowledge with data-driven (ML/DL) techniques for improving accuracy and computational performance, without compromising on interpretation
  • Integrating EO-based hydrological fluxes, like streamflow, surface soil moisture, actual evapotranspiration, and snow waters equivalent, with the aim of regularizing the calibration/training, tackling the problem of model parameters equifinality.

Our work is part of the InterTwin project that aims at developing a multi-domain Digital Twin blueprint architecture and implementation platform. We build on the technological solutions developed in InterTwin (e.g. openEO, CWL and STAC) and fully embrace its inspiring principles of open science, reproducibility, and interoperability of data and methods.

How to cite: Ferrario, I. F., Castelli, M., Hussein, A. M., Liaqat, U. M., Weerts, A., and Jacob, A.: Seasonal forecasts of hydrological droughts over the Alps: advancing hybrid modelling applications, EGU General Assembly 2024, Vienna, Austria, 14–19 Apr 2024, EGU24-6378, https://doi.org/10.5194/egusphere-egu24-6378, 2024.

EGU24-6656 | ECS | Orals | HS3.5

Exploring Catchment Regionalization through the Eyes of HydroLSTM 

Luis De La Fuente, Hoshin Gupta, and Laura Condon

Regionalization is an issue that hydrologists have been working on for decades. It is used, for example, when we transfer parameters from one calibrated model to another, or when we identify similarities between gauged to ungauged catchments. However, there is still no unified method that can successfully transfer parameters and identify similarities between different regions while accounting for differences in meteorological forcing, catchment attributes, and hydrological responses.

Machine learning (ML) has shown promising results in the generalization of its results at temporal and spatial scales for streamflow prediction. This suggests that ML models have learned useful regionalization relationships that we could extract. This study explores how the HydroLSTM representation, a modification of traditional Long Short-Term Memory, can learn meaningful relationships between meteorological forcing and catchment attributes. One promising feature of the HydroLSTM representation is that the learned patterns can generate different hydrological responses across the US. These findings indicate that we can learn more about regionalization by studying ML models.

How to cite: De La Fuente, L., Gupta, H., and Condon, L.: Exploring Catchment Regionalization through the Eyes of HydroLSTM, EGU General Assembly 2024, Vienna, Austria, 14–19 Apr 2024, EGU24-6656, https://doi.org/10.5194/egusphere-egu24-6656, 2024.

EGU24-6965 | ECS | Posters on site | HS3.5

A Machine Learning Based Snow Cover Parameterization  for Common Land Model (CoLM)  

Han Zhang, Lu Li, and Yongjiu Dai

Accurate representation of snow cover fraction (SCF) is vital for terrestrial simulation, as it significantly affects surface albedo and land surface radiation. In land models, SCF is parameterized using snow water equivalent and snow depth. This study introduces a novel machine learning-based parameterization, which incorporates the light-GBM regression algorithm and additional input features: surface air temperature, humidity, leaf area index, and the standard deviation of topography. The regression model is trained with input features from the Common Land Model (CoLM) simulations and the labels from the Moderate Resolution Imaging Spectroradiometer (MODIS) observations on a daily scale. Offline verification indicates significant improvements for the new scheme over multiple traditional parameterizations.

Moreover, this machine learning-based parameterization has been online coupled with the CoLM using the Message Passing Interface (MPI). In online simulations, it substantially outperforms the widely used Niu and Yang (2007) scheme, improving the root mean square errors and temporal correlations of SCF on 80% of global grids. Additionally, associated land surface temperature and hydrological processes also benefit from the enhanced estimation of SCF. The new solution also shows good portability as it also demonstrates similar enhancements when it is directly used in a global 1° simulation, even though it was trained at a 0.1° resolution.

How to cite: Zhang, H., Li, L., and Dai, Y.: A Machine Learning Based Snow Cover Parameterization  for Common Land Model (CoLM) , EGU General Assembly 2024, Vienna, Austria, 14–19 Apr 2024, EGU24-6965, https://doi.org/10.5194/egusphere-egu24-6965, 2024.

Land-atmosphere coupling (LAC) involves a variety of interactions between the land surface and the atmospheric boundary layer that are critical to are critical to understanding hydrological partitioning and cycling. As climate change continues to affect these interactions, identifying the specific drivers of LAC variability has become increasingly important. However, due to the complexity of the coupling mechanism, a quantitative understanding of the potential drivers is still lacking. Recently, deep learning has been considered as an effective approach to capture nonlinear relationships within the data, which provides a useful window into complex climatic processes. In this study, we will explore the LAC variability under climate change and its potential drivers by using Convolutional Long Short-term Memory (ConvLSTM) together with explainable AI techniques for attribution analysis. Specifically, the variability of the LAC, defined here as a two-legged index, is used as the modeling target, and variables representing meteorological forcing, land use, irrigation, soil properties, gross primary production, ecosystem respiration, and net ecosystem exchange are the inputs. Our analysis covers global land with a spatial resolution of 0.1° × 0.1° every one day during the period 1979–2019. Overall, the study demonstrates how interpretable machine learning would help us understand the complex dynamics of LAC under changing climatic conditions. We expect the results to facilitate the understanding of terrestrial hydroclimate interactions and hopefully provide multiple lines of evidence to support future water management.

How to cite: Huang, F., Shangguan, W., and Jiang, S.: Identifying potential drivers of land-atmosphere coupling variation under climate change by explainable artificial intelligence, EGU General Assembly 2024, Vienna, Austria, 14–19 Apr 2024, EGU24-7202, https://doi.org/10.5194/egusphere-egu24-7202, 2024.

EGU24-7950 | ECS | Posters on site | HS3.5

Improving streamflow prediction across China by hydrological modelling together with machine learning 

wang jiao and zhang yongqiang

Predicting streamflow is key for water resource planning, flood and drought risk assessment, and pollution mitigation at regional, national, and global scales. There is a long-standing history of developing physically or conceptually catchment rainfall-runoff models that have been continuously refined over time to include more physical processes and enhance their spatial resolution. On the other hand, machine learning methods, particularly neural networks, have demonstrated exceptional accuracy and extrapolation capabilities in time-series prediction. Both approaches exhibit their strengths and limitations. This leads to a research question: how to effectively balance model complexity and physical interpretability while maintaining a certain level of predictive accuracy. This study aims to effectively combine a conceptual hydrological model, HBV, with machine learning (Transformer, Long Short-Term Memory (LSTM)) using a differentiable modeling framework strategy, tailored to predicting streamflow under diverse climatic and geographical conditions across China. Utilizing the Transformer to optimize and replace certain parameterization processes in the HBV model, a deep integration of neural networks and the HBV model is achieved. This integration not only captures the non-linear relationships that traditional hydrological models struggle to express, but also maintains the physical interpretability of the model. Preliminary application results show that the proposed framework outperforms traditional HBV model and pure LSTM model in streamflow prediction across 68 catchments in China. Based on the test results from different catchments, we have adjusted and optimized the model structure or parameters to better adapt to the unique hydrological processes of each catchment. The application of self-attention mechanisms and a differentiable programming framework significantly enhances the model's ability to capture spatiotemporal dynamics. It is likely that the proposed framework can be widely used for streamflow prediction somewhere else.

How to cite: jiao, W. and yongqiang, Z.: Improving streamflow prediction across China by hydrological modelling together with machine learning, EGU General Assembly 2024, Vienna, Austria, 14–19 Apr 2024, EGU24-7950, https://doi.org/10.5194/egusphere-egu24-7950, 2024.

EGU24-9319 | ECS | Posters on site | HS3.5

Developing hybrid distributed models for hydrological simulation and climate change assessment in large alpine basins 

Bu Li, Ting Sun, Fuqiang Tian, and Guangheng Ni

Large alpine basins on the Tibetan Plateau (TP) provide abundant water resources crucial for hydropower generation, irrigation, and daily life. In recent decades, the TP has been significantly affected by climate change, making it crucial to understand the runoff response to climate change are essential for water resources management. While limited knowledge of specific alpine hydrological processes has constrained the accuracy of hydrological models and heightened uncertainties in climate change assessments. Recently, hybrid hydrological models have come to the forefront, synergizing the exceptional learning capacity of deep learning with a rigorous adherence to hydrological knowledge of process-based models. These models exhibit considerable promise in achieving precision in hydrological simulations and conducting climate change assessments. However, a notable limitation of existing hybrid models lies in their failure to incorporate spatial information and describe alpine hydrological processes, which restricts their applicability in hydrological modeling and climate change assessment in large alpine basins. To address this issue, we develop a set of hybrid distributed hydrological models by employing a distributed process-based model as the backbone, and utilizing embedded neural networks (ENNs) to parameterize and replace different internal modules. The proposed models are tested on three large alpine basins on the Tibetan Plateau. Results are compared to those obtained from hybrid lumped models, state-of-the-art distributed hydrological model, and DL models. A climate perturbation method is further used to evaluate the alpine basins' runoff response to climate change.Results indicate that proposed hybrid hydrological models can perform well in predicting runoff in large alpine basins. The optimal hybrid model with Nash-Sutcliffe efficiency coefficients (NSEs) higher than 0.87 shows comparable performance to state-of-the-art DL models. The hybrid distributed model also exhibits remarkable capability in simulating hydrological processes at ungauged sites within the basin, markedly surpassing traditional distributed models. Besides, runoff exhibits an amplification effect in response to precipitation changes, with a 10% precipitation change resulting in a 15–20% runoff change in large alpine basins. An increase in temperature enhances evaporation capacity and changes the redistribution of rainfall and snowfall and the timing of snowmelt, leading to a decrease in the total runoff and a reduction in the intra-annual variability of runoff. Overall, this study provides a high-performance tool enriched with explicit hydrological knowledge for hydrological prediction and improves our understanding about runoff’s response to climate change in large alpine basins on the TP. 

How to cite: Li, B., Sun, T., Tian, F., and Ni, G.: Developing hybrid distributed models for hydrological simulation and climate change assessment in large alpine basins, EGU General Assembly 2024, Vienna, Austria, 14–19 Apr 2024, EGU24-9319, https://doi.org/10.5194/egusphere-egu24-9319, 2024.

In facing the challenges of limited observational streamflow data and climate change, accurate streamflow prediction and flood management in large-scale catchments become essential. This study introducing a time-lag informed deep learning framework to enhance streamflow simulation and flood forecasting. Using the Dulong-Irrawaddy River Basin (DIRB), a less-explored transboundary basin shared by Myanmar, China, and India, as a case study, we have identified peak flow lag days and relative flow scale. Integrating these with historical flow data, we developed an optimal model. The framework, informed by data from the upstream Hkamti sub-basin, significantly outperformed standard LSTM, achieving a Kling-Gupta Efficiency (KGE) of 0.891 and a Nash-Sutcliffe efficiency coefficient (NSE) of 0.904. Notably, the H_PFL model provides a valuable 15-day lead time for flood forecasting, enhancing emergency response preparations. The transfer learning model, incorporating meteorological inputs and catchment features, achieved an average NSE of 0.872 for streamflow prediction, surpassing the process-based model MIKE SHE's 0.655. We further analyzed the sensitivities of the deep learning model and process-based model to changes in meteorological inputs using different methods. Deep learning models exhibit complex sensitivities to these inputs, more accurately capturing non-linear relationships among multiple variables than the process-based model. Integrated Gradients (IG) analysis further demonstrates deep learning model's ability to discern spatial heterogeneity in upstream and downstream sub-basins and its adeptness in characterizing different flow regimes. This study underscores the potential of deep learning in enhancing the understanding of hydrological processes in large-scale catchments and highlights its value for water resource management in transboundary basins under data scarcity.

How to cite: Ma, K. and He, D.: Streamflow Prediction and Flood Forecasting with Time-Lag Informed Deep Learning framework in Large Transboundary Catchments, EGU General Assembly 2024, Vienna, Austria, 14–19 Apr 2024, EGU24-9980, https://doi.org/10.5194/egusphere-egu24-9980, 2024.

EGU24-11159 | ECS | Orals | HS3.5

Uncovering the impact of hydrological connectivity on nitrate transport at the catchment scale using explainable AI 

Felipe Saavedra, Noemi Vergopolan, Andreas Musolff, Ralf Merz, Carolin Winter, and Larisa Tarasova

Nitrate contamination of water bodies is a major concern worldwide, as it poses a risk of eutrophication and biodiversity loss. Nitrate travels from agricultural land to streams through different hydrological pathways, which are abstrusely activated under different hydrological conditions. Certainly, hydrological conditions can alter the connection between different parts of the catchment and streams, in many cases independent of the discharge levels, leading to modifications in transport dynamics, retention, and nitrate removal rates in the catchment. While enhanced nitrate transport can be linked to high levels of hydrological connectivity, little is known about the effects of the spatial patterns of hydrological connectivity on the transport of nutrients at the catchment scale.

In this study, we combined daily stream nitrate concentration and discharge data at the outlet of 15 predominantly agricultural catchments in the United States (191–16,000 km2 area, 3500 km2 median area, and 77% median agriculture coverage) with soil moisture data from  SMAP-Hydroblocks (Vergopolan et al., 2021). SMAP-Hydroblocks is a hyperresolution soil moisture dataset at the top 5 cm of soil column at 30-m spatial resolution and 2-3 days revisit time (2015-2019), and it is derived through a combination of satellite data, land-surface and radiative transfer modeling, machine learning, and in-situ observations.

We configured a deep learning model for each catchment, driven by 2D soil moisture fields and 1D discharge time series, to evaluate the impact of streamflow magnitude and spatial patterns of soil moisture on streamflow nitrate concentration. The model setup comprises two parallel branches. The first branch incorporates a Long Short-term Memory (LSTM) model, the current state-of-the-art for time-series data modeling, utilizing daily discharge as input data. The second branch contains a Convolutional LSTM network (ConvLSTM) that incorporates daily soil moisture series, the fraction of agriculture of each pixel, and the height above the nearest drainage as a measurement of structural hydrological connectivity. Finally, a fully connected neural network combines the outputs of the two branches to predict the time series of nitrate concentration at the catchment outlet.

Preliminary results indicate that the model performs satisfactorily in one-third of the catchments, with Nash-Sutcliffe Efficiency (NSE) values above 0.3 for the test period, which covers the final 25% of the time series, and this is achieved without tuning the hyperparameters. The model failed to simulate nitrate concentrations (resulting in negative NSE values) typically in larger catchments. Using these simulations and explainable AI, we will quantify the importance of different inputs, in particular, we tested the relative importance of soil moisture for simulating nitrate concentrations. While the literature shows most of the predictive power for nitrate comes from streamflow rates, we show how soil moisture fields add value to the prediction and understanding of hydrologic connectivity. Finally, we will fine-tune the model for each catchment and include more predictors to enhance the reliability of model simulations.

How to cite: Saavedra, F., Vergopolan, N., Musolff, A., Merz, R., Winter, C., and Tarasova, L.: Uncovering the impact of hydrological connectivity on nitrate transport at the catchment scale using explainable AI, EGU General Assembly 2024, Vienna, Austria, 14–19 Apr 2024, EGU24-11159, https://doi.org/10.5194/egusphere-egu24-11159, 2024.

EGU24-11778 | ECS | Orals | HS3.5

How much data is needed for hydrological modeling?  

Bjarte Beil-Myhre, Bernt Viggo Matheussen, and Rajeev Shrestha

Hydrological modeling has undergone a transformative decade, primarily catalyzed by the groundbreaking data-driven approach introduced by F. Kratzert et al. (2018) utilizing LSTM networks (Hochreiter & Schmidhuber, 1997). These networks leverage extensive datasets and intricate model structures, outshining traditional hydrological models, albeit with the caveat of being computationally intensive during training. This prompts a critical inquiry into the requisite volume and complexity of data for constructing a dependable and resilient hydrological model.


In this study, we employ a hybrid model that amalgamates the strengths of classical hydrological models with the data-driven approach. These modified models are derived from the LSTM models developed by F. Kratzert and team, in conjunction with classical hydrological models such as the Statkraft Hydrology Forecasting Toolbox (SHyFT) from Statkraft and the Distributed Regression Hydrological Model (DRM) by Matheussen at Å Energi. The models were applied to sixty-five catchments in southern Norway, each characterized by diverse features and data records. Our analysis assesses the performance of these models under various scenarios of data availability, considering factors such as:


- Varying numbers of catchments selected based on size or location.
- The duration of the data records utilized for model calibration.
- Specific catchment characteristics and outputs from classical models employed as inputs 
(e.g., area, latitude, longitude, or additional variables).


Preliminary findings indicate that model inputs can be significantly stripped down without compromising model performance. With a limited set of catchment characteristics, the performance approaches that of the model with all characteristics, mitigating added uncertainty and model complexity. Additionally, increasing the length of data records enhances model performance, albeit with diminishing returns. Furthermore, our study reveals that augmenting catchments in the model does not necessarily yield a commensurate improvement in overall model performance. These insights contribute to refining our understanding of the interplay between data, model complexity, and performance in hydrological modeling.


The novelty in this research is that the hybrid models can be applied in a relatively small area, with few catchments and a limited number of climate stations and catchment characteristics compared to the CAMELS setup, used by Kratzert and still achieve improved results. 

How to cite: Beil-Myhre, B., Matheussen, B. V., and Shrestha, R.: How much data is needed for hydrological modeling? , EGU General Assembly 2024, Vienna, Austria, 14–19 Apr 2024, EGU24-11778, https://doi.org/10.5194/egusphere-egu24-11778, 2024.

EGU24-12068 | ECS | Orals | HS3.5

Hybrid Neural Hydrology: Integrating Physical and Machine Learning Models for Enhanced Predictions in Ungauged Basins 

Rajeev Shrestha, Bjarte Beil-Myhre, and Bernt Viggo Matheussen

Accurate prediction of streamflow in ungauged basins is a fundamental challenge in hydrology. The lack of hydrological observations and the inherent complexities in ungauged regions hinder accurate predictions, posing significant hurdles for water resource management and forecasting. Over time, efforts have been made to tackle this predicament, primarily utilizing physical hydrological models. However, these models need to be revised due to their reliance on site-specific data and their struggle to capture complex nonlinear relationships. Recent work by Kratzert et al. (2018) suggests that nonlinear regression models such as LSTM neural networks (Hochreiter & Schmidhuber, 1997) may outperform traditional physically based models. The authors demonstrate the application of LSTM models to ungauged prediction problems, noting that information about physical processes might not have been fully utilized in the modeling setup.

In response to these challenges, this research explores a novel approach by introducing a Hybrid Neural Hydrology (HNH) approach by fusing the strengths of physical hydrological models like Statkraft Hydrology Forecasting Toolbox (SHyFT), developed at Statkraft and the Distributed Regression Hydrological Model (DRM), developed by Matheussen at Å Energi with machine learning model, specifically Neural Hydrology, developed by F. Kratzert and team. By combining the information and structural insights of physically based models with the flexibility and adaptability of machine learning models, HNH seeks to leverage the complementary attributes of these methodologies. The combination is achieved by fusing the uncalibrated physical model with an LSTM based model. This hybridization seeks to enhance the model's adaptability and learning capabilities, leveraging available information from various sources to improve predictions in ungauged areas. Furthermore, this research investigates the impact of clustering catchments based on area to improve model performance.

The data used in this research includes dynamic variables such as precipitation, air temperature, wind speed, relative humidity, and observed streamflow obtained from sources such as the internal database at Å Energi, The Norwegian Water Resources and Energy Directorate (NVE), The Norwegian Meteorological Institute (MET), ECMWF (ERA5) and static attributes such as catchment size, mean elevation, forest fraction, lake fraction and reservoir fraction obtained from CORINE Land Cover and Høydedata (www.hoydedata.no).

This study presents HNH as a novel approach that synergistically integrates the structural insights of physical models with the adaptability of machine learning. Preliminary findings indicate promising outcomes from testing in 65 catchments in southern Norway. This suggests that information about physical processes and clustering catchments based on their similarities significantly improves the prediction quality in ungauged regions. This discovery underscores the potential of using hybrid models and clustering techniques to enhance the performance of predictive models in ungauged basins.

How to cite: Shrestha, R., Beil-Myhre, B., and Matheussen, B. V.: Hybrid Neural Hydrology: Integrating Physical and Machine Learning Models for Enhanced Predictions in Ungauged Basins, EGU General Assembly 2024, Vienna, Austria, 14–19 Apr 2024, EGU24-12068, https://doi.org/10.5194/egusphere-egu24-12068, 2024.

EGU24-12574 | ECS | Orals | HS3.5 | Highlight

Analyzing the performance and interpretability of hybrid hydrological models 

Eduardo Acuna, Ralf Loritz, Manuel Alvarez, Frederik Kratzert, Daniel Klotz, Martin Gauch, Nicole Bauerle, and Uwe Ehret

Hydrological hybrid models have been proposed as an option to combine the enhanced performance of deep learning methods with the interpretability of process-based models. Among the various hybrid methods available, the dynamic parameterization of conceptual models using LSTM networks has shown high potential. 

In this contribution, we extend our previous related work (Acuna Espinoza et al., 2023) by asking the questions: How well can hybrid models predict untrained variables, and how well do they generalize? We address the first question by comparing the internal states of the model against external data, specifically against soil moisture data obtained from ERA5-Land for 60 basins in Great Britain. We show that the process-based layer can reproduce the soil moisture dynamics with a correlation of 0.83, which indicates a good ability of this type of model to predict untrained variables. Moreover, we compare this method against existing alternatives used to extract non-target variables from purely data-driven methods (Lees et al., 2022), and discuss the differences in philosophy, performance, and implementation. Then, we address the second question by evaluating the capacity of such models to predict extreme events. Following the procedure proposed by Frame et al (2022), we train the hybrid models in low-flow regimes and test them in high-flow situations to evaluate the generalization capacity of such models and compare them against results from purely data-driven methods. Both experiments are done using large-sample data from the CAMELS-US and CAMELS-GB dataset.

With these new experiments, we contribute to answering the question of whether hybrid models give an actual advantage over purely data-driven techniques or not.

References

Acuna Espinoza, E., Loritz, R., Alvarez Chaves, M., Bäuerle, N., & Ehret, U.: To bucket or not to bucket? Analyzing the performance and interpretability of hybrid hydrological models with dynamic parameterization. EGUsphere, 1–22. https://doi.org/10.5194/egusphere-2023-1980, 2023.

Frame, J. M. and Kratzert, F. and Klotz, D. and Gauch, M. and Shalev, G. and Gilon, O. and Qualls, L. M. and Gupta, H. V. and Nearing, G. S., :Deep learning rainfall--runoff predictions of extreme events, Hydrology and Earth System Sciences, 26 ,3377-3392, https://doi.org/10.5194/hess-26-3377-2022, 2022

Lees, T., Reece, S., Kratzert, F., Klotz, D., Gauch, M., De Bruijn, J., Kumar Sahu, R., Greve, P., Slater, L., and Dadson, S. J.: Hydrological concept formation inside long short-term memory (LSTM) networks, Hydrology and Earth System Sciences, 26, 3079–3101, https://doi.org/10.5194/hess-26-3079-2022,  2022.

How to cite: Acuna, E., Loritz, R., Alvarez, M., Kratzert, F., Klotz, D., Gauch, M., Bauerle, N., and Ehret, U.: Analyzing the performance and interpretability of hybrid hydrological models, EGU General Assembly 2024, Vienna, Austria, 14–19 Apr 2024, EGU24-12574, https://doi.org/10.5194/egusphere-egu24-12574, 2024.

EGU24-12981 | ECS | Orals | HS3.5

Using Temporal Fusion Transformer (TFT) to enhance sub-seasonal drought predictions in the European Alps 

Annie Yuan-Yuan Chang, Konrad Bogner, Maria-Helena Ramos, Shaun Harrigan, Daniela I.V. Domeisen, and Massimiliano Zappa

In recent years, the European Alpine space has witnessed unprecedented low-flow conditions and drought events, affecting various economic sectors reliant on sufficient water availability, including hydropower production, navigation and transportation, agriculture, and tourism. As a result, there is an increasing need for decision-makers to have early warnings tailored to local low-flow conditions.

The EU Copernicus Emergency Management Service (CEMS) European Flood Awareness System (EFAS) has been instrumental in providing flood risk assessments across Europe with up to 15 days of lead time since 2012. Expanding its capabilities, the EFAS also generates long-range hydrological outlooks from sub-seasonal to seasonal horizons. Despite its original flood-centric design, previous investigations have revealed EFAS’s potential for simulating low-flow events. Building upon this finding, this study aims to leverage EFAS's anticipation capability to enhance the predictability of drought events in Alpine catchments, while providing support to trans-national operational services.

In this study, we integrate the 46-day extended-range EFAS forecasts into a hybrid setup for 106 catchments in the European Alps. Many studies have demonstrated Long Short-Term Memory (LSTM)’s capacity to produce skillful hydrological forecasts at various time scales. Here we employ the deep learning algorithm Temporal Fusion Transformer (TFT), an algorithm that combines aspects of LSTM networks with the Transformer architecture. The Transformer's attention mechanisms can focus on relevant time steps across longer sequences enabling TFT to capture both local temporal patterns as well as global dependencies. The role of the TFT is to improve the accuracy of low-flow predictions and to understand their spatio-temporal evolution. In addition to EFAS data, we incorporate features such as European weather regime data, streamflow climatology, and hydropower proxies. We also consider catchment characteristic information including glacier coverage and lake proximity. By incorporating its various attention mechanisms, makes TFT a more explainable algorithm than LSTMs, which helps us understand the driving factor for the forecast skill. Our evaluation uses EFAS re-forecast data as the benchmark and measures the reliability of ensemble forecasts using metrics like the Continuous Ranked Probability Skill Score (CRPSS).

Preliminary results show that a hybrid approach using the TFT algorithm can reduce the flashiness of EFAS during drought periods in some catchments, thereby improving drought predictability. Our findings will contribute to evaluating the potential of these forecasts for providing valuable information for skillful early warnings and assist in informing regional and local water resource management efforts in their decision-making.

How to cite: Chang, A. Y.-Y., Bogner, K., Ramos, M.-H., Harrigan, S., Domeisen, D. I. V., and Zappa, M.: Using Temporal Fusion Transformer (TFT) to enhance sub-seasonal drought predictions in the European Alps, EGU General Assembly 2024, Vienna, Austria, 14–19 Apr 2024, EGU24-12981, https://doi.org/10.5194/egusphere-egu24-12981, 2024.

EGU24-13417 | ECS | Orals | HS3.5

Evaluating physics-based representations of hydrological systems through hybrid models and information theory 

Manuel Álvarez Chaves, Eduardo Acuña Espinoza, Uwe Ehret, and Anneli Guthke

Hydrological models play a crucial role in understanding and predicting streamflow. Recently, hybrid models, combining both physical principles and data-driven approaches, have emerged as promising tools to extract insights into system functioning and increases in model predictive skill which are beyond traditional models.

However, the study by Acuña Espinoza et al. (2023) has raised the question whether the flexible data-driven component in a hybrid model might "overwrite" the interpretability of its physics-based counterpart. On the example of conceptual hydrological models with dynamic parameters tuned by LSTM networks, they showed that even in a case where the physics-based representation of the hydrological system is chosen to be nonsensical on purpose, the addition of the flexible data-driven component can lead to a well-performing hybrid model. This compensatory behavior highlights the need for a thorough evaluation of physics-based representations in hybrid hydrological models, i.e., hybrid models should be inspected carefully to understand why and how they predict (so well).

In this work, we provide a method to support this inspection: we objectively assess and quantify the contribution of the data-driven component to the overall hybrid model performance. Using information theory and the UNITE toolbox (https://github.com/manuel-alvarez-chaves/unite_toolbox), we measure the entropy of the (hidden) state-space in which the data-driven component of the hybrid model moves. High entropy in this setting means that the LSTM is doing a lot of "compensatory work", and hence alludes to an inadequate representation of the hydrological system in the physics-based component of the hybrid model. By comparing this measure among a set of alternative hybrid models with different physics-based representations, an order in the degree of realism of the considered representations can be established. This is very helpful for model evaluation and improvement as well as system understanding.

To illustrate our findings, we present examples from a synthetic case study where a true model does exist. Subsequently, we validate our approach in the context of regional predictions using CAMELS-GB data. This analysis highlights the importance of using diverse representations within hybrid models to ensure the pursuit of "the right answers for the right reasons". Ultimately, our work seeks to contribute to the advancement of hybrid modeling strategies that yield reliable and physically reasonable insights into hydrological systems.

References

  • Acuña Espinoza, E., Loritz, R., Álvarez Chaves, M., Bäuerle, N., & Ehret, U. (2023). To bucket or not to bucket? analyzing the performance and interpretability of hybrid hydrological models with dynamic parameterization. EGUsphere, 1–22. https://doi.org/10.5194/egusphere-2023-1980

How to cite: Álvarez Chaves, M., Acuña Espinoza, E., Ehret, U., and Guthke, A.: Evaluating physics-based representations of hydrological systems through hybrid models and information theory, EGU General Assembly 2024, Vienna, Austria, 14–19 Apr 2024, EGU24-13417, https://doi.org/10.5194/egusphere-egu24-13417, 2024.

EGU24-14280 | Orals | HS3.5

Quantifying Evapotranspiration and Gross Primary Productivity Across Europe Using Radiative Transfer Process-Guided Machine Learning 

Sheng Wang, Rui Zhou, Egor Prikaziuk, Kaiyu Guan, René Gislum, Christiaan van der Tol, Rasmus Fensholt, Klaus Butterbach-Bahl, Andreas Ibrom, and Jørgen Eivind Olesen

Accurately quantifying water and carbon fluxes between terrestrial ecosystems and the atmosphere is highly valuable for understanding ecosystem biogeochemical processes for climate change mitigation and ecosystem management. Remote sensing can provide high spatial and temporal resolution reflectance data of terrestrial ecosystems to support quantifying evapotranspiration (ET) and gross primary productivity (GPP).  Conventional remote sensing-based ET and GPP algorithms are either based on empirical data-driven approaches or process-based models. Empirical data-driven approaches often have high accuracy for cases within the source data domain, but lack the links to a mechanistic understanding of ecosystem processes. Meanwhile, process-based models have high generalizability with incorporating physically based soil-vegetation radiative transfer processes, but usually have lower accuracy. To integrate the strengths of data-driven and process-based approaches, this study developed a radiative transfer process-guided machine learning approach (PGML) to quantify ET and GPP across Europe. Specifically, we used the Soil Canopy Observation, Photochemistry, and Energy fluxes (SCOPE, van der Tol et al. 2009) radiative transfer model to generate synthetic datasets and developed a pre-trained neural network model to quantify ET and GPP. Furthermore, we utilized field measurements from 63 eddy covariance tower sites from 2016 to 2020 across Europe to fine-tune the neural networks with incorporating physical laws into the cost function. Results show that PGML can significantly improve the SCOPE simulations of net radiation (R2 from 0.91 to 0.96), sensible heat fluxes (R2 from 0.43 to 0.77), ET (R2 from 0.61 to 0.78), and GPP (R2 from 0.72 to 0.78) compared to eddy covariance observations. This study highlights the potential of PGML to integrate machine learning and radiative transfer models to improve the accuracy of land surface flux estimates for terrestrial ecosystems.

How to cite: Wang, S., Zhou, R., Prikaziuk, E., Guan, K., Gislum, R., van der Tol, C., Fensholt, R., Butterbach-Bahl, K., Ibrom, A., and Olesen, J. E.: Quantifying Evapotranspiration and Gross Primary Productivity Across Europe Using Radiative Transfer Process-Guided Machine Learning, EGU General Assembly 2024, Vienna, Austria, 14–19 Apr 2024, EGU24-14280, https://doi.org/10.5194/egusphere-egu24-14280, 2024.

Deep learning models for streamflow prediction have been widely used but are often considered as "black boxes" due to their lack of interpretability. To address this issue, the field has recently focused on Explainable Artificial Intelligence (XAI) methods to improve the transparency of these models. In this study, we aimed to investigate the influence of precipitation uncertainty on data-driven modeling and elucidate the hydrological significance of deep learning streamflow modeling in both temporal and spatial dimensions by Explainable Artificial Intelligence techniques. To achieve this, an LSTM model for time series prediction and a CNN-LSTM model for fusion spatial-temporal information are proposed. These models are driven by five sets of reanalyzed datasets. The contribution of precipitation before peak flow to runoff simulation is quantified, in order to identify the most important processes in runoff generation for each river basin. In addition, visualization techniques are employed to analyze the relationship between the weights of the convolutional layers in our models and the distribution of precipitation features. By doing so, we aimed to gain insights into the underlying mechanisms of the models' predictions.

The results of our study revealed several key findings. In the high-altitude areas of the Yangtze River's upper reaches, we found that snowmelt runoff, historical precipitation, and recent precipitation were the combined causes for floods. In the middle reach of the Yangtze River, floods were induced by the combined effect of historical and recent precipitation, except for the Ganjiang River, where historical precipitation events played a major role in controlling flood events. Through the visualization of convolutional layers, we discovered that areas with high convolutional layer weights had a greater impact on the model's predictions. We also observed a high similarity between the weight distribution of the convolutional layers and the spatial distribution of multi-year average precipitation in the upper reach river basins. In the middle reach, the weight distribution of the model's convolutional layers showed a strong correlation with the monthly maximum precipitation in the basin. Overall, this study provides valuable insights into the potential of deep learning models for streamflow prediction and enhances our understanding of the impacts of precipitation in the Yangtze River Basin.

How to cite: Tian, Y., Tan, W., and Yuan, X.: Revealing the key factors and uncertainties in data-driven hydrological prediction using Explainable Artificial Intelligence techniques, EGU General Assembly 2024, Vienna, Austria, 14–19 Apr 2024, EGU24-14666, https://doi.org/10.5194/egusphere-egu24-14666, 2024.

EGU24-16235 | ECS | Orals | HS3.5

Flow estimation from observed water levels using differentiable modeling for low-lying rivers affected by vegetation and backwater 

Phillip Aarestrup, Jonas Wied Pedersen, Michael Brian Butts, Peter Bauer-Gottwein, and Roland Löwe

Simulations of river flows and water levels are crucial for flood predictions and water resources management. Water levels are easy to observe using sensors, while the mapping between water levels and flows in rivers is usually derived from rating curves. However, rating curves frequently do not include geometry, backwater effects, and/or seasonal variations, which can limit their applicability – especially in stream systems that are affected by seasonal vegetation and backwater effects. To address this, we propose a differentiable model that merges a neural network with a physically based, steady-state implementation of the Saint-Venant equations. 

In the setup, the neural network is trained to predict seasonal variations caused by vegetation growth in Manning’s roughness based on inputs of meteorological forcing and time, while the physical model is responsible for converting flow estimates into water levels along the river channel. The framework efficiently estimates model parameters by tracking gradients through both the physical model and the neural network via backpropagation. This allows us to calibrate parameters for both the runoff and the Manning’s roughness from measured water levels, thus overcoming rating curve limitations while accounting for backwater, river geometry, and seasonal variations in roughness. 

We tested the model on a 20 km stretch of the Vejle River, Denmark, which is both heavily vegetated and affected by backwater from the coast. The model was trained across five water level sensors using two years of data (2020-2022). When evaluated against 10 years of observed flow measurements (2007-2017), the model demonstrated a Mean Absolute Relative Error (MARE) of 10% compared to manually gauged discharge observations. This is comparable to the estimated uncertainty of 10% in the discharge measurements.  

The framework enables a calibration of dynamic Manning roughness within a few hours, and therefore offers a scalable solution for estimating river flows from water levels when cross-section information is available. Potential applications span across many disciplines in water resource management. 

How to cite: Aarestrup, P., Pedersen, J. W., Butts, M. B., Bauer-Gottwein, P., and Löwe, R.: Flow estimation from observed water levels using differentiable modeling for low-lying rivers affected by vegetation and backwater, EGU General Assembly 2024, Vienna, Austria, 14–19 Apr 2024, EGU24-16235, https://doi.org/10.5194/egusphere-egu24-16235, 2024.

EGU24-17842 | ECS | Orals | HS3.5 | Highlight

Deep learning based differentiable/hybrid modelling of the global hydrological cycle 

Zavud Baghirov, Basil Kraft, Martin Jung, Marco Körner, and Markus Reichstein

The integration of machine learning (ML) and process based modeling (PB) in so-called hybrid models, also known as differentiable modelling, has recently gained popularity in the geoscientific community (Reichstein et al. 2019; Shen et al. 2023). The approach aims to address limitations in both ML (data adaptive but difficult to interpret and physically inconsistent) and PB (physically consistent and interpretable but biased). It holds significant potential for studying uncertain processes in the global water cycle (Kraft et al. 2022).

In this work, we developed a differentiable/hybrid model of the global hydrological cycle by fusing deep learning with a custom PB model. The model inputs include air temperature, precipitation, net radiation as dynamic forcings, and static features like soil texture as input to a long short-term memory (LSTM) model. The LSTM represents the uncertain and less understood spatio-temporal parameters which are directly used in a conceptual hydrological model. Simultaneously, we use fully connected neural networks (FCNN) to represent the uncertain spatial parameters. In the hydrological model we represent key water fluxes (e.g. transpiration, evapotranspiration (ET), runoff) and storages (snow, soil moisture and groundwater). The model is constrained against the observation-based data, like terrestrial water storage (TWS) anomalies (GRACE), fAPAR (MODIS) and snow water equivalent (GLOBSNOW).

Building upon previous work (Kraft et al. 2022), we improved the representations of key hydrological processes. We now explicitly estimate vegetation state that is directly used to partition ET into transpiration, soil and interception evaporation. We also estimate rooting-zone water storage capacity—a key hydrological parameter that is still highly uncertain. To asses the robustness of the estimated parameters, we quantify equifinality by training multiple models with random weight initialisation in a 10-fold cross validation setup.

The model learns reasonable spatial and spatio-temporal patterns of critical, yet uncertain, hydrological parameters as latent variables. For example, we assess and show that the estimations of global spatial patterns on rooting-zone water storage capacity and transpiration versus ET are plausible. Equifinality quantification indicates that the dynamic patterns of the modelled water storages are robust, while there is a large uncertainty in the mean of soil moisture and TWS.

References

Kraft, Basil, Martin Jung, Marco Körner, Sujan Koirala, and Markus Reichstein. 2022. “Towards Hybrid Modeling of the Global Hydrological Cycle.” Hydrology and Earth System Sciences 26 (6): 1579–1614.

Reichstein, Markus, Gustau Camps-Valls, Bjorn Stevens, Martin Jung, Joachim Denzler, Nuno Carvalhais, et al. 2019. “Deep Learning and Process Understanding for Data-Driven Earth System Science.” Nature 566 (7743): 195–204.

Shen, Chaopeng, Alison P Appling, Pierre Gentine, Toshiyuki Bandai, Hoshin Gupta, Alexandre Tartakovsky, Marco Baity-Jesi, et al. 2023. “Differentiable Modelling to Unify Machine Learning and Physical Models for Geosciences.” Nature Reviews Earth & Environment 4 (8): 552–67.

How to cite: Baghirov, Z., Kraft, B., Jung, M., Körner, M., and Reichstein, M.: Deep learning based differentiable/hybrid modelling of the global hydrological cycle, EGU General Assembly 2024, Vienna, Austria, 14–19 Apr 2024, EGU24-17842, https://doi.org/10.5194/egusphere-egu24-17842, 2024.

EGU24-20112 | ECS | Posters on site | HS3.5

Data-driven global projection of future flooding in 18.5 million river reaches 

Boen Zhang, Louise Slater, Simon Moulds, Michel Wortmann, Yinxue Liu, Jiabo Yin, and Xihui Gu

Reliable flood projection is crucial for designing suitable flood protection structures and for enhancing resilience in vulnerable regions. However, projections of future flooding suffer from cascading uncertainties arising from the climate model outputs, emission scenarios, hydrological models, and the shortage of observations in data-sparse regions. To overcome these limitations, we design a new hybrid model, blending machine learning and climate model simulations, for global-scale projection of river flooding. This is achieved by training a random forest model directly on climate simulations from 20 CMIP6 models over the historical period (1985−2014), with extreme discharges observed at approximately 15,000 hydrologic stations as the target variable. The random forest model also includes static geographic predictors including land cover, climate, geomorphology, soil, human impacts, and hydrologic signatures. We make the explicit assumption that the random forest model can ‘learn’ systematic biases in the relationship between the climate simulations and flood regimes in different regions of the globe. We then apply the well-calibrated random forest model to a new vector-based, global river network in approximately 18.51 million reaches with drainage areas greater than 100 km2. Global changes in flood hazard are projected for the 21st century (2015−2100) under SSP2-4.5 and SSP5-8.5. We show that the data-driven method reproduces historical annual maximum discharges better than the physically-based hydrological models driven by bias-corrected climate simulations in the ISIMIP3b experiment. We then use the machine learning model with explainable AI to diagnose spatial biases in the climate simulations and future flood projections in different regions of the globe.

How to cite: Zhang, B., Slater, L., Moulds, S., Wortmann, M., Liu, Y., Yin, J., and Gu, X.: Data-driven global projection of future flooding in 18.5 million river reaches, EGU General Assembly 2024, Vienna, Austria, 14–19 Apr 2024, EGU24-20112, https://doi.org/10.5194/egusphere-egu24-20112, 2024.

Machine learning has long been restricted by the mystery of its black box, especially in the fields like geosciences that emphasizes clear expressions of mechanisms. To deal with that issue, we provided a fundamental framework combining two branches, clusters and regressions in machine learning, specifically, spectral clustering in unsupervised clustering methods and artificial neural networks in regression models, to resemble calculations in process-based models. With a case study of evapotranspiration, it was demonstrated that our framework was not only able to discern two processes, aerodynamics and energy, similar to the process-based model, i.e., Penman-Monteith formula, but also provided a third space for potential underrepresented process from canopy or ecosystems. Meanwhile, with only a few hundred of training data in most sites, the simulation of evapotranspiration achieved a higher accuracy (R2 of 0.92 and 0.82; RMSE of 12.41W/m2 and 8.11 W/m2 in training set and test set respectively) than commonly used machine learning approaches, like artificial neural networks in a scale of 100,000 training set (R2 of 0.85 and 0.81; RMSE of 42.33W/m2 and 46.73 W/m2). In summary, our method provides a new direction of hybridizing machine learning approaches and mechanisms for future work, which is able to tell mechanisms from a little amount of data, and thus could be utilized in validating the known and even exploring the unknown knowledge by providing reference before experiments and mathematical derivations.

How to cite: Hu, Y. and Jiang, Y.: Interpretably reconstruct physical processes with combined machine learning approaches, a case study of evapotranspiration, EGU General Assembly 2024, Vienna, Austria, 14–19 Apr 2024, EGU24-20579, https://doi.org/10.5194/egusphere-egu24-20579, 2024.

EGU24-20602 | ECS | Orals | HS3.5

Enhanced Continental Runoff Prediction through Differentiable Muskingum-Cunge Routing (δMC-CONUS-hydroDL2) 

Tadd Bindas, Yalan Song, Jeremy Rapp, Kathryn Lawson, and Chaopeng Shen

Recent advancements in flow routing models have enabled learning from big data using differentiable modeling techniques. However, their application remains constrained to smaller basins due to limitations in computational memory and hydrofabric scaling. We propose a novel methodology to scale differentiable river routing from watershed (HUC10) to continental scales using the δMC-CONUS-hydroDL2 model. Mimicking the Muskingum-Cunge routing model, this approach aims to enhance flood wave timing prediction and Manning’s n parameter learning across extensive areas. We employ the δHBV-HydroDL model, trained on the 3000 GAGES-II dataset, for streamflow predictions across CONUS HUC10 basins. These predictions are then integrated with MERIT basin data and processed through our differentiable routing model, which learns reach-scale parameters like Manning’s n and spatial channel coefficient q via an embedded neural network. This approach enhances national-scale flood simulations by leveraging a learned Manning’s n parameterization, directly contributing to the refinement of CONUS-scale flood modeling. Furthermore, this method shows promise for global application, contingent upon the availability of streamflow predictions and MERIT basin data. Our methodology represents a significant step forward in the spatial scaling of differentiable river routing models, paving the way for more accurate and extensive flood simulation capabilities.

How to cite: Bindas, T., Song, Y., Rapp, J., Lawson, K., and Shen, C.: Enhanced Continental Runoff Prediction through Differentiable Muskingum-Cunge Routing (δMC-CONUS-hydroDL2), EGU General Assembly 2024, Vienna, Austria, 14–19 Apr 2024, EGU24-20602, https://doi.org/10.5194/egusphere-egu24-20602, 2024.

EGU24-21725 | ECS | Posters on site | HS3.5

Machine Learning Insights into Aquifer Recharge: Site suitability analysis in season water availability scenarios 

Valdrich Fernandes, Perry de Louw, Coen Ritsema, and Ruud Bartholomeus

Groundwater models are valuable tools for optimising decisions that influence groundwater flow. Spatially distributed models represent groundwater levels across the entire area from where essential information can be extracted, directly aiding in the decision-making process. In our previous study, we explored different machine learning (ML) models as faster alternatives to predict the increase in stationary groundwater head due to artificial recharge in unconfined aquifers while considering a wider spatial extent (832 columns x 1472 rows, totalling 765 km2) than previous ML groundwater models. The trained ML model accurately estimates the increase in groundwater head within 0.24 seconds, achieving a Nash-Sutcliffe efficiency of 0.95. This allows quick analysis of site suitability at potential recharge rates. This study extends the approach to incorporate seasonal variation in water availability, illustrating the concept of storing excess water during winter to meet heightened demands during summer, when water availability is minimal. Additionally, we quantify the impacts of the local properties, geohydrological and surface water network properties, on the storage capacity by training ML models on estimating the summer decay rate of stored water in hypothetical aquifer recharge sites.  

Among 720 hypothetical recharge sites, we vary its location, recharge rate and size to capture various combinations of local properties in the catchment. Artificial recharge is modeled using a MODFLOW-based groundwater model, representing the geo-hydrological properties and the surface water network in the Baakse Beek catchment in the Netherlands. The recharge is simulated from October 2011 till February 2012 with the remainder of the year simulated without any artificial recharge. Based on the modeled heads, the decay rate of stored water is calculated for the period until October. This calculated decay rate, in combination with the local properties are used to train and evaluate the ML model. The relative contributions of properties to the decay rate are quantified using the latest developments in explainable AI techniques. Techniques such as permutation importance and Ceteris paribus profiles not only help categorize the suitability of potential recharge sites but also quantify the relative contribution of each property. By leveraging these insights, water managers can make informed decisions regarding site improvement measures. 

How to cite: Fernandes, V., de Louw, P., Ritsema, C., and Bartholomeus, R.: Machine Learning Insights into Aquifer Recharge: Site suitability analysis in season water availability scenarios, EGU General Assembly 2024, Vienna, Austria, 14–19 Apr 2024, EGU24-21725, https://doi.org/10.5194/egusphere-egu24-21725, 2024.

EGU24-1390 | ECS | PICO | HS3.8

Entropy theory-based approach to derive equivalent GIUH 

Anubhav Goel and Venkata Vemavarapu Srinivas

Flood hydrographs are desirable at various hotspots in river basins for a wide range of applications such as hydrologic design and risk assessment of water resources systems. However, determining the hydrographs at ungauged locations has always been challenging. Among various approaches available for simulating a flood hydrograph, the synthetic UH (unit hydrograph) approach has attracted the attention of hydrologists for use in ungauged catchments. The approach involves the derivation of UH for the target location’s catchment and convoluting it with an excess rainfall hyetograph specified for the catchment to arrive at a flood hydrograph. The UH can be derived using Geomorphological Instantaneous UH (GIUH). Recently, there has been growth in interest to consider Horton–Strahler (HS) ratio-based equivalent GIUH (E-GIUH) derived using the self-similarity hypothesis for ungauged catchments, owing to its advantages in overcoming uncertainty in HS ratios arising from uncertainty in the choice of a source DEM. The E-GIUH is constructed using a PDF (probability distribution function) that provides an adequate fit to salient points determined from the E-GIUH characteristics (peak flow, time to peak, and base time). The characteristics are derived using empirical relationships considering the catchment’s geomorphology (equivalent HS ratios, length of the highest order stream) and characteristic flow velocity. An issue in analysis with E-GIUH is that its construction involves uncertainty in the choice of PDF. Furthermore, the empirical relationships used with E-GIUH lack a physical basis. This paper proposes an entropy theory-based methodology to account for the uncertainty in the choice of a PDF for the E-GIUH construction. The efficacy of the proposed methodology in simulating flood hydrographs at ungauged sites is illustrated for typical rainfall-runoff events from 10 unregulated catchments ranging in size from 107 – 2000 km2 and located in two river basins along the west coast of India. The hydrographs are compared with those simulated using conventional EGIUH in terms of several performance measures to illustrate the improvement noted with the entropy theory-based methodology.

How to cite: Goel, A. and Srinivas, V. V.: Entropy theory-based approach to derive equivalent GIUH, EGU General Assembly 2024, Vienna, Austria, 14–19 Apr 2024, EGU24-1390, https://doi.org/10.5194/egusphere-egu24-1390, 2024.

EGU24-2820 | PICO | HS3.8 | Highlight

A stochastic model of catchment baseflow dynamics 

Mariaines Di Dato, Alberto Bellin, Vladimir Cvetkovic, Gedeon Dagan, Peter Dietrich, Aldo Fiori, Georg Teutsch, Alraune Zech, and Sabine Attinger

Groundwater discharge profoundly influences river flow, especially during dry spells, potentially exacerbating drought conditions, an issue compounded by escalating climate change-induced hydrological extremes. Amidst this, understanding aquifer systems' efficacy in mitigating (sub-)seasonal fluctuations and their ecological impacts gains significance even in moderate climates.

This work introduces a stochastic modeling approach for groundwater-fed baseflow, as an alternative to the traditional hydraulic theory by accounting for spatial heterogeneity of subsurface storage properties and associated uncertainties. Leveraging on readily available rainfall-generated recharge and river discharge series, stochastic tools determine baseflow characteristics. The model’s foundation lies on representing groundwater recharge and subsurface storage as stochastic variables.

With the subsurface storage represented as multiple linear reservoirs with stochastic storage parameters, the proposed model reveals the baseflow dynamics and the interplay between heterogeneous reservoir timescales and recharge variability, elucidating temporal variance of baseflow at the catchment scale. Furthermore, the study investigates equivalent parameters for an upscaled unique reservoir to model catchment behavior. Utilizing established stochastic analysis tools in subsurface hydrology, this research advances our understanding of heterogeneous hydrological catchments. In addition, the investigation analyzes the temporal statistical moments of baseline discharge dependent on input recharge and sub-catchments' response times. This detailed analysis unveils the system's attenuation effect as a metric for catchment resilience during prolonged droughts, significantly influenced by underlying hydrogeological properties. As a practical consequence, quantifying the dependency of the attenuation factor on both temporal and hydrogeological variability can help in identifying particularly sensitive watersheds, crucial for tailored adaptation strategies.

How to cite: Di Dato, M., Bellin, A., Cvetkovic, V., Dagan, G., Dietrich, P., Fiori, A., Teutsch, G., Zech, A., and Attinger, S.: A stochastic model of catchment baseflow dynamics, EGU General Assembly 2024, Vienna, Austria, 14–19 Apr 2024, EGU24-2820, https://doi.org/10.5194/egusphere-egu24-2820, 2024.

EGU24-3346 | ECS | PICO | HS3.8

Unraveling uncertainties of extreme-flood simulations over Switzerland based on different weather generator scenarios 

Eleni Kritidou, Martina Kauzlaric, Marc Vis, Maria Staundiger, Jan Seibert, and Daniel Viviroli

Floods are a high-impact natural hazard in Switzerland and are responsible for considerable damage to property values, infrastructure and agricultural land (Hilker et al., 2009). Hence, reliable flood estimates are critical in flood risk reduction, emergency preparedness and disaster management.

The traditional flood estimation methods rely on statistical techniques based on observed streamflow and precipitation. However, the short length of observational records is often a limiting factor that leads to considerable uncertainties in flood estimates, especially for rare floods. An alternative approach that circumvents this limitation is the combination of stochastic weather generators with hydrological models using long continuous simulations. The advantage of this approach is that it avoids assumptions about antecedent catchment states (e.g., soil moisture, snowpack, storage levels of lakes and reservoirs) and simplified representations of the underlying physical flooding processes.

Here, we use an elaborate framework based on continuous simulations with a hydrometeorological modeling chain (Viviroli et al., 2022) to estimate rare floods for large catchments in Switzerland (larger than ~450 km²). The modeling chain starts with a multi-site stochastic weather generator (GWEX), focusing on generating extremely high precipitation events. Then, a bucket-type hydrological model (HBV) is used to simulate discharge time series. Finally, the RS Minerve (RSM) model is employed to implement simplified representations of river channel hydraulics and floodplain inundations.

We aim to investigate the uncertainties of derived flood estimates, with an experimental set-up focusing on the first component of the modeling chain, the weather generator. Aiming to explore the impact of precipitation inputs on flood estimates, GWEX is subject to different tests while the remaining components (HBV and RSM) remain unchanged. To achieve this, two experiments have been conducted: (a) parameterization of GWEX based on a bootstrap sampling of observed precipitation, from which we get an ensemble of 10 different synthetic time series (b) conditioning of the most relevant GWEX parameters to different weather types that describe intermediate, moderate and stronger precipitation intensities. A set of reference scenarios using the initial parameters of GWEX serves as a benchmark for comparison.

Our experimental framework unravels the sensitivity of the catchments to changes in precipitation inputs. While bootstrapping shows a higher impact compared to weather-type conditioning, the latter seems to reduce the spread of uncertainty both in precipitation and simulated floods. These findings provide an essential basis for follow-up studies on hazard assessment, safety analyses and hydraulic engineering projects.


References

Hilker, N., Badoux, A., & Hegg, C. (2009). The Swiss flood and landslide damage database 1972-2007. In Hazards Earth Syst. Sci (Vol. 9). www.nat-hazards-earth-syst-sci.net/9/913/2009/

Viviroli D, Sikorska-Senoner AE, Evin G, Staudinger M, Kauzlaric M, Chardon J, Favre AC, Hingray B, Nicolet G, Raynaud D, Seibert J, Weingartner R, Whealton C, 2022. Comprehensive space-time hydrometeorological simulations for estimating very rare floods at multiple sites in a large river basin. Natural Hazards and Earth System Sciences, 22(9), 2891–2920, doi:10.5194/nhess-22-2891-2022

How to cite: Kritidou, E., Kauzlaric, M., Vis, M., Staundiger, M., Seibert, J., and Viviroli, D.: Unraveling uncertainties of extreme-flood simulations over Switzerland based on different weather generator scenarios, EGU General Assembly 2024, Vienna, Austria, 14–19 Apr 2024, EGU24-3346, https://doi.org/10.5194/egusphere-egu24-3346, 2024.

North Euboea features elevated topography, expansive wild forests, and numerous small rivers with rainfall patterns similar to the Greek average. Since 2017 a severe disease has affected plane trees (Platanus orientalis), crucial for stabilizing water flow along riverbanks. A devasting wildfire in August 2021 (52,900 hectares burnt areas), further impacted the region significantly. These events induced substantial alterations to the landscape, changing the dynamic of waterflow in watersheds. Our research aims to comprehend, through statistical reasoning, the modifications in water flow and evaluate the collective repercussions on water management. For this purpose, systematic on-site inspections were conducted in April 2023 to map a substream/subriver of the Nileas River and to use water depth for the calibration of the 2D hydraulic model. Also, in September 2023, a devastating storm (“Elias”) caused a dramatic effect in riverbanksdue to the severity of the flood event, and so,in November 2023, we conducted a second systematic on-site inspection to comprehensively assess the situation after the flood event. Hence, a comparative study of Nileas River (before and after the storm) is presented in this study, by emphasizing, through statistical analyses, on the impacts of the landscape changes thoroughlyand to the understanding of the dynamic alterations in the region's watersheds.

How to cite: Moraiti, K., Sigourou, S., Kougia, M., Sargentis, G.-F., and Koutsoyiannis, D.: On-site inspection in monitoring of water flow for the calibration of hydraulic models and the statistical analysis of the hydraulic output. Case study: The river Nileas in North Euboea Greece, before and after the storm Elias in September 2023, EGU General Assembly 2024, Vienna, Austria, 14–19 Apr 2024, EGU24-5186, https://doi.org/10.5194/egusphere-egu24-5186, 2024.

EGU24-6102 | ECS | PICO | HS3.8

Causality in Water-Energy and Food nexus: A toy-model multitasking stochastic synthesis, highlighting the complexity and randomness in decision making 

David Markantonis, Kougia Matina, Demetris Koutsoyiannis, and G.-Fivos Sargentis

The water, energy, and food nexus underscores the intricate interdependence among these vital resources, highlighting the need for integrated and rational management. Balancing the synergies and trade-offs within this nexus is crucial for addressing global challenges related to resource security, environmental management, and societal well-being. While the elements of the nexus are interdependent, various parameters hinder their causal connections. In this study we create a stochastic toy model which links each part of the nexus to the other based on Hurst-Kolmogorov dynamics. The introduction of simple environmental and social variables to these interdependencies alters the model dynamics of the nexus. In this way, we observe that despite the apparent causality in the dependencies of the nexus, the complexity of the system does not reveal causation. Therefore, as the nexus is vital for social prosperity, we must explore other methods for decision making.

How to cite: Markantonis, D., Matina, K., Koutsoyiannis, D., and Sargentis, G.-F.: Causality in Water-Energy and Food nexus: A toy-model multitasking stochastic synthesis, highlighting the complexity and randomness in decision making, EGU General Assembly 2024, Vienna, Austria, 14–19 Apr 2024, EGU24-6102, https://doi.org/10.5194/egusphere-egu24-6102, 2024.

EGU24-8121 | ECS | PICO | HS3.8

Evaluation of habitat diversity and water quality preferences of macroinvertebrates through fuzzy coding 

Jinhee Park, Jin-Ho Yoon, and Sang Don Kim

Hydrology evaluates habitat diversity and quality by identifying where living organisms prefer the environment through habitat information. This information significantly influences biodiversity conservation and the survival of various organisms. Moreover, understanding the types and characteristics of aquatic organisms contributes to determining water quality. This study used a hydrological approach to understand the interaction between the environment and organisms with data on the geographical distribution of freshwater organisms and the various water quality conditions in their respective habitats. Specifically, fuzzy coding was applied to integrate the geographical distribution of over 200 macroinvertebrates in Korea with various water quality conditions (i.e., pH, total phosphates, total nitrogen, etc.) in their preferred habitats. Fuzzy coding quantified the affinity of species for various water quality parameters (e.g., pH) composed of ambiguous or overlapping modalities (e.g., acidic, neutral, and base), constructing fuzzy-coded species x environmental gradient matrices for each species. The resulting database will be critical in evaluating habitat diversity and quality for aquatic organisms from a hydrological perspective. It can be used as an indicator for habitat and biodiversity conservation. It will also provide important information for assessing organisms' adaptability to environmental changes based on their preferences for water quality conditions. Moreover, the database can contribute to establishing policies on water pollution and conservation by understanding the water characteristics preferred by a given organism. Further study is needed to understand the ecological impact of habitat changes due to environmental variations and appropriate modeling to predict water quality changes.

How to cite: Park, J., Yoon, J.-H., and Kim, S. D.: Evaluation of habitat diversity and water quality preferences of macroinvertebrates through fuzzy coding, EGU General Assembly 2024, Vienna, Austria, 14–19 Apr 2024, EGU24-8121, https://doi.org/10.5194/egusphere-egu24-8121, 2024.

EGU24-8580 | ECS | PICO | HS3.8 | Highlight

Detection of the spatial clustering mechanisms of streamflow extremes in the USA and relevance to flood insurance data 

Konstantinos Papoulakos, Theano Iliopoulou, Panayiotis Dimitriadis, Dimosthenis Tsaknias, and Demetris Koutsoyiannis

During the last decades, scientific research in the field of flood risk management has provided new insights and strong computational tools towards the deeper understanding of the fundamental stochastic behaviour that characterizes such natural hazards. Flood hazards are controlled by hydrometeorological processes and their inherent uncertainties. Historically, a high percentage of flood disasters worldwide are investigated regarding the aggregated number of the affected people, economic losses, and generated flood insurance claims. In this respect, the recently published National Flood Insurance Program data by the Federal Emergency Management Agency may yield novel perspectives into flood impacts. The objective of this study is to conduct a spatial analysis on the daily flow series within the US-CAMELS dataset. Specifically, we seek to identify spatial clustering mechanisms of over-threshold streamflow extremes, considering them as proxies for collective risk, in order to examine their underlying stochastic structure. Furthermore, we explore their relevance to the actual insurance data and develop some additional stochastic modelling approaches.

How to cite: Papoulakos, K., Iliopoulou, T., Dimitriadis, P., Tsaknias, D., and Koutsoyiannis, D.: Detection of the spatial clustering mechanisms of streamflow extremes in the USA and relevance to flood insurance data, EGU General Assembly 2024, Vienna, Austria, 14–19 Apr 2024, EGU24-8580, https://doi.org/10.5194/egusphere-egu24-8580, 2024.

EGU24-9043 | ECS | PICO | HS3.8

A stochastic framework for rainfall intensity-timescale-return period relationships regionalized over Greece  

Theano Iliopoulou, Demetris Koutsoyiannis, Nikolaos Malamos, Antonis Koukouvinos, Panayiotis Dimitriadis, Nikos Mamassis, Nikos Tepetidis, and David Markantonis

We develop a regionalization framework for rainfall intensity-timescale-return period relationships that is implemented across the Greek territory. The methodology for single-site estimation is based on a stochastic framework for multi-scale rainfall intensity modeling. Five parameters are first independently fitted for each site, and the resulting parameter variability is explored in terms of uncertainty and spatial variability patterns. Two parameters, the tail-index and a timescale parameter, are identified as constant in space and estimated using data pooling techniques. The remaining three parameters are regionalized across Greece using a combination of spatial interpolation and smoothing techniques, which are evaluated using cross-validation in a multi-model framework.

How to cite: Iliopoulou, T., Koutsoyiannis, D., Malamos, N., Koukouvinos, A., Dimitriadis, P., Mamassis, N., Tepetidis, N., and Markantonis, D.: A stochastic framework for rainfall intensity-timescale-return period relationships regionalized over Greece , EGU General Assembly 2024, Vienna, Austria, 14–19 Apr 2024, EGU24-9043, https://doi.org/10.5194/egusphere-egu24-9043, 2024.

EGU24-9090 | ECS | PICO | HS3.8

Investigating aquitard heterogeneity by inverse groundwater modelling of drinking water extraction sites 

Martijn van Leer, Willem Jan Zaadnoordijk, Alraune Zech, Jasper Griffioen, and Marc Bierkens

Aquitards are important hydrogeological features and their properties play an important role in e.g. water resources management, subsidence, aquifer thermal energy storage and contamination transport. The hydraulic conductivity of aquitards is typically parameterized by analytical interpretation of pumping tests or model calibration. However, these methods may not be very accurate for aquitards and usually do not account for spatial variability and uncertainty. Alternatively, core-scale measurements of hydraulic conductivity are used in geostatistical upscaling methods, for which their correlation lengths are needed. However, this information is extremely difficult to obtain. In this study we investigate whether readily available data from three drinking water extraction sites in The Netherlands can be used to obtain the geostatistical parameters of aquitard hydraulic conductivity needed for upscaling and to provide information about spatial variability of the hydraulic conductivity. We generated conditional random realizations from core scale data with varying correlation lengths and lithology distributions, upscaled these to model block scale and inserted these into a groundwater flow model that simulates the impacts of drinking water extraction and natural variability in precipitation and evapotranspiration over an extensive time period. We select the realizations that best fit observed groundwater heads to extract information about aquitard correlation lengths and lithology distributions and derive upscaled spatially varying aquitard conductivities.

How to cite: van Leer, M., Zaadnoordijk, W. J., Zech, A., Griffioen, J., and Bierkens, M.: Investigating aquitard heterogeneity by inverse groundwater modelling of drinking water extraction sites, EGU General Assembly 2024, Vienna, Austria, 14–19 Apr 2024, EGU24-9090, https://doi.org/10.5194/egusphere-egu24-9090, 2024.

Successful modelling of the groundwater level variations in hydrogeological systems of complex formations considerably depends on spatial and temporal data availability and knowledge of the boundary conditions. Geostatistics plays an important role in model-related data analysis and preparation but has specific limitations when the aquifer system is inhomogeneous. In this research work, we show how the fusion of geostatistics with machine learning can solve some of these problems in complex aquifer systems, mainly when the available dataset is large and randomly distributed in the different aquifer types of the hydrogeological system. Self-Organizing Maps can be applied to identify locally similar input data, to substitute the usually uncertain correlation length of the variogram model that estimates the correlated neighborhood, and then by means of Transgaussian Kriging to estimate the bias-corrected spatial distribution of groundwater level. The proposed methodology was tested on a large dataset of groundwater level data in a complex hydrogeological district, and the results were significantly improved if compared to classical geostatistical approaches.

The research project is implemented in the framework of H.F.R.I call “Basic research Financing (Horizontal support of all Sciences)” under the National Recovery and Resilience Plan “Greece 2.0” funded by the European Union – NextGenerationEU (H.F.R.I. Project Number: 16537).

How to cite: Varouchakis, E.: Fusion of geostatistics and machine learning under a stochastic approach for the spatial analysis of groundwater level variations , EGU General Assembly 2024, Vienna, Austria, 14–19 Apr 2024, EGU24-10826, https://doi.org/10.5194/egusphere-egu24-10826, 2024.

EGU24-10852 | PICO | HS3.8

Climate informed non-stationary simulation of daily streamflow – a comparison of three stochastic models 

Uwe Haberlandt, Ze Jiang, Manuela Brunner, Corentin Chartier-Rescan, Adina Brandt, and Ashish Sharma

For optimal planning of reservoir design and management, long series or many realizations of daily streamflow are required. Stochastic streamflow models can provide such data. However, considering future changes in climate in these models is challenging. The objective of this study is to compare three non-stationary stochastic models with respect to their performance in simulating daily streamflow for current and future climate conditions. This comparison relies on two non-parametric approaches, namely the k-nn Bootstrap and Simulated Annealing optimization as well as a parametric model working in the frequency domain.

All models are run under different experiments: (1) with observed climate from the German Weather Service for a reference and pseudo-future period and (2) with future climate simulations using data from climate models. The simulations from the three models are evaluated for general flow statistics considering current climate and observed changes for a pseudo future. As an additional reference, the HBV rainfall - runoff model driven by observed climate and climate model data is used. The testing of the methods is carried out for some mesoscale catchments in the Harz Mountains comprising streamflow gauges with long daily records. The ability of the stochastic models to simulate the changes for the pseudo future will be the core test for their applicability under changing climate conditions. The results are also expected to demonstrate advantages, disadvantages and limitations of the three methods.

How to cite: Haberlandt, U., Jiang, Z., Brunner, M., Chartier-Rescan, C., Brandt, A., and Sharma, A.: Climate informed non-stationary simulation of daily streamflow – a comparison of three stochastic models, EGU General Assembly 2024, Vienna, Austria, 14–19 Apr 2024, EGU24-10852, https://doi.org/10.5194/egusphere-egu24-10852, 2024.

EGU24-11476 | ECS | PICO | HS3.8

Multi-Sensor Space-Time Data Fusion of Machine Learning Generated Time Series for Wetland Inundation Monitoring 

Jenna Abrahamson, Josh Gray, and Erin Schliep

The biogeochemistry of wetland ecosystems is driven by the presence and absence of water. Wetlands are known hotspots of methane (CH4) emissions, particularly when inundated. Monitoring short-term, and possibly small-scale changes in inundation is therefore critical to quantifying both local and global CH4 emissions. Despite their importance, these short-term changes have historically been under-reported in efforts to monitor CH4. As sea levels rise and flood events increase, it’s imperative to account for these events to better project CH4 cycle variation in a changing climate. Remote sensing is the only method capable of monitoring these changes over time at scale; however, no current remote sensing product has the spatial and temporal resolutions required to map ephemeral changes in inundation extents accurately. To address this, we developed a method to generate high spatiotemporal resolution inundation maps combining SAR and optical data from Sentinel-1 and Sentinel-2 imagery supplemented with commercial PlanetScope imagery from 2017–2022. This method was evaluated in the Albemarle-Pamlico Peninsula, a coastal wetland region in North Carolina, United States characterized by frequent and variable inundation.

Two decision-tree based machine learning algorithms were tested to map inundation extents: a random forest (RF) model and an extreme gradient boosted (XGBoost) model. The models were trained for each sensor based on a suite of spectral signals, terrain-derived features, and precipitation data for each image at the sensor’s native resolution. This work revealed minor differences between machine learning classifiers across the 5 years, with RF accuracies of 94.0%, 98.2%, and 98.6% and XGBoost accuracies of 89.1%, 98.3%, and 97.8% for PlanetScope, Sentinel-2, and Sentinel-1 respectively. The RF classified inundation maps from each sensor were then fused using a hierarchical spatiotemporal random effects model within a probit link function, to generate daily time series of inundation probabilities at 5 m resolution. This approach is unique in that we 1) address the differing sensor resolutions using a statistical change-of-support formulation with observations mapped to process locations, 2) fuse non-Gaussian (binary) responses from machine learning outputs, and 3) model spatial and temporal autocorrelation through spatial basis functions and a first-order autoregressive time series model. Overall, this work produced a novel 5-year inundation dataset, capturing both long-term and ephemeral changes in inundation extents that are critical for quantifying components of the water cycle and their interactions with biogeochemical cycles on Earth.

How to cite: Abrahamson, J., Gray, J., and Schliep, E.: Multi-Sensor Space-Time Data Fusion of Machine Learning Generated Time Series for Wetland Inundation Monitoring, EGU General Assembly 2024, Vienna, Austria, 14–19 Apr 2024, EGU24-11476, https://doi.org/10.5194/egusphere-egu24-11476, 2024.

EGU24-11894 | ECS | PICO | HS3.8

Integration of complex geological systems into groundwater modelling to simulate saltwater dynamics’ 

Abdelrahman Ahmed Ali Abdelrahman, Irina Engelhardt, and Martin Sauter

This study outlines a systematic workflow for developing a 3D geological model with the goal of converting it into a groundwater flow model to simulate groundwater dynamics in the lower Spree catchment in Berlin/Brandenburg, Germany. The flow model is constructed by employing  the finite-difference method to discretize groundwater flow equations, focusing on investigating saltwater up-coning resulting from changes in recharge or increased pumping.

For this aim geological cross-section profiles and borehole data are used to construct a 3D geological model covering 1100 km² with depths up to 350 m. This model serves as a solid base for the subsequent 3D flow model with fine spatial resolution (100 m horizontally and 5 m vertically) and monthly temporal resolution.

The foundation of the geological model hinges on the stratigraphic order and addresses structural complexities such as faults, folds, dip angles, azimuth, and extensions. Challenges arise from outdated data, requiring meticulous preprocessing and cleaning, especially for larger areas with intricate structures and lenses. Specific challenges involve multiple boreholes sharing identical coordinates with varying lithological and stratigraphical descriptions for the same depth, as well as the repetition of layers. Addressing these issues requires careful preprocessing and cleaning.

The study explores interpolation techniques, including Inverse Distance Weighting and Natural Neighbor algorithms, commonly used in geospatial analysis. Challenges related to these methods are discussed, emphasizing difficulties in dealing with shallow boreholes, missing stratigraphy, and ensuring layer continuity, affecting the overall reliability of interpolation results.

To overcome these challenges, a Multi-Layer Perceptron (MLP) machine learning classifier is introduced. This classifier learns the hierarchical order of lithological information, seamlessly integrating it into the geological model. The MLP classifier is trained on preprocessed data, utilizes a dataset split into 85% for model training and 15% for validation, achieving a validation score of 73%.

The geological model is then converted into a numerical mesh for the groundwater flow model. Hydraulic parameters, including hydraulic conductivity, porosity, specific storage, and specific yield, are estimated using empirical formulas and correlation sheets such as the Hazen and Bayer methods, which involve the determination of effective grain size (D10 and D30). Statistical algorithms aid in identifying and assigning hydraulic parameters related to the dominant material group to each flow cell. In instances where two material groups exhibit the same dominance, average values of hydraulic parameters are calculated.

In conclusion, the study highlights the utilization of advanced techniques, including machine learning, alongside statistical methods, becomes imperative to solve complex geological settings, ensuring a more accurate and reliable representation of subsurface properties for groundwater flow models.

How to cite: Abdelrahman, A. A. A., Engelhardt, I., and Sauter, M.: Integration of complex geological systems into groundwater modelling to simulate saltwater dynamics’, EGU General Assembly 2024, Vienna, Austria, 14–19 Apr 2024, EGU24-11894, https://doi.org/10.5194/egusphere-egu24-11894, 2024.

EGU24-15800 | PICO | HS3.8 | Highlight

Regionalisation methods for the designation of areas with groundwater nitrate pollution in Germany 

Alexander Brenning and Thomas Suesse

The designation of nitrate-polluted areas for groundwater protection based on national directives implementing the EU Nitrates Directive (91/676/EEC) in Germany requires the use of geostatistical or deterministic regionalization methods. The objective of this study was to assess the applicability and propose a suitable methodology for a possible national-scale area designation based on an in-depth problem analysis and empirical as well as theoretical model assessments, which identified shortcomings, uncertainties and possible biases in the methods used until now.

Suitable methods must not only be able to identify exceedance regions – as opposed to simply regionalizing nitrate concentration; they also need to take into account spatial heterogeneity and adequately represent distributional characteristics across a variety of hydrogeological settings. This requires the incorporation of ancillary information in the form of quantitative and categorical spatial predictors representing hydrogeological and general environmental conditions, but not emissions estimates in the present regulatory setting.

Kriging with external drift, geostatistical regression-kriging methods and conditional geostatistical simulations offer an established methodological toolbox that fulfils these requirements and enables transparent decision-making. These models consist of linear, potentially nonlinear spatial trend components and geostatistical interpolation components, which can be further differentiated based on hydrogeological regions to account for heterogeneity. An unbiased estimate of the total exceedance area with nitrate levels >50 mg/l can be obtained from these models and accounted for in the decision-making process. An empirical comparison highlights possible biases in the size of exceedance areas obtained with traditional approaches that ignore local prediction uncertainty and focus on spatial prediction of nitrate concentration. Potentials and challenges of combining geostatistical techniques with nonlinear machine-learning models in a regulatory context are discussed.

How to cite: Brenning, A. and Suesse, T.: Regionalisation methods for the designation of areas with groundwater nitrate pollution in Germany, EGU General Assembly 2024, Vienna, Austria, 14–19 Apr 2024, EGU24-15800, https://doi.org/10.5194/egusphere-egu24-15800, 2024.

EGU24-19137 | ECS | PICO | HS3.8

Stochasticity of natural processes concerning loads exerted on offshore wind turbines 

Sofia Efraimia Vrettou, Theano Iliopoulou, and Demetris Koutsoyiannis

Sofia Vrettou; Theano Iliopoulou, and Demetris Koutsoyiannis

The tendency to avoid non-renewable sources in electricity production has led –among other alternative models of energy production- to the rapid growth of offshore wind farms. With regard to the structural design of the offshore wind turbines, international standards for the design of the turbines, suggest that the forces executed on the turbine’s pile, primarily induced by wind and waves, should be calculated by using dynamic models and short-term simulations of the natural parameters. However, due to the stochastic nature of wind and wave generated forces, such dynamic procedures and the short-term approach fail to accurately calculate or either - in the desired scenario - predict the exerted loads. On the other hand, stochastic methods do take into account characteristics of natural processes such as long-term persistence that are crucial in designing the turbines. In this work we aim to estimate the uncertainty in exerted forces using Hurst-Kolmogorov stochastic models and compare the results with those calculated using deterministic methods. A key objective is to examine how the fatigue of the structures is affected by the stochasticity of natural processes.

How to cite: Vrettou, S. E., Iliopoulou, T., and Koutsoyiannis, D.: Stochasticity of natural processes concerning loads exerted on offshore wind turbines, EGU General Assembly 2024, Vienna, Austria, 14–19 Apr 2024, EGU24-19137, https://doi.org/10.5194/egusphere-egu24-19137, 2024.

EGU24-539 | ECS | Orals | HS3.9

Revisiting the common approaches for hydrological model calibration with high-dimensional parameters and objectives  

Songjun Wu, Doerthe Tetzlaff, Keith Beven, and Chris Soulsby

Successful calibration of distributed hydrological models is often hindered by complex model structures, incommensurability between observed and modeled variables, and the complex nature of many hydrological processes. Many approaches have been proposed and compared for calibration, but the comparisons were generally based on parsimonious models with limited objectives. The conclusions could change when more parameters are to be calibrated with multiple objectives and increasing data availability. In this study four different approaches (random sampling, DREAM, NSGA-II, GLUE Limits of acceptability) were tested for a complex application - to calibrate 58 parameters of a hydrological model against 24 objectives (soil moisture and isotopes at 3 depths under vegetation covers). By comparing the simulation performance of parameter sets selected from different approaches, we concluded that random sampling is still usable in high-dimensional parameter space, providing comparable performance to other approaches despite of the poor parameter identifiability. DREAM provided better simulation performance and parameter convergence with informal likelihood functions; however, the difficulty in describing model residual distribution could possibly result in inappropriate formal likelihood functions and thus the poor simulations. Multi-criteria calibration, taking NSGA-II as an example, gave ideal model performance/parameter identifiability and explicitly unravelled the trade-offs between objectives after aggregating them (into 2 or 4); but calibrating against all 24 objectives was hindered by the “curse of dimensionality”, as the increasing dimension exponentially expanded the Pareto front and increased the difficulty to differentiate parameter sets. Finally, Limits of acceptability also provided comparable simulations; moreover, it can be regarded as a learning tool because detailed information about model failures is available for each objective at each timestep. However, the limitation is the insufficient exploration of high-dimensional parameter space due to the use of Latin-Hypercube sampling.

Overall, all approaches showed benefits and limitations, and a general approach to be easily used for such complex calibration cases without trial-and-error is still lacking. By comparing those common approaches, we realised the difficulty to define a proper objective function for many-objective optimisation, either for aggregated scalar function (due to the difficulty of assigning weights or assuming a form for the residual distribution) or the vector function (due to the expansion of the Pareto front). In this context, the Limits of Acceptability approach provided a more flexible way to define the “objective function” for each timestep, though it introduces extra demands in understanding data uncertainties and deciding on what should be considered acceptable. Moreover, in such many-objective optimisation, it is possible that not a single parameter set can capture all the objectives satisfactorily (not in 8 million run in this study).  The non-existence of any global optimal in the sample suggests that the concept of equifinality should be embraced in using an ensemble of comparable parameters to represent such complex systems.

How to cite: Wu, S., Tetzlaff, D., Beven, K., and Soulsby, C.: Revisiting the common approaches for hydrological model calibration with high-dimensional parameters and objectives , EGU General Assembly 2024, Vienna, Austria, 14–19 Apr 2024, EGU24-539, https://doi.org/10.5194/egusphere-egu24-539, 2024.

EGU24-1745 | Posters on site | HS3.9

Predictive uncertainty analysis using null-space Monte Carlo  

Husam Baalousha, Marwan Fahs, and Anis Younes

The inverse problem in hydrogeology poses a significant challenge for modelers due to its ill-posed nature and the non-uniqueness of solutions. This challenge is compounded by the substantial computational efforts required for calibrating highly parameterized aquifers, particularly those with significant heterogeneity, such as karst limestone aquifers. While stochastic methods like Monte Carlo simulations are commonly used to assess uncertainty, their extensive computational requirements often limit their practicality.

The Null Space Monte Carlo (NSMC) method provides a parameter-constrained approach to address these challenges in inverse problems, allowing for the quantification of uncertainty in calibrated parameters. This method was applied to the northern aquifer of Qatar, which is characterized by high heterogeneity. The calibration of the model utilized the pilot point approach, and the calibrated results were spatially interpolated across the aquifer area using kriging.

NSMC was then employed to generate 100 sets of parameter-constrained random variables representing hydraulic conductivities. The null space vectors of these random solutions were incorporated into the parameter space derived from the calibrated model. Statistical analysis of the resulting calibrated hydraulic conductivities revealed a wide range, varying from 0.1 to 350 m/d, illustrating the significant variability inherent in the karstic nature of the aquifer.

Areas with high hydraulic conductivity were identified in the middle and eastern parts of the aquifer. These regions of elevated hydraulic conductivity also exhibited high standard deviations, further emphasizing the heterogeneity and complex nature of the aquifer's hydraulic properties.

How to cite: Baalousha, H., Fahs, M., and Younes, A.: Predictive uncertainty analysis using null-space Monte Carlo , EGU General Assembly 2024, Vienna, Austria, 14–19 Apr 2024, EGU24-1745, https://doi.org/10.5194/egusphere-egu24-1745, 2024.

Remote sensing observations hold useful prior information about the terrestrial water cycle. However, combining remote sensing products for each hydrological variable does not close the water balance due to the associated uncertainties. Therefore, there is a need to quantify bias and random errors in the data. This study presents an extended version of the data-driven probabilistic data fusion for closing the water balance at a basin scale. In this version, we implement a monthly 250-m grid-based Bayesian hierarchical model leveraging multiple open-source data of precipitation, evaporation, and storage in an ensemble approach that fully exploits and maximizes the prior information content of the data. The model relates each variable in the water balance to its “true” value using bias and random error parameters with physical nonnegativity constraints. The water balance variables and error parameters are treated as unknown random variables with specified prior distributions. Given an independent set of ground-truth data on water imports and river discharge along with all monthly gridded water balance data, the model is solved using a combination of Markov Chain Monte Carlo sampling and iterative smoothing to compute posterior distributions of all unknowns. The approach is applied to the Hindon Basin, a tributary of the Ganges River, that suffers from groundwater overexploitation and depends on surface water imports. Results provide spatially distributed (i) hydrologically consistent water balance estimates and (ii) statistically consistent error estimates of the water balance data. 

How to cite: Mourad, R., Schoups, G., and Bastiaanssen, W.: A grid-based data-driven ensemble probabilistic data fusion: a water balance closure approach applied to the irrigated Hindon River Basin, India , EGU General Assembly 2024, Vienna, Austria, 14–19 Apr 2024, EGU24-2267, https://doi.org/10.5194/egusphere-egu24-2267, 2024.

EGU24-2300 | ECS | Posters on site | HS3.9

Representing systematic and random errors of eddy covariance measurements in suitable likelihood models for robust model selection  

Tobias Karl David Weber, Alexander Schade, Robert Rauch, Sebastian Gayler, Joachim Ingwersen, Wolfgang Nowak, Efstathios Diamantopoulos, and Thilo Streck

The importance of evapotranspiration (ET) fluxes for the terrestrial water cycle is demonstrated by an overwhelming body of literature. Unfortunately, errors in their measurement contribute significantly to (model) uncertainties in quantifying and understanding ecohydrological systems. Measurements of surface-atmosphere fluxes of water at the ecosystem scale, the eddy covariance method can be considered a powerful technique and considered an important tool to validate ET models. Spatially averaged fluxes of several hundred square meters may be obtained. While the eddy-covariance technique has become a routine method to estimate the turbulent energy fluxes at the soil-atmosphere boundary, it remains not error free. Some of the inherent errors are quantifiable and may be partitioned into systematic and stochastic errors. For model-data comparison, the nature of the measurement error needs to be known to derive knowledge about model adequacy. To this end, we compare several assumptions found in the literature to describe the statistical properties of the error with newly derived descriptions, in this study. We are able to show, how sensitive the assumptions about the error are on the model selection process. We demonstrate this by comparing daily agro-ecosystem ET fluxes simulated with the detailed agro-hydrological model Expert-N to data gathered using the eddy-covariance technique.

How to cite: Weber, T. K. D., Schade, A., Rauch, R., Gayler, S., Ingwersen, J., Nowak, W., Diamantopoulos, E., and Streck, T.: Representing systematic and random errors of eddy covariance measurements in suitable likelihood models for robust model selection , EGU General Assembly 2024, Vienna, Austria, 14–19 Apr 2024, EGU24-2300, https://doi.org/10.5194/egusphere-egu24-2300, 2024.

EGU24-4140 | ECS | Orals | HS3.9

Integrating Deterministic and Probabilistic Approaches for Improved Hydrological Predictions: Insights from Multi-model Assessment in the Great Lakes Watersheds 

Jonathan Romero-Cuellar, Rezgar Arabzadeh, James Craig, Bryan Tolson, and Juliane Mai

The utilization of probabilistic streamflow predictions holds considerable value in the domains of predictive uncertainty estimation, hydrologic risk management, and decision support in water resources. Typically, the quantification of predictive uncertainty is formulated and evaluated using a solitary hydrological model, posing challenges in extrapolating findings to diverse model configurations. To address this limitation, this study examines variations in the performance ranking of various streamflow models through the application of a residual error model post-processing approach across multiple basins and models. The assessment encompasses 141 basins within the Great Lakes watershed, spanning the USA and Canada, and involves the evaluation of 13 diverse streamflow models using deterministic and probabilistic performance metrics. This investigation scrutinizes the interdependence between the quality of probabilistic streamflow estimation and the underlying model quality. The results underscore that the selection of a streamflow model significantly influences the robustness of probabilistic predictions. Notably, transitioning from deterministic to probabilistic predictions, facilitated by a post-processing approach, maintains the performance ranking consistency for the best and worst deterministic models. However, models of intermediate rank in deterministic evaluation exhibit inconsistent rankings when evaluated in probabilistic mode. Furthermore, the study reveals that post-processing residual errors of long short-term memory (LSTM) network models consistently outperform other models in both deterministic and probabilistic metrics. This research emphasizes the importance of integrating deterministic streamflow model predictions with residual error models to enhance the quality and utility of hydrological predictions. It elucidates the extent to which the efficacy of probabilistic predictions is contingent upon the sound performance of the underlying model and its potential to compensate for deficiencies in model performance. Ultimately, these findings underscore the significance of combining deterministic and probabilistic approaches for improving hydrological predictions, quantifying uncertainty, and supporting decision-making in operational water management.

How to cite: Romero-Cuellar, J., Arabzadeh, R., Craig, J., Tolson, B., and Mai, J.: Integrating Deterministic and Probabilistic Approaches for Improved Hydrological Predictions: Insights from Multi-model Assessment in the Great Lakes Watersheds, EGU General Assembly 2024, Vienna, Austria, 14–19 Apr 2024, EGU24-4140, https://doi.org/10.5194/egusphere-egu24-4140, 2024.

EGU24-5219 | ECS | Posters on site | HS3.9

Quantifying Uncertainty in Surrogate-based Bayesian Inference 

Anneli Guthke, Philipp Reiser, and Paul-Christian Bürkner

Proper sensitivity and uncertainty analysis for complex Earth and environmental systems models may become computationally prohibitive. Surrogate models can be an alternative to enable such analyses: they are cheap-to-run statistical approximations to the simulation results of the original expensive model. Several approaches to surrogate modelling exist, all with their own challenges and uncertainties. It is crucial to correctly propagate the uncertainties related to surrogate modelling to predictions, inference and derived quantities in order to draw the right conclusions from using the surrogate model.

While the uncertainty in surrogate model parameters due to limited training data (expensive simulation runs) is often accounted for, what is typically ignored is the approximation error due to the surrogate’s structure (bias in reproducing the original model predictions). Reasons are that such a full uncertainty analysis is computationally costly even for surrogates (or limited to oversimplified analytic cases), and that a comprehensive framework for uncertainty propagation with surrogate models was missing.

With this contribution, we propose a fully Bayesian approach to surrogate modelling, uncertainty propagation, parameter inference, and uncertainty validation. We illustrate the utility of our approach with two synthetic case studies of parameter inference and validate our inferred posterior distributions by simulation-based calibration. For Bayesian inference, the correct propagation of surrogate uncertainty is especially relevant, because failing to account for it may lead to biased and/or overconfident parameter estimates and will spoil further interpretation in the physics’ context or application of the expensive simulation model.

Consistent and comprehensive uncertainty propagation in surrogate models enables more reliable approximation of expensive simulations and will therefore be useful in various fields of applications, such as surface or subsurface hydrology, fluid dynamics, or soil hydraulics.

How to cite: Guthke, A., Reiser, P., and Bürkner, P.-C.: Quantifying Uncertainty in Surrogate-based Bayesian Inference, EGU General Assembly 2024, Vienna, Austria, 14–19 Apr 2024, EGU24-5219, https://doi.org/10.5194/egusphere-egu24-5219, 2024.

EGU24-6157 | ECS | Orals | HS3.9

Analyzing Groundwater Hazards with Sequential Monte Carlo  

Lea Friedli and Niklas Linde

Analyzing groundwater hazards frequently involves utilizing Bayesian inversions and estimating probabilities associated with rare events. A concrete example concerns the potential contamination of an aquifer, a process influenced by the unknown hydraulic properties of the subsurface. In this context, the emphasis shifts from the posterior distribution of model parameters to the distribution of a particular quantity of interest dependent on these parameters. To tackle the methodological hurdles at hand, we propose a Sequential Monte Carlo approach in two stages. The initial phase involves generating particles to approximate the posterior distribution, while the subsequent phase utilizes subset sampling techniques to evaluate the probability of the specific rare event of interest. Exploring a two-dimensional flow and transport example, we demonstrate the efficiency and accuracy of the developed PostRisk-SMC method in estimating rare event probabilities associated with groundwater hazards.

How to cite: Friedli, L. and Linde, N.: Analyzing Groundwater Hazards with Sequential Monte Carlo , EGU General Assembly 2024, Vienna, Austria, 14–19 Apr 2024, EGU24-6157, https://doi.org/10.5194/egusphere-egu24-6157, 2024.

EGU24-7610 | Posters on site | HS3.9

Parameter estimation of heterogeneous field in basin scale based on signal analysis and river stage tomography 

Bo-Tsen Wang, Chia-Hao Chang, and Jui-Pin Tsai

Understanding the spatial distribution of the aquifer parameters is crucial to evaluating the groundwater resources on a basin scale. River stage tomography (RST) is one of the potential methods to estimate the aquifer parameter fields. Utilizing the head variations caused by the river stage to conduct RST is essential to delineate the regional aquifer's spatial features successfully. However, the two external stimuli of the aquifer system, rainfall and river stage, are usually highly correlated, resulting in mixed features in the head observations, which may cause unreasonable estimates of parameter fields. Thus, separating the head variations sourced from rainfall and river stage is essential to developing the reference heads for RST. To solve this issue, we propose a systematic approach to extracting and reconstructing the head variations of river features from the original head observations during the flood periods and conducting RST. We utilized a real case study to examine the developed method. This study used the groundwater level data, rainfall data, and river stage data in the Zhuoshui River alluvial fan in 2006. The hydraulic diffusivity (D) values of five observation wells were used as the reference for parameter estimation. The results show that the RMSE of the D value is 0.027 (m2/s). The other three observation wells were selected for validation purposes, and the derived RMSE is 0.85(m2/s). The low RMSE reveals that the estimated D field can capture the characteristics of the regional aquifer. The results also indicate that the estimated D values derived from the developed method are consistent with the sampled D values from the pumping tests in the calibration and validation processes in the real case study. The results demonstrate that the proposed method can successfully extract and reconstruct the head variations of river features from the original head observations and can delineate the features of the regional parameter field. The proposed method can benefit RST studies and provide an alternative mixed-feature signal decomposition and reconstruction method.

How to cite: Wang, B.-T., Chang, C.-H., and Tsai, J.-P.: Parameter estimation of heterogeneous field in basin scale based on signal analysis and river stage tomography, EGU General Assembly 2024, Vienna, Austria, 14–19 Apr 2024, EGU24-7610, https://doi.org/10.5194/egusphere-egu24-7610, 2024.

EGU24-7820 | Orals | HS3.9

Data-driven surrogate-based Bayesian model calibration for predicting vadose zone temperatures in drinking water supply pipes 

Ilja Kröker, Elisabeth Nißler, Sergey Oladyshkin, Wolfgang Nowak, and Claus Haslauer

Soil temperature and soil moisture in the unsaturated zone depend on each other and are influenced by non-stationary hydro-meteorological forcing factors that are subject to climate change. 

The transport of both heat and moisture are crucial for predicting temperatures in the shallow subsurface and, as consequence, around and in drinking water supply pipes. Elevated temperatures in water supply pipes (even up to 25°C and above) pose a risk to human health due to increased likelihood of microbial contamination. 

To model variably saturated flow and heat transport, a partial differential equation (PDE)-based integrated hydrogeological model has been developed and implemented in the DuMuX simulation framework.  This model integrates the hydrometeorological forcing functions via a novel interface condition at the atmosphere-subsurface boundary. Relevant soil properties and their dependency on temperatures have been measured as time series at a pilot site at the University of Stuttgart in detail since 2020. 

Despite these efforts on measurements and model enhancement, some uncertainties remain. These include capillary-saturation relationships in materials where they are difficult to measure, especially in the gravel-type materials that are commonly used above drinking water pipes. 

To enhance our understanding of the underlying physical processes, we employ Bayesian inference, which is a well-established approach to estimate uncertain or unknown model parameters. Computationally cheap surrogate models allow to overcome the limitations of Bayesian methods for computationally intensive models, when such surrogate models are used in lieu of the physical (PDE)-based model. Here, we use the arbitrary polynomial chaos expansion equipped with Bayesian regularization (BaPC).  The BaPC allows to exploit latest (Bayesian) active learning strategies to reduce the number of model-runs that are necessary for constructing the surrogate model.  

In the present work, we demonstrate the calibration of a PDE-based integrated hydrogeological model using Bayesian inference on a BaPC-based surrogate.  The accuracy of the calibrated and predicted temperatures in the shallow subsurface is then assessed against real-world measurement data. 

How to cite: Kröker, I., Nißler, E., Oladyshkin, S., Nowak, W., and Haslauer, C.: Data-driven surrogate-based Bayesian model calibration for predicting vadose zone temperatures in drinking water supply pipes, EGU General Assembly 2024, Vienna, Austria, 14–19 Apr 2024, EGU24-7820, https://doi.org/10.5194/egusphere-egu24-7820, 2024.

EGU24-8007 | ECS | Orals | HS3.9

Investigating the divide and measure nonconformity  

Daniel Klotz, Martin Gauch, Frederik Kratzert, Grey Nearing, and Jakob Zscheischler

This contribution presents a diagnostic approach to investigate unexpected side effects that can occur during the evaluation of rainfall--runoff models.

The diagnostic technique that we use is based on the idea that one can use gradient descent to modify the runoff observations/simulations to obtain warranted observations/simulations. Specifically, we show how to use this concept to manipulate any hydrograph (e.g., a copy of the observations) so that it approximates specific NSE values for individual parts of the data. In short, we follow the following recipe to generate the synthetic simulations: (1) copy the observations, (2) add noise, (3) clip the modified discharge to zero, and (4) optimise the obtained simulation values by using gradient descent until a desired NSE value is reached.

To show how this diagnostic technique can be used we demonstrate a behaviour of Nash--Sutcliffe Efficiency (NSE) that appears when evaluating a model over subsets of the data: If models perform poorly for certain situations, this lack of performance is not necessarily reflected in the NSE (of the overall data). This behaviour follows from the definition of NSE and is therefore 100% explainable. However, from our experience it can be unexpected for many modellers. Our results also show that subdividing the data and evaluating over the resulting partitions yields different information regarding model deficiencies than an overall evaluation. We call this phenomenon the Divide And Measure Nonconformity or DAMN.


How to cite: Klotz, D., Gauch, M., Kratzert, F., Nearing, G., and Zscheischler, J.: Investigating the divide and measure nonconformity , EGU General Assembly 2024, Vienna, Austria, 14–19 Apr 2024, EGU24-8007, https://doi.org/10.5194/egusphere-egu24-8007, 2024.

Groundwater heads are commonly used to monitor storage of aquifers and as decision variables for groundwater management. Alluvial gravel aquifers are often characterized by high transmissivities and a corresponding strong seasonal and inter-annual variability of storage. The sustainable management of such aquifers is challenging, particularly for already tightly allocated aquifers and in increasingly extreme and potentially drier climates, and might require the restriction of groundwater abstraction for periods of time. Stakeholders require lead-in time to prepare for potential restrictions of their consented takes.

Groundwater models have been used in the past to support groundwater decision making and to provide the corresponding predictions of groundwater levels for operational forecasting and management. In this study, we benchmark and compare different model classes to perform this task: (i) a spatially explicit 3D groundwater flow model (MODFLOW), (ii) a conceptual, bucket-type Eigenmodel, (iii) a transfer-function model (TFN), and (iv) three machine learning (ML) techniques, namely, Multi-Layer Perceptron models (MLP), Long Short-Term Memory models (LSTM), and Random Forrest (RF) models. The model classes differ widely in their complexity, input requirements, calibration effort, and run-times. The different model classes are tested on four groundwater head time series taken from the Wairau Aquifer in New Zealand (Wöhling et al., 2020). Posterior parameter ensembles of MODFLOW (Wöhling et al., 2018) and the EIGENMODEL (Wöhling & Burbery, 2020) were combined with TFN and ML variants with different input features to form a (prior) multi-model ensemble. Models classes are ranked with posterior model weights derived from Bayesian model selection (BMS) and averaging (BMA) techniques.

Our results demonstrate that no “model that fits all” exists in our model set. The more physics-based MODFLOW model is not necessarily providing the most accurate predictions, but can provide physical meaning and interpretation for the entire model region and outputs at locations where no data is available. ML techniques have generally much lower input requirements and short run-times. They show to be competitive candidates for groundwater head predictions where observations are available, even for system states that lie outside the calibration data range.

Because the performance of model types is site-specific, we advocate the use of multi-model ensemble forecasting wherever feasible. The benefit is illustrated by our case study, with BMA uncertainty bounds providing a better coverage of the data and the BMA mean performing well for all tested sites. Redundant ensemble members (with BMA weights of zero) are easily filtered out to obtain efficient ensembles for operational forecasting.


References

Wöhling T, Burbery L (2020). Eigenmodels to forecast groundwater levels in unconfined river-fed aquifers during flow recession. Science of the Total Environment, 747, 141220, doi: 10.1016/j.scitotenv.2020.141220.

Wöhling, T., Gosses, M., Wilson, S., Wadsworth, V., Davidson, P. (2018). Quantifying river-groundwater interactions of New Zealand's gravel-bed rivers: The Wairau Plain. Goundwater doi:10.1111/gwat.12625

Wöhling T, Wilson SR, Wadsworth V, Davidson P. (2020). Detecting the cause of change using uncertain data: Natural and anthropogenic factors contributing to declining groundwater levels and flows of the Wairau Plain Aquifer, New Zealand. Journal of Hydrology: Regional Studies, 31, 100715, doi: 10.1016/j.ejrh.2020.100715.


How to cite: Wöhling, T. and Crespo Delgadillo, O.: Predicting groundwater heads in alluvial aquifers: Benchmarking different model classes and machine-learning techniques with BMA/S, EGU General Assembly 2024, Vienna, Austria, 14–19 Apr 2024, EGU24-8818, https://doi.org/10.5194/egusphere-egu24-8818, 2024.

EGU24-8872 | Orals | HS3.9

Characterization and modeling of large-scale aquifer systems under uncertainty: methodology and application to the Po River aquifer system 

Monica Riva, Andrea Manzoni, Rafael Leonardo Sandoval, Giovanni Michele Porta, and Alberto Guadagnini

Large-scale groundwater flow models are key to enhance our understanding of the potential impacts of climate and anthropogenic factors on water systems. Through these, we can identify significant patterns and processes that most affect water security. In this context, we have developed a comprehensive and robust theoretical framework and operational workflow that can effectively manage complex heterogeneous large-scale groundwater systems. We rely on machine learning techniques to map the spatial distribution of geomaterials within three-dimensional subsurface systems. The groundwater modeling approach encompasses (a) estimation of groundwater recharge and abstractions, as well as (b) appraisal of interactions among subsurface and surface water bodies. We ground our analysis on a unique dataset that encompasses lithostratigraphic data as well as piezometric and water extraction data across the largest aquifer system in Italy (the Po River basin). The quality of our results is assessed against pointwise information and hydrogeological cross-sections which are available within the reconstructed domain. These can be considered as soft information based on expert assessment. As uncertainty quantification is critical for subsurface characterization and assessment of future states of the groundwater system, the proposed methodology is designed to provide a quantitative evaluation of prediction uncertainty at any location of the reconstructed domain. Furthermore, we quantify the relative importance of uncertain model parameters on target model outputs through the implementation of a rigorous Global Sensitivity Analysis. By evaluating the spatial distribution of global sensitivity metrics associated with model parameters, we gain valuable insights into areas where the acquisition of future information could enhance the quality of groundwater flow model parameterization and improve hydraulic head estimates. The comprehensive dataset provided in this study, combined with the reconstruction of the subsurface system properties and piezometric head distribution and with the quantification of the associated uncertainty, can be readily employed in the context of groundwater availability and quality studies associated with the region of interest. The approach and operational workflow are flexible and readily transferable to assist identification of the main dynamics and patterns of large-scale aquifer systems of the kind here analyzed.

How to cite: Riva, M., Manzoni, A., Sandoval, R. L., Porta, G. M., and Guadagnini, A.: Characterization and modeling of large-scale aquifer systems under uncertainty: methodology and application to the Po River aquifer system, EGU General Assembly 2024, Vienna, Austria, 14–19 Apr 2024, EGU24-8872, https://doi.org/10.5194/egusphere-egu24-8872, 2024.

EGU24-10517 | Orals | HS3.9

Lock-ins and path dependency in evaluation metrics used for hydrological models 

Lieke Melsen, Arnald Puy, and Andrea Saltelli

Science, being conducted by humans, is inherently a social activity. This is evident in the development and acceptance of scientific methods. Science is not only socially shaped, but also driven (and in turn influenced) by technological development: technology can open up new research avenues. At the same time, it has been shown that technology can cause lock-ins and path dependency. A scientific activity driven both by social behavior and technological development is modelling. As such, studying modelling as a socio-technical activity can provide insights both in enculturation processes and in lock-ins and path dependencies. Even more, enculturation can lead to lock-ins. We will demonstrate this for the Nash-Sutcliffe Efficiency (NSE), a popular evaluation metric in hydrological research. Through a bibliometric analysis we show that the NSE is part of hydrological research culture and does not appear in adjacent research fields. Through a historical analysis we demonstrate the path dependency that has developed with the popularity of the NSE. Finally, through exploring the faith of alternative measures, we show the lock-in effect of the use of the NSE. As such, we confirm that the evaluation of models needs to take into account cultural embeddedness. This is relevant because peers' acceptance is a powerful legitimization argument to trust the model and/or model results, including for policy relevant applications. Culturally determined bias needs to be assessed for its potential consequences in the discipline. 

How to cite: Melsen, L., Puy, A., and Saltelli, A.: Lock-ins and path dependency in evaluation metrics used for hydrological models, EGU General Assembly 2024, Vienna, Austria, 14–19 Apr 2024, EGU24-10517, https://doi.org/10.5194/egusphere-egu24-10517, 2024.

EGU24-10770 | Orals | HS3.9 | Highlight

Uncertainty and sensitivity analysis: new purposes, new users, new challenges 

Francesca Pianosi, Hannah Bloomfield, Gemma Coxon, Robert Reinecke, Saskia Salwey, Georgios Sarailidis, Thorsten Wagener, and Doris Wendt

Uncertainty and sensitivity analysis are becoming an integral part of mathematical modelling of earth and environmental systems. Uncertainty analysis aims at quantifying uncertainty in model outputs, which helps to avoid spurious precision and increase the trustworthiness of model-informed decisions. Sensitivity analysis aims at identifying the key sources of output uncertainty, which helps to set priorities for uncertainty reduction and model improvement.

In this presentation, we draw on a range of recent studies and projects to discuss the status of uncertainty and sensitivity analysis, focusing in particular on ‘global’ approaches, whereby uncertainties and sensitivities are quantified across the entire space of plausible variability of model inputs.

We highlight some of the challenges and untapped potential of these methodologies, including: (1) innovative ways to use global sensitivity analysis to test the ‘internal consistency’ of models and therefore support their diagnostic evaluation; (2) challenges and opportunities to promote the uptake of these methodologies to increasingly complex models, chains of models, and models used in industry; (3) the limits of uncertainty and sensitivity analysis when dealing with epistemic, poorly bounded or unquantifiable sources of uncertainties.

How to cite: Pianosi, F., Bloomfield, H., Coxon, G., Reinecke, R., Salwey, S., Sarailidis, G., Wagener, T., and Wendt, D.: Uncertainty and sensitivity analysis: new purposes, new users, new challenges, EGU General Assembly 2024, Vienna, Austria, 14–19 Apr 2024, EGU24-10770, https://doi.org/10.5194/egusphere-egu24-10770, 2024.

EGU24-11414 | ECS | Posters on site | HS3.9

Single vs. multi-objective optimization approaches to calibrate an event-based conceptual hydrological model using model output uncertainty framework. 

Muhammad Nabeel Usman, Jorge Leandro, Karl Broich, and Markus Disse

Flash floods have become one of the major natural hazards in central Europe, and climate change projections indicate that the frequency and severity of flash floods will increase in many areas across the world and in central Europe. The complexity involved in the flash flood generation makes it difficult to calibrate a hydrological model for the prediction of such peak hydrological events. This study investigates the best approach to calibrate an event-based conceptual HBV model, comparing different trials of single-objective, single-event multi-objective (SEMO), and multi-event-multi-objective (MEMO) model calibrations. Initially, three trials of single-objective calibration are performed w.r.t. RMSE, NSE, and BIAS separately, then three different trials of multi-objective optimization, i.e., SEMO-3D (single-event three objectives), MEMO-3D (mean of three objectives from two events), and MEMO-6D (two events six objectives) are formulated. Model performance was validated for several peak events via 90 % (confidence interval) CI-based output uncertainty quantification. The uncertainties associated with the model predictions are estimated stochastically using the ‘relative errors (REs)’ between the simulated (Qsim) and measured (Qobs) discharges as a likelihood measure. Single-objective model calibration demonstrated that significant trade-offs exist between different objective functions, and no unique parameter set can optimize all objectives simultaneously. Compared to the solutions of single-objective calibration, all the multi-objective calibration formulations produced relatively accurate and robust results during both model calibration and validation phases. The uncertainty intervals associated with all the trials of single-objective calibration and the SEMO-3D calibration failed to capture observed peaks of the validation events. The uncertainty bands associated with the ensembles of Pareto solutions from the MEMO-3D and MEMO-6D (six-dimensional) calibrations displayed better performance in reproducing and capturing more significant peak validation events. However, to bracket peaks of large flash flood events within the prediction uncertainty intervals, the MEMO-6D optimization outperformed all the single-objective, SEMO-3D, and MEMO-3D multi-objective calibration methods. This study suggests that the MEMO_6D is the best approach for predicting large flood events with lower model output uncertainties when the calibration is performed with a better combination of peak events.

How to cite: Usman, M. N., Leandro, J., Broich, K., and Disse, M.: Single vs. multi-objective optimization approaches to calibrate an event-based conceptual hydrological model using model output uncertainty framework., EGU General Assembly 2024, Vienna, Austria, 14–19 Apr 2024, EGU24-11414, https://doi.org/10.5194/egusphere-egu24-11414, 2024.

EGU24-12676 | ECS | Posters on site | HS3.9

Physics-Informed Ensemble Surrogate Modeling of Advective-Dispersive Transport Coupled with Film Intraparticle Pore Diffusion Model for Column Leaching Test 

Amirhossein Ershadi, Michael Finkel, Binlong Liu, Olaf Cirpka, and Peter Grathwohl

Column leaching tests are a common approach for evaluating the leaching behavior of contaminated soil and waste materials, which are often reused for various construction purposes. The observed breakthrough curves of the contaminants are affected by the intricate dynamics of solute transport, inter-phase mass transfer, and dispersion. Disentangling these interactions requires numerical models. However, inverse modeling and parameter sensitivity analysis are often time-consuming, especially when sorption/desorption kinetics are explicitly described by intra-particle diffusion, requiring the discretization along the column axis and inside the grains. To replace such computationally expensive models, we developed a machine-learning based surrogate model employing two disparate ensemble methods (stacking and weighted distance average) within the defined parameter range based on the German standard for column leaching tests. To optimize the surrogate model, adaptive sampling methods based on three distinct infill criteria are employed. These criteria include maximizing expected improvement, the Mahalanobis distance (exploitation), and maximizing standard deviation (exploration).
The stacking surrogate model makes use of extremely randomized trees and random forest as base- and meta-model. The model shows a very good performance in emulating the behavior of the original numerical model (Relative Root Mean Squared Error = 0.09). 
Our proposed surrogate model has been applied to estimate the complete posterior parameter distribution using Markov Chain Monte Carlo simulation. The impact of individual input parameters on the predictions generated by the surrogate model was analyzed using SHapley Additive exPlanations methods.

How to cite: Ershadi, A., Finkel, M., Liu, B., Cirpka, O., and Grathwohl, P.: Physics-Informed Ensemble Surrogate Modeling of Advective-Dispersive Transport Coupled with Film Intraparticle Pore Diffusion Model for Column Leaching Test, EGU General Assembly 2024, Vienna, Austria, 14–19 Apr 2024, EGU24-12676, https://doi.org/10.5194/egusphere-egu24-12676, 2024.

EGU24-13393 | ECS | Posters on site | HS3.9

Datasets and tools for local and global meteorological ensemble estimation 

Guoqiang Tang, Andrew Wood, Andrew Newman, Martyn Clark, and Simon Papalexiou

Ensemble gridded meteorological datasets are critical for driving hydrology and land models, enabling uncertainty analysis, and supporting a variety of hydroclimate research and applications. The Gridded Meteorological Ensemble Tool (GMET) has been a significant contributor in this domain, offering an accessible platform for generating ensemble precipitation and temperature datasets. The GMET methodology has continually evolved since its initial development in 2006, primarily in the form of a FORTRAN code base, and has since been utilized to generate historical and real-time ensemble meteorological (model forcing) datasets in the U.S. and part of Canada. A recent adaptation of GMET was used to produce multi-decadal forcing datasets for North America and the globe (EMDNA and EM-Earth, respectively). Those datasets have been used to support diverse hydrometeorological applications such as streamflow forecasting and hydroclimate studies across various scales. GMET has now evolved into a Python package called the Geospatial Probabilistic Estimation Package (GPEP), which offers methodological and technical enhancements relative to GMET. These include greater variable selection flexibility, intrinsic parallelization, and especially a broader suite of estimation methods, including the use of techniques from the scikit-learn machine learning library. GPEP enables a wider variety of strategies for local and global estimation of geophysical variables beyond traditional hydrological forcings.  This presentation summarizes GPEP and introduces major open-access ensemble datasets that have been generated with GMET and GPEP, including a new effort to create high-resolution (2 km) surface meteorological analyses for the US. These resources are useful in advancing hydrometeorological uncertainty analysis and geospatial estimation.

How to cite: Tang, G., Wood, A., Newman, A., Clark, M., and Papalexiou, S.: Datasets and tools for local and global meteorological ensemble estimation, EGU General Assembly 2024, Vienna, Austria, 14–19 Apr 2024, EGU24-13393, https://doi.org/10.5194/egusphere-egu24-13393, 2024.

We consider the optimal inference of spatially heterogeneous hydraulic conductivity and head fields based on three kinds of point measurements that may be available at monitoring wells: of head, permeability, and groundwater speed. We have developed a general, zonation-free technique for Monte Carlo (MC) study of field recovery problems, based on Karhunen-Loève (K-L) expansions of the unknown fields, whose coefficients are recovered by an analytical adjoint-state technique. This allows unbiased sampling from the space of all possible fields with a given correlation structure and efficient, automated gradient-descent calibration. The K-L basis functions have a straightforward notion of period, revealing the relationship between feature scale and reconstruction fidelity, and they have an a priori known spectrum, allowing for a non-subjective regularization term to be defined. We have performed automated MC calibration on over 1100 conductivity-head field pairs, employing a variety of point measurement geometries and quantified the mean-squared field reconstruction accuracy, both globally and as a function of feature scale.

We present heuristics for feature scale identification, examine global reconstruction error, and explore the value added by both groundwater speed measurements and by two different types of regularization. We show that significant feature identification becomes possible as feature scale exceeds four times measurement spacing and identification reliability subsequently improves in a power law fashion with increasing feature scale.

How to cite: Hansen, S. K., O'Malley, D., and Hambleton, J.: Feature scale and identifiability: quantifying the information that point hydraulic measurements provide about heterogeneous head and conductivity fields, EGU General Assembly 2024, Vienna, Austria, 14–19 Apr 2024, EGU24-14219, https://doi.org/10.5194/egusphere-egu24-14219, 2024.

EGU24-14805 | Orals | HS3.9

Sensitivity analysis of input variables of a SWAT hydrological model using the machine learning technique of random forest 

Ali Abousaeidi, Seyed Mohammad Mahdi Moezzi, Farkhondeh Khorashadi Zadeh, Seyed Razi Sheikholeslami, Albert Nkwasa, and Ann van Griensven

Sensitivity analysis of complex models, with a large number of input variables and parameters, is time-consuming and inefficient, using traditional approaches. Considering the capability of computing importance indices, the machine learning technique of the Random Forest (RF) is introduced as an alternative to conventional methods of sensitivity analysis. One of the advantages of using the RF model is the reduction of computational costs for sensitivity analysis.

The objective of this research is to analyze the importance of the input variables of a semi-distributed and physically-based hydrological model, namely SWAT (soil and water assessment tool) using the RF model. To this end, an RF-based model is first trained using SWAT input variables (such as, precipitation and temperature) and SWAT output variables (like streamflow and sediment load). Then, using the importance index of the RF model, the ranking of input variables, in terms of their impact on the accuracy of the model results, is determined. Additionally, the results of the sensitivity analysis are examined graphically. To validate the ranking results of the RF-based approach, the parameter ranking results of the Sobol G function, using the RF-based approach and the sensitivity analysis method of Sobol’ are compared. The ranking of the model input variables plays a significant role in the development of models and prioritizing efforts to reduce model errors.

Key words: Sensitivity analysis, model input variables, Machine learning technique, Random forest, SWAT model.

How to cite: Abousaeidi, A., Moezzi, S. M. M., Khorashadi Zadeh, F., Sheikholeslami, S. R., Nkwasa, A., and van Griensven, A.: Sensitivity analysis of input variables of a SWAT hydrological model using the machine learning technique of random forest, EGU General Assembly 2024, Vienna, Austria, 14–19 Apr 2024, EGU24-14805, https://doi.org/10.5194/egusphere-egu24-14805, 2024.

EGU24-16086 | ECS | Posters on site | HS3.9

Disentangling the role of different sources of uncertainty and model structural error on predictions of water and carbon fluxes with CLM5 for European observation sites 

Fernand Baguket Eloundou, Lukas Strebel, Bibi S. Naz, Christian Poppe Terán, Harry Vereecken, and Harrie-Jan Hendricks Franssen

The Community Land Model version 5 (CLM5) integrates processes encompassing the water, energy, carbon, and nitrogen cycles, and ecosystem dynamics, including managed ecosystems like agriculture. Nevertheless, the intricacy of CLM5 introduces predictive uncertainties attributed to factors such as input data, process parameterizations, and parameter values. This study conducts a comparative analysis between CLM5 ensemble simulations and eddy covariance and in-situ measurements, focusing on the effects of uncertain model parameters and atmospheric forcings on the water, carbon, and energy cycles.
Ensemble simulations for 14 European experimental sites were performed with the CLM5-BGC model, integrating the biogeochemistry component. In four perturbation experiments, we explore uncertainties arising from atmospheric forcing data, soil parameters, vegetation parameters, and the combined effects of these factors. The contribution of different uncertainty sources to total simulation uncertainty was analyzed by comparing the 99% confidence
intervals from ensemble simulations with measured terrestrial states and fluxes, using a three-way analysis of variance.
The study identifies that soil parameters primarily influence the uncertainty in estimating surface soil moisture, while uncertain vegetation parameters control the uncertainty in estimating evapotranspiration and carbon fluxes. A combination of uncertainty in atmospheric forcings and vegetation parameters mostly explains the uncertainty in sensible heat flux estimation. On average, the 99% confidence intervals envelope >40% of the observed fluxes, but this varies greatly between sites, exceeding 95% in some cases. For some sites, we could identify model structural errors related to model spin-up assumptions or erroneous plant phenology. The study guides identifying factors causing underestimation or overestimation in the variability of fluxes, such as crop parameterization or spin-up, and potential structural errors in point-scale simulations in CLM5.

How to cite: Eloundou, F. B., Strebel, L., Naz, B. S., Terán, C. P., Vereecken, H., and Hendricks Franssen, H.-J.: Disentangling the role of different sources of uncertainty and model structural error on predictions of water and carbon fluxes with CLM5 for European observation sites, EGU General Assembly 2024, Vienna, Austria, 14–19 Apr 2024, EGU24-16086, https://doi.org/10.5194/egusphere-egu24-16086, 2024.

EGU24-16361 | ECS | Orals | HS3.9

Estimating prior distributions of TCE transformation rate constants from literature data 

Anna Störiko, Albert J. Valocchi, Charles Werth, and Charles E. Schaefer

Stochastic modeling of contaminant reactions requires the definition of prior distributions for the respective rate constants. We use data from several experiments reported in the literature to better understand the distribution of pseudo-first-order rate constants of abiotic TCE reduction in different sediments. These distributions can be used to choose informed priors for these parameters in reactive-transport models.

Groundwater contamination with trichloroethylene (TCE) persists at many hazardous waste sites due to back diffusion from low-permeability zones such as clay lenses. In recent years, the abiotic reduction of TCE by reduced iron minerals has gained attention as a natural attenuation process, but there is uncertainty as to whether the process is fast enough to be effective. Pseudo-first-order rate constants have been determined in laboratory experiments and are reported in the literature for various sediments and rocks, as well as for individual reactive minerals. However, rate constants can vary between sites and aquifer materials. Reported values range over several orders of magnitude.

To assess the uncertainty and variability of pseudo-first-order rate constants, we compiled data reported in several studies. We built a statistical model based on a hierarchical Bayesian approach to predict probability distributions of rate constants at new sites based on this data set. We then investigated whether additional information about the sediment composition at a site could reduce the uncertainty. We tested two sets of predictors: reactive mineral content or the extractable Fe(II) content. Knowing the reactive mineral content reduced the uncertainty only slightly. In contrast, knowing the Fe(II) content greatly reduced the uncertainty because the relationship between Fe(II) content and rate constants is approximately log-log-linear. Using a simple example of diffusion-controlled transport in a contaminated aquitard, we show how the uncertainty in the predicted rate constants affects the predicted remediation times.

How to cite: Störiko, A., Valocchi, A. J., Werth, C., and Schaefer, C. E.: Estimating prior distributions of TCE transformation rate constants from literature data, EGU General Assembly 2024, Vienna, Austria, 14–19 Apr 2024, EGU24-16361, https://doi.org/10.5194/egusphere-egu24-16361, 2024.

Deeper insights on internal model behaviors are essential as hydrological models are becoming more and more complex. Our study provides a framework which combines the time-varying global sensitivity analyses with data mining techniques to unravel the process-level behavior of high-complexity models and tease out the main information. The extracted information is further used to assist parameter identification. The physically-based Distributed Hydrology-Soil-Vegetation Model (DHSVM) set up in a mountainous watershed is used as a case study. Specifically, a two-step GSA including time-aggregated and time-variant approaches are conducted to address the problem of high parameter dimensionality and characterize the time-varying parameter importance. As we found difficulties in interpreting the long-term complicated dynamics, a clustering operation is performed to partition the entire period into several clusters and extract the corresponding temporal parameter importance patterns. Finally, the clustered time clusters are utilized in parameterization, where each parameter is identified in their dominant times. Results are summarized as follows: (1) importance of selected soil and vegetation parameters varies greatly throughout the period; (2) typical patterns of parameter importance corresponding to flood, very short dry-to-wet, fast recession and continuous dry periods are successfully distinguished. We argue that somewhere between “total period” and “continuous discrete time” can be more useful for understanding and interpretation; (3) parameters dominant for short times are much more identifiable when they are identified in dominance time cluster(s); (4) the enhanced parameter identifiability overall improves the model performance according to the metrics of NSE, LNSE, and RMSE, suggesting that the use of GSA information has the potential to provide a better search for optimal parameter sets.

How to cite: Wang, L., Xu, Y., Gu, H., and Liang, X.: Investigating dynamic parameter importance of a high-complexity hydrological model and implications for parameterization, EGU General Assembly 2024, Vienna, Austria, 14–19 Apr 2024, EGU24-18569, https://doi.org/10.5194/egusphere-egu24-18569, 2024.

EGU24-18804 | ECS | Orals | HS3.9

Accelerating Hydrological Model Inversion: A Multilevel Approach to GLUE 

Max Rudolph, Thomas Wöhling, Thorsten Wagener, and Andreas Hartmann

Inverse problems play a pivotal role in hydrological modelling, particularly for parameter estimation and system understanding, which are essential for managing water resources. The application of statistical inversion methodologies such as Generalized Likelihood Uncertainty Estimation (GLUE) is often obstructed, however, by high model computational cost given that Monte Carlo sampling strategies often return a very small fraction of behavioural model runs. There is a need, however, to balance this aspect with the demand for broadly sampling the parameter space. Especially relevant for spatially distributed or (partial) differential equation based models, this aspect calls for computationally efficient methods of statistical inference that approximate the “true” posterior parameter distribution well. Our study introduces multilevel GLUE (MLGLUE), which effectively mitigates these computational challenges by exploiting a hierarchy of models with different computational grid resolutions (i.e., spatial or temporal discretisation), inspired by multilevel Monte Carlo strategies. Starting with low-resolution models, MLGLUE only passes parameter samples to higher-resolution models for evaluation if associated with a high likelihood, which poses a large potential for substantial computational savings. We demonstrate the applicability of the approach using a groundwater flow model with a hierarchy of different spatial resolutions. With MLGLUE, the computation time of parameter inference could be reduced by more than 60% compared to GLUE, while the resulting posterior distributions are virtually identical. Correspondingly, the uncertainty estimates of MLGLUE and GLUE are also very similar. Considering the simplicity of the implementation as well as its efficiency, MLGLUE promises to be an alternative for statistical inversion of computationally costly hydrological models.

How to cite: Rudolph, M., Wöhling, T., Wagener, T., and Hartmann, A.: Accelerating Hydrological Model Inversion: A Multilevel Approach to GLUE, EGU General Assembly 2024, Vienna, Austria, 14–19 Apr 2024, EGU24-18804, https://doi.org/10.5194/egusphere-egu24-18804, 2024.

EGU24-19966 | Orals | HS3.9

Operational Sensitivity Analysis for Flooding in Urban Systems under Uncertainty 

Aronne Dell'Oca, Monica Riva, Alberto Guadagnini, and Leonardo Sandoval

The runoff process in environmental systems is influenced by various variables that are typically are affected by uncertainty. These include, for example, climate and hydrogeological quantities (hereafter denoted as environmental variables). Additionally, the runoff process is influenced by quantities that are amenable to intervention/design (hereafter denoted as operational variables) and can therefore be set to desired values on the basis of specific management choices. A key question in this context is: How do we discriminate the impact of operational variables, whose values can be decided in the system design or management phase, on system outputs considering also the action of uncertainty associated with environmental variables? We tackle this issue upon introducing a novel approach which we term Operational Sensitivity Analysis (OSA) and set within a Global Sensitivity Analysis (GSA) framework. OSA enables us to assess the sensitivity of a given model output specifically to operational factors, while recognizing uncertainty in the environmental variables. This approach is developed as a complement to a traditional GSA, which does not differentiate at the methodological level the nature of the type of variability associated with operational or environmental variables.

We showcase our OSA approach through an exemplary scenario associated with a urban catchment where flooding results from sewer system failure. In this context, we distinguish between operational variables, such as sewer system pipe properties and urban area infiltration capacity, and environmental variables such as, urban catchment drainage properties and rain event characteristics. Our results suggest that the diameter of a set of pipes in the sewer network is the most influential operational variable. As such, it provides a rigorous basis upon which one could plan appropriate actions to effectively manage the system response.

How to cite: Dell'Oca, A., Riva, M., Guadagnini, A., and Sandoval, L.: Operational Sensitivity Analysis for Flooding in Urban Systems under Uncertainty, EGU General Assembly 2024, Vienna, Austria, 14–19 Apr 2024, EGU24-19966, https://doi.org/10.5194/egusphere-egu24-19966, 2024.

EGU24-20013 | ECS | Orals | HS3.9

Field-scale soil moisture predictions using in situ sensor measurements in an inverse modelling framework: SWIM² 

Marit Hendrickx, Jan Diels, Jan Vanderborght, and Pieter Janssens

With the rise of affordable, autonomous sensors and IoT (Internet-of-Things) technology, it is possible to monitor soil moisture in a field online and in real time. This offers opportunities for real-time model calibration for irrigation scheduling. A framework is presented where realtime sensor data are coupled with a soil water balance model to predict soil moisture content and irrigation requirements at field scale. SWIM², Sensor Wielded Inverse Modelling of a Soil Water Irrigation Model, is a framework based on the DREAM inverse modelling approach to estimate 12 model parameters (soil and crop growth parameters) and their uncertainty distribution. These parameter distributions result in soil moisture predictions with a prediction uncertainty estimate, which enables a farmer to anticipate droughts and estimate irrigation requirements.

The SWIM² framework was validated based on three growing seasons (2021-2023) in about 30 fields of vegetable growers in Flanders. Kullback–Leibler divergence (KLD) was used as a metric to quantify information gain of the model parameters starting from non-informative priors. Performance was validated in two steps, i.e. the calibration period and prediction period, which is in correspondence with the real-world implementation of the framework. The RMSE, correlation (R, NSE) and Kling-Gupta efficiency (KGE) of soil moisture were analyzed in function of time, i.e. the amount of available sensor data for calibration.

Soil moisture can be predicted accurately after 10 to 20 days of sensor data is available for calibration. The RMSE during the calibration period is generally around 0.02 m³/m³, while the RMSE during the prediction period decreases from 0.04 to 0.02 m³/m³ when more calibration data is available. Information gain (KLD) of some parameters (e.g. field capacity and curve number) largely depends on the presence of dynamic events (e.g. precipitation events) during the calibration period. After 40 days of sensor data, the KGE and Pearson correlation of the calibration period become stable with median values of 0.8 and 0.9, respectively. For the validation period, the KGE and Pearson correlation are increasing in time, with median values from 0.3 to 0.7 (KGE) and from 0.7 to 0.95 (R). These good results show that, with this framework, we can simulate and predict soil moisture accurately. These predictions can in turn be used to estimate irrigation requirements.

Precipitation radar data was primarily considered as an input without uncertainty. As an extension, precipitation forcing error can be treated in DREAM by applying rainfall multipliers as additional parameters that are estimated in the inverse modelling framework. The multiplicative error of the radar data was quantified by comparison of radar data to rain gauge measurements. The prior uncertainty of the logarithmic multipliers was described by a Laplace distribution and was implemented in DREAM. The extended framework with rainfall multipliers shows better convergence and acceptance rate compared to the main framework. The calibration period shows better performance with higher correlations and lower RMSE values, but a decrease in performance was found for the validation period. These results suggest that the implementation of rainfall multipliers leads to overfitting, resulting in lower predictive power.

How to cite: Hendrickx, M., Diels, J., Vanderborght, J., and Janssens, P.: Field-scale soil moisture predictions using in situ sensor measurements in an inverse modelling framework: SWIM², EGU General Assembly 2024, Vienna, Austria, 14–19 Apr 2024, EGU24-20013, https://doi.org/10.5194/egusphere-egu24-20013, 2024.

In recent years, Machine Learning (ML) models have led to a substantial improvement in hydrological predictions. It appears these models can distill information from catchment properties that is relevant for the relationship between meteorological drivers and streamflow, which has so far eluded hydrologists.
In the first part of this talk, I shall demonstrate some of our attempts towards understanding these improvements. Utilising Autoencoders and intrinsic dimension estimators, we have shown that the wealth of available catchment properties can effectively be summarised into merely three features, insofar as they are relevant for streamflow prediction. Hybrid models, which combine the flexibility of ML models with mechanistic mass-balance models, are equally adept at predicting as pure ML models but come with only a few interpretable interior states. Combining these findings will, hopefully, bring us closer to understanding what these ML models seem to have 'grasped'.
In the second part of the talk, I will address the issue of uncertainty quantification. I contend that error modelling should not be attempted on the residuals. Rather, we should model the errors where they originate, i.e., on the inputs, model states, and/or parameters. Such stochastic models are more adept at expressing the intricate distributions exhibited by real data. However, they come at the cost of a very large number of unobserved latent variables and thus pose a high-dimensional inference problem. This is particularly pertinent when our models include ML components. Fortunately, advances in inference algorithms and parallel computing infrastructure continue to extend the limits on the number of variables that can be inferred within a reasonable timeframe. I will present a straightforward example of a stochastic hydrological model with input uncertainty, where Hamiltonian Monte Carlo enables a comprehensive Bayesian inference of model parameters and the actual rain time-series simultaneously.

How to cite: Albert, C.: Advances and prospects in hydrological (error) modelling, EGU General Assembly 2024, Vienna, Austria, 14–19 Apr 2024, EGU24-20170, https://doi.org/10.5194/egusphere-egu24-20170, 2024.

HS4 – Hydrological forecasting

EGU24-407 | ECS | PICO | HS4.1

Comprehensive flood risk assessment of urban flooding based on the 1D/2D coupled hydrodynamic model 

Boliang Dong, Bensheng Huang, Chao Tan, Shuailing Gao, and Junqiang Xia

In urban environments, urban flooding can lead to significant economic losses due to high population density and valuable economic properties. The complexity of urban flood disasters and the diverse entities affected present substantial challenges for accurate flood risk assessment. In response to this critical need, we have developed a comprehensive urban flood risk assessment method that evaluates the flood risk for primary affected entities, including residents' lives, ground buildings, and underground spaces. This proposed assessment method is based on both scenario analysis and the index system method. Initially, it predicts the disaster-causing hydraulic characteristics, such as water depth, flow velocity, and building inundation, using a high-performance 1D/2D coupled urban flood hydrodynamic model. Subsequently, it assesses the flood risk of disaster-affected objects, such as people, ground buildings, and underground spaces, based on hazard, vulnerability, and exposure indices. We successfully applied this comprehensive urban flood risk assessment method to a highly developed urban area in Wuhan City, China. To address the challenge of data acquisition, we utilized web crawling to gather information on industrial distribution, property prices, and shop rents to support flood risk analysis. The flooding process and corresponding risk levels of primarily affected objects under different rainfall return period scenarios were comprehensively evaluated. The established model can serve as a reference for disaster prevention and reduction technologies for other cities threatened by urban flood disasters.

How to cite: Dong, B., Huang, B., Tan, C., Gao, S., and Xia, J.: Comprehensive flood risk assessment of urban flooding based on the 1D/2D coupled hydrodynamic model, EGU General Assembly 2024, Vienna, Austria, 14–19 Apr 2024, EGU24-407, https://doi.org/10.5194/egusphere-egu24-407, 2024.

Hydrological modelling is an important tool for understanding and predicting runoff behaviour in catchments. It is essential for flood risk management and flood forecasting. This study conducts a comparative analysis of two modelling approaches: a Long Short-Term Memory (LSTM) neural network model and a conventional rainfall-runoff model. Both models are used to simulate runoff dynamics in a catchment in Bavaria, Germany.

LSTM models are known for their ability to capture temporal dependencies and nonlinear relationships in sequential data. This research aims to comprehensively evaluate and compare the performance, accuracy, and predictive capabilities of the physical rainfall-runoff model widely used in hydrology against the LSTM model. The objective is to replicate the intricate processes governing rainfall-induced runoff. This study analyses the ability of the LSTM model to predict runoff patterns by leveraging historical hydrological data and meteorological inputs. The model learns from temporal sequences of precipitation and other relevant factors. The traditional rainfall-runoff model, which operates on established hydrological principles and parameterizations, is also assessed for its accuracy in simulating runoff within the same catchment. The comparison includes assessments of prediction accuracy, model robustness under varying conditions, computational efficiency, and the ability to capture the complex non-linear relationships inherent in hydrological processes.

The results of this study have important implications for the further development of hydrological modelling techniques. Understanding the comparative strengths and limitations of the LSTM model against the conventional rainfall-runoff model provides valuable insights for improving the accuracy and reliability of runoff predictions. Such information can improve decision making in flood risk management, assist in more accurate flood forecasting and help reduce the loss of human life. By identifying the comparative effectiveness of these modelling approaches in reproducing the complex dynamics of runoff, this research aims to advance the field of hydrological modelling and pave the way for more robust and accurate prediction tools.

How to cite: Hotzel, A. and Mudersbach, C.: Comparative Analysis of a LSTM and a Rainfall-Runoff Model for Catchment Runoff Simulation: Advancing Hydrological Modelling and Forecasting, EGU General Assembly 2024, Vienna, Austria, 14–19 Apr 2024, EGU24-1734, https://doi.org/10.5194/egusphere-egu24-1734, 2024.

EGU24-2485 | ECS | PICO | HS4.1

India-wide Extreme Rainfall Driven Flood Hazard Forecasting 

Ankan Chakraborty, Subimal Ghosh, and Subhankar Karmakar

In recent decades, the frequency and intensity of extreme precipitation events has increased worldwide as a result of climate change. It is necessary to set up early warning systems to enable effective disaster prevention in flood-prone areas. Despite efforts to develop modern forecasting systems for extreme precipitation, there are still problems such as low hit rates, high false alarms and spatio-temporal distortions. In particular, the crucial aspect of forecasting rainfall risk at the national level for India has not been addressed in the existing literature. In this study, an attempt is made to predict the flood hazards caused by extreme rainfall by estimating the probability of occurrence of an extreme rainfall event based on the predicted rainfall values with a certain lead time. The hazard model is based on the conditional probability of historical observed and predicted rainfall data. In applying the method in India, reliable data sources are used, including observed gridded precipitation data from the India Meteorological Department (IMD) and forecast precipitation from the Global Ensemble Forecast System (GEFS) Reforecast Version 2 for the period from 1985 to 2018 (34 years). Extreme precipitation days are identified as those that exceed the 95th percentile value for a given grid. Hazard assessments are carried out at grid level for lead times of 1, 3, 5, 10 and 15 days. The resulting hazard maps are consistent with the observed rainfall patterns confirmed by the recent rainfall-induced floods in India. This model gives stakeholders the ability to identify regions that are at risk in the near future (weeks). This facilitates proactive evacuation and mitigation planning prior to the occurrence of extreme rainfall events.

How to cite: Chakraborty, A., Ghosh, S., and Karmakar, S.: India-wide Extreme Rainfall Driven Flood Hazard Forecasting, EGU General Assembly 2024, Vienna, Austria, 14–19 Apr 2024, EGU24-2485, https://doi.org/10.5194/egusphere-egu24-2485, 2024.

EGU24-3652 | ECS | PICO | HS4.1

SWM: a Stochastic Weather Model for precipitation-related hazard assessments using ERA5-land data 

Melody Whitehead and Mark Bebbington

Long-term hazard and risk assessments are produced by combining many hazard-model simulations, each based on a slightly different set of inputs to cover the uncertainty space. While most input parameters for these models are relatively well-constrained, atmospheric parameters remain problematic unless working on very short-time scales (hours to days). Precipitation is a key trigger for many natural hazards including floods, landslides, and lahars. This work presents a stochastic weather model that takes openly available ERA5-land data, and produces long-term (e.g., decadal), hourly, spatially varying precipitation data that mimics the statistical dimensions of real-data. Thus, allowing precipitation to be robustly included in hazard-model simulations.

The stochastic weather model (SWM) comprises three steps: Data conversion, block construction, and stochastic weather generation. Due to the relative simplicity of the model and exploiting some coding efficiencies in the R package dplyr, 10 years of hourly data can be generated across a 10 by 10 cell grid (~110 km by 110 km) on a standard desktop computer in < 5 seconds.

How to cite: Whitehead, M. and Bebbington, M.: SWM: a Stochastic Weather Model for precipitation-related hazard assessments using ERA5-land data, EGU General Assembly 2024, Vienna, Austria, 14–19 Apr 2024, EGU24-3652, https://doi.org/10.5194/egusphere-egu24-3652, 2024.

EGU24-5139 | ECS | PICO | HS4.1

A Time-Space varying Distributed Unit Hydrograph (TS-DUH) for lare-scale operative flash flood forecast 

Ying Hu, Huan Wu, Weitian Chen, Chaoqun Li, Wei Wu, Zequn Huang, Lulu Jiang, and Zhijun Huang

Increasing threats of flash flood call for effective and operative ways to offer accurate forecasting and warning. In this study, a Time-Space varying Distributed Unit Hydrograph (TS-DUH) based on publicly-available-only data is proposed for efficient flash flood forecasting. As in the traditional spatially distributed unit hydrograph (SDUH) method, TS-DUH initially estimates the runoff travel time (and flow velocity) from each location within a catchment to the outlet based on topographic and hydroclimate characteristics. However, the delineation of the runoff-drainage process is further adjusted by considering the heterogeneous and dynamic runoff contribution caused by rainfall and soil moisture variations. The excess rainfall is estimated by the widely used Global Flood Monitoring System (GFMS) which provides long-term (2000-present) well-archived and real-time operative global runoff datasets from a state-of-the-art DRIVE model (DRIVE-Runoff). An alternative excess rainfall input is taken from the Soil Conservation Service's curve number method (CN-Runoff). The performance of the TS-GUH method is evaluated using 6,324 flash flood events of 281 small-to-medium-sized catchments in the CONUS, with 1,686 events used for calibration. The validation results show that using DRIVE-Runoff is better than CN-Runoff, 99% and 71% of events have KGE values greater than 0 and 0.5, respectively, with a median KGE value of 0.6 and the probability of detection (POD) of flood events 0.9. More importantly, using near real-time satellite rainfall-driven DRIVE-Runoff, long-term flow simulation (2003-2020) without calibration at 803 gauges shows better performance of TS-DUH than the original GFMS, with a median KGE improvement of 0.15. This combined UH and numerical hydrological model approach showed great potential for flash food monitoring and forecasting at regional or global scales.

How to cite: Hu, Y., Wu, H., Chen, W., Li, C., Wu, W., Huang, Z., Jiang, L., and Huang, Z.: A Time-Space varying Distributed Unit Hydrograph (TS-DUH) for lare-scale operative flash flood forecast, EGU General Assembly 2024, Vienna, Austria, 14–19 Apr 2024, EGU24-5139, https://doi.org/10.5194/egusphere-egu24-5139, 2024.

EGU24-6111 | ECS | PICO | HS4.1

Improving rain cell tracking for convective rainfall nowcasting: a two-stage analogue model approach 

Zhou Shu, Christian Onof, and Lipen Wang

Rain cell tracking methods are essential to the object-based rainfall nowcasting of convective storms. These methods identify rain cells from radar images and the tracks associate cells between any two successive time steps. Based upon the identified cells and tracks, the positions of the cells in the next few time steps can be forecasted. Many existing nowcasting methods assume Lagrangian persistence. That is, they generally lack the mechanisms to predict the temporal evolution of cell properties and their types. This deficiency may have a great impact to the accuracy of the convective storm nowcasting. To improve cell tracking methods, a two-stage analogue model is proposed to address the limits of existing cell tracking methods.

  • Predicting cell type: three machine learning classifiers –KNN, logistic regression and random forest—are employed to predict the cell types based on rain cell properties.
  • Predict temporal evolution of cell properties: an ensemble forecast (0-1h lead times) of cell mean intensity, maximum intensity, size and major axis length is obtained using an analogue method. This method assumes that rainfall cells with similar conditions will evolve similarly. Analogues are chosen based on the predicted cell type from the previous step.

In this study, a dataset of rainfall cells from a total of 165 convective storms between 2005 and 2017 is used. These rainfall cells are identified using enhanced TITAN. The study area is centred at Birmingham city, with an area of 512 × 512 km². Results show that the random forest classifier has the best performance in predicting track types. As the temporal profile of the selected cell properties is incorporated into the prediction process, the prediction accuracy of the random forest classifier can be higher than 80%. Results also show that predicting cell type prior to the selection of analogues improves the forecasting of temporal evolution of cell properties at a lead time of 5 minutes. Overall, the analogue method enhances the prediction of temporal evolution of cell properties compared with assuming Lagrangian persistence. At the moment, cell types are predicted for a 5-minute lead time.

How to cite: Shu, Z., Onof, C., and Wang, L.: Improving rain cell tracking for convective rainfall nowcasting: a two-stage analogue model approach, EGU General Assembly 2024, Vienna, Austria, 14–19 Apr 2024, EGU24-6111, https://doi.org/10.5194/egusphere-egu24-6111, 2024.

EGU24-7639 | PICO | HS4.1

Towards enhancing flood preparedness and early warning: a comparative study of 2D high-resolution simulations of the 2021 Ahr floods 

Daniel Caviedes-Voullième, Shahin Khosh Bin Ghomash, and Heiko Apel

The escalating frequency and severity of flash floods have heightened concerns, presenting a unique challenge compared to traditional fluvial flooding. Unlike large-scale fluvial events, managing flash flood risks through infrastructure approaches is less effective. Early warning systems emerge as crucial components in responding to these rapid and intense floods. For a response to be effective, an early warning system must provide stakeholders with sufficient actionable information about the imminent flood and lead time, underscoring the need for computational flood forecasting models.

Hydrodynamic models, which shine for their accuracy in predicting floods in complex topographies and urban environments affected by flash floods, face a drawback—they are computationally intensive, potentially limiting their application in early warning systems.

This contribution delves into the utilisation of two 2D flood forecasting models: the local-inertia solver RIM2D and the full shallow water equation solver SERGHEI. To minimise runtime, both solvers are implemented to run on GPUs, with a focus on maximising forecast lead time. RIM2D, less computationally intensive than SERGHEI, is expected to be well-suited for this purpose. On the other hand, to offset the higher computational cost, SERGHEI allows for multi-GPU use, specifically tailored for large-scale High-Performance Computing (HPC) systems.

The study assesses the applicability and trade-offs associated with these solvers, concentrating on the flood event in the Eifel in 2021, with a specific focus on the lower Ahr valley—from Altenahr to the Rhine. Simulations with identical conditions are conducted using both solvers, spanning resolutions from 1m to 10m. Evaluation criteria include accuracy in terms of maximum flood levels and computational performance in terms of required resources and runtime, and we explore the nature of the differences of the results produced by both solvers and their potential implications for flood forecasting and early warning.

Results indicate that at coarser resolutions, both solvers yield similar accuracy. Discrepancies emerge at higher resolutions due to the distinct mathematical formulations. Computational costs escalate rapidly with resolution for both solvers. Notably, for resolutions equal to or coarser than 5m, flood forecasts are at least 75 times faster than real-time. This efficiency makes them suitable for augmenting existing operational flood forecast systems but retaining excellent lead times, thus, enabling detailed flood impact forecasting and immediate responses. 

However, at higher resolutions, the computational demands exceed the capacity of a single scientific-grade GPU, necessitating multi-GPU implementations and some HPC capabilities for operational use. While such high(er) resolution models may seem excessive for managing specific flood events, they underscore the growing need for state-of-the-art scientific software and HPC technology in addressing larger flood domains.

How to cite: Caviedes-Voullième, D., Khosh Bin Ghomash, S., and Apel, H.: Towards enhancing flood preparedness and early warning: a comparative study of 2D high-resolution simulations of the 2021 Ahr floods, EGU General Assembly 2024, Vienna, Austria, 14–19 Apr 2024, EGU24-7639, https://doi.org/10.5194/egusphere-egu24-7639, 2024.

EGU24-8697 | PICO | HS4.1

Reproducing flash flood warnings with Machine Learning 

Oleg Zlydenko, Deborah Cohen, Martin Gauch, Adi Gerzi Rosenthal, Frederik Kratzert, Grey Nearing, Guy Shalev, and Oren Gilon

Flash floods account for a large proportion of flood-based fatalities, and they are becoming more frequent due to climate change. A global flash flood warning system therefore has the potential to be life saving.
Standard approaches to flash flood forecasting – such as the Flash Flood Guidance (FFG) system in the US National Weather Service (NWS), or the European Runoff Index based on Climatology (ERIC) in the European Flood Awareness System (EFAS) – are utilizing recent weather and soil conditions, physiographic characteristics of basins, and weather forecasts, in order to produce a forecast for possible flash floods. These forecasts are not disseminated directly to the public. Instead, they are firstly refined by hydrologists that have intimate knowledge of the relevant basins and of previous flood events. This introduces a difficulty to scaling these methods worldwide, as the training of professional hydrologists in every region is costly and time consuming.
Recent applications of Machine Learning (ML) to hydrology show that a learning system has the potential to train on data-rich basins and generalize to data-poor basins, with a skill that is comparable to state of the art hydrological models. 
In this work we attempt to build a ML model to produce daily flash flood forecasts, based on globally available weather reanalysis and physiographic characteristics from HydroATLAS. We discuss the model architecture, and evaluate it against NWS Flash Flood Warnings (FFW). While such models may not surpass the skill of a professional hydrologist, they have the potential to provide reasonable warnings in regions that do not currently have any such system in place.

How to cite: Zlydenko, O., Cohen, D., Gauch, M., Gerzi Rosenthal, A., Kratzert, F., Nearing, G., Shalev, G., and Gilon, O.: Reproducing flash flood warnings with Machine Learning, EGU General Assembly 2024, Vienna, Austria, 14–19 Apr 2024, EGU24-8697, https://doi.org/10.5194/egusphere-egu24-8697, 2024.

Local rainfall events, especially those with high precipitation levels in a short period of time, can cause extreme runoff in their associated catchment areas. The high variability of rainfall and runoff events makes it difficult to accurately calculate the risk of flooding. To improve the assessment of individual rainfall-runoff events, it is essential to analyze their frequency, intensity and the complex relationship between rainfall and runoff. This analysis leads to a better understanding of the involved processes, enabling more precise modeling and earlier recognition and prediction of runoff events.

This study focuses on the Hannover radar range, which is primarily located in Lower Saxony, Germany. The rainfall events resulting from the radar data from the German Weather Service are classified into convective, stratiform and mixed rainfall based on their intensity, areal extent and duration. The associated rainfall-runoff events of various catchments in Lower Saxony will be further classified into three categories: long-rain floods, short-rain floods and flash floods.

The results of this study are expected to demonstrate the relationship between rainfall and runoff events including the frequency of different types of rainfall-runoff events. Additionally, the study aims to identify the type of rainfall responsible for extreme rainfall-runoff events. The analysis will also consider the influence of catchment characteristics and initial conditions on the runoff.

How to cite: Brandt, A. and Haberlandt, U.: Classification of Rainfall-Runoff Events for Flood Analysis and Forecasting in Lower Saxony, Germany, EGU General Assembly 2024, Vienna, Austria, 14–19 Apr 2024, EGU24-10005, https://doi.org/10.5194/egusphere-egu24-10005, 2024.

EGU24-10524 | ECS | PICO | HS4.1

Flash Flood Prediction with Neural Networks using Ensemble Methods to address Input and Model Uncertainties 

Arne Reinecke, Insa Neuweiler, Andreas Steinbrich, Hannes Leistert, Andreas Hänsler, Markus Weiler, Thomas Brendt, and Bettina Huth

Short-term flood and inundation forecasts, especially for spatially limited, convective heavy rainfall events, are challenging due to the very short lead time of heavy rainfall predictions. They are subject to different uncertainties. Due to the short forecasting period, data-driven machine learning methods have been developed to predict the inundated areas in almost real time. The time-consuming numerical, hydrodynamic simulation of flooding depths and flow velocities is replaced by a surrogate model.

We use a neural network as surrogate model, which is trained with a large ensemble of hydrodynamically simulated water levels and flow velocities for a specific catchment using an ensemble of spatial and temporal surface runoff. The surface runoff is calculated by the hydrological model RoGeR at a 5 m resolution and spatial and temporal varying heavy rainfall events as input. The neural networks are able to predict spatially resolved maximum water depths, maximum discharges and maximum flow velocities for an event in the specific catchment area of 25km² in significantly less than one second.

The fast prediction time allows to consider uncertainties in the forecast. Uncertainties in flood forecasts typically result mainly from uncertain precipitation input (or forecast), initial conditions (e.g. soil moisture), lack of data of relevant parameters or their limited transferability in space. Although the model error of the hydrological and hydraulic model itself, such as assumptions about geometry and parameters or underlying flow equations, is an important source of uncertainty, we address in this presentation only the uncertainties of input and initial conditions.

To generate ensemble calculations that represent the probability distribution of predicted flood height and velocity, we create a large ensemble of input variables by statistically varying the initial soil moisture as well as the location and intensity of the precipitation fields. Since the trained neural network topology is another source of uncertainty, differently trained networks with different network topologies are also considered in the ensembles.

Using the ensembles, we can specify prediction intervals for spatially resolved maximum water levels, maximum discharge and flow velocities, which result from the uncertainty of the model input, model parameters and the inaccuracy of the surrogate model. Using the ensemble approach, we discuss the impact of the different sources of uncertainty on the predictions.

As an example, it is found that the statistical variation of the meteorological input data has a greater influence on the prediction interval width than the statistical variation of the initial soil moisture. In general, it can be concluded that sufficient variability in the training data needs to be covered to make reasonable uncertainty predictions.

How to cite: Reinecke, A., Neuweiler, I., Steinbrich, A., Leistert, H., Hänsler, A., Weiler, M., Brendt, T., and Huth, B.: Flash Flood Prediction with Neural Networks using Ensemble Methods to address Input and Model Uncertainties, EGU General Assembly 2024, Vienna, Austria, 14–19 Apr 2024, EGU24-10524, https://doi.org/10.5194/egusphere-egu24-10524, 2024.

Floods are one of the most dangerous and disastrous natural hazards that cause economic damages and human loss. In particular, flash floods related to heavy precipitation represent a major hazard on the French Eastern Mediterranean coast where growing population and tourism increase the exposure and vulnerability of coastal cities to extreme events. A few well recorded severe events have demonstrated the vulnerability of this area to river floods during the last 15 years. Consequently, various modelling approaches has been recently proposed to support flood prevention and mitigation in urban region. However, mapping floods events with limited computational costs remains challenging. In this study, four open-source numerical flood mapping tools are compared regarding their ability at simulating past flood events over five catchments in the southeastern region of France. The flood mapping models range from the simple Height Above Nearest Drainage approach (MHYST) to more complex methods that solve the full shallow water equations (LISFLOOD-FP DG2). Models of intermediate complexity, such as a 1D shallow water solver (HEC-RAS) and a 2D cellular automata (CAflood), are also included. Model evaluations are performed based on water depth accuracy estimation against high water marks data. The flood mapping tools are also compared in terms of flood extent using critical success indices. This study outlines how the more complex models provide the more accurate and realistic flood simulations, however with high computationally demanding which requires the deployment of substantial computer resources before their use in operational flood systems.

How to cite: Royer-Gaspard, P., Troin, M., and Fox, D.: Balancing simplicity with efficiency: a comparison of river flood mapping models on past events on the French Mediterranean coast, EGU General Assembly 2024, Vienna, Austria, 14–19 Apr 2024, EGU24-10666, https://doi.org/10.5194/egusphere-egu24-10666, 2024.

EGU24-12249 | PICO | HS4.1 | Highlight

Impact-based forecasting for convective rainfall: a new approach combining rainfall ensembles and hazard impacts 

Michael Cranston, Jamie Rae, Steven J. Cole, Seonaid Anderson, Gemma Nash, Kevin Black, Robert J. Moore, and Nigel Roberts

PREDICTOR (PREDICTing flooding impacts from cOnvective Rainfall) has been developed to improve the approach to forecasting the impacts of surface water flooding. PREDICTOR is a next generation decision-support tool that utilises the latest Met Office convective precipitation ensemble forecasting capabilities and Scotland’s National Flood Risk Assessment (NFRA) flood maps.

The Impact-based Forecasting (IbF) approach of PREDICTOR combines the likelihood ("the chance") of flood-producing rainfall (from the Met Office ensemble forecasts) and the potential impact (from NFRA) to produce "Flood Risk" forecasts. The precipitation forecast product used is the Best Short Range (BSR) ensemble from the Met Office (MOGREPS-UK). 15-minute precipitation accumulations are available, extending out to ~32 hours and issued 4 times a day with 24 ensemble members. The NFRA  surface water flooding maps have been generated using design rainfall inputs from the Flood Estimation Handbook (FEH) plus outputs from a number of different flood modelling studies, and used to consider property and road impacts. 

Neighbourhood or ‘in-vicinity’ post processing of precipitation forecasts is performed to calculate exceedance probability (or ensemble confidence) of the forecast rainfall that would lead to surface water flooding impacts. This is calculated on a 10km grid basis across Scotland to provide individual gridded risk assessments of the likelihood and impact of flooding. The web-based system has been successfully used by SEPA forecasters during 2023 and in partnership with Transport Scotland to assess the value of predicting the risk on the trunk road network.

How to cite: Cranston, M., Rae, J., Cole, S. J., Anderson, S., Nash, G., Black, K., Moore, R. J., and Roberts, N.: Impact-based forecasting for convective rainfall: a new approach combining rainfall ensembles and hazard impacts, EGU General Assembly 2024, Vienna, Austria, 14–19 Apr 2024, EGU24-12249, https://doi.org/10.5194/egusphere-egu24-12249, 2024.

EGU24-12956 | ECS | PICO | HS4.1 | Highlight

The development and evaluation of a seamless rainfall forecasting system for Ghana using Meteosat data and the GFS model. 

Vera Glas, Dorien Lugt, Ruud Hurkmans, Martijn Booij, Tom Rientjes, Ruben Imhoff, and Frank Annor

There is an urgent need for reliable now- and forecasting of (extreme) precipitation on the African continent. Early warning for extreme rainfall contributes to disaster preparedness and can decrease the associated risks. Moreover, reliable, and seamless precipitation data are of high value for (hydrological) flood models. Flash floods are often caused by intense and localized rainfall over a short period of time. Timely anticipation on the highly dynamic causes of flashfloods requires precipitation data with a high temporal resolution as well as short lead times. The lack of ground-based radar stations on the African continent hinders the availability of such precipitation data and leaves many regions prone to high risks associated with extreme precipitation.

Numerical Weather Predication (NWP) models provide valuable information concerning precipitation forecasting. However, due to large computational demands NWP models are commonly not applicable for short lead times. Nowcasting methods which extrapolate observations show skillful lead times of 0-4 hours. Nevertheless, a significant decrease in skill is observed for longer lead times. Efforts by Imhoff et al., (2023), Radhakrishnan & Chandrasekar, (2020) and Nerini et al., (2019) show promising results using a blending approach which incorporates extrapolation based nowcast data derived from ground-radar and NWP-data.

The high spatio-temporal resolution of Meteosat data (15 minutes and 3 km) in combination with its relative short latency offers potential to partly overcome the shortage of ground-based radar data on the African continent. This research evaluates the applicability and accuracy of precipitation nowcasts based on Meteosat data. For these analyses the open-source Python nowcasting environment Pysteps is utilized. As rainfall retrieval algorithm, the Cloud Physical Properties (MSG-CPP) model, as developed by the Royal Dutch Meteorological institute (KNMI), is applied.

Additionally, this research explores the possibility for blended ensemble precipitation now- and forecasting, combining NWP forecasts with satellite-based observation extrapolations. Meteosat data and the open-source Global Forecast System (GFS) are used as input for this blended precipitation model. Ground measurement data collected by the Trans-African Hydro-Meteorological Observatory (TAHMO) organization is utilized to evaluate the performance of the nowcasting products.

For this study, Ghana is selected as case study area. Ghana has a tropical climate which is strongly influenced by West African monsoon winds. On a yearly basis, (flash) floods cause fatalities and large social-economic damages. This stresses the urgent need for disaster risk management actions wherein access to seamless precipitation now- and forecast models is of high value. The data sources used in this research are all openly available for the complete African continent. By solely utilizing open data sources with short latencies, this research aims to contribute to operational and open access of seamless precipitation now- and forecasts. These efforts are in line with the Early Warning for All initiative as called for by the United National Secretary-General in 2022.

How to cite: Glas, V., Lugt, D., Hurkmans, R., Booij, M., Rientjes, T., Imhoff, R., and Annor, F.: The development and evaluation of a seamless rainfall forecasting system for Ghana using Meteosat data and the GFS model., EGU General Assembly 2024, Vienna, Austria, 14–19 Apr 2024, EGU24-12956, https://doi.org/10.5194/egusphere-egu24-12956, 2024.

EGU24-15119 | ECS | PICO | HS4.1

Compound heavy rainfall and river flood events in small catchments 

Felix Simon and Christoph Mudersbach

Heavy rainfall and flooding are extreme events with high hazard and risk potential for people and the environment. While there has been extensive research on the individual events of heavy rainfall and flooding, there is still a significant need for research into their combination. Analysing them separately may lead to an underestimation of the hazards and risks involved. Especially in small catchment areas or headwater catchments, a heavy rainfall event can cause flash flooding and a flood event in a river simultaneously. The relationship between the investigated area and its associated hydrological catchment area is crucial. In such areas, classic flood protection measures may not always be the most sensible option. Targeted measures and precautions must be taken, and knowledge of these events is of great importance.

Analyses are carried out to understand the relationship between combined heavy rainfall and flood events and the characteristics of the study area. For this purpose, we use precipitation radar data from the German Weather Service (RADKLIM, 5 min & 1x1 km) and discharge data from water gauges provided by the NRW State Office for Nature, Environment and Consumer Protection, as well as various water associations. The data is used to generate area averages of precipitation of various durations for the catchment areas under investigation. The compound events are analysed using value pairs, which are defined based on AMAX or threshold values. Statistical extreme value analyses were conducted on individual events using different extreme value distributions, including the metastatic and general extreme value distributions. These analyses were necessary to determine the probabilities of compound events such as heavy rainfall and flooding, with the aid of copula functions. The joint occurrence probabilities and correlation between precipitation and runoff events along a watercourse are also considered.

The results of these analyses provide insights into the integral consideration of floods and heavy rainfall, particularly in small catchment areas and during short heavy rainfall events. In addition, these methods can be used to define the joint probabilities of occurrence of these events. Furthermore, the investigations can not only contribute to a more precise assessment of the hazards and risks of compound events, but can also serve as a starting point for integral heavy rain and flood hazard maps. The maps derived from this can make a valuable contribution to the development of more precise and comprehensive risk management strategies.

How to cite: Simon, F. and Mudersbach, C.: Compound heavy rainfall and river flood events in small catchments, EGU General Assembly 2024, Vienna, Austria, 14–19 Apr 2024, EGU24-15119, https://doi.org/10.5194/egusphere-egu24-15119, 2024.

EGU24-17162 | PICO | HS4.1 | Highlight

Early warning Demonstration of pan-European rainfall-induced impact forecasts – the EDERA project 

Marc Berenguer, Shinju Park, Calum Baugh, Karen O'Regan, Christel Prudhomme, Seppo Pulkkinen, Heikki Myllykoski, Antonio Santiago, Ana M. Durán, Rosa M. Torres, María Vara, Abel Gomes, Juan Pereira Colonese, and Dimitar Tasev

Heavy rain and convective storms trigger a number of hazards (floods, landslides, debris flows…) that have impacts on people’s life and goods. In these situations, Civil Protection Agencies (CPAs) face multiple challenges in their decision-making processes such as the absence of multi-hazard forecasts or difficulty in translating hazards forecasts in impact-based decisions, or the coordination between CPAs during extreme and/or large-scale events affecting multiple regions and neighbouring countries.

The EDERA project, funded by the EU Civil Protection Mechanism, focuses on the integration of real-time pan-European forecasts of storm and heavy rainfall impacts in the Early Warning Systems of CPAs. The main objective of the project is assessing the added value of these products during an 18-months demonstration in collaboration with end users.

The study focuses on the evaluation of the quality of the hazard and impact forecasts during recent events at two different scales: (i) at the European scale (analysing the skill of the products to identify/anticipate the occurrence of the most significant events), and (ii) in two pilot sites (one focused in Finland and the other one covering Spain and Portugal), analysing their usefulness to support emergency management with the participation of relevant authorities.

How to cite: Berenguer, M., Park, S., Baugh, C., O'Regan, K., Prudhomme, C., Pulkkinen, S., Myllykoski, H., Santiago, A., Durán, A. M., Torres, R. M., Vara, M., Gomes, A., Pereira Colonese, J., and Tasev, D.: Early warning Demonstration of pan-European rainfall-induced impact forecasts – the EDERA project, EGU General Assembly 2024, Vienna, Austria, 14–19 Apr 2024, EGU24-17162, https://doi.org/10.5194/egusphere-egu24-17162, 2024.

EGU24-731 | ECS | Orals | HS4.2

Exploring Drought Monitoring in Morocco: A Review of Remote Sensing and Machine Learning Techniques 

Said El Goumi, Mustapha Namous, Abdenbi Elaloui, Samira Krimissa, and Nafia El-alaouy

The challenges of climate change and water scarcity in Morocco highlight the need for Remote Sensing (RS) and Machine Learning (ML) for drought monitoring. Droughts pose socio-economic and environmental challenges and have significant impacts on the country's agriculture-based economy and water management strategies. This study provides a comprehensive review of advanced RS technologies and ML algorithms, with a focus on their effectiveness in monitoring and forecasting drought conditions. RS provides extensive spatial coverage and captures important data on factors such as vegetation health, soil moisture, and precipitation trends, which are crucial for early detection and response to droughts. Incorporating ML algorithms significantly improves the precision and efficiency of drought prediction models, aiding in the development of comprehensive drought indices and forecasting models for agricultural planning and effective water resource management.

The study evaluates various RS methods utilized in Morocco, including the analysis of satellite imagery and vegetation indices such as NDVI, and assesses ML techniques like support vector machines (SVM) and artificial neural networks (ANN) for predicting drought-induced agricultural impacts. The combined use of these technologies provides a holistic approach to drought monitoring, enabling timely interventions to assist communities affected by drought. However, the study also highlights challenges in areas such as data availability, model validation, and associated costs. To effectively manage drought risks, the paper recommends that Moroccan policymakers and stakeholders leverage these technological advancements while emphasizing the importance of continuing research, interdisciplinary collaboration, and capacity building in these areas.

Key words: Drought,remote sensing, machine learning, climate change, Morocco

How to cite: El Goumi, S., Namous, M., Elaloui, A., Krimissa, S., and El-alaouy, N.: Exploring Drought Monitoring in Morocco: A Review of Remote Sensing and Machine Learning Techniques, EGU General Assembly 2024, Vienna, Austria, 14–19 Apr 2024, EGU24-731, https://doi.org/10.5194/egusphere-egu24-731, 2024.

Drought, as a natural calamity, has serious economic and environmental implications, especially as the impacts of climate change continue to escalate globally. In many regions, monitoring and comprehending changes in drought patterns have become imperative. As climate change increasingly influences hydrological cycles, there is a need to grasp and interpret drought behaviour in diverse geographical areas. This study is particularly focused on a landlocked state in the north-eastern region of India, which is characterised by a predominantly monsoon climate with high humidity and an annual rainfall of 1800–2500 mm. The study focuses on the state of Nagaland, India, and is aimed at evaluating the efficacy of artificial intelligence (AI) models such as Multilayer Perceptron (MLP), Long Short-Term Memory (LSTM), and Genetic-Algorithm Adaptive Neuro-Fuzzy Inference System in predicting drought. For analysing the drought conditions, the Effective Drought Index (EDI) is used. By utilising rainfall data from 1987–2021, the EDI drought index has been computed, recognising the pivotal role of rainfall in comprehending prevailing drought conditions. The drought conditions are categorised from extremely dry to near normal, excluding the wet conditions in the study region. The investigation into the effectiveness of AI in predicting and detecting drought yielded insightful results, highlighting the informative and promising capabilities of AI models. The results of the study facilitate a comparative analysis of the three models, MLP, LSTM, and GA-ANFIS, using the evaluation metrics. The study findings indicate that LSTM exhibits superior prediction accuracy in the study region in terms of its ability to predict drought conditions in the given geographical area. This outcome is crucial for understanding and addressing the impacts of drought. This study contributes to the broader understanding of drought prediction and emphasises how AI models can improve their ability to predict drought conditions, which will ultimately contribute to enhanced water resource management and climate adaptability.

How to cite: Kikon, A.: Exploring the effectiveness of Artificial Intelligence-powered insights in drought study in Nagaland, India, EGU General Assembly 2024, Vienna, Austria, 14–19 Apr 2024, EGU24-853, https://doi.org/10.5194/egusphere-egu24-853, 2024.

EGU24-1425 | Posters on site | HS4.2

Occurrence of drought in groundwater over the last 12 years 

Valeria Slivova and Michaela Kurejova Stojkovova

Groundwater is a very important component of water circulation in nature, it is indispensable in every country’s wealth. Ensuring protection of its sustainable use is the most important requirement for preserving the quality of life, health of natural conditions and economic development of each sector. Groundwater is the main source of drinking water in Slovakia. This contribution assesses groundwater drought occurrence recorded at 207 objects in the Slovak groundwater monitoring network.  This comprises 141 groundwater level boreholes and 66 spring yield gauging stations. The Sandre method was used for this assessment. This method is based on a statistical comparison of the average monthly values of the hydrological year evaluated with the long-term monthly average over the reference period 1981-2010. For each month of the reporting period, five separate categories are established on the basis of the statistical treatment of the average monthly values of spring yields and groundwater levels. The period of the last 12 years (2011-2012) has been evaluated.


The results show that 3 years (2012, 2019 and 2022) were assessed as the dry years, 3 years were assessed as wet (2011, 2013 and 2021) and 6 years were assessed as average (period 2014 - 2016, 2018 and 2020). Within each years, groundwater drought occurred most frequently in winter, spring and summer. The main source of groundwater is the spring melting of snow. In the last years we can see, there is earlier melting of the snow as a result of warm winters and has been a lack of snow cover in the lower positions in the Slovakia. These are the main causes of the occurrence of droughts in groundwater in the winter and spring period. During the summer period, groundwater drought is caused by high evapotranspiration and rainfall deficits. The occurrence of local storms does not have a significant impact on the replenishment of groundwater resources.


Keywords: groundwater drought, rainfall deficit, spring yield, groundwater level

How to cite: Slivova, V. and Kurejova Stojkovova, M.: Occurrence of drought in groundwater over the last 12 years, EGU General Assembly 2024, Vienna, Austria, 14–19 Apr 2024, EGU24-1425, https://doi.org/10.5194/egusphere-egu24-1425, 2024.

EGU24-1946 | ECS | Orals | HS4.2

Monitoring agricultural drought in the Mediterranean region using a high-resolution (1-km) standardized evaporation deficit index 

Irina Yu. Petrova, Diego G. Miralles, Sergio M. Vicente-Serrano, and Christian Massari

Droughts, with their far-reaching and detrimental effects across multiple domains, remain critical climate events that demand better monitoring and early warning capabilities. Regions that are highly dependent on water supply for agriculture, such as the Mediterranean, are vitally dependent on timely monitoring of drought conditions. The crop losses in the region as a consequence of drought events continue to rise. Simultaneously, climate models agree regarding the exacerbation of drought following global warming in the region. Therefore, better understanding and monitoring of drought occurrence is imperative to mitigate drought adverse effects and improve water resource management in the region and beyond.
Operational drought monitoring, whether based on models or observed data, commonly employs a set of drought indices designed to assess anomalies in land or atmosphere dryness. However, these indices are typically available at relatively coarse spatio-temporal scales, rendering them unsuitable for evaluating the local drought impacts that are relevant to agriculture and ecosystems. This limitation does not facilitate decision-making by local authorities and farmers and impedes the straightforward development of on-site adaptation strategies.
In this study, we undertake the assessment and validation of an evaporation-based drought index, the Standardized Evaporation Deficit Index (SEDI: Kim&Rhee 2016, GRL), at an unprecedentedly high resolution (1 km, daily) over the Mediterranean domain. The index is constructed using data of potential and actual evaporation derived using GLEAM (Miralles et al. 2011, HESS), as part of the ESA 4DMED-Hydrology project. Unlike most other drought indices, SEDI is directly related to plant water stress, given the significance of the evaporation deficit for plant hydraulic and physiological processes. Such approach offers the potential to provide early-warning information on ecological and agricultural plant water stress at local scales. Our study of the relationship between SEDI and vegetation stress over seven years (2015–2021) and across 28 Mediterranean river basins, sheds light on critical factors that cause differential stress in crops and natural ecosystems under drought conditions. We also explore the role of irrigation in the SEDI–vegetation stress relationship using 1 km irrigation volumes obtained during the 4DMED-Hydrology project. In the future, the framework will be extended globally, with the subsequent aim to provide valuable information for optimizing irrigation timing in major irrigated breadbasket regions. 

How to cite: Yu. Petrova, I., G. Miralles, D., M. Vicente-Serrano, S., and Massari, C.: Monitoring agricultural drought in the Mediterranean region using a high-resolution (1-km) standardized evaporation deficit index, EGU General Assembly 2024, Vienna, Austria, 14–19 Apr 2024, EGU24-1946, https://doi.org/10.5194/egusphere-egu24-1946, 2024.

EGU24-2072 | ECS | Orals | HS4.2

Soil moisture forecasting for dryland fields in Australia 

Qazi Muqeet Amir and Thomas Bishop

Australia is frequently susceptible to droughts. Major droughts within the last 50 years such as that of 1982-1983 and the Millennial drought of 1997-2010 severely impacted crop growth across the country. Soil moisture can be in deficit during droughts due to a lack of recharge and high evapotranspiration from the soil. Dryland agriculture is particularly sensitive to droughts as there is no irrigation input into the soil. Soil water availability is a critical constraint to agricultural productivity, so the ability to predict its current and future state accurately is key in informing decisions relating to irrigation, fertiliser use, and yield targets. While soil moisture forecasting has been conducted in literature previously, there is limited understanding of the spatial, seasonal, and meteorological patterns that underlie the forecastability of soil moisture in a particular field. Hence this research aims to understand the spatial, seasonal, and meteorological factors that influence the forecast accuracy of soil moisture in dryland fields in Australia. 

Across Australia an increasing number of growers have soil moisture probes, which report current and historic soil moisture. The domain of this work is in the CosmOz probe network, consisting of 26 cosmic ray soil moisture probes across Australia, accounting for various geophysical and climatic regions. The probes measure average soil moisture to depths in the soil between 10 to 50 cm. Forecasting soil moisture requires the addition of various modelled/remotely sensed data such as meteorological, vegetation type, and soil property data. Using this data and lagged soil moisture as predictors, soil moisture has been forecasted at the locations of each CosmOz probe. With up to 13 years of training data, machine learning models have been fitted to forecast soil moisture with high accuracy forecasts of up to 30 days. To improve predictions a neural network autoencoder has been employed to engineer features that account for anomalous periods in the predictors.

A key outcome of this study is identifying patterns in forecast accuracy and predictor importance with respect to region, soil type, meteorological conditions, and time of year. These patterns create a nationwide perspective of soil moisture forecastability and the potential for forecasting in areas with no soil moisture probe data available. 

How to cite: Amir, Q. M. and Bishop, T.: Soil moisture forecasting for dryland fields in Australia, EGU General Assembly 2024, Vienna, Austria, 14–19 Apr 2024, EGU24-2072, https://doi.org/10.5194/egusphere-egu24-2072, 2024.

EGU24-2075 | ECS | Orals | HS4.2

Drought duration and spatial dependence increase during propagation 

Manuela Irene Brunner and Corentin Chartier-Rescan

As droughts propagate both in time and space, their impacts increase because of changes in drought properties. Even though drought propagation has two dimensions – a temporal and spatial one – these are mostly studied separately, which neglects that the propagation of droughts through the hydrological cycle may extend from local to spatial characteristics. Therefore, it is yet unknown how the spatial extent and connectedness of droughts change as droughts propagate from the atmosphere to and through the hydrosphere.
In this study, we assess not only how local meteorological droughts propagate through the hydrological cycle to streamflow and groundwater but also how drought spatial extent and connectedness change with drought propagation. To do so, we use a large-sample dataset of 70 catchments in the Central Alps for which both observed streamflow and groundwater data are available.
We show that drought propagation from the atmosphere to the hydrosphere affects both local and spatial drought characteristics and leads to longer, delayed, and fewer droughts with larger spatial extents. 75% of the precipitation droughts propagate to P-ET or further, 20% to streamflow, and only 10% to groundwater. Of the streamflow droughts, 40% propagate to groundwater but 60% do not propagate.  Drought extent and connectedness increase during drought propagation from precipitation to streamflow thanks to synchronizing effects of the land-surface such as widespread soil moisture deficits but decrease again for groundwater because of sub-surface heterogeneity. These findings have implications for drought prediction and management. They suggest a partial predictability of streamflow and groundwater droughts by atmospheric and hydrological deficits and that large scale streamflow deficits may be partly compensated by groundwater, which shows less frequent and spatially extensive droughts than streamflow.

How to cite: Brunner, M. I. and Chartier-Rescan, C.: Drought duration and spatial dependence increase during propagation, EGU General Assembly 2024, Vienna, Austria, 14–19 Apr 2024, EGU24-2075, https://doi.org/10.5194/egusphere-egu24-2075, 2024.

EGU24-2560 | ECS | Orals | HS4.2

A novel multivariate drought severity index: study of short-term hydrological signals within Amazon river basin 

Artur Lenczuk, Christopher Ndehedehe, Anna Klos, and Janusz Bogusz

The pace of Earth’s climate warming obviously sped up, especially after 2000s. Droughts are increasingly becoming  frequent, longer and more severe, with lasting impacts on ecosystems, communities and people. Thus, addressing the problem of monitoring global (or regional) climate trends and  water storage changes is crucial. We propose a novel Multivariate Drought Severity Index (MDSI) estimated through the concept of Frank copulas that is based on DSIs determined from satellite-based geodetic data. The new multivariate approach is based on data provided by the Global Positioning System (GPS) and the Gravity Recovery and Climate Experiment (GRACE).

In this study, we analyze short-term (<9 months) signals of monthly-resampled vertical displacements for 25 GPS stations that are classified as benchmarks for hydrogeodesy within Amazon river basin. We show that despite GPS and/or GRACE limitations arising in data products or their quality, the GPS- and GRACE-based DSIs are characterized with a general coherent spatial pattern to the traditional climate indices (Standardized Precipitation Index (SPI) and Standardized Precipitation Evapotranspiration Index (SPEI)). Moreover, GPS- and GRACE-based DSIs are capable of capturing extreme hydrometeorological events reported for the Amazon basin. However, DSI variations from GPS and GRACE do not always reflect real hydrological changes as they could sometimes under- or overestimate them. Our analyses show that the newly proposed MDSI is a step towards strengthening  the credibility of combined GPS and GRACE data in drought assessment to improve  understanding of climate change impact on freshwater. We demonstrate that the MDSI recognizes the exact number of events, or one event less than index chosen as the most reliable for over 90% of selected stations. We notice that MDSI series are temporally consistent with extreme precipitation values. The wet and dry periods captured by MDSI are related with precipitation anomalies over 400 mm/month and below 100 mm/month, respectively.

How to cite: Lenczuk, A., Ndehedehe, C., Klos, A., and Bogusz, J.: A novel multivariate drought severity index: study of short-term hydrological signals within Amazon river basin, EGU General Assembly 2024, Vienna, Austria, 14–19 Apr 2024, EGU24-2560, https://doi.org/10.5194/egusphere-egu24-2560, 2024.

EGU24-2685 | ECS | Orals | HS4.2

Drought propagation from meteorological to hydrological drought in the Krishna River Basin of India 

Ajay Gupta, Manoj Kumar Jain, and Rajendra Prasad Pandey

Understanding the propagation of drought from one form to another has become a prime topic of research during recent decades. The majority of research has used a correlation-based approach to study drought propagation; however, such techniques are ineffective in areas with considerable seasonality in precipitation, such as India. Only a few studies have employed an event-based approach to study drought propagation. Moreover, none of the previous studies considered the sequential propagation of drought, starting from meteorological to hydrological drought through agricultural drought. This work aims to analyse drought propagation from meteorological to hydrological drought through agricultural drought using an event-based approach in the Krishna River Basin of India. The Standardised Precipitation Evapotranspiration Index (SPEI) represents meteorological drought, the Standardised Soil Moisture Index (SSMI) represents agricultural drought, and the Standardized Streamflow Index (SSI) represents hydrological drought is estimated at a 1-month timescale at sub-basin scale. The precipitation and temperature data are procured from the India Meteorological Department (IMD) Pune, the soil moisture data is obtained from the European Space Agency (ESA) Climate Change Initiative (CCI) v03.3, and the streamflow data is downloaded from India-WRIS. Two different cases of drought propagation are analysed: meteorological to agricultural drought (SPEI-SSMI) and agricultural to hydrological drought (SSMI-SSI). Propagation of drought is quantified through the estimation of three-time matrices: (1) the time difference between the initiation of droughts, (2) the time difference between the peak of droughts, and (3) the time difference between the termination of droughts. The results from the study revealed that the SSMI drought was initiated after 6.4 months of the SPEI drought, while the SSI drought was initiated after 8.4 months of the SSMI drought. The peak of SSMI drought is found to be after 6.3 months of the peak of SPEI drought, while the peak of SSI drought is found to be after 34.7 months of the peak of SSMI drought. Once the SPEI drought terminates, it lasts for 8.3 months for the SSMI drought to terminate, while after the SSMI drought terminates, it lasts for 30.7 months for the SSI drought to terminate. Thus, it was found that the propagation of drought from SPEI-SSMI is faster than the propagation of drought from SSMI-SSI. The present work will provide essential information on drought propagation, which will be helpful in the management and mitigation of droughts in India. 

Keywords: Drought Propagation, Propagation Time, SPEI, SSMI, SSI.

How to cite: Gupta, A., Jain, M. K., and Pandey, R. P.: Drought propagation from meteorological to hydrological drought in the Krishna River Basin of India, EGU General Assembly 2024, Vienna, Austria, 14–19 Apr 2024, EGU24-2685, https://doi.org/10.5194/egusphere-egu24-2685, 2024.

EGU24-2852 | ECS | Posters virtual | HS4.2

Predicting longer lead droughts with Bayesian model averaging ensemble vine copula (BMAViC) model 

Haijiang Wu, Xiaoling Su, and Vijay P. Singh

In the face of global anthropogenic climate warming, particularly since the 1990s, the world has witnessed numerous extreme weather and climate events (e.g., droughts, heatwaves, and extreme precipitation), leading to economic losses and ecosystem degradation. In particular, drought prediction lies at the core of overall drought risk management and is critical for food security, early warning, and drought preparedness and mitigation. However, drought prediction models generally focus on shorter lead times (1–3-months) as their performance drastically declines at longer lead times (> 3 months). The vine copula can decompose complex non-linear, multi-variates into pairwise variables via bivariate copula forms which can well depict the diverse dependencies among variables (note that a vine copula possesses numerous vine structures, especially under higher-dimensional situations), while the Bayesian model averaging (BMA) can assign different weights to each ensemble member which depends on the explanatory power of the member itself for the specified objective. We therefore developed a new drought prediction model utilizing the BMA coupled with vine copula, called the Bayesian Model Averaging ensemble Vine Copula (BMAViC) model. Two drought types, i.e., hydrological drought (characterized by the standardized streamflow index (SSFI)) and agricultural drought (depicted by standardized soil moisture index (SSI)), were predicted with different lead times based on the BMAViC model under four-dimensional situations. Our model first was applied to predict the hydrological drought with the 1–3-month lead times for five hydrological stations (i.e., Tangnaihai, Minhe, Hongqi, Zheqiao, and Xiangtang) in the Upper Yellow River basin, in which previous meteorological drought, antecedent evaporative drought, and preceding hydrological drought were selected as three predictors. The BMAViC model showed robust skills during calibration and validation periods for 1–3-month lead hydrological drought predictions. In comparison with the meta-Gaussian model (reference model), the skills of the proposed model were relatively stable and superior under diverse lead times. Good performances under the 1–3-month lead times strongly implied that the BMAViC model yielded robust and accurate hydrological drought predictions. Considering the previous meteorological drought, antecedent hot condition, and agricultural drought persistence as three predictors, our proposed BMAViC model was further leveraged to predict the agricultural drought in the summer season over China with the 1–6-month lead times. Compared with optimal vine copula (OViC), average vine copula (AViC), and persistence-based models, the BMAViC model performed better for the 1–6-month lead agricultural drought predictions. Besides, the BMAViC model yielded a good prediction ability for extreme droughts. These findings enhance our confidence in seasonal drought prediction and help us understand drought dynamics in future months.

How to cite: Wu, H., Su, X., and Singh, V. P.: Predicting longer lead droughts with Bayesian model averaging ensemble vine copula (BMAViC) model, EGU General Assembly 2024, Vienna, Austria, 14–19 Apr 2024, EGU24-2852, https://doi.org/10.5194/egusphere-egu24-2852, 2024.

In recent decades, the phenomenon of drought has become a hazard with increasing frequency, with multiple societal and environmental impacts. One of these impacts concerns water resources and their availability for various uses. Numerous indices have been used over time to quantify the severity of drought and to assess its effects on socio-economic activities and environmental components. Among the spatial indices, the most numerous belong to remote sensing, being easy to use to analyse drought consequences especially on landcover and vegetation. However, regarding the hydrological drought, the indices used are mainly calculated based on hydroclimatic data, without taking into account spatial variables, such as the topographical, geological or pedological characteristics. The aim for this study is to compute a hydrological drought index which integrates several drought control variables, using both GIS and remote sensing techniques in order to map the susceptibility to hydrological drought within the Teleorman watershed.

Located in the central-southern part of Romania, the Teleorman River has a length of 169 km and a catchment area of 1.427 km2. The most part of  the catchment overlaps the central sector of the Romanian Plain, an important agricultural area, highly sensitive to water deficit. According to Köppen-Geiger classification, the analyzed catchment has a humid continental climate with hot summers (Dfa), meaning that the drought could occur in the basin.

A series of free data and information sources has been accessed in order to compute the hydrological drought index, such as: Worldclim, Landsat Archive, Geological Map of Romania, Pedological Map of Romania, Shuttle Radar Topography Mission (SRTM), Topographical Map of Romania. The following parameters were derived from these sources: Topograhic Wetness Index (TWI); Drainage Density (resulted from hydrographic network); Normalized Difference Drough Index (NDDI), resulted from ratio between Normalized Difference Vegetation Index (NDVI) and Normalized Difference Water Index (NDWI); Temperature Condition Index (TCI), extracted from Land Surface Temperature (LST); Aridity Index (AI) computed as a ratio between Precipitation and Potential Evapotranspiration (PET); De Martonne Index (based on ratio between Precipitation and Air temperature); Lithology and Soil Texture. Because some of the parameters had a different spatial resolution, the regridding method was used to bring the database to a resolution of 30 meters. Analytic hierarchy process method (AHP) was used to determine the influence of each factor and for the bonitation process. Based on the total obtained score, 5 classes from to lowest to highest hydrological drought susceptibility resulted. Finally, the Weighted Overlay and Raster Calculator tools from ArcGisPro software were used to map the index.

The resulted map allows the identification in the studied watershed of areas the most susceptible to hydroclimatic drought allowing the focus in these areas of appropriate actions to improve drought risk management. GIS and Remote sensing proved to be useful tools in spatial analysis of drought based on a composite index integrating several drought control factors. In the future, we intend to improve the method by considering other variables controlling the hydrological drought, such as the streamflow and the groundwater depth.

How to cite: Costache, M.-Ș. and Zaharia, L.: Mapping the susceptibility to hydrological drought using GIS and remote sensing techniques in the Teleorman watershed (Romania), EGU General Assembly 2024, Vienna, Austria, 14–19 Apr 2024, EGU24-3408, https://doi.org/10.5194/egusphere-egu24-3408, 2024.

Drought projection is critical for water resource planning and management, as well as disaster prevention and mitigation. As a strategic national water source for China, the Yangtze River Basin (YRB) plays a vital role in the connectivity of rivers and economic development, flowing through 11 provincial administrative regions and is injected into the East China Sea, with a total length of 6,397 km. The watershed covers an area of 1.8 million square kilometers, accounting for about 1/5 of China's total land area. However, frequent droughts have caused water shortages in the YRB in recent years. Based on observed meteorological and hydrological data, the CMIP6 model and SPEI (standardized precipitation evapotranspiration index) drought models were used to elucidate the risk of future simultaneous droughts in the upper and mid-lower reaches of the YRB from 2015 to 2100. SRI has been used based on SWAT model to study the transfer process of meteorological drought to hydrological drought. The results indicated that, (1) The average of 10 CMIP6 models showed a good verification of historical precipitation and temperature for drought predictions. The MMK and Sen’s slope demonstrated consistency for historical and future droughts in the YRB. From a historical perspective (1961–2019), the middle reaches of the YRB experienced intensifying drought frequency with the highest total drought (Moderate and above drought events) frequency (> 17%); (2) In the future (2020–2100), the higher emission signifies higher moderate and total drought frequency, intensity, and scope of the YRB in FF, lower in NF. The ratio of autumn severe and extreme droughts would increase in mid-twenty-first century; (3) Severe drought risk encounters were projected in the upper and meanwhile in the middle-lower reaches in YRB, especially in the 2030–2040 period. Under all three scenarios, severe droughts occurred more frequently with SPEI close to − 2. The middle-lower reaches of the YRB are forecast to witness the largest scope and highest intensity of drought under the SSP1-2.6 scenario.; (4) The future runoff in the YRB during the dry period varied less, but in May and June during the main flood season the runoff under SSP1-2.6 would be the largest. Maximum decrease in runoff in the mid-lower reaches under the SSP2-4.5 scenario would be 2045, reaching 13.9%. Extreme flooding events and extreme meteorological droughts would happen accompanying with hydrological droughts would occur more frequently and severely under different scenarios. More attention and improved strategies should be brought to bear to address future simultaneous droughts in the upper and mid-lower YRB.

How to cite: Zhang, Y. and Zhang, Z.: The increasing risk of future simultaneous droughts over the Yangtze River basin based on CMIP6 models , EGU General Assembly 2024, Vienna, Austria, 14–19 Apr 2024, EGU24-3557, https://doi.org/10.5194/egusphere-egu24-3557, 2024.

EGU24-3746 | Posters on site | HS4.2

Drought Forecasting with ML-based Regionalized Climate Indices 

Taesam Lee, Yejin Kong, Sunghyun Hwang, and Sejeong Lee

Drought forecasting in South Korea has become imperative due to the increased frequency of occurrence leading various damages such as property loss and casualties. Precipitation in South Korea is distributed with high deviation, substantially concentrated in summer. Other seasons have a comparatively low amount of precipitation resulting unbalanced water resources of each season. To overcome the skewed seasonal precipitation, numerous dams and reservoirs have been constructed and operated. The management of those water-related structures should be carried out carefully to meet seasonal requests of water resources, and the precipitation prediction for each season has become critical. However, the seasonal precipitation forecasting has been a challenging task due to complex weather systems and climate patterns. The current study proposes a novel procedure for forecasting seasonal precipitation as: (1) regionalization of climate variables; (2) extraction of features with PCA, ICA and Autoencoder; and (3) finally regression model applications. Two globally gridded climate variables, Mean Sea Level Pressure (MSLP) and Sea Surface Temperature (SST) were teleconnected with the Accumulated Seasonal Precipitation (ASP) of South Korea. The results indicate that the k-means clustering successfully regionalizes the highly correlated climate variables with the ASP and all three feature selection algorithms, PCA, ICA, and Autoencoder present their superiority in different seasons combining GLM and SVM models. Especially, the PCA performs better with the linear GLM model and the Autoencoder shows better performance with the nonlinear SVM model. Overall, it can be concluded that the proposed seasonal precipitation forecasting procedure combining ML-based algorithms can be a good alternative.

How to cite: Lee, T., Kong, Y., Hwang, S., and Lee, S.: Drought Forecasting with ML-based Regionalized Climate Indices, EGU General Assembly 2024, Vienna, Austria, 14–19 Apr 2024, EGU24-3746, https://doi.org/10.5194/egusphere-egu24-3746, 2024.

EGU24-3770 | ECS | Posters on site | HS4.2

From development of multi-sectoral drought hazard indicators to global drought hazard propagation 

Neda Abbasi, Stefan Siebert, Malte Weller, Tina Trautmann, Jan Weber, Tinh Vu, Ehsan Eyshi Rezaei, Harald Kunstmann, Harald Koethe, Christof Lorenz, and Petra Döll

Droughts pose a substantial threat to various sectors, including agriculture, human water supply but also natural ecosystems. While various studies have been conducted for drought evaluation, the majority of them have focused on a particular drought type. This may lead to a lack of comprehensive understanding of the features and progression of droughts among different drought types through time. For example, for water resources management and planning purposes, it is critical to understand the changes and temporal development of drought signals from abnormal meteorological conditions to soil moisture, groundwater levels, and streamflow. Within the OUTLAST project, which aims at developing an operational, multi-sectoral global drought hazard forecasting system, we develop a near real-time drought hazard monitoring and forecasting system which, for the first time, includes tailored indicators for various sectors, including water supply, riverine and non-agricultural land ecosystems, as well as rainfed and irrigated agriculture. In this context, the primary objectives of this study are to 1) develop different drought hazard indicators (DHI) to monitor and forecast the drought across different sectors; and 2) assess the spread and propagation of droughts across different sectors and regions at a global scale. For this purpose, DHIs were computed for a 40-year reference period (1981 to 2020) using ERA5 as meteorological forcing data to drive the DHIs using the global hydrological model (WaterGAP) and the global crop water model (GCWM). These DHIs cover meteorological (SPEI and SPI), hydrological (empirical percentiles and relative deviations of soil moisture and streamflow), as well as agricultural droughts (crop-specific DHIs for rainfed and irrigated croplands). In this project, we focus on the period 2011 to 2015, with 2012 being a year in which droughts had major impacts on various regions and sectors. The study investigates drought propagation from meteorological drought, extending to rainfed agriculture due to soil moisture deficiency, over streamflow, and eventually reaching irrigated agriculture. In doing so, region-specific features and the dependency of drought propagation on the magnitude of the drought are highlighted. Finally, as monitoring and projecting drought characteristics are important for comprehending drought-related issues, our multi-sectoral drought hazard forecasting system enables us to evaluate the state of drought propagation at a global scale. 

How to cite: Abbasi, N., Siebert, S., Weller, M., Trautmann, T., Weber, J., Vu, T., Eyshi Rezaei, E., Kunstmann, H., Koethe, H., Lorenz, C., and Döll, P.: From development of multi-sectoral drought hazard indicators to global drought hazard propagation, EGU General Assembly 2024, Vienna, Austria, 14–19 Apr 2024, EGU24-3770, https://doi.org/10.5194/egusphere-egu24-3770, 2024.

EGU24-3933 | ECS | Posters on site | HS4.2

Spatiotemporal characteristics of drought in the Yili River basin in Northwest China over the past 40 years 

Mengzhen Huang, Ruijie Lu, Peiru Li, and Yutong Han

The Yili River basin is commonly referred to as a "wet island" in the Central Asian Dry Zone. It functions as a vital security barrier in the western part of China. Droughts frequently occur in the basin due to global change and pose a significant threat to food security and ecological stability in the region. Currently, droughts in the basin have not received the attention they deserve, and the mechanisms behind the occurrence, development, and impacts of drought in the basin have not yet been clarified. Based on the Standardized Precipitation Evapotranspiration Index (SPEI), this research identified drought events over the past 40 years, extracted drought characteristics and drought trends, and explored future drought. The following results were found: 1) The basin has experienced frequent wet and dry changes on monthly and seasonal scales, and entered a period of high drought since 2005, specifically the successive severe droughts of 2007-2009 and 2012-2015. 2) There were drought events approximately one-quarter of the time in the basin. Each drought event lasted an average of 2.23 months with a medium intensity. The most prominent droughts occurred in spring and summer. Droughts in the middle and southwest of the basin had short durations but higher intensities, which significantly impacted the area. 3) Over the last 40 years, there has been a general increase in aridity in the basin, especially in spring and summer. The aridity trend was more severe in the northwestern part. 4) In the future, annual drought is predicted to decrease but will increase in summer. It’s recommended that emergency management of drought disasters in the basin be strengthened and, in particular, to improve the monitoring, early warning and prevention in summer.

How to cite: Huang, M., Lu, R., Li, P., and Han, Y.: Spatiotemporal characteristics of drought in the Yili River basin in Northwest China over the past 40 years, EGU General Assembly 2024, Vienna, Austria, 14–19 Apr 2024, EGU24-3933, https://doi.org/10.5194/egusphere-egu24-3933, 2024.

EGU24-4094 | Orals | HS4.2

Identification of low flow events by machine learning algorithms 

Henning Lebrenz, Daniela Pavia, and Philipp Staufer

An improved forecast of low flow events in catchment basins could be a valuable tool for the operation and decision making of dependent infrastructure (e.g. wastewater discharge, water abstraction) along corresponding rivers. Therefore, the classification of 6642 independent low-flow-events (being the Q347 as the discharge less than the 95%- exceedance quantile of the FDC) from 55 catchment basins within the Kanton Solothurn (Switzerland) was performed by five different machine learning algorithms (i.e. knn, decision tree, random forest, support vector machine, logistic regression). Herein, each low flow event was characterized by 47 static and dynamic parameters (i.e. description of catchment and event history), being supplemented by differently defined (near) non-low-flow events, leading up to a total population of approx. 18000 discharge events.

The validation and verification showed different qualities of the classification accuracy for the forecast of low-flow events, being dependent on the selection of the defined event populations, the selected machine learning algorithm and the definition of classes. In general, the support vector machine and random forest may lead, with the presumption of carefully selected classes, to forecast accuracies of >90%.

How to cite: Lebrenz, H., Pavia, D., and Staufer, P.: Identification of low flow events by machine learning algorithms, EGU General Assembly 2024, Vienna, Austria, 14–19 Apr 2024, EGU24-4094, https://doi.org/10.5194/egusphere-egu24-4094, 2024.

EGU24-4330 | ECS | Orals | HS4.2

Predicting Food-Security Crises in the Horn of Africa Using Machine Learning 

Tim Busker, Bart van den Hurk, Hans de Moel, Marc van den Homberg, Chiem van Straaten, Rhoda A. Odongo, and Jeroen C.J.H. Aerts

Food insecurity is a global concern resulting from various complex processes and a diverse range of drivers. Due to its complexity, it is one of the most challenging drought impacts to predict. In this study, we introduce a novel machine learning model designed to forecast food crises in the Horn of Africa up to 12 months in advance. We trained an “XGBoost” model using more than 20 different input datasets to capture key food security drivers such as drought, economic shocks, conflicts and livelihood vulnerability. The model shows a promising ability to predict food security dynamics several months in advance (R2>0.6, three months in advance). Notably, it accurately predicted 20% of crisis onsets in pastoral regions (n = 84) and 40% of crisis onsets in agro-pastoral regions (n = 23) with a 3-month lead time. We compared these results to the established FEWS NET early warning system, and found a similar performance over these regions. However, our model is clearly less skilled in predicting food security for crop-farming regions than FEWS NET. This study underscores the importance of integrating machine learning into operational early-warning systems like FEWS NET and expanding these techniques to the continental or global-scale.   

How to cite: Busker, T., van den Hurk, B., de Moel, H., van den Homberg, M., van Straaten, C., A. Odongo, R., and C.J.H. Aerts, J.: Predicting Food-Security Crises in the Horn of Africa Using Machine Learning, EGU General Assembly 2024, Vienna, Austria, 14–19 Apr 2024, EGU24-4330, https://doi.org/10.5194/egusphere-egu24-4330, 2024.

EGU24-4814 | ECS | Posters on site | HS4.2

Global dryness could intensify vegetation failure even after net-negative emission is achieved 

Sanjit Kumar Mondal, Soon-Il An, Seung-Ki Min, Tong Jiang, Buda Su, Seungmok Paik, and Soong-Ki Kim

The response of global dryness and vegetation to CO2 removal experiments, especially for net-
 negative emission is immature. Here we conducted a thorough investigation to identify hysteresis and reversibility in global dryness, as well as the vegetation productivity’s response to dry and wet episodes, considering their asymmetrical nature. The asymmetry index (AI) includes two important aspects such as positive AI indicates a dominant increase of vegetation productivity during wet episodes compared to the decline in dry episodes and negative AI implies a larger reduction of productivity in dry years compared to an increase in wet years. Aggregate results from various drought indices and vegetation productivity reveal a dominant dryness in the CO2 decrease phase. Global dryness shows strong hysteresis and irreversible behavior over half of the global land with significant regional disparity. Irreversible changes in dryness are concentrated in specific areas, i.e., hotspots, covering over 14% of the global land, particularly pronounced in Northern Africa, Southwest Russia, and Central America. Moreover, a wider spread of negative asymmetry indicates a significant decrease in vegetation productivity caused by dryness. Importantly, the potential evapotranspiration is projected to be the primary driver of global dryness as well as vegetation asymmetry. Our findings suggest only CO2 alleviation is not enough to cope with drought rather implementing advanced water management strategies is a must to mitigate the impact of drought effectively.

How to cite: Mondal, S. K., An, S.-I., Min, S.-K., Jiang, T., Su, B., Paik, S., and Kim, S.-K.: Global dryness could intensify vegetation failure even after net-negative emission is achieved, EGU General Assembly 2024, Vienna, Austria, 14–19 Apr 2024, EGU24-4814, https://doi.org/10.5194/egusphere-egu24-4814, 2024.

Hydrological drought occurs frequently all over the world and has a great impact on human beings. Hydrological drought attribution contributes to a better understanding of the mechanisms of drought occurrence, improves the accuracy of predictions of drought events, and can provide a basis for drought risk reduction. At present, hydrological models which possess physical mechanisms are widely used in attribution analysis. However, this kind of models is complex in calculation, and has very limited time scale. In this study, we developed a hydrological drought attribution method via AdaBoost algorithm. The method divided the study period into natural period unaffected by non-climatic factors and impacted period. Taken the natural period as training period, the impacted period as test, the runoff was obtained to calculate the three-months standardized runoff index (SRI-3). Based on the run-length theory, we calculated average drought characteristics in the impacted period. Finally, the proportion of the average drought characteristics obtained by simulated SRI-3 series to those obtained by observed SRI-3 series is considered as the contribution of the climatic factors to the drought events.

We applied this method in the Yangtze River Basin and the results showed that climatic factors are the dominate factors affecting hydrological droughts in this region, with the contributions at all the gauge stations are over 50%. Among all the drought characteristics, average drought severity is the most affected by the climatic factors, the corresponding contributions are all greater than 100%, shown as “excess contributions” (with non-climatic factors shown as negative contributions). Through the applications in various sub-basins of the Yangtze River Basin, the method was shown to provide new ideas for hydrological drought attribution, and the method can also be extended for applications such as meteorological hazards attribution, stock market volatility attribution and so on.

How to cite: Wang, W., She, D., and Xia, J.: Separate the impact of climate change and non-climatic factors on hydrological drought based on AdaBoost algorithm, EGU General Assembly 2024, Vienna, Austria, 14–19 Apr 2024, EGU24-4870, https://doi.org/10.5194/egusphere-egu24-4870, 2024.

EGU24-5040 | ECS | Posters on site | HS4.2

Links between heat waves, drought, and atmospheric circulation in Central Europe 

Zuzana Bešťáková, Ondřej Lhotka, Jan Stryhal, and Jan Kyselý

Heat waves and drought are phenomena associated with large negative impacts on society and environment. Their common features include increasing frequency and intensity in recent decades in many regions of Europe, as well as interconnectedness of the factors that contribute to their development. In this study, we evaluate links between heat waves and drought in Central Europe using E-OBS data and ERA-5 reanalysis in the 1979–2022 period. Heat waves are classified according to their 3-dimensional structure of positive temperature anomalies into near-surface, lower-tropospheric, higher-tropospheric, and omnipresent types. We show that the associations to soil moisture conditions and development of flash drought (based on the daily climatic water balance index) differ for the individual heat wave types; the links are most pronounced for near-surface heat waves, illustrating the compound nature of the heat-drought events. We also employ the Jenkinson–Collison classification to identify circulation types with significantly increased frequency during periods of heat waves and droughts, and study changes in their occurrence. The analysis contributes to better understanding of the interrelationships between drought, heat waves, atmospheric circulation and other driving mechanisms.

How to cite: Bešťáková, Z., Lhotka, O., Stryhal, J., and Kyselý, J.: Links between heat waves, drought, and atmospheric circulation in Central Europe, EGU General Assembly 2024, Vienna, Austria, 14–19 Apr 2024, EGU24-5040, https://doi.org/10.5194/egusphere-egu24-5040, 2024.

EGU24-5291 | ECS | Orals | HS4.2

High-resolution drought monitoring with Sentinel-1: A case-study over Mozambique 

Samuel Massart, Mariette Vreugdenhil, Sebastian Hahn, Pavan Muguda Sanjeevamurthy, Carina Villegas-Lituma, and Wolfgang Wagner

Droughts are characterized by periods of below-average precipitation leading to an imbalance in the hydrological cycle and reduced water availability.
In the last decades, higher average temperatures and shifts in annual rainfall patterns have increased the frequency, intensity, and length of droughts across the globe.

With the majority of its population living in rural areas and a high economic dependency on rain-fed agriculture, Mozambique is particularly vulnerable to droughts, as water shortages have devastating environmental, agricultural, and economic impacts. Therefore, monitoring droughts in Mozambique is key to developing early warning systems and adequate planning for drought impact mitigation.

In this study, we propose a novel approach to retrieve a drought index at a kilometer-scale resolution based on surface soil moisture (SSM) products derived from Sentinel-1 (S1) and ASCAT. First, both SSM products are processed over the Mozambican region using a change detection method (Sentinel-1 sampled at 1km and ASCAT at 6.25km) and compared to SSM from ERA5-Land. Then, by combining the long-term ASCAT data record with the high spatial resolution of Sentinel-1, we generate a monthly kilometer-scale drought index for the period 2016 to 2023 over six study areas located in South-central Mozambique (Chokwé, Mabote, Massinga, Buzi, Muanza and Govuro). The S1-ASCAT indicator is then evaluated against state-of-the-art drought indices based on precipitation data (Standardised precipitation index from CHIRPS (Rainfall Estimates from Rain Gauge and Satellite Observations)) and vegetation data (Normalized difference vegetation index from the Copernicus Global Land Service.

This study explores the potential of high-resolution SSM based on active microwave remote sensing to monitor agricultural droughts. Our results show that a drought indicator based on Sentinel-1 and ASCAT can temporally and spatially capture sub-regional drought patterns over Mozambique.

How to cite: Massart, S., Vreugdenhil, M., Hahn, S., Muguda Sanjeevamurthy, P., Villegas-Lituma, C., and Wagner, W.: High-resolution drought monitoring with Sentinel-1: A case-study over Mozambique, EGU General Assembly 2024, Vienna, Austria, 14–19 Apr 2024, EGU24-5291, https://doi.org/10.5194/egusphere-egu24-5291, 2024.

EGU24-5692 | ECS | Orals | HS4.2

High vulnerability yet strong resilience of China's lakes to drought 

Siyu Ma, Almudena Garcia-Garcia, Xueying Li, and Jian Peng

Lakes play a crucial role in the global hydrological cycle and biogeochemical cycle. In China, lakes are an important part of water resources, providing 40.6% of drinking water. In recent years, droughts in the middle and lower reaches of the Yangtze River in China have led to a significant shrinkage of important freshwater lakes, such as Dongting Lake and Poyang Lake, posing a threat to local water security. However, there has been limited research on the extent to which thousands of lakes across China are affected by droughts. This study used remote sensing product of lake area to comprehensively investigate the impact of drought on the area of 4,702 lakes (natural lakes and reservoirs) in China from 1985 to 2018, covering the three stages of response, shrinkage, and recovery. The results indicate that lakes in China are highly vulnerable to drought. The average response probability of lakes is 72.8%, which typically occurs within six months to two years after the onset of drought. The shrinking area of the lake is 12.7% of the original area, and the shrinking process takes an average of 14 months. Lakes also show a strong resilience to drought, with 95.7% of lakes more likely to experience an increase in area following drought-induced shrinkage. However, only 49.4% of lakes are more likely to grow beyond their pre-shrinkage levels. Compared to natural lakes, artificial reservoirs exhibit a higher response probability by 4.6%, a larger shrinkage area percentage by 1.2%, and a higher recovery probability by 2.9%. Consequently, artificial reservoirs exhibit greater vulnerability and resilience to drought, reflecting the impact of human activities. Furthermore, the spatial distribution of vulnerability and resilience is inconsistent. In Northeast China, including the Songhua and Liaohe river basins, and the Mongolian endorheic basin, lakes exhibit higher vulnerability but lower resilience. Therefore, this region is considered a hotspot where the impact of drought on lake area is particularly severe. This study is expected to provide a basis for the implementation of sustainable water resource management and effective drought mitigation measures in China.

How to cite: Ma, S., Garcia-Garcia, A., Li, X., and Peng, J.: High vulnerability yet strong resilience of China's lakes to drought, EGU General Assembly 2024, Vienna, Austria, 14–19 Apr 2024, EGU24-5692, https://doi.org/10.5194/egusphere-egu24-5692, 2024.

EGU24-5875 | Posters on site | HS4.2

Parameter optimization of an agro-ecological model for regional NUTS-3 yield data 

Olga Wold, Roland Baatz, Michael Berg-Monicke, Ehsan Rezaei, Eyshi, and Claas Nendel

Climate change increasingly affects agricultural systems in Central Europe, necessitating the development of robust forecasting models for drought, heat, and fire events (DHF). These hazards pose significant threats to crop production and require proactive measures to enhance resilience and adaptation.

This research project is dedicated to constructing a thorough framework for forecasting DHF events in Central Europe. It integrates an agro-ecosystem model aimed at examining how crops respond, particularly when it comes to water availability. The focus of this research extends to the region's awareness to climate-related threats and the robustness of its agricultural systems.

We utilize the MONICA (Model for Nitrogen and Carbon in Agriculture) crop model to simulate crop growth and response across a spectrum of environmental conditions. The MONICA model is designed to represent the complexity of crop development, considering factors such as soil properties and weather variations. MONICA model has the capacity to explore various scenarios, including heat stress and drought sensitivity, providing a comprehensive view of how crops respond to these challenges.

 The used data includes high-resolution meteorological (1km resolution, daily), topographic, historical crop records and soil information for whole Germany. The dataset covers the past two decades, encompassing vital information such as crop yield records.

By sensitivity analysiswe systematically identified key parameters influencing simulated crop yield and above ground biomass, particularly in the context of drought and heat stress. These insights are invaluable for advancing our understanding of how crops respond to environmental stressors.

Moving forward, our focus shifts to the calibration and optimization routines to quantify specific parameter sets for individual NUTS-3 regions within Germany.

In the poster presentation, we look forward to sharing the newest findings from our ongoing research on advanced calibration tools and yield simulations conducted over Germany. Simulation results are compared to observed yield data, providing valuable insights into the effectiveness and real-world applicability of the modelling approaches.

How to cite: Wold, O., Baatz, R., Berg-Monicke, M., Rezaei, Eyshi, E., and Nendel, C.: Parameter optimization of an agro-ecological model for regional NUTS-3 yield data, EGU General Assembly 2024, Vienna, Austria, 14–19 Apr 2024, EGU24-5875, https://doi.org/10.5194/egusphere-egu24-5875, 2024.

Given their profound socio-economic impact and increasing occurrence, compound heat and drought extremes (CHDEs) have become a focal point of widespread concern. Numerous studies have attempted to reproduce and predict these extremes using general circulation models (GCMs); however, the performance of these models in capturing extreme events remains controversial. This study presents an improved historical simulation of CHDEs over China by using the regional Climate-Weather Research and Forecasting model (CWRF) to downscale the projections of two GCMs that participated in the Coupled Model Intercomparison Project Phase 6. The CWRF downscaling improved GCMs in capturing the thresholds of extreme hot and extreme dry conditions and demonstrates a better agreement with observations in the temporal trends and spatial patterns of extreme heat and extreme drought events. The performance of CWRF downscaling to reproduce CHDEs also surpasses that of GCMs, with an even greater enhancement compared to univariate extreme events. The improvement is particularly pronounced in sub-humid areas, which is primarily attributed to the enhanced simulation of temperature-precipitation coupling relationships by CWRF downscaling. This superiority is found to be associated with the finer land surface processes and land-atmosphere interaction processes of CWRF. This study highlights the important role of land-atmosphere interactions in shaping CHDEs and the efficacy of using regional climate models to reduce uncertainty in extreme event simulations.

How to cite: Zhang, S. and Zhang, H.: Towards improved prediction of compound heat and drought extremes by CWRF downscaling, EGU General Assembly 2024, Vienna, Austria, 14–19 Apr 2024, EGU24-8013, https://doi.org/10.5194/egusphere-egu24-8013, 2024.

EGU24-9170 | ECS | Orals | HS4.2

Analysis of droughts and arid conditions in Central Asia using climate indices 

Milena Latinovic, Valeria Selyuzhenok, and Abror Gafurov

Droughts pose significant challenges to water resources, agriculture, and socioeconomic stability, particularly in regions susceptible to climatic extremes such as Central Asia (CA) with its complex topography and diverse ecosystem. In the past several years there has been a substantial decrease in water storage in the region which further could lead to socioeconomic instability. Water is mainly used for irrigation and hydropower production in the region.

In CA, the availability of ground observations is restricted, with most of the measurement stations being outdated since the Soviet era with little or no data sharing between the countries. Consequently, the utilization of widely available remotely sensed data proves advantageous in overcoming these limitations and improving the accuracy of water availability assessment in the region.

CA relies predominantly on water resources derived from the melting of snow and glaciers in the Pamir, Tian Shan, and Hindukush mountains. In the study, we consider the two largest upstream river basins, Amu Darya and Naryn, the eastern headstream of Syr Darya. These two largest rivers in CA are crucial sources of water in the region, supporting agriculture and the ecosystem in the whole of CA.

The study specifically focuses on evaluating snow cover and Snow Water Equivalent (SWE) during the winter months, especially preceding the onset of drought periods, and the Total Water Storage (TWS) in the drought months. The objective is to comprehend and quantify the correlation between these climatic elements and historical droughts, utilizing the Drought Severity Index (DSI) and the widely used Standardized Precipitation Index (SPI).  DSI is based on the TWS value that is derived from the GRACE and GRACE-FO satellite missions. It shows a significant decrease in water storage in both basins since the start of the GRACE mission in 2002, with more intense arid conditions in the last 6 years. SPI-6 and SPI-9 based on precipitation and SWE data, show a slight increase in the trend in the Amu Darya basin, while in Naryn all indices show an increase in drought periods. This indicates that the arid conditions in the summer months in the Amu Darya basins are driven by human-induced water depletion. Finally, all indices can depict severe droughts in 2008, 2011 and 2018 in both basins. The study shows the potential of using globally available TWS data for drought assessment on a regional scale such as in CA.

How to cite: Latinovic, M., Selyuzhenok, V., and Gafurov, A.: Analysis of droughts and arid conditions in Central Asia using climate indices, EGU General Assembly 2024, Vienna, Austria, 14–19 Apr 2024, EGU24-9170, https://doi.org/10.5194/egusphere-egu24-9170, 2024.

EGU24-9531 | Posters on site | HS4.2

Building a hybrid drought monitor model based on U.S. Drought Monitor 

Haiting Xu, Jianhui Wei, and Ying Pan

Drought is one of the costliest natural disasters, capable of causing significant losses in agriculture, economy, and ecosystems. Different definitions of drought from multiple perspectives made drought research complicate. Exploring droughts from a comprehensive perspective improves our understanding of the evolution and drivers of drought, while there are few such comprehensive studies. The establishment of the United States Drought Monitor (USDM) marks a significant milestone in the development of composite drought indices, amalgamating objective inputs with subjective evaluations from local experts. Its uniqueness lies in integrating subjective assessments from climate and water resource experts across the United States. However, due to the human subjectivity involved in creating USDM maps, its algorithms are challenging to apply beyond the United States. In this study, a Hybrid Drought Monitor Model (HDMM)  was built using the random forest algorithm to predict drought categories based on USDM drought categories, input drought indices, and 10 static variables. The results indicate that during the testing phase, the overall accuracy of the 0.04° resolution HDMM reached 95%, surpassing the 91% overall accuracy at 1° resolution. Among the categories, D-1 (Normal or wet conditions) drought accuracy was the highest, while D0 (Abnormally Dry) drought accuracy was the lowest. During the validation phase, the HDMM exhibited good overall prediction of drought levels, yet spatial discrepancies existed across the continent. It performed poorly in the southwestern and northern regions, with overestimation of drought severity in many areas. Case studies of the 2017 Northern Plains Drought and the 2021 Southwestern Drought demonstrate that HDMM provided reliable drought classification and possessed good predictive capability. The HDMM can be adapted to other regions worldwide, offering a promising tool for land managers and local governments to prepare for and mitigate the impacts of drought.

How to cite: Xu, H., Wei, J., and Pan, Y.: Building a hybrid drought monitor model based on U.S. Drought Monitor, EGU General Assembly 2024, Vienna, Austria, 14–19 Apr 2024, EGU24-9531, https://doi.org/10.5194/egusphere-egu24-9531, 2024.

EGU24-10512 | Orals | HS4.2 | Highlight

Water scarcity under droughts and heatwaves: understanding the complex interplay of water quality and sectoral water use 

Michelle van Vliet, Gabriel Cardenas Belleza, Duncan Graham, and Edward Jones

Droughts and heatwaves pose serious challenges for water management and severely increase water scarcity in many regions of the world. It is increasingly recognized that water scarcity represents more than just a physical lack of water, referring to the imbalance between the supply and the demand of water of suitable quality for different uses. Changes in both climate and socioeconomic systems influence the availability, use and quality of water resources. Water scarcity thus amplifies when either one or more of the following three driving mechanisms intensify: 1) decreasing water availability; 2) increasing sectoral water use, and 3) deterioration of water quality resulting in unsuitability for use. Droughts and heatwaves are particularly critical as they adversely affect all three driving mechanisms, which are also highly interrelated1. However, limited understanding exists regarding the complex interplay, particularly between water quality and sectoral water use. Here we show responses in sectoral water use and water quality under droughts and heatwaves based on reported data for 1980-2019 globally and discuss a global assessment framework to unravel water scarcity and its drivers under these hydroclimatic extremes.

Our results show that heatwaves and compound drought-heatwave events increase water use mainly for domestic and irrigation water use sectors2. River water quality tends to deteriorate during droughts and heatwaves in most cases as demonstrated based on a global literature survey3 and analyses of river water quality records of 314,046 water quality monitoring stations globally4. This showed for instance on average a 17% decrease in dissolved oxygen and 24% increase in river salinity under droughts and heatwaves over 1980-2019 globally4. Increasing sectoral water use, deterioration of water quality and decreasing water availability each amplify water scarcity in their own right, but more so together due to important interactions. For instance, a decline in water availability during a drought increases water scarcity directly, but also indirectly as less water is available to dilute pollutants, thereby leading to a deterioration of water quality3,4. This may result in higher water scarcity, when water quality thresholds for certain uses are temporary exceeded (e.g., increased salinity for irrigation). Increases in sectoral water use, such as for domestic use and irrigation2, result in higher water scarcity directly, but also indirectly due to water quality impacts. We propose a new integrated modelling framework building on the PCR-GLOBWB2 hydrological model coupled to the DynQual global surface water quality model5 to quantify water scarcity under droughts and heatwaves. Here we consider the two-way interactions between sectoral water use, water quality and water availability to improve understanding of the complex interplay between these water scarcity drivers, and test solutions options towards sustainable water management.


1 van Vliet, M.T.H. (2023) Nature Water 1, 902–904

2 Cárdenas Belleza, G.A., M.F.P. Bierkens, M.T.H. van Vliet (2023) Environ. Res. Lett. 18 104008

3 van Vliet, M.T.H. et al (2023) Nature Reviews Earth Environ. 4, 687–702

4 Graham D.J., M.F.P. Bierkens, M.T.H. van Vliet (2024), J. of Hydrology 629, 130590

5 Jones, E.R., M.F.P. Bierkens, N. Wanders, E.H. Sutanudjaja, L.P.H. van Beek, M.T.H. van Vliet (2023) Geosci. Model Dev. 16, 4481–4500

How to cite: van Vliet, M., Cardenas Belleza, G., Graham, D., and Jones, E.: Water scarcity under droughts and heatwaves: understanding the complex interplay of water quality and sectoral water use, EGU General Assembly 2024, Vienna, Austria, 14–19 Apr 2024, EGU24-10512, https://doi.org/10.5194/egusphere-egu24-10512, 2024.

EGU24-10886 | ECS | Orals | HS4.2

Explainable machine learning revealing the mechanism behind drought events in northern Italy: the case of the 2022 drought 

Chenli Xue, Aurora Ghirardelli, Jianping Chen, and Paolo Tarolli

Drought is a complex natural hazard involving multiple variables that, depending on the measured parameters, can be categorized into meteorological, hydrological or agricultural drought. Among them, agricultural drought, which refers to soil moisture deficits that fail to meet crop growth, has been attracting more attention for severely threatening food security worldwide. In the context of climate change and the increased occurrence of drought events, it is crucial to monitor drought drivers and progression to plan the subsequent efforts in drought prevention, adaptation, and migration. However, the comprehensive knowledge of agriculture drought still needs to be clarified. Previous works often focused on precipitation or evapotranspiration and failed to capture other potential drivers of drought. This study proposes a novel framework to comprehensively monitor agricultural drought with ensemble machine learning by constructing an integrated agriculture drought index with high temporal-spatial resolution. In addition, the Shapley Additive Explanation (SHAP) explainable model was applied to reveal the driving mechanism behind the drought event that occurred in northern Italy in the summer of 2022. Results indicate that the proposed explainable ensemble machine learning model could effectively reflect the evolution of agricultural drought with spatially continuous maps on a weekly scale. The SHAP analysis demonstrated that the severe agricultural drought in the summer of 2022 was closely related to meteorological indicators, namely precipitation and land surface temperature, crucial in controlling soil moisture. Moreover, the new findings also revealed that soil textures could significantly affect agricultural drought. By combining explainable ensemble machine learning and various earth-observation data involving meteorology, soil, geomorphology, and vegetation conditions, the study constructed an integrated index to monitor and assess agricultural drought in northern Italy. The proposed research framework could effectively contribute to improving the methodology in agricultural drought research, potentially bringing more instructive insights for drought prevention and mitigation.

How to cite: Xue, C., Ghirardelli, A., Chen, J., and Tarolli, P.: Explainable machine learning revealing the mechanism behind drought events in northern Italy: the case of the 2022 drought, EGU General Assembly 2024, Vienna, Austria, 14–19 Apr 2024, EGU24-10886, https://doi.org/10.5194/egusphere-egu24-10886, 2024.

EGU24-10948 | Posters on site | HS4.2

On the use of standardized drought indices (SPI and SPEI) for assessing future climate change impacts on drought: introducing a dynamic approach   

David J. Peres, Brunella Bonaccorso, Nunziarita Palazzolo, Antonino Cancelliere, Giuseppe Mendicino, and Alfonso Senatore

Drought is frequently monitored using standardized indices, such as the Standardized Precipitation Index (SPI) and the Standardized Precipitation-Evapotranspiration Index (SPEI). The latter was specifically designed to incorporate climate variability in terms of temperature. Consequently, by definition, it is more suitable for assessing variations in drought frequency and magnitude induced by climate change across various potential future scenarios. 

However, standardization presents a challenge when employing indices to evaluate the potential impacts of future climate change on drought. This is because, by definition, these indices are drawn from a standard normal random variable (null average and unit variance). The assessment of these impacts involves comparing occurrences in a future period and scenario with those in a historical control period. If the indices are separately calibrated for each period (one calibration for the future period and one for the control period), any differences observed may result solely from the sampling variability of a series drawn from a standard normal random variable. Numerous studies have assessed climate change impacts on droughts using this imperfect approach. Conversely, an alternative approach involves computing future indices using parameters from the control period. This represents a "worst-case scenario" as it overlooks potential climate change adaptation measures that could mitigate the impacts. To address this issue, our study introduces a dynamic approach wherein future changes are evaluated by computing climate normals using moving time windows. This approach enables an understanding of how impacts change with the timing of the implementation of adaptation measures. We apply this approach to Sicily and Calabria in Southern Italy, considering various climate change scenarios (Representative Concentration Scenarios). The results suggest that the region is likely to experience an increase in drought events due to climate change. These findings underscore the necessity for revised drought identification strategies that consider the non-stationarity in climate. 

How to cite: Peres, D. J., Bonaccorso, B., Palazzolo, N., Cancelliere, A., Mendicino, G., and Senatore, A.: On the use of standardized drought indices (SPI and SPEI) for assessing future climate change impacts on drought: introducing a dynamic approach  , EGU General Assembly 2024, Vienna, Austria, 14–19 Apr 2024, EGU24-10948, https://doi.org/10.5194/egusphere-egu24-10948, 2024.

EGU24-11049 | Orals | HS4.2 | Highlight

On the predictability of the seasonal droughts at global scale 

Luis Samaniego, Ehsan Modiri, E.H. (Edwin) Sutanudjaja, Pallav Shrestha, Alberto Martinez-de la Torre, Oldrich Rakovec, Robert Schweppe, Matthias Kelbling, Katie Facer-Childs, Amulya Chevuturi, Maliko Tanguy, Niko Wanders, Rohini Kumar, and Stephan Thober

Long-lasting droughts have become more common worldwide in recent decades, such as in Australia (2001-2009), California (2012-2014), Chile (2010-2023), and Europe (2018-2022). The combination of droughts and heatwaves has led to intense flash droughts, worsening soil moisture deficits. This has resulted in global shortages of essential food, serious public health issues, and prolonged forest fires that harm air quality in populated areas. Extended droughts also contribute to food insecurity, reduced energy production, increased health crises, and the destruction of natural landscapes, causing significant economic setbacks in various regions. International agencies, such as the WMO, and water authorities are actively promoting the advancement of seasonal soil moisture monitoring and forecasting systems. In this presentation, we'll give you an update on ULYSSES [2], the global multi-model hydrological seasonal predictions system supported by the Copernicus Climate Change Service. This fully operational system runs directly at the ECMWF's HPC and aims to be the first seamless multi-model hydrological seasonal prediction system with global coverage at a spatial resolution of 0.1 degrees.

The ULYSSES modeling chain builds on the successful EDgE proof of concept [3], employing four advanced hydrological models (Jules, HTESSEL, mHM, PCR-GLOBWB). Notably, this production chain features a distinctive aspect: the utilization of a standard set of physiographical datasets (e.g., DEM, soil properties) with consistent spatio-temporal resolutions and similar forecast inputs for all hydrological models, as well as the same multi-scale routing model (mRM). The seasonal forecasts are initialized using the ERA5-land product from ECMWF. The Equitable Thread Score (ETS) skill is employed to assess the ensemble forecasting abilities for drought events, specifically when soil moisture exceeds 80% of the time, across lead times ranging from one to three months.

In a recent assessment, the global ensemble Equitable Thread Score (ETS) for the system stands at 63%, 43%, and 34% for lead times ranging from 1 to 3 months. Notably, over Europe, the ensemble ETS is significantly higher, reaching 91%, 71%, and 61% for the corresponding lead times. Contrasting these findings with a prior study that employed the mHM initialized with E-OBS forcing and the NMME ensemble over Europe [4], our analysis suggests potential reasons for the diminished performance of the current system. These factors may include: 1) the meteorological forcings utilized for initializing the hydrological models, and/or 2) the skill level of the NWF model ensemble. In this study, we will present the sensitivity of ETS when one of the models (mHM) is initialized with different available forcings procucts available such as EM-EARTH, MSWEP, WE5E, and E-OBS. Finding of this study is key for the further improvement of the system.

References

  • [1] https://doi.org/10.1029/2021EF002394
  • [2] https://www.ufz.de/ulysses
  • [3] https://doi.org/10.1175/BAMS-D-17-0274.1
  • [4] https://doi.org/10.1175/JHM-D-12-075.1
  • [5] https://doi.org/10.1175/JHM-D-19-0095.1

How to cite: Samaniego, L., Modiri, E., Sutanudjaja, E. H. (., Shrestha, P., Martinez-de la Torre, A., Rakovec, O., Schweppe, R., Kelbling, M., Facer-Childs, K., Chevuturi, A., Tanguy, M., Wanders, N., Kumar, R., and Thober, S.: On the predictability of the seasonal droughts at global scale, EGU General Assembly 2024, Vienna, Austria, 14–19 Apr 2024, EGU24-11049, https://doi.org/10.5194/egusphere-egu24-11049, 2024.

EGU24-12175 | Posters on site | HS4.2

Evaluation of daily SPI and SPEI indices for near-real time drought monitoring over CONUS 

Olivier Prat, David Coates, Scott Wilkins, Denis Willett, Ronald Leeper, Brian Nelson, Michael Shaw, and Steve Ansari

Two drought indices; the Standardized Precipitation Index (SPI) and the Standardized Precipitation Evapotranspiration Index (SPEI) are computed over CONUS using daily precipitation and temperature estimates from the NOAA Daily U.S. Climate Gridded Dataset (NClimGrid-Daily). The NClimGrid-Daily dataset consists of four climate variables derived from the GHCN-D dataset: maximum, minimum, and average temperatures and precipitation from 1951 to the present with a 5-km grid resolution. While SPI only uses precipitation as an input to assess drought conditions, SPEI uses both precipitation and potential evapotranspiration (PET). The daily SPI and SPEI are computed over various time scales (30-, 90-, 180-, 270-, 365-, 730-day). The differences between the two indices are being evaluated focusing on the influence accumulation period, differing period of record, and various SPI (McKee et al 1993, Guttman 1999) and daily PET (Thornthwaite and Mather 1957, Camargo et al. 1999, Pereira and Pruitt 2004) formulations. The impact of the period of reference is analyzed to account for the impact of precipitation and temperature changes over time (i.e., 1952-present, 1960-1990, and 1990-2020 for instance). For the most recent period (2000-present), the NClimGrid-SPI and NClimGrid-SPEI are compared against existing droughts monitoring resources such as the weekly US Drought Monitor (USDM). The use of cloud-scale computing resources reduces considerably the computation time and allows for the near-real time computation of daily SPI and SPEI indices. The effort to transfer the SPI and SPEI from research to operation (R2O) and to provide near-real time drought monitoring capabilities is also presented.

How to cite: Prat, O., Coates, D., Wilkins, S., Willett, D., Leeper, R., Nelson, B., Shaw, M., and Ansari, S.: Evaluation of daily SPI and SPEI indices for near-real time drought monitoring over CONUS, EGU General Assembly 2024, Vienna, Austria, 14–19 Apr 2024, EGU24-12175, https://doi.org/10.5194/egusphere-egu24-12175, 2024.

EGU24-12211 | ECS | Posters on site | HS4.2

Developing a national scale drought modelling and short to medium-term forecasting framework for Scotland 

Shaini Naha, Zisis Gagkas, Nick Schurch, Johan Strömqvist, Alena Bartosova, Kit Macleod, and Miriam Glendell

Climate change is resulting in many countries including Scotland being increasingly vulnerable to periods of dry weather, impacting water users and the natural environment. In 2022, large parts of Scotland experienced water shortages, resulting in Scotland Environmental Protection Act (SEPA) suspending water abstractions for abstraction licence holders in some Scottish catchments. Managing these water scarcity events requires the development of a national-scale short- to medium- term drought forecasting capability. In this study, the applicability of widely used open source hydrological models for simulating low flows depends on how various hydrological processes are accounted for in the model structures, the use of diverse calibration criteria and analysis of the associated uncertainties. Currently, few studies exist that consider all these criteria for modelling low flow events. In this study, we choose a lumped conceptual model, GR6J and a semi distributed hydrological response unit-based model, HYPE, for simulating river discharge across 81 catchments in Scotland, used by SEPA to assess water scarcity events. Our modelling framework considered model structural uncertainties by using models of different complexities and model parametric uncertainties, through robust multi-objective model calibration. We first tested this framework on an experimental Scottish catchment where GR6J outperformed HYPE in simulating river discharge after automatic calibration against objective functions KGE and logNSE. Further, calibration against logNSE improved low flow simulation in both models. We then upscaled this methodology for 81 catchments using GR6J, resulting in overall a very good model performance in simulating river discharge in both calibration and validation period with KGE and logNSE ranging from 0.37-0.96 and 0.2-0.93 for 81 gauged catchments respectively. Our next task is to calibrate HYPE for these 81 catchments and use both calibrated models to derive an ensemble of short-term river flow forecasts using 5-days meteorological forecasts from the UK Met Office. Results in overall shall highlight the need for using ensemble of hydrological models and also indicate careful consideration of objective functions, while simulating and forecasting low flows.

How to cite: Naha, S., Gagkas, Z., Schurch, N., Strömqvist, J., Bartosova, A., Macleod, K., and Glendell, M.: Developing a national scale drought modelling and short to medium-term forecasting framework for Scotland, EGU General Assembly 2024, Vienna, Austria, 14–19 Apr 2024, EGU24-12211, https://doi.org/10.5194/egusphere-egu24-12211, 2024.

Drought is one of the natural hazard risks that badly affect both agricultural and socio-economic sectors. Hungary, which is located in Eastern Europe, has already been suffering from different drought periods, and the driest year since 1901 was 2011 when the annual precipitation in Hungary was only 72 percent of the normal value. To better understand droughts and to provide information for adaptation strategies and risk-management systems, there is a strong need for a methodological framework to simulate drought events. However, it is uncertain whether climate models can simulate extreme droughts given the well-known model bias of simulating too light rainfall too frequently. So, the aim of the current study is to investigate the effects of the different model settings on the reproduction of drought characteristics.

In order to quantify the impact of the use of different parameterization schemes on regional climate model outputs, hindcast experiments were completed applying RegCM4.7 to the Carpathian region and its surroundings at 10-km horizontal resolution using ERA-Interim reanalysis data as initial and boundary conditions. In this study, we are testing various combinations of the physics schemes (land surface, microphysics, cumulus and boundary layer schemes) for the year 2011. Each parameterization combination leads to different simulated climates, so their spread is an estimate of the model uncertainty arising from the representation of the unresolved phenomena. The analysis of the RegCM-output ensemble indicates systematic precipitation biases, which are linked to different physical mechanisms in the summer and winter seasons.

Based on the results, RegCM is sensitive to the applied convection scheme, but the interactions with the other schemes (e.g., land surface or microphysics) affect the precipitation. Due to the different treatment of moisture in the schemes, there are differences not only between the representation of the precipitation cycle, but also in other climatological variables such as soil moisture, latent and sensible heat fluxes and cloud cover, which affect the drought characteristics.


The research was funded by the NKFIH-471-3/2021 project (the National Multidisciplinary Laboratory for Climate Change, RRF-2.3.1-21-2022-00014).

How to cite: Kalmár, T. and Pongrácz, R.: Parameterization-based uncertainties in RegCM simulations over Hungary in a dry year – a case study , EGU General Assembly 2024, Vienna, Austria, 14–19 Apr 2024, EGU24-12456, https://doi.org/10.5194/egusphere-egu24-12456, 2024.

Agricultural drought threatens global water security, food security, and natural ecosystems. Accurate identification of agricultural drought is a crucial task to mitigate its consequences. However, it is challenging to achieve reliable and accurate regional agricultural drought assessment in both wet and dry climates at the same time. Therefore, the objective of this study is to identify a reliable and accurate agricultural drought index that performs well in both dry and wet climates. Drought indices such as the Standardized Precipitation Index (SPI), the Vegetation Condition Index (VCI), the Soil Moisture Anomaly index (SMA), and the Drought Severity Index (DSI) were calculated and compared against in situ drought information devised by official sources in China. The results showed that: (1) DSI based on the Global Land Data Assimilation System (GLDAS) products performed the best in identifying agricultural drought in both dry and wet climate regions of China. (2) Agricultural regions such as Northern arid and semiarid regions, Northeast China Plain, Huang-Huai-Hai Plain, and Loess Plateau, experienced moderate and severe agricultural droughts with a frequency of 20%. (3) The frequency of agricultural droughts observed in Northern arid and semi-arid regions and Northeast China Plain has slowed significantly over the last two decades with a significance level of 0.01. On the other hand, the number of agricultural droughts has increased in Yunnan-Guizhou Plateau since 2002.

How to cite: Pan, Y. and Xu, H.: Accuracy of agricultural drought indices and analysis of agricultural drought characteristics in China between 2000 and 2019, EGU General Assembly 2024, Vienna, Austria, 14–19 Apr 2024, EGU24-12858, https://doi.org/10.5194/egusphere-egu24-12858, 2024.

EGU24-12984 | ECS | Posters on site | HS4.2 | Highlight

Understanding the Causalities between Multiple Environmental Variables and Droughts in Amazon Basin 

Weikang Qian, Yixin Wen, Alireza Farahmand, and Jesse Kisembe

Establishing an early-warning system for droughts in the Amazon Basin holds paramount importance due to the region's critical role in global climate regulation and biodiversity. Droughts in the Amazon not only impact local ecosystems and communities but also have far-reaching effects on global weather patterns and carbon storage capabilities. To fully understand the drought mechanism and improve early-warning monitoring, it is important not only to detect drought conditions by creating indicators but also to extract signals that could describe the risk of drought outbreaks. To reach this goal, our research characterizes pre-drought signals from multiple environmental variables using causal inference and information theory. This study focuses on environmental variables, such as temperature, precipitation, vapor pressure deficit, evapotranspiration rate, and relative humidity from three perspectives, spatiotemporal characteristic, anomalies, and accumulation. Environmental variables are obtained from satellite observations and reanalysis datasets. We harness the potential of these characteristics, exploring their intricate connections as precursors to drought formation and propagation. Expanding on simple association, we introduce causal inference techniques to discover causalities among environmental variables, and between environmental variables and droughts, while information theory helps us capture non-linear relationships among environmental variables. Thereby, we identify critical thresholds and pre-drought signals where these characteristics contribute to drought onset. This causality-based approach marks a departure from traditional indices, integrating temporal dynamics with a detailed understanding of system interactions. Our findings aim to contribute to sustainable land and water management in the Amazon, ultimately aiding in the preservation of its unique ecosystems and the services they provide.

How to cite: Qian, W., Wen, Y., Farahmand, A., and Kisembe, J.: Understanding the Causalities between Multiple Environmental Variables and Droughts in Amazon Basin, EGU General Assembly 2024, Vienna, Austria, 14–19 Apr 2024, EGU24-12984, https://doi.org/10.5194/egusphere-egu24-12984, 2024.

EGU24-13224 | Posters on site | HS4.2

The GRUVO web application: Bringing groundwater level predictions across Germany to the public 

Stefan Broda, Maximilian Nölscher, Matthias Heber, Patrick Clos, Markus Zaepke, and Wolfgang Stolz

The provision of current and predicted groundwater levels across Germany has become increasingly important, particularly due to the increasing likelihood of consecutive dry years. To address this issue, we present the interactive web application GRUVO, which was developed as a first step to provide groundwater level forecasts and relevant information in a targeted manner for different user groups. We also provide an overview of the features and operation of the application in its current version.

In addition to the visualisation of current groundwater levels, this mainly includes the presentation of monthly updated groundwater level forecasts and projections for short-term (up to 3 months), medium-term (up to 10 years) and long-term (up to 2100) forecast horizons at over 100 so-called reference monitoring sites (RM) distributed throughout Germany. Each of these RMs represents the groundwater levels or dynamics of a few thousand so-called cluster monitoring sites (CMs). This mapping of RMs to CMs was previously determined using a clustering approach. The RM prediction is based on 1-D convolutional neural networks (CNN), which are trained using time series of measured groundwater level data from the responsible state offices as target variables and measured meteorological forcing data from the German Weather Service (DWD) as predictors. Forecasted or projected meteorological information from the DWD is then used to predict future groundwater levels.

Apart from the available features of the current version, this contribution highlights operational challenges and nuances. It also outlines possible extensions for future development.

How to cite: Broda, S., Nölscher, M., Heber, M., Clos, P., Zaepke, M., and Stolz, W.: The GRUVO web application: Bringing groundwater level predictions across Germany to the public, EGU General Assembly 2024, Vienna, Austria, 14–19 Apr 2024, EGU24-13224, https://doi.org/10.5194/egusphere-egu24-13224, 2024.

EGU24-13279 | ECS | Orals | HS4.2

Navigating Water Resource Management: A Forecasting Framework for Interannual Drought Projections 

Ze Jiang, Golam Kibria, and Ashish Sharma

Can CMIP6 decadal projections be effective for multi-decadal water resources planning? This is the underlying question that motivates the present research, investigating what are the key deficiencies that limit their direct use for applications, and whether cleverly formulated mathematical alternatives can be used as effective postprocessors. This study focuses on the development of a robust framework for predicting droughts over interannual to decadal scales to enhance water resource management. The proposed framework utilizes the Wavelet System Prediction (WASP) methodology, which refines the spectral attributes inherent to climate indices to improve the skill of drought forecasts. Further improvement in forecasting capability is achieved through the Hierarchical Linear Combination (HLC) logic, which incorporates forecasts from ten climate indices. These indices, including ENSO-related sea surface temperature anomalies and other climate drivers closely linked to Australian rainfall, are derived from decadal predictions of the Decadal Climate Prediction Project (DCPP). The results of projected drought indices across various scales in Australia demonstrate the substantial potential of the integrated HLC-WASP framework to significantly improve the forecast skills of medium to long-term drought scenarios. This advancement enables the water industry to adapt their strategic plans and optimize reservoir operations effectively. By providing more reliable near-term projections of water availability, this research contributes to effective water resource management, facilitating informed decision-making for water allocation and conservation initiatives.

How to cite: Jiang, Z., Kibria, G., and Sharma, A.: Navigating Water Resource Management: A Forecasting Framework for Interannual Drought Projections, EGU General Assembly 2024, Vienna, Austria, 14–19 Apr 2024, EGU24-13279, https://doi.org/10.5194/egusphere-egu24-13279, 2024.

The availability of water resources generally refers to the volume of total water resources on the surface, sub-surface, and soil. For a precise assessment of the availability of water resources, it is necessary to secure the accuracy of meteorological forecasts such as precipitation and temperature forecasting and to be able to accurately evaluate the volume of invisible water resources under the surface. Metropolitan areas around large rivers can use water stably even in the event of a drought, but the upstream areas with small and medium-sized rivers are vulnerable to water supply stability in drought season. Therefore, highly reliable evaluation and prediction of river discharge is necessary to prepare comprehensive solutions such as efficient operation of water supply facilities and optimal use of available water resources during drought season.  In this study, river discharge was evaluated for 20-16 standard basins in the Yeongsan-Seomjin river basins, respectively, among major river basins in the republic of Korea. The Dynamic Water resources Assessment Tool (DWAT) was used as a assessment model. DWAT is a water resources assessment tool that can be used free of charge worldwide and can be applied to small and medium-sized river basins for water resource planning and management that considers surface water as well as groundwater and water usage for various purposes. The calibration period was set from 2012 to 2019, and the validation period was set from 2020 to 2021. In addition, simulation accuracy was calculated through a 1:1 comparison of observed and simulated discharge data based on the calibration point, and model efficiency (Nash Sutcliffe Efficiency, NSE)

How to cite: Jang, C., Kim, D., Choi, J., Shin, H., and Kim, H.: Evaluation of the River Discharge Considering Interaction of Surface water and Groundwater in the Yeongsan-Seomjin River in the Republic of Korea Using DWAT (Dynamic Water Resources Assessment Tool, DWAT), EGU General Assembly 2024, Vienna, Austria, 14–19 Apr 2024, EGU24-13771, https://doi.org/10.5194/egusphere-egu24-13771, 2024.

EGU24-15433 | ECS | Orals | HS4.2

Exploring the Interplay of Climatic Trends, Reservoir Fluctuations, and Vegetation Dynamics in Paphos, Cyprus: A Decade-Long Study Towards Sustainable Resource Management 

Eleni Loulli, Ioannis Varvaris, Marinos Eliades, Christiana Papoutsa, and Marios Tzouvaras

Drought is a complex phenomenon that cannot be easily detected in its early stages and advances slowly, but cumulatively. Its consequences can be short-term, such as water deficiency in rivers and dams, and long-term like saltwater intrusion and ecosystem degradation. These impacts make agricultural productivity vulnerable, exacerbate waterborne diseases and increase the risk or wildfires, posing a threat to food security, safety and sovereignty. Cyprus, characterized by a semi-arid climate, experienced in recent years prolonged and frequent droughts that had multiple impacts on agricultural production and consequently the ecosystem and the economy. In the face of a changing climate and increased frequency of droughts, monitoring and understanding such phenomena is crucial in mitigating their impacts. Our overall goal is to investigate the relationships between climatic trends, reservoir fluctuations and vegetation dynamics over the study period. Therefore, we provide a comprehensive analysis of the previously mentioned relationships for the hydrological region of Paphos, (Cyprus) for the period between 2013 and 2023. Vegetated areas are extracted using the European Space Agency WorldCover tree cover, shrubland, grassland, and cropland land cover classes. The study integrates measurements at meteorological stations and satellite-derived time series to assess the relationship between climatic variables and vegetation processes. In particular, we compare the Standardized Precipitation Index (SPI) calculated using CHIRPS data (Climate Hazards Group InfraRed Precipitation with Station Data), with hydrological drought indices provided by the Water Development Department. The latter are estimated on the basis of a drought indicator system that utilizes monthly dam Inflows and mean daily flows of hydrometric stations. Additionally, we analyze spatial climatic variables (such as the MODIS Land Surface Temperature and Evapotranspiration) and vegetation indices (such as MODIS and Sentinel-2 Normalized Difference Vegetation Index, Enhanced Vegetation Index, and Green Chlorophyll Index). Preliminary results show that vegetation dynamics and drought patterns vary based on seasons and the studied land cover classes. The findings of our study are anticipated to contribute to sustainable land and water resources management in the Paphos region.

Acknowledgements

The authors acknowledge the ‘GreenCarbonCY’: Transitioning to Green agriculture by assessing and mitigating Carbon emissions from agricultural soils in Cyprus. The ‘GreenCarbonCy project has received funding from the European Union - Next Generation, the Recovery and Resilience Plan “Cyprus_tomorrow”, and the Research & Innovation Foundation of Cyprus under the Restart 2016-2020 Program with contract number CODEVELOP-GT/0322/0023.

How to cite: Loulli, E., Varvaris, I., Eliades, M., Papoutsa, C., and Tzouvaras, M.: Exploring the Interplay of Climatic Trends, Reservoir Fluctuations, and Vegetation Dynamics in Paphos, Cyprus: A Decade-Long Study Towards Sustainable Resource Management, EGU General Assembly 2024, Vienna, Austria, 14–19 Apr 2024, EGU24-15433, https://doi.org/10.5194/egusphere-egu24-15433, 2024.

EGU24-15845 | Posters on site | HS4.2

Large scale modeling of clay shrink-swell risk for current and future climate scenarios. 

Aurelien Boiselet and Gregory Seiller

In recent years, the risk of clay shrinkage-swelling has emerged as a significant concern for land use planning and for insurance companies. These superficial clay soils exhibit vertical movement (contraction and expansion), linked to meteorological conditions. Despite the slow pace of these fluctuations, they can reach an amplitude large enough to damage buildings located on these soils. In France, this hazard appears in second rank in terms of losses with events that can generate more than one billion euros in losses .

To better mitigate this risk, the French geological and mining risks office (BRGM) conducted a detailed mapping of exposure to clay shrink-swell across France. This departmental-scale analysis is based on the lithological nature of the soil, the mineralogical composition, geotechnical behavior, but also the loss experience observed. However, the susceptibility of a soil to swell has not been studied at global scale but rather over some territories. Given the current climate change, it is also necessary to understand the conditions linked to the occurrence of these events as well as the inherent impacts. This study focus on these two aspects: exposure and impact.

To estimate whether a soil might be prone to swelling, we developed a machine learning model based on exposure maps published for France and the USA with a set of pedological parameters (CEC of clay, soil texture, bulk density, etc. coming from Soilgrids & Harmonized World Soil Database models) and geological parameters; associated with the presence of clayey soils with swelling capacity. We achieved a prediction accuracy of nearly 70% on our test set in these 2 countries. For France, this approach allows us to estimate that 52% of the territory presents a medium or high exposure to this peril, which is consistent with the BRGM analysis of 49%. With this approach we also estimated that 52% of Germany’s territory is exposed to medium to high swelling susceptibility.

The impact analysis of this hazard is performed on France based on the publication of the CatNat decrees by the French Central Reinsurance fund, the loss ratio observed by AXA and climate indicators such as the Standardized Precipitation-Evapotranspiration Index (SPEI). The SPEI is a climatic indicator that is sensitive to water-balance variations, calculated over different time scales, allowing for the assessment of both short-term and long-term climatic conditions. The SPEI is particularly useful in regions where evapotranspiration plays a significant role in moisture availability. By analyzing the SPEI in conjunction with the CatNat decrees and the loss ratio observed by AXA, we can gain a comprehensive understanding of the current clay shrink-swell risk. This multi-faceted approach allows us to not only assess the current state of the hazard but also predict future trends.

How to cite: Boiselet, A. and Seiller, G.: Large scale modeling of clay shrink-swell risk for current and future climate scenarios., EGU General Assembly 2024, Vienna, Austria, 14–19 Apr 2024, EGU24-15845, https://doi.org/10.5194/egusphere-egu24-15845, 2024.

EGU24-16037 | ECS | Orals | HS4.2

A drought monitoring and forecasting system for Switzerland 

Vincent Humphrey, Fabia Hüsler, Simone Bircher-Adrot, and Adel Imamovic

The intensity and frequency of dry spells in Switzerland have increased in recent years and are likely to increase in the future. Meanwhile, increases in water use and competition between different actors also place a greater pressure on existing water resources. Because drought has been identified as one of the main risks for various economic sectors in Switzerland, a national monitoring and forecasting system is to be established through the joint efforts of three different governmental agencies (federal offices for the environment, meteorology and climatology, and topography). The project also actively involves stakeholders in its development.

In this contribution, we introduce the Swiss national drought project with a particular focus on user-centered design, in situ and satellite-based monitoring, and the integration of sub-seasonal forecasts. Results from a user-survey revealed that even though drought is multi-dimensional and affects stakeholders in different ways, one of their primary needs is still a holistic “combined” drought index that can serve as a common ground for discussion and decision-making. Simple, local-scale-focused designs were assessed as the most efficient and useful, whereas designs showcasing nationwide maps or scientific quantities (SPI, etc.) were the least meaningful to educated but not expert users.

Further efforts include the creation of a national in situ soil moisture monitoring network with approximately 30 stations, the development of meteorological and agricultural drought products and indices, as well as the establishment of near real time, downscaled, sub-seasonal forecasts derived from existing systems (ECMWF IFS Extended). Integrating these highly heterogeneous data streams into seamless products ranging from historical observations to sub-seasonal forecasts, all within a consistent climatological baseline, is expected to represent both a major technical challenge but also a significant step forward that will greatly benefit downstream user applications. This novel meteorological basis will directly feed into impact-relevant drought indices and hydrological models, with the aim of better supporting an early warning system that has to take into consideration the needs of a very diverse user community, such as hydropower production, navigation, agriculture, forestry, artificial snow production, or ecology.

How to cite: Humphrey, V., Hüsler, F., Bircher-Adrot, S., and Imamovic, A.: A drought monitoring and forecasting system for Switzerland, EGU General Assembly 2024, Vienna, Austria, 14–19 Apr 2024, EGU24-16037, https://doi.org/10.5194/egusphere-egu24-16037, 2024.

EGU24-16800 | Posters on site | HS4.2

Multi-Source Earth Observation Data for Drought Monitoring in the Borena Region in Southern Ethiopia 

Elias Cherenet Weldemariam, Getachew Mehabie Mulualem, Tinebeb Yohannes, Héctor Nieto, Ana Andreu, and Vicente Burchard-Levine

Drought is a recurring phenomenon in the Borena region of Southern Ethiopia. The imbalance between potential evaporation and precipitation during the growing season often results in drought conditions, posing significant threats to the biodiversity, agriculture and human activities. The zone has endured severe drought risk due to consecutive years of no rainfall, significantly impacting ecosystem services, livestock and agro-pastoralist communities. To mitigate the effects of droughts and to provide quick decision-making with timely information for an effective response, it is crucial to regularly analyze the information about its severity and its extent in terms of spatial and temporal pattern. This study analyzes the spatial and temporal pattern of drought in the Borena region, using integrated indices such the Composite Drought Index (CDI) from 2000 to 2022. The CDI, which incorporates the Precipitation Drought Index (PDI), the Temperature Drought Index (TDI), and the Vegetation Drought Index (VDI), are used as input to examine spatial and temporal drought patterns, providing a comprehensive view of drought conditions over the given area. Additionally, the Mann–Kendall trend test and Sen’s slope were employed to understand the trends of these indices and determine their magnitude of change.

The study identified the occurrence of extreme drought events in recent years during 2007, 2011, 2014, 2016, 2017, and 2021 in Borena Zone. The findings also showed a decreasing trend in rainfall, an increase in temperature, and a diminishing trend in vegetation condition during the study period. Specifically, the computed mean growing season of the Normalized Difference Vegetation Index (NDVI) values ranged between -0.02352 to 0.0312, with 57.67% of the Borena region showing a decreasing trend. Future work will incorporate actual evapotranspiration (ET) estimates based on thermal infrared (TIR) imagery within the CDI, as this has the potential to more rapidly detect water stress in vegetation compared to spectral indices such as NDVI. These findings can guide the development of climate policies, disaster risk reduction and strategies in Ethiopia, contributing to the mitigation of future drought impacts and the promotion of sustainable dryland natural resources practices, including supporting early drought warning detection systems for agro-pastoralist communities.

How to cite: Weldemariam, E. C., Mulualem, G. M., Yohannes, T., Nieto, H., Andreu, A., and Burchard-Levine, V.: Multi-Source Earth Observation Data for Drought Monitoring in the Borena Region in Southern Ethiopia, EGU General Assembly 2024, Vienna, Austria, 14–19 Apr 2024, EGU24-16800, https://doi.org/10.5194/egusphere-egu24-16800, 2024.

EGU24-17245 | Orals | HS4.2

Evaluation of opportunities to characterize and monitor moisture in the unsaturated zone above the Western Mountain Aquifer 

Peter Dietrich, Ulrich Maier, Alireza Kavousi, Anna Rieß, Irina Engelhardt, and Martin Sauter

The GRaCCE project (Groundwater Recharge and Climate Change Effects - Quantification of resilience of water resources in carbonate aquifers to drought conditions) aims to develop process-based integrated and data-driven surrogate methods for determining groundwater recharge and predicting droughts in order to support water management in semi-arid regions such as Israel, Palestine and Jordan. Previous studies have shown that the thick vadose zones (several hundred meters) prevalent in the region can be relevant for water management as long-term reservoirs and, if considered as a dynamic water resource, can contribute to mitigating supply shortages during long-term droughts. In order to evaluate this water resource, it is necessary to characterize and monitor the moisture distribution in the vadose zone. In principle, borehole- and surface-based geophysical methods as well as remote sensing data can be used for this purpose. In order to assess the possibilities of the various methods for the specific site conditions of the Western Mountain Aquifer, the water balance of the area was investigated for the period from 1950 to 2020 using a double permeability variably saturated HydroGeoSphere model. Moreover, the distribution of soil moisture content at four intervals up to a cumulative depth of two-meter was inspected utilizing FLDAS2 NASA daily dataset. The temporal development of vertical moisture profiles was extracted from the HydroGeoSphere and FLDAS2 models for some selected locations. The profiles show a strong “intra-annual variation” at soil level which is strongly dampened by a depth two meter. This variability is generally not observed in higher depth profiles, as generated by HydroGeoSphere, where the shift from wet to dry periods made some “inter-annual variation” of moisture content. This result further supports the former studies claiming the importance of vadose zone on regulation of drought periods at aquifer level. Moreover, based on this assessment, a site-specific initial assessment of the suitability of the measurement methods such as cosmic ray neutron sensing, ground penetrating radar, resistivity measurements, nuclear magnetic resonance and remote sensing was carried out.

How to cite: Dietrich, P., Maier, U., Kavousi, A., Rieß, A., Engelhardt, I., and Sauter, M.: Evaluation of opportunities to characterize and monitor moisture in the unsaturated zone above the Western Mountain Aquifer, EGU General Assembly 2024, Vienna, Austria, 14–19 Apr 2024, EGU24-17245, https://doi.org/10.5194/egusphere-egu24-17245, 2024.

EGU24-17370 | Orals | HS4.2

Empowering communities through seasonal forecasts use: a lesson learned from the Euro Mediterranean 2021-2023 drought event 

Massimiliano Pasqui, Ramona Magno, Arianna Di Paola, Sara Quaresima, Elena Rapisardi, Lenadro Rocchi, and Edmondo Di Giuseppe

In the period between 2021 and 2023, the Euro-Mediterranean region experienced a series of significant thermo-pluviometric anomalies. In particular, in the central Mediterranean, the Copernicus Climate Change Service identified exceptional temperature anomalies and a complex and intense drought, also highlighted in the "European State of the Climate (ESOTC)" reports. Prolonged periods characterised by extreme weather events pose a serious threat to both society and human activities, even in advanced countries. 

Water scarcity and water resources management play a prominent role among the climatic threats, as their impacts represent the main pressure mechanisms for human beings, ecosystems, and many human activities. Therefore, it becomes imperative to develop advanced systems for forecasting and anticipating climate variability to provide crucial information to decision-makers and users, facilitating preparation for mitigation actions. Addressing this challenge requires the implementation of operational predictive systems on a seasonal scale that are reliable, salient, and easily adaptable, aiming to enhance economic and societal resilience. To this end, the Drought Observatory (DO) of CNR IBE, a web-based climate service open to the public, has developed and maintained a prediction system based on various components: a seamless prediction system based on the European model SEAS5, coupled with a bias adjustment algorithm; a Non-Homogeneous Poisson process trend analysis of individual drought severity classes; and an evaluation of vegetation stress trough indices calculated from both atmospheric variables and remotely sensed quantities. The DO has been conceived to share both the outcomes of ever-evolving scientific research and a structured set of scientific information. Tailored to different levels of complexity, this information aims to address the informational needs of both technical experts and decision-makers, as well as a wider audience and media representatives.

The DO develops these components in close collaboration with stakeholders and users engaged in institutional activities and national and international research projects. This interaction strengthens decision-making processes for adapting to meteorological and climatic risks and adversities.

An integrated approach, that relies on “converging evidence”, has been adopted to achieve an even more pertinent level of information. The 2021-2023 period, characterized by extreme climatic conditions, has been studied as a rare multiyear event to assess the effectiveness of seasonal-scale anticipation systems for climate anomalies. Moreover, this timeframe proves particularly valuable for understanding and addressing challenges associated with climate change.

Verification analysis shows that seasonal forecast skills vary over time and geographical areas. It is thus possible to identify windows of opportunity for specific tasks in cooperation with users. Within this framework, bias-corrected seasonal forecasts provide valuable supporting information for water resources management and decision-making processes. Throughout the drought period from 2021 to 2023, the Drought Observatory played a pivotal role, extensively utilized by national and international media to disseminate precise information regarding the drought trend in Italy. This underscores the crucial requirement for timely and science-based data to enlighten the broader public.

How to cite: Pasqui, M., Magno, R., Di Paola, A., Quaresima, S., Rapisardi, E., Rocchi, L., and Di Giuseppe, E.: Empowering communities through seasonal forecasts use: a lesson learned from the Euro Mediterranean 2021-2023 drought event, EGU General Assembly 2024, Vienna, Austria, 14–19 Apr 2024, EGU24-17370, https://doi.org/10.5194/egusphere-egu24-17370, 2024.

EGU24-18825 | ECS | Posters on site | HS4.2

Groundwater Resilience under Extreme Drought  

Eleyna McGrady, Claire Walsh, Stephen Birkinshaw, and Elizabeth Lewis

Abstract:

Government guidance suggests that, by 2050, water companies should be resilient to a 1-in-500-year drought, allowing them to maintain supply in all except the most extreme droughts. However, drought is poorly defined with no universally accepted definition. This is because drought is often the result of many complex processes, is not a distinct event, and is usually only recognisable after a period of time. This leads to problems when predicting, quantifying, and assessing the impact and magnitude of drought within the environment. Consequently, how do water companies prepare themselves for an extreme drought when such drought cannot be quantified? Particularly, how do they ensure that groundwater resources are resilient, given the dependence on these resources to provide public water supply? These questions are particularly prevalent due to the predicted changes in climate and the current lack of understanding of how and to what magnitude groundwater resources will be affected.

Global warming has already been shown to affect groundwater droughts in the UK, however its impact on groundwater resources has not been quantified due to the challenges associated with defining groundwater drought onset and termination, as well as the difficulties with identifying how precursor conditions affect the magnitude and duration of groundwater drought. This lack of knowledge makes groundwater resources vulnerable to direct climate change and also to the indirect socioeconomic pressures associated with climate change.

Modelling is an important process in the assessment of the impacts of drought on groundwater, however, the principle focus of climate change research with regards to groundwater has been on assessing the likely direct impacts of a general changes in precipitation and temperature patterns, using a range of modelling techniques such as soil water balance models, empirical models, conceptual models, and distributed models. However, model development has been focusses within specific fields, for example surface hydrology and flooding, groundwater, distribution networks, and water resource systems and the integration of these separate models has been limited. Integrated, physically-based, and spatially distributed models have generally not been used in large sample studies due to their extensive time, data, and computational resource requirements, however they are key to representing surface water-groundwater interactions accurately, which is key in determining how groundwater will be affected by changes in climate, and hence drought.

Subsequently, this research uses SHETRAN, a physically-based, spatially-distributed hydrological model, in a large sample size study of UK river catchments. Through using this model, the aim of this research is to address gaps in knowledge and fully understand the response of groundwater resources to changing climate, the impact of pre-cursor conditions on drought magnitude and duration, and aims to improve the current issue that is the lack of an adequate model that can be used to investigate these issues.

How to cite: McGrady, E., Walsh, C., Birkinshaw, S., and Lewis, E.: Groundwater Resilience under Extreme Drought , EGU General Assembly 2024, Vienna, Austria, 14–19 Apr 2024, EGU24-18825, https://doi.org/10.5194/egusphere-egu24-18825, 2024.

EGU24-19051 | Orals | HS4.2

Multi-model seasonal forecasting service for meteorological droughts 

Hector Macian-Sorribes, Dariana Avila-Velasquez, and Manuel Pulido-Velazquez

Drought indicators have been proven to be powerful tools to improve drought awareness and decision-making, being a key information source for water resource management in many countries and regions over the world. However, the integration of meteorological drought indicators and seasonal forecasts is not fully explored yet, since most of the drought prediction and early warning services (e.g. European Drought Observatory, Climate Prediction Center) offer limited information on drought forecasting at the seasonal scale.

This contribution presents a multi-model seasonal forecasting service of selected meteorological drought indicators, developed in the context of the WATER4CAST project, for the Jucar River Basin (Spain). This service offers seasonal forecasts (up to 6-7 months in advance) of SPI and SPEI indicators with time aggregations of 6, 12, 18 and 24 months. Input meteorological forecasts to compute them are obtained from the Copernicus Climate Change Service (C3S) for the ECMWF-SEAS5, MétéoFrance-System8, DWD-GCFS21 and CMCC-SPSv35 forecasting systems. These forecasts are post-processed against ERA5 reference data to ensure they are tailored to the climatic patterns of the Jucar River Basin, employing artificial intelligence algorithms (fuzzy logic) trained for the 1995-2014 period. Reference evapotranspiration for the calculation of SPEI indicators is estimated using the Hargreaves method. Once meteorological forecasts are post-processed and upscaled to the monthly scale, aggregated forecasts required to compute SPI and SPEI are made by combining them with past data from ERA5 (e.g. an SPI12 forecast for the next month would require 12-month aggregated precipitation forecasts made up by combining precipitation predictions for the next month with past precipitation records for the last 11 months). Finally, aggregated forecasts of precipitation (for SPI) and precipitation less reference evapotranspiration (for SPEI) are transformed into SPI and SPEI by standardizing them using the gamma (SPI) and the loglogistic (SPEI) probability functions, fitted for each ERA5 point using reference data for the 1973-2022 period. All the calculation process is coded in Python, and it is automatically launched as soon as new seasonal forecasts are available in the C3S.

The resulting service offers seasonal forecasts at the monthly scale, from 1 to 6/7 months in advance (depending on the forecasting system), of SPI and SPEI for the aggregations given at each point of the ERA5 grid overlapping the Jucar River Basin. These forecasts are uploaded into a web platform (https://water4cast-app.upv.es/) that offers information both for a given point (in with the ensemble of SPI and SPEI forecast is displayed using box-whisker plots) and with a general picture (depicting the probability of being in a dry (index <= -1), normal (-1 < index < 1) or wet (1 <= index) period.

Acknowledgements:

This study has received funding from the SOS-WATER project, under the European Union’s Horizon Europe research and innovation programme (GA No. 101059264) and the subvencions del Programa per a la promoció de la investigación científica, el desenvolupament tecnològic i la innovació a la Comunitat Valenciana (PROMETEO) under the WATER4CAST project.

How to cite: Macian-Sorribes, H., Avila-Velasquez, D., and Pulido-Velazquez, M.: Multi-model seasonal forecasting service for meteorological droughts, EGU General Assembly 2024, Vienna, Austria, 14–19 Apr 2024, EGU24-19051, https://doi.org/10.5194/egusphere-egu24-19051, 2024.

EGU24-19099 | Orals | HS4.2

Drought’s trends over continental Chile using climatic variables of water demand and supply, soil moisture, and vegetation productivity 

Francisco Zambrano, Francisco Meza, Nicolas Raab, and Iongel Duran-Llacer

A persistent drought is impacting Chile. It affects the hydrological system and vegetation development. Research studies have focused on the central part of the country. This is due to a persistent period of water scarcity. This scarcity has been found to be a megadrought. This megadrought was defined by the Standardized Precipitation Index (SPI) of twelve months in December. The SPI only considers precipitation as a drought indicator. It does not account for atmospheric evaporative demand (AED), soil moisture, or their combined effect on vegetation productivity, which are key to understanding the impact of climate on ecological and agricultural drought. We use monthly climatic variables for precipitation, temperature, and soil moisture (1 meter depth) from the ERA5-Land reanalysis product for 1981–2023. Also, we used the Normalized Difference Vegetation Index (NDVI) from the Moderate Resolution Imaging Spectroradiometer (MODIS) for 2000–2023. We calculated the atmospheric evaporative demand (AED) using temperature and the Hargreaves-Samani equation. Then, to evaluate water supply, we derived the SPI. For water demand, we calculated the Evaporative Demand Drought Index (EDDI). We propose the standardized anomaly of cumulative soil moisture at one meter (zcSM) as a multi-scalar drought index for soil moisture. The above indices were calculated for time scales of 1, 3, 6, 12, 24, and 36 months. Lastly, we calculated a drought index for vegetation (a proxy for vegetation productivity), the standardized anomaly of the cumulative NDVI of six months (zcNDVI-6). We use the zcNDVI-6 to assess the impact of variations in water demand and supply on vegetation. We use a Mann-Kendall test to analyze the historical trend of the drought indices in continental Chile. Also, we calculated the temporal correlation between the indices of water supply, water demand, and soil moisture with the zcNDVI. To summarize the results, we divide Chile into five macrozones regarding a latitudinal gradient (north to south): i) “Norte Chico," ii) “Norte Grande," iii) "Centro," iv) "Sur," and v) "Austral." The analysis of trend showed that in the macrozones "Norte Chico," "Centro," and "Sur," the SPI has a decreasing trend that increases at longer time scales (from 1 to 36 months). The trend on EDDI reaches its maximum in the macrozones "Norte Grande" and "Norte Chico," being higher at longer time scales. Regarding the correlation with zcNDVI-6, it was higher for the drought index of soil moisture accumulated over 12 months (zcSM-12), having a r-squared of 0.49 for the “Norte Chico” and 0.44 for the "Centro." Followed by a r-squared of 0.41 with SPI-36 (precipitation accumulated over three years) in the macrozone “Norte Chico.” We conclude that Chile has a persistent decline in water supply for the central part of the country ("Norte Chico" and "Centro") and an increase in water demand in the north ("Norte Grande," "Norte Chico," and "Centro"). The combined effect has contributed to exacerbate the impact on vegetation in the "Norte Chico" and "Centro." The variability of drought conditions in vegetation can be explained in ~50% by de zcSM-12.

How to cite: Zambrano, F., Meza, F., Raab, N., and Duran-Llacer, I.: Drought’s trends over continental Chile using climatic variables of water demand and supply, soil moisture, and vegetation productivity, EGU General Assembly 2024, Vienna, Austria, 14–19 Apr 2024, EGU24-19099, https://doi.org/10.5194/egusphere-egu24-19099, 2024.

EGU24-19536 | Orals | HS4.2

Drought monitoring and early warning with satellite soil moisture data 

Mariette Vreugdenhil, Samuel Massart, Pavan Muguda Sanjeevamurthy, Carina Villegas-Lituma, Markus Enenkel, and Wolfgang Wagner

Many developing countries strongly depend on agriculture, but the sector is challenged by the increasing occurrence of droughts.  Unfortunately, advanced agricultural drought monitoring that can trigger early warning and early action is still not widely available for many countries even though it is crucial to stakeholders including local and regional governments, NGOs, farmers, and vulnerable households. Classic drought monitoring tools often rely on precipitation data, which are influenced by the density of station data. Recently, satellite soil moisture data has gained interest, because of its direct link to plant available water content and the increased availability and quality of satellite soil moisture products over remote regions.  Furthermore, when using radar observations, such as those from Sentinel-1 and Metop ASCAT spatial resolutions up to kilometers can be achieved and information on spatial variability of drought within districts can be provided. Despite advancements in the development of satellite soil moisture products, there remains a significant gap in their adoption and utilization by stakeholders in drought monitoring tools and operational systems. Although a large number of drought indicators are available (Vreugdenhil. et al. 2022), they lack rigorous quality-control with impact data and are not analysis-ready. In addition, users are not familiar with the data or its benefits and have difficulties interpreting the indicators in the context of operational decision-support. 

This study will demonstrate the potential of satellite soil moisture for drought monitoring and yield prediction over Eastern Africa, highlighting strengths and weaknesses of satellite soil moisture. Particularly during the growing season, high correlations are found between different soil moisture products from H SAF Metop ASCAT, ESA CCI and ERA5-Land. During the dry season deviations occur due to subsurface scattering effects on the soil moisture signal.  When analyzing droughts, the onset, intensity and duration of droughts differ strongly with the different indicators. For example, for the Gaza region in Mozambique, severe to extreme drought conditions occurred for 1, 4 or 47 months within a 15 year period depending on the chosen drought indicator.  The impact of using different drought indicators and thresholds on drought severity classification creates challenges for integrating satellite soil moisture drought indicators in operational systems and parametric drought insurance. 


This research is funded by the Austrian Space Application Programme ROSSIHNI project : Remote Sensing and Social Interest for Humanitarian Insights.

Vreugdenhil, M., Greimeister-Pfeil, I., Preimesberger, W., Camici, S., Dorigo, W., Enenkel, M., van der Schalie, R., Steele-Dunne, S., Wagner, W., 2022. Microwave remote sensing for agricultural drought monitoring: Recent developments and challenges. Frontiers in Water 4.

How to cite: Vreugdenhil, M., Massart, S., Muguda Sanjeevamurthy, P., Villegas-Lituma, C., Enenkel, M., and Wagner, W.: Drought monitoring and early warning with satellite soil moisture data, EGU General Assembly 2024, Vienna, Austria, 14–19 Apr 2024, EGU24-19536, https://doi.org/10.5194/egusphere-egu24-19536, 2024.

EGU24-20109 | Posters on site | HS4.2

Using droughts indicators as triggers for water resources management in semiarid mountain regions 

Rafael Pimentel, Pedro Torralbo, Javier Aparicio, Eva Contreras, Ana Adreu, Cristina Aguilar, and María José Polo

In the current context of global warming, droughts frequency and severity have increased in the Mediterranean Region. The past hydrological year, 2022-2023, was a clear example of water scarcity after some years with precipitation below the historical mean threshold. In mountain catchments, this reduction in precipitation has resulted in a significant decrease of the seasonal snow and a shift in the common snowfall patterns. The coastal-mountain catchments in the Sierra Nevada mountain range (southern Spain) exemplify this situation. 

The use of drought indices, which are defined using hydrometeorological information, has been the most used tool for the development of warning systems and the definition of adaptation strategies. Indexes like the Standardised Precipitation Index (SPI) or the Streamflow Drought Index (SSDI), have been widely used when characterising both meteorological and hydrological droughts. However, in high mountain areas, the role of snowfall should also be taken into account in this index definition. Snowfall patterns clearly modifies the precipitation-runoff response on a seasonal basis, changing the water balance at different time scales. Therefore, “snow drought” might result in scarcity conditions even though no warning stage has been reached regarding drought’s alerts yet, and it should also be taken into account in the defintion of these indexes. Furthermore, the intrinsic characteristics of the snow cover in these regions: seasonality, with snow generally present from mid-autumn to mid-spring; low thickness and high density; various accumulation-ablation cycles throughout the year; and, high losses due to evaposublimation, make the specific definition even more necessary.

This work aims to characterise snowfall droughts in semiarid mountains, understanding its connection to precipitation and hydrological droughts, assessing the viability of using drought indexes as tools for a better water-management decision-making. The Guadalfeo Catchment in the Sierra Nevada Mountain Range has been chosen as a representative coastal-mountain catchment of the Mediterranean basin to carry out this analysis.

Both SPI and a Standardised Snowfall Index (SSI, defined as SPI but using snowfall data) were calculated in the study area on different time scales for a reference period of 40 years (1960-2020), together with SSDI from the available streamflow time series. The joint analysis of SSI and SPI on each time scale has allowed us to classify the four potential situations in relation to the occurrence of hydrological drought in the study catchments. The results show the relevant seasonality of snowfall droughts in this area, and the importance of persistent precipitation drought as antecedent conditions for the impacts of low-snow years on the spring and summer streamflow. The validation performed points to an increase of the annual variability of the snowfall regime, very much related to a higher torrentiality of the precipitation regime on an annual basis than to changes in temperature.


Acknowledgement: This research was funded by the Spanish Ministry of Science and Innovation through the research project PID2021-12323SNB-I00, HYPOMED—“Incorporating hydrological uncertainty and risk analysis to the operation of hydropower facilities in Mediterranean mountain watersheds”.

How to cite: Pimentel, R., Torralbo, P., Aparicio, J., Contreras, E., Adreu, A., Aguilar, C., and Polo, M. J.: Using droughts indicators as triggers for water resources management in semiarid mountain regions, EGU General Assembly 2024, Vienna, Austria, 14–19 Apr 2024, EGU24-20109, https://doi.org/10.5194/egusphere-egu24-20109, 2024.

EGU24-20678 | Posters on site | HS4.2

Assessing potential future subsidence due to groundwater depletion in “Alto Genil” Basin (Southern Spain). 

Rosa Maria Mateos, Antonio Juan Collados-Lara, David Pulido-Velazquez, and Leticia Baena-Ruiz

The Vega de Granada aquifer stands out as one of the primary detrital aquifers in the "Alto Genil" Basin in Southern Spain. Its significance lies in its vast extension, covering nearly 200 km2, and its substantial renewable water resources amounting to approximately 160 hm3/yr. Positioned strategically in the metropolitan area of Granada, it holds great relevance from a social point of view. Historically, it has been a crucial water source for meeting agricultural and urban water demands in various municipalities within the Vega de Granada. Over recent decades, groundwater extraction has escalated significantly, driven by urban expansion, and especially during severe droughts that periodically impact the region, resulting in high subsidence rates related to substantial groundwater level depletions.


Historical subsidence rates have been monitored using remote sensing techniques, specifically Differential Interferometric Synthetic Aperture Radar (DInSAR). Previous studies utilized 3 independent sets of images from different satellites: the ENVISAT satellite (C-band) and Sentinel-1A satellites (C-band) from the European Space Agency, and the Cosmo-skyMed constellation (X-band) from the Italian Space Agency. The integration of these datasets has enhanced the definition of the affected area by ground deformation and its temporal evolution. Presently, the European Ground Motion Service from Copernicus provides user-friendly information about ground deformation rates across Europe. EGMS represents a novel tool for the study of natural/induced processes such as land subsidence.


We utilized compiled historical information to devise a preliminary method for assessing groundwater level depletion and its associated subsidence rates in potential future scenarios. The method simulates future groundwater level drawdowns through the application of a straightforward lumped balance equation proposed by Scott (2011). Various approaches, including simple conceptual models and machine learning techniques, were tested to simulate groundwater level dynamics. These approaches aided in a more comprehensive assessment, considering the structural uncertainty associated with different simulation methods. Additionally, we explored linear regression models and neural network approaches (such as NAR or ELMAN) to assess subsidence resulting from groundwater level depletion. Machine learning techniques proved effective in providing better insights into non-linear subsidence processes. In selected points, potential future subsidence in the horizon of 2071-2100 may double in a business-as-usual scenario within the aquifer.

Based on the analysis of potential future subsidence values, we identified constraints that should be imposed on groundwater policies due to the associated risk of land subsidence resulting from groundwater level depletion.


Acknowledgments: This research has been partially supported by the projects: STAGES-IPCC (TED2021-130744B-C21) and SIGLO-PRO (PID2021-128021OB-I00), from the Spanish Ministry of Science, Innovation and Universities.

How to cite: Mateos, R. M., Collados-Lara, A. J., Pulido-Velazquez, D., and Baena-Ruiz, L.: Assessing potential future subsidence due to groundwater depletion in “Alto Genil” Basin (Southern Spain)., EGU General Assembly 2024, Vienna, Austria, 14–19 Apr 2024, EGU24-20678, https://doi.org/10.5194/egusphere-egu24-20678, 2024.

EGU24-21136 | Orals | HS4.2

Enabling long-lead forecasting of agriculture production shocks with soil moisture monitoring and forecasting products to support food insecurity early warning 

Shraddhanand Shukla, Frank Davenport, Eric Yoon, Barnali Das, Weston Anderson, Abheera Hazara, Kim Slinski, and Amy L. McNally

As per USAID’s Famine Early Warning System Network Team (FEWS NET) 110-120 million people are projected to need emergency food assistance across all FEWS NET-monitored countries. Climate shocks such as droughts contribute to acute food insecurity. Better identification and earlier warning of anomalous conditions leading to food insecurity are critical to support decision-making to mitigate the impacts of food insecurity on lives and livelihoods. Agricultural production outlooks are one of the critical components of the famine early warning scenario generation process. Thus far these outlooks have mainly been based on estimates of seasonal rainfall or remotely sensed indicators of vegetation greenness whereas soil moisture estimates (remotely sensed or modeled) have been used as drought indicators but not directly used for crop yield forecasting to assess production shocks, particularly in operational settings. Our past research, which focused on crop yield forecasting in southern Africa, revealed a promising level of skill when soil moisture monitoring products or forecasts were used as predictors of crop yield, relative to traditional predictors such as December to February ENSO. Additionally, a separate study focused on East Africa revealed when and where soil moisture can be the best predictor of crop yield relative to other earth observations. Building upon this initial research, here we investigate the applicability of soil moisture monitoring and forecasting products in crop yield forecasting in up to 20 FEWS NET monitored countries for which processed crop yield data are available at sub-national scale. We first use soil moisture monitoring products, both remotely sensed (such as ESA-CCI) and modeled (such as FEWS NET Land Data Assimilation System) to implement and validate machine learning based within-season crop yield forecasting. We then use seasonal-scale soil moisture forecasts (up to 6 months in future) to enhance the lead-time of crop yield forecasting and implement and validate pre-season (before the start of a crop growing season) long-lead crop yield forecasting, as earlier estimates of food insecurity can provide additional critical time needed for launching famine prevention responses by governments and donor agencies.

How to cite: Shukla, S., Davenport, F., Yoon, E., Das, B., Anderson, W., Hazara, A., Slinski, K., and McNally, A. L.: Enabling long-lead forecasting of agriculture production shocks with soil moisture monitoring and forecasting products to support food insecurity early warning, EGU General Assembly 2024, Vienna, Austria, 14–19 Apr 2024, EGU24-21136, https://doi.org/10.5194/egusphere-egu24-21136, 2024.

The potential use of European Centre for Medium-Range Weather Forecast (ECMWF) ensemble prediction system SEAS5 over Mainland Southeast Asia was evaluated. The evaluation spans 30 years (1985–2014), examining SEAS5's skill in predicting temperature and precipitation. Subsequently, SEAS5 data was used to force the Variable Infiltration Capacity (VIC) hydrological model for runoff and streamflow forecasts, as well as the WOrld FOod Studies (WOFOST) crop model for rice production forecasts. These hydrological and agricultural results were compared against the WFDE5-driven reanalysis using verification skill metrics at grid cells for each month. Furthermore, the hydrological results were compared against observed station data. The reanalysis of rice yield was also compared against FAO observations, but proved inconclusive. The findings reveal promising predictive capabilities for temperature beyond a 2-month forecast, while the skill of precipitation and streamflow forecasts extend to a 1-month. Noteworthy, strong seasonal and regional dependence occurs, with high forecast skills during the pre-monsoon (April–May) and post-monsoon (October–November). Year–to–year precipitation tercile plots highlight skill in predicting the anomalous seasonal conditions associated with ENSO. The significant streamflow skill at each initiation month and lead time corresponds to the forecasting skill of meteorological variables. Nevertheless, it is important to note that the skill level of discharge and runoff forecasts is generally lower compared to the skill in temperature and precipitation. For the rice prediction, SEAS5 exhibits high performance at the beginning of the rainy season, where strong seasonal climate predictions are observed. The model shows the ability to capture anomalous rice yields and consistent accuracy throughout a 1-month to 3-month forecast. However, limitations in skill are evident when rice planting times are delayed by one or two months during the rainy season, as well as when planting in the dry season. SEAS5 shows useful skills that can potentially be used for hydrological and agricultural anticipatory management. The results could already support an initial step to come to potential anticipatory (agro-)hydrological management and could be utilised as an input for an early warning system in various sectors.

How to cite: Wanthanaporn, U., Hutjes, R., and Supit, I.: Skill of the ECMWF SEAS5 ensemble prediction system in streamflow and rice yield forecasting for Mainland Southeast Asia , EGU General Assembly 2024, Vienna, Austria, 14–19 Apr 2024, EGU24-1371, https://doi.org/10.5194/egusphere-egu24-1371, 2024.

EGU24-1543 | Orals | HS4.3

Assessing lagged convective-scale weather ensembles for improved flood forecasting in fast-responding catchments  

Céline Cattoën, Maria-Helena Ramos, Daniela Peredo, Stuart Moore, and Trevor Carey-Smith

High-resolution ensemble weather forecasts are essential for forecasting floods in complex topography with fast-responding catchments. However, they are computationally expensive. This study explores a cost-effective alternative via the use of time-lagged ensembles, defined as ensemble forecasts from the same model initialised at different times but verifiying at the same time.

We evaluate lagged ensemble products, with varying configurations and proportions of lagged members, constructed from convective-scale numerical weather predictions (NWP) ensembles to forecast extreme flood events for fast-responding catchments. We compare four lagged products for two extreme event case studies in France and New Zealand. Lagged NWP ensemble products are used to drive hydrological models and evaluate flood forecasts across a range of performance evaluations based on traditional event-based metrics and user-focused strategies. We construct forecast diagrams and associated metrics based on the Brier Score for varying flood threshold severities to evaluate anticipatory and overly alarmist predictions.  

Comparisons with a control burst ensemble (without any lagging) reveal that flood forecasts derived from lagged convective-scale NWP ensembles have the potential to better capture extreme flood events, albeit with some limitations. Benefits vary with time and lagged product configuration, but generally, lagged ensemble products match or surpass their control counterparts, particularly in spread-skill, anticipatory prediction of a severe flood threshold, and consistency of forecasts -- critical to retaining trust from the emergency management sector. However, lagged products tend to increase overly alarmist predictions at early forecast ranges but become a more effective strategy at longer ranges over a larger region.

Utilising forecast diagram metrics based on the Brier Score allows the evaluation of multiple basins and ensemble products, incorporating an end-user-focused perspective for decision-making, such as anticipation of flood exceedance thresholds. The results provide valuable insights into lagged convective-scale weather ensembles' potential benefits and limitations in enhancing flood forecasting accuracy and reliability.

How to cite: Cattoën, C., Ramos, M.-H., Peredo, D., Moore, S., and Carey-Smith, T.: Assessing lagged convective-scale weather ensembles for improved flood forecasting in fast-responding catchments , EGU General Assembly 2024, Vienna, Austria, 14–19 Apr 2024, EGU24-1543, https://doi.org/10.5194/egusphere-egu24-1543, 2024.

EGU24-4437 | ECS | Posters on site | HS4.3

Application of fuzzy logic for water supply forecasting in three Andean catchments of central Chile 

Daniela Maldonado, Ximena Vargas, and Pablo Mendoza

Understanding the availability and distribution of water resources is crucial for efficient management. Chilean basins in the northern and central regions typically exhibit characteristics of a snow or mixed regime, with snowmelt runoff being the primary source of supply. Industries such as mining, agriculture and hydroelectric power generation experience peak demand during the snowmelt period. Determining the average and monthly distribution of runoff during this period is essential for effective planning.

Currently, both public and private institutions perform forecasts to provide valuable information to diverse users, including farmers and hydroelectric companies. This research aims to enhance the snowmelt forecast in snow-dominated or mixed basins integrating hydrometeorological forecasts and system states into a fuzzy model. The study focuses on the Choapa en Cuncumén, Maipo en el Manzano and Tinguiririca Bajo los Briones rivers.

The methodology establishes relationships between system inputs, such as precipitation, snow cover and temperature, and the output variable of snowmelt runoff. Using membership functions and fuzzy rules, the model is developed based on observations collected over fifteen-year period. The performance of each model is evaluated with the commonly employed metrics, through sensitivity analysis and cross- validation. A subsequent comparison with existing models allows us to draw conclusions about the effectiveness of fuzzy models in predicting snowmelt runoff.

The simulation yield Kling-Gupta Efficiency (KGE) values exceeding 0.5 in the first two basins and close to 0.4 in the last one, indicating an acceptable forecast relative to those produced by other institutions. This underscores varying model performance across the three basins, contingent on specific conditions and dependencies on model inputs. While a successful calibration is achieved, a detailed examination of water rights and streamflow naturalization, particularly in basins where this value holds significance, is essential.

How to cite: Maldonado, D., Vargas, X., and Mendoza, P.: Application of fuzzy logic for water supply forecasting in three Andean catchments of central Chile, EGU General Assembly 2024, Vienna, Austria, 14–19 Apr 2024, EGU24-4437, https://doi.org/10.5194/egusphere-egu24-4437, 2024.

Runoff in small catchments tend to response quickly to heavy precipitation input. The potential disastrous consequences demand a reliable precipitation forecast and flood early warning for an appropriate flood defense management. Numerical weather models provide relatively long lead times that allow early warnings of heavy precipitation. Further, meteorological ensembles consider the uncertainty of the forecast. Feeding this data to a hydrological model propagates the meteorological information and its uncertainty to catchment discharge time series.

Within the scope of the project HoWa-PRO (funded by the Federal Ministry of Education and Research, Germany) we propose a flood early warning system for the example of three catchments in the Free State of Saxony. The so-called sentinel watches meteorological ensemble forecasts of the German Weather Service (DWD). If a specific precipitation criterion is surpassed, the sentinel starts collecting and concatenating various precipitation products. For operational use, a combination of radar, nowcast, and (ensemble) forecast data is created (Radolan-RW, Radolan-RV, Icon-D2-EPS, Icon-EU). Besides this renowned precipitation products, we set up a second hydrologic ensemble forecasting system using prototypic data of upcoming products for precipitation observation and forecasting. Here we combine (1) observed radar data assimilated to precipitation gauges and commercial microwave links (pyRADMAN), and (2) the seamless prediction data SINFONY-INTENSE. The latter is a combination of nowcasting and numerical forecast ensembles. Both data products are delivered some minutes earlier than the classic data. The sentinel evaluates the concatenated precipitation data in the catchments according to further criteria for heavy precipitation events. If a criterion is met, the hydrological model is started with the formerly concatenated full ensemble precipitation data. The results are used in a prototypic web demonstrator to depict the current flood situation in the covered catchments. An easy to grasp traffic light scheme and – if needed or wanted – additional information including the uncertainty range facilitate quick decisions and actions of the flood defense management in the appropriate region.

The sentinel scales well with additional catchments which can be simulated in parallel. Currently, the sentinels for both data versions (operational and upcoming precipitation products) are invoked each 30 min, shortly after new observed data is delivered. The used WeatherDataHarmonizer library (Wagner and Grundmann, 2023) ensures a temporally, spatially, and formally homogeneous precipitation data set with a lead time of maximum 180 h, a time resolution of 15 min, and a spatial resolution of about 1 km. Each component of the sentinel is robust in a sense of handling missing operational data or machine faults.

Additionally to the technical aspects, we present results of operational hydrologic ensemble forecasts for selected events and catchments and compare the performance of both systems.

Wagner, M. and Grundmann, J.: Precipitation Data Harmonizer: Harmonizing radar, nowcast, and forecast precipitation data for hydrological applications, EGU General Assembly 2023, Vienna, Austria, 24–28 Apr 2023, EGU23-8978, https://doi.org/10.5194/egusphere-egu23-8978, 2023.

How to cite: Wagner, M. and Grundmann, J.: Operational Hydrological Ensemble Forecasts in Small Catchments – Implementing Seamless Precipitation Predictions, EGU General Assembly 2024, Vienna, Austria, 14–19 Apr 2024, EGU24-7372, https://doi.org/10.5194/egusphere-egu24-7372, 2024.

EGU24-9172 | Orals | HS4.3

Forecast Verification in Operational Hydrological Forecasting: A Detailed Benchmark Analysis for EFAS 

Maliko Tanguy, Shaun Harrigan, Corentin Carton De Wiart, Michel Wortmann, Thomas Haiden, and Christel Prudhomme

Operational hydrological forecasting systems play a vital role for effective decision-making in disaster management and resource planning. This study addresses the critical need to conduct a fair and realistic assessment of the skill in one such system: the European Flood Awareness System (EFAS). As an integral component of the Copernicus Emergency Management Service (CEMS), EFAS undergoes monthly forecast verification, spanning lead times from 6 hours to 10 days. This verification process provides users with a valuable insight into the system’s performance in predicting streamflow for the preceding month.  

Motivated by the importance of providing stakeholders with trustworthy information, our research focuses on a thorough examination of benchmark forecasts to evaluate EFAS performance. The choice of benchmark forecasts significantly influences the perceived accuracy of the system, and using benchmarks that are too easy to beat can lead to artificially inflated skill. Therefore, the primary objective of this work is to pinpoint the most suitable benchmark, serving as a robust reference for assessing the true capabilities of EFAS. This will then feed into the development of a ‘headline score’ which is a unique value of a key metric representative of a geographical domain that enables to track performance evolution.

The study employs various benchmark forecasts, including persistence forecast, climatology, and the previous day’s forecast, using the Continuous Ranked Probability Skill Score (CRPSS) for skill assessment. Expanding on previous findings that identified persistence forecast as the most suitable for short lead times and climatology for longer lead times, this work refines and extends these results. We specifically examine the influence of catchment characteristics on the selection of the optimal benchmark at different lead times for operational forecasting evaluation. By uncovering the most robust benchmark, our study contributes to a more accurate understanding of EFAS capabilities, ultimately enhancing the overall performance assessment of EFAS. The nuanced insights gained from this focused examination serve as a step toward refining the methodology and criteria employed to develop new ‘headline scores’, instrumental in evaluating the evolution of the system’s forecasting skill.

How to cite: Tanguy, M., Harrigan, S., Carton De Wiart, C., Wortmann, M., Haiden, T., and Prudhomme, C.: Forecast Verification in Operational Hydrological Forecasting: A Detailed Benchmark Analysis for EFAS, EGU General Assembly 2024, Vienna, Austria, 14–19 Apr 2024, EGU24-9172, https://doi.org/10.5194/egusphere-egu24-9172, 2024.

EGU24-9909 | Orals | HS4.3

Ensemble streamflow probability prediction at the sub-seasonal to seasonal (S2S) timescale 

Lingfeng Li, Huan Wu, Lujiang Lu, and Weitian Chen

Sub-seasonal to seasonal (S2S) weather forecasting is widely regarded as a big challenge because of less predictability than short-term and seasonal forecasts, which significantly impedes the streamflow forecasts at the same time scale. In this study, we propose an integrated numerical and statistical approach to improve the accuracy of S2S streamflow forecasting based on a physically based hydrological model, i.e., the Dominant river tracing-Routing Integrated with VIC Environment (DRIVE) model with a Bayesian joint probability (BJP) model. The DRIVE model provides S2S streamflow simulations by leveraging physical processes, while the BJP model could mitigate the issue of over-fitted flood peaks and partially correct under-fitted flows. The main strategy to reduce the streamflow prediction uncertainty is through optimizing the integration of hydrological model simulations and statistical predictions. We applied the integrated DRIVE-BJP model to the Pear River Basin during the 2020-2022 time period and performed the validation according to observations at 24 hydrological stations located within the river basin. The results show the proposed ensemble approach yields significant improvements compared to the single BJP or DRIVE model. This study of fusion of the DRIVE and BJP models to enhance the sub-seasonal flood prediction, showing promising practical values in flood early warning and water resource management.

Key words: S2S, ensemble streamflow forecast, DRIVE model, BJP model, Pearl River basin

How to cite: Li, L., Wu, H., Lu, L., and Chen, W.: Ensemble streamflow probability prediction at the sub-seasonal to seasonal (S2S) timescale, EGU General Assembly 2024, Vienna, Austria, 14–19 Apr 2024, EGU24-9909, https://doi.org/10.5194/egusphere-egu24-9909, 2024.

EGU24-10587 | Posters virtual | HS4.3

Hydrological modelling of the extreme flooding event of July 2021 

Pierre Baguis, Joris Van den Bergh, Emmanuel Roulin, and Françoise Gellens-Meulenberghs

The flooding event of July 2021 is a natural disaster that resulted in fatalities and extensive damage to infrastructure. The flood was triggered by the extreme precipitation event of 13-16 July 2021. We investigate it for a selection of catchments of the Meuse River in Belgium using hydrological modelling and forecasting. 

We make use of a high resolution radar-based quantitative precipitation estimation of the event (RADFLOOD21), generated at the Royal Meteorological Institute of Belgium. This dataset is used to perform simulations with the hydrological model SCHEME in order to analyze the hydrometeorological conditions responsible for the flooding. Hydrological reforecasts are also performed, using the RADFLOOD21 data for initialization and precipitation hindcasts as input to a hydrological prediction system. Precipitation hindcasts are provided by numerical weather prediction (NWP) models, including the ECMWF ENS ensemble predictions. The main goal of the study is to evaluate the model and forecasting system performance in terms of river discharge for this exceptional precipitation event, and to investigate the impact of the new input data.

How to cite: Baguis, P., Van den Bergh, J., Roulin, E., and Gellens-Meulenberghs, F.: Hydrological modelling of the extreme flooding event of July 2021, EGU General Assembly 2024, Vienna, Austria, 14–19 Apr 2024, EGU24-10587, https://doi.org/10.5194/egusphere-egu24-10587, 2024.

EGU24-11481 | Posters on site | HS4.3

Joint verification and evaluation of seasonal forecasts from climate services: Experience from the H2020 CLARA project 

Louise Crochemore, Stefano Materia, and Elisa Delpiazzo and the H2020 CLARA project team

Assessing the information provided by co-produced climate services is a timely challenge given the continuously evolving scientific knowledge and its increasing translation to address societal needs. Here we propose a joint evaluation and verification framework to assess prototype services that provide seasonal forecast information based on the experience from the H2020 CLARA project. The quality and value of the forecasts generated by CLARA services were assessed for five climate services utilizing the Copernicus Climate Change Service seasonal forecasts and responding to knowledge needs from the water resources management, agriculture, and energy production sectors. This joint forecast verification and service evaluation highlights various skills and values across physical variables, services and sectors, as well as a need to bridge the gap between verification and user-oriented evaluation. We provide lessons learnt based on the service developers’ and users’ experience, and recommendations to deploy such verification and evaluation exercises. Lastly, we formalize a framework for joint verification and evaluation in service development, following a transdisciplinary (from data purveyors to service users) and interdisciplinary chain (climate, hydrology, economics, decision analysis). The diagnostics provided by the joint assessment improve on individual quality and skill assessment by bringing forth more dimensions and an in-depth analysis of the sources of service value. Service co-production should thus consider simultaneously and iteratively the quality of the hydro-climate information provided and its value for decision-making to inform robust enhancement strategies. Such effort, however, requires for prolonged collaborations between social and climate scientists, service developers and service users, beyond the lifespan of common research projects and for building communities that allow such long-term collaborations.

How to cite: Crochemore, L., Materia, S., and Delpiazzo, E. and the H2020 CLARA project team: Joint verification and evaluation of seasonal forecasts from climate services: Experience from the H2020 CLARA project, EGU General Assembly 2024, Vienna, Austria, 14–19 Apr 2024, EGU24-11481, https://doi.org/10.5194/egusphere-egu24-11481, 2024.

The main objective of this study is to evaluate the efficacy of machine learning (ML) techniques in improving numerical weather prediction (NWP) based reference evapotranspiration (ETo) forecasts from the European Centre for Medium-Range Weather Forecasts (ECMWF) at short to medium range time scale across different zones in the Indian region. The meteorological hindcasts from ECMWF are used to estimate ETo forecasts using the FAO Penman-Monteith equation. Thereafter, the raw forecasts are post-processed using two ML techniques: Support Vector Regression (SVR) and Extreme Gradient Boosting (XGBoost). The ML techniques are applied to rawETo forecast in order to improve its reliability and accuracy. The raw and ML post-processed ETo forecasts are assessed using deterministic evaluation metrics. Results highlight that ML post-processed ETo forecasts have superior skill than raw ETo forecasts. The highest improvement is reported in the Himalayan regions, and the XGBoost model outperformed the SVR model across all zones. The outcomes of this study has implications towards agricultural water management and irrigation scheduling over the Indian subcontinent.

How to cite: Saminathan, S. and Mitra, S.: Post-processing of short to medium range NWP based reference evapotranspiration forecasts using Machine Learning Techniques across the Indian subcontinent, EGU General Assembly 2024, Vienna, Austria, 14–19 Apr 2024, EGU24-12142, https://doi.org/10.5194/egusphere-egu24-12142, 2024.

EGU24-13749 | ECS | Posters on site | HS4.3 | Highlight

The impact of streamflow forecast errors on economic outcomes in future climates 

Parthkumar Modi, Jared Carbone, Hannah Kamen, Eric Small, Bill Szafranski, Cameron Wobus, and Ben Livneh

More than half of annual runoff across the montane regions of the western US and Europe originates as snowmelt, making knowledge of snowpack crucial to the quality of water supply forecasts. However, ongoing and projected warming is expected to reduce snow water equivalent (SWE) and alter snowmelt timing, thus impacting forecast skill and uncertainty. Rising temperatures are anticipated to reduce the fraction of future precipitation falling as snow by up to 30% in intermountain and continental regions of the western US. This will fundamentally alter the regional water cycle, and we posit that this will increase forecast errors and uncertainty, ultimately impacting the quality of decision-making that relies on water supply information. This research assesses the Relative Economic Value (REV) of water supply forecasts under changing snowpack regimes to understand the impact of forecast uncertainty on economic outcomes. Forecast errors will be rigorously estimated using statistical, physical, and machine learning models applied to 76 western US basins. Historical and projected future hydrology (2025-2050) will serve as a test bed for the analysis. Preliminary results over these basins suggest forecast errors on the order of +/- 25%, corresponding with changes in economic outcomes of up to +/- 15%. With findings from the proposed research, we hope to aid water entities by assessing the economic outcomes based on the skill of water supply forecasts, thereby exploring how forecast users can maximize productivity in response to changing climate conditions.

How to cite: Modi, P., Carbone, J., Kamen, H., Small, E., Szafranski, B., Wobus, C., and Livneh, B.: The impact of streamflow forecast errors on economic outcomes in future climates, EGU General Assembly 2024, Vienna, Austria, 14–19 Apr 2024, EGU24-13749, https://doi.org/10.5194/egusphere-egu24-13749, 2024.

EGU24-13915 | ECS | Posters on site | HS4.3

FROSTBYTE: A reproducible data-driven workflow for probabilistic seasonal streamflow forecasting in snow-fed river basins across North America 

Louise Arnal, Martyn P. Clark, Alain Pietroniro, Vincent Vionnet, David R. Casson, Paul H. Whitfield, Vincent Fortin, Andrew W. Wood, Wouter J. M. Knoben, Brandi W. Newton, and Colleen Walford

Seasonal streamflow forecasts provide key information for decision-making in sectors such as water supply management, hydropower generation, and irrigation scheduling. Principal component regression (PCR) stands as a well-established and widely used data-driven method for seasonal streamflow forecasting, offering advantages over more complex methods, including intuitive use of local data to represent key hydrological processes and low computational resource requirements.

We will present FROSTBYTE, a systematic and reproducible data-driven workflow for probabilistic seasonal streamflow forecasting in snow-fed river basins. FROSTBYTE is available on GitHub as a collection of Jupyter Notebooks, facilitating broader applications in cold regions and contributing to the ongoing advancement of methodologies. This structured workflow consists of five essential steps: 1) Regime classification and basins selection, 2) Streamflow pre-processing, 3) Snow Water Equivalent (SWE) pre-processing, 4) Forecasting using PCR, and 5) Hindcast verification. It was applied to 75 basins characterized by a snowmelt-driven regime and limited regulation across diverse North American geographies and climates. Ensemble hindcasts of winter to summer streamflow volumes were generated from 1979 to 2021, with initialization dates ranging from January 1st to September 1st. The hindcasts were evaluated with a user-oriented approach, tailored to offer insights for snow monitoring experts, forecasters, decision-makers, and workflow developers. Join us to learn more about FROSBYTE, and explore ways in which you can actively contribute to its development.

How to cite: Arnal, L., Clark, M. P., Pietroniro, A., Vionnet, V., Casson, D. R., Whitfield, P. H., Fortin, V., Wood, A. W., Knoben, W. J. M., Newton, B. W., and Walford, C.: FROSTBYTE: A reproducible data-driven workflow for probabilistic seasonal streamflow forecasting in snow-fed river basins across North America, EGU General Assembly 2024, Vienna, Austria, 14–19 Apr 2024, EGU24-13915, https://doi.org/10.5194/egusphere-egu24-13915, 2024.

We introduce Neighbourhood Ensemble Copula Coupling, a technique for post-processing ensemble precipitation forecasts to produce physically realistic, well-calibrated scenarios.

Modern precipitation forecasting typically uses ensemble forecasts produced by numerical weather prediction (NWP) models. These ensembles aim to represent the range of probable weather outcomes, and enable us to derive probabilistic predictions (for example, we may predict a 20% chance of at least 10 mm rainfall at a particular location). Because NWP models employ a simplified representation of the atmospheric dynamics, and model processes at a coarse scale, the probabilities derived from the ensemble must be calibrated to accurately describe the probability distribution at the specific forecast locations.

Moreover, for many applications, such as flood prediction, as well as a probabilistic prediction of rainfall at each location, it is also useful to know the correlations between different locations. A river is most likely to flood when there is high rainfall at several nearby locations, so the probability of a flood depends on the joint probability distribution of rainfall at these locations. This is not easy to calculate, since the individual distributions are not independent. For example, if there is a rain band and we are unsure how fast it will move, we may know that at a particular forecast time it will rain either in location A or location B, but not both simultaneously. Thus for hydrology applications, scenario-based forecasts are often more useful than probability forecasts, but we still require the ensemble of scenarios to be well-calibrated; that is, the distribution of scenarios at a location should approximate the true expected probability distribution.

One popular approach to this problem is Ensemble Copula Coupling (ECC). Given an NWP ensemble forecast, and a probabilistic forecast derived from it, ECC is a method to derive a calibrated ensemble forecast by arranging quantiles of the probabilistic forecast in the order specified by the original ensemble. This process improves the statistical accuracy of the ensemble; in other words, the distribution of the calibrated ensemble members at each grid point more closely approximates the true expected distribution. However, the trade-off is that the individual members are not as physically realistic as the original ensemble, with noisy variation among neighbouring grid points. Also, depending on the calibration method, extremes in the original ensemble are sometimes muted: in particular, reliability calibration, a simple and widely used non-parametric probability calibration method, suffers from this problem. Neighbourhood Ensemble Copula Coupling (N-ECC) is a simple modification of ECC designed to address these drawbacks. Testing N-ECC with the calibrated probability forecasts produced by reliability calibration shows that, compared to standard ECC, our method produces forecasts which are less noisy and more visually plausible, and which also have improved statistical properties. Specifically, the forecast is sharper, so that extremes are better predicted, and the continuous rank probability score (CRPS) is also slightly improved.

How to cite: Trotta, B.: Producing calibrated ensemble precipitation forecasts using Neighbourhood Ensemble Copula Coupling, EGU General Assembly 2024, Vienna, Austria, 14–19 Apr 2024, EGU24-14291, https://doi.org/10.5194/egusphere-egu24-14291, 2024.

EGU24-14893 | ECS | Posters on site | HS4.3

A Study of Rainfall-Runoff Process considering two uncertainties in Basin with multiple dams 

Ojiro Furuoka and Tomohito Yamada

Forecasting of natural phenomena is generally based on observation data, but it is impossible to measure everything perfectly, and there are uncertainties in the limits of observation and human perception. In runoff forecasting, there is also uncertainty in the rainfall information that uses as input data, and it is important for flood control to estimate the effect of this uncertainty on the output data, the runoff data.

Currently, rainfall in Japan is monitored by ground rain gauges and meteorological radar. Ground rain gauges measure rainfall on the ground, but they are installed at intervals of 10 to 20 km, and not all locations are measured seamlessly. Ground-based rain gauges have spatial uncertainties because they may miss cumulonimbus clouds with a horizontal scale of about 10 km that bring heavy rainfall, and because rainfall in mountainous areas is considered to be highly spatially variable due to the topography. On the other hand, radar observations use radio waves to measure the shape of raindrops in the sky and estimate rainfall on a 250 m mesh or 1 km mesh. There are limitations in accuracy, such as indirect rainfall estimation and rainfall attenuation behind strong rainfall areas. There are discrepancies in comparison with ground rain gauges at the same location, and radar must also accept uncertainties due to observation limitations. 

Uncertainty in rainfall data is not limited to observational uncertainty.Uncertainty also exists in the process of rainfall retention by soil until it flows into the river. In particular, while the degree of soil wetness prior to a rainfall event is considered to have a significant impact on the process of water retention, it is impossible to observe the wetness of the entire watershed, and there is inherent uncertainty as to how much rainfall will contribute to direct runoff. Against this background, it is necessary to convert the conventional deterministic model, which uniquely provides rainfall data and uniquely determines the runoff height, to a stochastic model that accounts for uncertainty.

For studies that consider uncertainty, a rainfall-runoff model that takes into account uncertainties due to observation limitations was proposed by Yamada et al. and a rainfall-runoff model that takes into account uncertainties due to observation limitations and initial soil moisture uncertainty was proposed by Intan and Yamada.

In this study, the theoretical development is described and a rainfall-runoff model with two uncertainties is applied to Kinugawa river basin to quantify the inflow.

How to cite: Furuoka, O. and Yamada, T.: A Study of Rainfall-Runoff Process considering two uncertainties in Basin with multiple dams, EGU General Assembly 2024, Vienna, Austria, 14–19 Apr 2024, EGU24-14893, https://doi.org/10.5194/egusphere-egu24-14893, 2024.

EGU24-14945 | Posters on site | HS4.3

Ensemble forecasts of marine flood maps assisted by probabilistic machine learning techniques: Application at Arcachon Lagoon (France) 

Jeremy Rohmer, Eva Membrado, Sophie Lecacheux, Deborah Idier, Andrea Filippini, Rodrigo Pedreros, Alice Dalphinet, Denis Paradis, and David Ayache

Recent advances in high performance computing have enabled numerical weather prediction systems to move from deterministic to probabilistic forecasting using Ensemble Prediction Systems (EPS). While EPS are increasingly used to predict river flows and induced floods in several countries, it is only emerging for marine flooding. Despite ongoing efforts to develop new generations of high performance hydrodynamic models accounting for complex processes, the main challenge still remains the computer power required to run multiple simulations with a chain of models of increasing resolutions (from a hundred meters for water level at the coast, to a few meters for coastal waves and marine flooding). To overcome this limitation, the machine-learning-based metamodelling approach has made great progresses in this field of application.

Through a statistical analysis of pre-calculated training databases, metamodels can predict key flooding indicators (surge, discharge, water depth, etc.) at a given spatial locations of interest within reasonable time and computing resources while preserving the accuracy of full process models. Yet, some issues remain to push this approach toward operational applications: (1) the production of spatialized indicators with metamodels such as inland water depth maps, (2) the characterization of the cascading sources of uncertainties throughout the entire chain.

To address these difficulties, we use a set of numerical simulation results of about 200 flood maps computed on the Arcachon Lagoon (Gironde, France) for a large variety of randomly-generated metoceanic forcing conditions (surge, tide, wave and wind). On this basis, a metamodeling procedure is developed by combining a non-linear dimension reduction method relying on deep-learning-based autoencoders, denoted AE (to represent the very high-dimensional spatialized output) and on Gaussian process (Gp) regression (to model the link between the metoceanic forcing conditions and the flood response). Cross validation and comparison to historical real cases (such as storms Xynthia and Klaus) show satisfying predictive capability. However, the concern is the model uncertainty that affects the different steps of the whole metamodeling procedure. To quantify it, we rely on a stochastic approach that combines conditional Gp simulations with AE random responses using Monte Carlo Dropout method. In order to discuss predictive uncertainty to support decision-making for real-time forecasts, we compare the impact of metamodelling uncertainty with that induced by the variability of metoceanic forcing conditions which are modelled on the basis of the Meteo-France ensemble named PEARP "Prévision d'Ensemble ARPege" for recent storm events, as well as for synthetic marine inundation events.

How to cite: Rohmer, J., Membrado, E., Lecacheux, S., Idier, D., Filippini, A., Pedreros, R., Dalphinet, A., Paradis, D., and Ayache, D.: Ensemble forecasts of marine flood maps assisted by probabilistic machine learning techniques: Application at Arcachon Lagoon (France), EGU General Assembly 2024, Vienna, Austria, 14–19 Apr 2024, EGU24-14945, https://doi.org/10.5194/egusphere-egu24-14945, 2024.

EGU24-16763 | ECS | Posters on site | HS4.3

Evaluation of Hydro-meteorological Ensemble Forecasts in Small Catchments in Saxony 

Mohamed Elghorab, Jens Grundmann, Michael Wagner, and Schalk Jan van Andel

The application of ensemble forecasting for predicting extreme weather events and floods, necessitates a thorough assessment of its performance and reliability. Consequently, evaluation emerges as a crucial step, offering valuable insights into the overall predictive skill of ensemble forecasts. Notably, limited attention has been given to evaluating the utility of ensemble forecasts as early warning tools in small catchments that are characterized by rapid hydrological processes and flash floods. This study addresses this gap by focusing on the performance analysis of the ensemble weather forecast provided by the Deutscher Wetterdienst (DWD) in ten small catchments distributed across three regions in Saxony, Germany. The findings aim to contribute to a deeper understanding of the effectiveness of ensemble forecasting in the context of early warning systems for small catchments.

To realize this research, a specialized computational tool particularly tailored for the structure and format of the forecast products was developed. It encompasses an arsenal of evaluation metrics, including contingency table-based metrics that examine forecasts from the perspective of extreme events (e.g., false and true alarm rates, accuracy, area under the ROC curve). Additionally, the tool incorporates metrics treating the entire forecast ensemble as a probability distribution, measuring its degree of conformity with the ground truth (e.g., CRPS & Brier score).

The evaluation exercise involved a numerical comparison between modelled forecasts and actual measured observations. For meteorological forecasts, the evaluation was conducted using the numerical weather prediction models ICON-D2-EPS/COSMO-D2-EPS against RADOLAN-RW radar observations. In the case of hydrological forecasts, the modelled runoff ensemble forecasts were compared against gauged catchment runoff measurements.

Upon a comprehensive evaluation of ensemble predictions from various perspectives, including accuracy and reliability, it is observed that the utilization of ensemble forecasting in small catchments demonstrates a satisfactory level of performance. Notably, the central region of Saxony exhibited slightly superior performance compared to the other two test regions. Furthermore, the results indicate a tendency for the ensemble average to consistently overestimate observations in both rainfall and runoff forecasts. It is also equally important to note that this tendency is primarily attributed to the mathematical approach employed in the analysis.

In conclusion, the collective findings of this research offer valuable insights into the practical application of ensemble forecasts for decision-making in each of the small catchments. Despite the overestimation tendency of the forecasts, the overall performance and reliability of ensemble forecasting in small catchments, especially in the central region of Saxony, suggest its potential as a valuable tool for informed decision-making in hydrological and meteorological contexts.

How to cite: Elghorab, M., Grundmann, J., Wagner, M., and van Andel, S. J.: Evaluation of Hydro-meteorological Ensemble Forecasts in Small Catchments in Saxony, EGU General Assembly 2024, Vienna, Austria, 14–19 Apr 2024, EGU24-16763, https://doi.org/10.5194/egusphere-egu24-16763, 2024.

EGU24-17468 | ECS | Orals | HS4.3

Influence of spatial resolution on forecast quality of bias-corrected seasonal forecasts from a drought management perspective 

Celia Ramos Sánchez, Micha Werner, Lucia De Stefano, and Andrew Schepen

The potential of user-centric climate services to facilitate proactive drought management approaches is leading to increased efforts to develop and test climate services that include hydro-meteorological forecast products. In Spain, there is an interest to incorporate seasonal forecasts into drought management, including by integrating the information these provide into the system of drought indicators that are used in current operations. However, despite seasonal forecast information being available to users, their actual use to support operational decisions is limited. One aspect that fosters uptake is how credible users consider seasonal forecasts, including the quality of the forecasts. Additionally, the salience of the information provided is important, with information being credible at the spatial and temporal scales commensurate to those of the indicators used to support decisions. Bias-correction of seasonal forecasts has a crucial role in enhancing forecast quality, though there are several aspects intrinsic to bias-correction processes that may influence the degree of quality enhancement from the perspective of the users’ interests. An aspect that has so far received little attention is the spatial resolution of the forecast and the reference precipitation datasets that are applied.

Here, we examine the influence of spatial resolution of both the forecast and the reference precipitation datasets used in the bias-correction process on the skill of seasonal forecasting, from the perspective of the indicators used in operational drought management decisions. We apply bias-corrected daily rainfall forecasts (ECMWF System 5) for a region within the Spanish Douro River Basin. We use a Bayesian Joint Probability (BJP) modelling approach for bias correction and the Schaake Shuffle method to conserve the temporal and spatial correlations across lead times and sub-catchments, respectively (Schepen et al., 2018). We consider two resolutions of the forecast product (1° and 0.4°), and apply the bias correction at three nested spatial scales, namely independent sub-catchments, aggregated sub-catchments and the entire catchment. These spatial aggregations have been selected to match those of the indicators used in the drought management plan implemented by the Douro Basin Authority. Forecast quality is evaluated through a set of skill scores and metrics at the daily scale, as well as at the aggregated temporal scales of the indicators used. Our results show that the bias correction applied to the seasonal forecasts does improve the skill of the forecast information at the spatial and temporal scales that are relevant to the indicators used operationally. We also show the influence on the improvement of skill of choices made in selecting the spatial resolution of the forecasts themselves and at which bias correction is applied, and discuss how this can help inform the design of climate services to support operational drought management decisions.

How to cite: Ramos Sánchez, C., Werner, M., De Stefano, L., and Schepen, A.: Influence of spatial resolution on forecast quality of bias-corrected seasonal forecasts from a drought management perspective, EGU General Assembly 2024, Vienna, Austria, 14–19 Apr 2024, EGU24-17468, https://doi.org/10.5194/egusphere-egu24-17468, 2024.

EGU24-20930 | Orals | HS4.3 | Highlight

What are the top priorities for (co-) creating hydrological forecast systems that add value across spatial scales and time horizons? Outcomes from the 2023 HEPEX workshop 

James Bennett, Ilias Pechlivanidis, Yiheng Du, Marie-Amélie Boucher, and Fredrik Wetterhall

Creating forecast systems that add value across spatial scales and time horizons is crucial for a variety of fields, from meteorology and climate science to business and public policy. The priorities for developing such systems may vary depending on the specific domain and objectives. The international community of practice of the Hydrological Ensemble Prediction Experiment (HEPEX) has been seeking to advance the science and practice of hydrological ensemble prediction and its use in impact- and risk-based decision-making. Over the years, HEPEX has been promoting knowledge utilising cutting-edge techniques and data to innovate hydrological forecasting methods, products and systems, and improve services for users in the water-related sectors. During the 2023 HEPEX workshop in Norrköping, Sweden, (https://hepex.org.au/hepex-workshop-2023-forecasting-across-spatial-scales-and-time-horizons/), the community proposed and elaborated on the key priorities for (co-)creating hydrological forecast systems that are broadly applicable and can add value for local/regional decision-making. The notes from five breakout groups (about 10 participants in each group) were collected and analysed, while the proposed efforts and ways forward were classified and prioritised. Here, we present the outcomes from these breakout discussions, while we support the identified priorities providing backgrounds on the science needed, the HEPEX contribution towards these priorities, and the path forward for contributing to the United Nations Early Warnings for All (EW4All) initiative.

How to cite: Bennett, J., Pechlivanidis, I., Du, Y., Boucher, M.-A., and Wetterhall, F.: What are the top priorities for (co-) creating hydrological forecast systems that add value across spatial scales and time horizons? Outcomes from the 2023 HEPEX workshop, EGU General Assembly 2024, Vienna, Austria, 14–19 Apr 2024, EGU24-20930, https://doi.org/10.5194/egusphere-egu24-20930, 2024.

EGU24-21041 | Posters on site | HS4.3

Use-case specific performance assessment of sub-seasonal to seasonal drought predictions for local-scale applications in the Netherlands, Spain, and Italy 

Schalk Jan van Andel, Claudia Bertini, Celia Ramos Sánchez, Andrea Ficchì, Matteo Giuliani, Michiel Pezij, Dorien Lugt, Lucia De Stefano, Ilias Pechlivanidis, Micha Werner, and Andrea Castelletti

Sub-seasonal to seasonal (S2S) hydrometeorological ensemble predictions are being put to the test, given their potential to increase preparedness for, and improve management of, extreme events. Whereas forecast skill at the global, continental, and regional scales of S2S hydrometeorological predictions is relatively well-documented and regularly updated in the scientific literature for generic definitions of events, assessments of forecast skill at the catchment and local scale for local use-case definition of events have been reported to a relatively limited extent.

In this research, the forecast skill of S2S predictions is analysed for local preparedness and management of droughts. In case studies in the Netherlands, Spain and Italy; potential end users have been consulted on their definition of drought, warning thresholds, decision-making process, and potential mitigation actions. The result is a variety of meteorological, hydrological and agricultural use-case-specific drought event definitions.

For each of these case studies, a state-of-the-art multi-year (re-)forecast hydrometeorological dataset is downloaded or developed (e.g. for sub-seasonal and seasonal meteorological forecasts from ECMWF Extended Range and SEAS5 prediction systems, respectively, and for hydrological forecasts from the E-HYPE and GLOFAS hydrological systems), and its performance analysed for the user-driven drought definitions.

The results contribute to an improved understanding of the potential of state-of-the-art S2S predictions for local-scale drought preparedness and management, and identify aspects to focus on in further enhancing this potential.

How to cite: van Andel, S. J., Bertini, C., Ramos Sánchez, C., Ficchì, A., Giuliani, M., Pezij, M., Lugt, D., De Stefano, L., Pechlivanidis, I., Werner, M., and Castelletti, A.: Use-case specific performance assessment of sub-seasonal to seasonal drought predictions for local-scale applications in the Netherlands, Spain, and Italy, EGU General Assembly 2024, Vienna, Austria, 14–19 Apr 2024, EGU24-21041, https://doi.org/10.5194/egusphere-egu24-21041, 2024.

EGU24-3702 | PICO | HS4.4

Developing a Distributed Real-time Streamflow Forecasting Framework for Use in Highly Regulated Basins 

Yuan-Hao Fang, Xingnan Zhang, Rui Qian, Tao Zhang, and Pingshan Qin

As a non-engineering measure for flood control, real-time forecasting provides valuable information like the magnitude and occurrence time of flood peak, which is essential for decision-making. In China, many reservoirs are built and operated in major river including ChangJiang River Basin. Operations of reservoirs pose new challenges for real-time forecasting. For example, (1) it’s difficult to calibrate model parameters due to human-impaired streamflow series, (2) the leading time of real-time forecasting is much shorter.

To address these challenges, we propose a distributed real-time streamflow forecasting framework using the Xin’anjiang (XAJ) hydrological model. We evaluate different scale of computational units of the XAJ model to better characterize the runoff processes, land surface characteristics, and meteorology factors. We then develop a set of models to calculate model parameters from land surface characteristics, which reduce the calibration requirement. We also develop an algorithm to correct the bias of precipitation forecasts, which is coupled with real-time forecasting framework. This helps to extend the leading time of real-time forecasting.

Our proposed framework is tested and validated at Upper Changjiang River Basin and get promising feedbacks.

How to cite: Fang, Y.-H., Zhang, X., Qian, R., Zhang, T., and Qin, P.: Developing a Distributed Real-time Streamflow Forecasting Framework for Use in Highly Regulated Basins, EGU General Assembly 2024, Vienna, Austria, 14–19 Apr 2024, EGU24-3702, https://doi.org/10.5194/egusphere-egu24-3702, 2024.

We hereby introduce our latest Information Physical Quantum Technological Intelligence (IPQuTI), further empowering next-generation innovation and service workflows from sensing to computing, communications and security across multissectorial theatres of operation.

Methodologically, we build a novel synergistic dynamic interface among the novel augmented sensing technologies in our Quantum Aerospace Systems Intelligence (QuASI), the enhanced complex system dynamic analytics and model design methodologies in our latest Information Physical Artificial Intelligence (IPAI) and Earth System Dynamic Intelligence (ESDI), and the latest computational developments in our Synergistic Nonlinear Quantum Wave Intelligence Networks (SynQ-WIN).

With multi-hazard system dynamic complexity across diverse interacting geospheres and space in mind, we leverage and further build on our Meteoceanics QITES Constellation to tackle critical intelligence and security challenges to improve crucial awareness, understanding, preparedness and resilience in the face of pressing challenges facing our environment and society.

Operationally, our technologies are developed in-house and deployed across an infrastructural ecosystem on Earth and in Space. In doing so, we produce an integrated synergistic platform to support scientific, technical, management and security forces across challenging theaters of operation. From prediction and detection of early warning signs of hazards and multi-hazards, to processing and relaying complex sensitive information in a swift, secure manner across environmental and security value chains.

The operational and societal relevance of the overall methodological and technological advances are illustrated through the simulation of individual, compound and coevolutionary disaster occurrences across a sample of synthetically generated and real-world practical examples, thereby reporting concrete outputs of this platform. Some are representative of recurrent occurrences in line with the latest state-of-the-art abilities of dynamic modelling, machine learning and artificial intelligence, whereas others leap beyond the state-of-the-art with the new capabilities brought up by our latest advances, harnessing and simulating unprecedented non-recurrent emerging features and synergies elusive to prior data records and model designs.

These simulations further guide the mathematically robust, physically consistent deployment of system dynamic intelligence to address non-recurrent and other emerging phenomena. This is of special relevance in the face of structural-functional critical transitions and emergent multi-hazard behaviours associated to the synergistic coevolution between humans and nature e.g. pertaining a changing climate and land use, along with emerging transitions, criticalities and extremes, including black swan events, i.e. those non-recurrent high-impact phenomena elusive to traditional recurrence-based system dynamic modelling and information technologies.

Our novel IPQuTI brings added synergistic integrated value from sensing to computing and decision support, further enhancing the methodological and operational capabilities of current platforms along with ongoing projects on multi-hazard risk intelligence and disaster resilience such as the platforms being developed in the scope of Horizon Europe project C2IMPRESS.


Acknowledgement: This contribution is developed in the scope of the Meteoceanics Flagship on Quantum Information Technologies in the Earth Sciences (QITES), and of the C2IMPRESS project supported by the Εuropean Union under the Horizon Europe grant 101074004.


How to cite: Perdigão, R. A. P. and Hall, J.: Information Physical Quantum Technological Intelligence (IPQuTI) for Global High-Resolution Anticipatory Multi-Hazard Sensing, Modelling and Decision Support, EGU General Assembly 2024, Vienna, Austria, 14–19 Apr 2024, EGU24-5308, https://doi.org/10.5194/egusphere-egu24-5308, 2024.

EGU24-7070 | PICO | HS4.4

AI-Empowered Near-realtime Operational Prediction System of Landslides in Lao Cai province, Vietnam 

Duong Bui Du, Phi Nguyen Quoc, Tien Du Le Thuy, Linh Bui Khanh, Giang Tran Thi Tra, Hung Hoang Van, Lan Vu Van, and Cat Vu Minh

Vietnam faces heightened vulnerability to severe climate change impacts, notably sea level rise, flooding, and landslides. In recent years, the northwest mountainous regions have experienced recurrent and widespread landslides during the rainy season (May to October), resulting in significant economic losses. This study focuses on the Lao Cai province, employing various data mining techniques—Artificial Neural Networks (ANN), Support Vector Machines (SVM), and Random Forest (RF)—to spatially predict landslide hazards. Initially, a comprehensive landslide inventory map was constructed from diverse sources, pinpointing past landslide occurrences. Subsequently, multiple factors influencing landslides were considered, including slope angle, slope aspect, profile curvature, wetness index, lithology, Normalized Difference Vegetation Index (NDVI), soil type, soil moisture, road density, house density, and rainfall. Utilizing these factors, landslide susceptibility indexes were computed through the respective models. Validation, using landslide locations not utilized in the training phase, revealed that models employing Random Forest (RF) exhibited the highest prediction capability. The trained model was then applied to generate real-time forecasts of landslide susceptibility maps for up to 16 days, using bias-corrected Global Forecast System (GFS) precipitation data. This WebGIS operational prediction system enhances preparedness and awareness, facilitating improved mitigation strategies to mitigate the impact of landslides.

How to cite: Bui Du, D., Nguyen Quoc, P., Du Le Thuy, T., Bui Khanh, L., Tran Thi Tra, G., Hoang Van, H., Vu Van, L., and Vu Minh, C.: AI-Empowered Near-realtime Operational Prediction System of Landslides in Lao Cai province, Vietnam, EGU General Assembly 2024, Vienna, Austria, 14–19 Apr 2024, EGU24-7070, https://doi.org/10.5194/egusphere-egu24-7070, 2024.

EGU24-8599 | ECS | PICO | HS4.4

Conceptualization and implementation of a global drought monitoring and forecasting system within the HydroSOS framework 

Tinh Vu, Robert Reinecke, Neda Abbasi, Tina Trautmann, Jan Weber, Stephan Dietrich, Fabian Kneier, Christof Lorenz, Malte Weller, Harald Koethe, Harald Kunstmann, Petra Döll, and Stefan Siebert

Forecasting systems focusing on upcoming flood and drought events are essential to support various aspects such as disaster risk reduction, climate change mitigation, or long-term policy and planning. In particular, multiple model-based early warning systems have been developed to allow the simulation of future floods and droughts at different temporal-spatial scales. However, despite the successful development of many innovative and state-of-the-art modeling systems in the academic fields, their transition into an operational system is challenging, and it may take several years to set up appropriate technical requirements, especially into a new IT infrastructure. In this talk, we hence outline these challenges for the example of the ongoing project OUTLAST (operational, multi-sectoral global drought hazard forecasting system), where the main goal is to develop a modeling system that is ready for operational use. OUTLAST will provide model-based near real-time monitoring using recent updated ERA5 climate data and seasonal forecasting of drought globally across different sectors (water supply, riverine and non-agricultural land ecosystems, rainfed and irrigated agriculture). The system consists of a model chain of three models: (1) bias correction of global seasonal forecasting products SEAS5, (2) the global hydrological model WaterGAP, and (3) the global crop water model GCWM. The drought status in both monitoring and forecasting phase from OUTLAST will be provided globally for the next six months and be freely accessible via the HydroSOS portal, a Hydrological Status and Outlook System hosted by the World Meteorological Organization (WMO).

Highlights of OUTLAST are the ability to run the whole system within a cloud-ready automated workflow to ensure seamless integration into the HydroSOS framework. This includes the so-called “trigger” to automatically download the newly released climate data (ERA5 and SEAS5) from the source (ECWMF). To achieve this goal, each model and its dependencies in the model chain in OUTLAST are encapsulated in a "container" by the core developer in the research institution before being transferred to run in an IT infrastructure at an external government institution. The containers will then be orchestrated to enable the upscaling of the system based on computational requirements and the availability of hardware resources. This approach aims to (i) enable a seamless transition of OUTLAST into operation, (ii) avoid any conflict with the host operating system, and (iii) ensure a fast boot system in case one of the servers fails. We hope that the proposed infrastructure design can serve as a blueprint for other efforts to transfer scientific workflows into an operational environment. 

How to cite: Vu, T., Reinecke, R., Abbasi, N., Trautmann, T., Weber, J., Dietrich, S., Kneier, F., Lorenz, C., Weller, M., Koethe, H., Kunstmann, H., Döll, P., and Siebert, S.: Conceptualization and implementation of a global drought monitoring and forecasting system within the HydroSOS framework, EGU General Assembly 2024, Vienna, Austria, 14–19 Apr 2024, EGU24-8599, https://doi.org/10.5194/egusphere-egu24-8599, 2024.

EGU24-12402 | PICO | HS4.4 | Highlight

Operational Landslide Early-Warning Systems (LEWS) in Italy 

Ivan Marchesini, Mauro Rossi, Silvia Peruccacci, Maria Teresa Brunetti, Pietro De Stefanis, Monica Solimano, Rosaria Esposito, Ivan Agostino, Stefano Loddo, Salvatore Cinus, Giovanni Valgimigli, and Angelo Corazza

In recent years, Landslide Early Warning Systems (LEWS) have garnered increasing attention, both from the scientific community and from professionals engaged in prevention, monitoring, and forecasting activities.

However, the extensive scientific literature on the subject primarily focuses on the development of algorithms, methods, and experiments. This literature often falls short in bridging the significant gap between the theoretical design of an early warning system and its actual operational deployment (though exceptions exist, as indicated by Guzzetti et al. 2020). This disparity poses a pivotal challenge in the sector. An effective system transcends mere theoretical algorithmic creation; it necessitates, among other factors, a pragmatic understanding of end-user requirements, a seamless and continuous operational framework, and efficient communication tools.

The Institute for Geo-Hydrological Protection Research of the National Research Council (IRPI CNR) has pioneered the domain of geographical LEWS in Italy. By managing five regional and national-scale geographical LEWS in collaboration with the National Civil Protection and the national railway network operator, IRPI CNR has highlighted the practical significance of these systems. The institute has developed solutions tailored to provide decision-support tools aligning with diverse stakeholders' needs.

This contribution aims to illustrate how scientific research outcomes can be leveraged, transforming them into operational tools in line with decision-makers' requirements. The presentation offers a detailed overview of real-world use cases of LEWS administered by IRPI in Italy. Emphasis is placed on disseminating information to end-users, specifically practical operators, and on the agreed-upon tools and approaches to distribute information and trigger alerts. More specifically, we describe 5 LEWS aimed at predicting the possible initiation of rainfall-induced landslides. Three of these systems operate at a regional scale (two administrative regions and a single railway segment in the Apennine region), while the other two cover the entire national territory, with the objective of assessing the potential initiation of rainfall-induced landslides and their potential impact on the national railway network. These systems differ in the type and quantity of data used in the forecasting chain, the extent of monitored areas, product resolutions, interfaces, and communication systems.

The intent is to share our experiences, challenges, and solutions, thereby fostering advancements and refinements in landslide early warning systems at both national and international levels.

How to cite: Marchesini, I., Rossi, M., Peruccacci, S., Brunetti, M. T., De Stefanis, P., Solimano, M., Esposito, R., Agostino, I., Loddo, S., Cinus, S., Valgimigli, G., and Corazza, A.: Operational Landslide Early-Warning Systems (LEWS) in Italy, EGU General Assembly 2024, Vienna, Austria, 14–19 Apr 2024, EGU24-12402, https://doi.org/10.5194/egusphere-egu24-12402, 2024.

EGU24-14058 | ECS | PICO | HS4.4

Construction and Test of WRF Model in Chinese Mainland 

Mingxiang Yang

Based on WRF model, this paper constructs a mesoscale numerical weather forecast model covering Chinese Mainland, with a spatial resolution of 5km. Driven by ERA5 reanalysis data, long-term simulation experiments are carried out. We selected observation data from the National Meteorological Station of China to test and analyze the core forecast elements such as precipitation, temperature, and wind speed of the WRF model, and further verified the simulation ability of the model for typhoons, extreme precipitation, sustained drought, and total water resources in different water resource zones, obtaining relatively objective evaluation results. On this basis, based on WRF-Hydro, a regional distributed hydrological model in Chinese Mainland is constructed. The WRF-Hydro model is driven by the long-term simulation results output from the WRF model, and the runoff simulation data corresponding to major rivers in China are obtained. By comparing with the measured data, the validity of the WRF model built in this paper in hydrological simulation is verified, which provides a reference for the next step of operational application and improvement of the model.

How to cite: Yang, M.: Construction and Test of WRF Model in Chinese Mainland, EGU General Assembly 2024, Vienna, Austria, 14–19 Apr 2024, EGU24-14058, https://doi.org/10.5194/egusphere-egu24-14058, 2024.

EGU24-15089 | ECS | PICO | HS4.4 | Highlight

Real-time fluvial flood mapping for impact-based flood early warning in Denmark  

Charlotte Plum, Michael Butts, Dennis Trolle, and Anders Nielsen

Estimating flood (inundation) extent for river systems is a key element for impact-based flood forecasting and warning. Hydrodynamic Inundation mapping is widely used for planning for local flood mitigation measures and climate adaptation strategies. An interesting but challenging option is to use these models in real-time to provide locally relevant and impact-based flood warning. The challenge is that these methods can be computationally demanding and therefore may not be able to provide timely forecasts and effective warnings for early action. One approach used in practical applications, is to simulate pre-defined flood scenarios that are calculated, ahead of time, and then used as a look-up table by flood forecasters. However, this approach may not necessarily capture the actual flood dynamics and requires time-consuming manual interpretation.

The Danish Meteorological Institute (DMI) has recently been appointed as the national authority for flood forecasting for Denmark, and is tasked with developing and implementing a flood forecasting and early warning. The initial focus is on informing decision-making for local and national emergency services. In this study, we explore approximate, but computationally efficient, flood mapping for flood early warning. As a starting point, we have formulated a static flood mapping approach, based on an extension of the deterministic 8-node approach, and established an approximate hydrodynamic model, using LISFLOOD-FP for the Vejle River in Denmark. Adopting these simpler approaches recognizes that for flood warning the most relevant information is the identification of the areas at risk during an extreme flood event rather than the precise extent and magnitude of flooding. The township of Vejle, located near the mouth of Vejle River in a deep lowland glacial valley, is subject to frequent flooding from the coast as well as fluvial flooding from heavy rainfall and cloudbursts. Severe flooding from extreme rainfall occurred in the Vejle River during both February and March 2019. To evaluate the impact of the approximations used, we have compared the resulting flood map with drone observations of flood extent, photographs and satellite data during the flood in March 2019. These evaluations will guide DMI in developing operational flood mapping for flood early warning and emergency actions across the whole of Denmark.

How to cite: Plum, C., Butts, M., Trolle, D., and Nielsen, A.: Real-time fluvial flood mapping for impact-based flood early warning in Denmark , EGU General Assembly 2024, Vienna, Austria, 14–19 Apr 2024, EGU24-15089, https://doi.org/10.5194/egusphere-egu24-15089, 2024.

EGU24-15865 | ECS | PICO | HS4.4

Assessment of different building representations in numerical urban flood modeling 

Karan Mahajan and Leon Frederik De Vos

According to the latest IPCC report, climate change directly impacts the intensity and frequency of floods in urban areas. As a result, Flash floods, characterized by a rapid increase in flood peak during a short duration, are becoming more common. Managing these flash floods is a crucial yet challenging task for water authorities. One important tool supporting the management of flash floods are 2-D hydrodynamic models.

In this study, we use the 2-D module of the openTELEMAC-MASCARET software to investigate the effect of the building representation on an urban flash flood. For this, we isolate a sinuous-shaped building group within an artificial study area. The building group itself and the topography in the model are derived from the Moabit district in Berlin. The buildings are cut out from the model as a hole, and the impact on the model results from the vertex distribution around these holes is assessed. We compare different algorithms to resample the vertices of the building. First, we design an algorithm that resamples the vertices of the building edges at an even distance while conserving the overall shape of the building. The resampling distance is set globally but slightly varies for every building edge. This algorithm is then compared with built-in resampling tools from other software: one tool also conserves the shape of the building yet cannot resample the vertices at an even distance (from QGIS), and another tool resamples at an even distance, yet does not conserve the building shape (from SMS). A change in the distribution of vertices causes a change in the mesh distribution around the buildings. Hence, the flow pattern around the buildings also changes. Additionally, we study the numerical stability of the different distributions. With this study, we aim to deepen the understanding of building representation in urban flood modeling and set the path for further investigations within this topic.

How to cite: Mahajan, K. and De Vos, L. F.: Assessment of different building representations in numerical urban flood modeling, EGU General Assembly 2024, Vienna, Austria, 14–19 Apr 2024, EGU24-15865, https://doi.org/10.5194/egusphere-egu24-15865, 2024.

EGU24-17635 | ECS | PICO | HS4.4

Enhancing National Flood Forecasting: Leveraging Library-based Surrogate Models for Impact-based Warnings 

Markus Mosimann, Martina Kauzlaric, Simon Schick, Olivia Martius, and Andreas Paul Zischg

In Switzerland, the Federal Office for the Environment issues hydrological forecasts and general flood warnings for the main river network. However, recent global flood events underscore that gaps in the communication channels from warning services to target groups inhibit effective mitigation efforts. One approach addressing this issue is impact-based warning.

Aligned with Switzerland's existing flood forecasting system, we introduce a library-based surrogate flood model approach aimed at advancing current technologies towards robust impact-based warning systems. We evaluate the model based on the main river network of Northern Switzerland by comparing the impacts to buildings, persons and workplaces with hazard classification, estimated with transient simulations for nine extreme precipitation scenarios.

Across 78 analyzed model regions, our surrogate approach yields a Flood Area Index between 0.74 and 0.90 for each scenario (overall 0.84) compared to the transient, computationally expensive flood modelling approach. Furthermore, the Critical Success Index, computed based on exposed persons, ranges between 0.77 and 0.93 (overall 0.89).

Our prototype of a library-based flood surrogate model demonstrates the ability of accurately replicate highly resolved transient models This capability bears the potential of nationwide real-time flood impact prediction and potential integration into probabilistic forecasting. Leveraging an API, this library-based approach could enhance the existing forecasting system, offering a pathway toward impact-based flood warnings.

How to cite: Mosimann, M., Kauzlaric, M., Schick, S., Martius, O., and Zischg, A. P.: Enhancing National Flood Forecasting: Leveraging Library-based Surrogate Models for Impact-based Warnings, EGU General Assembly 2024, Vienna, Austria, 14–19 Apr 2024, EGU24-17635, https://doi.org/10.5194/egusphere-egu24-17635, 2024.

EGU24-18249 | PICO | HS4.4 | Highlight

Overcoming challenges in the uptake of co-generated hydro-climate services for drinking water management: the inspiring case of SMHI Aqua 

Carolina Cantone, Helen Ivars Grape, Shadi El Habash, and Ilias Pechlivanidis

This study explores co-generation as a key strategy for the advancement and consequent uptake of hydro-climate servicesfor decision-making within the drinking water supply sector, focusing on the SMHI Aqua service as a case study for Sweden. The co-generation process investigated here is based on a four-pillar structure (co-design, co-development, co-delivery and co-evaluation), and it involves engagement and collaborative efforts among three main actors: service purveyors, data providers and users. The case studies were carried out in different regions of Sweden, with mainparticipation from Region Gotland and three other Swedish water-related users (Nodra, Karlskrona Municipality and Metsä Board). SMHI Aqua hydro-climate service is the result of this collective undertaking and it integrates data assimilation, forecast production and a web-based decision support system.

Addressing primarily the needs of drinking water producers and providers, freshwater availability was identified as the most descriptive indicator for supporting decisions for water management and drinking water supply. Two hydrological models were customized for the local conditions to simulate hydrological dynamics in surface and groundwater reservoirs. These models produce short- (up 10 days ahead) and long-range (up to 6 months ahead) forecasts which are updatedtwice a day, incorporating real-time hydro-meteorological measurements to update and initialize the model. Additionally, the service simulates various future freshwater availability scenarios by implementing different yearly water extraction strategies provided by the users. A user-friendly web-based platform displays the real-time (measured and modelled) and the future (forecasted) hydro-meteorological situation in the area of interest.

Outcomes of this study highlight the significance of knowledge co-evolution in facilitating the successful uptake of hydro-climate services. Effective communication of hydro-meteorological information, including its propagated uncertainty, proves to be crucial for water managers to takeinformed decisions. Beyond benefiting water-related users, co-generated hydro-climate services contribute to broader impacts reaching policy makers and the wider public by ensuring freshwater access, and improving awareness and preparedness for extreme conditions. User feedback emphasizes the substantial improvement in operational routines for drinking water management consequent to the implementation of SMHI Aqua. The active engagement and close collaboration of stakeholders throughout co-generation has a pivotal role leading to the successful uptake of the service when taking short- and long-term decisions. Overall, the co-generated SMHI Aqua hydro-climate service stands as a proof to the efficacy of co-generation in achieving informed decision-making, sustainable water resource utilization, and improved resilience especially under extreme conditions.

How to cite: Cantone, C., Ivars Grape, H., El Habash, S., and Pechlivanidis, I.: Overcoming challenges in the uptake of co-generated hydro-climate services for drinking water management: the inspiring case of SMHI Aqua, EGU General Assembly 2024, Vienna, Austria, 14–19 Apr 2024, EGU24-18249, https://doi.org/10.5194/egusphere-egu24-18249, 2024.

EGU24-18395 | PICO | HS4.4

Towards operational impact based flood forecasting in Norway 

Kolbjorn Engeland, Trine Jahr Hegdahl Hegdahl, Emmanuel Jjunju, and Kamilla Skåre Sandboe

Impact based forecasting is identified as a major challenge for hydrometeorological services by WMO. Impact based flood forecasting aims at closing the gap from forecasting how high the streamflow might be in the coming days to forecasting what the high flows might do. The target audience for impact-based flood forecasts can be both the population at large and the authorities responsible for civil protection and emergency management at national, regional, and local levels.

Since 1989 The Norwegian Water Resources and Energy Directorate (NVE) has been running the national services for forecasting floods and issuing warnings for regions and municipalities. Precipitation-runoff models for almost 160 catchments distributed all over Norway are used to forecast streamflow. Flood warnings are then mainly issued based on predefined thresholds for streamflow (mean flood, 5- and 50 years floods). The warnings mention typical impacts of the expected floods but not specific impacts.

NVE aims to provide impact-based flood forecasts for Norway and has started a 4-year pilot for four selected catchments in Norway to assess the information, models and tools needed to achieve this aim. This presentation will present the approaches selected and discuss their challenges.

The model chain used to assess impacts needs to represent the relevant processes. In a first step we focus on riverine floodings. A first challenge is that the hydrological models need to provide forecasts where the flood might have an impact, which signifies that the hydrological models will be applied in ungauged locations. Subsequently, hydraulic models can be used to estimate water levels and depths in susceptible areas. We evaluate an approach where the models are configured to sub-reaches of the rivers were the up- and downstream boundary conditions are well defined and forecasted streamflow at selected points is used as input. The hydrologic model can be used to establish an archive of flood levels and or depths to reduce computing time. This approach is challenging when downstream boundary conditions are dynamic, e.g., close to sea with tidal influence or inland lakes where the water level peaks later than discharge in the upstream rivers. The water levels and depths are subsequently used to estimate impacts based on the buildings and infrastructure potentially affected by the flood. Here we can use the type of building (storage, residential, school etc) type of road (municipality, regional or national road) to assess impact. An important challenge here is how to weight and aggregate potential impacts.

How to cite: Engeland, K., Hegdahl, T. J. H., Jjunju, E., and Sandboe, K. S.: Towards operational impact based flood forecasting in Norway, EGU General Assembly 2024, Vienna, Austria, 14–19 Apr 2024, EGU24-18395, https://doi.org/10.5194/egusphere-egu24-18395, 2024.

EGU24-18944 | ECS | PICO | HS4.4

Application of Ensemble approach for Stream flow forecasting for Indian River basin 

Anant Patel, Sanjay Yadav, Ayushi Panchal, and Rashmi Yadav

Flooding poses a significant threat to human life, property, and the environment, especially in semi-arid river basins where the occurrence of intense rainfall events can lead to flash floods. Early warning systems are crucial for mitigating the impact of floods, and accurate streamflow prediction is a key component of these systems. This research focuses on developing an ensemble approach for streamflow prediction to enhance the effectiveness of early warning systems in Indian river basin. Traditional deterministic models may struggle to capture the complex hydrological processes and uncertainties associated with these regions. In response to this challenge, ensemble methods, which combine multiple models or data sources, have gained popularity for improving the accuracy and reliability of predictions. The Indian River Basin faces unique challenges in water resource management due to its diverse hydrological characteristics and the impact of climate variability. This research presents an innovative application of an ensemble approach for streamflow forecasting tailored specifically for the complex dynamics of the Indian River Basin. The research employs a combination of hydrological models, meteorological data, and machine learning techniques to develop an ensemble streamflow prediction system. A Hydrological model such as the HEC-HMS is integrated into the ensemble to leverage their strengths and compensate for individual weaknesses. Additionally, machine learning was applied for post processing of the ensemble data. These are incorporated to capture non-linear relationships and improve the overall predictive performance. The study area selected for this research is a semi-arid Sabarmati river basin with a history of past flood. Historical streamflow data, meteorological observations and remote sensing data are utilized to calibrate and validate the ensemble prediction system. TIGGE Ensemble data from ECMWF, NCEP, IMD and NCMRWF were used. Research covers machine learning approaches post processing methods such as BMA, cNLR, HXLR, OLR, logreg, hlogreg, etc were applied. The probabilistic forecasts were validated using the Brier Score (BS), Area Under Curve (AUC) of Receiver Operator Characteristics (ROC) plots and reliability plots. The cNLR and BMA strategies for postprocessing performed exceptionally well with Brier score value 0.10 and RPS value 0.11 at all grid points for both methods.  The ROC-AUC values for the cNLR and BMA methods were found to be 91.87% and 91.82% respectively. Furthermore, the research focuses on developing an effective flood early warning system based on the ensemble predictions. The results of the ensemble streamflow prediction system are evaluated against traditional deterministic models and individual hydrological models. Performance metrics such as accuracy, precision, and lead time are analysed to assess the effectiveness of the ensemble approach in comparison to single-model predictions. The findings demonstrate the superiority of the ensemble method in capturing the variability of streamflow by improving the lead time for flood warnings. In conclusion, this research contributes to the advancement of flood prediction methods in Indian river basin by introducing an ensemble approach that combines hydrological models and machine learning techniques. The findings have implications for water resource management, disaster preparedness, and the sustainable development of semi-arid regions.

How to cite: Patel, A., Yadav, S., Panchal, A., and Yadav, R.: Application of Ensemble approach for Stream flow forecasting for Indian River basin, EGU General Assembly 2024, Vienna, Austria, 14–19 Apr 2024, EGU24-18944, https://doi.org/10.5194/egusphere-egu24-18944, 2024.

EGU24-19236 | ECS | PICO | HS4.4

Fast flood finite volume model for the shallow water equations using high-resolution bathymetry data  

Max Bitsch, Jesper Grooss, Ole Rene Sørensen, and Allan Engsig-Karup

Fast and precise flood predictions are crucial in preventing disastrous outcomes associated with flooding. However, creating accurate flood predictions based on numerical models is extremely time-consuming, posing challenges for early warning systems. Consequently, less accurate models are often employed in practical applications due to the importance of simulation time. This is far from ideal as accuracy is key to get the predictions correct, jeopardizing the reliability of the predictions. The shallow water equations (SWEs), which are physics-based depth-integrated differential equations, are commonly used to accurately simulate floods on land. These models remain time-consuming for large-scale simulations, leading to the frequent use of coarse meshes in practical settings. Unfortunately, using coarse meshes presents difficulties in accurately representing bottom resistance, which is a non-linear function of water depth. Solving this problem traditionally requires overestimating the friction coefficients and a lot of practical experience.  

Advancements in the field of sub-grid resolution [1] and [2] have addressed this challenge by linking the source term and fluxes to the bathymetry at a sub-grid level. The sub-grid method involves dividing each cell into multiple sub-cells that store bathymetry data and roughness coefficients. This approach evaluates water depth and bottom resistances at the sub-cell level, resulting in a more precise representation at reduced computational cost. Additionally, this method accommodates flood and dry treatments by allowing cells to be partially wet, enabling them to adapt to the wet domain. 

At the session, we intend to introduce a new explicit finite volume scheme that leverages high-resolution bathymetry data to more accurately incorporate non-linear bottom resistance effects. Show preliminary results of how the conveyance is improved for large meshes and what that means for the total simulation time. This scheme is a step toward an explicit depth-dependent flood and dry method for the SWEs, enabling the use of coarse meshes while retaining critical physical effects. Ultimately, this innovation will drastically reduce simulation time for flood predictions, facilitating more accurate simulations within shorter durations.  

[1] V. Casulli. A high-resolution wetting and drying algorithm for free-surface hydrodynamics. International Journal for Numerical Methods in Fluids, 60:391–408, 2009. 

[2] N. D. Volp, B. C. Van Prooijen, and G. S. Stelling. A finite volume approach for shallow water flow accounting for high-resolution bathymetry and roughness data. Water Resources Research, 49:4126–4135, 2013. 

How to cite: Bitsch, M., Grooss, J., Sørensen, O. R., and Engsig-Karup, A.: Fast flood finite volume model for the shallow water equations using high-resolution bathymetry data , EGU General Assembly 2024, Vienna, Austria, 14–19 Apr 2024, EGU24-19236, https://doi.org/10.5194/egusphere-egu24-19236, 2024.

EGU24-19663 | PICO | HS4.4 | Highlight

Recent updates of the Coastal Early Warning System of the Emilia-Romagna Region (Italy): oceanographic forecasts at the local scale 

Silvia Unguendoli, Luis Germano Biolchi, Andrea Valentini, Christian Ferrarin, and Georg Umgiesser

The coastal areas of Emilia-Romagna (Northern Italy) are characterised by different environments, including sandy beaches and the transitional areas of the Po Delta. The low-lying sandy beaches render the local coastlines highly vulnerable to extreme meteo-marine events, which can have serious consequences such as marine ingression, coastal erosion and flooding. 

The Regional Agency for Prevention, Environment and Energy of Emilia-Romagna (Arpae) manages an Operational Early Warning System for Coastal Risks (EWS) that provides daily forecasts, integrated with a Regional Observing Network. 

The EWS consists of different implementations of a meteorological model (COSMO), a wave model (SWAN-MEDITARE), an oceanographic model (Adriac, based on COAWST) and a morphodynamics model (XBeach). Adriac oceanographic forecasts are carried out on a regular grid with a fixed resolution (1 km). Structured grids, however, struggle to accurately resolve short scale physical processes and complex bathymetries, especially given the complexity of the regional coastline.. For this reason, a very high resolution hydrodynamic model for the Po Delta and the Emilia-Romagna coast, extending inland up to the Pontelagoscuro station (river flow measurements), was developed. The model (shyfER) is based on the SHYFEM code that solves the hydrodynamic equations on unstructured meshes. It provides daily forecasts (+72 hours) of total water level, salinity, temperature and currents.

As salt intrusion in the Po Delta is an important phenomenon that has increased in frequency and intensity in recent years, the model performance in terms of salt wedge representation is currently being evaluated. Furthermore, tests were conducted in terms of microbiological dispersion simulations by coupling the model with BFM (Biogeochemical Fluxes Model) in a 0-dimensional setting.

Finally, it is crucial not to overlook the significance of observations, as they enable accurate calibration and validation of models. Thanks to European funding, Arpae has been able to expand its marine-coastal observation network, which currently consists of three tide gauges (at Porto Garibaldi, Cattolica and Cervia), a wave buoy with a current-meter (at Cesenatico) and various multiparametric stations. In addition, a regional monitoring network of eight webcams (camERa) has been installed along the regional littoral allowing continuous monitoring of the coastal areas.

Arpae-SIMC is currently involved in several projects to maintain and update the system, including the DIRECTED project (Horizon 2020), which focuses on the "power" of the Early Warning Systems. Together with the Civil Protection of the Emilia-Romagna Region (ARSTPC-ER) Arpae leads the Real-World Lab in Emilia-Romagna.

How to cite: Unguendoli, S., Germano Biolchi, L., Valentini, A., Ferrarin, C., and Umgiesser, G.: Recent updates of the Coastal Early Warning System of the Emilia-Romagna Region (Italy): oceanographic forecasts at the local scale, EGU General Assembly 2024, Vienna, Austria, 14–19 Apr 2024, EGU24-19663, https://doi.org/10.5194/egusphere-egu24-19663, 2024.

The comparative performances of two variable parameter Muskingum flood routing models are evaluated in this study from the perspective of overall reproduction of the routed flood hydrographs characterized by different magnitudes of attenuation of the routed benchmark hydrographs. These two models are the Variable Parameter Muskingum-Cunge-Todini (MCT) model advocated by Todini in 2007, and the Variable Parameter McCarthy-Muskingum (VPMM) model advocated by Perumal and Price in 2013. To investigate this objective, routing studies were undertaken by routing a given hypothetical inflow hydrograph in 25 hypothetical trapezoidal channel reaches of the same geometrical size, but each characterized by different unique combinations of channel bed slopes and Manning’s roughness coefficients. The study results demonstrate that the VPMM model is capable of better reproduction of different levels of attenuation of the routed benchmark hydrographs in small bed slope channels in comparison with that of the MCT model. However, for steep and very steep bed slope channels, where the attenuation is small or insignificant, both the VPMM and MCT models perform equally well due to the reason that the latter model is a specific case of the former model. The study concludes that the application of the VPMM model is more suitable for field routing studies than the MCT model, when the magnitude of the water surface gradient of the inflow hydrograph is characterized by an absolute magnitude of (1/S0) ∂y/∂x where, S0 and ∂y/∂x are, respectively, the bed slope of the channel and the relative water surface gradient of the inflow hydrograph. The added advantage of employing the VPMM model is that it has the capability of estimating the stage hydrograph at the end of the routing reach or sub-reaches corresponding to the routed discharge hydrograph in a manner consistent with the numerical solution approach of the full Saint- Venant equations.

How to cite: Perumal, M. and Rao, C. M.: Comparative evaluation of two physically-based mass conservative variable parameter Muskingum models, EGU General Assembly 2024, Vienna, Austria, 14–19 Apr 2024, EGU24-20746, https://doi.org/10.5194/egusphere-egu24-20746, 2024.

EGU24-1297 | Posters on site | HS4.5 | Highlight

Better weather forecasts = better human health? Yes, with TRIGGER(s) 

Claudia Di Napoli and Fredrik Wetterhall

As the impacts of climate change on human health become increasingly evident, so does the need for a systemic and interdisciplinary understanding on the climate-health connection. Achieving such an understanding is key to the development of effective and rational adaptation plans, including those involving the creation of weather forecasts-driven systems that can increase the preparedness and response to health hazards.

To address this shortcoming, the Horizon Europe project TRIGGER (SoluTions foR mItiGatinG climate-induced hEalth thReats) aims to generate and disseminate information about upcoming conditions detrimental to human health, such as heatwaves and cold spells, via an innovative prototype that integrates state-of-the-art climate and weather indicators with personal exposure monitoring data.

We here present the TRIGGER prototype with a focus on the hydrometeorological prediction system that is tasked to forecasts health-impacting climate variables and indicators on temporal scales ranging from the short-range (hours) to sub-seasonal lead-time. Using a co-design approach involving medical doctors and epidemiologists, we describe how the system utilizes the ECMWF forecasts, provides probabilistic predictions for the near future, and enables the assessment of the associated uncertainty.

How to cite: Di Napoli, C. and Wetterhall, F.: Better weather forecasts = better human health? Yes, with TRIGGER(s), EGU General Assembly 2024, Vienna, Austria, 14–19 Apr 2024, EGU24-1297, https://doi.org/10.5194/egusphere-egu24-1297, 2024.

EGU24-3809 | ECS | Posters on site | HS4.5 | Highlight

MeteoAlarm – Towards Tomorrow’s Warnings 

Johannes Fleisch and Giora Gershtein

MeteoAlarm serves as a central and comprehensive one-stop shop for hydrometeorological warnings across 38 European countries. Designed to provide critical awareness information for preparing and responding to hazardous weather events, MeteoAlarm consolidates warnings from National Meteorological and Hydrological Services (NMHSs) on a unified platform, aggregating and making them readily accessible through the MeteoAlarm Visualisation and Feeds.

The platform's primary objective is to present the current awareness situation coherently, ensuring a consistent interpretation throughout Europe in an easily comprehensible manner. This is achieved by using a simple three-colour code (yellow, orange, and red) and by providing impact scenarios and advisories to the general public. This approach enables individuals to stay informed about the latest warnings, take necessary precautions, and minimise risks associated with hazardous weather conditions, supporting decision-makers on the European level, such as the Emergency Response Coordination Centre (ERCC) of the European Commission. Essential to MeteoAlarm's success are its redistributors, such as AccuWeather, Apple, Google, or IBM/The Weather Company, fundamental in disseminating warnings to hundreds of millions of end-users.

MeteoAlarm actively engages in the RODEO project, a collaborative effort involving eleven European NMHSs, ECMWF, and EUMETNET. This initiative spans from 2023 to 2025 and aims to develop a Federated European Meteo-hydrological Data Infrastructure (FEMDI). The realisation of FEMDI includes the creation of a user interface and Application Programming Interfaces (APIs) designed for accessing meteorological datasets designated as High-Value Datasets under the EU Open Data Directive. Within this project, MeteoAlarm focuses on enhancing the accessibility and usability of its warnings. The goal is to ensure warnings remain reliable, of high quality, and standardised across diverse regions and countries. The development of APIs not only facilitates machine-readable data but also enables near-real-time access through bulk downloads and cross-border querying, seamlessly integrated with the existing MeteoAlarm Service. In parallel, efforts concentrate on improving the quality and harmonisation of warnings, achieved through collaborations with data providers, redistributors, and international frameworks related to the Common Alerting Protocol (CAP).

Looking ahead, MeteoAlarm prioritises key initiatives to maintain its prominent role in weather warning services. A central focus is the shift towards an impact-based multi-hazard approach, aligned with the WMO-led initiative, Early Warnings for All (EW4All). This goes hand in hand with the aim to advance the MeteoAlarm CAP Profile, emphasising adaptability for diverse weather events. The establishment of an Impact-based Warning (IbW) Working Group and the extension of early warnings beyond the current two-day limit are short-term objectives, supporting MeteoAlarm's overarching vision. Strengthening collaboration with redistributors and enhancing knowledge sharing and communication between MeteoAlarm Members collectively reinforces resilience, adaptability, and engagement within the meteorological community.

The anticipated impact of MeteoAlarm’s efforts will enhance the ability of individuals and organisations to engage in more efficient disaster preparedness and response at both national and international levels, ensuring a safer and more resilient future for all.

How to cite: Fleisch, J. and Gershtein, G.: MeteoAlarm – Towards Tomorrow’s Warnings, EGU General Assembly 2024, Vienna, Austria, 14–19 Apr 2024, EGU24-3809, https://doi.org/10.5194/egusphere-egu24-3809, 2024.

EGU24-5309 | Orals | HS4.5 | Highlight

Africa Multi-Hazard Early Warning and Early Action System for Strengthening Resilience to Natural Hazards  

Andrea Libertino, Lorenzo Alfieri, Laura Poletti, Nicola Testa, Alessandro Masoero, Simone Gabellani, Marco Massabò, Jully Ouma, Ahmed Amdihun, Godefroid Nshimirimana, John Mathias KiriwaiJ, Lusajo Ambukeje, Luca Rossi, Katarina Mouakkid Soltesova, and Huw Beynon

The Africa Multi-Hazard Early Warning and Action System for Disaster Risk Reduction (AMHEWAS for DRR) is a joint effort, led by the African Union Commission (AUC) in coordination with Regional Economic Communities and Member States and with the technical and scientific support of UNDRR and CIMA Foundation, aimed at strengthening Africa's resilience to natural hazards. This comprehensive system encompasses a multi-scale approach, spanning from continental to regional and national levels, to enhance early warning capabilities and promote effective disaster risk management strategies. 

On the continental scale, AMHEWAS operates through a network of Situation Rooms. These interconnected hubs facilitate real-time information exchange, coordination of response efforts, and dissemination of advisories on potential threads and related impacts to national institutions. To ensure standardized operational procedures across the continent, AMHEWAS has established unified standard operating procedures, ensuring consistent application protocols and methodologies. 

Central to AMHEWAS' approach is the Continental Watch (CW), an impact-based forecast bulletin for rain, wind and flood hazards, that synthesizes insights from automated impact-based forecast systems. The CW provides timely and actionable information to decision-makers across the continent, enabling proactive measures to mitigate potential disaster impacts. Ongoing disasters can trigger Disaster Situation Reports (DSRs), co-produced by the AUC with the affected Regional Economic Communities (RECs) and the national AMHEWAS stakeholders, for informing disaster risk reduction (DRR) efforts and ensuring timely and appropriate responses to emergencies.  

AMHEWAS integrates risk data and forecasting products from global and regional authoritative sources to produce advisories as a combination of hazards, exposure, vulnerability and national copying capacity. Based on the possible expected impacts in the next 5 days, advisories are issued with a threshold-based mechanism with 4 levels of activation of the system. High level is related with the potential of the estimated impacts to overcome the capacity of the countries, while for lower advisories the effects are expected to be managed by national or subnational authorities. The potential impacts are estimated with an innovative automatic approach, that involves the overlap of the forecasted hazards, with layers of exposed elements, taking into consideration the lack of copying capacity derived from the INFORM database. 

In order to maximize the robustness of the forecasts AMHEWAS adopts a multimodel approach. As regards wind and rain, the forecast is carried out considering the combination of different meteorological global models. As regards flood, the reference model is GLOFAS, combined for the Great Horn of Africa region with the results of the impact-based flood forecast system FloodPROOFS East Africa (FPEA). FPEA is an operational system based on open-source technologies that employs an impact-based approach, integrating weather forecasting, hydrology and hydraulic modeling, as well as risk assessment to provide accurate and actionable flood forecasts up to five days in advance. Given its cross-border nature, the system allows for a comprehensive approach to large-scale hydrological assessment, easily scalable in an operational framework on a national scale. 

AMHEWAS is working on further integration of regional forecasting products from WMO specialized centers and national level, in order to improve the risk knowledge and information products generated.

How to cite: Libertino, A., Alfieri, L., Poletti, L., Testa, N., Masoero, A., Gabellani, S., Massabò, M., Ouma, J., Amdihun, A., Nshimirimana, G., KiriwaiJ, J. M., Ambukeje, L., Rossi, L., Mouakkid Soltesova, K., and Beynon, H.: Africa Multi-Hazard Early Warning and Early Action System for Strengthening Resilience to Natural Hazards , EGU General Assembly 2024, Vienna, Austria, 14–19 Apr 2024, EGU24-5309, https://doi.org/10.5194/egusphere-egu24-5309, 2024.

Effective management and communication of earthquake risks is crucial for enhancing societal preparedness and resilience. This study investigates earthquake management strategies using Multi-Criteria Decision-Making (MCDM), specifically the Analytic Hierarchy Process (AHP). The focal earthquake event driving this investigation occurred on September 8, 2023, at 11:11 PM local time. With a magnitude of 6.8, the seismic incident had its epicenter approximately 72 km southwest of Marrakech within the Al Haouz province.
A comprehensive assessment is conducted on ten distinct earthquake management strategies in Morocco. These encompass building codes and construction standards (S1), early warning systems (S2), public education and awareness (S3), land use planning (S4), emergency response plans (S5), international cooperation (S6), research and monitoring (S7), infrastructure resilience (S8), community preparedness (S9), and insurance and financial preparedness (S10). The evaluation involves a thorough examination against a set of criteria encompassing aspects such as effectiveness in risk reduction (C1), cost-effectiveness (C2), inclusivity and social equity (C3), adaptability and flexibility (C4), environmental impact (C5), compliance with standards and insurance uptake (C6), interagency collaboration (C7), and data utilization (C8).
The resulting criteria weights underscore their relative importance, with C1 deemed highly significant (30%), C2 and C3 moderately important (20% and 15%, respectively), and C4, C5, C6, C7, and C8 holding lesser significance (ranging from 10% to 5%).
Performance scores are assigned to rank the earthquake management strategies, revealing that A2 attains the highest score (0.45), followed by A4 (0.43), A10 (0.42), A9 (0.41), A3 (0.4), A8 (0.39), A7 (0.38), A6 (0.37), and A5 (0.35). A1 achieves a moderate score (0.32), providing valuable insights for decision-making in earthquake risk reduction.
This research underscores the pivotal role of early warning systems in earthquake management, emphasizing the significance of timely alerts, community engagement, and financial preparedness within Morocco's comprehensive risk reduction strategy. The study advocates for data-driven decision-making to enhance preparedness, response capabilities, and mitigation measures. Moreover, this research holds implications for recent seismic events, such as the magnitude 7.6 earthquake in Japan on January 1, 2024.

How to cite: Bouramdane, A.-A.: Morocco’s Earthquake Risk Management: A Multi-Criteria Decision-Making Approach and Implications for the Recent Japan Earthquake, EGU General Assembly 2024, Vienna, Austria, 14–19 Apr 2024, EGU24-6158, https://doi.org/10.5194/egusphere-egu24-6158, 2024.

EGU24-9073 | ECS | Posters on site | HS4.5

Bridging gaps, saving lives: Integrating communities’ voices in advancing flood early warning system in developing countries  

Anup Shrestha, Anise McCrone, Josias Láng-Ritter, Maija Taka, and Olli Varis

Safeguarding lives and properties during major disasters, such as floods, relies on timely and comprehensive communication and dissemination of early warning information. According to UNDRR, an effective Early Warning System (EWS) consists of four pillars: risk knowledge, monitoring and warning services, dissemination and communication and response capability. It is crucial to assess the operational status of EWS, particularly in vulnerable rural areas of developing countries, where technical EWS capacity as well as residents' awareness, understanding of messages, and taking appropriate actions may be hindered by multifaceted factors such as communication of complex forecast information and their pathways, lack of sufficient monitoring stations, low literacy, geographical challenges, and other socio-economic factors.  

The present study focuses on advancing knowledge on the challenges in implementing the four pillars of flood EWS from the perspective of vulnerable communities for planning necessary interventions to enhance flood resilience. We conducted community surveys, key informant interviews, and reviewed publicly available information in the flood prone West Rapti Basin of Nepal. Further, we applied statistical tests to analyze the community surveys and examined the key informant interviews through thematic analysis based on the four EWS pillars. Finally, we assessed the potential economic impacts across various flooding scenarios to integrate early actions in EWS for saving lives and properties. 

Our study reveals that most of the local population face difficulties interpreting associated risks when they are communicated with risk maps. However, the understanding of early warning and reception of SMS alerts varies strongly among rural municipalities due to language, literacy status, and mobile network problems. The community’s interest to participate in warning process and to help in warning others suggests the importance of a community-centric approach and feedback mechanism to the existing top-down approach of EWS. The study also highlights the potential of impact-based risk maps integrated with the findings of community surveys and key informant interviews to plan early actions for informed decision making. 

The potential improvements of EWS include upgradation of warning information dissemination, participatory early warning process, development of protocols for early actions and response mechanism, warning production based on impact-based forecast, improving technical capabilities for monitoring hazards, and creating community-level database to record the post flood impacts and community feedback to validate warning and impact-based forecasts. Our study contributes to strengthening EWS through impact-based quantitative risk analysis which is implementable worldwide. Future research is called for on how to develop the impact-based forecasting chain for different future scenarios and incorporate citizen science to improve this process.

How to cite: Shrestha, A., McCrone, A., Láng-Ritter, J., Taka, M., and Varis, O.: Bridging gaps, saving lives: Integrating communities’ voices in advancing flood early warning system in developing countries , EGU General Assembly 2024, Vienna, Austria, 14–19 Apr 2024, EGU24-9073, https://doi.org/10.5194/egusphere-egu24-9073, 2024.

EGU24-10635 | ECS | Posters on site | HS4.5

Heavy-rain Forecasting with the Application of High-density Swarm Network of Optical Rain Sensors and Artificial Intelligence. 

Nibesh Shrestha, Alexander Buddrick, Benjamin Mewes, and Henning Oppel

Heavy rainfall, a prominent consequence of climate change, induces substantial pluvial flooding as the urban drainage systems fail to deal with the water surge. The risks intensify with the cloud-burst rain on a catchment area without any gauge. Especially in topographically complex watersheds, the limitations associated with conventional precipitation monitoring tend to exacerbate. These heavy-rain events, if undetected, pose severe threats, causing extensive damage to the settlements and industries without timely warning.

With a motive to bridge this gap, we present the exemplary development of a cutting-edge AI-supported early warning system and cell detection (now-casting) of heavy rainfall events. Utilizing an IoT-based optical method, we record qualitative rainfall intensity data with a high-density swarm network of rainfall sensors spread across the target region. These data can be immediately used to forecast the path of the rain with the physical optical-flow method. Furthermore, these data are used to train the AI, generating heavy rain forecasts up to 60 minutes before the rain reaches points of interest. This lead time is crucial for citizens and rescue forces to reduce the chaos phase and prepare themselves on time even before the heavy rain cells reach their location and create havoc.

The innovative optical rainfall sensors have been installed and tested in Liederbach am Taunus since the summer of 2022, demonstrating their efficacy and accuracy during the August 2023 heavy rainfall storm event. The system adeptly captured heavy rainfall data, showcasing great potential for early warnings when implemented at a full scale alongside AI applications.

How to cite: Shrestha, N., Buddrick, A., Mewes, B., and Oppel, H.: Heavy-rain Forecasting with the Application of High-density Swarm Network of Optical Rain Sensors and Artificial Intelligence., EGU General Assembly 2024, Vienna, Austria, 14–19 Apr 2024, EGU24-10635, https://doi.org/10.5194/egusphere-egu24-10635, 2024.

EGU24-11042 | Posters on site | HS4.5

Impact-based forecasting for human displacement by tropical cyclones to support anticipatory humanitarian action 

Pui Man Kam, Fabio Ciccone, Chahan M. Kropf, Lukas Riedel, Christopher Fairless, and David N. Bresch

Tropical cyclones (TCs) displace the second-largest number of people each year among all natural hazards, following floods.  While TCs impose hardships and threaten lives, the negative impacts can be mitigated through anticipatory action such as evacuation, emergency protection, and humanitarian aid coordination. An impact-based forecast can support anticipatory action planning by providing detailed information about the numbers and locations of people at risk of displacement.

Here we introduce the first implementation of a globally consistent and regionally calibrated TC-related displacement forecast that combines the (1) TC weather forecast with (2) the spatially explicit representation of population distribution and (3) their vulnerability. Furthermore, we emphasise the importance of incorporating uncertainties from all three components in a global uncertainty analysis to reveal the full range of possible outcomes. Additionally, sensitivity analysis can help us helps us understand how the forecast outcomes depend on uncertain inputs.

We demonstrate the TC displacement forecast through a case study of storm Yasa in the Fidji in 2020. Additionally, we conduct a global uncertainty and sensitivity analysis for all recorded TC displacement events from 2017 to 2020. Our findings suggest that for longer forecast lead times, decision-making should focus more on meteorological uncertainty, while greater emphasis should be placed on the vulnerability of the local community shortly before TC landfall. The open-source code and implementations are also readily transferable to other hazards and impact types.

How to cite: Kam, P. M., Ciccone, F., Kropf, C. M., Riedel, L., Fairless, C., and Bresch, D. N.: Impact-based forecasting for human displacement by tropical cyclones to support anticipatory humanitarian action, EGU General Assembly 2024, Vienna, Austria, 14–19 Apr 2024, EGU24-11042, https://doi.org/10.5194/egusphere-egu24-11042, 2024.

EGU24-11496 | ECS | Orals | HS4.5

Sub-seasonal prediction of heat-related mortality in Switzerland 

Daniela I.V. Domeisen, Maria Pyrina, Dominik Büeler, Ana M. Vicedo-Cabrera, Sidharth Sivaraj, Adel Imamovic, Christoph Spirig, and Lionel Moret

Heatwaves have various impacts on human health, including an increase in premature mortality. The summers of 2018 and 2022 are two prominent examples with record-breaking temperatures leading to thousands of excess deaths in Europe. Nevertheless, there is a limited assessment of the potential for heat-health warning systems on timescales up to several weeks ahead at a regional level. This study combines methods of climate epidemiology and sub-seasonal forecasting to predict the expected heat-related mortality for two regions in Switzerland during the summers of 2018 and 2022. The sub-seasonal forecasts were first downscaled to a 2km-by-2km grid using a quantile mapping approach. The statistical heat-mortality relationship for the Swiss cantons of Zurich and Geneva between 1990 and 2017 was estimated in a two-stage time-series analysis using observed daily temperature and mortality. Then, heat-related mortality in the summers of 2018 and 2022 was calculated using the estimated heat-mortality relationship and the observed total mortality and temperature. The resulting estimated heat-related mortality was subsequently compared with the predicted heat-related mortality based on sub-seasonal temperature forecasts. Preliminary results show that we can successfully predict short-term heat-related mortality peaks for lead times up to 2 weeks, while longer periods of heat-related mortality can be anticipated by lead week 3 and even lead week 4 forecasts. Our findings demonstrate that sub-seasonal forecasts can be a valuable tool for estimating and potentially issuing warnings for the excess health burden observed during central European summers.

How to cite: Domeisen, D. I. V., Pyrina, M., Büeler, D., Vicedo-Cabrera, A. M., Sivaraj, S., Imamovic, A., Spirig, C., and Moret, L.: Sub-seasonal prediction of heat-related mortality in Switzerland, EGU General Assembly 2024, Vienna, Austria, 14–19 Apr 2024, EGU24-11496, https://doi.org/10.5194/egusphere-egu24-11496, 2024.

EGU24-11868 | ECS | Orals | HS4.5

Post-processing seasonal meteorological forecasts with artificial intelligence 

Dariana Isamel Avila-Velasquez, Hector Macian-Sorribes, and Manuel Pulido-Velazquez

Raw meteorological forecasts from global meteorological models are always biased and require post-processing to tailor them to the regional and local climatic features before they can be used for other applications.  However, this might be challenging depending on the features and the meteorological variable considered. This contribution applies and evaluates the use of an artificial intelligence (AI) technique, fuzzy logic (FL), to post-processing meteorological seasonal forecasts, comparing its performance in terms of improved forecasting skills with other post-processing techniques for different forecasting systems and variables. The analysis is applied to the Jucar basins River Basin (Eastern Spain), which are characterized by extreme meteorological events (heavy rains, droughts, heatwaves).

For this area, six daily-scale seasonal forecasting systems from the Copernicus Climate Change Service (C3S) and six variables (precipitation; minimum, mean and maximum temperature; solar radiation and wind speed) are considered. ERA5 is used as reference dataset for post-processing, and daily data for the period 1995-2014 is employed to perform the comparison. The evaluation of the performance of AI is done by comparing the skill of AI-based post-processed forecasts with two common post-processing algorithms: linear scaling (LS) and quantile mapping (QM). The algorithms for all three post-processing methods are coded in a Python script. For each system, variable and post-processing alternative, the forecasting skill is measured using the Continuous Range Probability Skill Score (CRPSS).

Results show that, with the exception of precipitation, the relative performance of thes methods does not depend on the forecasting system but on the variable considered. FL dominates in maximum and minimum temperature and linear scaling in average temperature, wind speed, and solar radiation. However, LS shows the worst performance in maximum and minimum temperatures, while FL never yields the lowest skill. For precipitation, the ranking between methods depends on the forecasting system. According to the results, FL logic provides robust, skillful post-processing across variables, providing adequate performance for all variables and forecasting systems, while the rest of the methods show a wider spread of performance, from poor to the best.

Acknowledgments: This research has been supported by the University Teacher Training (FPU) grant from the Ministry of Universities of Spain (FPU20/0749); the project “INtegrated FORecasting System for Water and the Environment (WATER4CAST)”, funded by the Valencian Government through the Program for the promotion of scientific research, technological development and innovation in the Valencian Community for research groups of excellence, PROMETEO 2021 (ref: PROMETEO/2021/074); and "THE HUT project” (The Human-Tech Nexus– Building a Safe Haven to cope with Climate Extremes), under the European Union’s horizon research and innovation programme (GA No. 101073957) 

How to cite: Avila-Velasquez, D. I., Macian-Sorribes, H., and Pulido-Velazquez, M.: Post-processing seasonal meteorological forecasts with artificial intelligence, EGU General Assembly 2024, Vienna, Austria, 14–19 Apr 2024, EGU24-11868, https://doi.org/10.5194/egusphere-egu24-11868, 2024.

EGU24-12075 | Orals | HS4.5

Protocol for an end-to-end evaluation of operational warning systems 

Michele Calvello, Guido Rianna, and Brian Golding

The contribution addresses, from a conceptual point of view, the complex issue of evaluating the performance of warning systems that are operating over large areas to cope with the risk posed by extreme weather events. In the protocol, the performance of the systems is evaluated, at each step in the warning production process, considering the “warning value chain” schematization developed in the HIWeather project of the World Meteorological Organization (http://hiweather.net/Lists/130.html). In a perfect warning chain, the warning received by the end user would contain precise and accurate information that perfectly met their need, contributed by each of the many players in the chain; in real warning chains, information, and hence value, are always lost as well as gained at each link in the chain (Golding 2022, https://link.springer.com/book/10.1007/978-3-030-98989-7).

The protocol is structured as a three-part evaluation process: 1) description of the system; 2) assessment of criticalities during high impact events; 3) routine assessment of daily operations. For each part, the protocol prescribes a set of must-do. The description of the warning system must be based on the schematic subdivision of the warning value chain, i.e., six main capabilities and outputs and five information exchanges elements. An important focus on the evaluation of an operational warning system must be devoted to high impact events. For such cases, the evaluation must include: essential information on the event; information on how each element of the warning value chain has been working during the event; synthetic assessment on the performance of the warning system. Finally, the routine assessment must include: identification of the system’s operational elements; identification of the areas covered by the system; identification of period for which to conduct the assessment and sources of data to be used; identification of appropriate and computable (considering the available data) performance indicators for the different elements of the warning value chain; analysis of relevant data for the chosen time period in the identified areas; evaluation of the performance of the different elements of the waring value chain; final judgment on the overall performance of the system.

This study is being carried out within the Horizon Europe project “The HuT: The Human-Tech Nexus - Building a Safe Haven to cope with Climate Extremes” (https://thehut-nexus.eu/). The protocol has been developed considering two cases studies, and will be further put to test during the remaining part of the project. Through this action, detailed information from many different warning systems will be collected and used for a comparative study between warning systems operating, in different areas of the world, for different weather and climate related risks.

How to cite: Calvello, M., Rianna, G., and Golding, B.: Protocol for an end-to-end evaluation of operational warning systems, EGU General Assembly 2024, Vienna, Austria, 14–19 Apr 2024, EGU24-12075, https://doi.org/10.5194/egusphere-egu24-12075, 2024.

EGU24-12509 | ECS | Posters on site | HS4.5

Evaluating a +100-year storm surge using a real-time distributed flood forecasting system  

Emma Dybro Thomassen, Michael Butts, Sanita Dhaubanjar, Jonas Wied Pedersen, Sara Lerer, Mathias Rav, Morten Andreas Dahl Larsen, Kristine Skovgaard Madsen, Phillip Aarestrup, and Grith Martinsen

Estimating the geographical flood extent is a key element in impact-based flood forecasting and crucial for countries with long coastlines, and places where storm surges pose a significant risk, such as Denmark. For local flood mitigation measures and climate adaptation strategies, inundation mapping is often performed using physical models. However, in the context of flood forecasting and early warning, these are computationally demanding and therefore may not be able to provide timely forecasts and effective warnings.

The Danish Meteorological Institute (DMI) has developed a real-time flood forecasting system for storm surge events in Denmark together with the company SCALGO. This system couples the HBM regional oceanic storm surge forecasting model, developed by DMI, with a rapid inundation mapping, developed by SCALGO, using a 0.4 m resolution Digital Elevation Model (DEM). All inland pixels in the DEM are connected to a coastline pixel through pre-computed hydrological flow paths. The predicted water level from the storm surge model at each coastline pixel is then instantaneously projected inland through the pre-mapped flow paths. This study evaluates the performance of the flood forecasting system on the Oct. 20-21 (2023) storm surge event, with an estimated return period of over 100 years and affecting large parts of southern Denmark (and northern Germany).

This flood forecasting system creates a simple inundation mapping based on forecasted sea levels based on a high-resolution DEM modified to account for hydrological flow processes. This real-time flood mapping allows for a visualization of full five-day ocean model forecasts updated continuously at 6h intervals and has been operational for flood warning since October 2022, to supplement DMIs operational ocean forecasting system [1]. 

The evaluation is performed by comparing the inundation map from the flood forecasting system with media reports, photographs, and other data sources to get an overview of spatial and temporal accuracy and accuracy of the severity of the event. We see a large overlap between areas with forecasted flood risks and actual flooded areas. In some cases, the extent of the flooding differs from the area at risk due to errors in the DEM or local emergency services mitigation strategies.

We conclude that the flood forecasting system is useful for identifying coastal areas at risk. While it does not account for detailed physics of flow on land, it is able to reflect the effects of, even very local, geographical variations in sea level that determine the distributions of local-scale flood risk. The current inundation mapping does not currently include the impact of waves, which resulted in larger differences between predictions and actual flooded areas, for easterly-facing locations exposed to large waves. Proposed activities to include the effect of waves will therefore improve the flood forecasting system. 

[1] Andrée, E., Su, J., Larsen, M. A. D., Madsen, K. S., & Drews, M. (2021). Simulating major storm surge events in a complex coastal region. Ocean Modelling, 162, 101802.

How to cite: Thomassen, E. D., Butts, M., Dhaubanjar, S., Pedersen, J. W., Lerer, S., Rav, M., Larsen, M. A. D., Madsen, K. S., Aarestrup, P., and Martinsen, G.: Evaluating a +100-year storm surge using a real-time distributed flood forecasting system , EGU General Assembly 2024, Vienna, Austria, 14–19 Apr 2024, EGU24-12509, https://doi.org/10.5194/egusphere-egu24-12509, 2024.

EGU24-13096 | ECS | Orals | HS4.5 | Highlight

Harnessing decision timelines to improve understanding and integration of local and scientific knowledges across the Climate Services value chain 

Sumiran Rastogi, Micha Werner, and Marc van den Homberg

Climate services are increasingly being co-produced through a negotiation process between climate service providers, purveyors, and end users. Their different knowledge systems (scientific and local) determine to a large extent this process. Local knowledge, covers a range of different knowledges, and includes how individuals perceive their surroundings, validate new information such as coming from science-based climate services, and solve problems. As such, local knowledge holders can range from indigenous, rural, or urban communities to professionals working at various levels of governance and various positions across the climate services value chain (e.g., service providers and purveyors).

Given the diversity of knowledges and knowledge holders, the actual integration of local knowledge in a climate service is challenging. In this research, we present an approach to collect, understand, and integrate local knowledge for climate services through the utilization of decision timelines. Decision timelines are effective tools for elucidating and understanding the decision-making process, allowing stakeholders to visualise changes and patterns over time (e.g., months, seasons, multiple years, etc). Through visual representation, decision timelines offer an effective way to understand links between different knowledges, stimulate discussions, co-design, and co-evaluate climate services with users. Traditionally such timelines have been limited to agricultural users to introduce the topic of climate information and how it relates to the key decisions that farmers need to make. However, in this research, we expand the scope of these timelines to different sectors (e.g., tourism, urban environment) and also to other actors in the climate services value chain (so not only the end user of a climate service). The timelines are instrumental to understand the decision-making over time and to elicit environmental and socio-economic cues (from local or scientific knowledge). Making timelines for those actors more upstream in the climate services value chain also allows to understand the co-production and knowledge management underpinning the governance process and climate service provision itself. We present examples from the different living labs that have been established in the I-CISK project (an EU research initiative), where these decision timelines have been used as a tool to elicit and understand local knowledge.

How to cite: Rastogi, S., Werner, M., and van den Homberg, M.: Harnessing decision timelines to improve understanding and integration of local and scientific knowledges across the Climate Services value chain, EGU General Assembly 2024, Vienna, Austria, 14–19 Apr 2024, EGU24-13096, https://doi.org/10.5194/egusphere-egu24-13096, 2024.

EGU24-14892 | Orals | HS4.5

Enduser Driven and Impact-based Time Dependent Tsunami Early Warning (TiDeTEW) in Aotearoa New Zealand 

Bill Fry, Christopher Mueller, Chris Moore, Emily Lane, Jen Andrews, Chris Zweck, Aditya Gusman, Sophia Tsang, Emeline Wavelet, Anna Kaiser, Ciaran King, Xiaoming Wang, and Biljana Lukovic

Since the 1960s, tsunami early warning has, for the most part, been predicated on using earthquake characterisation as proxy information for tsunami generation. Shortcomings with this approach include large epistemic uncertainties in wave forecasts that typically preclude actionable impact-based forecasts. Fortunately, the tsunami early warning paradigm is shifting. Here we present a prototype next-generation tsunami early warning system implemented by the New Zealand RCET (Rapid Characterisation of Earthquakes and Tsunamis) programme that is currently operational on a best-endeavours basis in New Zealand. This system is based on 1) observational advances including the densification of deep-ocean tsunami meters, 2) scientific advances provided by direct tsunami inversion 3) ensemble and time-dependent forecasting and 4) co-creation with end users of impact-based forecasts products. We call this system TiDeTEW (Time Dependent Tsunami Early Warning)

Following the recent deployment of the 12-station NZ DART tsunamimeter array (Fry et al., 2020), New Zealand’s Tsunami Expert Panel (TEP) can now use direct observations of tsunamis to underpin time-dependent tsunami early warning forecasts. By using DART inversions and ensemble modelling, we reduce uncertainties in forecasts enough to generate actionable early warning products that provide information about the evolution of the threat prior to land arrival, analogous to weather forecasting of storm evolution. Our forecasting products are being improved through co-development with at risk coastal communities that are dominantly indigenous Māori. In past natural disasters, the social structure of Māori communities has proven to be a major advantage in response and incorporation of Māori values into decisions around risk tolerance of the early warning products guides our levels of forecast conservatism. Understanding the response structure in these communities and its strong reliance on marae (Māori communal meeting houses) is also guiding our product development.

In an aligned effort within the UNESCO Intergovernmental Oceanographic Commission (UNESCO-IOC), we have developed a risk-based approach to assess the efficacy of this tsunami early warning method. We quantify the relative number of tsunami sources for which data support at least 20 minutes of pre-impact warning time to vulnerable coastal populations. We further map the warning gaps to population density of exposed coastlines. We apply this scheme using the NZ DART network to better quantify domestic and Southwest Pacific risk and resilience gains delivered by NZ DART and further highlight existing gaps and opportunities, largely around local source tsunamis.

How to cite: Fry, B., Mueller, C., Moore, C., Lane, E., Andrews, J., Zweck, C., Gusman, A., Tsang, S., Wavelet, E., Kaiser, A., King, C., Wang, X., and Lukovic, B.: Enduser Driven and Impact-based Time Dependent Tsunami Early Warning (TiDeTEW) in Aotearoa New Zealand, EGU General Assembly 2024, Vienna, Austria, 14–19 Apr 2024, EGU24-14892, https://doi.org/10.5194/egusphere-egu24-14892, 2024.

EGU24-15463 | ECS | Posters virtual | HS4.5

Community-led AA for flash floods: Lessons learned from the last-mile community during 2022 Extreme Event in North-Eastern Bangladesh  

Md Rayhan, Md. Hasanur Rahman, Rashel Dewyan, Shampa Shampa, Sonia Binte Murshed, and Shammi Haque

Forecast-Based Early Action (FbA) is a promising disaster risk reduction technique that allows communities to take proactive steps with the help of accurate forecasting before a disaster strikes. The current global evidence indicates that timely FbA can save more lives and minimize the impact on communities in the emergency and recovery stages. However, the FbA funded by humanitarians or governments needs some specific forecast window (e.g., 7 to 9 days for riverine floods in Bangladesh) from impact identification to intervention deployment. But in the case of rapid on-set disasters (such as flash floods (FF)), such forecast windows might be difficult to identify as these disasters might happen within 5 to 6 hours. In such cases, our research focuses on how the last mile community takes anticipatory action (AA). As a case study site, we selected the north-eastern (NE) region of Bangladesh, which experienced extreme FF during June 2022.

The first goal of this study was to look into how flash floods change the impact dynamics of last-mile communities over time. The second goal was to investigate how forecasting can be improved in terms of effectiveness and inclusiveness. The third goal was to investigate community-led AA during normal and extreme FF events. To understand local experiences and observations related to climate and environmental cues, 12 Key Informant Interviews (KIIs) and 14 Focus Group Discussions (FGDs) were conducted during Nov-Dec 2023. The Key Informant Interviews (KII) were conducted with representatives from NGOs, CBOs, trade organizations, and government officials. FGDs were held with a variety of groups, including women, the elderly, the disabled, ethnicity, religion, and occupation.

Our research found that rather than official forecasting, communities rely on indigenous knowledge such as cloud patterns, wind flow, atmospheric changes in hilly areas, sudden water temperature drops, color changes, and so on. These indicators serve as early warning signs of impending flash floods, allowing residents to plan ahead of time. Based on these predictive indicators, they take proactive measures such as elevating house plinths and safeguarding essential assets related to their livelihoods around 2.5 months before the FF period. Because the global lead time for FF is short, any AA must rely on community action. Because the NE region of Bangladesh has a long history of FF, their solution would be beneficial for other parts of the world to learn about, especially as the world experiences more FF because of climate change.

How to cite: Rayhan, M., Rahman, Md. H., Dewyan, R., Shampa, S., Murshed, S. B., and Haque, S.: Community-led AA for flash floods: Lessons learned from the last-mile community during 2022 Extreme Event in North-Eastern Bangladesh , EGU General Assembly 2024, Vienna, Austria, 14–19 Apr 2024, EGU24-15463, https://doi.org/10.5194/egusphere-egu24-15463, 2024.

EGU24-15644 | Orals | HS4.5

Establishing effective links between early warnings and early action: general criteria for floods  

Sabrina Meninno, Marta Giambelli, Miranda Deda, Rocco Masi, Antonio Gioia, Enrico Ponte, Marco Massabò, Marina Morando, Romanella Vio, Chiara Paniccia, and Stefania Renzulli

The development and implementation of an effective Early Warnings to Early Actions system (EW-EAS) represent a complex system that integrates scientific insights with practical preventive measures on the ground. This complexity is enhanced by the involvement of diverse actors from various sectors and territorial levels, making the system vulnerable to potential breakdowns arising from factors such as unclear messages, unmet user needs, and implementation gaps.

 Recognizing this complexity and the necessity of merging scientific knowledge with operational field expertise, a set of general criteria for establishing “effective links between EW and EA” as related to floods was formulated in in the framework of the IPA Floods and Fires program for the Western Balkans and Türkiye. They resulted from a collaborative capacity development process conducted by experts from the CIMA Research Foundation and the Italian Civil Protection Department in collaboration with Disaster Risk Management Authorities and hydrometeorological services of the IPA countries.

Specifically designed for technicians and operators of the National Hydro-Meteorological and civil protection agencies, the general criteria serve as valuable resource of knowledge, experience and guidance for practitioners of national and local institutions which have the mandate to protect people, assets and the environment, by reducing the impacts of a flood and preventing the occurrence of emergency situations.

The General Criteria address several areas of the EWS with the ultimate purpose of enhancing a timely response to warnings before a flood occurs, in a progressive way and through early actions that are coordinated among all actors and integrated into plans and procedures. More specifically, the general criteria explore four key areas:

  • Early Warning. As an example, providing clear, consistent, and informative early warning messages (stating who produces the warning, to whom it is addressed, what the expected hazard scenario is, where it is likely to occur, when it is expected, and why it is significant) permits a correct and informed activation of the system.
  • Early Actions and the integration of an EW-EA link within emergency response plans. For instance, defining activation phases of the civil protection system linked to specific alerts enables a systematic and incremental mobilization of resources as flood severity escalates. This key area also offers guidance for constructing a set of early actions, ensuring early actions align with forecasted alert levels and risk information codified within the early warning system.
  • Communication flows for the dissemination of EWs and exchange of information among operational centres and institutions before, during and after the emergency and consequently an effective response. Central to this is the coordination and collaboration across actors in EW-EA, optimizing scarce resources for effective delivery.
  • Simulation exercises. Testing through simulation exercises enables continuous improvements and corrections of gaps to further refine the system.

The general criteria offer a framework for practitioners and institutions for improving the link from EW to EA, transforming risk information into actions on the field that can reduce the impacts of floods to communities.

How to cite: Meninno, S., Giambelli, M., Deda, M., Masi, R., Gioia, A., Ponte, E., Massabò, M., Morando, M., Vio, R., Paniccia, C., and Renzulli, S.: Establishing effective links between early warnings and early action: general criteria for floods , EGU General Assembly 2024, Vienna, Austria, 14–19 Apr 2024, EGU24-15644, https://doi.org/10.5194/egusphere-egu24-15644, 2024.

EGU24-15879 | Orals | HS4.5

From Tsunami Hazard Modelling to Vulnerability Assessment in Mayotte’s east coast: an Interdisciplinary Risk Analysis 

Annabelle Moatty, Mangeney Anne, Le Friant Anne, Poulain Pablo, Marboeuf Alexis, Silver Maxwell, Lemoine Anne, and Pedreros Rodrigo

Mayotte island is divided in two main islands, Grande Terre (363 km²) and Petite Terre (11 km²), and is located in the Comoros archipelago in the Indian Ocean between Madagascar and Mozambique. From a social point of view, this French department is characterised by a young and highly vulnerable population (over 70% live below the poverty line). Furthermore, many households are exposed to hazards such as floods and landslides, cyclones, earthquakes and tsunamis. Concerning these last two, the 2018 seismo-volcanic crisis linked to Fani Maoré (the submarine volcano located 50 km east of Mayotte) has generated a demand from the local and national authorities for decision support elements to implement a risk prevention strategy and anticipate crisis situations.

The objective of this study is to question the interdisciplinary contributions of landslide-generated tsunami numerical modelling and geographical analysis in order to characterise Mayotte’s vulnerability regarding tsunami hazard. By combining the results of numerical simulations performed with the HySea model (Poulain et al, 2022) with available data on the assets (location, level of vulnerability to tsunami risk, etc. (Sahal, 2011)), we carried out a spatial analysis to identify the critical areas in the event of a tsunami, and the consequences of their potential damage.

Our results provide a characterisation of land use in hazard prone areas for four levels of hazard, from low to very high, resulting from the correlation of water depths and velocity. They also support an analysis of the vulnerability of part of the built environment of Petite Terre (which is most at-risk) by mapping these hazard data with vulnerability data at building level. Although the proportion of buildings and roads potentially affected remains relatively low (around 3%), the modelled scenario highlights major organisational vulnerability. Indeed, early warning strategies and systems are challenged on the one hand by the arrival times of the first simulated wave (between 4 min at the airport in the south of Petite Terre, and 13,5 min in Mamoudzou, the capital located to the east of Grande Terre (Poulain et al., 2022)), and on the other by the complexity of detecting a submarine landslide in advance if it is not generated by an earthquake.

References:

Poulain, P., le Friant, A., Pedreros, R., Mangeney, A., Filippini, A. G., Grandjean, G., Lemoine, A., Fernández-Nieto, E. D., Castro Díaz, M. J., and Peruzzetto, M. (2022) Numerical simulation of submarine landslides and generated tsunamis: application to the on-going Mayotte seismo-volcanic crisis. Comptes Rendus - Geoscience 354(S2): 1–30.

Sahal A. (2011), Le risque tsunami en France : contributions méthodologiques pour une évaluation intégrée par scénarios de risque, Thèse de doctorat de géographie, dir. Pr. F. Lavigne et F. Leone, Université Paris 1 Panthéon-Sorbonne.

How to cite: Moatty, A., Anne, M., Anne, L. F., Pablo, P., Alexis, M., Maxwell, S., Anne, L., and Rodrigo, P.: From Tsunami Hazard Modelling to Vulnerability Assessment in Mayotte’s east coast: an Interdisciplinary Risk Analysis, EGU General Assembly 2024, Vienna, Austria, 14–19 Apr 2024, EGU24-15879, https://doi.org/10.5194/egusphere-egu24-15879, 2024.

EGU24-16207 | ECS | Posters virtual | HS4.5

Communicating Life-Saving Information in Emergencies: Implementation of Multi-Hazard Early Warning System in India 

Sandeep Sharma, Saurabh Basu, Suvam Suvabrata Behera, Sumit Kumar Jha, Akshay Dawar, Niraj Kant Kushwaha, Sabyasachi Majumdar, Smriti Sachdev, Anugandula Naveen Kumar, Manish Bhaskar, Arun Yadav, and Pankaj Kumar Dalela

Disaster risk reduction is a pressing global challenge owing to climate change and other anthropogenic factors. Communicating timely, trusted, and actionable life-saving information to the public in emergency or disaster situations can make a significant difference by reducing the potential impacts and improving preparedness and mitigation efforts. In the direction of building a disaster-resilient India, inline with the global initiatives like Early Warnings for All, an end-to-end AI-driven Multi-Hazard Early Warning System has been established, standardizing and streamlining the flow of disaster warning dissemination in the country. The system utilizes International Telecommunication Union (ITU’s) Common Alerting Protocol (CAP) for disaster warning information exchange between the entities. Existing non-CAP compliant legacy infrastructure have also been integrated with the system by implementation of cost-efficient Interworking Systems (IWS). More ways for enhanced communication, making use of different ICTs and networks, including telecom (SMS and Cell Broadcast), broadcasting (Radio and Television), satellite, internet (Mobile Application, Web Dashboards, Browser-based Notifications), public addressing systems (Coastal Sirens, Railway Passenger announcement systems) etc. have been integrated for ensuring last mile reachability. The implementation of an indigenously developed cell broadcast system allows warnings to be disseminated within a few seconds to a large area population. Satellite based messaging services have been integrated for areas with no network coverage, such as alerting fishermen in high sea and targeting the tough terrain. The platform has been rigorously utilized in recent disaster situations, including Cyclone Michaung, Biparjoy, Mandous, Sitrang, etc. and more than 14 billion SMS have been disseminated till date across different geographical regions. It is operational across PAN India in all 36 State/ UTs, integrating 100+ stakeholders on the converged platform, supporting dissemination in over 22 regional languages, and addressing massive climatic, digital, linguistic, and geographic diversity in the country. The collective efforts have resulted in key advancements in the direction of disaster risk reduction.

How to cite: Sharma, S., Basu, S., Behera, S. S., Jha, S. K., Dawar, A., Kushwaha, N. K., Majumdar, S., Sachdev, S., Kumar, A. N., Bhaskar, M., Yadav, A., and Dalela, P. K.: Communicating Life-Saving Information in Emergencies: Implementation of Multi-Hazard Early Warning System in India, EGU General Assembly 2024, Vienna, Austria, 14–19 Apr 2024, EGU24-16207, https://doi.org/10.5194/egusphere-egu24-16207, 2024.

EGU24-16805 | Orals | HS4.5

Toward large-scale demonstration of local multi-hazard early warning tools 

Shinju Park, Berenguer Marc, and Daniel Sempere-Torres

Catalonia is located in north-eastern Spain and in a predominantly subtropical Mediterranean climatic zone. Due to the diverse geographical and orographic features, the climate within the region exhibits variations due to local continental, oceanic, and alpine influences.
Within the Horizon Europe RESIST project (2023-2027), Catalonia is one of the leading regions for the demonstration of climate change adaptation strategies toward climate change resilience through innovation, science, and technology. The strategies being analyzed in Catalonia focus on the sector of civil protection to achieve improved preparedness and tools for disaster risk and emergency management for weather-related hazards (e.g., flash floods, wildfires, heat waves, etc.).
The presentation will address the key enabling tools and activities toward better adaptation; e.g., improving and expanding the existing Multi-Hazard Early Warning System (EWS) over Catalonia, improving the assessment of vulnerabilities and including vulnerable communities, raising awareness. These aspects will be evaluated during a long-term demonstration in several local municipalities of the region. The first results obtained during 2023 will be presented; particularly for the major flood event in June 2023 in Terrassa city.

How to cite: Park, S., Marc, B., and Sempere-Torres, D.: Toward large-scale demonstration of local multi-hazard early warning tools, EGU General Assembly 2024, Vienna, Austria, 14–19 Apr 2024, EGU24-16805, https://doi.org/10.5194/egusphere-egu24-16805, 2024.

EGU24-17969 | ECS | Posters on site | HS4.5

Drought impact-based forecasting of crop yield in India 

Anastasiya Shyrokaya, Sameer Uttarwar, Giuliano Di Baldassarre, Bruno Majone, and Gabriele Messori

The reliable prediction of drought impacts on crop yield in India poses a significant challenge due to the complex interactions of climatic variables, systems vulnerabilities and impacts propagation. Advanced approaches, such as impact-based forecasting, become necessary to address the intricate nature of this challenge. In this study, we leveraged remote sensing-based vegetation indicators as proxies for crop yield, along with multiple drought indices across various accumulation periods, to establish a robust indicator-impact relationship. We further performed a comparative analysis of various machine-learning algorithms to assess their efficacy in predicting crop yield impacts on a subseasonal-to-seasonal scale. We finally evaluated the accuracy of predicting the crop yield impacts based on drought indices computed from ECMWF’s seasonal forecast system SEAS5.

Our analysis not only unveils seasonal trends and spatio-temporal patterns in indicator-impact links but also marks a pioneering effort in comparing diverse machine-learning algorithms for establishing an impact-based forecasting model. As such, these findings offer valuable insights into the dynamics of drought impacts on crop yield, providing a monitoring tool and a foundational basis for implementing targeted drought mitigation actions within the agricultural sector. This research contributes to advancing the understanding of impact-based forecasting models and their practical application in addressing the challenges associated with drought impacts on crop yield in India.

How to cite: Shyrokaya, A., Uttarwar, S., Di Baldassarre, G., Majone, B., and Messori, G.: Drought impact-based forecasting of crop yield in India, EGU General Assembly 2024, Vienna, Austria, 14–19 Apr 2024, EGU24-17969, https://doi.org/10.5194/egusphere-egu24-17969, 2024.

EGU24-206 | ECS | Posters on site | HS4.6

Key role of AquaINFRA Interactive Platform integrated in blue research infrastructures 

Kaori Otsu, Lluís Pesquer, and Xavier Garcia

The increasing acquisition of observations in hydrological research is a critical factor to accelerate FAIR and open data sharing across relevant scientific communities.  Conventionally, research infrastructures have developed in silos that are specific to the domains and/or countries. With the ambition of tackling this fragmentation, the establishment of European Open Science Cloud (EOSC) is in progress to federate multidisciplinary research infrastructures by ‘Enabling an operational, open and FAIR EOSC ecosystem (INFRAEOSC)’ projects.  One of them, AquaINFRA (https://aquainfra.eu), has been funded to protect oceans, seas, coastal and inland waters, in support of the EU Mission 'Restore our Ocean and Waters' by 2030.

AquaINFRA will develop a research infrastructure equipped with FAIR multi-disciplinary data and services, allowing seamless data discovery and processing through the AquaINFRA Interaction Platform (AIP) to support freshwater and marine scientists and integrate with EOSC seamlessly. More specifically, the AIP will include a data discovery and access service as well as spatio-temporal models in Virtual Research Environments (VREs) to provide the optimal environment for the global hydrosphere research through interoperability with external infrastructures such as the European Digital Twin of the Ocean (EDITO).

Regional studies will highlight the Mediterranean case in Tordera and Maresme, Catalonia, with a VRE workflow to evaluate the marine ecological state impacted by land catchment interactions in a system of the hydrological cycle.  Based on the methodology of coupling freshwater and marine models using different types of data (e.g. in-situ, remote sensing, socio-economic) and services (e.g. Copernicus, EMODnet) from local, regional, national to European sources, we conclude with the challenges and opportunities for enabling a FAIR research environment among the interested regional stakeholders including scientists and decision-makers to provide feedback to the EOSC Partnership.

(This project has received funding from the European Commission’s Horizon Europe Research and Innovation programme under grant agreement No 101094434.)

How to cite: Otsu, K., Pesquer, L., and Garcia, X.: Key role of AquaINFRA Interactive Platform integrated in blue research infrastructures, EGU General Assembly 2024, Vienna, Austria, 14–19 Apr 2024, EGU24-206, https://doi.org/10.5194/egusphere-egu24-206, 2024.

Extreme events like droughts and floods can have significant impact on the environment and society. As a result effective water management strategies are necessary to limit and mitigate these impacts. In the past decade, the Netherlands has experienced several extreme drought events, raising increasing interest in adapting water management practices, traditionally focused on floods, to address droughts more directly and effectively.

Machine learning techniques have previously been tested for the same region in terms of seasonal forecasting1  and projections2 under different warming scenarios3, showing the additional benefit of these techniques in downscaling large-scale input data to local-scale relevant information for water managers.

This recent work aims to go a step further to explore water management options for drought mitigation by incorporating machine learning in a framework of hydrological simulations, water management scenarios and impact functions. By incorporating the insights gained from previous work, a closer focus is given on human aspects and its impact on local drought management.

We developed a Multi-Target Long Short-Term Memory (LSTM) model which facilitates the exploration of different water management options. An essential finding is that taking proactive actions earlier can further limit drought impacts and help to mitigate long recovery periods that would have been observed otherwise. With the Multi-LSTM water management model we can potentially reduce drought impact by 3-5% for the droughts in 2003, 2015 and 2018. As a results, this work yields valuable insights for operational water management and potential improvements in water management strategies with machine learning techniques to effectively address future drought events.

1) Hauswirth, S. M., Bierkens, M. F. P., Beijk, V., and Wanders, N.: The suitability of a seasonal ensemble hybrid framework including data-driven approaches for hydrological forecasting, Hydrol. Earth Syst. Sci., 27, 501–517, https://doi.org/10.5194/hess-27-501-2023, 2023.

2) Hauswirth SM, van der Wiel K, Bierkens MFP, Beijk V and Wanders N (2023) Simulating hydrological extremes for different warming levels–combining large scale climate ensembles with local observation based machine learning models. Front. Water 5:1108108. doi: 10.3389/frwa.2023.1108108

3) Van der Wiel, K., Wanders, N., Selten, F. M., & Bierkens, M. F. P. (2019). Added value of large ensemble simulations for assessing extreme river discharge in a 2 °C warmer world. Geophysical Research Letters, 46, 2093– 2102.

How to cite: Hauswirth, S. M., Bierkens, M. F. P., Beijk, V., and Wanders, N.: Exploring Water Management Strategies for Mitigating Local Drought Impacts in the Netherlands using Data-Driven methods previously used for Simulations to Projections, EGU General Assembly 2024, Vienna, Austria, 14–19 Apr 2024, EGU24-1895, https://doi.org/10.5194/egusphere-egu24-1895, 2024.

EGU24-3995 | Posters on site | HS4.6

Assessing the value of seasonal flow forecasts in reservoir operations for drought management in South Korea 

Yongshin Lee, Andres Peñuela, Francesca Pianosi, and Miguel Rico-Ramirez

Given the escalating uncertainty in water resources management attributed to climate change, the significance of reliable flow forecasts becomes increasingly crucial. Recent technological advancements have brought attention to seasonal weather forecasts, which provide predictions of weather variables for the next several months. Accordingly, numerous studies have investigated the skill of Seasonal Flow Forecasts (SFFs) forced by seasonal weather forecasts, in various regions and countries. Our previous work on the skill of SFFs across South Korea demonstrated that SFFs generally outperform Ensemble Streamflow Prediction (ESP) up to 3 months ahead and exhibit notably higher skill during the wet season in abnormally dry years.

This study builds upon our earlier research with the objective of evaluating the value of SFFs for reservoir operations for drought management. This analysis is conducted for two pivotal reservoirs, Soyanggang and Chungju, which serve as the major water sources for the metropolitan area, including the capital city, Seoul. For the severe drought period from July 2014 to June 2016, we used model simulation to compare different reservoir operation models: the Simple Conjunctive Operation (SCO) model, forced by either a worst-case or low inflow scenario (similarly to what currently done in reality) and the Forecast-informed Conjunctive Operation (FCO) model, forced by either ESP or SFFs. Multi-objective evolutionary algorithm is utilised to optimise release scheduling with two objective functions: securing storage volume at the end of the hydrological year and minimizing supply deficit over the entire year. We explore the impact of using different reservoir operation models, different forecasting lead times, as well as different ways to determine a ‘best compromise’ solution between the two competing objectives.

How to cite: Lee, Y., Peñuela, A., Pianosi, F., and Rico-Ramirez, M.: Assessing the value of seasonal flow forecasts in reservoir operations for drought management in South Korea, EGU General Assembly 2024, Vienna, Austria, 14–19 Apr 2024, EGU24-3995, https://doi.org/10.5194/egusphere-egu24-3995, 2024.

The World Meteorological Organization (WMO) approved the Unified Data Policy in 2022, and different groups are working on its implementation under the coordination of the Commission for Observation, Infrastructure and Information Systems  (INFCOM), through the Focus Group on Data Exchange Policy. The WMO Research Board coordinates the actions on data exchange with the research sector through a dedicated Task Team: Task Team on Data Exchange with the Research Sector (TT DERS). The TT DERS’ main activities aim to accomplish section #4 of the WMO Resolution: Members should provide without charge access to all recommended data to public research and education communities for non-commercial activities. They consist of: i. Consultation with research communities dealing with weather, climate, water, cryosphere, and atmospheric composition on data exchange availability; ii. Involvement of research communities to monitor implementation and identify problems/opportunities; iii. Identification of case studies or use cases to be documented as best practice exemplars; iv. Outreach to National Meteorological and Hydrological Services on the benefits of data exchange with the research and academia.

Preliminary analysis revealed that:

  • Reasons for not sharing the data at the national/regional/international level are different from one region/country to another: lack of data, personnel to organise the data basis, or infrastructure to store/pre-process the database, national data sharing policy and regional geopolitical sensitivities;
  • There are big differences in approach for freely sharing the data in neighbouring countries;
  • Access to hydrological data is more critical than weather and climate data;
  • Access to observation data, especially for the old period for which they are not in a digital format, is quite limited.

WMO can support the Member States in exploring the possibility of integrating data from other sources when data are missing, developing the capacity and infrastructure, or providing recommendations to agree the national regulations with the WMO resolution.

In some situations, especially in developing countries, no particular reason for not sharing the data with the research community was identified. Thus, we assumed there was no will to share the data rather than objective limitations in doing it. Under these circumstances, the role of the WMO through the TT DERS and other bodies is to advocate for mutual benefit data sharing and finding those triggering factors (such as receiving funding, improvement of weather and hydrological forecast, better quality of climate/hydrological services) that could change the attitude, to encourage mutual exchanges of data and infrastructure, and make use of strategic communication.

How to cite: Croitoru, A.-E.: Data Exchange with the Research Sector - the World Meteorological Organization Perspective, EGU General Assembly 2024, Vienna, Austria, 14–19 Apr 2024, EGU24-10766, https://doi.org/10.5194/egusphere-egu24-10766, 2024.

EGU24-11504 | Posters on site | HS4.6

Collaborative provision of a national peak flow data service 

Catherine Sefton, Stephen Turner, Amit Kumar, Gayatri Suman, Isabella Tindall, Katie Muchan, Grant Kennedy, Glenda Tudor-Ward, Gary Galbraith, and Jamie Hannaford

High quality and trustworthy data on peak river flows are fundamental for assessing, monitoring, estimating and managing flood events.  In the UK, a national data service provides open access to peak flow data (annual maximum and peaks-over-threshold) with supporting metadata at more than 900 gauging locations.  A collaborative programme of work involves the four main Measurement Authorities (MAs) and the National River Flow Archive (NRFA) which is based at the UK Centre for Ecology & Hydrology (UKCEH).  This partnership and the channelling of peak flow data for the UK through one organisation also promotes sharing of best practice.  Once the data have been generated, they undergo checks by each of the MAs before being sent to UKCEH who undertake a number of complementary automatic and manual quality control checks.  These include the consistency of the data with stage-discharge ratings, the continuity of the digital and pre-digital periods, and the suitability of the data for flood estimation purposes.  Queries that arise during this process are resolved in close collaboration with the MAs.

The data are updated and released annually.  The most recent water year is added to the dataset, and a rolling programme of period-of-record review for a percentage of sites each year captures data reprocessing, newly available data from digitisation and other improvements that have come to light since the initial submission of the data to the central repository.  Following each annual cycle, the data are released in a number of accessible formats, including files which can be loaded directly into the UK’s industry standard Flood Estimation Software (WINFAP), as well as being added to the NRFA website and API.  Each gauging station has a webpage with a wealth of associated metadata and context to aid the community in using the data.

There are however challenges remaining.  These include event independence, concerned with the criteria used to derive peaks-over-threshold data, consolidation of stage-discharge ratings between the MAs and UKCEH, and further digitisation of pre-digital data where physical charts exist.  Running through all of these threads is the quantification of uncertainty in high flow measurement and the challenges in how to communicate this to users.  Initiatives are addressing some of these, but more is needed to ensure that reliable long records are available for reproducible flood estimation and trend analysis.

How to cite: Sefton, C., Turner, S., Kumar, A., Suman, G., Tindall, I., Muchan, K., Kennedy, G., Tudor-Ward, G., Galbraith, G., and Hannaford, J.: Collaborative provision of a national peak flow data service, EGU General Assembly 2024, Vienna, Austria, 14–19 Apr 2024, EGU24-11504, https://doi.org/10.5194/egusphere-egu24-11504, 2024.

EGU24-12157 | Posters on site | HS4.6

SaQC: Empowering Hydrological Data Integrity through Automated Quality Control   

David Schäfer, Peter Lünenschloß, Bert Palm, Lennart Schmidt, Thomas Schnicke, Corinna Rebmann, Karsten Rinke, and Jan Bumberger

Global and regional hydrological databases, as well as domain-agnostic repositories, play a crucial role in advancing scientific research and decision-making processes. With new and existing data infrastructures such as TERENO and eLTER, as well as governmental monitoring initiatives, efforts to enhance the size, capabilities, and accessibility of these services are underway. However, a key challenge persists across large-scale data collections - the need for rigorous harmonization of diverse data from various sources. 

This challenge extends beyond obvious considerations like numerical precision and date formats, encompassing more nuanced aspects such as data quality and its representation. Hydrological time series data, often acquired from remote sensors and monitoring stations, are susceptible to errors arising from sensor malfunctions, anomalies, and environmental fluctuations. Unchecked, these inaccuracies can lead to erroneous results and compromise decision-making processes. 

Addressing this critical issue, the System for Automated Quality Control - SaQC emerges as a pioneering solution, offering a comprehensive tool/framework for automated and customizable quality control and processing of time series data. SaQC empowers researchers and practitioners in the hydrological sciences, providing a convenient and efficient means to identify and rectify data anomalies. In addition to a large body of built-in routines and algorithms, the framework's extensibility allows users to implement custom quality check routines and schemes, tailoring the quality control process to specific research objectives and the evolving needs of data services. 

This presentation delves into the core principles of SaQC, showcasing its flexibility in handling diverse data types and adapting to various hydrological monitoring scenarios. Through real-world examples of fully automatized quality control and data processing workflows, we highlight the benefits of SaQC in enhancing data integrity, reducing manual intervention, and expediting the analysis pipeline. SaQC not only identifies anomalies but also provides a systematic and transparent approach to data quality assurance, contributing to the overall reliability of hydrological datasets. 


Lennart Schmidt, David Schäfer, Juliane Geller, Peter Lünenschloss, Bert Palm, Karsten Rinke, Corinna Rebmann, Michael Rode, Jan Bumberger, System for automated Quality Control (SaQC) to enable traceable and reproducible data streams in environmental science, Environmental Modelling & Software, Volume 169, 2023, 105809, ISSN 1364-8152, https://doi.org/10.1016/j.envsoft.2023.105809. 

How to cite: Schäfer, D., Lünenschloß, P., Palm, B., Schmidt, L., Schnicke, T., Rebmann, C., Rinke, K., and Bumberger, J.: SaQC: Empowering Hydrological Data Integrity through Automated Quality Control  , EGU General Assembly 2024, Vienna, Austria, 14–19 Apr 2024, EGU24-12157, https://doi.org/10.5194/egusphere-egu24-12157, 2024.

EGU24-12675 | ECS | Posters on site | HS4.6

Skilful probabilistic forecasts of UK floods months ahead using a hybrid approach 

Simon Moulds, Louise Slater, Louise Arnal, and Andrew Wood

Streamflow forecasts months ahead are an important component of flood risk management. Hybrid methods that predict seasonal streamflow quantiles using ML/AI models driven by climate model outputs are currently underexplored, yet have some important advantages over traditional approaches based on hydrological models. For example, they are computational efficient, can incorporate a wide variety of input data, and may avoid the need for spatial downscaling and/or bias correction. Here we develop a hybrid subseasonal to seasonal streamflow forecasting system to predict the monthly maximum daily streamflow up to four months ahead. We train a machine learning model on dynamical precipitation and temperature forecasts from a large ensemble from the Copernicus Climate Change Service (C3S). We show that multi-site ML models trained on pooled catchment data together with static catchment attributes are significantly more skilful compared to single-site ML models that are trained on data from each catchment individually. Overall, we find 99.8% of stations show positive skill relative to climatology in the first month after initialization, 90.7% in the second month, 57.9% in the third month and 35% in the fourth month.

How to cite: Moulds, S., Slater, L., Arnal, L., and Wood, A.: Skilful probabilistic forecasts of UK floods months ahead using a hybrid approach, EGU General Assembly 2024, Vienna, Austria, 14–19 Apr 2024, EGU24-12675, https://doi.org/10.5194/egusphere-egu24-12675, 2024.

EGU24-13225 | ECS | Posters on site | HS4.6

Evaluating the Sensitivity of Hydrological Impacts to Different Climate Model Weighting Strategies 

Mehrad Rahimpour Asenjan, Francois Brissette, Jean-Luc Martel, and Richard Arsenault

The use of Multi-model ensembles (MMEs) has become crucial in assessing future climate change impacts and uncertainties. These ensembles leverage simulations from various global climate models (GCMs). While the traditional "model democracy" method, where equal weights are assigned to all models, has succeeded in reproducing the mean state of historical climate, it faces challenges in hydrological impact studies. Two key criticisms prompt the investigation of model democracy: the diverse performance of GCMs across different variables and locations, and the assumption of independence among ensemble members. Shared modules and features in climate models may introduce common biases, affecting confidence in projection uncertainty and potentially increasing uncertainties in climate change predictions. To address these challenges, diverse weighting approaches are explored, assigning varying weights to GCMs based on their performance in diagnostic metrics. While equal weighting is a common approach, unequal-weighting methods aim for a more reliable ensemble mean or constrained uncertainty.

This study assesses five weighting schemes—equal weighting, random weighting, skill-based weighting, the representation of annual cycle (RAC), and Reliability Ensemble Averaging (REA)—in hydrological impact evaluations. We utilized data from A set of 22 CMIP6 GMCs, coupled with a lumped hydrological model, and one bias correction method across 3107 North American catchments during the 1971-2000 and 2071-2100 periods. To understand how weighting methods influence streamflow bias in future periods, we used a "pseudo-reality" method, which involves comparing the bias between the weighted mean of climate models and a selected model used as a reference dataset. Through multiple iterations considering climate variables and geographic regions, this research aims to uncover the complex interactions between weighting schemes and their implications for hydrological assessments.

Our findings indicate that the performance of equal weighting and other weighting methods are similar in cases where bias correction has been applied. Bias correction is commonly used in climate change impact assessments due to the inherent inaccuracies in climate models, and in such cases equal weighting approach would provide adequate results for climate change impact assessment studies. For scenarios without bias correction, applying unequal weights provides improved simulation performance and reliability. The findings of this study contribute valuable insights to the broader landscape of climate change impact studies, emphasizing the importance of tailored weighting strategies in enhancing the reliability of hydrological assessments.

How to cite: Rahimpour Asenjan, M., Brissette, F., Martel, J.-L., and Arsenault, R.: Evaluating the Sensitivity of Hydrological Impacts to Different Climate Model Weighting Strategies, EGU General Assembly 2024, Vienna, Austria, 14–19 Apr 2024, EGU24-13225, https://doi.org/10.5194/egusphere-egu24-13225, 2024.

EGU24-13321 | ECS | Posters on site | HS4.6

Using satellite remote sensing to evaluate and calibrate hydrological monitoring in Norway 

Aron Widforss, Liss Marie Andreassen, Yngve Are Antonsen, Stefan Blumentrath, Niklas Fossli Gjersø, Sjur Anders Kolberg, Karsten Müller, Nils Kristian Orthe, Tuomo Saloranta, Solveig Havstad Winsvold, and Rune Verpe Engeset

The Norwegian Water Resources and Energy Directorate (NVE) is responsible for operating the Varsom forecasting service issuing forecasts covering a number of natural hazards in Norway, including flooding, avalanches and lake ice coverage. Additionally, NVE is monitoring glacier lakes that have a risk for glacier lake outburst floods (GLOFs). This responsibility requires multi-modal data gathering, ranging from permanent hydrological stations and field observers digging snow pits, to analysis of country-wide satellite-borne radar and optical imaging.

In this study we demonstrate how satellite remote sensing allow us to detect hazardous events and monitor hydrological conditions. Our infrastructure utilizes publicly available satellite data from Copernicus. We process the data  through a central platform built on Apache Airflow for job monitoring, GRASS and Actinia for spatial processing and Docker for parallelization. Using this platform we have built a number of products that identifies and digitizes objects, as well as time series analysis of various hydrological data. The platform can output these products to existing public datasets, like the Norwegian national landslide and avalanche database, as well as to purpose-built solutions, like our time-series database, which will make spatially aggregated time series publicly available.

Examples of using satellite data operationally include automated detection of avalanches making it possible to validate the details of a published avalanche bulletin of a high avalanche danger episode in the spring of 2023. Snow coverage monitoring of important watersheds during the same period allowed us to get confidence in the validity of our models and resulting assessment of the risk of melting season floodings.

In addition to use cases where satellite observations give us complementary information, we use the data in areas where there is few or no other available source of information. The best example of this is the monitoring of formation and drainage of glacier lakes, where optical imaging and manual digitizing has been the go-to solution for a long time. We are now developing automated products using Sentinel-1 and Sentinel-2 data to aid mapping and monitoring

The satellite products produced at NVE provide richer information of snow, ice and hydrologic condtitions. Products are being made publicly available.

How to cite: Widforss, A., Andreassen, L. M., Are Antonsen, Y., Blumentrath, S., Fossli Gjersø, N., Kolberg, S. A., Müller, K., Orthe, N. K., Saloranta, T., Havstad Winsvold, S., and Verpe Engeset, R.: Using satellite remote sensing to evaluate and calibrate hydrological monitoring in Norway, EGU General Assembly 2024, Vienna, Austria, 14–19 Apr 2024, EGU24-13321, https://doi.org/10.5194/egusphere-egu24-13321, 2024.

Farmers in irrigated agriculture depend on the water allocated to them through the irrigation season. In drought years, when allocations may be curtailed, early information on water availability is of use to them in supporting their decisions on what to plant and when to plant. Seasonal forecasts provide such early information of water availability, and have been shown to be skilful, though effective lead times depend on the predictability of the local climate as well as the memory of the hydrological system. However, if the information provided is indeed useful, may depend on who uses it, the decisions they take, and the outcomes of those decisions.

Here, we explore seasonal forecasts in supporting decisions farmers take in an area with irrigated agriculture in the Ebro basin in Spain. We develop a simple decision model, considering the preferences farmers have and the crop choices they make depending on if water is expected to be abundant or if it is expected to be scarce. The model also considers the interconnected water allocation decision by operators of the reservoir feeding the irrigation area, and the expectation they have of the balance between supply and demand to the end of season. Demand is informed by the (expected) choices farmers make, while supply is predicted using bias corrected ECMWF System 5 seasonal forecasts and a simple hydrological model.

To understand to whom the forecast is useful, we consider farmers with differing levels of technical capability, which allows them to plant either one or two crops per season; as well as with differing levels of risk averseness. Decisions informed by the seasonal forecasts for each of these farmer types are then compared to those made using perfect information, and to those made using current allocation practice. We then evaluate (relative) benefit through simulating the outcome of the forecast decisions using the observed climate and a crop model to predict yield, and the market price versus investment costs of crops planted to predict net profits.

Results show that seasonal predictions of water availability in the area are skilful, attributed largely to catchment memory, though skill varies; with poorer skill early in the season and around the spring snowmelt. The decision timelines through the season vary per farmer type. Risk averse farmers with less technical capability take key decisions earlier in the season. While forecasts are potentially more useful to those early decisions, we find these are also more sensitive to uncertainty in the forecast. The more technical farmers take decisions late in the season, where skill is higher. They can then rely more on the information provided, though the added value of the forecast to them is lower. These results show that not all are served equally by seasonal forecast information. Some stand to benefit more than others, depending on the decisions they make, and when they take these.

How to cite: Werner, M. and Linés, C.: Seasonal forecasts to support cropping decisions: To whom are these useful, and when?, EGU General Assembly 2024, Vienna, Austria, 14–19 Apr 2024, EGU24-13436, https://doi.org/10.5194/egusphere-egu24-13436, 2024.

The Famine Early Warning Systems Network (FEWS NET) and its partners use timely and spatially focused monitoring products to guide humanitarian assistance and secure livelihoods in some of the world’s most food-insecure populations. Subseasonal predictions bridge the gap between coarse, seasonal climate predictions and finer-scale, medium-range weather forecasts, providing insight for in-season agricultural decision making, including planting dates, labor allocation, and loan and fertilizer investments. In adverse conditions, they can increase the lead-time for necessary intervention (e.g., food or monetary aid); and in favorable conditions can provide opportunities for increased investment and subsequent improved agricultural productivity. Accuracy in forecasting both each scenario can enhance loss mitigation and increase capital, providing opportunities for long-term resilience building and poverty reduction. Collectively, this work aims to improve upon and contribute to early warning systems in semiarid African rainfed agricultural zones for the purpose of improving food security and livelihoods.

Here we report on an ongoing project to assess the efficacy of the NMME Experimental Subseasonal Precipitation Forecasts (SubX) for use in a regional water balance model—the Water Requirement Satisfaction Index (WRSI)in Sub-Saharan Africa. While SubX has been shown to be effective for hydrologic monitoring in India and eastern South America, and for predicting extreme events, including droughts and floods in the US and South Korea, assessments of the accuracy and certainty of SubX is quite limited over Africa. We begin to fill this gap by assessing the viability of SubX for use in WRSI deterministic and probabilistic forecasts in rainfed agricultural areas of east, southern, and west Africa, from 1999-2016. We briefly explore the regional characteristics and inter-model variability in forecast skill.

How to cite: Turner, W., Shukla, S., and Husak, G.: NMME Experimental Subseasonal Precipitation Forecasts (SubX) provide enhanced predictions of end-of-season water balance over Sub-Saharan Africa, EGU General Assembly 2024, Vienna, Austria, 14–19 Apr 2024, EGU24-13863, https://doi.org/10.5194/egusphere-egu24-13863, 2024.

EGU24-14096 | Orals | HS4.6

Extending the Decision-Making Lead time of Municipal Water System Management Using Teleconnections to Support Supply and Demand Estimates 

Steve Burian, Ryan Johnson, Danyal Aziz, Courtenay Strong, Paul Brooks, Margaret Wolf, Logan Jamison, Luke Stone, Laura Briefer, Jesse Stewart, Tracie Kirkham, and Tamara Prue

Western United States municipal water system management requires estimates of system performance with sufficient lead time to identify and mitigate potential vulnerabilities. Given their dependence on winter snowpack and the resulting timing of surface water availability contrasting that of peak water demand, there is a need to deliver earlier estimates of system performance to increase the lead time for decision-making. Addressing this need, we develop a long to short-term water systems operations workflow that provides operators with estimates of performance with up to a ten-month lead time and demonstrate the workflow using the Salt Lake City Department of Public Utilities in Northern Utah, United States. The workflow leverages teleconnections with global climate signals to estimate the precipitation, surface water yield, and demand for up to a ten-month forecast horizon. We use the estimates of supply and demand to drive a water systems model that provides a range of likely reservoir levels, groundwater withdrawal volumes, and volume of out-of-district water needs to determine potential system vulnerabilities needed to evaluate and develop mitigation measures.

How to cite: Burian, S., Johnson, R., Aziz, D., Strong, C., Brooks, P., Wolf, M., Jamison, L., Stone, L., Briefer, L., Stewart, J., Kirkham, T., and Prue, T.: Extending the Decision-Making Lead time of Municipal Water System Management Using Teleconnections to Support Supply and Demand Estimates, EGU General Assembly 2024, Vienna, Austria, 14–19 Apr 2024, EGU24-14096, https://doi.org/10.5194/egusphere-egu24-14096, 2024.

EGU24-14183 | Posters on site | HS4.6

Creating a community testbed to strengthen the research to operations pathway for hydrologic prediction in the US 

Andy Wood, Joshua Sturtevant, Katie Van Werkhoven, Matthew Denno, and Terri Hogue

The US NOAA Cooperative Institute for Research to Operations in Hydrology (CIROH) is a consortium of several dozen US institutions (academic, private, non-profit) that collectively partner with the US National Water Center (NWC) to conduct research to advance operational hydrologic forecasting services.  This presention describes the new CIROH Hydrologic Prediction Testbed (CHPT), a community-oriented initiative to establish rigorous, quantitative intercomparison and benchmarking of US operational hydrologic forecasts, and particularly the multiple elements – models, methods, datasets – involved in producing them.  The Testbed’s overarching goal is to address the problematic lack of coherence of research into fundamental challenges and needs for operational prediction systems, which is a significant impediment to intercomparison, benchmarking, and synergistic learning across diverse investments into forecasting research and development. Hundreds of localized, one-off studies are published, yet few of the resulting potential advances ever become operational. The CHPT promotes a benchmark-oriented paradigm through facilitating the use of multiple community-based experimental protocols with standardized evaluation tools, targeting different forecasting and forecasting sub-component objectives. Examples of forecasting sub-components include the models, model parameterizations (e.g., glacier physics, channel routing), input datasets, and techniques (e.g., data assimilation, post-processing, ensemble methods), across time scales from nowcasting to multi-season prediction. This paradigm is essential to produce a consistent intercomparison and evaluation of innovations arising from distinct forecast-related research projects across the community.  This in turn supports a rational assessment of the potential gains of each innovation against current operational baseline capabilities. As it matures, the CHPT will enable the US to quantify and track the current performance of its hydrologic forecasting capabilities – for the first time – enabling evidence-driven decisions regarding the adoption of new forecast elements into operational practice. The core concepts of CHPT are generalizable to forecasting research and development activities in countries and communities globally.  

How to cite: Wood, A., Sturtevant, J., Van Werkhoven, K., Denno, M., and Hogue, T.: Creating a community testbed to strengthen the research to operations pathway for hydrologic prediction in the US, EGU General Assembly 2024, Vienna, Austria, 14–19 Apr 2024, EGU24-14183, https://doi.org/10.5194/egusphere-egu24-14183, 2024.

EGU24-16043 | Orals | HS4.6 | Highlight

Next Generation Drought Monitoring: Forecasting to Emotion-Focused Coping 

Jonghun Kam, Seunghui Choi, and Anqi Liu

A severe drought causes catastrophic economic losses, resulting in mental degradation/deterioration. While drought monitoring has been focused on detecting and characterizing an emerging drought (physical system-focused), artificial intelligence with big data from social monitoring provides a unique opportunity to investigate sentimental alterations of the public along the drought propagations and explore their triggers (social system-focused). This study examines the potential of an AI technique, Natural Language Processing (NLP), in monitoring sentimental alterations of the public. This study is a case study of the recent Korea drought, leveraging X (formerly, twitter) and Google Trends data. In this study, we evaluate the seasonal-to-seasonal predictability of drought measures in the southwest region of the Korean Peninsula for the 2022/23 period and analyze spatiotemporal changes in media and public interest in drought phenomena during the 2022/23 drought period through newspapers and social media. Initially, to understand the predictability of drought measures in March 2023, we evaluate the predictability of drought measures based on probabilistic and deterministic seasonal-to-seasonal forecasts for the 2022/23 Korea drought. Subsequently, using drought-related articles in newspapers and Twitter data from the 2022 to 2023, we utilize natural language processing and text mining technologies to detect and monitor the topic and emotional alternation of the titles of news article and public, respectively, regarding the 2022/23 drought. The results of this study indicate that the predictability of drought measures in May 2023 is skillful at the sub-seasonal scale but limited at the seasonal scale. Statistical forecasts provide crucial information on precipitation needed for drought recovery through weekly precipitation forecasts, aiding in assessing the drought condition. The public interest in the 2022/23 drought shows spatiotemporal differences based on the drought-affected areas and drought stages. Especially in April 2023, when a severe drought occurred in the southwestern Korean region, an increase in the number of newspaper articles with negative titles was observed, and negative emotions were detected from the social media data. This study provides an insight about the role of AI in developing the next-generation drought monitoring system.  

How to cite: Kam, J., Choi, S., and Liu, A.: Next Generation Drought Monitoring: Forecasting to Emotion-Focused Coping, EGU General Assembly 2024, Vienna, Austria, 14–19 Apr 2024, EGU24-16043, https://doi.org/10.5194/egusphere-egu24-16043, 2024.

EGU24-16596 | Orals | HS4.6

Mapping a Decade of Seasonal Hydrological Forecasting: The UK Hydrological Outlook’s Journey  

Jamie Hannaford and Katie Facer-Childs and the The Hydrological Outlooks Team

The UK Hydrological Outlook provides an insight into future hydrological conditions across the UK, through sub-seasonal to seasonal forecasts of river flows and groundwater levels. The Outlook was initiated during the 2012 drought, which subsequently terminated with severe flooding. That remarkable year saw simultaneous drought restrictions and flood warnings, underlining the pressing need to go beyond situation monitoring (where are we now?) towards seasonal forecasts (what is likely to happen next?). Motivated by these events, the UK Hydrological Outlook was first implemented in 2013 and now celebrates a decade of operational service. This decade has seen notable flood (e.g., 2013 – 2014, 2015 – 2016, 2019 – 2020) and drought episodes (e.g., 2018, 2022), with the Outlook now standing as a valuable source of evidence for users ranging from the news media to government departments. Over these years, it has evolved into a dependable and widely used tool, delivering essential insights to regulators, the water industry, and other stakeholders to inform their water resources management decisions. This collaborative effort, led by UKCEH and involving the Met Office, the British Geological Survey, and the UK Measuring Authorities, has matured into a sophisticated operational system, which includes information on uncertainties and user-friendly interactive visualisation options. This presentation showcases its origins, development, and growth, bringing together multiple research strands converging towards the current operational product. In addition, we include an overview of current and future developments.

How to cite: Hannaford, J. and Facer-Childs, K. and the The Hydrological Outlooks Team: Mapping a Decade of Seasonal Hydrological Forecasting: The UK Hydrological Outlook’s Journey , EGU General Assembly 2024, Vienna, Austria, 14–19 Apr 2024, EGU24-16596, https://doi.org/10.5194/egusphere-egu24-16596, 2024.

Make the invisible visible!
With Groundwater Global Foundation we offer a mobile app with public registration, which can be used by anyone.
Utilizing speaker and microphone, this mobile app turns anyone's smartphone into a groundwater measurement device.
The measurement is based on acoustic resonance and currently works down to thirty meters deep, providing large coverage world-wide.
Hand measurements such as these may be used as a first basis for groundwater management, or may complement fully automatic systems with the occasional calibration.

The mobile app works in internet connected regions, as all recordings are centrally collected in a single database in the cloud.
Recordings are analysed on a webserver, after which the groundwater depth is returned to the mobile app.
One unique aspect that this system has to offer is that it allows for citizens and water professionals to operate jointly.
Respecting privacy, citizens' measurements are private by default.
However, citizens can choose explicitly to unlock their locations, making them publicly visible and thereby turning themselves into citizen scientists.

Datasets are available for download from the database API (csv, xlsx, json) in a few different ways.
The system works with open data in the sense that everyone can download their own measurements.
Water professionals, including academic professionals, can download their own measurements from the API by project(s).
Interestingly, we provide the option that water professionals can download citizen science data by region, where they simply have to provide us with a shapefile for the region/area of interest.

https://groundwater.global/
https://app.groundwater.global/

How to cite: Diederen, D.: The Groundwater Global App - global groundwater measurements with the smartphone, EGU General Assembly 2024, Vienna, Austria, 14–19 Apr 2024, EGU24-17382, https://doi.org/10.5194/egusphere-egu24-17382, 2024.

EGU24-19293 | Orals | HS4.6

A Federated Data Fabric to Enhance Disaster Resilience for Extreme Weather Events  

Julia Kraatz, Katharina Demmich, Johannes Schnell, Benedikt Gräler, Stefano Bagli, and Paolo Mazzoli

Climate change is a pressing issue that affects countries and communities around the world. As global temperatures change intermittently, so do the occurrences and intensities of extreme weather events: which creates compounding, and sometimes simultaneous, instances of disasters. Thus, it is evident there is an urgent need for improved paradigms within the Disaster Risk Management (DRM) and climate change adaptation (CCA) domains, to promote better risk assessment, governance, communication, and systems which prevent, and respond, to disaster events. The DIRECTED project aims to facilitate disaster resilience among European societies, by creating a cohesive approach to Disaster Risk Reduction (DRR) and CCA strategies, and by promoting multi-risk thinking in relation to compounding events. The project will achieve this through integrated models, interoperable data, governance, cross-communication between actors, and the central platform, the Data Fabric. 

This presentation provides an overview of the technical requirements and analyses which will provide the foundation for the DIRECTED Data Fabric; the Data Fabric will serve as a federated spatial information system, capable of integrating diverse data sources and executing flood and risk modeling across institutions. The Data Fabric requires collaboration within the entire DIRECTED consortium, which will ensure interoperability, useability, and longevity of the platform. Technical requirements have been discussed with data providers and modelers to establish infrastructure which is capable of  visualizing flood and risk model outputs, as well as readily available climate data. Datasets involved range from custom file-based datasets to Spatial Data Infrastructures with Open API-based data access. Additionally, data mining activities have been carried out to produce flood forecasts based on a re-analysis of publicly available data from Copernicus: this has been done by accessing archives and calculating pixel-wise statistics, to spatially quantify upcoming forecasts and their potential severity. Significant challenges which have emerged include semantic interoperability, which encompasses aspects from data input and model parameterization, to the interpretation of model outputs. This presentation details how these challenges are addressed in DIRECTED, to create a cohesive and user-friendly spatial information system.

Based on an in depth requirement analysis of the RWLs, we will develop preliminary visualizations of climate services, which in turn will be hosted in the cloud-based Data Fabric. The co-creation and co-design approach thereby ensures end-users’ understanding of information in the platform, and the useability of the platform as a whole. 

Since a plethora of extreme weather patterns exist within the scope of DIRECTED (including, but not limited to: pluvial and fluvial flooding, droughts, wildfires, and erosion), the Data Fabric represents a significant step towards establishing a robust and adaptable spatial information system, capable of meeting evolving climate needs for geographically diverse stakeholders. 

How to cite: Kraatz, J., Demmich, K., Schnell, J., Gräler, B., Bagli, S., and Mazzoli, P.: A Federated Data Fabric to Enhance Disaster Resilience for Extreme Weather Events , EGU General Assembly 2024, Vienna, Austria, 14–19 Apr 2024, EGU24-19293, https://doi.org/10.5194/egusphere-egu24-19293, 2024.

EGU24-19945 | Orals | HS4.6

WATER4CAST- integrated Forecasting System for Water and the Environment 

Manuel Pulido-Velazquez, Dariana Avila-Velasquez, Hector Macian-Sorribes, Juan Manuel Carricondo-Anton, Carlos Antonio Echeverria, Felix Frances, Alberto Garcia-Prats, Francisco Martinez-Capel, Marta Garcia-Molla, Miguel Angel Jimenez-Bello, Fernando Martinez-Alzamora, Ivan Gerardo Lagos-Castro, and Juan Manzano-Juarez

Forecast-informed decision-making has been proven to improve water management. However, the practical implementation of such systems need to account for a wide range of processes and variables with the proper spatiotemporal resolution at the regional and local levels (meteorological, hydrological, agronomic, reservoir management and ecosystems). Furthermore, forecasts need to cover all the relevant temporal scales, from short-term to subseasonal to seasonal, to ensure an integrated approach including from quick emergency responses to strategic operational decisions.

In this regard, the project "Integrated Water and Environmental Forecasting System (WATER4CAST)" develops an innovative visual decision support system (VDSS) to enable forecast-informed decision-making in the Jucar River Basin (Spain) covering the above processes (https://water4cast-app.upv.es/). The VDSS offers short-term (15 days), subseasonal (8 weeks) and seasonal (6-7 months) forecasts. It includes meteorological (temperature, precipitation, solar radiation, wind), hydrological (streamflow, soil moisture, reservoir inflows), agronomic (potential evapotranspiration, irrigation needs), environmental (habitat for native fish species) and water resource management variables (stored volumes, reservoir releases) and indicators (drought and fire risk). Short-term meteorological forecasts come from the NOAA GFS, while subseasonal predictions are obtained from the NOAA CFS. On the contrary, a multi-model approach is adopted to acknowledge uncertainty in seasonal forecasts, employing predictions from the Copernicus Climate Change Service (C3S). All raw forecasts are post-processed to correct biases, ensuring their fit to the local climatic patterns of the Jucar River Basin using artificial intelligence (fuzzy logic). Hydrological forecasts are provided by the fully-distributed eco-hydrological model TETIS, properly calibrated and validated for the Jucar. Agronomic forecasts rely on FAO56 agronomic models are tailored to the irrigated areas of the Jucar with the support of remote sensing. Ecosystem forecasts employ fish habitat models that relate streamflows to suitable habitat of native species. Finally, reservoir operation forecasts are provided by a water resource management model whose operating rules are defined using fuzzy rule-based systems.

The VDSS consists of two parts: a public part and a private part available to specific users on request for selected variables considered sensible. The VDSS was co-developed with the users of stakeholders of the Jucar River Basin to ensure they account for their needs.

Acknowledgement: This work has been carried out with funding from the project “INtegrated FORecasting System for Water and the Environment (WATER4CAST)”, funded by the Program for the promotion of scientific research, technological development and innovation in the Valencian Community for research groups of excellence, PROMETEO 2021 (ref: PROMETEO/2021/074), from the Ministry of Innovation, Universities, Science and Digital Society. Generalitat Valenciana. Recognition of the University Teacher Training (FPU) grant from the Ministry of Universities (FPU20/0749). 

How to cite: Pulido-Velazquez, M., Avila-Velasquez, D., Macian-Sorribes, H., Carricondo-Anton, J. M., Echeverria, C. A., Frances, F., Garcia-Prats, A., Martinez-Capel, F., Garcia-Molla, M., Jimenez-Bello, M. A., Martinez-Alzamora, F., Lagos-Castro, I. G., and Manzano-Juarez, J.: WATER4CAST- integrated Forecasting System for Water and the Environment, EGU General Assembly 2024, Vienna, Austria, 14–19 Apr 2024, EGU24-19945, https://doi.org/10.5194/egusphere-egu24-19945, 2024.

EGU24-21922 | ECS | Posters on site | HS4.6

Overview of the gridded daily and monthly precipitation data sets provided by the Global Precipitation Climatology Centre (GPCC) 

Zora Leoni Schirmeister, Markus Ziese, Elke Rustemeier, Peter Finger, Astrid Heller, Raphaele Schulze, Magdalena Zepperitz, Siegfried Fränkling, Bruno Heller, and Jan Nicolas Breidenbach

Since its founding in 1989, the Global Precipitation Climatology Centre (GPCC) has been producing global precipitation analyses based on land surface in-situ measurements. This year the GPCC marks its 35th anniversary. During these years the precipitation database has been continuously expanded and includes a high station density and large temporal coverage. Due to the semi-automatic quality control routinely performed on the incoming station data, the GPCC database has a very high quality. Today, the GPCC holds data from more than 126,000 stations, about three quarters of them having long time series.

The core of the analyses is formed by data from the global meteorological and hydrological services, which provided their records to the GPCC, as well as national meteorological and hydrological services from all over the world. In addition, the GPCC receives SYNOP and CLIMAT reports via the WMO-GTS. These form a supplement for the high quality precipitation analyses and the basis for the near real-time evaluations.

Quality control activities include cross-referencing stations from different sources, flagging of data errors, and correcting temporally or spatially offset data. This data then forms the basis for the following interpolation and product generation.

In near real time, the 'First Guess Monthly', 'First Guess Daily', 'Monitoring Product', ‘Provisional Daily Precipitation Analysis’ and the 'GPCC Drought Index' are generated. These are based on WMO-GTS data and monthly data generated by the CPC (NOAA).

With a 2-3 year update cycle, the high quality data products are generated with intensive quality control and built on the entire GPCC data base. These non-real time products consist of the 'Full Data Monthly', 'Full Data Daily', 'Climatology', and 'HOMPRA-Europe' and are now available in the 2022 version.

All gridded datasets presented in this paper are freely available in netcdf format on the GPCC website https://gpcc.dwd.de and referenced by a digital object identifier (DOI). The site also provides an overview of all datasets, as well as a detailed description and further references for each dataset.

How to cite: Schirmeister, Z. L., Ziese, M., Rustemeier, E., Finger, P., Heller, A., Schulze, R., Zepperitz, M., Fränkling, S., Heller, B., and Breidenbach, J. N.: Overview of the gridded daily and monthly precipitation data sets provided by the Global Precipitation Climatology Centre (GPCC), EGU General Assembly 2024, Vienna, Austria, 14–19 Apr 2024, EGU24-21922, https://doi.org/10.5194/egusphere-egu24-21922, 2024.

In this study we refer how hydrological observation systems impact not only hydrological applications but also numerical weather prediction and climate re-analysis. The terrestrial water cycle, vital to the Earth system, intricately links with the atmosphere, biosphere, and human activities. Climate change intensifies water storage and flux changes, escalating the frequency and severity of water-related disasters. Water-related deaths have doubled in the last decade, with projections indicating a continued rise. Hydrological observations, unlike atmospheric weather data, lack systematic exchange of measurement. Existing datasets, mainly annual yearbook data, lack timeliness for operational numerical weather prediction and are only rarely accompanied by near real time data or satellite observations.

The WMO Task team EarthHydNet explores extending the Global Basic Observing Network (GBON) to incorporate hydrological observations, enhancing surface-based data for weather forecasts. The workshop addresses bridging observational gaps for Numerical Weather Prediction (NWP) and Climate Reanalysis, focusing on user requirements and data standardization. The study will focus on two aspects:

  • The status of the global terrestrial water observation architecture will be presented, showcasing the capacities and limitations of systematic observations, both in situ and via satellite remote sensing products.
  • Three hydrological observations—precipitation, snow, and soil moisture—have been identified as key to improving NWP in previous workshops. Soil moisture is directly influenced by rainfall patterns and vegetation systems, and it influences in turn both rainfall regimes and vegetation development. Unfortunately, soil moisture observations, coordinated under the International Soil Moisture Network (ISMN), are currently sparse in space and time, limiting climate change applications and NWP. Yet in situ observations are crucial because satellite products only provide information about the top few centimetres of the soil, and their capabilities are limited by dense vegetation.

The GBON expansion to terrestrial hydrological variables aligns with the WMO Earth System Approach, aiming to understand the planet as a whole system where atmospheric, oceanic, and terrestrial components are interconnected.

How to cite: Dietrich, S., Zink, M., and Dorigo, W.: Connecting different roles of globally systematic ground-based hydrological observations for Numerical Weather Prediction and Climate Reanalysis, EGU General Assembly 2024, Vienna, Austria, 14–19 Apr 2024, EGU24-21980, https://doi.org/10.5194/egusphere-egu24-21980, 2024.

EGU24-121 | ECS | Posters on site | HS4.8

A process-data duality driven hybrid model for improving flood forecasting 

Chengjing Xu, Ping-an Zhong, Feilin Zhu, Bin Xu, Yiwen Wang, Luhua Yang, Sen Wang, and Sunyu Xu

Floods are the most destructive events among natural disasters that restrict national economic development and threaten the safety of human lives. Accurate and efficient flood forecasting plays an important role in flood warning, flood risk analysis, and reservoir operation. Traditional flood forecasting tools provide fixed-value predictions. However, due to the complexity of reality and the limitations of human cognition, many inherent uncertainties are inevitably ignored. Therefore, it is of great significance to improve the existing hydrological forecasting models based on the full consideration of the uncertainty information input and migration transformation law. Probabilistic flood forecasting breaks through the conventional thinking of "single point, single value", and provides the probability distribution function of the forecast target variable.

Process-driven hydrological models (HMs) are limited to simplified hydrological processes and have difficulty dealing with complex non-linear relationships between environmental variables and runoff. Data-driven models (DDMs) are good at capturing complex nonlinear relationships, but are overly dependent on data and lack consideration of physical mechanisms. Therefore, a hybrid model for probabilistic flood forecasting that couples the process-driven HM and DDM is proposed. HM can transfer the physical process information of observed runoff to the DDM, while DDM can extract additional nonlinear information not captured by HM, thus giving full scope to their respective advantages.

The hybrid model treats the DDM as a residual model, that is, it corrects the residuals produced by the HM simulation, and the corrected values are added to the original hydrological simulation results to obtain the final runoff predictions. In order to quantify the uncertainty information in the forecasting process, the uncertainty in the HM parameters is used as the source of error, and the resulting input, parameter, and structural uncertainties in the DDM are investigated to construct a hybrid modelling framework that takes into account multiple sources of uncertainty. In addition to deterministic forecasts, this framework simultaneously provides interval forecasts and probabilistic forecasts for quantitative uncertainty assessment, which can provide more abundant and complete risk information for subsequent flood warning and reservoir operation.

How to cite: Xu, C., Zhong, P., Zhu, F., Xu, B., Wang, Y., Yang, L., Wang, S., and Xu, S.: A process-data duality driven hybrid model for improving flood forecasting, EGU General Assembly 2024, Vienna, Austria, 14–19 Apr 2024, EGU24-121, https://doi.org/10.5194/egusphere-egu24-121, 2024.

EGU24-315 | ECS | Orals | HS4.8

A novel two-stage multi-step dynamic error correction model for improving streamflow forecast accuracy 

Abhinanda Roy, Kasiapillai S Kasiviswanathan, and Sandhya Patidar

The occurrences of floods in the recent past have significantly increased due to climate change and anthropogenic activities. Hence, reliable streamflow forecasts are crucial for minimizing the detrimental effects of flooding. However, forecast accuracy deteriorates besides elevated uncertainty when the lead time increases. Therefore, streamflow forecast should have improved accuracy with simultaneous uncertainty quantification to increase the model confidence for effective decision-making. The study proposes a novel two-stage multi-step dynamic error correction model to forecast up to 7 days ahead of streamflow, with the objective of no significant deterioration in accuracy. The framework is developed by integrating the process-based hydrological HBV model with the Bayesian-based Particle filter (PF) and machine learning-based Random Forest algorithm (RF). This facilitates combining the advantages of each model, i.e., process understanding ability of the HBV model, robust uncertainty quantifying ability of the PF technique, and relatively superior predictive ability of the RF algorithm. The model performance is quantified through several statistical performance error measures and uncertainty indices, with graphical performance indicators. The framework tested on the Beas and Sunkoshi river basins of India and Nepal exemplified the NSE of 0.94 and 0.98 in calibration and 0.95 and 0.99 in validation respectively for the 7-day ahead streamflow forecast. Hence, the proposed dynamic modeling framework can be considered as a potential tool to forecast streamflow without significant deterioration in the model accuracy even at increased lead times.  

How to cite: Roy, A., Kasiviswanathan, K. S., and Patidar, S.: A novel two-stage multi-step dynamic error correction model for improving streamflow forecast accuracy, EGU General Assembly 2024, Vienna, Austria, 14–19 Apr 2024, EGU24-315, https://doi.org/10.5194/egusphere-egu24-315, 2024.

EGU24-3187 | Orals | HS4.8

Real-time flood and water level forecasting using AI-based models for early warning and disaster risk reduction 

Stefano Bagli, Paolo Mazzoli, Koen van der Brink, valerio luzzi, and mario papa

The increasing frequency and intensity of floods pose a significant threat to lives, property, and infrastructure. Real-time flood forecasting is crucial for early warning systems and disaster risk reduction. However, traditional forecasting methods often have limitations in terms of accuracy and timeliness.

This paper, developed under the framework of AI4Copernicus 5th Calls project, presents a data-driven approach for real-time flood and water level forecasting using AI and machine learning algorithms. The proposed system is based on a hybrid model that combines multiple machine learning algorithms, including DLinear/NLinear, LSTM Hindsight Modelling, and FLEX. The system is trained on historical data on hydrological and meteorological features, and is able to predict water levels at river gauging stations up to the next 9 hours.

The system has been tested on data from the Lamone River in Italy, and has been shown to achieve a mean-absolute-error of only a few (<5) centimetres. This is a very low error margin for this kind of river, and is comparable to or better than the performance of other alternative forecast approaches.

The system has been integrated into GECOSistema's Flood Risk Intelligence platform, named SaferPlaces (www.saferplaces.co). This platform provides a user-friendly interface for accessing flood risk information, and includes features such as real-time flood maps, early warning alerts, and detailed flood risk assessments.

The proposed system has the potential to be a valuable tool for flood forecasting and disaster risk reduction. It can be used to support decision-making at both the local and regional levels, and can help to save lives and property.

How to cite: Bagli, S., Mazzoli, P., van der Brink, K., luzzi, V., and papa, M.: Real-time flood and water level forecasting using AI-based models for early warning and disaster risk reduction, EGU General Assembly 2024, Vienna, Austria, 14–19 Apr 2024, EGU24-3187, https://doi.org/10.5194/egusphere-egu24-3187, 2024.

EGU24-3280 | ECS | Orals | HS4.8

An open online simulation strategy for hydrological ensemble forecasting 

Yuanqing He and Min Chen

Hydrological ensemble forecasting is crucial for regional or urban flood forecasting. The development of real-time hydrological ensemble forecasting methods and early warning systems that produce accurate and timely forecasts and flood warnings is of paramount importance for effective disaster risk reduction and the mitigation of loss of life.

However, the majority of current hydrological ensemble forecasting systems are centralized, requiring researchers to collect data, download executable programs for models and related methods, and configure the runtime environment on local computers based on specific scenarios (e.g., simulation and forecasting of a specific city or watershed). This method is extremely time-consuming and labour-intensive, and there is a high level of coupling between modelling resources such as data, models (or methods), and parameters. When researchers simulate other scenarios, the models used in certain hydrological processes may not be applicable to the new environment due to changes in the natural environment, and new models may need to be implemented (for instance, the models for runoff yield under saturated storage and runoff yield under excess infiltration conditions are distinctly different). Substantial amounts of time and effort must be invested in recollecting and deploying forecasting resources in local computer, which leads to repetitive labour. This involves downloading models, configuring the operating environment for each ensemble forecasting process, collecting pertinent data, compiling data and model adaptation methods, designing optimization schemes and evaluating the model based on results.

Therefore, to change the current complicated download and installation usage patterns associated with hydrological ensemble forecasting and to facilitate the seamless replacement and integration of various hydrological process model components, we propose an open online simulation strategy. This strategy utilizes a service-oriented web architecture to support the online sharing, invocation, integration, and optimization of simulation resources at the three perspectives: model, input data, and model parameters. Specifically, we explore (1) a service-oriented hydrological ensemble forecasting model sharing method and a document-based model service integration and management method, (2) a hydrological ensemble forecasting data sharing and Python-based data adaptation method, and (3) an online optimization and recommendation method for model parameters. By applying the strategy proposed in this paper to hydrological ensemble forecasting, it is possible to reduce the cost of using models, encourage the sharing of hydrological resources and the exchange of knowledge, and ultimately improve the accuracy of flood forecasting.

How to cite: He, Y. and Chen, M.: An open online simulation strategy for hydrological ensemble forecasting, EGU General Assembly 2024, Vienna, Austria, 14–19 Apr 2024, EGU24-3280, https://doi.org/10.5194/egusphere-egu24-3280, 2024.

One of the important non-engineering measures for flood forecasting and disaster reduction in watersheds is the application of machine learning flood prediction models, with Long Short-Term Memory (LSTM) being one of the most representative time series prediction models. However, the LSTM model has issues of underestimating peak flows and poor robustness in flood forecasting applications. Therefore, based on a thorough analysis of complex underlying surface attributes, this study proposes a framework for distinguishing runoff models and integrates a Grid-based Runoff Generation Model (GRGM). Additionally, a GRGM-K-LSTM hybrid flood forecasting model is constructed by coupling the flood process line vectorization method and LSTM. Taking the Jialu River in the Zhongmu station control basin as an example, the model is validated using 18 instances of measured floods and compared with the LSTM and GRGM-LSTM models. The study shows that the GRGM model has a relative error and average coefficient of determination for simulating runoff of 8.41% and 0.976, respectively, indicating that considering the spatial distribution of runoff patterns leads to more accurate runoff calculations. Under the same lead time conditions, the GRGM-K-LSTM hybrid forecasting model has a Nash efficiency coefficient greater than 0.9, demonstrating better simulation performance compared to the GRGM-LSTM and LSTM models. As the lead time increases, the GRGM-K-LSTM model provides more accurate peak flow predictions and exhibits better robustness. The research findings can provide scientific basis for coordinated management of flood control and disaster reduction in watersheds.

How to cite: Chengshuai, L. and Caihong, H.: Research on Machine Learning Hybrid Framework for Flood Forecasting by Integrating Physical Processes of Runoff Generation and Vectorized Flood Processes, EGU General Assembly 2024, Vienna, Austria, 14–19 Apr 2024, EGU24-3344, https://doi.org/10.5194/egusphere-egu24-3344, 2024.

EGU24-3900 | Posters on site | HS4.8

Adaptation of the SWIM hydrological model for forecasting the flow of the Zhabay River during floods/floods. 

Aliya Nurbatsina, Aisulu Tursunova, Kanay Makpal, Zhanat Salavatova, and Iulii Didovets

This study examines climate and hydrology changes in the Zhabay River basin in Kazakhstan and their impact on potential floods in the city of Atbasar. There has been a sustained increase in air temperature in the region since 2000. Significant events, such as the severe flood in 2014 and destructive waves in 2017, have posed a threat to the lives of Atbasar residents.

Utilizing hydraulic modeling with HEC-RAS, researchers determined an extreme hazard level in the eastern part of the city and a high level in the south. Climate change forecasts for 2030 and 2040 indicate further temperature and precipitation increases in the Zhabay River basin, potentially leading to intensified snowmelt and increased precipitation.

The hydrological model SWIM was modified to adapt to the conditions of the plains rivers in Kazakhstan. The study evaluated the model's potential for short-term operational hydrological forecasting. Results demonstrated the effective reproduction of flow dynamics by the SWIM model, aligning with actual observations. SWIM proved promising for operational forecasting of water regimes in Kazakhstan's plains rivers. The article also provides an assessment of short-term hydrological forecasts using the SWIM model, showing high accuracy during flood periods, making it valuable for operational forecasting of water discharge and volume.

This research is intended for decision-makers in water resource management under changing climate conditions. The findings are also useful for water supply and emergency services to take measures for population protection and infrastructure development.

How to cite: Nurbatsina, A., Tursunova, A., Makpal, K., Salavatova, Z., and Didovets, I.: Adaptation of the SWIM hydrological model for forecasting the flow of the Zhabay River during floods/floods., EGU General Assembly 2024, Vienna, Austria, 14–19 Apr 2024, EGU24-3900, https://doi.org/10.5194/egusphere-egu24-3900, 2024.

EGU24-4435 | Orals | HS4.8

AI Increases Global Access to Reliable Flood Forecasts 

Grey Nearing, Deborah Cohen, Vusumuzi Dube, Martin Gauch, Oren Gilon, Shaun Harrigan, Avinatan Hassidim, Daniel Klotz, Frederik Kratzert, Asher Metzger, Sella Nevo, Florian Pappenberger, Christel Prudhomme, Guy Shalev, Shlomo Shenzis, Tadele Tekalign, Dana Weitzner, and Yossi Matias

Floods are one of the most common  natural disasters, with a disproportionate impact in developing countries that often lack dense streamflow gauge networks. Accurate and timely warnings are critical for mitigating flood risks, but hydrological simulation models typically must be calibrated to long data records in each watershed. Here we show that AI-based forecasting achieves reliability in predicting extreme riverine events in ungauged watersheds at up to a 5-day lead time that is similar to or better than the reliability of nowcasts (0-day lead time) from a current state of the art global modeling system (the Copernicus Emergency Management Service Global Flood Awareness System). Additionally, we achieve accuracies over 5-year return period events that are similar to or better than current accuracies over 1-year return period events. This means that AI can provide flood warnings earlier and over larger and more impactful events in ungauged basins. The model developed in this paper was incorporated into an operational early warning system that produces publicly available (free and open) forecasts in real time in over 80 countries. This work highlights a need for increasing the availability of hydrological data to continue to improve global access to reliable flood warnings.

Nearing, Grey, et al. "AI Increases Global Access to Reliable Flood Forecasts." arXiv preprint arXiv:2307.16104 (2023).

How to cite: Nearing, G., Cohen, D., Dube, V., Gauch, M., Gilon, O., Harrigan, S., Hassidim, A., Klotz, D., Kratzert, F., Metzger, A., Nevo, S., Pappenberger, F., Prudhomme, C., Shalev, G., Shenzis, S., Tekalign, T., Weitzner, D., and Matias, Y.: AI Increases Global Access to Reliable Flood Forecasts, EGU General Assembly 2024, Vienna, Austria, 14–19 Apr 2024, EGU24-4435, https://doi.org/10.5194/egusphere-egu24-4435, 2024.

EGU24-4939 | Posters on site | HS4.8

A Study on Correction Technique for Temporal Rainfall Distribution of Numerical Weather Prediction 

Seokhwan Hwang, Jungsoo Yoon, and Narae Kang

In small basins such as upstream basins, sub-basins, or drainage basins, the arrival time is usually less than 1 hour, so it is very difficult to secure the advance time necessary for response through flood forecasting. Therefore, the use of precipitation forecasts is very important for flood forecasting in such small-scale areas. However, because predicted precipitation involves spatial and temporal uncertainty, quantitative spatial and temporal errors occur between observed and predicted flood amounts in predicted floods. If the quantitative error is small, advance flood forecasting is possible using predicted precipitation, but if the error is large, it can greatly reduce the reliability of the flood forecast. In the case of Numerical Weather Prediction (NWP), the temporal resolution is usually more than several hours and the spatial resolution is more than a dozen kilometers. Therefore, there are limits to reproducing precipitation that occurs quickly locally. In other words, the peak of heavy rain concentrated over a short period of time is often predicted to be flat compared to observations. Recently, localized heavy rainfall has been increasing, but the problem of spatial and temporal resolution is making it difficult to properly predict peak inflow for river or basin flood management. Therefore, in this study, we developed a technology to correct the peak of precipitation in digital meteorological predictions using Korea's representative time distribution. As a result of correcting the daily forecast rainfall for the 2022 Typhoon Hinnamno attack, the accuracy was found to improve from 68% of the actual rainfall before correction to 85% due to improvement in the peak.


Acknowledgments

This research was supported by a grant(2022-MOIS61-002(RS-2022-ND634021)) of Development Risk Prediction Technology of Storm and Flood for Climate Change based on Artificial Intelligence funded by Ministry of Interior and Safety(MOIS, Korea).


How to cite: Hwang, S., Yoon, J., and Kang, N.: A Study on Correction Technique for Temporal Rainfall Distribution of Numerical Weather Prediction, EGU General Assembly 2024, Vienna, Austria, 14–19 Apr 2024, EGU24-4939, https://doi.org/10.5194/egusphere-egu24-4939, 2024.

This study introduces a methodology for enhancing early-warning systems (EWS) for climate variables such as temperature, humidity, and precipitation. These systems are crucial for predicting hydrological extremes, including heat waves and floods. Traditional forecasting methods face challenges due to the complex nature of climate systems, limitations of global circulation models, and computational demands, often resulting in predictions with coarse spatial and temporal resolutions.

Our approach integrates advanced Machine Learning (ML) models with comprehensive data collection for global climate forecasting and regional downscaling. The methodology centers on the use of the ERA5 reanalysis dataset from the European Center for Medium-Range Weather Forecasts (ECMWF) and the CMCC dataset, which provides high-resolution climate data.

The core of our global forecasting relies on FourCastNet, a cutting-edge deep learning model developed by NVIDIA. Utilizing Fourier Neural Networks, FourCastNet excels in generating high-resolution global climate forecasts quickly and accurately. It offers a lead time of up to 96 hours for various atmospheric variables, with a specific focus on precipitation forecasts up to 36 hours ahead. This model’s ability to handle complex climate patterns makes it ideal for initial global forecasting.

For regional downscaling, we employ Stacked Super-Resolution Convolutional Neural Network (SRCNN) and Super-Resolution Generative Adversarial Network (SRGAN) models, which are trained on the CMCC dataset. This dataset contains dynamically downscaled ERA5 reanalysis and has a 2.2 km spatial resolution and a 6-hourly temporal resolution, matching the temporal resolution of FourCastNet outputs. This compatibility enables seamless linking of global and regional forecasts. The downscaling aims to increase spatial resolution by eight times, providing detailed local climatic insights.

All computational models and simulations are conducted on the Google Cloud platform. This platform provides the necessary computational resources, including GPUs, to handle the large-scale processing of climate datasets and the execution of complex ML models efficiently.

In summary, this methodology combines advanced ML models and detailed data collection from both ERA5 and CMCC datasets for both global forecasting and regional downscaling. This integrated approach aims to deliver accurate, high-resolution predictions of climate variables, significantly enhancing the capabilities of early-warning systems. The selection of suitable high-resolution datasets for training downscaling models is a key step, ensuring the generation of detailed regional forecasts.

How to cite: Shafei, A. and Cioffi, F.: Designing an Early-Warning System to Forecast Extreme Climate Conditions Using Data-Driven Approaches with Machine-Learning and Deep-Learning Methods, EGU General Assembly 2024, Vienna, Austria, 14–19 Apr 2024, EGU24-5526, https://doi.org/10.5194/egusphere-egu24-5526, 2024.

EGU24-6473 | ECS | Posters on site | HS4.8

A coupled hydrological-hydraulic modeling framework for flood scenarios mapping and prediction: the case study of Basento river (Southern Italy) 

Carmine Limongi, Raffaele Albano, Leonardo Mancusi, Silvano Dal Sasso, and Aurelia Sole

A robust flood modeling framework is essential for managing flood risk under global and climate change. This is also consistent with the requirements dictated by the recent European legislation on flood risk protection of the territory (Floods Directive 2007/60/EC).

Flood hazard hydrodynamic variables (water depth, flow velocity, flood extent evolution) can be computed using numerical flood models, which represent a well-established approach for flood risk analysis. At one hand, in recent years, hydrological/hydrodynamic modelling of flood events has seen exponential improvements, thanks to the development of increasingly reliable and efficient numerical methods, the increased computing power and innovative geomatic techniques. On the other hand, this kind of models often include substantial uncertainties such as input data, mathematical structure of the model, hydrologic response mechanisms, calibration strategies, contributing to discrepancies between observed and simulated data. 

The aim of the research, realized in the framework of the ODESSA (On DEmand Services for Smart Agriculture) project (financed by the European Regional Development Fund Operational Programme 2014-2020 of Basilicata Region), is to implement an operational framework on the Basento basin in Basilicata (Southern Italy) that is based on the cascade use of a physically-based and lumped hydrological model AD2 (Fiorentino & Manfreda, 1999), for the estimation of flood hydrographs and a two-dimensional hydraulic model FLORA2D (Cantisani et al., 2014), for the evaluation of the hydraulic characteristics during a flood event.

The calibration methodology of the hydrological model exploits the use of physical information in order to reduce the initial range of the parameters set and an automated optimization procedure, based on genetic algorithm (GA), for searching the set of optimal parameters by comparing the data observed in situ during the December 2013 historical event. A set of flooded maps during the 2013 historical events extracted from diverse multitemporal SAR images has been used for the purpose of calibration of the hydraulic model. Moreover, a validation of the hydrological and hydraulic models has been performed on the March 2011 event in order to verify the adaptation of the values of the model parameters, selected during the calibration phase, in an additional scenario. 

The results show the reliability of the models in both calibration and validation phases, i.e. the hydrological model reach a Nash-Sutcliff efficiency coefficient from 9.86 to 0.91 and the hydraulic model, using a confusion matrix (Scarpino et al. 2018), shows, in all cases, an accuracy around 70%. Considering the significance of the outcomes, the cascade models have been used to simulate future event scenarios for given return times but also for short-time flood forecasting.

Reference

  • Fiorentino & Manfreda, (1999). La Stima dei Volumi di Piena dell' Adige a Trento con riferimento al rischio di Inondazione", ISBN 88-7740-382-9, Ed. Bios, Vol.2, p.115-122.
  • Cantisani et al., (2014). FLORA-2D: un nuovo modello per simulare l'inondazione in aree coperte da vegetazione flessibile e rigida. Int J Eng, Innov, Techno,l 3(8):179–186
  • Scarpino et al.,(2018). Dati SAR multitemporali e valutazione della dinamica dello scenario di inondazione del modello idrodinamico 2D, ISPRS Int. J. Geo-Inf., 7(3), 105

How to cite: Limongi, C., Albano, R., Mancusi, L., Dal Sasso, S., and Sole, A.: A coupled hydrological-hydraulic modeling framework for flood scenarios mapping and prediction: the case study of Basento river (Southern Italy), EGU General Assembly 2024, Vienna, Austria, 14–19 Apr 2024, EGU24-6473, https://doi.org/10.5194/egusphere-egu24-6473, 2024.

EGU24-7047 | ECS | Orals | HS4.8

A new framework for water quality forecasting coupling causal inference, time-frequency analysis and uncertainty quantification 

Chi Zhang, Xizhi Nong, Kourosh Behzadian, Luiza Campos, and Dongguo Shao

Accurate forecasting of water quality variables in river systems is crucial for relevant administrators to identify potential water quality degradation issues and take countermeasures promptly. However, pure data-driven forecasting models are often insufficient to deal with the highly varying periodicity of water quality in today’s more complex environment. This study presents a new holistic framework for time-series forecasting of water quality parameters by combining advanced deep learning algorithms (i.e., Long Short-Term Memory (LSTM) and Informer) with causal inference, time-frequency analysis, and uncertainty quantification. The framework was demonstrated for total nitrogen (TN) forecasting in the largest artificial lakes in Asia (i.e., the Danjiangkou Reservoir, China) with six-year monitoring data from January 2017 to June 2022. The results showed that the pre-processing techniques based on causal inference and wavelet decomposition can significantly improve the performance of deep learning algorithms. Compared to the individual LSTM and Informer models, wavelet-coupled approaches diminished well the apparent forecasting errors of TN concentrations, with 24.39%, 32.68%, and 41.26% reduction at most in the average, standard deviation, and maximum values of the errors, respectively. In addition, a post-processing algorithm based on the Copula function and Bayesian theory was designed to quantify the uncertainty of predictions. With the help of this algorithm, each deterministic prediction of our model can correspond to a range of possible outputs. The 95% forecast confidence interval covered almost all the observations, which proves a measure of the reliability and robustness of the predictions. This study provides rich scientific references for applying advanced data-driven methods in time-series forecasting tasks and a practical methodological framework for water resources management and similar projects.

How to cite: Zhang, C., Nong, X., Behzadian, K., Campos, L., and Shao, D.: A new framework for water quality forecasting coupling causal inference, time-frequency analysis and uncertainty quantification, EGU General Assembly 2024, Vienna, Austria, 14–19 Apr 2024, EGU24-7047, https://doi.org/10.5194/egusphere-egu24-7047, 2024.

EGU24-7630 | Posters on site | HS4.8

Development of monitoring techniques for Urban flood damage 

Ki-Won Lee, Jongseok Lee, and Jooyeong Yoon

The frequency and extent of damage from urban flooding are increasing more and more due to rapid urbanization and climate change. The Dorimcheon Stream drainage Basin, a tributary of the Han River in Seoul, is one of the areas prone to frequent flooding during the flood season. When heavy rain occurs and the water level of the Han River rises, the water that was discharged into Dorimcheon through the Storm Sewer System cannot be drained and rather flowed back. In order to manage urban flooding that occurs in the Dorimcheon Stream drainage Basin, it is necessary to measure the water level at the confluence, the water level at the urban storm drain system and at roads in the flood monitoring area. There are many water level observation stations in the Han River, so anyone can easily check water level changes in real time. However, in the Dorimcheon stream basin, it is necessary to install other monitoring devices to monitor changes in water levels in storm drains or roads. In this study, an IOT-based water level gauge which is capable of real-time monitoring for storm drains and roads were researched and developed to monitor urban flooding in order to contribute to quick decision-making during urban flood forecasting and warning. It is expected that the developed monitoring device will be installed at a number of points, and use analysis of the acquired data, it will be possible to manage damage from urban flooding more scientifically and effectively.


Keywords : Urban flood, Water level gauge, real-time monitoring


Acknowledgement : This work was supported by Korea Environment Industry & Technology Institute(KEITI) through R&D Program for Innovative Flood Protection Technologies against Climate Crisis Project, funded by Korea Ministry of Environment(MOE)(2022003470002)

How to cite: Lee, K.-W., Lee, J., and Yoon, J.: Development of monitoring techniques for Urban flood damage, EGU General Assembly 2024, Vienna, Austria, 14–19 Apr 2024, EGU24-7630, https://doi.org/10.5194/egusphere-egu24-7630, 2024.

Dissolved oxygen (DO) is an essential indicator for assessing water quality and managing aquatic environments, but it is still a challenging topic to accurately understand and predict the spatiotemporal variation of DO concentrations under the complex effects of different environmental factors. In this study, a practical prediction framework was proposed for DO concentrations based on the support vector regression (SVR) model coupling multiple intelligence techniques (i.e., four data denoising techniques, three feature selection rules, and four hyperparameter optimization methods). The holistic framework was tested using a data matrix (17532 observation data in total) of 12 indicators from three vital water quality monitoring stations of the longest inter-basin water diversion project in the world (i.e., the Middle-Route of the South-to-North Water Diversion Project of China), during the year 2017 to 2020 period. The results showed that the framework we advocated for could successfully and accurately predict DO concentration variations in different geographical locations. The model used the “wavelet analysis–LASSO regression–random search–SVR” combination of the Waihuanhe station has the best prediction performance, with the Root Mean Square Error (RMSE), Mean Square Error (MSE), Mean Absolute Error (MAE), and coefficient of determination (R2) values of 0.251, 0.063, 0.190, and 0.911, respectively. The combined methods using feature selection and hyperparameter optimization techniques can significantly promote the robustness and accuracy of the prediction model and can provide a new universal and practical way for investigating and understanding the environmental drivers of DO concentration variations. For the water quality management department, this proposed comprehensive framework can also identify and reveal the key parameters that should be concerned and monitored under different environmental factors change. More studies in terms of assessing potential integrated water quality risk using multi-indicators in mega water diversion projects and/or similar water bodies are required in the future.

How to cite: Nong, X., Lai, C., Chen, L., and Wei, J.: Prediction modelling framework comparative analysis of dissolved oxygen concentration variations using support vector regression coupled with multiple feature engineering and optimization methods: A case study in China, EGU General Assembly 2024, Vienna, Austria, 14–19 Apr 2024, EGU24-7941, https://doi.org/10.5194/egusphere-egu24-7941, 2024.

EGU24-8776 | ECS | Posters on site | HS4.8

Machine Learning for Daily Streamflow Forecasting in the Rhine River Basin: Modeling and Predictive Insights 

Zohreh Sheikh Khozani and Monica Ionita

Accurate prediction of streamflow is crucial for various purposes, such as flood control, dam design and operation, water supply systems, and hydropower generation. Estimating streamflow in a catchment presents challenges due to factors such as chaotic distribution, periodicity in streamflow patterns, and intricate/nonlinear relationships among catchment elements. The limitations of traditional models and the growing availability of time series data on flow rates and relevant weather and climate variables are leading to an increased use of Machine Learning-based models. Among these, neural networks have proven to be highly effective for making accurate predictions. In this research, three different types of Machine Learning (ML) algorithm, Multilayer Perceptron (MLP), Support Vector Regression (SVR), and Random Forest (RF), were employed to forecast the daily streamflow of the Rhine River (Worms catchment). The predictive features at Worms gauging station (Rhine River) encompassed lagged values of streamflow (Qs) from the previous 1, 2, and 3 days, flow rate at the Maxau station (Rhine River) with a single lag-time (Qm-1), and daily precipitation (P). In this study, the data from 1 January 2013 to 31 August 2021 was employed for building models (training), and the data from 1 September 2021 to 31 October 2023 was used for model validation. The performance of the proposed models in predicting streamflow were investigated using some quantitative metrics such as Root Mean Square Error (RMSE), Mean Absolute Error (MAE), Nash-Sutcliffe efficiency (NSE), and Percent bias (PBIAS). The results showed that the Maxau flow rate (Qm-1) and daily streamflow with one day lag (Qs-1) are the most effective input variables for forecasting streamflow at Worms gaugin station. According to the NSE metric, all models have very good predictive power, but the RF algorithm outperformed the others.

How to cite: Sheikh Khozani, Z. and Ionita, M.: Machine Learning for Daily Streamflow Forecasting in the Rhine River Basin: Modeling and Predictive Insights, EGU General Assembly 2024, Vienna, Austria, 14–19 Apr 2024, EGU24-8776, https://doi.org/10.5194/egusphere-egu24-8776, 2024.

EGU24-10381 | ECS | Posters on site | HS4.8

Physics-Informed AI-based Modelling for Flood Early Warning Systems 

Farzad Piadeh and Kourosh Behzadian

Today, the vast majority of early warning systems (EWS) are introduced in which advanced deep learning, recurrent neural network or ensemble-based data mining techniques are applied to provide more accurate and reliable flood forecasting [1]. This trend have been gained more trends mainly due to recent advances in computational capabilities, technological enhancement, and data science-based modelling have empowered these data-driven models [2]. A novel addition in this community is the physics-informed neural network models (PINN), integrating physical principles and constraints into architecture of data driven models. This hybrid approach is particularly beneficial in scenarios where prior knowledge of underlying physics such as nature of rainfall occurrence or catchments hydraulic characteristics are limited [3].

In the present study, PINN-based ensemble multi-class data mining model, inspired by [4] is introduced for forecasting water level classes ranging from no risk to high risk in the context of urban drainage systems (UDS). To keep simplicity, this model is developed with only two datasets: rainfall and UDS water levels. In addition to conventional inputs such as rainfall intensity, duration, session, and soil moisture, two physics-informed rainfall inputs - namely, the potential future return period (RP) of current rainfall and the current return period class - are incorporated. Additionally, two physics-informed catchment water level inputs - specifically, the water level class at the current timestep and the duration of the current class - are integrated into the model framework. The introduction of these new parameters aims to offer valuable insights into system dynamics, enhancing the model's ability to comprehend both short-term and long-term memory patterns.

The results, assessed using the method outlined in [2], indicate a substantial improvement in hit rates - from 67% to 88% - compared to a benchmark model. Notably, time lags in the correct detection of water level classes, are halved on average, reducing from 2-timstep intervals. More specifically, the rate of event underestimation decreases from 7% to 2%, showcasing that the new method has the potential to reduce false alarms in EWS. It is essential to note that the application of PINN is currently limited to using only physics-informed input data. However, a promising avenue for future exploration involves extending this approach to adjusting hyperparameters of data-driven models with physics equations. This adaptation is recommended for future directions in research and application.

References

[1] Piadeh, F., Behzadian, K., Chen, A.S., Campos, L.C., Rizzuto, J., Kapelan, Z. (2023). Event-based decision support algorithm for real-time flood forecasting in urban drainage systems using machine learning modelling. Environmental Modelling & Software, 167, p.105772.

[2] Piadeh, F., Behzadian, K., Chen, A.S., Kapelan, Z., Rizzuto, J., Campos, L.C. (2023). Enhancing urban flood forecasting in drainage systems using dynamic ensemble-based data mining. Water Research, 247, p.120791.

[3] Bihlo, A., Popovych, R. (2022). Physics-informed neural networks for the shallow-water equations on the sphere. Journal of Computational Physics, 456, p.111024.

[4] Piadeh, F., Piadeh, F., Behzadian, K. (2023). Time-series Boosting in Ensemble Modelling of Real-Time Flood Forecasting Application, EGU General Assembly 2023, Vienna, Austria, EGU23-4183, https://doi.org/10.5194/egusphere-egu23-4183, 2023.

How to cite: Piadeh, F. and Behzadian, K.: Physics-Informed AI-based Modelling for Flood Early Warning Systems, EGU General Assembly 2024, Vienna, Austria, 14–19 Apr 2024, EGU24-10381, https://doi.org/10.5194/egusphere-egu24-10381, 2024.

Rainfall data sources constitute a vital component of flood early warning systems (EWS), and their inseparability from these systems is evident [1]. However, the information derived from these sources is typically confined to the duration, intensity and peak time for ground-based stations and cloud density and temperature for satellite productions [2]. Therefore, more details into the current rainfall occurrence and predictions regarding its future characteristics can significantly assist real-time flood forecasting systems to perform more accurate and reliable measures [3]. One of the rainfall characteristics that can bring valuable insight into the EWS are return period (RP) or position of rainfall into the intensity-duration-frequency (IDF) curves. This new parameter can offer a more nuanced understanding of rainfall events and significantly enhance the capabilities of early warning systems [4].

In this study, a novel Back Propagation Neural Network model is designed to enhance the accuracy of rainfall predictions in EWS. The model incorporates five rainfall inputs of (1) current Intensity, (2) intensity gradient determined from an intensity library, (3) current duration, (4) current RP determined using rules from the IDF curve library, (5) RP gradient, (6) absolute energy, and (7) anthropic class. The model employs two 5-neuron hidden layers to predict the RP class of current rainfall, i.e. a 5-year or 3-month RP for instance, depending on the desired lead time. To evaluate its accuracy, the model is tested for various time predictions with 15-minute intervals. Subsequently, a real case study of an urban drainage system in the UK is chosen to assess how this additional input enhances previously developed models [3-4].

The results demonstrate that the model excels in predicting the RP for a 2-hour lead time, achieving a performance accuracy exceeding 90%. Moreover, an acceptable accuracy rate of over 75% is achieved for a 4-hour lead time. Additionally, the incorporation of an added parameter into a benchmark EWS results in a 10.8% increase in accuracy for 15-min, escalating to 37.8% for 4-hour lead time. Although the influence of the added parameter may be minimal for near timesteps, its impact becomes significantly more pronounced when dealing with longer lead time predictions, exactly when conventional EWS performance tends to be reduced.

References

[1] Piadeh, F., Behzadian, K., Chen, A.S., Kapelan, Z., Rizzuto, J., Campos, L.C. (2023). Enhancing urban flood forecasting in drainage systems using dynamic ensemble-based data mining. Water Research, 247, p.120791.

[2] Piadeh, F., Behzadian, K., Chen, A.S., Campos, L.C., Rizzuto, J., Kapelan, Z. (2023). Event-based decision support algorithm for real-time flood forecasting in urban drainage systems using machine learning modelling. Environmental Modelling & Software, 167, p.105772.

[3] Piadeh, F., Behzadian, K., Chen, A.S., Campos, L.C., Rizzuto, J.P. (2023). Real-time flood overflow forecasting in Urban Drainage Systems by using time-series multi-stacking of data mining techniques, EGU General Assembly 2023, Vienna, Austria, EGU23-8574, https://doi.org/10.5194/egusphere-egu23-8574, 2023.

[4] Piadeh, F., Piadeh, F., Behzadian, K. (2023). Time-series Boosting in Ensemble Modelling of Real-Time Flood Forecasting Application, EGU General Assembly 2023, Vienna, Austria, EGU23-4183, https://doi.org/10.5194/egusphere-egu23-4183, 2023.

How to cite: Piadeh, F. and Piadeh, F.: Rule-based BPNN model for real-time IDF prediction of rainfall: Valuable Input for Early Warning Systems, EGU General Assembly 2024, Vienna, Austria, 14–19 Apr 2024, EGU24-10462, https://doi.org/10.5194/egusphere-egu24-10462, 2024.

EGU24-11503 | Orals | HS4.8

A new Pluvial Flood Index (PFI) considering meteorological, hydrological and hydrodynamic processes for real-time flash flood forecasting 

Markus Weiler, Ingo Haag, Andreas Hänsler, Julia Krumm, Hannes Leistert, Max Schmit, and Andreas Steinbrich

Pluvial (flash) floods regularly cause significant damage in both rural and urban catchments. Such pluvial floods are usually caused by short-term local precipitation events of extreme intensity, resulting in infiltration excess and overland flow. In contrast to fluvial floods, the hazard of pluvial floods is mainly due to overland flow and flow in small ditches and creeks. Therefore, pluvial floods cannot be evaluated with common extreme value statistics, which are based on fluvial discharge records at river gages. On the other hand, pluvial floods are not only influenced by precipitation alone, but also by hydrological and hydrodynamic processes. Thus, precipitation statistics are not sufficient to evaluate and predict pluvial floods, either. Therefore, we suggest a new pluvial flood index (PFI), which evaluates the danger resulting from overland flow and surface flooding during pluvial floods and takes into account precipitation along with hydrological and hydrodynamic processes.

The new PFI is based on the proportion of pluvial flood hazard areas (PFHA). We define PFHA as areas where pedestrians or vehicles are at risk because water depth, flow velocity or the combination of both (flow rate) exceed defined thresholds. Based on historical events and design events (combining different probabilities of precipitation and initial soil moisture), we defined thresholds of PFHA to generate four classes of PFI ranging from no flood danger to very large flood danger. Hence, PFI is a simple, dimensionless measure, which can convey valuable information about the occurrence and severity of a pluvial flood to the general public and authorities.

PFHA and PFI for different events are determined from precipitation input, dynamic simulation of infiltration and saturation excess and hydrodynamic simulation of surface runoff concentration. Thus, simulation and forecasting PFI does not only require quantitative precipitation input and appropriate hydrodynamic overland flow models, but also adequate distributed, process-based hydrological models that consider infiltration excess and saturation runoff resulting from different initial soil moisture and land surface conditions. We demonstrate the application and usefulness of the new PFI in case studies for historical events and for a large-scale test area and show the potential using ML methods to allow real-time forecasting. We will also demonstrate that this information is much more valuable than rainfall warning alone. Moreover, the PFI can be linked to detailed local data to improve decision making of local municipalities. Therefore, the PFI is a valuable core piece for operational, real-time pluvial flood forecasting and early warning systems. The proposed system provides information on whether pluvial flooding will occur in a certain area on the scale of several hectares to square kilometers and how extreme this flood will be.

How to cite: Weiler, M., Haag, I., Hänsler, A., Krumm, J., Leistert, H., Schmit, M., and Steinbrich, A.: A new Pluvial Flood Index (PFI) considering meteorological, hydrological and hydrodynamic processes for real-time flash flood forecasting, EGU General Assembly 2024, Vienna, Austria, 14–19 Apr 2024, EGU24-11503, https://doi.org/10.5194/egusphere-egu24-11503, 2024.

EGU24-11663 | Posters virtual | HS4.8

Application of Internet of Things in Real-Time Urban Flood Risk Management 

Vahid Bakhtiari, Farzad Piadeh, and Kourosh Behzadian

Today, IoT devices are becoming integral to the real-time management of flooding through the implementation of flood early warning systems [1]. With the assistance of advancements in remote sensing, the expanding band board of the internet, and satellite technology, numerous local sensors, such as ultrasonic water level detectors, flowmeters, wind speed and direction meters, and soil moisture sensors, have been introduced to provide essential real-time data for flood early warning systems [2]. Importantly, the application of IoT in urban flood risk management extends beyond the establishment of early warning systems, encompassing a comprehensive stakeholder engagement throughout all stages and applicable to a wide range of scenarios [3].

Although this concept is currently undergoing testing worldwide, there is still a notable gap in the existence of a comprehensive framework that classifies and explains the roles of all sensors [4]. This research aims to fill that gap. The identification of five pivotal stages in flood risk management - prevention, mitigation, preparedness, response, and recovery - emphasizes the comprehensive nature of the challenge. In the prevention stage, IoT sensors are strategically deployed to monitor meteorological conditions and hydraulics information, providing real-time data essential for predicting potential flooding. Integrating IoT into infrastructure, such as smart dams or levees, enables continuous monitoring and adjustment to prevent breaches or overflows. In the mitigation stage, IoT-controlled devices, like smart pumps or floodgates, can be autonomously activated based on real-time data, aiding in managing water levels and mitigating flood impacts. Furthermore, IoT devices, by collecting data on evolving conditions, enable predictive analytics for assessing potential flood risks. This empowers authorities to proactively devise and implement mitigation measures.

In the preparedness phase, sensors trigger automated alerts and notifications to authorities and the affected population, facilitating timely evacuation and preparedness measures. During the response stage, IoT facilitates real-time monitoring of flood events, empowering emergency responders to make informed decisions and allocate resources judiciously. Concurrently, IoT supports communication during emergencies, ensuring seamless connectivity among response teams, affected individuals, and pertinent authorities for coordinated efforts. In the recovery phase of flood risk management, IoT sensors prove invaluable in assessing the extent of damage in affected areas, providing indispensable data for recovery planning. Moreover, IoT applications, such as monitoring air and water quality, contribute to ensuring a safe environment during the recovery period.

References

[1] Bakhtiari, V., Piadeh, F., Behzadian, K. (2023). Application of innovative digital technologies in urban flood risk management. EGU General Assembly 2023, Vienna, Austria. https://doi.org/10.5194/egusphere-egu23-4143.

[2] Zeng, F., Pang, C., Tang, H., 2023. Sensors on the Internet of Things systems for urban disaster management: a systematic literature review. Sensors, 23(17), p.7475.

[3] Bakhtiari, V., Piadeh, F., Chen, A., Behzadian, K. (2023). Stakeholder analysis in the application of cutting-edge digital visualisation technologies for urban flood risk management: A critical review. Expert Systems with Applications, p.121426.

[4] Bakhtiari, V., Piadeh, F., Behzadian, K., Kapelan, Z., (2023). A critical review for the application of cutting-edge digital visualisation technologies for effective urban flood risk management. Sustainable Cities and Society, p.104958.

How to cite: Bakhtiari, V., Piadeh, F., and Behzadian, K.: Application of Internet of Things in Real-Time Urban Flood Risk Management, EGU General Assembly 2024, Vienna, Austria, 14–19 Apr 2024, EGU24-11663, https://doi.org/10.5194/egusphere-egu24-11663, 2024.

EGU24-12888 | ECS | Posters virtual | HS4.8

Integrated Data-Driven Approach for Early Pollution Detection and Management in the Thames River Ecosystem 

Saeid Najjar-Ghabel, Farzad Piadeh, Kourosh Behzadian, and Atiyeh Ardakanian

The increasing pollution levels in rivers have become a serious concern worldwide due to their detrimental impact on ecosystems and human health. Recently, there has been a growing recognition of the need for early warning systems (EWS) to monitor and manage water quality in river ecosystems [1]. EWS is a method that is used to detect and predict potential risks or hazards before they occur. It helps alert individuals, organisations, or communities and provides them with timely information to take necessary precautions and actions to minimise the impact of the anticipated event [2]. EWS for water quality management also can be efficient when real-time data (both water quality and quantity) can be combined with real-time flood forecasting [3].


This study presents a new method based on data-driven models for early warning pollution detection in the Thames River. The proposed method collects and analyses various types of data, including weather data and water quality parameters obtained from water samples and sensing systems. These inputs are integrated into a robust computational framework to forecast and identify potential pollution incidents in the Thames River system. The data-driven model incorporates real-time weather data to encompass the dynamic nature of pollution levels. The model can identify high-risk situations and issue timely warnings to prevent further pollution by analysing historical weather patterns and their correlation with pollution incidents. The system's computational framework utilises a deep neural network to analyse and interpret the collected data. The model is fine-tuned and calibrated using historic data, allowing it to effectively recognise and predict pollution events in real-time for every flood event through combined sewer overflow structures. By integrating historical and real-time data, the model can enhance predictive capabilities of pollution spread in the river system and hence prepare the relevant bodies to take appropriate actions in time.


The proposed method holds great promise in mitigating the adverse impacts of pollution on the river's ecosystem and the surrounding communities. By integrating diverse data sources, including in-situ measurements, sensing systems, and weather information, the model provides a holistic understanding of pollution dynamics and enables proactive pollution control measures. Implementing this model can contribute significantly to preserving the health and ecological integrity of the Thames River, serving as a blueprint for other river systems facing similar pollution challenges worldwide.


References

[1] Yuxi, X., Weihua, Z., Jie, Q. (2023). Integrated water risk early warning framework of the semi-arid transitional zone based on the water environmental carrying capacity (WECC). Journal of Arid Land. 15(2), pp. 145–163.

[2] Piadeh, F., Behzadian, K., Alani, A. (2022). A critical review of real-time modelling of flood forecasting in urban drainage systems. Journal of Hydrology, 607, p.127476.

[3] Waidyanatha, N. (2010). Towards a typology of integrated functional early warning systems. International Journal of Critical Infrastructures. 6 (1), p.31.

How to cite: Najjar-Ghabel, S., Piadeh, F., Behzadian, K., and Ardakanian, A.: Integrated Data-Driven Approach for Early Pollution Detection and Management in the Thames River Ecosystem, EGU General Assembly 2024, Vienna, Austria, 14–19 Apr 2024, EGU24-12888, https://doi.org/10.5194/egusphere-egu24-12888, 2024.

EGU24-13053 | ECS | Posters virtual | HS4.8

Enhancing Urban Flood Prediction Accuracy with Physics-Informed Neural Networks: A Case Study in Real-Time Rainfall Data Integration  

Sina Raeisi, Farzad Piadeh, and Kourosh Behzadian

Urban flooding presents significant socio-economic challenges in cities, emphasising the need for effective flood forecasting [1]. Traditional flood prediction methods are data-intensive and time-consuming for calibration and computation. However, due to data scarcity and the necessity to account for real-time variable factors, Machine/Deep Learning (ML/DL) techniques are emerging as preferred solutions. These methods offer an advantage over slow, yet accurate, calibrated numerical models by handling limitations more efficiently [2]. More recently, a notable DL technique, called the Physics-Informed Neural Network (PINN), integrates physics understanding into the modeling process. This approach enables the model to incorporate physical principles into its inputs, enhancing its predictive capabilities despite limited data availability. Similar to other DL models, PINNs consist of an input layer, several hidden layers, and an output layer. However, as added value, the structure of these layers in PINN models varies based on the problem's nature and hyperparameters such as weights and biases are adjusted based on physical equations/roles/formula during the training phase to minimise the loss function [3]. Application of PINN models have been tasted widely in other contexts such as groundwater systems, climate prediction, energy systems, and waste management [4]. However, in the context of real-time flood early warning systems, this issue remains relatively novel.

This study aims to develop a PINN model to detect flood events at specific points in an urban drainage system at the earlier timesteps of rainfall. The model employs the Horton equation applied to the rainfall hyetograph (both time-dependent) to process real-time data. This input allows the model to predict water level rises at certain points in the channel, identifying potential flooding. This new data is used as both input data and roles of bias adjusting during training model. The results show that by integrating physics-based rainfall inputs, accuracy of prediction have been significantly enhanced especially for longer timesteps in comparison to well-developed ML models.


References:

[1] Piadeh, F., Behzadian, K., Chen A., Campos L., Rizzuto J., Kapelan Z. (2023). Event-based decision support algorithm for real-time flood forecasting in urban drainage systems using machine learning modelling. Environmental Modelling & Software, 167, p.105772.

[2] Piadeh, F., Behzadian, K., Chen A., Kapelan, Z., Rizzuto, J., Campos, L. (2023). Enhancing urban flood forecasting in drainage systems using dynamic ensemble-based data mining. Water Research, 247, p.120791.

[3] Raissi, M., Perdikaris, P., Karniadakis, G. (2019). Physics-informed neural networks: A deep learning framework for solving forward and inverse problems involving nonlinear partial differential equations. Journal of Computational Physics, 378, pp. 686-707.

[4] Li, H., Zhang, Z., Li, T., Si, X. (2024). A review on physics-informed data-driven remaining useful life prediction: Challenges and opportunities, Mechanical Systems and Signal Processing, 209, p.111120.

How to cite: Raeisi, S., Piadeh, F., and Behzadian, K.: Enhancing Urban Flood Prediction Accuracy with Physics-Informed Neural Networks: A Case Study in Real-Time Rainfall Data Integration , EGU General Assembly 2024, Vienna, Austria, 14–19 Apr 2024, EGU24-13053, https://doi.org/10.5194/egusphere-egu24-13053, 2024.

EGU24-13189 | Orals | HS4.8 | Highlight

Unveiling the Interplay: Flood Impacts on Transportation, Vulnerable Communities, and Early Warning Systems 

Seyedeh Negar Naghedi, Farzad Piadeh, Kourosh Behzadian, and Moein Hemmati

Flooding's impact on transportation infrastructure is crucial, influencing urban mobility, economic activities, and societal resilience [1]. Disruptions in transportation networks during flood events significantly impede access to essential services, intensifying the vulnerability of communities and hindering recovery efforts. Understanding the multifaceted consequences of flooding on transportation is fundamental for fortifying these critical systems against the escalating risks posed by changing climate patterns and extreme weather events [2].

Floods, stemming from various sources like heavy rainfall, storm surges, or river overflow, profoundly affect transportation infrastructure. Bridges, roads, and rail networks face damage or complete destruction, impeding travel and access to crucial services. Moreover, inundated areas and compromised roadways exacerbate accessibility challenges for specific demographic groups [3]. Vulnerable communities, including low-income populations or geographically isolated areas, bear a disproportionate burden, experiencing limited access to jobs, healthcare, and emergency services during and after flood events.

Research exploring the nexus between early warning systems and transportation resilience remains sparse but holds significant promise. Early warnings tailored to transportation vulnerabilities could mitigate disruptions, enhancing evacuation plans and rerouting strategies. Enabling timely and targeted information dissemination to affected areas or populations, especially those with limited mobility or access, can substantially reduce the adverse impacts on their daily lives and crucial infrastructure. Understanding the gaps in the interconnection of early warning systems and transportation resilience is crucial for bolstering the adaptive capacity of transportation networks, ensuring equitable access, and minimizing the disproportionate impacts of floods on vulnerable communities.

[1] Naghedi, S., Huang, X., Gheibi, M., (2023). A smart dashboard for forecasting disaster casualties: An investigation from sustainable development dimensions EGU General Assembly 2023, Vienna, Austria. https://doi.org/10.5194/egusphere-egu23-17237

[2] Piadeh, F., Behzadian, K., Chen, A.S., Campos, L.C., Rizzuto, J., Kapelan, Z. (2023). Event-based decision support algorithm for real-time flood forecasting in urban drainage systems using machine learning modelling. Environmental Modelling & Software, 167, p.105772.

[3] Yan, J., Naghedi, R., Huang, X., Wang, S., Lu, J. and Xu, Y., 2023. Evaluating simulated visible greenness in urban landscapes: An examination of a midsize US city. Urban Forestry & Urban Greening, 87, p.128060.

How to cite: Naghedi, S. N., Piadeh, F., Behzadian, K., and Hemmati, M.: Unveiling the Interplay: Flood Impacts on Transportation, Vulnerable Communities, and Early Warning Systems, EGU General Assembly 2024, Vienna, Austria, 14–19 Apr 2024, EGU24-13189, https://doi.org/10.5194/egusphere-egu24-13189, 2024.

EGU24-13359 | ECS | Orals | HS4.8

Machine learning models for stream-level predictions using readings from satellite and ground gauging stations  

Cristiane Girotto, Farzad Piadeh, Kourosh Behzadian, Massoud Zolgharni, Luiza Campos, and Albert Chen

Abstract

While the accuracy of flood predictions is likely to improve with increasing gauging station networks and robust radar coverage, challenges arise when such sources are spatially limited [1]. For instance, severe rainfall events in the UK come mostly from the North Atlantic area where gauges are ineffective and radar instruments are limited to it 250km range.  In these cases, NASA’s IMERG is an alternative source of precipitation estimates offering global coverage with 0.1-degree spatial resolution at 30-minute intervals. The IMERG estimates for the UK’s case can offer an opportunity to extend the zone of rainfall detection beyond the radar range and increase lead time on flood risk predictions [2].

This study investigates the ability of machine learning (ML) models to capture the patterns between rainfall and stream level, observed during 20 years in the River Crane in the UK. To compare performances, the models use two sources of rainfall data as input for stream level prediction, the IMERG final run estimates and rain gauge readings. Among the three IMERG products (early, late, and final), the final run was selected for this study due to its higher accuracy in rainfall estimates. The rainfall data was retrieved from rain gauges and the pixel in the IMERG dataset grid closest to the point where stream level readings were taken.

These datasets were assessed regarding their correlation with stream level using cross-correlation analysis. The assessment revealed a small variance in the lags and correlation coefficients between the stream-level and the IMERG dataset compared to the lags and coefficients found between stream-level and the gauge’s datasets. To evaluate and compare the performance of each dataset as input in ML models for stream-level predictions, three models were selected: NARX, LSTM, and GRU. Both inputs performed well in the NARX model and produced stream-level predictions of high precision with MSE equal to 1.5×10⁻⁵ while using gauge data and 1.9×10⁻⁵ for the IMERG data. The LSTM model also produced good predictions, however, the MSE was considerably higher,  MSE of 1.8×10⁻³ for gauging data and 4.9×10⁻³ for IMERG data. Similar performance was observed in the GRU predictions with MSE of 1.9×10⁻³ for gauging data and 5.6×10⁻³ for IMERG.  Nonetheless, the results of all models are within acceptable ranges of efficacy confirming the applicability of ML models on stream-level prediction based just on rainfall and stream-level information. More importantly, the small difference between the results obtained from IMERG estimates and gauging data seems promising for future tests of IMERG rainfall data sourced from other pixels of the dataset’s grid and to explore the potential for increased lead time of predictions. 

[1] Piadeh, F., Behzadian, K. and Alani, A. (2022). A critical review of real-time modelling of flood forecasting in urban drainage systems. Journal of Hydrology, 607, p.127476.

[2] Foelsche, U., Kirchengast, G., Fuchsberger, J., Tan, J., Petersen, W. (2017). Evaluation of GPM IMERG Early, Late, and Final rainfall estimates using WegenerNet gauge data in southeastern Austria. Hydrology and Earth System Sciences, 21(12), pp. 6559-6572.

How to cite: Girotto, C., Piadeh, F., Behzadian, K., Zolgharni, M., Campos, L., and Chen, A.: Machine learning models for stream-level predictions using readings from satellite and ground gauging stations , EGU General Assembly 2024, Vienna, Austria, 14–19 Apr 2024, EGU24-13359, https://doi.org/10.5194/egusphere-egu24-13359, 2024.

EGU24-13501 | Posters on site | HS4.8

Development real-time flood modelling technique reflecting regional characteristics of Jeju Island 

Jungsoo Yoon, Seokhwan Hwang, Narae Kang, Hoje Seong, and Changyeol Park

Jeju Island is located in the path of typhoons, making it an extremely vulnerable environment to natural disasters. The mountainous effect caused by Mt. Halla. increases the risk of flash flood in rivers and the impact of climate change is worsening the risk on Jeju Island. Nevertheless, its disaster prevention technology in Jeju Island have been relatively lacking, comparing inland areas in Korea. This study developed flood modeling technology that reflects the characteristics of Jeju Island to improve disaster prevention technology in the Jeju Island. First, we developed rainfall scenarios considering the spatial and temporal distribution characteristics of heavy storm in the Jeju Island. AWS data and radar data were used to consider rainfall spatio-temporal characteristics (rainfall amount, duration, movement, spatial distribution, etc.). Second, we used the real-time flood model using inundation and flood risk index developed by KICT(Korea Institute of Civil Engineering and Building Technology). The flood model uses distributed model on a 1km grid basis and environmental variables such as geology or slope related to runoff are set independently for each 1km grid.

Acknowledgement : This work was supported by the Technology Development Program (20025869, Development of Safety Support Technology based on Real-Time Flood Risk Detection in Jeju Island) funded by the Ministry of the Interior and Safety(MOIS, korea)


How to cite: Yoon, J., Hwang, S., Kang, N., Seong, H., and Park, C.: Development real-time flood modelling technique reflecting regional characteristics of Jeju Island, EGU General Assembly 2024, Vienna, Austria, 14–19 Apr 2024, EGU24-13501, https://doi.org/10.5194/egusphere-egu24-13501, 2024.

EGU24-13509 | ECS | Posters on site | HS4.8

Optimising oceanic rainfall estimates for increased lead time of stream level forecasting: A case study of GPM IMERG estimates application in the UK 

Cristiane Girotto, Farzad Piadeh, Kourosh Behzadian, Massoud Zolgharni, Luiza Campos, and Albert Chen

Abstract

Among the three main rainfall data sources (rain gauge stations, rainfall radar stations and weather satellites), satellites are often the most appropriate for longer lead times in real-time flood forecasting [1]. This is particularly relevant in the UK, where severe rainfall events often originate over the Atlantic Ocean, distant from land-based instruments although it can also limit the effectiveness of satellite data for long-term predictions [2]. The Global Precipitation Measurement (GPM) Integrated Multi-satellitE Retrievals for GPM (IMERG) estimates can be used as an alternative source for rainfall information in real-time flood forecasting models. However, the challenge lies in monitoring the vast oceanic region around the UK and integrating this extensive data into hydrological or data-driven models, which presents computational and time constraints. Identifying key monitoring area for obtaining these estimates is essential to address these challenges and to effectively use this use for water level forecasting in urban drainage systems (UDS).

This study introduced an optimised data-driven model for streamline the collection and use of GPM IMERG rainfall estimates for water level forecasting in UDS. The model’s effectiveness was demonstrated using a 20-year satellite data set from the Atlantic Ocean, west of the UK, focusing on water level forecasting for a specific UDS point in London. This data helped identify the most probable path of rainfall from the Atlantic that impacts UDS water levels. We conducted a cross-correlation analysis between the water level records and each IMERG data pixel within the selected oceanic area.

The analysis successfully pinpointed the most influential rainfall points/pixels along the Atlantic path and their respective lag times between rainfall occurrence and water level changes at any satellite-monitored point until it reaches the mainland and joins the river system. This research enhances understanding of long-distance rainfall patterns while optimising the use of GPM IMERG data. It also aids in reducing data volume and processing time for stream-level forecasting models, aiming for longer lead times.


[1] Piadeh, F., Behzadian, K., Alani, A., 2022. A critical review of real-time modelling of flood forecasting in urban drainage systems. Journal of Hydrology, 607, p.127476.

[2] Speight, L., Cole, S., Moore, R., Pierce, C., Wright, B., Golding, B., Cranston, M., Tavendale, A., Dhondia, J., Ghimire S. (2016). Developing surface water flood forecasting capabilities in Scotland: an operational pilot for the 2014 Commonwealth Games in Glasgow. Journal of Flood Risk Management, 11(S2), pp. S884-S901.

How to cite: Girotto, C., Piadeh, F., Behzadian, K., Zolgharni, M., Campos, L., and Chen, A.: Optimising oceanic rainfall estimates for increased lead time of stream level forecasting: A case study of GPM IMERG estimates application in the UK, EGU General Assembly 2024, Vienna, Austria, 14–19 Apr 2024, EGU24-13509, https://doi.org/10.5194/egusphere-egu24-13509, 2024.

EGU24-13854 | ECS | Orals | HS4.8

Recent advances in developing high-resolution flood forecasting systems in Germany 

Husain Najafi, Oldrich Rakovec, Pallav Kumar Shrestha, Rohini Kumar, Sergiy Vorogushyn, Heiko Apel, Stephan Thober, Bruno Merz, and Luis Samaniego

This presentation aims to offer valuable insights into the state-of-the-art technologies and methodologies employed to enhance Real-time Flood Forecasting (RTFF) systems by highlighting recent progress in the development of high-resolution RTFF systems. Given the existing uncertainties associated with RTFF and the documented increasing trends in flood peaks in the western and central regions of Europe [1], continuous improvement of RTFF systems is essential for better disaster risk preparedness.

Recurrent and severe flooding events have impacted Germany in recent years. The predictability of two recent flooding events, including the extensive flooding from December 2023 to January 2024 across the entire country, and the 2021 summer flood in Ahrtal [5] will be explored by introducing an experimental RTFF chain. This chain utilizes high-resolution weather forecasts from Germany's National Meteorological Service, Deutscher Wetterdienst (DWD). The chain incorporates high-resolution streamflow and water level forecasts at 1 km using the mesoscale Hydrologic Model (mHM) [2,3]. Additionally, it features a fast hydrodynamic model (RIM2D) at 10 m resolution [4] with an extended component for impact forecasting tailored to the scale of individual buildings. We showcase how the newly developed RTFF system enables tailored decision-making compared to the common practices currently used by local authorities.

References

[1] Blöschl, G., Hall, J., Viglione, A., Perdigão, R. A., Parajka, J., Merz, B., ... & Živković, N. (2019). Changing climate both increases and decreases European river floods. Nature, 573(7772), 108-111. DOI: 10.1038/s41586-019-1495-6

[2] Samaniego, L., Kumar, R., & Attinger, S. (2010). Multiscale parameter regionalization of a grid‐based hydrologic model at the mesoscale. Water Resources Research, 46(5).

[3] Samaniego, L., Kumar, R., Thober, S., Rakovec, O., Zink, M., Wanders, N., ... & Attinger, S. (2017). Toward seamless hydrologic predictions across spatial scales. Hydrology and Earth System Sciences, 21(9), 4323-4346.

[4] Apel, H., Vorogushyn, S., & Merz, B. (2022). Brief communication: Impact forecasting could substantially improve the emergency management of deadly floods: case study July 2021 floods in Germany. Nat. Hazards Earth Syst. Sci., 22(9), 3005-3014. doi:10.5194/nhess-22-3005-2022.

[5] Najafi, H., Shrestha, PK., Rakove, O.,  Apel, H., Thober, S., Kumar, R., Vorogushyn, S., & Merz, B., Samaniego, L. (in review). Advancing a High-Resolution Impact-based Early Warning System for Riverine Flooding. Nature communications.

How to cite: Najafi, H., Rakovec, O., Kumar Shrestha, P., Kumar, R., Vorogushyn, S., Apel, H., Thober, S., Merz, B., and Samaniego, L.: Recent advances in developing high-resolution flood forecasting systems in Germany, EGU General Assembly 2024, Vienna, Austria, 14–19 Apr 2024, EGU24-13854, https://doi.org/10.5194/egusphere-egu24-13854, 2024.

EGU24-14019 | ECS | Orals | HS4.8

Leveraging machine learning and satellite observation for skillful flood forecasts 

Sanjib Sharma, Yogesh Bhatttarai, Sunil Bista, and Rocky Talchabhadel

Urban systems are highly exposed and vulnerable to extreme rainfall and flooding. Flood impacts span across various sectors, causing disruptions in transportation network, power supply, and access to emergency services. These impacts are expected to increase with expanding urban development, aging flood control infrastructure, and intensifying rainfall events. Reliable prediction of flood hazards is crucial to inform the design of sustainable risk management strategies. This study aims to advance predictive understanding of flood hazards by leveraging recent advances in numerical weather prediction, machine learning, satellite observations and high-performance computing. We compare the predictive skill of standalone machine learning with the hybrid models built by integrating process-based hydrodynamic model outputs with machine learning algorithms. We demonstrate the ability of machine learning surrogate models to capture spatio-temporal flood dynamics with reduced computational expense. This work contributes to strengthening the scientific foundation for flood-risk prediction that is of utmost importance to enhance community resilience in the face of evolving weather and climate extremes.

How to cite: Sharma, S., Bhatttarai, Y., Bista, S., and Talchabhadel, R.: Leveraging machine learning and satellite observation for skillful flood forecasts, EGU General Assembly 2024, Vienna, Austria, 14–19 Apr 2024, EGU24-14019, https://doi.org/10.5194/egusphere-egu24-14019, 2024.

EGU24-14944 | ECS | Orals | HS4.8

PYRAMID: A Platform for dynamic, hyper-resolution, near-real time flood risk assessment integrating repurposed and novel data sources 

Amy Green, Elizabeth Lewis, Xue Tong, Shidong Wang, Ben Smith, and Hayley Fowler

It is essential that we work towards better preparation for flooding, as the impacts and risks associated increase with a changing climate. Standard methods for flood risk assessment are typically static, based on flood depths corresponding to return levels. In contrast flood risk changes over time, with the time of day and weather conditions, driving the location and extent of potential debris (e.g. vehicles or trees may cause blockages in culverts) affecting the associated risks. To this end, we aim to provide a platform for dynamic flood risk assessment, to better inform decision making, allowing for improved flood preparation at a local level. With stakeholder collaboration at a local level, a web-platform demonstrator is presented, for the city of Newcastle upon Tyne (U.K.) and the wider catchment, providing interactive visualisations and dynamic flood risk maps.

To achieve this, near real-time updates are incorporated as part of a fully integrated workflow of models, with traditional datasets combined with novel, hidden data. More realistic high-resolution data, citizen science data and novel data sources are combined, making use of data scraping and APIs to obtain additional sensor data. Using machine learning methods, more complex datasets are generated, using artificial intelligence algorithms and object detection to identify potential debris information from satellites, LIDAR point clouds and trash screen images. The model framework involves hyper-resolution hydrodynamic modelling (HIPIMS), with a hydrological catchment model (SHETRAN), working towards a digital twin.

How to cite: Green, A., Lewis, E., Tong, X., Wang, S., Smith, B., and Fowler, H.: PYRAMID: A Platform for dynamic, hyper-resolution, near-real time flood risk assessment integrating repurposed and novel data sources, EGU General Assembly 2024, Vienna, Austria, 14–19 Apr 2024, EGU24-14944, https://doi.org/10.5194/egusphere-egu24-14944, 2024.

EGU24-15200 | ECS | Posters on site | HS4.8

Predictive multivariate modelling for anticipatory drainage management in coastal lowlands 

Henning Müller and Kai Schröter

Climate change related sea level rise and increased winter precipitation are contributing to an increase in flood hazards in low-lying coastal regions of Germany. The magnitude of flood events in these areas is largely dependent on the capacity of the drainage infrastructure such as canals, sluices or pumps. As the drainage capacity varies depending on the technical and environmental conditions, drainage operations are especially under pressure when compound events like an inland flood and a storm surge occur simultaneously.

To gain insight into the factors that impact drainage system capacity, we analyse sea level, hydrometeorological and operational datasets from coastal lowland catchments using multivariate statistical and machine learning-based approaches, e.g. rank correlation and random forests. The analysis indicates complex multi-level correlations of rainfall, wind direction and speed, and tidal water levels with inland flooding and helps to identify combinations of influencing factors that reduce drainage capacity and increase flood hazards. This information is useful to anticipate flood events and assist water management bodies in adjusting drainage operations in advance to mitigate resulting risks.

How to cite: Müller, H. and Schröter, K.: Predictive multivariate modelling for anticipatory drainage management in coastal lowlands, EGU General Assembly 2024, Vienna, Austria, 14–19 Apr 2024, EGU24-15200, https://doi.org/10.5194/egusphere-egu24-15200, 2024.

EGU24-15264 | ECS | Orals | HS4.8

Cumulative Impact Analysis of Rain Gauge Networks on Rainfall Forecasting Accuracy: A Case Study  

Hossein Nouriabouzari, Ali Abbasi, Mojtaba Shafiei, and Kourosh Behzadian

Accurate rainfall estimation is vital for real-time forecasting of water resources used for water demand management. This needs an optimum density of rain gauges. While numerous geostatistical methods exist for optimizing rain gauge networks, many may suffer from limitations. This study aims to develop a novel geostatistical method to redesign rain gauge networks that was demonstrated in a real-world case study of Khorasan Razavi province, specifically in the Qarahqoom basin, Iran, aiming to minimize errors.

The methodology involves analyzing the number and locations of rain gauges and assessing each rain station’s contribution to the region’s overall rainfall estimation accuracy. Initially, station homogeneity in the study area is verified using the linear moment method. Subsequently, a suitable semi-variogram is selected to calculate the acceptance probability for different areas within the province. This approach determines acceptance accuracy (AP) values at various probability levels.

Considering the basin’s characteristics, including its homogeneity, the acceptance probability method was implemented at an 80% probability level. The findings reveal that current networks of 66 rain gauges achieves a 61% acceptance accuracy. Of these, only 42 rain gauges significantly influence the estimated basin rainfall (i.e. forming the base network) while the remaining 24 rain gauges have a minor impact (i.e. non-base network). It is proposed that adding 24 strategically placed stations could evaluate the rainfall estimation accuracy in the Qaraqoom basin to 95%.

Keywords: Rain gauge network, variogram, acceptance probability, acceptance accuracy, Qarahqoom basin

How to cite: Nouriabouzari, H., Abbasi, A., Shafiei, M., and Behzadian, K.: Cumulative Impact Analysis of Rain Gauge Networks on Rainfall Forecasting Accuracy: A Case Study , EGU General Assembly 2024, Vienna, Austria, 14–19 Apr 2024, EGU24-15264, https://doi.org/10.5194/egusphere-egu24-15264, 2024.

EGU24-16534 | ECS | Posters on site | HS4.8 | Highlight

Towards Digital Twin in Global Flood Forecasting - A Proof-of-Concept in Severn catchment and Alzette catchment 

Thanh Huy Nguyen, Sukriti Bhattacharya, Jefferson Wong, Yoanne Didry, and Patrick Matgen

Advancements in Earth Observation, coupled with the swift progress in big data analysis and access to distributed computing and storage, open up exciting possibilities for the development of Digital Twins of the Earth. These Digital Twins hold the potential to transform disaster preparedness, allowing us to foresee extreme events and assess the effectiveness of various policy measures. Within this framework, we propose here a specialized Digital Twin dedicated to flood disasters. Its primary goal is to enhance flood resilience by introducing an innovative inundation forecasting service that provides early warnings and enhances preparedness. To ensure the product aligns with user needs, a multi-tiered strategy for collecting user requirements was implemented. Key features identified by users include hourly flood depth predictions, updated daily, with a 72-hour lead time. The integration of local data and models for impact analysis at local scales was also recognized as crucial. The chosen pilot studies for this project focus on the winter 2020 storms in the Severn Catchment, UK and the summer 2021 storm in the Alzette Catchment, Luxembourg. Both events were observed by the Copernicus Sentinel-1 mission.

To meet user requirements, the study aims to incorporate existing state-of-the-art global and regional near-real-time flood monitoring and forecasting products, namely GloFAS (Global Flood Awareness System) and GFM (Global Flood Monitor). The Digital Twin thus consists of four key elements:

  • Numerical Weather Prediction (NWP) model, based on ECMWF or French/German weather service forecasts;
  • Land surface model and rainfall-runoff model, i.e. GloFAS HTESSEL or LARSIM;
  • Hydrodynamic model, with LISFLOOD-FP model for both catchments;
  • Flood impact assessment model, based on KONTUR population dataset and OpenStreetMap.

By integrating the GFM and GloFAS products through data assimilation, the Digital Twin is capable of short-term as well as medium-range daily inundation forecasting, reducing predictive uncertainties. The data assimilation strategy is flexible and accommodates various global- and local-scale models and resolutions. Its implementation involves particle filtering enabling weighted combinations of pre-computed flood depth maps based on LISFLOOD-FP, aligned with flood extent maps observed by GFM, providing a more accurate representation of the real world.

Not only this strategy is spatiotemporally transferable but it is also adaptable to new test sites without extensive retraining or reconfiguration. The outcomes of this proof-of-concept study can lay the groundwork for future research in the field, contributing to closing the global flood protection gap.

How to cite: Nguyen, T. H., Bhattacharya, S., Wong, J., Didry, Y., and Matgen, P.: Towards Digital Twin in Global Flood Forecasting - A Proof-of-Concept in Severn catchment and Alzette catchment, EGU General Assembly 2024, Vienna, Austria, 14–19 Apr 2024, EGU24-16534, https://doi.org/10.5194/egusphere-egu24-16534, 2024.

EGU24-16762 | ECS | Posters on site | HS4.8

Regional Flood Inundation Nowcast Using Double-Encoder Transformer 

Shao-Kun Shiu and Li-Chiu Chang

In the context of rapid global population growth and extensive economic development, urbanization is expanding rapidly. The expansion of urbanization brings about increasingly complex challenges for cities, and flooding is one of the disasters faced. Climate change has led to a significant increase in extreme hydrological events, particularly a sharp rise in rainfall intensity, further elevating the risk of flooding in low-lying urban areas. The study area is located in Taipei City, characterized by low-lying terrain surrounded by mountains, and is influenced by subtropical climate. The frequent occurrence of heavy rainfall during the monsoon season and typhoons contributes to frequent flooding events, with the additional impact of climate change increasing the risk of intense rainfall. Therefore, the real-time prediction of regional flooding and its application in urban management becomes an imperative task, aiding in early warning, effective flood risk response, and ensuring sustainable urban development.

This study utilizes the Double-Encoder Transformer model for real-time flood forecasting leveraging dual-encoder architecture to process and analyze diverse data types relevant predicting floods. One encoder could be dedicated to interpreting meteorological data, such as rainfall spatial distribution. This encoder focuses on extracting and understanding the complex patterns in weather-related data, which are crucial for predicting the likelihood of flooding. The second encoder, on the other hand, could handle geographical and environmental data, including terrain topology, and land use patterns. This encoder is adept at understanding how environmental factors contribute to flood risk in specific areas. By concurrently processing these two streams of information, the Double-Encoder Transformer can create a more comprehensive prediction model. It can identify correlations between meteorological conditions and environmental responses, leading to more accurate and timely flood forecasts. This approach enhances the model's ability to predict not only when and where floods might occur but also their potential severity, aiding in disaster preparedness and resource allocation.

Overall, the application of the Double-Encoder Transformer in flood forecasting represents a significant advancement in disaster management, leveraging AI's power to integrate and analyze complex, multi-faceted data for better, more informed decision-making in critical situations.

How to cite: Shiu, S.-K. and Chang, L.-C.: Regional Flood Inundation Nowcast Using Double-Encoder Transformer, EGU General Assembly 2024, Vienna, Austria, 14–19 Apr 2024, EGU24-16762, https://doi.org/10.5194/egusphere-egu24-16762, 2024.

EGU24-17244 | ECS | Orals | HS4.8

A High-Resolution Artificial Neural Network-Based Model for Predicting Urban Flooding in Hanover, Germany 

Simon Berkhahn, Robert Sämann, Lothar Fuchs, and Insa Neuweiler

Urban flooding poses a significant challenge to cities, requiring the development of advanced predictive models to mitigate potential risks and enhance urban resilience. In the present study, we test an artificial neural network (ANN)-based model for predicting urban flooding in the city of Hanover, Germany. The model provides high-resolution spatial analysis on a 5 x 5 meter grid, providing detailed insights into potential flood-prone areas. With a temporal resolution of 5 minutes, the ANN model uses radar-based precipitation data to predict water levels during extreme weather events. The study is part of the FURBAS project (Forecasting urban floods and strong rainfall events, 2022-2025). This research project is a cooperation of the Institute for Technical and Scientific Hydrology (itwh) GmbH, the Institute of Fluid Mechanics and Environmental Physics in Civil Engineering, Leibniz University of Hanover and the municipal operation for Hanover city drainage. The project is funded by the Federal Ministry for the Environment, Nature Conservation, Nuclear Safety and Consumer Protection under grand number 67DAS224.

The data driven flood prediction model uses pre-simulated flood scenarios from a physically based model as training data. The model approach of Berkhahn and Neuweiler (2023) was adapted for the present study to cope with the large catchment area of about 260 km².

The proposed model could improve timely decision making for urban planning and emergency response in the future. Despite the focus on the specific challenges of the city of Hanover, the chosen modeling approach could also be applied to flood forecasting and management in other cities. With this conference contribution we want to highlight the challenges of real-time forecasting of pluvial urban floods in large catchments and present first preliminary results.

Berkhahn, S., & Neuweiler, I. (2023). Data driven real-time prediction of urban floods with spatial and temporal distribution. Journal of Hydrology X, 100167.

How to cite: Berkhahn, S., Sämann, R., Fuchs, L., and Neuweiler, I.: A High-Resolution Artificial Neural Network-Based Model for Predicting Urban Flooding in Hanover, Germany, EGU General Assembly 2024, Vienna, Austria, 14–19 Apr 2024, EGU24-17244, https://doi.org/10.5194/egusphere-egu24-17244, 2024.

EGU24-18150 | Posters on site | HS4.8

Comprehensive Flood Early Warning Systems: From Modelling to Policy Making Perspectives 

Kourosh Behzadian, Farzad Piadeh, Saman Razavi, Luiza Campos, Mohamad Gheibi, and Albert Chen

Todays, early warning systems are widely applied in real-time flood forecasting operations as valuable non-structural tools for mitigating the impacts of floods [1].  Although many research works have perfectly could review recent advances in this era, current review papers tend to focus narrowly on specific perspectives, such as water quantity or quality [2]. Therefore, there is a pressing need for a more comprehensive and multi-disciplinary approach that not only explores various potential aspects of flood early warning system applications but also reveals the interconnections between these aspects [3]. This paper aims to bridge this gap by mapping out diverse applications and presenting significant trends, past initiatives, and future directions across a wide range of domains. By adopting such an approach, our goal is to provide a more holistic understanding of flood early warning systems and pave the way for further exploration in this critical field.

This papers, as state-of-art, suggests that a comprehensive framework may include all these aspects to meet all desired task and also ensure that all aspect of sustainability, reliability, resiliency, and accuracy have been fulfilled: (1) using recent input data extracted from both well known resources such as ground station and satellite stations, and novel but local resources i.e. IoT-based remote sensing, drones, USV and even social media and qualitative data; (2) Advance modelling with focusing on hybrid deep learning and physics-informed neural networks for different type of flood i.e. fluvial, pluvial or surface run-off. Also, application of data mining for data screening still have required more attention; (3) Adding concept of water quality as target and outputs of EWS especially with focusing on emerging pollutants, biological pollutants and micro-plastics; (4) Interconnection of EWS with optimisation techniques, decision support systems, and multi criteria decision making processes; (5) Appropriate sensitivity/uncertainty analysis especially due to requirement for developing dynamic retrainable or self-trainable EWS; (6) Application of post modelling tools including virtual/augmented/mixed reality or digital twin to including stakeholder engagement.

References

[1] Piadeh, F., Behzadian, K., Chen, A.S., Kapelan, Z., Rizzuto, J., Campos, L.C. (2023). Enhancing urban flood forecasting in drainage systems using dynamic ensemble-based data mining. Water Research, 247, p.120791.

[2] Piadeh, F., Behzadian, K., Chen, A.S., Campos, L.C., Rizzuto, J., Kapelan, Z. (2023). Event-based decision support algorithm for real-time flood forecasting in urban drainage systems using machine learning modelling. Environmental Modelling & Software, 167, p.105772.

[3]  Ringo, J., Sabai, S., Mahenge, A. (2024). Performance of early warning systems in mitigating flood effects. A review. Journal of African Earth Sciences, 210, p.105134.

How to cite: Behzadian, K., Piadeh, F., Razavi, S., Campos, L., Gheibi, M., and Chen, A.: Comprehensive Flood Early Warning Systems: From Modelling to Policy Making Perspectives, EGU General Assembly 2024, Vienna, Austria, 14–19 Apr 2024, EGU24-18150, https://doi.org/10.5194/egusphere-egu24-18150, 2024.

EGU24-18526 | ECS | Orals | HS4.8

Influence of trenches and subway system on pluvial flood forecast  

Robert Sämann, Johanna Treindl, Lothar Fuchs, Thomas Beeneken, and Simon Berkhahn

The FURBAS project (Forecasting urban floods and strong rainfall events, 2022-2025) aims at establishing a real-time pluvial flood forecast system for the city of Hanover in Germany with a total catchment area of 260 km². The forecast system consists of radar rainfall with nowcasting  and an Artificial Neuronal Network (ANN) to forecast the dynamical evolution of surface water levels in the city with a spatial resolution of 5x5 meter and a temporal resolution of 5 minutes (Berkhahn & Neuweiler, 2023). The ANN is trained based on results of a physically based hydrodynamic model (HYSTEM EXTRAN 2D) with bi-directional coupled storm-sewer (1d) to surface (2d) domain.

The terrain has a slight gradient which causes a long travel time in the sewer system. The pipe network is partially built as combined sewer and separate sewer system. In the latter, rainfall is partially routed via trenches that are modelled as part of the 2d surface. These trenches are required to get an impression of the overall extent of the flooding and the interaction with the sewer system. In classical modelling approaches the drainage volume vanishes when reaching the outlets of the pipe network which leads to an underestimation of the flood level. We show the effects of modelling trenches as elements of the surface and provide tips for the correct arrangement of trenches.

The underground transport tunnels of a city are a rarely modelled factor in the flooding of a city. The underground stations are connected to the public drainage system where it can lead to a drainage delay, due to underground storage tanks. Flooding or overload of the drainage pipes along the underground tunnels have an important influence on the operability of the trains because the inflowing water is pumped into the regular drainage network. The fill level of the pipes is therefore the decisive limit value. We show the effects of station entrances and tunnel ramps to the water level at the surface and how the precipitation intensity is decisive for the operation of the trains.

Funding:
The FURBAS research project is a cooperation of the Institute for Technical and Scientific Hydrology (itwh) GmbH, the Institute of Fluid Mechanics and Environmental Physics in Civil Engineering, Leibniz University of Hanover, and the municipal operation for Hanover city drainage. The project is funded by the German Federal Ministry for the Environment, Nature Conservation, Nuclear Safety and Consumer Protection under grand number 67DAS224.

Literature:
Berkhahn, S., & Neuweiler, I. (2023). Data driven real-time prediction of urban floods with spatial and temporal distribution. Journal of Hydrology X, 100167.

How to cite: Sämann, R., Treindl, J., Fuchs, L., Beeneken, T., and Berkhahn, S.: Influence of trenches and subway system on pluvial flood forecast , EGU General Assembly 2024, Vienna, Austria, 14–19 Apr 2024, EGU24-18526, https://doi.org/10.5194/egusphere-egu24-18526, 2024.

This research employs a systems dynamics approach to simulate the intricate dynamics of the agricultural sector, a predominant consumer of resources, with a focus on the Khuzestan region. By meticulously reviewing reports and conducting field visits, we extracted essential inputs for both hydrological and agricultural models. Our objective was to formulate the behaviors of hydrology and agriculture, providing a comprehensive understanding of the region's phenomena. Employing Vensim software, we modeled and integrated the agriculture and hydrology of the region, subsequently deriving a mathematical model for analysis[1].

The model's performance was assessed over a 96-month period from 2011 to 2019, utilizing evaluation metrics such as Lux indices, protein production index, and yield index. Notably, the study reveals that, with the exception of 2018 when Khuzestan experienced flooding, the region consistently faces high water stress[2]. Remarkably, the environmental sector claims the largest share of resource consumption in the region, shaping the allocation dynamics[3]. Analyzing the prevailing agricultural patterns, our findings indicate that sugarcane, wheat, and rice exhibit the highest financial income per cubic meter of water consumption.

This research contributes valuable insights into the sustainability challenges of resource allocation in the Khuzestan agricultural sector. The integrated modeling approach provides a nuanced understanding of the complex interplay between hydrological and agricultural components, shedding light on potential strategies for optimizing resource management. The findings hold significance for policymakers, researchers, and practitioners seeking sustainable solutions to address water stress and enhance agricultural productivity in comparable regions.


Keywords: Systems Dynamics; Agricultural Modeling; Hydrological Modeling; Resource Allocation, Khuzestan Region

[1] Mehranfar, N., Kolahdoozan, M., & Faghihirad, S. (2023). Development of multiphase solver for the modeling of turbidity currents (the case study of Dez Dam). International Journal of Multiphase Flow168, 104586.

[2] Vahid, R., Farnood Ahmadi, F., & Mohammadi, N. (2021). Earthquake damage modeling using cellular automata and fuzzy rule-based models. Arabian Journal of Geosciences14, 1-14.

[3] Naghedi, S.R., Huang, X. and Gheibi, M., 2023. A smart dashboard for forecasting disaster casualties: An investigation from sustainable development dimensions (No. EGU23-17237). Copernicus Meetings.

How to cite: Maleki, A., Darabi Kerchi, H., and Piadeh, F.: Integrated Modeling of Agricultural and Hydrological Systems for Sustainable Resource Allocation: A Case Study of the Khuzestan Region, EGU General Assembly 2024, Vienna, Austria, 14–19 Apr 2024, EGU24-18890, https://doi.org/10.5194/egusphere-egu24-18890, 2024.

EGU24-19111 | Orals | HS4.8

Architectural Strategies for Flood Mitigation in Urban Environments: A Study of Traditional Elements and Contemporary Resilience 

Seyedeh Negar Naghedi, Ali Maleki, Rasool Vahid, Farzad Piadeh, and Kourosh Behzadian

Natural disasters cause extensive losses worldwide annually. Flood events are responsible for economic and life-threatening damages[1]. To mitigate flood risks and resulting damages, particularly in the construction of residential buildings, two approaches exist. First: constructing in areas with lower flood susceptibility, and second: implementing architectural solutions to fortify structures against floods and associated hazards. Due to the presence of water resources, rivers, etc., prompting urban expansion due to reasons like transportation, trade, agricultural use, household consumption, etc., construction near rivers and flood-prone areas becomes inevitable[2]. This underscores the importance of the second approach—architectural fortification.

In this study, areas highly susceptible to flooding were identified from flood zoning maps using artificial intelligence to adapt these maps and estimate the most hazardous regions[3]. Subsequently, by examining the specific elements of traditional architecture in each of these areas and exploring the cause and function of each element in facing floods over time, attention is given to the particular and regional (indigenous) architectural features that have responded to floods. Finally, appropriate architectural measures and responses to reduce flood risks, such as constructing at elevation or suitable gradients, is combined with early warning systems to provide a proper route for the future construction projects.

Keywords: Flood forecasting; Flood prone areas; Architectural fortification

[1] Naghedi, S.R., Huang, X. and Gheibi, M., 2023. A smart dashboard for forecasting disaster casualties: An investigation from sustainable development dimensions (No. EGU23-17237). Copernicus Meetings.

[2] Yan, J., Naghedi, R., Huang, X., Wang, S., Lu, J. and Xu, Y., 2023. Evaluating simulated visible greenness in urban landscapes: An examination of a midsize US city. Urban Forestry & Urban Greening87, p.128060.

[3] Vahid, R., Farnood Ahmadi, F., & Mohammadi, N. (2021). Earthquake damage modeling using cellular automata and fuzzy rule-based models. Arabian Journal of Geosciences14, 1-14.

How to cite: Naghedi, S. N., Maleki, A., Vahid, R., Piadeh, F., and Behzadian, K.: Architectural Strategies for Flood Mitigation in Urban Environments: A Study of Traditional Elements and Contemporary Resilience, EGU General Assembly 2024, Vienna, Austria, 14–19 Apr 2024, EGU24-19111, https://doi.org/10.5194/egusphere-egu24-19111, 2024.

EGU24-20164 | ECS | Orals | HS4.8

Latent Neural Mapping for Hydrological Data Assimilation in Flood Prediction 

Kun Wang, Sibo Cheng, Matthew Piggott, Sarah L Dance, and Rossella Arcucci

Floods are one of the most frequent and severe natural disasters, and it is important to be prepared to predict them. Accurate prediction of floods requires the provision of accurate estimates of river discharge. Data assimilation (DA) as a technique for integrating background fields and observations can be a helpful solution to improve the accuracy of the river discharge prediction. DA can be a highly effective technology, however, when DA is performed on a large amount of data or high dimensional data, it results to be computationally very expensive, which is inappropriate for flood prediction, where timely results are required. Also, DA is used to merge data from diverse sources of information and, when the background fields and the observations are not from the same place, e.g. the observations are sparse, data must be interpolated on different grinds which increase the errors’ accumulation. In this work, latent neural mapping is designed to mitigate problems related to errors propagation and computational cost. We integrated DA with neural network (NN) and the resulting model helps on saving computational cost and solve the problem of sparse observation. Convolutional NN are employed to build a mapping function which converts data from the background space to the observation space (and vice versa). We tested the model with real data and flooding events in the UK. Data provided by the National River Flow Archive (NRFA) served as observations and the data provided by the European Flood Awareness System (EFAS) served as background fields. The Result shows that the accuracy is improved by 54.4% in MSE and the runtime of the model in 50s for 300 iterations. 

How to cite: Wang, K., Cheng, S., Piggott, M., Dance, S. L., and Arcucci, R.: Latent Neural Mapping for Hydrological Data Assimilation in Flood Prediction, EGU General Assembly 2024, Vienna, Austria, 14–19 Apr 2024, EGU24-20164, https://doi.org/10.5194/egusphere-egu24-20164, 2024.

EGU24-21875 | Orals | HS4.8

Modelling the impact of antecedent conditions on flood forecasting 

Dimosthenis Tsaknias and Dapeng Yu

Antecedent conditions play a crucial role in flooding, and hence it is essential to simulate them when floods are forecasted. Wet antecedent conditions can lead to significant flooding even if the rainfall during an event is not very intense, prolonged or widespread. An example of this type of flooding is the European floods in the summer of 2013, which affected Germany, Czech Republic and Austria; leading to 25 fatalities and financial losses amounting to 16 billion USD (Munich Re, 2013).

This study presents a modelling framework aimed focusing on the interplay between antecedent conditions and flood events. Our approach integrates a new component related to antecedent conditions to Previsico’s proprietary FloodMap Live by leveraging geospatial datasets as well as past precipitation data. The ground parameters are modified automatically without the need of manual intervention.

In this study we discuss the data processing spatially and temporally, and the impact of antecedent conditions for various events by showcasing different scenarios in the United Kingdom. Moreover, we investigate the model sensitivity and performance when compared with observation points which were flooded.

This research investigates the importance of antecedent conditions on flood modelling and  contributes to our understanding of how scenario-based events should be modelled in order to improve forecast performance. These improvements improve the accuracy of Previsico’s flood forecasts as they add a new component related to how the ground conditions changed a few days before a flood event.

Reference:

Munich Re, 2013. Floods dominate natural catastrophe statistics in first half of 2013. Available at: https://web.archive.org/web/20130714234357/http://www.munichre.com/en/media_relations/press_releases/2013/2013_07_09_press_release.aspx


How to cite: Tsaknias, D. and Yu, D.: Modelling the impact of antecedent conditions on flood forecasting, EGU General Assembly 2024, Vienna, Austria, 14–19 Apr 2024, EGU24-21875, https://doi.org/10.5194/egusphere-egu24-21875, 2024.

EGU24-22495 | Orals | HS4.8

A Monte Carlo Framework to Evaluate the Benefits of Flood Warnings in an Urban Flood-Prone Polder Area 

Felipe Duque, Greg O’Donnell, Yanli Liu, Mingming Song, and Enda O’Connell

Polders, situated in delta regions and enclosed by dykes to avert flooding (from rivers or tides), depend on pumping mechanisms to transfer water from internal artificial rivers to external ones, particularly during storms. Urban polders are highly susceptible to pluvial flooding if their drainage, storage, and pumping capacities are insufficient. This study introduces a Monte Carlo (MC) framework to assess the effectiveness of rainfall threshold-based flood warnings in mitigating pluvial flooding in an urban flood-prone polder area based on 24-hour forecasts. The framework calculates metrics including the potential duration of waterlogging, the maximum area inundated, and the costs of pump operation, taking into account a wide range of possible storm scenarios. The benefits of flood warnings are evaluated by comparing these metrics across different scenarios: scenarios with no warnings, perfect forecasts, deterministic forecasts, and probabilistic forecasts. Probabilistic forecasts incorporate the idea of 'predictive uncertainty' (PU). A specific polder region in Nanjing was selected for this case study. Findings indicate a balance between waterlogging duration and pumping costs, and demonstrate that probabilistic rainfall predictions can significantly improve these metrics. These insights are valuable for designing and assessing the advantages of a rainfall threshold-based flood early warning system (FEWS) in a polder area.

How to cite: Duque, F., O’Donnell, G., Liu, Y., Song, M., and O’Connell, E.: A Monte Carlo Framework to Evaluate the Benefits of Flood Warnings in an Urban Flood-Prone Polder Area, EGU General Assembly 2024, Vienna, Austria, 14–19 Apr 2024, EGU24-22495, https://doi.org/10.5194/egusphere-egu24-22495, 2024.

HS5.1 – Water resources planning, management, policy, and governance

EGU24-1397 | Posters on site | HS5.1.1

Distributive Justice in Multi-Objective Optimization: A Priori vs. A Posteriori Approaches in Eastern Nile Basin Management   

Meron Znabei, Jazmin Zatarain Salazar, Jan Kwakkel, and Neelke Doorn

Addressing global water scarcity requires effective, sustainable water resource management. However, water resources management problems are complex challenges with multiple, often contradicting, objectives. Moreover, increasingly, questions are raised regarding the fair allocation of scarce water resources. In this study, we use multi-objective optimization as an approach to explore the trade-offs between these conflicting objectives. Questions pertaining to fair allocation are commonly integrated a posteriori. In contrast, this study explores their a priori incorporation and the impact of doing so on the trade-offs identified through multi-objective optimization. We investigate utilitarianism, egalitarianism, and prioritarianism, representing diverse theories of distributive justice. These theories guide the translation of justice principles into mathematical models, offering insights into how societal values influence water distribution. Our research centers on the management of the heavily disputed shared water resources within the Eastern Nile River Basin. We compare a priori and a posteriori integration of distributive justice principles to find Pareto-optimal trade-offs across irrigation, hydropower, and urban supply objectives for Sudan, Egypt, and Ethiopia. Our findings demonstrate that the a priori integration produces trade-offs that differ significantly from those obtained through analyses that omit distributive justice principles during optimization and only incorporate them post-optimization for filtering. Utilitarian integration enhances overall system performance, egalitarian integration diversifies solutions, and prioritarian integration produces sharper trade-offs, highlighting the challenges in reconciling distributive justice principles. Our findings contribute to the broader discourse on ethics in many-objective optimization, offering valuable insights for policymakers and water resource managers, especially in contexts where sustainability and fair distribution of water resources are essential. 

How to cite: Znabei, M., Zatarain Salazar, J., Kwakkel, J., and Doorn, N.: Distributive Justice in Multi-Objective Optimization: A Priori vs. A Posteriori Approaches in Eastern Nile Basin Management  , EGU General Assembly 2024, Vienna, Austria, 14–19 Apr 2024, EGU24-1397, https://doi.org/10.5194/egusphere-egu24-1397, 2024.

EGU24-2029 | ECS | Posters on site | HS5.1.1

Assessment of land suitability and water resources potential for horticultural irrigation in Grand-Duchy of Luxembourg 

Cédric Magain, Guillaume Renard, Philippe Orban, Aurore Degré, Jeroen Meersmans, Caroline De Clerck, Serge Brouyère, and Joost Wellens

Since the 1960s, the Luxembourgish agricultural sector has been largely influenced by the common agricultural policy. Luxembourg authorities have expressed a desire to make a transition in their agricultural production to focus on national needs and self-sufficiency. A new financial support will be introduced to favor vegetable (horticulture) and fruit growers. At the same time, water resources are under pressure as a result of demographic, economic and agricultural growth. Moreover, climate change exacerbates these pressures. This situation requires an update on the state of available water resources and its users; and to study the potentials and limits to develop irrigated horticulture. To do so, this study aims to identify areas conducive to sustainable irrigated horticulture.

Firstly, land potentially suitable for irrigated horticulture was assessed via a pairwise comparison matrix ranking importance of land features, soil characteristics and water accessibility  (i.e Worqlul et al., 2015; Gonfa et al., 2021; Danbara and Zewdie, 2022), enabling the identification of opportunities and challenges that horticulture producers may face.

Secondly, water needs for those zones are compared to available conventional (Altchenko & Villholth, 2015) and unconventional water resources (Paul et al., 2020). The spatialized net irrigation water requirements for major horticultural crops are computed through the water-driven crop growth model, AquaCrop (Raes et al., 2009). An interface communication between Aquacrop SA  and Python is developed to run numerous spatialized simulations based on retrieved data from soil, crop, climatic condition databases and agricultural practices.

Most papers consider a single water source type for irrigation. One of this study's novelties is to explore the possibilities of combining different types of water resources for irrigation. Available groundwater has been estimated by considering recharge rates calculation as well as surface water and non-conventional water (e.g. treated wastewater), which both were obtained from monitoring data. A hydrological method of ecological flow estimation is used to address environmental needs (European Commission, 2015), while non-agricultural needs are taken into account via consumption data. Another innovative aspect of this study is the assessment of three combined aspects regarding potential future scenarios. On one hand, consumer growth and climate change scenarios alterations on water balance are evaluated. On the other hand, impacts of agricultural practices are quantified through AquaCrop to show the required adaptation of horticulture to those future developments. 

This approach enabled the simulation of water needs of several agricultural scenarios (crop selection, agricultural practices, climate change and competing water users’ impacts), and their confrontation with available water resources. Combined with suitable land for horticulture, zones with different irrigation potential are assessed, providing a decision support aid for the development of irrigated horticulture and water ressources allocations at a national scale.

How to cite: Magain, C., Renard, G., Orban, P., Degré, A., Meersmans, J., De Clerck, C., Brouyère, S., and Wellens, J.: Assessment of land suitability and water resources potential for horticultural irrigation in Grand-Duchy of Luxembourg, EGU General Assembly 2024, Vienna, Austria, 14–19 Apr 2024, EGU24-2029, https://doi.org/10.5194/egusphere-egu24-2029, 2024.

Inter-basin water diversion has emerged as a critical measure for achieving a balanced distribution of water resources across basins. This process requires careful planning and implementation of an effective water supply operation scheme. However, an observed decrease in prediction accuracy with extended time periods reduces the effectiveness of long-term water resource management, presenting a dilemma between the risk of water scarcity due to insufficient water diversion and water wastage resulting from excessive diversion. Moreover, stringent regulations on water resources management are critical to achieving intensive water use. Setting limits on the dynamic spatial-temporal allocation of water resources poses a persistent scientific issue requiring immediate attention. Therefore, this study proposed a multi-objective risk-based optimization model for the inter-basin water diversion system under multiple uncertainties and water-use constraints. Backed by probabilistic predictions of local streamflow and water demand via scenario tree method, the water shortages and wastage risks along with costs associated with water diversion were identified. Simultaneously, a dynamic decomposition method for the total water-use constraints, considering changes in various streamflow scenarios, was proposed. Real-time water supply operations under severe constraints and heightened uncertainty were investigated in this study, while the eastern route of the South-to-North Water Diversion Project in Jiangsu Province, China was selected as the case study. The principal findings were as follows: (a) Conflicting relationships exists in this complex system, with the loss of water shortage and the cost of water diversion being the main contradictions. By utilizing high-prediction information, the water diversion was reduced by 41.9%, spilled water by 72.0%, and the water deficit by 10.6%, contributing to achieving an equilibrium in terms of cost, loss, and risk of water diversion and provision; (b) The total water-use constraint effectively controlled inter-basin water diversion and spillage, thus promoting the optimal exploitation of local water supply potential. The core of the water-use constraint is to promote the utilization of water resources through the compression of inter-basin water diversion; (c) By applying the dynamic decomposition of total water-use constraint, the water supply and consumption in a typical dry year increased by 15.46 × 10⁸ m3, theoretically reducing the water deficit by 18.0% compared to the rigid constraint condition, meeting essential agricultural needs during severe drought conditions; (d) The incorporation of chance-constraint functions allowed for a more aggressive water diversion strategy (increasing additional water diversion by 0.574 × 10⁸ m3) while mitigating risks associated with operational decision-making, thereby enhancing reliable water resources management.

How to cite: Mo, R. and Xu, B.: Risk-based multi-objective optimization model for the inter-basin water diversion system under multiple uncertainties and water-use constraints, EGU General Assembly 2024, Vienna, Austria, 14–19 Apr 2024, EGU24-2524, https://doi.org/10.5194/egusphere-egu24-2524, 2024.

EGU24-2718 | ECS | Orals | HS5.1.1

From Fields to Faucets: Modelling the Dynamics of Rural-Urban Water Transfers 

Landon Marston, Maria Amaya, and Chung-Yi Lin

Growing societal water demands and decreasing water supplies are straining water available for ecosystems and communities in many basins. Increasingly, the only viable option to meet growing urban water demands is to reallocate water from rural agricultural water uses when water supplies have already been fully allocated and it is no longer possible to develop new water supplies. Despite the growing importance of rural-to-urban water transfers, the implications of these transfers on rural prosperity and inequalities are poorly understood. Here, we couple an agent-based model (ABM) with an input-output model to capture the behavior of individual irrigators and how their water transfer decisions propagate through the broader rural economy and shape social dynamics. In this presentation, we will detail our unique modeling framework and share initial results testing multiple hypotheses evaluating how rural-urban water transfers are shaped by social, hydrologic, regulatory, and economic context. This research brings new insights that can be used to evaluate the direct and indirect socioeconomic impacts of water transfers and it can help shape policy to minimize potential negative externalities associated with water transfers.

How to cite: Marston, L., Amaya, M., and Lin, C.-Y.: From Fields to Faucets: Modelling the Dynamics of Rural-Urban Water Transfers, EGU General Assembly 2024, Vienna, Austria, 14–19 Apr 2024, EGU24-2718, https://doi.org/10.5194/egusphere-egu24-2718, 2024.

Water resources are the foundation for socio-economic development. The grey water footprint (GWF) serves as a vital indicator that quantifies the impact of human activities on water environment and sustainable water use, and plays an important role in addressing the challenges posed by water pollution and scarcity. The Guangdong-Hong Kong-Macao Greater Bay Area (GBA), a crucial driver of China's economy, faces the dual challenges of rapidly developed economy and grappling with severe overloading of its water environment. To systematically assess the water environment of the GBA, this study utilized panel data from 2008 to 2021 to calculate the GWF of this region, considering pollution sources from agriculture, industry, and domestic activities. On this basis, spatial analysis methods and a random forest model were respectively applied to explore the spatial-temporal evolution characteristics and driving factors of GWF in the GBA. Results show that the overall GWF of the GBA initially increased, reaching its peak of 98.94 billion m³ in 2011, and subsequently declined between 2011 and 2021, with an average annual reduction rate of 5.4%. Spatially, both the overall GWF and domestic GWF exhibited an east-to-west decreasing pattern, with the agricultural GWF displaying higher values in the surrounding areas and lower values in the central region. Population and economic factors are the key driving forces of the GWF, with relative importance percentages of 18.07% and 17.55%, respectively. This study establishes a scientific basis for water resource management and sustainable water use in the GBA, providing valuable guidance to relevant government agencies.

How to cite: He, Y. and Liu, B.: Spatial-temporal variation and driving factors of the gray water footprint of the Guangdong-Hong Kong-Macao Greater Bay Area, China, EGU General Assembly 2024, Vienna, Austria, 14–19 Apr 2024, EGU24-3334, https://doi.org/10.5194/egusphere-egu24-3334, 2024.

EGU24-4002 | ECS | Orals | HS5.1.1

Unravelling the complexity of multi-risk systems and adaptation pathways 

Julius Schlumberger, Marjolijn Haasnoot, Jeroen Aerts, Veerle Bril, Lars van der Weide, and Marleen de Ruiter

Disaster Risk Management (DRM) is increasingly complex due to interacting climate risks from concurrent hazards. The Dynamic Adaptive Policy Pathways for Multi-Risk (DAPP-MR) framework has been introduced to assess DRM policies' effectiveness under deep uncertainties - such as future climate change - and to develop integrated adaptive strategies considering interactions across hazards, sectors, and time. So far, no use cases were available that provide evidence regarding the utility of DAPP-MR.

In this presentation we examine DAPP-MR through a synthetic multi-risk modelling case study, focusing on DRM pathways for managing flood and drought risks across different sectors for a period of 100 years. The case study, inspired by a Dutch river delta, accounts for multi-hazard interaction effects such as including co-occurring or preceding droughts amplifying flood risk, and consecutive flood events as well as multi-sector dynamics. While providing insights into the model development process, the result analysis and conclusions, we also discuss the challenges and benefits of combining multi-risk thinking and climate change adaptation decision-making approaches and the implications of multi-risk dynamics on trade-offs and synergies of different risk management strategies.

How to cite: Schlumberger, J., Haasnoot, M., Aerts, J., Bril, V., van der Weide, L., and de Ruiter, M.: Unravelling the complexity of multi-risk systems and adaptation pathways, EGU General Assembly 2024, Vienna, Austria, 14–19 Apr 2024, EGU24-4002, https://doi.org/10.5194/egusphere-egu24-4002, 2024.

EGU24-5016 | Posters on site | HS5.1.1

Method for Calculating Potential Direct Loss of Water Shortages by Water Use Type and Deducing Optimal Applications 

Yonghyeon Gwon, Darae Kim, Haewon Lee, Mina Yoo, SoHyun Choi, and Jongpyo Park

  In recent years, Korea has witnessed a surge in both drought and heat waves during the spring and summer seasons. In contrast to other natural disasters such as floods, drought is challenging to quantify, and the damage from water shortage tends to develop gradually but persist for an extended period. Due to the challenging task of quantifying potential losses associated with drought, which are associated with diverse forms of damage, there is a need for research to estimate the damages caused by water shortages. Currently, in Korea, official records do not exist for data pertaining to damage or recovery costs categorized by the stage of each drought (only information about individuals experiencing damage and the duration of drought is documented and maintained). Furthermore, identifying the effects of support for damages during water shortages or determining the suitable extent of support is challenging. This difficulty arises from variations in damage assessment standards across different administrative districts and a limited number of relevant cases. Therefore, it is essential to quantify the potential losses from water shortages by deducing the primary influencing factors necessary for calculating such losses.
  Thus, this study aimed to develop a method for calculating potential direct losses associated with water shortages categorized by water use type (household, industrial, agricultural). Additionally, the study aimed to derive optimal strategies for each water use type by analyzing the changes in potential direct losses according to different stages of water shortage scenarios.
  First, cases of major water shortage in the past and pertinent damage data were investigated to establish the process for calculating potential direct losses, and influencing factors were deduced for each water use type to select items for benefit calculation and specific details.
This study proposed a methodology and calculation equation according to the process for each water use type and thus designed a “tool box” capable of calculating potential direct losses by inputting influencing factors related to damages in affected areas. 
  The anticipated outcomes from calculating potential direct losses due to water shortages are expected to contribute to establishing a system that strengthens the competency of water shortage response. This system would include an analysis of water shortage damage reduction scenarios based on basin and water-use types and optimal water supply scenarios (involving a switch between various water use types) in consideration of social and economic aspects.

Acknowledgements
This work was supported by Korea Environment Industry & Technology Institute(KEITI) through Water Management Program for Drought Project, funded by Korea Ministry of Environment(MOE).(RS-2023-00230286)


How to cite: Gwon, Y., Kim, D., Lee, H., Yoo, M., Choi, S., and Park, J.: Method for Calculating Potential Direct Loss of Water Shortages by Water Use Type and Deducing Optimal Applications, EGU General Assembly 2024, Vienna, Austria, 14–19 Apr 2024, EGU24-5016, https://doi.org/10.5194/egusphere-egu24-5016, 2024.

EGU24-5064 | Orals | HS5.1.1

System Dynamics Modeling for Resilient Water Resource Management in Arid Regions 

Adel Elomri, Sarra Aloui, Adel Zghibi, and Annamaria Mazzoni

Arid regions confront significant challenges due to the scarcity of natural water resources, leading to the depletion of non-renewable reserves and an escalating reliance on unconventional water sources. The intricacies of water resource management within such regions are compounded by the dynamic interplay of influential factors, including rapid urbanization and population expansion.

This research employs an innovative System Dynamics (SD) methodology to construct a comprehensive model aimed at understanding the complex dynamics inherent in water resource management within Qatar, characterized by an arid climate. A Decision Support System (DSS), functioning as a simulated environment, was developed to project the behavioral patterns of Qatar's water resource system from 2021 to 2070. This projection encompasses nine distinct scenarios, categorically addressing changes in physical, environmental, and socio-economic dynamics. These scenarios were further evaluated against Water Sustainability and Reliability Indexes to provide a comprehensive assessment. The outcomes of this study underscore that the conventional “business-as-usual” approach to water resource management can ensure a sustainable balance between water supply and demand for a limited span of 32 years, with the most optimistic scenario extending this sustainability horizon to 50 years. Furthermore, groundwater conservation strategies were integrated and simulated, accentuating the imperative to preserve groundwater resources as an indispensable "backstop" for the nation.

The developed model not only addresses Qatar's specific challenges but also offers insights applicable to other Gulf Cooperation Council (GCC) countries and similar arid regions. This research contributes a robust decision-making tool for policymakers and stakeholders to assess the long-term implications of various management scenarios. It contributes to the development of sustainable and resilient water policies for the years to come, particularly in navigating the uncertainties inherent in arid region water resource management.

How to cite: Elomri, A., Aloui, S., Zghibi, A., and Mazzoni, A.: System Dynamics Modeling for Resilient Water Resource Management in Arid Regions, EGU General Assembly 2024, Vienna, Austria, 14–19 Apr 2024, EGU24-5064, https://doi.org/10.5194/egusphere-egu24-5064, 2024.

EGU24-5137 | Posters on site | HS5.1.1

Measures to Reflect the Climate Change Uncertainties in Water Resources Plans in South Korea 

Moonhwan Lee, Seung Beom Seo, Iljoo Yang, and Jongho Ahn

The climate change impact assessment of the water resources in Korea has been carried out in many research projects and researchers for a long time, but there are no cases in which climate change impacts are reflected in water resources plan due to a variety of reasons. According to Article 27 of the Framework Act on Water Management in Korea, it is required to formulate a Master Plan for National Water Management including measures to respond to the vulnerabilities of water management to climate change, but there is a limit to reflecting climate change effects. In addition, the Board of Audit and Inspection in Korea pointed it out and demanded improvement measures. Various barriers that make it difficult to reflect climate change in water resources plan are climate change uncertainties, insufficient evidence, and limited cost-benefit analysis and so on. For these reasons, this study aims to derive technical and institutional limitations for establishing a water resources plan in consideration of climate change, and to establish a system that can formulate plans to reflect the climate change uncertainties. This study proposes short- and long-term improved measures to establish a water use plan in consideration of climate change such as 1) production and standardization of climate change scenario with multi-model ensemble for water sector applications, 2) preparation of a framework for analyzing water supply and demand considering climate change, 3) publication of national report for climate change impact and risk assessment on water resources, and 4) development of standard guidelines for water resources planning considering climate change. The details of these parts will be shown at the presentation.

[Acknowledgements]

This study was supported by grants through the project (2022003570007) of developing environmental technologies responding to a new climate regime funded by the Ministry of Environment and the project (WO2023-11) funded by Korea Environement Institute.

How to cite: Lee, M., Seo, S. B., Yang, I., and Ahn, J.: Measures to Reflect the Climate Change Uncertainties in Water Resources Plans in South Korea, EGU General Assembly 2024, Vienna, Austria, 14–19 Apr 2024, EGU24-5137, https://doi.org/10.5194/egusphere-egu24-5137, 2024.

EGU24-5414 | ECS | Orals | HS5.1.1

Socio-ecological systems modeling on water resources management under uncertainty: A literature review.  

Héctor González-López, Tim Foster, Laura Gil-García, Giuliano Di Baldassarre, Manuel Pulido-Velazquez, Jaroslav Mysiak, and C. Dionisio Pérez-Blanco

Scientists and decision-makers globally confront systemic challenges posed by the intertwining issues of water scarcity and climate change. These challenges give rise to cascading impacts across ecological and socioeconomic systems, often exacerbated by feedback loops and unforeseeable consequences (UNDRR, 2021). As non-linear changes loom, the reliance on consolidative modeling becomes dangerous, risking the activation of disastrous tipping points with severe implications for both nature and humans (Kreibich et al., 2022). The costs associated with neglecting uncertainties in modeling and policy spans diverse domains, including ecosystems, income, employment, capital value, insurance, etc. (UNDRR, 2022; Parrado et al., 2019; Adamson and Loch, 2021). This aligns with the concept of Knightian or deep uncertainty, where the external context, system dynamics, and conflicting outcomes are not fully known or agreed upon (Knight, 1921; Marchau et al., 2019; Lempert et al., 2006). A growing scientific and policy consensus emphasizes the need to move beyond traditional notions of optimality and deterministic prediction in conditions of deep uncertainty. Resilience and robustness emerge as crucial concepts, requiring the development of socio-ecological system (SES) models that explicitly quantify uncertainties (Adamson and Loch, 2021; Di Baldassarre et al., 2016; IPCC, 2021; UNDRR, 2021).

Recent research in SES, including coupled human and natural systems and socio-hydrology science, offers innovative modeling techniques integrating human and natural components. These techniques account for feedbacks and heterogeneity between systems, improving insight and the ability to predict tipping points (Gain et al., 2021). Recent studies demonstrate the potential of linking coupled models of human-water systems with sensitivity analysis and multi-system ensembles for robust water management policies (Basheer et al., 2023; Smith et al., 2021).

This review initially identified 2160 papers, filtering them to 198 studies that account quantitatively modelling in, both human and water systems. The geographical focus spans the USA, Europe, Australia, the Middle East, South America, China, and East Africa. The models range from piecewise equations to full-fledged representations. However, structural uncertainties are seldom explored, with only 3.5% of studies conducting multi-model ensemble experiments. This highlights a significant oversight in recognizing biases from simplifications. Conversely, parameter uncertainties are more frequently addressed (20.2%), focusing on hydrology, groundwater, behavioral, infrastructure, climatic, economic, and agronomic variables. Input uncertainties, notably contemporary (discharge data) and future (climate change) inputs, are extensively studied (148 out of 198), employing methods like expert judgment and Monte Carlo simulations. Despite this, the review highlights a limited exploration of structural uncertainties and the potential inadequacy of linear piecewise equations, emphasizing the need for more nuanced and robust approaches to enhance the accuracy and reliability of socio-environmental systems modeling.

Based on this study, we make the following recommendations to mainstream uncertainty quantification into SES modeling: (i) Quantify parameter and structural uncertainties within systems, (ii) Quantify structural uncertainties between models, (iii) Input uncertainties must be more thoroughly assessed and model assumptions systematically revised, (iv) Deliver actionable science that mainstreams uncertainty quantification into decision making, (v) Establish balanced stakeholder engagement and clear and transparent science-policy engagement rules, (vi) Balance complexity and usefulness to keep the model relevant.

How to cite: González-López, H., Foster, T., Gil-García, L., Di Baldassarre, G., Pulido-Velazquez, M., Mysiak, J., and Pérez-Blanco, C. D.: Socio-ecological systems modeling on water resources management under uncertainty: A literature review. , EGU General Assembly 2024, Vienna, Austria, 14–19 Apr 2024, EGU24-5414, https://doi.org/10.5194/egusphere-egu24-5414, 2024.

EGU24-6023 | Posters on site | HS5.1.1

Breathing cities: improving water quality in urban channels by controlling tidal flows, an idea for Ho Chi Minh City 

Marco Toffolon, Francesco Casadio, Nguyen Xuan Quang Chau, Ngoc Hoang Giang Ngo, and Matteo Aimini

Coastal cities are constantly facing new challenges in their relationship with the accelerated sea level rise associated with global warming, and with the quality of the water that flows in their urban canals. Indeed, some of the largest conurbations are innervated by a network of channels, which serve many purposes and provide preferential pathways for water exchange, but also make them prone to flooding. Flows periodically change their direction due to the tidal cycle, letting the fluxes of water, heat, and contaminants, enter and leave the city, like the breath of a living body. However, the presence of these channels is also a major threat of flood risk propagation, and in some cases motivated the construction of tidal gates to protect the city from high water levels. Ho Chi Minh City (HCMC) is an example where this strategy is progressively being applied.

In this work, we discuss how the existence of tidal gates for flood protection may be exploited to control the tidal flows in the urban canals with the aim of improving water quality. Interestingly, the channel network in HCMC is characterized by several closed loops, where the periodic “breathing” is not efficient to renew the water in the central branches of the network because the water tends to enter and leave the system synchronously at the two ends of the loop, dictated by the water levels at the two connecting sections in the estuary, where tide propagation is typically fast so that the levels are similar. Therefore, we propose to exploit the gates not only to protect the city from high tides, but also to induce a prevalent unidirectional flow in the closed loops by alternately opening and closing the gates according to the difference in water levels between the channels and the estuary. Careful management can promote the removal of pollutants with beneficial effects on water quality, and potentially contribute to the transport of sediments, thus reducing the need for dredging. We demonstrate how the system can work by means of hydrodynamic modelling, first considering an idealized closed loop and then extending the simulation to a realistic model of the HCMC channel network.

How to cite: Toffolon, M., Casadio, F., Chau, N. X. Q., Ngo, N. H. G., and Aimini, M.: Breathing cities: improving water quality in urban channels by controlling tidal flows, an idea for Ho Chi Minh City, EGU General Assembly 2024, Vienna, Austria, 14–19 Apr 2024, EGU24-6023, https://doi.org/10.5194/egusphere-egu24-6023, 2024.

EGU24-6125 | ECS | Orals | HS5.1.1

Parametric insurance for hydropower: Comparing alternative schemes combining hydrologic and market data 

Lorenzo Scarpellini, Andrea Ficchì, Matteo Giuliani, and Andrea Castelletti

The alteration in hydrological patterns due to climate change is causing a rise in the occurrence and severity of hydrological extremes like droughts and floods. This, in turn, is leading to conflicts over water resources and increasing financial risk for several economic sectors, such as hydropower and agriculture.
Parametric insurance is a tool for hedging financial risks that is already used for making water-related sectors more resilient. With respect to traditional loss-based insurance, parametric schemes are more flexible, simple and cost-effective, and they also minimize moral hazard and promote further adaptation efforts.
Parametric schemes rely on the definition of an index, correlated with revenue losses, and on predetermined thresholds to trigger payouts compensating for losses. Different conditions can be proposed to contract buyers, varying the payout structure, contract price (i.e., premium) and duration. For example, while in standard index-based insurance, a fixed premium is paid on an annual basis, in ‘collar’ contracts a premium is only paid in years when the index exceeds a pay-off threshold, i.e., when revenues are high. Indexes can also be designed in a variety of ways, but they should be highly correlated with losses, reliable and transparent. While simple indexes based on a hydrological variable are often preferred, multivariate indexes can, in some cases, be more suitable due to the multiple factors influencing revenue losses. This is the case for the hydropower sector, which is highly dependent on both hydrological and market variability. Different parametric insurance contract types have been proposed in the past for various sectors, but alternative schemes are seldom compared on the same system. 

In this study, we investigate the mitigation of economic impacts deriving from droughts and energy market variability on hydropower companies by comparing alternative parametric insurance schemes. Such alternatives are built considering a variety of payout structures, including standard and collar schemes, and both univariate and multivariate indexes based on hydro-meteorological and market variables. We test our methodology on three hydropower operators in the Lake Como system, in the Italian Alps, an area where global warming has caused local temperatures to increase more than double the global average and stakeholders are increasingly exposed to drought risk.
Results show that the use of a multivariate index explicitly considering electricity prices greatly increases performance compared to a simpler univariate hydrological index. In addition, while both standard and collar contracts can effectively reduce revenue variability and improve revenue floor, the collar contract can provide better performance at a lower price. However, such more complex contracts are more sensitive to parameter values and their calibration should be performed carefully.

How to cite: Scarpellini, L., Ficchì, A., Giuliani, M., and Castelletti, A.: Parametric insurance for hydropower: Comparing alternative schemes combining hydrologic and market data, EGU General Assembly 2024, Vienna, Austria, 14–19 Apr 2024, EGU24-6125, https://doi.org/10.5194/egusphere-egu24-6125, 2024.

EGU24-6421 | ECS | Orals | HS5.1.1

Novel Use of Integrated Water System Model for Decision-Making Processes at Different Scales 

Ziyan Zhang, Eduardo Rico Carranza, and Ana Mijic

The increasing population and new urban developments have posed challenges to urban water management, such as domestic water scarcity and deteriorated water quality.  Meanwhile, the existing development planning frameworks fail to facilitate an effective approach to enhance an efficient and sustainable urban water design. They tend to isolate groups and evidence by relying on different independent models. The state-of-the-art Water Systems Integrated Modelling framework (WSIMOD), which simulates the terrestrial water cycle integrally including physical and human processes, has been developed to provide holistic and integrated evidence to help with decision-making processes. The WSIMOD model has been previously implemented at the river sub-catchment resolution, while a complete decision-making process usually involves different groups, such as city authorities, water companies and environmental regulators, with multiple objectives at multiple spatial resolutions. In the current work, we propose the novel use of the model for multi-resolution simulations (local, borough and river sub-catchment), and aim to help multi-stakeholders and decision-makers understand potential challenges to achieving multi-objectives in a coordinated way. We will also explore the effectiveness of measures to offset urban water issues induced by new developments in the current and future scenarios. Our work can provide insight into efficient and sustainable urban water management strategies for multi-stakeholder planning and future adaptation under uncertainty.

How to cite: Zhang, Z., Rico Carranza, E., and Mijic, A.: Novel Use of Integrated Water System Model for Decision-Making Processes at Different Scales, EGU General Assembly 2024, Vienna, Austria, 14–19 Apr 2024, EGU24-6421, https://doi.org/10.5194/egusphere-egu24-6421, 2024.

EGU24-7221 | Orals | HS5.1.1

Sustainable Planning of Water and Land Resources in the Munneru River Basin, India 

Eswar Sai Buri, Venkata Reddy Keesara, and Loukika Kotapati Narayanaswamy

Water, a vital resource, plays a crucial role in supporting human health, ensuring food security, enabling energy production, and sustaining ecosystem services. However, water deficit is the main concern for developing countries caused by a number of factors including finite water supplies, increase in population, and climate change. A sustainable approach to manage the water resources is the optimal distribution of available resources, which recognizes the complex relationships between water systems and the effects they have on the environment, society and economy. In this study, the optimal allocation of land and water resources is carried out across five different sectors such as domestic, agriculture, livestock, industrial, and ecological in an annual time step. Munneru basin is selected as a study area which comes under lower region of the Krishna River Basin, India. Soil and Water Assessment Tool (SWAT) is used to calculate the water availability. Furthermore, for each administrative unit within the basin, the irrigation water requirements for crops are calculated using the CROPWAT tool. Study incorporates objective functions that take into account both social and economic factors. The multi-objective optimisation function maximizes the usage of water and land resources and optimize benefits from the agricultural sector. To achieve these goals, the Non-dominated Sorted Genetic Algorithm (NSGA-II) is used. Additionally, multi-criteria decision-making technique, such as Technique for Order of Preference by Similarity to Ideal Solution (TOPSIS) is used to identify better solutions among the Pareto optimal solutions generated by the NSGA-II. Through the application of advanced optimisation algorithms and decision-making techniques, this study aims to contribute valuable insights to the field of water resource management in India. As this approach represents a crucial tool for sustainable development at the basin level, it provides a solid foundation for further extension to other basins across the globe. Furthermore, this work offers the potential for future research into the impacts of climate change and land use/land cover changes on water allocation over various timeframes, without compromising benefits from agriculture sector.

How to cite: Buri, E. S., Keesara, V. R., and Kotapati Narayanaswamy, L.: Sustainable Planning of Water and Land Resources in the Munneru River Basin, India, EGU General Assembly 2024, Vienna, Austria, 14–19 Apr 2024, EGU24-7221, https://doi.org/10.5194/egusphere-egu24-7221, 2024.

EGU24-8816 | ECS | Posters on site | HS5.1.1

A graph-based exposure representation of elemental failures in alpine water distribution networks  

Rahul Satish, Martin Oberascher, and Robert Sitzenfrei

A continuous and reliable drinking water supply is crucial for the social well-being and economic growth of an area. Therefore, water distribution networks (WDNs) are a critical component of the urban infrastructure, ensuring the delivery of potable water to users. However, these systems are vulnerable to loss of function and reliability when confronted with failure scenarios. Crises scenarios like cyber-physical attacks or contamination, pandemic with changes in consumption due to social distancing regulations, uncoordinated withdrawal of drinking water for storage purposes or loss of knowledge due to personnel changes could have an impact on WDN resilience. These disturbances can strain the physical elements, affecting both water quantity and quality. However, the exposure of various elements to diverse disturbances is multifaceted. Understanding the interplay between failure scenarios and potentially affected elements within the network is crucial for improving the resilience of the WDN. To further enhance the understanding between these dependencies, this work links specific failure scenarios with their corresponding impacted elements in an exposure matrix and highlights the varying importance of these elements in the WDN by a hierarchical graphical structure.

The research consists of two phases. The first phase encompasses the identification of classical and emerging failure scenarios through a literature review. Thereby, 29 failure scenarios are categorized into 7 groups (water infrastructural failure, natural hazards, contamination, pandemic, attacks, other infrastructure/elemental/factor failures, and digital disruptions). Additionally, WDN elements are defined using a literature review and expert input for the field of water distribution.

In the second phase, investigation and documentation of WDN elements affected by these failure scenarios, specifically for Alpine WDNs, are conducted. Information is gathered through literature review and workshops with experts in the field. The outcomes are organized into three exposure matrices based on failure types (physical elements, quality, and quantity) resulting from failure scenarios affecting the WDN. For instance, during a river flood, diverse network elements such as ground-water wells, water treatment plants, pipes, valves, pumps, and hydrants may be adversely impacted, influencing both water quality and quantity in the WDN. Elevation tanks and springs remain impervious to river floods due to their elevated positioning, preventing floodwaters from reaching these structures and ensuring their resilience against the event. Finally, the exposure-matrix is a graphical representation that illustrates the relationships between different elements in a system and their vulnerabilities to various failure scenarios. A network graph is used to visually represent the exposure-matrix in a topological hierarchy. The results can offer guidance for WDN operators in risk assessments, providing an exposure matrix to anticipate potential elemental failures during disasters, thereby proactively setting action and enhancing the overall resilience of the WDN.

Funding: The project “RESIST” is funded by the Austrian security research programme KIRAS of the Federal Ministry of Finance (BMF).

How to cite: Satish, R., Oberascher, M., and Sitzenfrei, R.: A graph-based exposure representation of elemental failures in alpine water distribution networks , EGU General Assembly 2024, Vienna, Austria, 14–19 Apr 2024, EGU24-8816, https://doi.org/10.5194/egusphere-egu24-8816, 2024.

EGU24-9445 | ECS | Orals | HS5.1.1

Advancing Small Hydropower Design: A Novel Framework for Robust and Sustainable Solutions 

Veysel Yildiz, Solomon Brown, and Charles Rougé

Small hydropower plants (SHPs) present an eco-friendly and economically viable alternative to conventional dam-based plants. With only 36% of their worldwide capacity currently tapped, there is potential for substantial global expansion including in industrialised nations. Most SHPs follow run-of-the-river (RoR) scheme, depending on the fluctuating flow of rivers because of their negligible storage capacity. They are deployed in a world characterised by a changing hydro-climate and unpredictable socio-economic evolutions. Due to their inability to regulate  discharge fluctuations as well as their dependency on selling energy at higher rates, these plants are significantly vulnerable to these changes. Design alternatives  are generated through traditional approaches relying on cost-benefit analysis that use past hydroclimatic conditions and disregard operational considerations, without assessing investment robustness in the face of changes. What is more, optimization and robustness analysis of these systems typically require a significant amount of computing time and resources necessitating high performance computing.

We introduce a new framework for robust hydropower system design to address these issues. This framework uses and extends HYPER, a state-of-the-art toolbox that computes technical performance, energy production, maintenance and operational costs of a design.  It combines HYPER with many-objective robust decision making (MORDM) to define robust alternatives.   Our implementation involves a systematic four-step process: (1) Introducing a two-objective formulation to identify design parameters balancing cost and revenue. (2) Creating alternative futures by sampling deeply uncertain factors, encompassing socio-economic (electricity prices, interest rate,  cost overrun) and hydroclimatic factors (median, coefficient of variation, the 1st percentile of flows). These streamflow statistics are then transformed into flow duration curves using an innovative approach. (3) Robustness quantification of alternative designs using two newly introduced financial robustness metrics based on the probability of making the plant financially viable. (4) Identify the most critical parameters influencing robustness through sensitivity analysis and scenario discovery.  We then employ a computationally efficient approximation approach to streamline resource-intensive steps  in optimisation and robustness analysis.

Results indicate that employing the MORDM approach in the design of RoR hydropower plants offers valuable insights into the trade-offs between cost and revenue, while supporting design with a range of viable alternatives aiding in the determination of the most robust and reliable design. Maximising the benefit cost ratio yields more robust and financially viable solutions than maximising NPV, as it leads to less costly designs that generate slightly less revenue on average but tend to better exploit low flows. Traditional design approaches employing identical turbine configurations and focusing on NPV maximisation, have proven to be less effective when compared to designs incorporating non-identical turbines. Moreover, such designs have demonstrated greater vulnerability to climate change, primarily attributable to their less flexible configuration. 

Combined optimization and robustness analysis of a RoR design, initially taking 120 hours, is also made computationally inexpensive through a novel method involving strategic data input reduction. This innovation resulted in a significant 95% reduction in processing time, while maintaining nearly identical outcomes in both steps. An open-source Python version of this methodology is scheduled to be available by July 2024.

How to cite: Yildiz, V., Brown, S., and Rougé, C.: Advancing Small Hydropower Design: A Novel Framework for Robust and Sustainable Solutions, EGU General Assembly 2024, Vienna, Austria, 14–19 Apr 2024, EGU24-9445, https://doi.org/10.5194/egusphere-egu24-9445, 2024.

EGU24-10180 | ECS | Orals | HS5.1.1

Assessing the Effect of Droughts on Complex Multi-sector Water Systems 

Matteo Sangiorgio, Marta Zaniolo, Matteo Giuliani, and Andrea Castelletti

In recent years, climate change has significantly intensified the frequency and severity of drought events. Rising temperatures, altered precipitation patterns, and changing weather dynamics have led to more prolonged and intense droughts altering water availability and exacerbating tradeoffs, especially in complex multi-sector water systems.

An archetypal example of this situation is the Lake Como water system, in the north of Italy. Lake Como is operated to provide water downstream to the agricultural sector, control floods on the lake shores, and contrast low water levels that would negatively impact navigation and aquatic ecosystems. The conflict between the interests of these sectors is expected to exacerbate in the years to come due to the evolving hydroclimatic regimes. Among different adaptation options considered by the regional authority, we investigate the potential expansion of the lake's active storage capacity enabled by the recent construction of flood mobile dykes.

Here, we contribute a framework for evaluating the impact of droughts on multiple water users. Specifically, we adopt a synthetic weather generator to create multiple streamflow ensembles (scenarios) controlling the drought’s frequency, duration, and intensity. Drought features are then linked to impacts (e.g., agricultural deficit) using a simulation model of the lake. Failure thresholds are defined for each impact indicator to set the minimum level of performance acceptable to each sector. Finally, a logistic classifier is used to identify the combination of drought features leading to a system failure.

Our results show that system failures can be accurately estimated using a linear combination of drought frequency, duration, and intensity. The combined effect of these three characteristics, rather than the extreme values of one of them, is responsible for system failure. Our analysis also proves that storage expansion is fundamental to reduce the downstream deficit, as well as to prevent most of the flood events.

How to cite: Sangiorgio, M., Zaniolo, M., Giuliani, M., and Castelletti, A.: Assessing the Effect of Droughts on Complex Multi-sector Water Systems, EGU General Assembly 2024, Vienna, Austria, 14–19 Apr 2024, EGU24-10180, https://doi.org/10.5194/egusphere-egu24-10180, 2024.

EGU24-11286 | ECS | Posters on site | HS5.1.1

A real options-based decision-making framework for hydraulic infrastructure investments 

Hamidreza Rezazadehkhorasani and Amaury Tilmant

Planning hydraulic infrastructure is challenging as it requires the careful consideration of many uncertain factors, such as the evolution of future demands and supplies. The deep uncertainty attached to climate change makes traditional planning approaches based on well-characterized statistical distributions ill-suited. This has led to the emergence of a new paradigm, "prepare and adapt," which focuses on developing robust and adaptive systems that can perform well under a wide range of futures. This research presents a framework for planning new water resources infrastructure (e.g., reservoirs, hydropower plants) based on real options, deep uncertainty, and temporal multicriteria analysis (TMCA). The real option component essentially handles the issues associated with the timing, sequencing, sizing, and operating of those infrastructures. The deep uncertainty that characterizes future hydroclimatic conditions is captured by a large ensemble of GCM-based hydrologic projections. Finally, TMCA allows us to compare and rank the options with respect to several criteria reflecting the different water uses (e.g., irrigated agriculture, hydropower generation, navigation, fisheries, flood recession agriculture, municipal and industrial water supply) in a dynamically changing environment induced by both climate change and the options. The framework is applied to the Senegal River Basin (SRB) in West Africa. The SRB is a complex system with several planned hydropower projects and irrigation schemes, making it ideal for testing the proposed framework. The results identify development pathways associated with different tradeoffs between risk and reward.  The framework also helps decision-makers understand the distributional effects of these development pathways on society.

How to cite: Rezazadehkhorasani, H. and Tilmant, A.: A real options-based decision-making framework for hydraulic infrastructure investments, EGU General Assembly 2024, Vienna, Austria, 14–19 Apr 2024, EGU24-11286, https://doi.org/10.5194/egusphere-egu24-11286, 2024.

EGU24-11849 | ECS | Posters on site | HS5.1.1

A Comparative Analysis of Economic Instruments for Water Management across Europe 

Adria Rubio-Martin, Eulalia Gomez-Martin, Erik Ansink, Leon Bremer, Lilian Tavernier, Juan-Pablo Henao, Roberto Villalba, Ema Lazorcakova, Miroslava Rajcaniova, Solene Fovelle, Clemence Gracia, Aaron Cutajar, Mattia Monaco, Hector Macian-Sorribes, Manuel Pulido-Velazquez, Pietro Sala, and Maria Vrachioli

The RETOUCH NEXUS project aims to create and improve strategies of managing water, energy, food and ecosystems (WEFE nexus) together that are innovative, fair and operative. The objective of these strategies, which include smart water governance schemes, economic instruments, and refined institutional frameworks, is to ensure water availability within the European Union (EU) amid a range of future challenging scenarios, including those induced by climate change.

Although economic instruments were highlighted as powerful measures to achieve sustainable water management by the EU Water Framework Directive, their practical application is still challenging and mostly depends on national and regional setups and legislative frameworks. In this contribution, we have developed a review of economic, financial and business instruments that have been used or proposed for the water sector in Europe. This analysis extends to an assessment of the effectiveness, efficiency, and replicability of these instruments. The foundation for our study is a thorough review of existing literature, data repositories, and case studies, coupled with extensive consultations with key stakeholders in the domain. We have identified the main drivers, barriers and opportunities for the implementation of these instruments, and analysed their impacts on water valuation, risk management, investment leverage and system sustainability. The aim is to explore the potential for transferring and adapting these instruments to different contexts and scales, taking into account the nexus perspective on water, energy and food security.

The results, delivered as factsheets, provide a landscape of recommendations for policy makers, water managers and practitioners on how to design and apply these instruments in a coherent and integrated way. These factsheets serve also as a valuable resource for educators by translating complex economic instruments into accessible information, enhancing public comprehension of the strategies proposed in the RETOUCH NEXUS project and their previous application. Ultimately, by providing insights into potential avenues for transferring and adapting these instruments to diverse contexts and scales, we contribute to the creation of a versatile toolkit for sustainable resource management.

Our research within the RETOUCH NEXUS project contributes to the academic discourse by offering a detailed exploration of economic, financial, and business instruments in the water sector, while also offering a resource for educators and policy makers to enhance the broader public understating of these instruments. By bridging the gap between theory and practice, we aim to empower decision-makers with the knowledge required to navigate the complexities of resource management, ensuring resilience in the face of evolving challenges for the WEFE nexus. Through our analysis and actionable recommendations, we aspire to catalyze positive transformations in water governance and resource sustainability within the EU and beyond.

Acknowledgements:

This study has received funding from the RETOUCH NEXUS project (grant agreement No. 101086522), under the European Union’s Horizon Europe research and innovation programme.

How to cite: Rubio-Martin, A., Gomez-Martin, E., Ansink, E., Bremer, L., Tavernier, L., Henao, J.-P., Villalba, R., Lazorcakova, E., Rajcaniova, M., Fovelle, S., Gracia, C., Cutajar, A., Monaco, M., Macian-Sorribes, H., Pulido-Velazquez, M., Sala, P., and Vrachioli, M.: A Comparative Analysis of Economic Instruments for Water Management across Europe, EGU General Assembly 2024, Vienna, Austria, 14–19 Apr 2024, EGU24-11849, https://doi.org/10.5194/egusphere-egu24-11849, 2024.

EGU24-12035 | ECS | Orals | HS5.1.1

Managing Urban Water Supplies under Future Uncertainties: A Case Study of Bengaluru, India 

Snigdha Sarita Mohapatra, Meenakshi Arora, Wenyan Wu, and Manoj Kumar Tiwari

The future uncertainties, spanning both climatic (e.g., precipitation) and non-climatic (e.g., population growth) factors, will significantly impact urban water demands and supplies. To enhance future water security in urban areas, the Integrated Urban Water Management (IUWM) approach has gained popularity globally. The IUWM approach emphasizes a varied water supply source, addresses multiple sustainability objectives, and ensures the provision of fit-for-purpose water. This study uses an Integrated Urban Water Balance Model (IUWBM), developed in eWater Source platform version 5.10.0.11841, which utilizes different types of water (i.e., river water, groundwater, harvested stormwater, rooftop rainwater, and recycled wastewater) to meet future water needs. However, depending on how much water each source supplies, combining different water sources to meet the demand may result in trade-offs with the integrated urban water system's total cost and energy consumption. Given the future uncertainties, it is crucial to develop robust optimal water mix solutions that are minimal in total costs and total energy consumption across various future scenarios. This study proposes to address this challenge, focusing on Bengaluru (i.e., a city in India) as a case study due to its relevance to the identified issues. The IUWBM is linked to an optimization tool (i.e., Insight Version 5.10.0.11841, which uses the NSGA-II algorithm). Three robustness metrics—Laplace Principle of Insufficient Reasons, Hurwicz Optimistic-Pessimistic Rule, and Signal-to-Noise Ratio—are added to a multi-scenario, multi-objective optimization problem to make the decision-making more robust. All optimal solutions generated adhere to constraints, maintaining an average volumetric and time reliability of water supply above 99.50% for the study area. The findings reveal that low-cost optimal water mix solutions tend to exhibit higher energy consumption as they prioritize savings in the capital costs of building the new water supply infrastructure. Capital costs, therefore, significantly impact the total costs, while operating energy plays a crucial role in total energy consumption in Bengaluru urban water supplies. The present research also found that harvested stormwater and recycled wastewater emerge as potentially low-cost, low-energy, and reliable sources for potable and non-potable water, respectively, under future uncertainties. Additionally, recycled wastewater is preferable for non-potable uses as it offers the added benefit of mitigating adverse environmental impacts on Bengaluru's valleys and lakes.

How to cite: Mohapatra, S. S., Arora, M., Wu, W., and Tiwari, M. K.: Managing Urban Water Supplies under Future Uncertainties: A Case Study of Bengaluru, India, EGU General Assembly 2024, Vienna, Austria, 14–19 Apr 2024, EGU24-12035, https://doi.org/10.5194/egusphere-egu24-12035, 2024.

Flooding is a regularly recurring event and causes major damage worldwide every year. Due to urbanization and the associated sealing of land, more and more retention areas are being lost, which, in conjunction with the effects of climate change, further increases flooding in urban areas. In addition, settlement development worldwide, including in Germany and Vietnam, is partly taking place in floodplains, which poses a major threat to the health of the population and causes high reconstruction costs in both countries. However, economic development continues to be given higher priority than flood protection. Severe flood events in the recent past in both countries, accompanied by large losses of lives and asset values, show that current strategies are reaching their limits and new approaches are needed.        
      Based on a GIS analysis, this study derives and compares the legal bases and strategies of both countries, which represents a new scientific approach. The results show that both countries still have some hurdles to overcome on the way to integrated flood risk management and can learn a lot from each other. For example, Vietnam can make use of some aspects of the legal framework in Germany. In addition to addressing flood risk through the creation of comprehensive flood hazard and risk maps (§74 WHG) and the preservation of natural retention areas (§67 WHG), the dismantling of "top-down" mechanisms through the early involvement of the population in planning processes (§3 Para. 1 BauGB) is also a high priority for the country. In another direction, however, Germany can also take up some aspects of the Vietnamese principles. For example, in addition to a much closer link between disaster control and meteorological services (Art. 7 in conjunction with Art. 24 and Art. 42 No. 3c of the Law on Natural Disaster Prevention and Control) and the participation of the population or the consideration of traditional experiences in the creation of flood hazard maps (Art. 1 Para. 1 No. 6 National Strategy for Disaster Prevention, Response, and Mitigation), raising awareness and creating a positive risk perception among the population (Art. 21 No. 3c Law on Natural Disaster Prevention and Control) as well as smart city approaches can also represent an important extension of their own strategy. Both countries should pay particular attention to the protection of their ecosystems, which make an important contribution to integrated flood risk management. The here presented work shows that Vietnam and Germany face similar challenges and would benefit from drawing on each other's experience. Despite the different climatic and political conditions, both countries could expand their strategy through co-development and establish a sustainable flood risk management.         

How to cite: Gocht, C.: Institutional approaches to flood risk management in Vietnam and Germany - a comparison, EGU General Assembly 2024, Vienna, Austria, 14–19 Apr 2024, EGU24-12224, https://doi.org/10.5194/egusphere-egu24-12224, 2024.

EGU24-12328 | ECS | Posters on site | HS5.1.1

Optimal trade-off for operation of multi-purpose reservoir in the dry season 

Hai Yen Nguyen, Le An Ngo, Le Long Ngo, Tewelde Hagos Gebremadhin, Marco Peli, Ivan Serina, and Roberto Ranzi

Several optimisation models have been applied for optimising reservoir operations throughout the past decades. However, due to the limitations of each approach, the complexity of the system, and the conflict of combining purposes, reservoir operation evaluation and improvement remain classical. In this study, we apply a Genetic Algorithm model to generate a trade-off curve that presents alternative optimal strategies for the Hoa Binh reservoir in Vietnam. The study focuses on two goals: downstream water demand in the Red River Delta (RRD) and hydropower production in the dry season. Even though water availability in RRD is projected to be more plentiful until the mid-century, drought duration and intensity are also expected to increase. Thus, developing effective operation rules during the dry season is crucial for water security and the regional economy. The findings indicate that an optimised regulation can be developed to close the imbalance between water supply and demand while maintaining a high rate of energy generation. The optimisation criteria will also preliminarily consider the impact of the sediment transport reduction induced by trapping sediments generated by reservoirs: the enhanced erosion capacity of more clear streamflow water causes scouring of the riverbed, thus requiring more water release to meet the irrigation demand at the intake of the irrigation channels. In the future, reservoir management policies might also need to integrate the geomorphological changes induced by climatic and anthropic factors.

How to cite: Nguyen, H. Y., Ngo, L. A., Ngo, L. L., Gebremadhin, T. H., Peli, M., Serina, I., and Ranzi, R.: Optimal trade-off for operation of multi-purpose reservoir in the dry season, EGU General Assembly 2024, Vienna, Austria, 14–19 Apr 2024, EGU24-12328, https://doi.org/10.5194/egusphere-egu24-12328, 2024.

EGU24-12549 | ECS | Posters on site | HS5.1.1

Opportunities and challenges of Ensemble Forecast and Cross-Validation for MOEA optimisation in water resources management 

Davide Spinelli, Matteo Giuliani, and Andrea Castelletti

The acceleration in the hydrological cycle and increased frequency and intensity of extreme events prompt a shift towards adaptive control strategies in water reservoir management. In this study, we explore the potential of improved hydro-meteorological forecast products, particularly those extending to longer time scales and incorporating uncertainty information through Ensemble Forecast (EF), to facilitate this transition.

In particular, we consider the problem of managing Lake Como, a regulated system with diverse objectives, including flood prevention, low-level avoidance, and meeting downstream agricultural and hydroelectric generation demands. The lake operation can be informed using short-term, locally calibrated deterministic forecasts as well as sub-seasonal/seasonal large-scale ensemble forecasts from the European Flood Awareness System (EFAS), a part of the Copernicus Emergency Management Service.

The lake regulation is determined by operating policies derived using the Evolutionary Multi-Objective Direct Policy Search method, resulting in Pareto optimal policies capable of integrating various forecasts as inputs. This approach is seamlessly integrated with our newly developed algorithm, PECAN (Parallel Ensemble foreCAst coNtrol), designed to harness uncertainty information within EF. Validation of these policies is crucial for determining their generalisation capabilities, and it is performed through Blocked K-Fold Cross-Validation.

In this study, we demonstrate the presence of overfitting during the optimisation process and present an early stopping rule designed to save computation time while learning robust policies. Additionally, we introduce a second rule to dynamically determine epsilon parameters for the ε-approximate Pareto front, particularly useful in the presence of diverse multi-year climatic conditions. Through the application of these rules, we show the importance of cross-validation, highlight the greater generalisation capabilities of PECAN, and present how PECAN enables EF at longer time ranges to be competitive against locally calibrated deterministic forecasts at shorter intervals.

How to cite: Spinelli, D., Giuliani, M., and Castelletti, A.: Opportunities and challenges of Ensemble Forecast and Cross-Validation for MOEA optimisation in water resources management, EGU General Assembly 2024, Vienna, Austria, 14–19 Apr 2024, EGU24-12549, https://doi.org/10.5194/egusphere-egu24-12549, 2024.

EGU24-14942 | ECS | Orals | HS5.1.1

EU engagement for sustainable water management in the Aral Sea basin 

Aliya Assubayeva and Jenniver Sehring

Integrated Water Resources Management (IWRM) stands as a globally advocated approach heralded for its promise to orchestrate equitable and coordinated water allocation, usage, and governance. However, its implementation varies significantly across different river basins and countries. Transboundary water resources management in the Aral Sea basin presents a critical environmental and political challenge in the region, bringing concerns not only to basin countries, including Kazakhstan, Kyrgyz Republic, Tajikistan, Turkmenistan, and Uzbekistan but also to external actors.  The European Union (EU) has emerged as a pivotal donor in developing sustainable water resource management since the early 1990s. The EU's involvement stems from recognizing water challenges as potential threats to regional security and stability and fosters diverse regional and bilateral water programs and projects. This study delved into the evolution of the EU policies concerning environment and water management in the Aral Sea basin, focusing on promoting IWRM, raising environmental awareness, and building capacities. Methodologically, the research employed semi-structured interviews conducted with national, regional, and international experts engaged in EU initiatives, along with a synthesis of academic publications, EU official documents, and recent reports. 

Research reveals the changes in EU water policy in Central Asia since the 2000s, including shifts in objectives, the scale of cooperation, and the interplay between EU policies and the perceptions, responses, and shaping by regional actors. The EU has successfully promoted certain norms of ‘good water governance,’ and Central Asian countries have, to a certain degree, adopted them in their policies and legal frameworks. However, The EU's reliance on soft tools and multi-stakeholder dialogues, limited financial commitments, coordination challenges, and local political constraints have constrained its impact on the ground. This situation has created a palpable sense of 'dialogue fatigue' among national stakeholders. The contextual disparities, divergent interests, and issues at stake between the EU and Central Asian countries pose significant obstacles to transferring EU experiences and practices. Central Asian actors' responses to EU water initiatives, amid the influence of the external and internal political environment, bear implications for sustainable water management. These implications are particularly pressing given the region's vulnerability to climate variability, the geopolitical landscape, and the countries' capacity to navigate multiple crises.

How to cite: Assubayeva, A. and Sehring, J.: EU engagement for sustainable water management in the Aral Sea basin, EGU General Assembly 2024, Vienna, Austria, 14–19 Apr 2024, EGU24-14942, https://doi.org/10.5194/egusphere-egu24-14942, 2024.

EGU24-14956 | ECS | Posters on site | HS5.1.1

The role of emergency management in times of water stress – The need for adaptation 

Danielle Carbon and Till Wenzel

Climate change threatens profoundly the quality and quantity of groundwater  resources. Extreme precipitation patterns and existing hydrospheric basins are likely to change. Today, in some regions a significant decline in surface and groundwater reservoirs can already be observed. Rather than solely relying on reactive adaptation measures during water scarcity emergencies, governments have the responsibility to develop proactive and preventative strategies through an effective emergency management.

However, some emergency measures such as the emergency drinking water supply or wildfire response require the permanent availability of regional surface and groundwater. Among other things, emergency drinking water management is mainly based on the extraction and treatment of surface water (e.g. mobile via tanker lorries) and groundwater (e.g. static via emergency wells).

The results of the NASA programme GRACE indicate that, in particular, regions where surface water has already declined significantly due to prolonged periods of drought tend to substitute groundwater. Concerns are raised that such substitution can further increase regional affectedness by further reducing the local water availability. 

In a comprehensive review of 79 documents dealing with the exemplary management of drinking water emergencies in Germany, it became clear that currently the synergy between emergency measures and water resources are not sufficiently reflected.

The study analysed publications by the German Technical and Scientific Association for Gas and Water (DVGW), the Federal Office for Civil Protection and Disaster Assistance (BBK), the Federal Agency for Technical Relief (THW), the fire and rescue services and the German Red Cross (DRK).

The main objective was to identify gaps in the emergency management strategies including questions such as: To what extent regional water shortage and the resulting specific challenges for emergency management are currently addressed? And in turn, which impacts arise from the emergency management for water resources?

The results reveal that existing strategies are not tailored to the specific conditions of water stressed regions, as they neither address the damage or failure of the intended emergency structure (e.g. drying out of emergency wells) nor the protection of local water resources through further water abstraction. As a conclusion, emergency management should be integrated into a more holistic water management in an interdisciplinary approach. In doing so, regional water stress can be mitigated while at the same time the emergency management remains effective in face of future need.

Further work will include an EU-wide survey on how different emergency stakeholders involved in water-intense disaster management consider cascading effects of their measures and what GIS-based tools might support their decision making.

How to cite: Carbon, D. and Wenzel, T.: The role of emergency management in times of water stress – The need for adaptation, EGU General Assembly 2024, Vienna, Austria, 14–19 Apr 2024, EGU24-14956, https://doi.org/10.5194/egusphere-egu24-14956, 2024.

Providing reservoirs with accurate forecasts is crucial for effective real-time flood control. This research focuses on the key role of forecasts in real-time flood management for reservoirs. A new approach was developed in this study, integrating a forecast-driven methodology to handle uncertainty in reservoir flood control operations. This involves a novel hybrid of two post-processing techniques: the Cloud model and error-based copula functions, together termed as the stochastic errors-based Cloud (SE-Cloud). Additionally, a multi-objective robust optimization model (MRO) was proposed, encompassing risk, resilience, and vulnerability, to address flood control challenges using ensemble forecasts. For comparative purposes, a two-objective stochastic optimization model (TSO) was also created, aiming to reduce both the highest expected reservoir level and peak discharge. The proposed methodology was applied to the Lishimen reservoir in the Shifeng River subbasin, China, aiming to comprehensively verify the relationships among deterministic forecasts, ensemble forecasts, and flood control performance. The main findings of this study are: (1) The SE-Cloud model was proved to be more efficient in predicting peak flow events and in representing uncertainties in forecasts, with an improvement in hypervolume values ranging from 13.14% to 39.65% over the Cloud model. (2) The MRO strategy resulted in a higher inflow release compared to the TSO, leading to a 0.05m reduction in the anticipated highest water level and a 4.29% increase in peak discharge. (3) With the resilience value downstream remaining constant, it was suggested that increasing upstream vulnerability by using the MRO strategy would not lead to a decrease in resilience. The findings highlight the potential of AI-based ensemble forecasts in augmenting flood control robustness.

How to cite: Guo, Y., Xu, Y.-P., Yu, X., Liu, L., and Gu, H.: AI-based ensemble flood forecasts and its implementation in multi-objective robust optimization operation for reservoir flood control, EGU General Assembly 2024, Vienna, Austria, 14–19 Apr 2024, EGU24-17021, https://doi.org/10.5194/egusphere-egu24-17021, 2024.

Human-water feedbacks have been increasingly studied in the last decades, motivating the foundation of new disciplines such as socio-hydrology and, in general, enhanced interest toward conceptualization and modelling of the spatial and temporal dynamics of human-water systems. With anthropogenic activities being widely recognized as a major driver of global change and the human population being increasingly exposed to hydroclimatic extreme events, human systems are now at the forefront of the water cycle. Yet, human preferences, behaviors, and decisions in relation to water systems - including water usage dynamics, adoption of precautionary measures against climate extremes, and adaptation of urban landscapes - are often modelled based on behavioral or economic theories, or derived from small-scale samples. This often leads to heterogeneous results, which are often case-specific, or lack validation against real-world observations.

The availability of increasingly fine-resolution data from distributed sensors and databases (e.g., water consumption data from intelligent meters, flood insurance adoption records at the household level, and socio-demographic data) and earth observations (e.g., aerial and satellite imagery) provides us with an empirical basis to model heterogeneous individual and societal behavioral patterns, along with their determinants.

In my research, I strive to develop multi-disciplinary data-driven behavioral modelling approaches that bridge hydrologic/hydraulic sciences, informatics, economics, and systems engineering and harness information from multi-scale human data and earth observations and the power of data analytics and machine learning to better understand, model, and characterize human behaviors in coupled human-water systems. In this talk, I will first provide an overview of recent advances in descriptive behavioral modelling in human-water systems, with a focus on household-to-continental scale modelling of residential water consumption patterns and adoption of household flood insurance. Second, I will elaborate on modelling challenges that are motivating ongoing research related to machine learning-based behavioral models, including model explainability, data and computational requirements, generalization and scalability, and the influence of data resolution in time and space. Finally, I will discuss how developing descriptive models that learn human behaviors retrospectively can be used to inform forecasting tasks and formulate policy-relevant recommendations to shape future societal adaptation to climate change. Implications span from informing the design of feedback-based digital user engagement in pursuit of water conservation, to fostering proactive climate adaptation, addressing societal inequalities and heterogeneous water access and affordability conditions, or evaluating incentive programs and policies for sustainable urban development.

How to cite: Cominola, A.: Learning from the past to shape the future. Harnessing multi-scale human data and earth observations to foster sustainable water usage and societal adaptation to climate change, EGU General Assembly 2024, Vienna, Austria, 14–19 Apr 2024, EGU24-19445, https://doi.org/10.5194/egusphere-egu24-19445, 2024.

EGU24-19631 | ECS | Orals | HS5.1.1

Latest advances and reflections on 10 years of open-source development and applications 

James Tomlinson and Julien Harou

Pywr is an open-source water resource system simulation model. It was created almost 10 years ago. Since that time it has been widely adopted in the UK water resources planning community and also used by several researchers around the world. The original design goals were to create a fast, free and extendable library that could handle running large datasets on complex real-world problems. Pywr’s speed has made it popular with researchers and practitioners simulating large water systems under uncertainty (where many future scenarios must be considered).

Here we present an extension, a new simulation approach that exploits modern CPU hardware and instructions. The new method simulates multiple scenarios in parallel using “single instruction, multiple data” (SIMD) techniques. We apply SIMD to a simple interior point method that is capable of solving multiple similar linear programs in parallel. We compare our method against a conventional non-SIMD linear program solver (CLP) and demonstrate that it can provide significant speed-ups for some water resource simulations. We benchmark this method using a GPU using 100s of thousands of scenarios. Our results demonstrate that by exploiting modern CPU features it is possible to achieve further speed-ups for water resource simulations. More efficient (faster) simulation allow practitioners to explore more scenarios, find more robust solutions and/or use more complex models. Some existing and on-going applications will be briefly introduced.

Finally, we reflect on the adoption and evolution of Pywr over the last 10 years, and look at its current usage in UK water resources planning. We explain how the advances above will help planners and developers alike, hopefully setting the foundation of Pywr for the next 10 years.


How to cite: Tomlinson, J. and Harou, J.: Latest advances and reflections on 10 years of open-source development and applications, EGU General Assembly 2024, Vienna, Austria, 14–19 Apr 2024, EGU24-19631, https://doi.org/10.5194/egusphere-egu24-19631, 2024.

The Republic of Moldova is prone to different kinds of natural hazards including drought, floods, severe weather, earthquakes, and landslides. Heavy rains result in frequent floods, to which a great part of the country's settled areas is exposed. The most recent severe floods occurred in 2010. Climate variability and change is likely to increase the frequency and intensity of natural disasters. A large proportion of the flood risk in Moldova occurs on the floodplains of the two main rivers (the Prut and the Nistru). There are systems of flood defence dykes on these rivers and on some of the tributaries. These provide flood protection but there is a concern about their condition. In order to promote measures to increase natural water retention by conserving and improving the water storage capacity of soils and ecosystems, recently, a list of non-structural measures with natural - based solutions (NBS) approach were included in some policy documents. The most important policy documents are Flood risk management plans and Management plans, approved by Government decisions: GD 562/2020 – for flood risk management plans, and respectively, GD 814/2017 for Management Plan for Nistru river basin district, Ist cycle and GD 444/2022 for Management Plan for Danube – Prut and Black Sea river basin district, IInd cycle. These strategic documents are developed at the river basin district level; the territory of the Republic of Moldova consists of 2 river basin districts – Nistru and Danube – Prut and Black Sea. In this paper in deep analysis of NBS measures from different policy documents is provided. 

How to cite: Dilan, V. and Capatina, L.: Nature based solutions integration in the flood risk management policy documents: the Republic of Moldova case., EGU General Assembly 2024, Vienna, Austria, 14–19 Apr 2024, EGU24-20154, https://doi.org/10.5194/egusphere-egu24-20154, 2024.

EGU24-20819 | ECS | Orals | HS5.1.1

Impact and drivers of informal water markets in irrigation regions in India 

Juliane Haensch, Yashree Mehta, and Bernhard Brümmer

Significant water supply-demand gaps are projected in many regions of India under current scenarios. The government is considering and implementing different measures to support a sustainable water resources management in irrigated agriculture, e.g. incentives to reduce water abstractions, decreasing energy subsidies, metering, effective water pricing or community-based water management. Also, informal water markets are widespread in India; however, their impacts are largely unknown and under-researched due to a paucity in related data. We analyse the development and determinants of farmers’ water purchasing behaviour and related expenditure using a large representative household survey for India over two years. In addition, we merged district level average statistics for precipitation, temperature and groundwater storage with the survey data. Modelling results show that, after accounting for several control variables, irrigation water purchases were more likely where groundwater levels were already low, farmers have a diversified access to water sources but no access to public piped drinking water supply. Particularly in groundwater irrigation areas, purchases were also more likely where: a) conflicts are prevalent within the village; b) families solve (water supply) conflicts individually; c) farmers are not members in a cooperative; and d) farmers have low confidence in State or village governments. Increased expenditure (INR/acre) for irrigation water was associated when purchasing mainly from private as compared to government tubewell owners. There is a need for future research to examine this dataset at local spatial scales and per different irrigation types. This is reflected in the different results for the state-specific models. Overall, results highlight the severity of the state of India’s groundwater resources, local community cohesion issues and the need for better regulation and monitoring in water management, e.g. with regards to informal water markets and agricultural subsidies, to better serve local farming communities and the environment. At the same time, different water-related policies need to take into account the effects of multiple implemented measures as well as the existence of informal water markets.

How to cite: Haensch, J., Mehta, Y., and Brümmer, B.: Impact and drivers of informal water markets in irrigation regions in India, EGU General Assembly 2024, Vienna, Austria, 14–19 Apr 2024, EGU24-20819, https://doi.org/10.5194/egusphere-egu24-20819, 2024.

This study employs advanced Geographical Information Systems (GIS) and Remote Sensing (RS) techniques to thoroughly analyze the impact of climate change-induced droughts in the Gimcheon watershed within the Nakdong River Basin, South Korea. Using sophisticated statistical models and up-to-date climate projections, our research uncovers a significant 20% reduction in average annual precipitation over the past decade, leading to a concerning 15% decrease in water availability within the watershed. By integrating hydrological modeling and GIS, we identify a troubling 25% increase in the frequency of drought-affected areas within the watershed. Our socio-economic analysis further highlights the seriousness of these trends, with an estimated 30% decline in agricultural productivity and a consequent 10% reduction in income for communities directly dependent on water-intensive farming practices. In response to these alarming findings, our study recommends an Integrated Water Resources Management (IWRM) strategy, utilizing GIS to pinpoint strategic locations for innovative water-use efficiency measures. Statistical analysis underscores a significant 20% gap in existing water management practices, emphasizing the urgent need for targeted interventions. Furthermore, the integration of GIS-driven early warning systems demonstrates an impressive 40% improvement in response times to impending drought events. This abstract, supported by robust statistical figures, emphasizes the urgency of adopting GIS-informed IWRM strategies to effectively address the profound impacts of climate change-induced droughts in the Gimcheon watershed, offering valuable insights for policymakers and water resource managers in the face of evolving climate challenges.


Acknowledgment : Research for this paper was carried out under the KICT Research Program (Development of IWRM-Korea Technical Convergence Platform Based on Digital New Deal) funded by the Ministry of Science and ICT.


How to cite: Talpur, Z., Eun Lee, J., Ahmed, M., and Chung, I.-M.: Assessing the Impact of Climate Change-Induced Droughts in the Gimcheon Watershed: A GIS and Remote Sensing Approach for Informed Water Resource Management, EGU General Assembly 2024, Vienna, Austria, 14–19 Apr 2024, EGU24-21453, https://doi.org/10.5194/egusphere-egu24-21453, 2024.

EGU24-21887 | Orals | HS5.1.1

Achieving Carbon Neutrality in the Water Sector: Unlocking Co-Benefits Between Climate Mitigation and Adaptation 

Haejin Han, Jun Song Kim, Kichul Jung, Jae-hoon Sung, Seongkyu Kang, Yeora Chae, and Yungjung Hyun

The UN disaster report highlights that 90% of disasters from 1995 to 2015 were a consequence of hydrometeorological changes. An analysis by the World Meteorological Organization revealed that water-related disasters, including droughts, heatwaves, typhoons, and floods, which are partly driven by climate change, caused extensive global property damage and loss of life. Despite concerted global efforts for net-zero carbon emissions, there is a noticeable lack of integration of water in decarbonization strategies.

Traditionally, the water sector's response to the climate crisis has primarily centered on establishing policies and systems for water management to adapt to vulnerability, rather than actively participating in greenhouse gas reduction (mitigation). This strategic preference is largely attributed to the absence of a distinct organizational classification for the water sector in the national greenhouse gas inventory, leading to an unclear identification of the sector's own emissions profile.

In light of these challenges, this study addresses the critical need for assessing greenhouse gas emissions within the water sector and advocates for the establishment and implementation of carbon-neutral policies tailored specifically to the sector's unique characteristics. By delving into these imperatives, the study seeks to bridge the gap between global climate efforts and the water sector, fostering a more comprehensive and sustainable approach to climate resilience and mitigation."

Within the study's scope, the organizational boundary of the water sector was meticulously delineated. It encompasses water supply, wastewater, and livestock manure treatment services, as well as water resources facilities such as dams, reservoirs, and river spaces. Comprehensive assessments were conducted to calculate greenhouse gas emissions and absorption within these boundaries. This nuanced approach aims to provide a detailed understanding of the carbon emissions associated with key components of the water sector.

Moreover, the study identifies and assesses potential trajectories for attaining carbon neutrality in the water sector through the development and examination of three distinct scenarios. The demand-led scenario prioritizes water efficiency, leakage management, adoption of a vegetarian diet, and achieving energy self-sufficiency. The technology-led scenario emphasizes innovative technologies and substantial financial investments, while the combined scenario integrates elements from both the demand-led and technology-led pathways, offering a nuanced and balanced approach.

In conclusion, this case study illuminates a promising trajectory toward achieving carbon neutrality in the water sector by 2050, particularly when adopting a mixed scenario that combines elements from the three outlined scenarios. The comprehensive insights garnered from this study contribute to a more sustainable, resilient, and low-carbon future, highlighting the integral role of the water sector in global climate objectives.

Additionally, the study concludes that efforts towards carbon neutrality in the water sector represent a policy direction that enhances the public benefits of adaptation and reduction strategies. By actively engaging in mitigation measures, the water sector not only contributes to climate goals but also enhances its adaptive capacity, creating a synergistic approach that maximizes positive outcomes for both the environment and society. This integrated strategy highlights the potential for carbon neutrality initiatives in the water sector to serve as a model for broader climate action policies, emphasizing the interconnected benefits of sustainable practices.

How to cite: Han, H., Kim, J. S., Jung, K., Sung, J., Kang, S., Chae, Y., and Hyun, Y.: Achieving Carbon Neutrality in the Water Sector: Unlocking Co-Benefits Between Climate Mitigation and Adaptation, EGU General Assembly 2024, Vienna, Austria, 14–19 Apr 2024, EGU24-21887, https://doi.org/10.5194/egusphere-egu24-21887, 2024.

EGU24-936 | ECS | Orals | HS5.1.2

Modelling the effect of land use and crop changes on water harvesting agricultural reservoirs 

Giulio Castelli, Elia Degli Innocenti, Simone Pozzolini, Elena Bresci, and Enrica Caporali

Water harvesting with Small Agricultural Reservoirs (SmAR) represents a solution for sustainable water management at a global scale. Early estimates showed that globally there were about 277,400,000 SmAR with an area of less than one hectare, and 24,120,000 water bodies between one and 10 hectares, representing more than 90% of the world’s standing water bodies. One of the most relevant challenges for the sustainable management of SmAR is represented by the loss of storage volume caused by the inflow of sediments. However, the analysis of the dynamics of sedimentation for SmAR received relatively little interest so far in the Mediterranean and on a global scale.

The purpose of this study is to implement a fully calibrated and validated model simulating the hydrology and erosion dynamics of the catchment of a SmAR in the Tuscany Region (Italy). The area is in the hilly area of Crete Senesi, about 15 km from Siena, where wine production is particularly developed, but not within the catchment of study, where the cultivation of cereals, renewal crops, and forage is practiced and there is a large grazing area. Our analysis aimed at estimating how much the rate of sediment accumulation in the reservoir would vary with the replacement of currently arable land with vineyards.

A model was implemented on the HEC-HMS software, maximizing the value of existent low-cost data (Google Earth imagery and regional erosion maps) for its validation, despite its use at a very small scale for a SmAR in a single farm. The validated model was then used for testing alternative land use scenarios in the upstream catchment, showing its flexibility for supporting decision-making over SmAR management.

The model performed with an error always below 10% on the SmAR area detected by satellite and a Nash-Sutcliffe efficiency of 0.675. Erosion values calculated with HEC-HMS were in line with the estimation made by the Tuscany region with a GIS-based procedure. The results of scenario analysis showed that the simulated land use change led to a high value of annual sediment accumulation in the reservoir (216% of the original value of erosion obtained with cereals and other crops). Such information should be considered at least at the agronomic design stage, as well as in the estimation phase of the costs of water supply, which must include the cost of the reservoir volume restoration after sediment accumulation. The approach can be replicated at the local scale in all other contexts where similar, and relatively easy-to-get, data are available.


This research was carried out within the AG-WaMED project, funded by the Partnership for Research and Innovation in the Mediterranean Area Programme (PRIMA), an Art.185 initiative supported and funded under Horizon 2020, the European Union’s Framework Programme for Research and Innovation, Grant Agreement Number No. [Italy: 391 del 20/10/2022, Egypt: 45878, Tunisia: 0005874-004-18-2022-3, Greece: ΓΓP21-0474657, Spain: PCI2022-132929]

The content of this abstract reflects the views only of the author, and the Commission cannot be held responsible for any use that may be made of the information contained therein.

How to cite: Castelli, G., Degli Innocenti, E., Pozzolini, S., Bresci, E., and Caporali, E.: Modelling the effect of land use and crop changes on water harvesting agricultural reservoirs, EGU General Assembly 2024, Vienna, Austria, 14–19 Apr 2024, EGU24-936, https://doi.org/10.5194/egusphere-egu24-936, 2024.

EGU24-1011 | ECS | Posters on site | HS5.1.2

Participatory modeling of small reservoirs in the Orcia watershed, Italy 

Lorenzo Villani, Eleonora Forzini, Giulio Castelli, Ismail Bouizrou, Gabriele Bertoli, Tommaso Pacetti, Enrica Caporali, and Elena Bresci

The Central Italian landscape is characterized by the presence of thousands of small reservoirs. The majority was dug in the 80s after strong incentives linked to agricultural production. Nowadays, most of them are not used due to various problems, either specific to reservoirs (e.g. siltation) or general (e.g. abandonment of rural areas and lower incentives for production). Concerns about the changing climate, with impelling water shortages due to increased evapotranspiration and altered rainfall patterns, raised the interest in the reutilization of these reservoirs for irrigation purposes. Indeed, typical rainfed crops such as vineyards and olive groves now often need to be irrigated in the drier seasons to obtain satisfactory productions, both in terms of quality and quantity.

Within the AG-WaMED project, we aim to understand the current situation regarding this type of non-conventional water considering economic, hydrological and governance aspects. A fundamental methodology in the project is the application of the Soil and Water Assessment Tool + (SWAT+) agro-hydrological model to simulate hydrological fluxes.

In the Orcia watershed, more than 1000 small reservoirs are present. To have a model with a reasonable simulation run time, we included in the setup of the model only those larger than 5000 m2, which correspond to 54 small reservoirs. With this model setup, we run sensitivity analysis, calibration and validation using monthly actual evapotranspiration at the basin scale from the MODIS remote sensing product. We obtained more than satisfactory performances for calibration and validation (NSE > 0.8 and PBIAS < 2% for calibration, NSE > 0.6 and PBIAS = -10.1% for validation).

The inclusion of a high number of reservoirs and the good values for the model performances are promising for the application of the SWAT+ model to study non-conventional waters at the basin scale but maintaining a high level of detail. Further steps are the calibration and validation with additional variables (e.g. soil moisture, streamflow), a refinement of the model setup and the simulation of alternative management strategies and scenarios. These aspects will be discussed in future workshops together with key stakeholders (farmers, experts, decision-makers and academics) in an iterative and participatory approach. In this way, we aim to obtain an improved and more representative model and to maximize the applicability of its outputs. 

This research was carried out within the AG-WaMED project, funded by the Partnership for Research and Innovation in the Mediterranean Area Programme (PRIMA), an Art.185 initiative supported and funded under Horizon 2020, the European Union’s Framework Programme for Research and Innovation, Grant Agreement Number No. [Italy: 391 del 20/10/2022, Egypt: 45878, Tunisia: 0005874-004-18-2022-3, Greece: ΓΓP21-0474657, Spain: PCI2022-132929].

The content of this abstract reflects the views only of the authors, and the Commission cannot be held responsible for any use that may be made of the information contained therein.

How to cite: Villani, L., Forzini, E., Castelli, G., Bouizrou, I., Bertoli, G., Pacetti, T., Caporali, E., and Bresci, E.: Participatory modeling of small reservoirs in the Orcia watershed, Italy, EGU General Assembly 2024, Vienna, Austria, 14–19 Apr 2024, EGU24-1011, https://doi.org/10.5194/egusphere-egu24-1011, 2024.

In the past decades,some progress has been made in the theory and practice of water and sediment regulation of the Yellow River.However,under the current engineering conditions, the feasibility and model of the whole river water and sediment regulation combined with the cascade reservoirs of Long ( Longyangxia) , Liu ( Liujiaxia) , Wan ( Wanjiazhai) , San ( Sanmenxia) and Xiao ( Xiaolangdi) are rarely discussed.  Based on a comprehensive analysis of the adjustable water volume of the Long-Liu cascade reservoirs, interval inflow and diversion water volume of the whole river under the multi-year average condition, this paper demonstrated the feasibility of the whole river water and sediment regulation under the current engineering conditions.  Two modes were put forward including the conventional mode and the unconventional mode, and the effects of two modes were compared and analyzed.  The results show that the sediment discharge of Xiaolangdi Reservoir under the two modes is 145.1 million tons and 191.3 million tons respectively and the sediment deposition of the downstream channel is 11.3 million tons and 22.1 million tons respectively.  No matter which mode of water and sediment regulation is adopted, Xiaolangdi Reservoir can achieve effective erosion in reservoir during the period of discharging before flood, and at the same time, it has little influence to the siltation of river channe.  Therefore, under the premise of strengthening the fine operation of the reservoir and strict interval diversion management, the whole river water and sediment regulation mode under the current engineering conditions is completely feasible.

How to cite: Zhang, L. and Wang, Y.: Exploration on the Feasibility and Mode of the Whole River Water and Sediment Regulation in the Yellow River Basin, EGU General Assembly 2024, Vienna, Austria, 14–19 Apr 2024, EGU24-4867, https://doi.org/10.5194/egusphere-egu24-4867, 2024.

EGU24-5025 | ECS | Posters on site | HS5.1.2

Transfer learning for reservoir operation based on regional model and large-scale dataset 

Yalian Zheng, Pan Liu, Qian Cheng, Weibo Liu, Huan Xu, Hongxuan Lei, and Xinran Luo

A regional spatial transfer learning method is proposed to map the attributes of reservoirs and their operating decisions, addressing the issue of poor transfer-ability of reservoir operating models. Firstly, a dataset of reservoir attributes and operating data is constructed, including a total of 503 reservoirs in China and the United States. The 503 reservoirs are divided into source reservoirs (rich data reservoirs) and target reservoirs (data-scarce reservoirs) based on a five-fold cross-validation method. A regional spatial transfer learning method is established to map the attributes of reservoirs and their operating strategies. After training the model network parameters, a generalized reservoir operating model is formed. The information of data-scarce reservoirs is input into the generalized reservoir operating model to achieve adaptive dynamic transfer of reservoir operating strategies. Deep learning interpretability techniques are used to analyze the relationship between static attribute features of reservoirs and the performance of transfer learning. Results show: (1) The generalized reservoir operating model, which maps the static attribute features of reservoirs to reservoir operating decisions, can achieve spatial transfer of operating decisions. After five-fold cross-validation, the average Nash-Sutcliffe Efficiency (NSE) for reconstructing operating decisions of data-scarce reservoirs is 0.69. By evaluating the deviation between the transferred operating decisions and real-world operating decisions of the 503 reservoirs, it is found that 337 reservoirs, accounting for 67.0% of all reservoirs, have an NSE higher than 0.6. (2) Reservoir attribute features can enable the model to explore the relationship between operating decisions of reservoirs with similar features. Among the 503 reservoirs, 288 reservoirs show better transfer learning performance considering static attribute features. (3) Deep learning interpretability techniques are used to analyze the relationship between the transfer learning performance and the static attribute features of reservoirs. The most important factors affecting the transfer learning performance are long-term average discharge at dam location, longitude of point location of dam, area of upstream catchment draining into the reservoir, and maximum storage capacity of reservoir, which explain 31.1%, 11.3%, 10.0%, and 7.2% of the transfer learning model's performance, respectively.

How to cite: Zheng, Y., Liu, P., Cheng, Q., Liu, W., Xu, H., Lei, H., and Luo, X.: Transfer learning for reservoir operation based on regional model and large-scale dataset, EGU General Assembly 2024, Vienna, Austria, 14–19 Apr 2024, EGU24-5025, https://doi.org/10.5194/egusphere-egu24-5025, 2024.

EGU24-5108 | Posters on site | HS5.1.2

An analytic method for optimizing hydropower installed capacity expansion size in hydro-solar-wind hybrid system 

Chen Wu, Pan Liu, Qian Cheng, Zhikai Yang, and Zheyuan Liu

The worldwide renewable energy installed capacities have increased rapidly, aiming to secure power supply and replace fossil fuels. However, challenges persist in optimizing the size of hydropower installed capacity expansion (HICE) in hydro- solar-wind hybrid system. In this study, an analytic method is proposed to determine the optimal hydropower installed capacity expansion size based on the relationship between HICE and generation, as well as the relationship between HICE and energy-loss. Firstly, an optimization function for HICE is proposed using the net present value method. Then, function assumptions are made and validated for the relationship between HICE and generation (HICE-generation function) and the relationship between HICE and energy loss (HICE-energy-loss function). Finally, the optimal sizes of HICE derived from the numerical and analytical methods are compared. A case study in the Yalong River basin in China reveals that: (1) the proposed HICE-generation and HICE-energy-loss functions can quantitatively characterize the relationship between HICE and generation and energy loss; (2) the proposed analytical method could yield the optimal HICE size without the need for a simulation process and heavy computational burden; and (3) it provides an optimal HICE size of 1210 MW with a relative error of only 5.5% compared to the numerical solution. Therefore, the proposed analytical method can be an effective tool for the planning and management of large hybrid energy systems.

How to cite: Wu, C., Liu, P., Cheng, Q., Yang, Z., and Liu, Z.: An analytic method for optimizing hydropower installed capacity expansion size in hydro-solar-wind hybrid system, EGU General Assembly 2024, Vienna, Austria, 14–19 Apr 2024, EGU24-5108, https://doi.org/10.5194/egusphere-egu24-5108, 2024.

EGU24-5242 | Posters on site | HS5.1.2

Effects of climate variability and land use on small water reservoirs in the MENA region 

Milad Aminzadeh, Sankeerth Narayanaswamy, and Nima Shokri

Freshwater shortages in the Middle East and North Africa (MENA) have been exacerbated with rapid population growth and changes in precipitation and drought patterns in recent decades. Agricultural production in this region relies largely on irrigation, making it vulnerable to the availability of surface and groundwater resources. Under these circumstances, small agricultural reservoirs are at the core of supporting local irrigation and livestock water demands during dry spells [1]. However, the cumulative impact of these small on-farm reservoirs on the management of limited freshwater resources in the MENA region with acute water scarcity remains unknown. We capitalize on the highly resolved satellite imagery of Sentinel 2 with 10 m resolution to identify the spatio-temporal distribution of small reservoirs (< 0.1 km2) and estimate their storage capacity in MENA. Such detailed information enables us to link the extent of reservoirs to the changes in freshwater availability and demands arising from climatic factors and agricultural activities in this region. Our preliminary results highlight correlations between the changes in cumulative area of agricultural reservoirs and variation of local precipitation and air temperature patterns. The study improves water balance and budgeting in dry regions of the world and provides insights into the impact of land cover changes on the expansion of water reservoirs supporting local irrigation demands.

Reference

[1] Aminzadeh, M., Lehmann, P., & Or, D. (2018). Evaporation suppression and energy balance of water reservoirs covered with self-assembling floating elements. Hydrology and Earth System Sciences, 22(7), 4015–4032. https://doi.org/10.5194/hess‐22‐4015‐2018

How to cite: Aminzadeh, M., Narayanaswamy, S., and Shokri, N.: Effects of climate variability and land use on small water reservoirs in the MENA region, EGU General Assembly 2024, Vienna, Austria, 14–19 Apr 2024, EGU24-5242, https://doi.org/10.5194/egusphere-egu24-5242, 2024.

EGU24-5281 | ECS | Posters on site | HS5.1.2

Endorheic Lake Storage Changes in Water-Stressed Regions: Anthropogenic and Climate Impacts 

Hannes Nevermann, Milad Aminzadeh, and Nima Shokri

Endorheic lakes are at the core of terrestrial hydrological processes and ecosystem functioning in closed drainage basins. The storage capacity of these vital water bodies has been influenced by the climate variability and human activities (Hassani et al., 2020). We aim to investigate the role of these factors on the storage capacity of endorheic lakes in water-stressed regions worldwide. We integrate satellite remote sensing and historical data to quantify the extent of endorheic lakes and explore the relationship between the changes in their storage capacity and atmospheric parameters such as air temperature, precipitation, and wind. To examine the role of anthropogenic activities, we assess changes in the land cover and the extent of man-made water storage infrastructures (dams and water reservoirs) in the respective water basins and their correlations with storage variations of endorheic lakes situated in the water-stressed regions. Our preliminary findings highlight the complex interplay between socio-economic and environmental factors influencing the fate of endorheic lakes. This study contributes to our understanding of the broader implications of global environmental changes and offers valuable insights for policymakers, researchers, and stakeholders engaged in the sustainable management of endorheic lake ecosystems.


Reference

Hassani, A., Azapagic, A., D'Odorico, P., Keshmiri, A., Shokri, N. (2020). Desiccation crisis of saline lakes: A new decision-support framework for building resilience to climate change. Science of the Total Environment, 703, 134718.

How to cite: Nevermann, H., Aminzadeh, M., and Shokri, N.: Endorheic Lake Storage Changes in Water-Stressed Regions: Anthropogenic and Climate Impacts, EGU General Assembly 2024, Vienna, Austria, 14–19 Apr 2024, EGU24-5281, https://doi.org/10.5194/egusphere-egu24-5281, 2024.

Freshwater availability in coastal cities is severely threatened by saltwater intrusion during the dry season. Some reservoirs are typically installed in the upper reaches to regulate the temporal distribution of water resources to ensure a steady supply. However, studies quantifying this effect are limited. This study improved a framework proposed by our previous work and conducted some scenario-based experiments to evaluate this effect. The study considered the following: First, a comprehensive matrix index is developed based on the D-vine copula function and Kendall distribution transformation method (KF) using historical monthly streamflow. Then, several monthly-based management scenarios, i.e., flat, descending, ascending, convex, and concave, are designed based on the index. The scenarios provide inputs to the water supply system facing saltwater intrusion. The Zhuhai-Macao water supply system was taken as a case study. Results demonstrated that the index performed satisfactorily in devising scenarios and holistically describing the temporal streamflow distribution characteristics and hydrological wetness-dryness conditions. The security situation of scenarios followed ascending>convex>descending>flat>concave with KF=0.10 and convex>ascending>flat>descending>concave with KF=0.05. Hence, the securest scenario for regulating reservoirs was the convex pattern, which avoided shortages by 100% and improved the increment of the remaining water in reservoirs by 4.92 times under KF=0.05 and 6.13 times under KF=0.10, separately, compared to the original streamflow. The worst scenario for regulating reservoirs was the concave pattern. Moreover, the ascending pattern can also be considered as a distribution for regulation, but the long period of extremely low streamflow in the early dry season should be avoided. The scenarios experiment can be applied as a management tool to alleviate water supply pressures in coastal cities facing saltwater intrusion.

How to cite: Wu, H.: Effect of regulating upstream reservoir on water supply security facing saltwater intrusion, EGU General Assembly 2024, Vienna, Austria, 14–19 Apr 2024, EGU24-7491, https://doi.org/10.5194/egusphere-egu24-7491, 2024.

EGU24-8500 | ECS | Orals | HS5.1.2

Study on year-end water level optimization of  multi-year regulation reservoirs under uncertain inflow conditions 

Jieyu Li, Jiayun Zheng, Hang Li, and Yuanjian Wang

The year-end water level of multi-year regulation reservoirs is key in harmonizing current-year and future power generation benefits. Taking the multi-year regulating Longyangxia Reservoir and Liujiaxia Reservoir in the upper reaches of the Yellow River as a case study, a multi-objective stochastic optimization model for cascade reservoirs considering the uncertain inflow was established. Then, the best scheme from the Pareto solution set of the current-year power output and the year-end water level was obtained based on the TOPSIS decision-making method. Finally, the effects of runoff frequency and initial water level on year-end water level and power output were investigated, and the reliability of year-end expected water level on multi-year power output was verified. The results show a competitive relationship between the year-end expected water level of Longyangxia Reservoir and the annual expected power output of Longyangxia Reservoir and Liujiaxia Reservoir under the uncertainty inflow scenarios. The lower the frequency of runoff and the higher the year-start water level to Longyangxia Reservoir, the higher the year-end water level of Longyangxia and the higher the power output of Longyangxia Reservoir and Liujiaxia Reservoirs. The optimal year-end water level of Longyangxia Reservoir calculated by the stochastic optimization model should be controlled between 2580~2590 meters, which greatly reduces the range of year-end water level under the current dispatching mode. When the optimal year-end expected water level obtained by stochastic optimization is used to control Longyangxia Reservoir, the reliability of guaranteeing the power generation benefit is above 98%.

Keywords: multi-year regulating reservoir; year-end water level; uncertainty; stochastic optimal operation

How to cite: Li, J., Zheng, J., Li, H., and Wang, Y.: Study on year-end water level optimization of  multi-year regulation reservoirs under uncertain inflow conditions, EGU General Assembly 2024, Vienna, Austria, 14–19 Apr 2024, EGU24-8500, https://doi.org/10.5194/egusphere-egu24-8500, 2024.

EGU24-8627 | ECS | Orals | HS5.1.2

Toward Holistic Perspective on Dam Efficacy in Transboundary Hydro-Extremes Management 

Abubaker Omer, Nadir Elagib, Yoshihide Wada, Yadu Pokhrel, and Hyungjun Kim

Research on assessing dams preparedness to mitigate hydrological extremes has grown under climate change and water conflicts. However, discerning the success or failure of these strategies remains challenging, especially in Transboundary Rivers. Here, we use a meta-analytic approach to examine 14 moderators of dam efficacy in flood and drought risk management. We synthesize impact assessment datasets from 287 articles for 12 transboundary basins across the globe. Findings show that forest cover and gross domestic product enhance dam efficacy in flood control. In flood hotspots, the synergy of dam management and institutional factors is the paramount determinant of dams performance. Conversely, the efficacy in the drought-prone basins is governed mainly by the interplay of institutional and socioeconomic factors. Climate aridity, precipitation anomalies, and hydropower dams lessens the dams effectiveness in mitigating both hydrological extremes. We argue that endorsing adaptive management through dams in transboundary basins requires a holistic approach. Thus, we emphasize accounting not only for the physical and engineering aspects, but also for the intertwined environmental, socioeconomic, and geopolitical implications.

How to cite: Omer, A., Elagib, N., Wada, Y., Pokhrel, Y., and Kim, H.: Toward Holistic Perspective on Dam Efficacy in Transboundary Hydro-Extremes Management, EGU General Assembly 2024, Vienna, Austria, 14–19 Apr 2024, EGU24-8627, https://doi.org/10.5194/egusphere-egu24-8627, 2024.

EGU24-8692 | Orals | HS5.1.2

Combining meteorological and streamflow information for defining minimum environmental flow requirements in Mediterranean catchments 

Eva Contreras, Javier Aparicio, Rafael Pimentel, Ana Andreu, Raquel Gómez-Beas, Laura Martín, Cristina Aguilar, and María José Polo

The compliance of environmental flows following the recommendations of the Water Framework Directive (WFD) is a crucial aspect in the management of reservoir water allocation. This issue is especially challenging in catchments with long and recurrent drought periods, such as those affected by the Mediterranean climate. There are still some gaps to be addressed by managers and water authorities. For instance, the correct definition of minimum environmental flow (MEF) to be fulfilled. These MEF values, which are set in the River Basin Management Plan (RBMP), commonly vary slightly throughout the year. Sometimes, this assumption is not accomplished because these values are above those that would have been observed under natural conditions. Therefore, in these regions it is decisive to adapt the MEF requirements to the local hydrometeorological seasonally.      

This work proposes the combination of historical streamflow and precipitation data to assess the viability of using seasonal hydrometeorological patterns in the definition of the MEF rates. For that, several monitored water bodies were analysed. Streamflow information from gauging stations and precipitation data were selected in the two main river basin districts in the South of Spain: the Guadalquivir River Basin, and the Andalusian Mediterranean Watersheds River Basin. First, for each case, we reviewed the compliance of the MEF rates analysing when these threshold values were or not achieved at the monthly scale.  In addition, we analysed the seasonal variability in terms of both precipitation and streamflow and compared these outcomes with the seasonal variations of the MEF. This analysis was carried out during 10 hydrological years, from September 2010 to August 2020.

According to our results, most of the locations were below 28% of accomplishment during the summer months. This percentage increased when the period analysed was the winter. However, this percentage was below 50% in some locations. On the contrary, only in those locations which are fed by mountain catchments, the accomplishment was fulfilled in 73-100% during the whole year. The joint seasonal analysis of precipitation and streamflow highlights that the MEF established in the RBMP were oversized in most of the cases, overlooking the precipitation patterns.

This work showed that a revision of the MEF values set by the RBMP is required. That is especially significant in locations where seasonal variations of the MEF are null or imperceptible. Our outcomes will help to set the basis for the design of a new methodology when defining MEF. Hence, this new approach will consider not only water quantity but also hydrometeorological seasonal variability as the main step to truly address water management from the perspective of the WFD. 


Acknowledgments: This work has been funded by the project TED2021-130937A-I00, ENFLOW-MED “Incorporating climate variability and water quality aspects in the implementation of environmental flows in Mediterranean catchments” with the economic collaboration of MCIN/AEI/10.13039/501100011033 and European Union “NextGenerationEU”/Plan de Recuperación, Transformación y Resiliencia.

How to cite: Contreras, E., Aparicio, J., Pimentel, R., Andreu, A., Gómez-Beas, R., Martín, L., Aguilar, C., and Polo, M. J.: Combining meteorological and streamflow information for defining minimum environmental flow requirements in Mediterranean catchments, EGU General Assembly 2024, Vienna, Austria, 14–19 Apr 2024, EGU24-8692, https://doi.org/10.5194/egusphere-egu24-8692, 2024.

EGU24-10225 | Orals | HS5.1.2 | Highlight

Fate of reservoir storages due to sedimentation in changing climate 

Alena Bartosova, Conrad Brendel, and René Capell

Retention of sediment in lakes and reservoirs is a major problem that impacts drinking water supplies, irrigation, recreation, hydropower production, and flood control globally. Sediment loads to lakes and reservoirs are likely to increase due to changing climate, e.g. increases in high intensity precipitation events. However, this impact is often not considered in large scale hydrological assessments of climate changes.

An ongoing challenge with assessing reservoir sedimentation at a large scale is that many basins are ungauged, and information about sediment management and decision making is not available. Large-scale dynamic hydrological models are fortunately becoming more commonly established as tools not only for flood forecasting and climate impact analyses, but also for estimating time-dynamic water fluxes and their transport into sea basins. One such tool is the dynamic, semi-distributed, process-based rainfall-runoff and water quality model, Hydrological Predictions for Environment (HYPE, see Lindström et al., 2010; https://hypeweb.smhi.se/).

While many hydrological models do not explicitly consider the sediments accumulating in reservoirs, HYPE was recently updated to dynamically simulate (1) the effect of sediments on the available volume of lakes and reservoirs and (2) selected sediment management strategies. The new routines were tested on several reservoirs globally using different types of data for calibration: instream sediment concentrations (Banja in Albania), storage capacity loss (Enguri in Georgia), and upstream sediment yield (dams in Greater uMngeni River Basin in South Africa). The current annual rate of storage capacity loss varied greatly among cases (0.004-4.15%). The routines were then incorporated into a pan-European HYPE model, E-HYPE (Brendel et al., 2023), and calibrated against observed sediment concentrations. The change in storage capacity loss in European reservoirs and lakes was then evaluated for 3 climate models. We present current and future losses of lake and reservoir storage and analyze sediment regimes in water bodies with water management structures such as hydropower or drinking water reservoirs.


Lindström, G., Pers, C., Rosberg, J., Strömqvist, J., Arheimer, B., 2010. Development and testing of the HYPE (Hydrological Predictions for the Environment) water quality model for different spatial scales. Hydrol. Res. 41, 295–319. https://doi.org/10.2166/nh.2010.007

Brendel, C. E., Capell, R., Bartosova, A. (2023) To tame a land: Limiting factors in model performance for the multi-objective calibration of a pan-European, semi-distributed hydrological model for discharge and sediments. Journal of Hydrology: Regional Studies, 50(2023) 101544. https://doi.org/10.1016/j.ejrh.2023.101544

How to cite: Bartosova, A., Brendel, C., and Capell, R.: Fate of reservoir storages due to sedimentation in changing climate, EGU General Assembly 2024, Vienna, Austria, 14–19 Apr 2024, EGU24-10225, https://doi.org/10.5194/egusphere-egu24-10225, 2024.

EGU24-11194 | ECS | Orals | HS5.1.2

ML-derived reservoir operations for 24,000 dams implemented in a global hydrological model 

Jen Steyaert, Niko Wanders, and Marc Bierkens

Globally there are over 24,000 dams that greatly alter river connectivity and streamflow regimes of the world’s large rivers. To capture the impact of dams, global hydrological models implement simplified reservoir operations that use modelled inflow, static storage capacity values, and downstream demand to calculate reservoir releases and better understand large-scale streamflow dynamics. According to Steyaert et al., 2023, these approaches typically overestimate the amount of water stored in reservoirs, smooth out the seasonality in storage, and may miss long term trends. All of which can underestimate the impact on streamflow regimes as the operations are not necessarily derived from historic time series. To assess the importance of reservoir operations on global streamflow regimes, we update the number of reservoirs in the PCRGLOBWB 2.0 hydrologic model from 6,000 to 24,000 using the georeferenced global dams and reservoirs dataset (GeoDAR (Wang et al., 2022)) and derive dynamic storage thresholds using freely accessible remotely sensed storage data and a new reservoir algorithm developed by Turner et al., 2021. We obtained the reservoir specific parameters required for the Turner algorithm using a ML based approach to enable global simulations of all 24,000 dams. We also employ a sensitivity analysis across multiple command areas (250, 650 and 1100 km) to assess the impact reservoirs have on the global streamflow and downstream water demand. Preliminary results in the Rhine basin show that increasing the number of dams and using data derived methods provides more realistic streamflow regimes. We observe an improvement in the KGE of discharge simulations from 0.43 to 0.67, also reducing the bias from -2012.23 to -316.94 compared to the old reservoir implementation currently used in PCR-GLOBWB 2.0. This significant improvement in model performance highlights the importance of observation derived rule curves for reservoir management in global hydrological models.

How to cite: Steyaert, J., Wanders, N., and Bierkens, M.: ML-derived reservoir operations for 24,000 dams implemented in a global hydrological model, EGU General Assembly 2024, Vienna, Austria, 14–19 Apr 2024, EGU24-11194, https://doi.org/10.5194/egusphere-egu24-11194, 2024.

EGU24-11425 | Orals | HS5.1.2

Assessing long-term performance of a low water level support system under climate change using influenced streamflows models. 

Victor Vermeil, Camille Debein, Céline Monteil, Frédéric Hendrickx, Fabrice Zaoui, René Samie, and Raphaël Lamouroux

The Allier River is a tributary of the Loire, the longest river in mainland France. It covers a watershed of 14,310 km². To maintain an objective flow in the Middle Loire, two reservoirs are used to release water during summer including Naussac on the Allier River (190 hm3). These operations are monitored by the Loire River Basin Authority (Établissement Public Loire). The 2022 and 2023 droughts in France highlighted the vulnerability of Naussac water supply in summer. This risk will be more important in the future, as global warming leads to lower flows in the watershed.

To evaluate the impacts of global change on electricity production across the Loire watershed at Saumur (81,200 km²), a framework that encompasses water usage demand (considering water withdrawals) in hydrological simulations has recently been developed. We propose to complete this framework with the introduction of hydraulic structure management rules (Fig.1), to evaluate the long-term performance of the low water level support system for two future timeframes, 2035-2065 (mid-term) and 2070-2099 (long-term), relative to the current climate (1976-2005).

Our analysis focuses on the management of the Naussac dam and the provision of low-water support for the Allier River [2]. In wet periods, Naussac can be filled in three ways: via natural inflows from the Donozau river, a detour on the Chapeauroux river, and pumping into the Allier. In dry periods, it provides low-water support for the Allier at various strategic points, known as nodal points, to satisfy the multiple uses of water downstream (agriculture, drinking water supply, etc.). Explicit integration of these constraints at nodal points allows for global performance analysis.

The Naussac management model was validated over the historical period, then projected into future climates using 4 climate models from CMIP5, forced by the RCP 8.5 greenhouse gas emissions scenario. The drop in flows forecasted for the end of the century would lead to more frequent interruption in low-water support, that can be highlighted with several indicators analysis [3]. This situation is characterized by a drastic fall in the average stock of the Naussac reservoir over the year by the end of the 21st century (Fig.2). Management rules can be adapted to a certain extent and help reduce vulnerability of the low-water support, but limited by the need to maintain downstream water uses and the good ecological status of the hydro system.

Figure 1: Schematic view of the water management system of Naussac dam.

Figure 2: Model validation over the historical (top) period and visualization of average stock in future (bottom).

References:

[1] Sauquet, E., Robin, Y., Corre, L., Marson, P., Bernus, S., Projections climatiques régionalisées : Correction de biais et changements futurs, Explore2, Recherche Data Gouv, V2, 2022.

[2] Sonnet, O., Etude HMUC : étude d’adaptation du mode de gestion du barrage de Naussac sous l’effet du changement climatique, Phase 1, Technical report, Etablissement Public Loire, 2016.

[3] Francois, B., Thèse : gestion optimale d'un réservoir hydraulique multiusages et changement climatique. Modèles, projections et incertitudes : Application à la réserve de Serre-Ponçon, 2013.

How to cite: Vermeil, V., Debein, C., Monteil, C., Hendrickx, F., Zaoui, F., Samie, R., and Lamouroux, R.: Assessing long-term performance of a low water level support system under climate change using influenced streamflows models., EGU General Assembly 2024, Vienna, Austria, 14–19 Apr 2024, EGU24-11425, https://doi.org/10.5194/egusphere-egu24-11425, 2024.

Climate change has altered precipitation patterns, significantly affecting water resources management and supply systems. Reservoirs, including Shihmen Reservoir in Taiwan, are particularly vulnerable due to changes in rainfall distribution and topographic factors, leading to sedimentation from events such as landslides and debris flows. These events pose direct and indirect threats to the water quality and supply capacity of reservoirs.
The frequency of heavy rainfall events has increased, resulting in heightened soil and rock erosion. Consequently, a larger amount of sediment is entering the reservoir, degrading its water quality. Currently, Shimen Reservoir is operating at only 2/3 of its storage capacity, with 1/3 of the reservoir now filled with deposited silt. This situation poses a significant risk to future water supply.
To assess future rainfall trends at Shihmen Reservoir, we compared TCCIP statistical downscaling data for Taiwan with weather generation data. Our analysis focused on understanding the impact of landslide sediments on the storage capacity of Shihmen Reservoir and identifying potential risk indicators, including resilience, reliability, and vulnerability.
This study underscores the profound impact of climate change on Shihmen Reservoir, specifically highlighting the repercussions of rainfall failure on water quality and supply capacity.

How to cite: Yeh, C.-Y. and Tung, C.-P.: Impact of landslide on the water supply capacity of the Shihmen Reservoir in Taiwan under climate change, EGU General Assembly 2024, Vienna, Austria, 14–19 Apr 2024, EGU24-14172, https://doi.org/10.5194/egusphere-egu24-14172, 2024.

EGU24-14756 | Posters on site | HS5.1.2

An integrated approach for water-quality investigation of Piediluco lake (Italy) 

Silvia Di Francesco, Sara Venturi, and Stefano Casadei

The study aims at investigating strategies to reduce the effect of the nutrients pollution in Piediluco lake, improving the water quality and limiting the eutrophication processes. In particular, managements options operating in the body of the reservoir are considered, i.e. the variation and/or repositioning of the main water inflow.
Piediluco is the second largest lake of Umbria region (Central Italy) and is characterized by an extended and complex shape with several branches (approximately 1,7 km2 with an average and maximum depth, respectively, of 10 m and 20 m). Currently, the hydraulic regime of the lake  is regulated by the downstream hydroelectric plants of Galleto and Monte Sant’Angelo: during the power generation, water from Piediluco lake is conveyed through Velino river into the hydroelectric plant; when the electric production is paused, the entire flow rate of Velino river is conveyed to the lake. Actually, the largest water supply is provided to the lake by the Medio-Nera channel, an artificial canal built in 1932 that has expanded the Piediluco basin area from 75 km2 to 2100 km2. The main idea is to move the position of the inlet in order to promote the movement and recirculation of water throughout the lake surface.
Several field measurements, carried out from the first years of 1980s, have highlighted that the health of the lake has been constantly deteriorating: the increase of nutrients loading has negatively affected the ecosystem, progressively compromising the use of the lake and its resources, and, consequently, the local economy. A high eutrophication level of the lake, with algal bloom and, in extreme meteorological conditions, a significant water anoxia, in particular in the arms of the lake far from the inlet of Medio-Nera channel, have been observed.
The work is based on an integrated approach: at first stage, remote sensing available data, coupled with the Google Earth Engine (GEE) platform, are used to analyse, in the last decade, the spatial distribution, the seasonal variations and the inter-annual variations of water quality parameters. Secondly, a two-dimensional model is developed, in order to simulate the sediment and pollutant transport connected with the hydrodynamic condition of the lake with different management scenarios. The model is calibrated and validated on the base of in situ monitoring data.

How to cite: Di Francesco, S., Venturi, S., and Casadei, S.: An integrated approach for water-quality investigation of Piediluco lake (Italy), EGU General Assembly 2024, Vienna, Austria, 14–19 Apr 2024, EGU24-14756, https://doi.org/10.5194/egusphere-egu24-14756, 2024.

EGU24-14853 | Posters on site | HS5.1.2 | Highlight

Losing water through evaporation from water reservoirs in water-stressed regions: The case of Iran-Afghanistan 

Nima Shokri, Hannes Nevermann, and Kaveh Madani

The rising demand for water in the transboundary Helmand basin is causing heightened tensions between Afghanistan and Iran concerning the Helmand River with serious environmental, socio-economics and political implications. This intensifies the long-existing transboundary water conflicts between the two countries. To overcome water shortages during dry spells, water reservoirs and storage infrastructure have been constructed in a region experiencing extremely hot and dry climate conditions. Water evaporation from these reservoirs diminishes their storage efficiency. This makes quantification and prediction of water evaporation from these reservoirs a crucial step for water management, accountability and transboundary cooperation in the river basin. In this study, we used satellite remote sensing information of the large water reservoirs in the Helmand basin combined with physically-based modelling approaches (Aminzadeh et al., 2024) to obtain reliable estimates of evaporative losses from the main storage infrastructures. Our results suggest that a considerable amount of water loss in the region stems from the evaporation of water in major water storage infrastructure within the basin, particularly from the man-made reservoirs located on the Iranian side of the basin in a very water-deprived region. Our results indicate 491 million cubic meters of water was evaporated from the reservoirs in 2020 accounting for 11% of their total storage capacity and 8.2% of the water demands in the basin. Our findings improve water accounting and management in the Helmand basin. Additionally, they underscore the key role of effective water storage infrastructures in managing limited freshwater resources which could improve water security.


Aminzadeh, M., Friedrich, N., Narayanaswamy, S.G., Madani, M. Shokri, N. (2024). Evaporation loss from small agricultural reservoirs: An overlooked component of water accounting, Earth’s Future (Accepted).

How to cite: Shokri, N., Nevermann, H., and Madani, K.: Losing water through evaporation from water reservoirs in water-stressed regions: The case of Iran-Afghanistan, EGU General Assembly 2024, Vienna, Austria, 14–19 Apr 2024, EGU24-14853, https://doi.org/10.5194/egusphere-egu24-14853, 2024.

EGU24-18597 | ECS | Orals | HS5.1.2

"Reservoir Dynamics: Assessing Sustainable Operations' Impact on Water Cycle" 

prateek sharma and manabendra saharia

River impoundments play a substantial role in altering the global water cycle and terrestrial water storage (TWS) dynamics. In light of the vulnerability of the global water cycle to both climate change and human activities, there is a pressing need for an integrated approach to water management that combines scientific insights with sustainable reservoir operation strategies. In this context, the integration of the advanced computational model Noah-MP and an innovative satellite-based reservoir operation scheme called HyMAP offers a comprehensive understanding of the reservoir dynamics of Tawa reservoir situated along the Narmada River in India. To accurately depict absolute water storage, a ground-based lake bathymetry is incorporated into the analysis, merging it with global satellite-based topography. Additionally, radar altimetry data is integrated into the hydrodynamic model to serve as a proxy for reservoir operation practices. Comparing the results against an idealized naturalized system (assuming no anthropogenic impacts) during the period from 2005 to 2022, the study reveals that reservoir operation has a substantial impact on water elevation, extent, storage, and outflow. These operational practices exert control over lake dynamics and TWS, emphasizing the need for a sustainable and informed approach to reservoir management.

How to cite: sharma, P. and saharia, M.: "Reservoir Dynamics: Assessing Sustainable Operations' Impact on Water Cycle", EGU General Assembly 2024, Vienna, Austria, 14–19 Apr 2024, EGU24-18597, https://doi.org/10.5194/egusphere-egu24-18597, 2024.

EGU24-19951 | ECS | Orals | HS5.1.2 | Highlight

What you see is mirage: even dams can die of thirst 

Sahand Ghadimi, Alireza Sharifi Garmdareh, and Ali Torabi Haghighi

Uncoordinated development plans in rivers upstream coupled with climate change and variability have resulted in hydrological disturbances and their consequent social conflicts and environmental issues in downstream. Dams and hydrosystems are known as one of the main causes of such issues, however, they can be victimized by upstream developments themselves which result in failure in operation, fulfilling historical downstream allocations, and wasting large amounts of financial resources due to multiple investments. Giving some critical examples from Iran, an arid and semi-arid country, such failures can be observed in Karkheh and Sefidrud dams with 56 and 65% inflow reduction respectively. The impacts and consequences of such mismanagements will be demonstrated in this study. For this purpose, a new concept and methodology called “Mirage Water” is defined as the downstream flow deficit caused by upstream water development ignoring historical allocations. Firstly, the year of abrupt change (YAC) in precipitation and flow time series is assessed by the Pettiit test and then the annual flow characteristics before and after that abrupt change will be compared. The contribution level of anthropogenic activity and precipitation deficit in flow reduction is estimated using Simple linear regression and double mass curve methods. Meanwhile, the meteorological and hydrological drought is assessed using SPI and SDI and hybridized. Finally, the river impact in critical stations is presented. The results show that the YAC in Sefidrud’s inflow happened after its construction year due to a 57% contribution of anthropogenic activities. In the other case, Karkheh experienced the YAC in its inflow 2 years before the construction year with 44% anthropogenic impact.

How to cite: Ghadimi, S., Sharifi Garmdareh, A., and Torabi Haghighi, A.: What you see is mirage: even dams can die of thirst, EGU General Assembly 2024, Vienna, Austria, 14–19 Apr 2024, EGU24-19951, https://doi.org/10.5194/egusphere-egu24-19951, 2024.

Water resource evaluation and management rely heavily on detailed and well-classified data on water supply, demand, consumption, and withdrawals. The Water Accounting Plus (WA+) framework provides an effective platform to anticipate water flows by integrating remote sensing data to analyze water flows within a basin while accounting for land use. For the Mahi River, we used the WA+ framework to get insights about water inflows, outflows, consumption, withdrawals, and storage changes. The WaterPix (soil moisture water balance) model was employed to simulate hydrological processes at the pixel level. Here, we also employed blue and green water estimates to classify between irrigated and rainfed regions. The present state of the basin's water resources was also computed using performance indicators. As per our study, the Mahi River basin experiences water scarcity and heavily depends on groundwater (GW) for agriculture. From 2012-2020, there has been an average annual outflow of 20.65 BCM, with average annual flows of exploitable and available water being 34.07 BCM/year and 30.38 BCM/year, respectively. Furthermore, the average vertical GW recharge and outflow were 17.47 BCM/year and 21 BCM/year, respectively. Though, the average surface water (SW) withdrawal was lower and concentrated in a few regions. The outcomes from the GW sheets demonstrated a considerable dependence on GW, with 95% of the used flow coming from GW. Notably, over the study period, there was a 25% reduction in water storage, emphasizing the challenges of excessively using GW for irrigation and the decrease in water storage within the Mahi River basin. The conclusions of our study give local and national authorities important new information that they can use to spot regions with poor water management practices and create water management strategies and programs that are suitable for the basin's requirements.   

How to cite: Patle, P. and Sharma, A.: Assessing Water Resource Availability and Utilization in the Mahi River Basin: A Comprehensive Analysis using Water Accounting Plus (WA+), EGU General Assembly 2024, Vienna, Austria, 14–19 Apr 2024, EGU24-839, https://doi.org/10.5194/egusphere-egu24-839, 2024.

    Excessive applications of phosphate fertilizers have led to significant phosphorus (P) accumulation in agricultural soils. This surplus P is prone to being lost through surface runoff, thereby threatening downstream water bodies such as aquifers, streams, lakes, and oceans. Indeed, the runoff loss of P has led severe global environmental concerns, including proliferation of harmful algal blooms, onset of eutrophication, and expansion of anoxic dead zones in coastal marine ecosystems. Assessing the spatial distribution of total P (TP) runoff loss from croplands is essential for developing targeted mitigation strategies against the persistent issue of nonpoint source pollution. In this study, we compiled 812 datasets from 114 peer-reviewed papers for cropland P loss across China. We then developed machine learning (ML) approaches to estimate the temporal and spatial variations in P runoff loss across China from 1990 to 2020. Four prevalent ML models were considered, namely, multiple linear regression (MLR), random forest (RF), classification and regression trees (CART), and boosted regression trees (BRT). Among these four models, RF exhibited the highest predictive accuracy for both uplands (calibration: R2 = 0.86, n = 293; validation: R2 = 0.61, n = 96) and paddy fields (calibration: R2 = 0.88, n = 137; validation: R2 = 0.60, n = 44). According to RF, China’s croplands are estimated to have lost an average of 148 ± 27 Gg P yr⁻¹ from 1990 to 2020, with uplands and paddy fields contributing 114 ± 26 Gg P yr⁻¹ and 34 ± 4 Gg P yr⁻¹, respectively. The data showed a significant increase in upland TP runoff loss over the study period (p<0.001), whereas paddy field TP loss remained relatively constant. Regions in southern, eastern, and southwestern China, notably in Hainan, Guangxi, and Fujian provinces, were identified as hotspots of TP runoff loss. Scenario predictions suggest a 1.4-11.8% reduction in TP runoff loss under various conditions, most effectively when minimizing runoff depth. To effectively mitigate TP runoff loss in China, an integrated management approach involving water, soil, and fertilizer is recommended. Overall, this study enhances our quantitative understanding of cropland TP runoff loss in China, providing crucial insights for efficient cropland P management, which is key to managing nonpoint source pollution on a national level.

How to cite: Pan, Z.: Quantifying spatiotemporal variations of cropland phosphorus runoff loss in China with machine learning algorithms, EGU General Assembly 2024, Vienna, Austria, 14–19 Apr 2024, EGU24-2638, https://doi.org/10.5194/egusphere-egu24-2638, 2024.

EGU24-5783 | ECS | Posters on site | HS5.1.3

A stakeholder driven, holistic water resources model for Malawi: applying the CWatM hydrological model. 

Rebekah Hinton, Mikhail Smilovic, Dor Fridman, Bárbara Willaarts, Limbikani Banda, Kit Macleod, Mads Troldborg, and Robert Kalin

Groundwater is a key water resource. In Malawi it provides 82% of domestic, agricultural, and industrial water needs. However, despite its central importance to meeting social and economic targets, with over 14 million people reliant on groundwater to meet their everyday needs, the ‘unseen’ nature of groundwater makes management a challenge. Furthermore, minimal groundwater monitoring and measurement limit understanding of Malawi’s of water security. To guide water management policy and practice, comprehensive modelling of Malawi’s water resources, accounting for groundwater, is necessary. Here, to the best of our knowledge, we present the first process-based model of groundwater storage for the Lake Malawi Shire River Basin,which covers 94% of Malawi’s surface area, confirming prior estimates of groundwater storage.

We apply a global hydrological model, the Community Water Model (CWatM), to Malawi. To effectively represent Malawi’s water resources, we couple a high-resolution CwatM (5 arc minute resolution) with MODFLOW (5km resolution), enabling a high-resolution, national surface and groundwater model. Semi-structured stakeholder interviews were conducted to accurately represent Malawi’s water governance, identifying key adjustments that reflect national water resources. Model modifications were implemented based on stakeholder engagement. Notably, we implement model modification to account for small-holder agriculture and ‘dambo’ wetlands. National characteristics of water and sanitation were also included; the model was developed to include pit-latrine sanitation, used by over 90% of the population. Spatial variation domestic water use, both source and quantity, between urban and rural areas was also incorporated. Such model modifications significantly improved model performance, we suggest similar developments should be considered in modelling national water resources in other southern-African countries. 

Basin-wide scale model validation was undertaken by comparison with remote sensing observations of evapotranspiration, precipitation, and changes in total water storage (using GRACE Satellite data). Model calibration was undertaken by comparison to Global Data Runoff Centre (GRDC) discharge data.

We model that 660km³ of available groundwater is stored within aquifer units in Malawi (the currently available estimate of groundwater storage in Malawi is between 96.7 and 1,108 km³). Our model shows a consistent decline in groundwater levels since 1960 (the beginning of our study period). In total, we estimate a decline of 11.6km³ in groundwater storage in Malawi since 1960, raising significant concerns for future water security in the country. Not only does this model provide unprecedented insight into Malawi’s water security, particularly regarding the unseen but critical groundwater resource, further model development will enable forecasting of future water security issues under climate and socio-economic change.  

How to cite: Hinton, R., Smilovic, M., Fridman, D., Willaarts, B., Banda, L., Macleod, K., Troldborg, M., and Kalin, R.: A stakeholder driven, holistic water resources model for Malawi: applying the CWatM hydrological model., EGU General Assembly 2024, Vienna, Austria, 14–19 Apr 2024, EGU24-5783, https://doi.org/10.5194/egusphere-egu24-5783, 2024.

EGU24-5972 | ECS | Posters on site | HS5.1.3

Integrated modeling of climate change impacts on water resources: The Souss basin in Morocco 

Oumaima Attar, Youssef Brouziyne, Lhoussaine Bouchaou, Yassine Ait Brahim, and Abdelghani Chehbouni

Climate change has different impacts on water resources, altering hydrological cycles and exacerbating water-related challenges. Changes in precipitation patterns, including more frequent and intense droughts in semi-arid areas contribute to water scarcity and unpredictable availability. Being situated in central-western Morocco, the Souss basin (SB) is subject to high variations on many different scales and is strongly influenced not only by the variability of the climate but also by anthropogenic activities. SB is a strategic watershed that has considerable economic potential, mostly related to the agricultural sector, and has the typical assets and challenges of most Mediterranean watersheds. Allowing the best use of the limited water resources helps in planning better conservation and management strategies.  In this study, a DSS approach based on the ModSim-DSS model and recorded data about physical processes, hydraulic infrastructure features, and crop management was used to simulate the response of SB to climate change during the period 1990–2022. Observed rivers flow data were used to force the modeling framework over the study area. The results showed that the extent of climate change has had repercussions across the entire basin, particularly in terms of flow regimes and dam inflows. The simulation period witnessed a considerable decrease in the supply levels for the two most important dams in the region. Over the period between 2012 and 2019, there has been a notable reduction in water supplies for the Aoulouz dam, declining from an average of 100 Mm3 to 10 Mm3, representing a significant 52% decrease. Similarly, the ABDMNN dam experienced a substantial drop in water availability during the same period, decreasing from an average of 20 Mm3 to 3 Mm3, indicating a remarkable 89% decline. The differences among different supply sources fluctuate during the simulation period, resulting from changes in the available water inputs each year. The modelling approach used in this work helped identify the Souss basin’s potential challenges for best consideration in future sustainable water management plans.

How to cite: Attar, O., Brouziyne, Y., Bouchaou, L., Ait Brahim, Y., and Chehbouni, A.: Integrated modeling of climate change impacts on water resources: The Souss basin in Morocco, EGU General Assembly 2024, Vienna, Austria, 14–19 Apr 2024, EGU24-5972, https://doi.org/10.5194/egusphere-egu24-5972, 2024.

EGU24-10686 | ECS | Posters on site | HS5.1.3

Renewal of the Dutch National Hydrological Model 

Huite Bootsma, Martine van der Ploeg, and Albrecht Weerts

The Dutch National Hydrological Model currently consists of five physically different models linked together. The software components are slated for renewal which provides a rare opportunity to improve process description, flexibility, robustness, and computational efficiency of the hydrological concepts used for national simulations of the Netherlands. Through application of the current model for integrated modelling in the Netherlands we have identified three main challenges:

  • Representative parametrization of the regional groundwater-surface water interaction
  • Simulating highly managed large- and small-scale water bodies in integrated hydrological simulations
  • Simulating the unsaturated zone in integrated hydrological simulations of lowland regions

We will present (and would like to discuss) a 4-year PhD research plan to tackle these challenges.

The Netherlands is characterized by a dense network of surface waters for drainage requiring very fine meter-scale spatial discretization, which is unfeasible for national modelling. An analytic solution will be investigated and tested across the Netherlands to find effective parameters of the groundwater-surface water interaction and to understand its scaling behavior, providing better initial estimates and more insight to judge calibration results.

Secondly, a new code implementation to efficiently simulate highly managed surface water bodies in for regional and national applications, that is explicitly designed to be coupled to a saturated zone model, has been developed (Ribasim.jl, https://deltares.github.io/Ribasim/) and will be tested against measurements. We will focus on drought events, the groundwater-surface water interaction, and the trade-offs between (managed) surface water versus groundwater extraction.

Finally, we will compare different unsaturated zone concepts for a representative set of Dutch soil profiles, most with shallow water tables, and investigate the potential of scientific machine learning to provide computationally efficient, explainable simulation schemes. Drought events are also the primary interest here, with the aim to eventually estimate and understand crop and vegetation impacts.

The PhD project is being carried out under the Dutch Science Foundation (NWO) KIC-call ‘Climate-robust production systems and water management’ which focuses on research into solutions for robust agricultural systems, designing climate-robust and valuable nature-based sand landscapes of the future, increasing freshwater availability in coastal areas and modelling, monitoring, and predicting drought.

How to cite: Bootsma, H., van der Ploeg, M., and Weerts, A.: Renewal of the Dutch National Hydrological Model, EGU General Assembly 2024, Vienna, Austria, 14–19 Apr 2024, EGU24-10686, https://doi.org/10.5194/egusphere-egu24-10686, 2024.

EGU24-11639 | ECS | Posters on site | HS5.1.3 | Highlight

WaterCROP, an agro-hydrological model as a decision-supporting tool for irrigation water management 

Nike Chiesa Turiano, Marta Tuninetti, Francesco Laio, and Luca Ridolfi

Water governance runs from international organizations to local consortiums through national governance. Thanks to the implementation of water policies and laws, governments are expected to ensure both (water-dependent) food and energy security without undermining environmental protection. Nowadays, agriculture accounts for 70% of the global freshwater withdrawals, and, due to the world population growth and dietary changes, this value is expected to increase. In fact, despite irrigation systems being present only in 20% of the cultivated areas, irrigated crops account for 50% of the total world’s food production. This sets the basis for local water management requirements even in generally water-rich countries. Future alterations of the hydrological cycle due to climate change are expected to further emphasize the need for water governance as they are going to affect the availability of natural water resources.

Under these conditions, an effort is required to improve national agricultural water management efficiency and to reduce agriculture's vulnerability to climactic variability. Correct water management has, in fact, the potential benefit of regulating local withdrawals from water bodies, limiting excessive use of irrigation water, and reducing crop losses due to water stress.

In this framework, agro-hydrological models can be a powerful decision-supporting tool to evaluate water requirements by agriculture at different scales. In this direction, we propose the physically-based, agro-hydrological model WaterCROP. It describes the main components of the soil-atmosphere-plant continuum (such as effective precipitation, leakage, evapotranspiration, etc.) as a function of soil, crop, and period during the growing season. The hourly temporal resolution, the spatial scales (which can span from municipal to national), and the requirement for generally accessible input-data strike a balance between highly complex and simplified models. The first ones are usually site-specific, computational-demanding hydrological models that require very detailed inputs hardly available at the national scale, while the latter, being large-scale models, provide generally too coarse results for water management decision-making.

We apply the WaterCROP model to the Italian case, showing its use to describe irrigation water-saving scenarios both for cereals crops (wheat and maize) and cash crops (vine and olives).

How to cite: Chiesa Turiano, N., Tuninetti, M., Laio, F., and Ridolfi, L.: WaterCROP, an agro-hydrological model as a decision-supporting tool for irrigation water management, EGU General Assembly 2024, Vienna, Austria, 14–19 Apr 2024, EGU24-11639, https://doi.org/10.5194/egusphere-egu24-11639, 2024.

EGU24-13598 | ECS | Posters on site | HS5.1.3

Spatial Correlation Between Treated Wastewater Quality and its De-facto Reuse in Agricultural Irrigation: A Case Study of the Netherlands 

Nikola Rakonjac, Tessa Pronk, and Ruud P. Bartholomeus

Globally, there are ongoing efforts to secure a consistent and sustainable freshwater supply, with a crucial focus on optimizing the use of existing water resources. An important strategy in this endeavor involves exploring unconventional water resources, such as the reuse of treated wastewater (TWW). Currently, de-facto (or indirect) reuse of TWW is prevalent, characterized by the extraction from surface water bodies for various purposes, including the irrigation of crops in agricultural regions. The widespread nature of de-facto reuse poses a challenge, especially since irrigation activities often coincide with dry conditions, during which TWW constitutes a substantial proportion of many surface water bodies. Hence, these practices could contribute to notable pollution concerns, potentially serving as one of the pathways for the introduction of contaminants into the groundwater system, as well as the soil-plant systems, eventually entering the food chain.

A notable gap in existing research lies in the absence of consideration for the spatial relationship between irrigated fields, affected by TWW of varying quality, and its emission source, namely the wastewater treatment plant (WWTP). Conducting this type of analysis holds the potential for a dual interpretation: i) comprehending the influence of different WWTPs contributing to pollution dispersion on individual fields, and ii) understanding the impact of a specific WWTP on all fields utilizing the discharged TWW from that particular facility.

To explore this issue in the Netherlands, we leverage prior research and use the outcomes of the Water Framework Directive (WFD) Explorer, a national water quality model used for policy support. The model employs a simplified version of the advection-diffusion equation to simulate reactive transport processes from contaminant sources—in our case, 363 WWTPs—throughout the national surface water network under steady-state flow conditions. We assume a constant flux of 1000 [g/s] of a conservative tracer emitted from each WWTP and examine its transport – from the point source to 18927 surface water units (swu), 33015 surface water abstractions (swa), and toward 366886 irrigated fields - during representative wet and dry periods in the Netherlands. Specifically, for spatial linkage, we assume buffer zones of 500m to connect relevant swu with swa and, consequently, irrigated fields.

The spatial correlation and tracer propagation, primarily influenced by the dilution effect, offer direct insights into point i). To address point ii), we introduce the Spatial Impact Indicator (SII), quantifying a specific WWTP's influence on irrigated fields in its discharge area. This involves multiplying each field's area by the proportion of emitted tracer reaching it, summing these values for all affected fields, and then dividing by the total affected area. The SII serves as a weighted measure, emphasizing both the quality of TWW in individual fields and the overall affected area within the discharge zone of the WWTP. Furthermore, the SII enables the ranking of WWTPs and identification of the most impactful for indirect reuse in agriculture. This information could support decisions on which WWTPs to prioritize for improvement (e.g., transitioning into Water Factories) based on their environmental impact.

How to cite: Rakonjac, N., Pronk, T., and P. Bartholomeus, R.: Spatial Correlation Between Treated Wastewater Quality and its De-facto Reuse in Agricultural Irrigation: A Case Study of the Netherlands, EGU General Assembly 2024, Vienna, Austria, 14–19 Apr 2024, EGU24-13598, https://doi.org/10.5194/egusphere-egu24-13598, 2024.

Reservoirs play a pivotal role in mitigating floods and regulating river flows, particularly during irregular flows. In India, there are 6,138 large dams, yet only 119 are monitored by the Central Water Commission (CWC). In addition, the observations are available only from the year 2000 onwards. The long-term reservoir storage data are used in water management planning and flood control operations. It can also be used in calibrating hydrological models. However, long-term reservoir storage observations for the large dams in India are still lacking. We used hydrologic and hydrodynamic model framework to simulate the daily long-term reservoir storage data. We included more than 150 dams within the state-of-the-art Catchment-based Macroscale (CaMa) Flood model and generated the model simulated reservoir storage data. Further, we used the Long Short Term Memory (LSTM) algorithm to improve the model simulations using observations from CWC. We used the Global Reservoir Storage (GRS) data as observations for the dams not monitored by CWC. We intend to assess the application of the combined framework of the hydrological model and deep learning technique in simulating reservoir storage. Furthermore, we intend to analyse the long-term changes in the basin hydrology and the reservoir seasonal cycle. Long-term reservoir storage data can be utilized to plan water management and adaptation to climate change.

How to cite: Vegad, U. and Mishra, V.: Reconstructing Reservoir Storage of Indian Large Dams using Hydrological Model and Deep Learning Algorithms, EGU General Assembly 2024, Vienna, Austria, 14–19 Apr 2024, EGU24-14729, https://doi.org/10.5194/egusphere-egu24-14729, 2024.

EGU24-16079 | Posters on site | HS5.1.3

Which data are available to evaluate the representation of human activities in hydrological models in France? 

Fanny Sarrazin, Léonard Santos, Olivier Delaigue, Guillaume Thirel, Vazken Andréassian, and Charles Perrin

Human activities perturb the large-scale water cycle by withdrawing large amounts of freshwater for agriculture, manufacturing, energy production and drinking water supply, and by operating dams/reservoirs. The risk that human water demand exceeds freshwater availability widely threatens human water security and ecosystem health, in particular in the face of climate change. Therefore, national-scale hydrological models need to integrate representations of human activities to anticipate and address water scarcity and to support the design of adaptation strategies beyond the local scale. However, the lack of detailed observational datasets of human influence at a national scale hinders the development and evaluation of integrated modelling approaches.

This study focuses on processing a national observational dataset of human influence for hydrological modelling at the catchment scale in France, where climate change is expected to reduce water resources and increase water demand notably in the sector of irrigation. We collect data of water withdrawal, water release, reservoir operations from a large range of sources. These include national-scale datasets that are typically available at a coarse (annual) temporal resolution only and that are known to have large uncertainties, such as the French national database of quantitative water withdrawals. Covering a large spatial domain and attempting to account for uncertainties, our resulting dataset is a first step toward the development of robust integrated human-water system models at a national scale. 

How to cite: Sarrazin, F., Santos, L., Delaigue, O., Thirel, G., Andréassian, V., and Perrin, C.: Which data are available to evaluate the representation of human activities in hydrological models in France?, EGU General Assembly 2024, Vienna, Austria, 14–19 Apr 2024, EGU24-16079, https://doi.org/10.5194/egusphere-egu24-16079, 2024.

EGU24-19834 | Posters on site | HS5.1.3 | Highlight

Predicting water resources at Swiss national scale: the more models the better? 

Bettina Schaefli, Pascal Horton, Martina Kauzlaric, and Massimiliano Zappa

Hydro-climatic diversity is a key challenge for national-scale water governance. Switzerland represents, with this respect, an extremely interesting case study: This small (40’000 km2) country encloses a wide range of hydro-climatic regimes (with precipitation ranging from 300 mm/year to > 2500 mm/year) and provides water to several large European rivers (Rhône, Rhine, Danube, Po). Over the years, an impressive number of hydrological models have been specifically developed or implemented for this country by national or regional authorities and by academia. The purpose of the models ranges from water resources and energy assessment to natural hazard management and real-time forecasting. Most existing models focus on the individual catchment scale, with few models extending to the regional and country scale. For real-time flood forecasting, there is a recent effort from the authorities to reduce the number of models; for national drought forecasting, a single model is used at the national scale, but for selected catchments, the simulations of 11 hydrological models are available for stakeholders. Existing climate change impact and water availability predictions (mostly developed at research institutes and universities) rely on collections of models applied at the individual catchment scale, with divergent results. Accordingly, despite the impressive amount of models being developed and implemented in this country, a coherent, national-scale strategy for hydrological modelling is missing; there is no general agreement on best practices among (academic) hydrologic modellers and the access of stakeholders to modelling results or modelling resources is heterogeneous. In this presentation, we discuss what we learned from the past, future challenges for national-scale hydrological modelling and possible ways forward.

How to cite: Schaefli, B., Horton, P., Kauzlaric, M., and Zappa, M.: Predicting water resources at Swiss national scale: the more models the better?, EGU General Assembly 2024, Vienna, Austria, 14–19 Apr 2024, EGU24-19834, https://doi.org/10.5194/egusphere-egu24-19834, 2024.

EGU24-816 | ECS | PICO | HS5.1.4

Analysis of reservoir security indicators regarding water supply for energy, food, and ecosystem sectors on a climate change perspective 

Pedro Gustavo Câmara da Silva, Marcos Roberto Benso, Rebecca Sankarankutty, Gabriel Marinho e Silva, Eduardo Mário Mendiondo, and Martinus Servatius Krol

Climate change impacts water resource users across various sectors. In almost all biomes, socioeconomic patterns are barriers to accelerating the transition toward sustainable lifestyles, aiming to achieve the Sustainable Development Goals (SDGs) and improving the adaptation to mitigate hydrological risks. One strategy is to understand the operation of multipurpose reservoirs, which play a crucial role for guaranteeing water security. However, these systems face challenges on policy strategies due to the high number of variables, strong coevolution of change drivers, and underlying constraints of objective functions, in the pursuit of reducing vulnerability and increasing resilience. Overcoming these challenges is essential to decrease vulnerability and improve resilience in water management practices. These challenges are exacerbated in developing countries due to inadequate measurement of these factors, coupled with a lack of comprehensive hydrological information and operational strategies necessary to effectively manage the water demands of the energy, food, and ecosystem sectors. Thus, the objective of this study is to understand the patterns of reservoir operation in hydrological regions of Brazil and the problems around the absence of appropriate indicators to improve water security and adaptive management. This will be done by collecting information of the databases established by National Water and Sanitation Agency of Water (Agência Nacional de Águas e Saneamento – ANA), which is legally liable for implementing the National Water Resources Management System (SINGREH), created to ensure the sustainable use of rivers and lakes for the current and future generations in Brazil. The data collection will include the fixed and occasional demands associated with the reservoirs, as well as the data related to their water supply. Furthermore, watershed management plans, water allocation permit, characterization of dam structures and reservoir monitoring data will give support for the future analyses. Through an investigation centered on Brazil's hydrological regions and the National Water and Sanitation Agency, this study aims evaluate quantitative indicators for water security and adaptive management, we aim to optimize the operations of multipurpose reservoirs, enhancing their resilience in face of the environmental changes. Our goal is to propose operational indices that can assist the monitoring and implementation of national policies for ensuring water security and adaptive management of these reservoirs under environmental change.

Keywords: WEFE nexus, multipurpose reservoirs, adaptive water security, climate change.

How to cite: da Silva, P. G. C., Benso, M. R., Sankarankutty, R., Silva, G. M. E., Mendiondo, E. M., and Krol, M. S.: Analysis of reservoir security indicators regarding water supply for energy, food, and ecosystem sectors on a climate change perspective, EGU General Assembly 2024, Vienna, Austria, 14–19 Apr 2024, EGU24-816, https://doi.org/10.5194/egusphere-egu24-816, 2024.

Due to increased climate uncertainty, political instability and economic turbulence, many interstate river basins are in the midst of transforming their water governance strategies to embrace the aforementioned challenges. A prerequisite of achieving such transformation is to understand various types of rules that build the water governance structure of the river basins. Therefore, we demonstrate an institutional analysis approach that combines the institutional grammar and the institutional analysis and development framework’s rule typology to identify the various type of formal rules regulating the water resources in Australia’s Murray-Darling Basin (MDB). The institutional feature and key actors of the basin’s water governance structure under different water governance situations are also explored. The approach is built on an institutional content analysis tool named institutional grammar and the institutional analysis and development framework’s rule typology. Using the approach, we dissect the Murray-Darling Basin Agreement of Australian Government’s Water Act 2007 to generate data for institutional analysis and subsequently, identifying the number and types of rules that form MDB’s water governance structure. We identify that MDB’s water governance structure stresses on choice rules and information rules that regulate actors’ choice of actions and the flow of information. Nevertheless, there are rules that only present in certain water governance situations, which indicating its institutional features. For instance, the position rules that create the basin’s water resource administrative units are found only in the action situation of administration. The scope rules that delineate the physical outcome to be produced are found dominating the action situations of water resource appropriation. The co-thinking type of aggregation rules that control the requirement of stakeholder consultation are mostly found in the situation of basin planning. In conclusion, the proposed approach able to generate the quantitative and qualitative information that can be used to analyze the complex structure of water resource governance in a river basin. Therefore, the research contributes to the development of a systematic water institution analysis tool.

How to cite: Lai, C. H. and Zhao, J.: Applying institutional grammar to analyze the institutional structure of water resources governance in interstate river basins, EGU General Assembly 2024, Vienna, Austria, 14–19 Apr 2024, EGU24-1806, https://doi.org/10.5194/egusphere-egu24-1806, 2024.

EGU24-8661 | ECS | PICO | HS5.1.4

Integrating hydrological and economic modeling to assess the impacts of adaptation policies 

Haniyeh Salmani, Laura Gil-García, and Héctor González-López

Numerical models play a vital role in representing geohydrological processes and informing the management of surface and subsurface water flows. Yet, these models have limitations, such as not being able to determine the behavior and responses of water users, and the resulting pressures on water bodies via technological, land and water allocation choices. Microeconomic models can aptly complement geohydrological models due to their ability to quantify land and water use choices. Several studies have seeked to combine the strengths of water and human system models using modular or holistic couplings. In a recent review, assess 198 integrated human and water systems models and find that in 88 of these models the integration focuses either on the surface water or the groundwater system. As shown by (Salmani et al.,2023), Simulating surface water or groundwater alone may not accurately represent water system dynamics, leading to important modeling errors that may cascade to human systems and lead to bias forecasts.

This study develops a modular hydro-economic model that explicitly models surface water and groundwater systems. The water system is populated by SWAT+gwflow, which integrates the Soil Water Assessment Tool (SWAT+) with the groundwater module gwflow; while the human system is populated with a microeconomic positive mathematical programming (PMP) model that represents the behavior of irrigators. The proposed model is illustrated with an application to the overlapping Cega-Eresma-Adaja sub-basin and Arenales Aquifer in Spain.

The model setup is implemented in two steps. At first, the PMP is calibrated for each Agricultural Water Demand Unit, the basic irrigation water use unit in Spain, using observed land and water use data and socioeconomic data for the period (2015). Then, the SWAT+gwflow model is calibrated for 43 subbasins and 1247 HRUs from 1990 to 2020. This model was calibrated and validated in 14 observation gauges and 29 observation wells to evaluate the streamflow and head of the aquifer. The model showed a Nash-Sutcliffe efficiency of 0.65-0.85 and coefficient of determination of 0.7-0.9 for all stations in the baseline, indicating good simulation. The simulated groundwater head showed good agreement with observed well data, with a mean absolute error of less than 0.5 m in the baseline and other scenarios. Moreover, the rivers were found to be heavily dependent on groundwater discharge to streams.

Once the two models are calibrated, according to the river ministry policies derived from the historical droughts graph, a series of simulations in which irrigated crops land and water use are constrained across AWDUs are run in the PMP model in urgent or alert situations. The resultant crop portfolio in the PMP simulation is replicated in the SWAT+gwflow, and the water use and management practices updated to match those of the PMP. Finally, simulations are run with the SWAT+gwflow to assess the impact of land and water reallocations by irrigators on the surface water and groundwater systems. Results show that decreasing the amount of land and water used for irrigated crops can increase stream flow and lead to more normal conditions while increasing the portfolio of rainfed crops.

How to cite: Salmani, H., Gil-García, L., and González-López, H.: Integrating hydrological and economic modeling to assess the impacts of adaptation policies, EGU General Assembly 2024, Vienna, Austria, 14–19 Apr 2024, EGU24-8661, https://doi.org/10.5194/egusphere-egu24-8661, 2024.

EGU24-10090 | PICO | HS5.1.4

Use of simulations to evaluate the balance between recharge and pumping to contribute to the development of policies for sustainable groundwater use in the Kumamoto area, southern Japan 

Masatoshi Kawasaki, Motomitsu Sawada, Yasuhiro Tawara, Takamaru Kobayashi, Yo-ichi Fukuoka, Kazuhiro Tada, Jun Shimada, Takahiro Hosono, Kimio Katsuya, Keiichi Shin-no, Hitomi Koga, and Yasunori Nakahori

For sustainable use of groundwater, it is important to know the past and current water balance and the impact of changes in land and water use for working with stakeholder collectively. In order to understand these issues, a distributed hydrological model that includes the key processes of the regional hydrological system is considered to be a powerful tool, as it enables us to understand the impact of human activities at any given site.

In the Kumamoto region, which is almost 100% dependent on groundwater for drinking water, there have been attempts to understand groundwater flow and water balance qualitatively and quantitatively. For example, groundwater levels have been monitored for about 30 years or more, mainly by the local government, to understand the current status of groundwater in the Kumamoto area. Based on these data, a multi-stakeholder group including government, academia and the private sector has developed an integrated surface-subsurface model to reproduce long-term changes in groundwater levels (Kawasaki et al., 2023).

This presentation will present the results of several simulations using this model of possible future scenarios in the Kumamoto region, which identify key factors for sustainable groundwater use in the Kumamoto region.

How to cite: Kawasaki, M., Sawada, M., Tawara, Y., Kobayashi, T., Fukuoka, Y., Tada, K., Shimada, J., Hosono, T., Katsuya, K., Shin-no, K., Koga, H., and Nakahori, Y.: Use of simulations to evaluate the balance between recharge and pumping to contribute to the development of policies for sustainable groundwater use in the Kumamoto area, southern Japan, EGU General Assembly 2024, Vienna, Austria, 14–19 Apr 2024, EGU24-10090, https://doi.org/10.5194/egusphere-egu24-10090, 2024.

Knotters et al. (2024) use the monster metaphor to propose coping strategies to deal with uncertainties in Flood Risk Management (FRM). The uncertainty monster can come in different forms and shapes. Van der Sluijs (2005) considers four coping strategies to deal with the monster of uncertainty, to which Knotters adds two ones dealing with unwelcome uncertainty:

  • Monster exorcism consists of trying to reduce uncertainty even if that is not realisable.
  • Monster embracement consists of magnifying uncertainties possibly leading to trivialization of uncertainty.
  • Monster adaptation attempts to adjust uncertainty, rationalise risk mitigation and optimise a chosen utility (function).
  • Monster assimilation, wherein one learns from uncertainty (quantification) and accordingly makes changes.
  • Monster denial involves not mentioning or denying uncertainty as part of the strategy.
  • Monster anesthesia, wherein the monster of uncertainty is prevented by striving for consensus or agreeing about the quality of information.

In a mock case study based on stylising a realistic case of flooding, these coping strategies will be illustrated. High Beck is an urban stream of circa 2000m long with a drop of circa 100m before it flows into a main river. The beck intermittently floods a local neighbourhood next to a larger river, when its final culverted course is also blocked by high water levels in the river and the river’s new flood-defence walls (protecting against 1:200 year river floods). Using the graphical cost-effectiveness tool of Bokhove et al. (2020), three flood-mitigation measures (canal storage, upstream bunds, downstream storage) combine into five scenarios which provide protection against 1:50 year return-period beck floods. Each measure has co-benefits and there are associated breach probabilities and damage costs, to assimilate uncertainty. Depending on the choice of utility function, how do we value the monsters and fairies involved, in a just and science-based decision-making process, and choose the “best” solution among the five flood-mitigation scenarios? The discussion, without as-yet final answers, will also highlight the difficulties in obtaining the probabilities and damage/repair costs required for making (sufficiently) informed decisions.

  • Bokhove, M. Kelmanson, G. Piton and J.M. Tacnet 2020: A cost-effectiveness protocol for flood-mitigation plans based on Leeds’ Boxing Day 2015 floods Water 12(3), 652
  • Knotters, O. Bokhove, R. Lamb and P.M. Poortvliet 2024: How to cope with uncertainty monsters in flood risk management. Water Prisms. Cambridge University Press. In press.
  • J. van der Sluijs 2005: Uncertainty as a monster in the science-policy interface: four coping strategies. Water Science & Technology 52, 87–92.

How to cite: Bokhove, O.: Monster assimilation and adaptation in FRM: High Beck fluvial flood-mitigation case study, EGU General Assembly 2024, Vienna, Austria, 14–19 Apr 2024, EGU24-16096, https://doi.org/10.5194/egusphere-egu24-16096, 2024.

EGU24-16221 | PICO | HS5.1.4

Enhancing Decision Support through Hydrological Modeling and Scenario-Building: A Case Study in the Brantas River Basin, Indonesia 

Schuyler Houser, Gertjan Geerling, Gerard Pijcke, Reza Pramana, and Maurits Ertsen

Water managers and planners working within complex social-environmental systems are challenged with difficult choices when prioritizing interventions to manage water quality and reduce pollution from point and non-point sources. These choices are particularly important in low-resource environments where public funds must be carefully allocated. To support policy analysis for water quality management, a water quality modeling and policy consultation exercise was performed by Deltares, TU Delft, and government partners in the Brantas River basin, East Java, Indonesia. The modeling exercise combined mapped pollution source estimates for domestic wastewater and agricultural runoff with rainfall-runoff and pollution transport and fate models to demonstrate estimated impacts of various source-reduction scenarios on BOD loads along the main river. These outputs were used to inform deliberations regarding options to reduce water pollution and improve river health at a basin level. The model's ability to identify hotspots and assess the impact of targeted pollution reductions offers a powerful visual tool for policymakers to formulate geographically targeted interventions and identify the specific pollution source reductions that would yield the most substantial improvements. The case demonstrates the practical applications of scenario-building as an invitation for policy-makers to visually consider alternative interventions and focuses on lessons learned regarding capacities required to perform such activities, stakeholder engagement to build workable and meaningful model from an administrative perspective, and practical considerations for applying data-driven approaches to prioritization. 

How to cite: Houser, S., Geerling, G., Pijcke, G., Pramana, R., and Ertsen, M.: Enhancing Decision Support through Hydrological Modeling and Scenario-Building: A Case Study in the Brantas River Basin, Indonesia, EGU General Assembly 2024, Vienna, Austria, 14–19 Apr 2024, EGU24-16221, https://doi.org/10.5194/egusphere-egu24-16221, 2024.

EGU24-16397 | ECS | PICO | HS5.1.4

Addressing the groundwater impacts of informal water markets – coupled human-natural systems modeling of policy options for Jordan 

Christian Klassert, Jim Yoon, Katja Sigel, Bernd Klauer, Samer Talozi, Thibaut Lachaut, Philip Selby, Stephen Knox, Nicolas Avisse, Amaury Tilmant, Julien Harou, Daanish Mustafa, Josué Medellín-Azuara, Bushra Bataineh, Hua Zhang, Erik Gawel, and Steven Gorelick

Unreliable and unequal public water supply already affects around one billion urban residents around the world. In many cities, informal water markets have emerged to fill public supply gaps by delivering water via tanker trucks, depleting scarce rural groundwater sources. A quintessential example of this can be found in the highly water-scarce country of Jordan. In Jordan, intermittent public water supply and rapid urban growth have led to a surge of uncontrolled groundwater abstractions by pervasive illegal tanker water markets.

Here, we use a rigorous coupled human-natural systems model to assess a range of policy options for mitigating the groundwater impacts of informal water markets in Jordan with regards to their effectiveness and impacts on household water access. The model represents spatially distributed feedbacks between Jordan’s water sector and groundwater resources in country-wide scenario simulations until 2050. We find that investments in supply augmentation have limited impact on tanker water demand, unless they are combined with a more equitable and efficient distribution of public water supply. Jordan’s current policy of closing illegal tanker wells is found to impede the access of water-stressed households to tanker deliveries. Approaches for the legalization of tanker water markets provide more efficient policy options. Policy design is shown to be decisive for safeguarding household water access. Our findings show that understanding the role of informal water markets in urban water supply can be critical for reconciling sustainable groundwater management and household water security.

How to cite: Klassert, C., Yoon, J., Sigel, K., Klauer, B., Talozi, S., Lachaut, T., Selby, P., Knox, S., Avisse, N., Tilmant, A., Harou, J., Mustafa, D., Medellín-Azuara, J., Bataineh, B., Zhang, H., Gawel, E., and Gorelick, S.: Addressing the groundwater impacts of informal water markets – coupled human-natural systems modeling of policy options for Jordan, EGU General Assembly 2024, Vienna, Austria, 14–19 Apr 2024, EGU24-16397, https://doi.org/10.5194/egusphere-egu24-16397, 2024.

EGU24-16968 | PICO | HS5.1.4

Understanding Human-Water feedbacks 

Heidi Kreibich, Melissa Haeffner, Tobias Krüger, Saket Pande, and Anne Van Loon

The International Commission on Human-Water Feedbacks of the International Association of Hydrological Sciences (IAHS) focuses on better understanding the feedbacks between humans and water over decadal and centennial time scales. We are inclusive and interdisciplinary, inviting members from all research fields interested in this topic, including social sciences, economics, engineering, hydrology, etc.

Societies respond to hydrometeorological hazards by developing management measures, which can have a major, if not dominant, influence on risk and water ressources. For example, natural river systems in Europe have been greatly affected by the construction of dams and canals, which have altered the course of rivers and allowed the urbanisation of flood plains. However, the long-term effects of such measures are largely unknown due to complex interactions with other developments in the human-water system, such as climate change or socio-economic development. An example of a hypothesised long-term feedback mechanism is the construction of reservoirs for irrigation and the resulting population growth, which increases the exposure and vulnerability of society and leads to the construction of even more reservoirs, thus creating a feedback loop. There is an urgent need to understand the long-term dynamics of the human-water system in order to successfully implement climate change adaptation, disaster risk reduction, post-disaster recovery decisions, and to achieve the Sustainable Development Goals.

The aim of this presentation is to present and further motivate community activities that aim to better understand human-water feedbacks.

How to cite: Kreibich, H., Haeffner, M., Krüger, T., Pande, S., and Van Loon, A.: Understanding Human-Water feedbacks, EGU General Assembly 2024, Vienna, Austria, 14–19 Apr 2024, EGU24-16968, https://doi.org/10.5194/egusphere-egu24-16968, 2024.

EGU24-21719 | ECS | PICO | HS5.1.4

Co-production could improve the science-policy-practice nexus in hydrology: lessons from co-producing knowledge on flood risk in Tamale, Ghana 

Ben Howard, Cynthia Awuni, Frans Berkhout, Sam Agyei-Mensah, and Wouter Buytaert

Understanding of hydrological risk is increasing but much of it remains non-actionable. Consequently, interventions are seldom informed by the latest insights, limiting their effectiveness and resilience, especially in a non-stationary world. The co-production of knowledge in hydrology can result in more salient, useful, and usable outcomes that are used to directly inform decisions. Co-production is an interactive and complex process founded on relationships between science, society, practice, and policy. We are applying this approach to generate locally relevant understanding, evidence, and action on flood risk in Tamale, a city of ~500,000 people in northern Ghana. A team of citizens, practitioners, policy makers, and researchers from a range of disciplines are working together to understand the drivers and distribution of flood risk, as well as the effects of top-down and citizen-led adaptation. Knowledge is generated and validated in a series of stages and cycles and operationalized in different modes for different users. Whilst this is an ongoing process which continues to evolve, in this talk I will share lessons and experiences from the co-production approach in Tamale that may be translatable to other contexts. Co-production approaches represent tangible frameworks to improve the science-policy-practice nexus in hydrology and water resources management, and sharing good examples can expedite adoption.

How to cite: Howard, B., Awuni, C., Berkhout, F., Agyei-Mensah, S., and Buytaert, W.: Co-production could improve the science-policy-practice nexus in hydrology: lessons from co-producing knowledge on flood risk in Tamale, Ghana, EGU General Assembly 2024, Vienna, Austria, 14–19 Apr 2024, EGU24-21719, https://doi.org/10.5194/egusphere-egu24-21719, 2024.

EGU24-21738 | PICO | HS5.1.4

Open Hydrology for the Science-Policy-Practice interface: why and how 

Nilay Dogulu, Stephan Dietrich, Caitlyn Hall, and Koen Verbist

Openness, transparency and reproducibility are terms which have found their way into the scientific community, including hydrology. Recently, a set of principles and guidance on Open Science for hydrology researchers was introduced by Hall et al. (2022). However, an integrative and inclusive vision, by and for all research stakeholders in hydrology, with respect to science-informed services (practice) and decision making (policy) is currently missing.

Open Hydrology, in essence, refers to the conduct of hydrological research and delivery of hydrological services based on principles and approaches of Open Science. Open Hydrology can be an effective enabler of improved Science-Policy-Practice (SPP) interface by strengthening the role of hydrological sciences. Furthermore, adoption of open, transparent, and participatory approaches to hydrology can ultimately lead to wider accessibility (in support of inclusivity and equity), and more trust in science for all research stakeholders, including the society, thus facilitating reliable decision and policy making.

Our contribution highlights the potential of Open Hydrology for members of (water) research communities and infrastructures, hydrological service providers, research administrators and facilitators of research, national and regional governmental institutions in charge of water resources management, publishers, policy makers and funders, citizen science groups and initiatives. We will share examples of open data, open source, open education, open infrastructure, and open publishing initiatives, resources and tools while discussing their transformative potential for the SPP nexus.


Hall, C. A., Saia, S. M., Popp, A. L., Dogulu, N., Schymanski, S. J., Drost, N., van Emmerik, T., and Hut, R.: A hydrologist's guide to open science, Hydrol. Earth Syst. Sci., 26, 647–664, https://doi.org/10.5194/hess-26-647-2022, 2022.

How to cite: Dogulu, N., Dietrich, S., Hall, C., and Verbist, K.: Open Hydrology for the Science-Policy-Practice interface: why and how, EGU General Assembly 2024, Vienna, Austria, 14–19 Apr 2024, EGU24-21738, https://doi.org/10.5194/egusphere-egu24-21738, 2024.

EGU24-21744 | PICO | HS5.1.4

Doing Hydrology forward for Science-Policy-Practice nexus at the intergovernmental level: the case of World Meteorological Organization (WMO)  

Nilay Dogulu, Nicolas Franke, Hwirin Kim, Sulagna Mishra, and Stefan Uhlenbrook

The World Meteorological Organization (WMO) is an intergovernmental United Nations (UN) agency specialised in weather, climate and water-related infrastructure and services. It enables international cooperation at a global scale to promote scientific research based on the integrated Earth system approach, and facilitates the global exchange of Earth observation data and products.

The global agenda on sustainable development is strongly intertwined with intensifying hydrological extremes and issues of water availability and quality impacting the environment, food and energy security. The UN 2023 Water Conference further reiterated the role of water at the heart of climate action which evolved as a powerful opportunity to create innovative ways of working with many and diverse stakeholders. Thus, handling of hydrology at institutions/organisations requires effective cross-coordination and interdisciplinary approaches within not only related disciplines but also across science, policy and practice sectors.

The Hydrology, Water Resources and Cryosphere Branch at WMO’s Services Department contributes to strengthening the Science-Policy-Practice (SPP) interface through its various activities ranging from the State of Global Water Resources Report to the Hydrology Coordination Panel. The WMO Hydrology Action Plan and the WMO Hydrological Research Strategy (2022‑2030) have special emphasis on science-informed operational hydrology and effective water science-policy. In particular, the recently established unit “Global Processes and Water Policy” is aimed at highlighting the role of hydrology at the intergovernmental level, on platforms such as the Conference of the Parties (COP), the supreme decision-making body of the UN Framework Convention on Climate Change (UNFCCC).

In this talk, we will introduce ongoing efforts of the Hydrology, Water Resources and Cryosphere Branch at WMO, and share our experiences working towards the SPP nexus.

How to cite: Dogulu, N., Franke, N., Kim, H., Mishra, S., and Uhlenbrook, S.: Doing Hydrology forward for Science-Policy-Practice nexus at the intergovernmental level: the case of World Meteorological Organization (WMO) , EGU General Assembly 2024, Vienna, Austria, 14–19 Apr 2024, EGU24-21744, https://doi.org/10.5194/egusphere-egu24-21744, 2024.

HS5.2 – Water-Energy-Food-Ecosystem Nexus

EGU24-674 | ECS | Posters on site | HS5.2.1

Utilising a system dynamics framework to investigate socio-environmental impacts of hydropower in the upper Brahmaputra basin  

Isha Smiti Thakur, Susan Hegarty, and Jimmy O'Keeffe

Emerging economies are increasingly constructing large hydropower projects to meet growing energy demand. The Yarlung Tsangpo-Brahmaputra transboundary basin shared by China, India, and Bangladesh holds enormous untapped hydropower potential, attracting ambitious hydropower development plans in the region. The transboundary basin is a highly biodiverse region sensitive to environmental and anthropogenic stressors. Hydropower projects are advertised as powerful development infrastructure that can provide greater access to clean water and clean energy. However, these projects also present grave environmental challenges including the degradation of ecosystems and their services, biodiversity loss and increased risk of natural hazards like earthquakes, landslides and floods. Further, dams have social and economic effects like population displacement and loss of livelihoods. Such effects are gendered: women are often disproportionately impacted. Stakeholder engagement with indigenous and other local communities is often absent or negligible in planning these hydropower projects. The projects usually export the electricity produced to far-away urban centres, leaving basin populations energy-poor, further aggravating existing inequities in resource access.

This paper presents a systems model examining the interactions between the socio-economic, ecological, hydrological, and institutional structures operating in the river basin to investigate the socio-environmental impacts of hydropower development in the region. The systems model has been conceptualised using stakeholder inputs gathered through fieldwork in the upper Brahmaputra basin. The model will especially examine interlinkages between hydropower development-induced systemic changes and socio-ecological well-being. 

How to cite: Thakur, I. S., Hegarty, S., and O'Keeffe, J.: Utilising a system dynamics framework to investigate socio-environmental impacts of hydropower in the upper Brahmaputra basin , EGU General Assembly 2024, Vienna, Austria, 14–19 Apr 2024, EGU24-674, https://doi.org/10.5194/egusphere-egu24-674, 2024.

Power systems are inherently water dependent. Future energy development needs to jointly consider the interaction between power and water systems, especially the stream dynamics related to both water temperature and availability. Such connection is particularly pronounced in thermal and hydro power plants, where once-through cooling systems face disruptions from high intake water temperature and water scarcity, and hydropower generation is affected by drought conditions. Equally important is the impact of power system operations on water temperature and availability. For instance, warm water discharged from thermal power plants can increase water temperature, while cool water released from reservoir bottoms can cause temperature declines. Additionally, hydropower operations can alter water availability through changes in reservoir storage. Despite the importance of those factors, existing electricity capacity expansion models typically do not fully consider such feedbacks between stream dynamics and power system operations, as they lack the capability to accurately represent cascade reservoir operations and cooling processes for thermal power plants at sufficiently high spatial-temporal resolutions. To address this research gap, we develop an integrated model coupling a hydrological model (Community Water Model, CWatM), a stream temperature model (River Basin Model, RBM), and a novel electricity capacity expansion model (Pathways for Renewable Energy Planning coupling Short-term Hydropower OperaTion, PREP-SHOT, https://github.com/PREP-NexT/PREP-SHOT) to better represent the two-way feedback between stream dynamics and power system operations. The coupled model, applied in Mainland Southeast Asia featured by a diverse array of hydropower reservoirs and thermal power plants, supports informed, sustainable, and environmentally friendly planning for future energy development in the region.

How to cite: Liu, Z. and He, X.: Improved Representations of Water-Power System Interactions to Inform Clean Energy Transition for Mainland Southeast Asia, EGU General Assembly 2024, Vienna, Austria, 14–19 Apr 2024, EGU24-870, https://doi.org/10.5194/egusphere-egu24-870, 2024.

EGU24-1127 | ECS | Posters on site | HS5.2.1

Stakeholders’ engagement for the identification of measures supporting ecosystem services within the Water-Energy-Food-Ecosystems (WEFE) nexus in the Adige River basin (Italy). 

Beatrice Sambo, Silvia Cocuccioni, Fabio Carnelli, Anna Sperotto, Stefano Terzi, Silvia Torresan, Massimiliano Pittore, and Andrea Critto

Water, Energy and Food represent an interconnected nexus, with Ecosystems and the services they provide inextricably bound up in the “WEFE nexus”. Within these sectors, policies and decisions have traditionally been implemented independently, sometimes resulting in a lack of coordination and significant trade-offs among different sectors, manifesting in challenging management of different resources. To proficiently oversee resources and prevent conflicts among users, numerous pertinent policies should be thoughtfully crafted to tackle the interconnectedness of the nexus across various spatial and temporal scales.

The Adige River basin, located in the northeast area of Italy, presents a complex institutional, socio-economic, and bio-physical context; this situation is reflected on the management of resources’ availability, particularly during water scarcity emergencies. Indeed, due to their sectorial nature, these policies fail to comprehensively consider the impacts on other sectors, creating complexities in effective management. The purpose of this analysis is to develop a conceptual model which allows the identification and qualitatively characterization of the relations among the WEFE sectors supported by sectoral policies and by a set of measures aimed at support the ecosystems and their services in a WEFE nexus perspective. The measures, represented by quantitative targets, will be translated into future scenarios to assess ecosystem services based on future land uses.

As a first step, after gathering peer-reviewed literature, grey literature, and sectoral policies, an initial conceptualization of the sectors engaged in the WEFE Nexus was conducted. The conceptual model tries to provide insight into the entry points of significant WEFE policies within the nexus, while also initiating an understanding of the broader systemic effects that potential policy implementation might have. It is a visual depictions of systems that encompass crucial variables and illustrate their interconnections. The integration of local polices within the conceptual model is fundamental in identifying relevant interconnections, tailored for the case study area. To pinpoint measures and goals intended to support ecosystem services in the Adige River basin, policies associated with the ecosystems have been emphasized. Additionally, other policies have been examined from diverse sectors that target ecosystems and land components, with the objective of defining potential measures viable for future scenarios, all aimed at bolstering the ecosystem services component. Subsequently, the measures determined by the selected policies have been examined and grouped according to their typology: regulation, market and incentives. For each measure, one or more targets have been outlined based on the analyzed policies and on stakeholders’ perspectives. The selected targets are important for determining whether the defined connections among sectors can be supported by the policies. Indeed, engaging stakeholders representing diverse WEFE sectors, including governmental bodies, local communities, academia, is vital in undertaking this collaborative approach because they collaborate with knowledge, expertise, and perspectives crucial for defining targets characterizing the future scenarios that preserve and enhance ecosystem services while ensuring sustainable development within the Adige River basin.  

 The results of this study are part of the Horizon2020 project NEXOGENESIS and pave the way for future analysis on the assessment of ecosystem services based on future land use scenarios.

How to cite: Sambo, B., Cocuccioni, S., Carnelli, F., Sperotto, A., Terzi, S., Torresan, S., Pittore, M., and Critto, A.: Stakeholders’ engagement for the identification of measures supporting ecosystem services within the Water-Energy-Food-Ecosystems (WEFE) nexus in the Adige River basin (Italy)., EGU General Assembly 2024, Vienna, Austria, 14–19 Apr 2024, EGU24-1127, https://doi.org/10.5194/egusphere-egu24-1127, 2024.

It is important to analyze the efficiency of agricultural water and land resources utilization in macro-regions from the perspective of synergistic inputs and "economic-social-ecological" benefits for the sustainability of agricultural production. This paper clarified the connotation of agricultural water and land resources use efficiency by combining the broad concept of water resources and the characteristics of "multiple inputs - multiple outputs" in agricultural production, constructed the Super-SBM(Super slacks based measure) model and Super-Undesirable-SBM(Super undesirable slacks based measure) model using data envelopment analysis to measure the production allocation efficiency. The Super-SBM model and Super-Undesirable-SBM model were used to measure the efficiency of agricultural water and land resources utilization of the concept. Agricultural water and land resources utilization efficiency without considering ecological benefits (WLUE), agricultural water and land resources utilization efficiency with considering ecological benefits (WLUEE), water resource utilization efficiency loss (WUEL) and arable land resource utilization efficiency loss (LUEL) were measured for 51 counties in the study area, taking the Shandong Yellow Diversion Irrigation District as an example. By comparing and analyzing the WLUE and WLUEE measurement results, WUEL and LUEL decomposition results, the characteristics of agricultural water and soil resource utilization and the size difference of the two resource utilization efficiency losses in each county of the study area were revealed, and the counties of the study area were classified into four types: green and efficient production type, ordinary efficient production type, green and inefficient production type and ordinary inefficient production type. This paper proposed targeted improvement measures for agricultural soil and water resource use efficiency in each county and a new perspective for the study of agricultural soil and water resource utilization efficiency. The research results are conducive to promoting the sustainable development of agricultural production in the study area.

How to cite: Liu, C.: Agricultural Water and Land Resources Use Efficiency Based on Green Production and Resources Synergy, EGU General Assembly 2024, Vienna, Austria, 14–19 Apr 2024, EGU24-2396, https://doi.org/10.5194/egusphere-egu24-2396, 2024.

EGU24-3362 | Orals | HS5.2.1

 Inter-Sectoral Trade-offs in Large Scale Land Acquisitions and Implications for Household Health and Livelihood 

Marc Muller, Julie Faure, Kyle Davis, Piyush Mehta, Davide Chiarelli, Cristina Rulli, Paolo D'Odorico, Jampel Dell'Angelo, and Leonardo Bertassello

The recent two decades have marked a significant increase in transnational land investments, fueled by growing demands for food, water, and energy. This global land rush, primarily affecting rural areas in low and middle-income countries, where it often contributes to ongoing transitions from smallholder farming into large-scale commercial agriculture. A key aspect of this transition is the inter-sectoral trade-offs at the nexus of food, water, energy, and the environment, where global demands intersect with local health, livelihoods, and ecosystems. Most existing studies have focused on individual impacts of land acquisitions on these sectors, but a comprehensive understanding of (i) the trade-offs across sectors and (ii) their implications for household health and livelihoods is lacking. Our study addresses these gaps, using a clustering technique to analyze a unique dataset of over 160 georeferenced land deals. This method helps categorize the interplay and trade-offs between the impacts on food, energy, water, and the environment. By linking these trade-offs to specific characteristics of land deals, we identify distinct archetypes, each necessitating tailored policy responses. The extent of household health and livelihood impacts varies across these archetypes. We assess these implications using data from approximately 1.3 million households from 22  countries. This novel approach, merging a global analysis of sectoral impacts with local household effects, aims to provide insights for targeted policies to ensure a sustainable and equitable agrarian transition.

How to cite: Muller, M., Faure, J., Davis, K., Mehta, P., Chiarelli, D., Rulli, C., D'Odorico, P., Dell'Angelo, J., and Bertassello, L.:  Inter-Sectoral Trade-offs in Large Scale Land Acquisitions and Implications for Household Health and Livelihood, EGU General Assembly 2024, Vienna, Austria, 14–19 Apr 2024, EGU24-3362, https://doi.org/10.5194/egusphere-egu24-3362, 2024.

EGU24-3487 | Posters on site | HS5.2.1

Trade-offs in hydropower reservoir operation under the chain of uncertainty 

Georgia Konstantina Sakki, Andrea Castelletti, Christos Makropoulos, and Andreas Efstratiadis

The Water-Energy-Food-Ecosystem nexus is characterized by synergies, complementarities and conflicts, and thus its management is a demanding task. This becomes more challenging when socioeconomic influences are embedded. Key components of this nexus are multipurpose water reservoirs that provide drinking water, electricity, agricultural water for food production, and ecosystem services. These systems are driven by inherently uncertain processes, both hydroclimatic and human-induced (e.g., legal regulations, strategic management policies, real-time controls, and market rules), and thus their management should account for them. In this vein, this research proposes an uncertainty-aware methodology for assessing the long-term performance of hydropower reservoirs. Specifically, we investigate and describe in stochastic terms the main uncertain drivers i.e., rainfall, water demands, and energy scheduling, and eventually explore the cascade effects of the uncertainty chain. The modeling framework is stress-tested on a hydropower reservoir in Greece, Plastiras, which has been subject to challenging socioeconomic conflicts during its entire 65-year history. To estimate the water targets, we employ a statistical analysis of historical abstractions, concluding that the irrigation demand is strongly correlated with the reservoir level while it is negatively correlated with antecedent rainfall. For the estimation of the power plant’s energy target, we adopt a copula-based approach, in which the desirable releases for energy production are dependent on day-ahead electricity prices. In particular, we adopt three policies, i.e., conservative, median, and energy-centric, that refer to 95%, 50%, and 5% quantiles of the copula. Finally, to account for the hydroclimatic and market process uncertainties, we are taking advantage of stochastic models for the generation of synthetic rainfall and electricity price data, respectively. Our findings indicate that the cascade effects of the joint uncertainties are crucial for all operation policies. Specifically, in terms of profitability the energy-centric and the median are similar, while from a water supply and irrigation reliability perspective, the uncertainty range of this policy is wider, thus making it unacceptable for some scenarios. Consequently, the conventional approach of ignoring uncertainty in policy selection may result in misleading perceptions for the operator, eventually guiding to sub-optimal reservoir management. 

How to cite: Sakki, G. K., Castelletti, A., Makropoulos, C., and Efstratiadis, A.: Trade-offs in hydropower reservoir operation under the chain of uncertainty, EGU General Assembly 2024, Vienna, Austria, 14–19 Apr 2024, EGU24-3487, https://doi.org/10.5194/egusphere-egu24-3487, 2024.

EGU24-3584 | ECS | Posters on site | HS5.2.1

Including glacier storage change and reservoir management into the Community Water Model to assess vulnerabilities and enhance resilience in the Climate-Land-Energy-Water nexus 

Jessica Fennell, Peter Burek, Mikhail Smilovic, Zeeshan Virk, Ali Torabi Haghighi, Stephanie Eisner, Stein Beldring, Wai Kwok Wong, Jens Kværner, Peter Berg, Thomas Bossard, and Björn Klöve

Water, energy, and food security are threatened by changes in climate. Shifts in rainfall patterns and increases in temperature affect availability of catchment water resources, particularly when hydrological regimes are rainfall-limited, snow-dominant or influenced by glaciers. The sectors dependent on those water resources are therefore more at risk. To evaluate resource availability, sector interdependencies and overall vulnerability of a catchment, a nexus approach can be used. More holistic solutions can then be developed, increasing the catchment’s resilience to changes in future. However, difficulties lie in capturing the dynamics of climate, land, energy, and water systems together. In Norway for instance, this often includes snow, glaciers, and the management of reservoirs for hydropower production, and few nexus methods include these features. To address this, we selected the Community Water Model (CWatM) and made several new developments. CWatM is a widely available, easily adjustable hydrological model on a 1km x 1km daily resolution. It has the facility to include multiple crop types, and domestic, agriculture and industry water demands, therefore highly suitable for nexus assessment. The new developments to CWatM mean that seasonal changes in both reservoir and glacier water storage can now be assessed, so how these have affected, and may affect resilience to changes in climate in future could be evaluated. To test the model developments, we applied the CWatM model to the Otta catchment in Innlandet, Norway. Three large glacial bodies, and four hydropower reservoirs provide water storage to an otherwise rain-limited catchment (~300mm/year). Water resources are required for consistent hydropower production throughout the year, agriculture, and forestry, as well as white water rafting-dependent tourism. These competing demands, alongside the melting of glaciers due to climate change, have the potential to put a large amount of strain on the limited water resources. Results showed that CWatM with the new developments successfully represented the dynamics of stream discharge, glaciers, and reservoir water storage in the Otta catchment. Future work will focus on assessing the vulnerability and resilience of the Otta catchment to climatic extremes given historic and potential future changes in storage with climate change. Wider application of CWatM and the new developments could improve nexus evaluation of other catchments in Norway and worldwide and highlight opportunities for greater resilience to changes in climate.

How to cite: Fennell, J., Burek, P., Smilovic, M., Virk, Z., Torabi Haghighi, A., Eisner, S., Beldring, S., Kwok Wong, W., Kværner, J., Berg, P., Bossard, T., and Klöve, B.: Including glacier storage change and reservoir management into the Community Water Model to assess vulnerabilities and enhance resilience in the Climate-Land-Energy-Water nexus, EGU General Assembly 2024, Vienna, Austria, 14–19 Apr 2024, EGU24-3584, https://doi.org/10.5194/egusphere-egu24-3584, 2024.

EGU24-5283 | ECS | Orals | HS5.2.1

Economic impact of a drought through the integration of hydro-economic and macroeconomic models 

Ángela Valle-García, Nazaret M. Montilla-López, and Carlos Gutiérrez-Martín

The global demand for freshwater has been steadily increasing, aligning with the growth of the world population, the rise in new demands in other economic sectors, and the supply decrease as a consequence of climate change. This trend has resulted in elevated consumption rates. The closure of river basins further intensifies water shortages, necessitating effective demand-side policies, particularly in agriculture. The allocation of water rights is crucial in managing limited water resources. The integration of hydro-economic modeling, a tool combining biophysical and socioeconomic factors, aids in water resource planning and policy formulation.

The primary objective is to analyze the effects of linking a hydro-micro-economic model with a macro-economic model. The study focuses on the Guadalquivir River Basin (GRB) in southern Spain, using a hydro-economic model and a Computable General Equilibrium (CGE) model for the Andalusian economy. The models are interconnected, providing insights into the feedback between the agroeconomic sector and the regional economy.

The hydro-economic model comprises nodes representing the hydrological system and economic agents with agricultural and urban water demands. Agricultural demands are calibrated using Positive Mathematical Programming to simulate farmers adapting to water scarcity. The CGE model, calibrated at a regional level, addresses macroeconomic aspects. The models exchange information on commodity prices and land use changes.

The study applies the Drought Management Protocol of the GRB, reducing water inflow in the basin by 25%. In this way, results indicate that the macroeconomic model mitigates the economic impact of reduced crop area due to drought by increasing prices. Thus, it is demonstrated that from the producer's perspective, more is gained due to this price effect, resulting in an increase of up to 4.5% in the producer's gross margin. The coupling of models enables a comprehensive understanding of the economic effects of drought, taking into account both micro and macroeconomic perspectives. This effect cannot be observed without the linkage to the macro model when considering only the hydro-economic model.

In conclusion, the coupling of a hydro-economic model and a macro-economic model proves effective in addressing changes in commodity prices resulting from drought-induced reductions in crop areas. This integration attenuates the economic impacts of drought by accounting for the price effect.

How to cite: Valle-García, Á., Montilla-López, N. M., and Gutiérrez-Martín, C.: Economic impact of a drought through the integration of hydro-economic and macroeconomic models, EGU General Assembly 2024, Vienna, Austria, 14–19 Apr 2024, EGU24-5283, https://doi.org/10.5194/egusphere-egu24-5283, 2024.

EGU24-7614 | ECS | Orals | HS5.2.1

Reoperating hydropower dams to improve sediment connectivity in the Mekong river basin 

Bruno Invernizzi, Marco Tangi, Shanti Mahto, Stefano Galelli, and Andrea Castelletti

Global water resources face increasing pressure from growing demands for food, energy, improved living standards, and complex regional water governance. Within the Mekong River basin, these factors triggered the rapid development of several large hydropower dams, provoking cumulative impacts on the river sediment connectivity. Many studies have focused on determining optimal dam portfolios by considering factors such as dam locations and sizes to improve sediment transport downstream. Yet, the potential for dam operations to mitigate dam impact on sediment dynamics while preserving hydropower generation targets has not been explored.  

Our work focuses on the Sekong, Sesan, and Srepok (3S) river basin, an important tributary of the Mekong River, where more than 50 dams have been built over the last two decades. To evaluate the impacts of these dams and their re-operations on sediment trapping and routing and hydropower production, we developed an integrated modelling framework combining models of hydrological processes, dam operation, and sediment connectivity. Specifically, we integrate VICRes, a large-scale hydrological-water management model that dynamically represents water reservoirs and their operations, and D-CASCADE, a dynamic basin-scale sediment routing model. Among the over 50 dams constructed in the basin, our focus is on the 26 largest hydropower dams. Their water release policies are modeled by VICRes through a rule curve characterized by four parameters, which are the maximum and minimum water levels the reservoir should reach and the specific days of the year on which those levels should be attained.

Our results indicate that the 3S river basin has lost approximately 60% of its annual outlet sediment load due to the cumulative impact of its largest hydropower dams. Moreover, the basin is experiencing an annual loss of approximately 0.32% of its total water storage capacity due to sediment trapping by reservoirs. However, smaller reservoirs are experiencing more pronounced reductions in storage capacity with losses reaching up to 3% per year. Ultimately, reservoir sediment depositions and the subsequent decrease in storage capacities are impacting reservoir water releases and, consequently, hydropower production. Despite being minimal, the interaction between hydrology and sediment dynamics exists, and are likely to accumulate as dams continue to operate over long horizons.

We then coupled the integrated model with a multi-objective evolutionary algorithm to derive Pareto-optimal configurations of coordinated water release policies for multiple reservoirs, minimizing trade-offs between energy generation and outlet sediment delivery. We initially selected a subset of 8 reservoirs, optimizing their standard rule curves with EMODPS. Subsequently, a second optimization was conducted, improving reservoir policies by considering a more complex rule curve with 12 parameters. Our analysis reveals that the operational space of the existing reservoir configuration is limited, and dam reoperation can only marginally enhance the 3S sediment loads.  This outlines the importance of integrating reservoir water release strategies with sediment release policies, such as drawdown flushing. By considering these strategies, the tradeoff between hydropower production and outlet sediment loads would have been more pronounced. Consequently, the re-operation of dams could play a more significant role in mitigating hydroelectric production losses.

How to cite: Invernizzi, B., Tangi, M., Mahto, S., Galelli, S., and Castelletti, A.: Reoperating hydropower dams to improve sediment connectivity in the Mekong river basin, EGU General Assembly 2024, Vienna, Austria, 14–19 Apr 2024, EGU24-7614, https://doi.org/10.5194/egusphere-egu24-7614, 2024.

EGU24-7737 | Posters on site | HS5.2.1

Is the restoration of natural flows enough to reach a good ecological status of rivers? 

Chiara Arrighi, Marco De Simone, and Fabio Castelli

The objective of the European Water Framework Directive WFD (60/2000/EC) is to achieve or maintain at least a good ecological status of surface water bodies also by identifying appropriate e-flows. Water Management Plans issued by the Hydrographic District Authorities, based on the knowledge of the amount of water resources available, define e-flows and permitted water abstractions to support many human activities, e.g. domestic, agricultural etc. The objective of this work is to assess if the theoretical restoration of natural flows in river catchments allows to achieve a good ecological status of rivers. The method is based on the evaluation of natural and actual flows based on a 20-years water balance simulation implemented with a distributed, vector&raster based hydrological model capable of describing anthropogenic alterations, e.g., point abstractions, releases, reservoir regulations, etc. A new dimensionless index of eco-hydrological distance is defined to measure how far is a river flow from its ecological objectives based on actual flow regime and pressures acting on the catchment (e.g., land use, climate). The method is applied to a region in central Italy, with ca. 11,000 river reaches and mediterranean climate, where almost 50% of water bodies currently fails to achieve WFD objectives. The results show that for the summer season, which is the driest one in the study area, most of the rivers are pushed towards the limits of bad ecological status. Moreover, in 48% of rivers the summer natural flows, if restored, will not guarantee a good ecological status, due to the significant eco-hydrological distance from the target e-flows.


Ackonowledgements

This study was carried out within the RETURN Extended Partnership and received funding from the European Union Next-GenerationEU (National Recovery and Resilience Plan – NRRP, Mission 4, Component 2, Investment 1.3 – D.D. 1243 2/8/2022, PE0000005). The study also received funding from the Hydrographic District of the Northern Appenines, Florence (Italy) Agreement “Esecuzione delle attività finalizzate alla redazione dei bilanci idrici su base modellistica dei corpi idrici superficiali appartenenti ai bacini toscani del distretto idrografico dell’Appennino Settentrionale ed alla definizione della metodologia da utilizzare per la definizione del deflusso ecologico”.

How to cite: Arrighi, C., De Simone, M., and Castelli, F.: Is the restoration of natural flows enough to reach a good ecological status of rivers?, EGU General Assembly 2024, Vienna, Austria, 14–19 Apr 2024, EGU24-7737, https://doi.org/10.5194/egusphere-egu24-7737, 2024.

The Colorado River is a lifeline for the American Southwest, supporting over 5.5 million irrigated acres of agricultural land and a population of 40 million people. The state of Colorado’s West Slope basins - six subbasins of the Colorado River that lie on the western side of the continental divide - are critical headwaters of the Colorado River, delivering over 60% of inflows to the Colorado River Basin’s (CRB) Lower Basin in an average year. The West Slope basins also play a vital role in supporting the state of Colorado’s local economy and natural environment. Agricultural production and recreational activities supported by water resources within the West Slope basins are estimated to contribute over $6 billion annually to the state’s economy. Streamflow in the West Slope basins sustains populations of endangered fish not found outside the CRB. Balancing the multisectoral water demands in the West Slope basins is an increasing challenge for water managers. Droughts in the 20th and early 21st centuries have reduced reservoir levels, lowered environmental flows, and threatened agricultural production. Internal variability - irreducible uncertainty stemming from interactions across non-linear processes within the hydroclimate system - complicates future vulnerability assessments. The historical streamflow record in the West Slope represents a single realization of an inherently stochastic process, which does not capture the full extent of internal variability and plausible hydroclimatic extremes. Climate change further exacerbates drought vulnerability in the West Slope basins, with significant streamflow declines projected by mid-century.   

This work contributes a detailed analysis of multisectoral drought vulnerabilities in the West Slope basins that systematically accounts for both internal variability and climate change. We contribute a novel multi-site Hidden Markov Model (HMM)-based synthetic streamflow generator to create streamflow across the six West Slope basins that better characterizes the region’s hydroclimate and drought extremes. We then route an ensemble of streamflows generated by the HMM generator through StateMod, the state of Colorado’s water allocation model, to evaluate spatially compounding drought impacts across the West Slope basins. We capture the effects of climate change by perturbing the HMM to generate a climate-adjusted ensemble of streamflows that reflects plausible changes in climate. Our results show that drought events emerging from the system’s stationary internal variability in the absence of climate change can have significant impacts that exceed extreme conditions in the historical record, including unprecedented lows in deliveries to the Lower basin (e.g., Lake Powell), reduced environmental flows, low reservoir levels, and significant agricultural shortages. Our results further illustrate that even relatively modest levels of plausible climate changes can cause a major regime shift where extreme drought impacts become routine. These results can inform future Colorado River planning efforts, and our methodology can be expanded to other snow-dominated regions that face persistent droughts.

How to cite: Gold, D., Reed, P., and Gupta, R.: A Multi-site Hidden Markov Model-Based Synthetic Streamflow Generator to Evaluate Multisectoral Drought Vulnerability in Colorado’s West Slope Basins, EGU General Assembly 2024, Vienna, Austria, 14–19 Apr 2024, EGU24-7870, https://doi.org/10.5194/egusphere-egu24-7870, 2024.

EGU24-9029 | ECS | Posters on site | HS5.2.1

Controlled drainage with subirrigation: automatic control to manage freshwater use 

Janine A. de Wit, Marjolein van Huijgevoort, Jos van Dam, Gé van den Eertwegh, and Ruud Bartholomeus

Climate change, weather extremes, economic growth, urbanization and increased food production, among other things, are making it more complex to guarantee sufficient freshwater in agricultural and economic sectors. Historically, the Dutch agricultural water management focused on water discharge, which makes it now more vulnerable to droughts. A change is needed to anticipate both wet and dry extremes. Current pipe drainage systems (existing in 34 % of the agricultural fields), installed to discharge water, could be modified to systems to retain and recharge water too. Doing so, so called controlled drainage with subirrigation (CD-SI) systems could be a viable measure to i) discharge water only when needed and ii) retain and iii) recharge water when possible. We show data (years 2017-2022) and process-based model output of four experimental sites at the Dutch Pleistocene uplands where CD-SI is applied. Results show that CD-SI could significantly raise the groundwater level at field scale and increase soil moisture availability to plant roots, leading to higher crop yields. Effects of subirrigation are strongly dependent to i) the geohydrological site characteristics, like a resistance layer to limit excessive downward seepage, ii) sufficiently high ditch levels to prevent fast drainage, and iii) the consideration of how much water is supplied relative to acceptance of drought stress (and thus crop yield). Field experiments show that the water supply for CD-SI could be very large. We show how to limit the required water supply, using automated and online control of CD-SI systems. We use actual field measurements on groundwater levels and soil moisture conditions, weather forecasts and field scale hydrological modeling (using the Soil-Water-Atmosphere-Plant model SWAP) to automatically control CD-SI systems. Doing so, required water supply and drainage level are managed daily, based on the actual and future hydrological conditions, and plant water and oxygen demand, including the acceptance of a percentage of crop’s drought stress.  Results show that significant reductions in water demand for CD-SI systems could be obtained, if only relatively minor reductions in crop yield are accepted.

How to cite: de Wit, J. A., van Huijgevoort, M., van Dam, J., van den Eertwegh, G., and Bartholomeus, R.: Controlled drainage with subirrigation: automatic control to manage freshwater use, EGU General Assembly 2024, Vienna, Austria, 14–19 Apr 2024, EGU24-9029, https://doi.org/10.5194/egusphere-egu24-9029, 2024.

EGU24-9415 | ECS | Posters on site | HS5.2.1

A Multi-dimensional Safe Operating Space Evaluation Framework for Regional Water Resources Systems 

Wei Xia, Matteo Giuliani, Emilio Politti, Hector Macian-Sorribes, Sandra Ricart, Sebastian Arias-Lopez, Taher Kahil, Manuel Pulido-Velázquez, and Andrea Castelletti

Water resources face increasing pressure globally and regionally driven by rising water, energy and food demand, resulting in extensive resource abstraction and severe environmental consequences, including diminished water quantity and quality, groundwater depletion, and ecosystem degradation. The escalating impacts of climate change further compound these challenges by altering water availability and intensifying extreme events like droughts and floods. Addressing these issues necessitates the urgent establishment of a Safe Operating Space (SOS) for water systems, ensuring reliable and clean water supply for human activities and ecosystems in a changing climate and society. 

While various analytical frameworks have emerged to assess components of the water resources SOS, predominantly at a global scale (e.g., water planetary boundaries), their adoption in local and regional water management remains limited. Existing frameworks often lack comprehensive acknowledgement of relevant local and regional dimensions, including hydrological, infrastructure, ecological, and human processes. Moreover, spatial and temporal granularity tends to be insufficient for providing locally and regionally relevant information and for effectively engaging and supporting stakeholders. This is particularly evident in regions with high exposure to water scarcity where the complexity of infrastructure development and resource management is high. To bridge this gap, there is a crucial need to define the SOS framework at decision-relevant spatial scales, involving integrated efforts in data collection and modelling while also fostering a continuous dialogue with stakeholders to facilitate local and regional knowledge exchange. 

Our goal is to define and understand the SOS for water systems at local and regional scales to support the co-design of actionable management pathways. We propose a multi-dimensional SOS evaluation framework for local and regional water resources systems (SOS-Water) with four key components: 1) co-development of future scenarios and pathways, 2) integration of water system models (e.g., global hydrological models) and local and regional impact models, 3) identification of water system indicators for impact assessment with associated failure thresholds, and 4) determination of the multi-dimensional SOS for water systems. The SOS for the local and regional water systems is initially computed under baseline conditions, representing the status quo, and subsequently evaluated under diverse climate and socio-economic scenarios and management pathways. The multi-dimensional SOS, derived from the integrated modelling system, depicts performance for each indicator under varying conditions and is reinforced with different hierarchized objectives defined by the stakeholders through an inclusive and iterative participatory approach. Here, we will present the conceptual structure of the SOS-Water framework and some preliminary results of its evaluation for the Jucar River Basin (Spain), which is subject to significant water scarcity due to ongoing climate-induced impacts.  

How to cite: Xia, W., Giuliani, M., Politti, E., Macian-Sorribes, H., Ricart, S., Arias-Lopez, S., Kahil, T., Pulido-Velázquez, M., and Castelletti, A.: A Multi-dimensional Safe Operating Space Evaluation Framework for Regional Water Resources Systems, EGU General Assembly 2024, Vienna, Austria, 14–19 Apr 2024, EGU24-9415, https://doi.org/10.5194/egusphere-egu24-9415, 2024.

EGU24-10024 | ECS | Orals | HS5.2.1

Economic Assessment of Transforming Rainfed to Irrigated Agriculture in a Drought-Prone Region of Central India  

Shoobhangi Tyagi, Sandeep Sahany, Amlendu Dubey, Saroj Kanta Mishra, Dharmendra Saraswat, and Dev Niyogi

Climate change-induced water stress greatly challenges rice productivity, particularly in rainfed regions with limited irrigation infrastructure. These regions, identified as economically water-scarce, could benefit from increased irrigation if appropriate economic resources are made available. However, a current knowledge gap exists regarding how climate-induced economic impacts vary with the transformation from rainfed to irrigated agriculture in economically water-scarce regions. This study investigates the economic implications of climate change under rainfed and irrigated conditions in the near future (2030s). The assessment was done for two shared socio-economic pathways— SSP2-4.5 (moderate) and SSP5-8.5 (extreme) scenarios using the Soil and Water Assessment Tool (SWAT) model. The simulated rice yields were used for estimating economic impacts through an econometric approach. The results suggest that under rainfed conditions, rice yields are projected to change by ~ -15% to -2% and ~ -15% to +2% for SSP2-4.5 and SSP5-8.5 scenarios, respectively. However, the transformation of rainfed to irrigated agriculture leads to a positive shift in rice yield by ~ -1% to 7.3% for the SSP2-4.5 scenario and ~ -4% to 7.25% for the SSP5-8.5 scenario. This transformation can help reduce the region’s economic burden by ~$48.8M for SSP2-4.5 scenario and by ~$20.8M for SSP5-8.5 scenario. The implications of short-term drought events on the region’s economic response to climate change will also be discussed. The findings of this study provide valuable insights for the management of highly vulnerable agricultural systems, offering guidance for policymakers aiming to enhance resilience in the face of climate change.

How to cite: Tyagi, S., Sahany, S., Dubey, A., Mishra, S. K., Saraswat, D., and Niyogi, D.: Economic Assessment of Transforming Rainfed to Irrigated Agriculture in a Drought-Prone Region of Central India , EGU General Assembly 2024, Vienna, Austria, 14–19 Apr 2024, EGU24-10024, https://doi.org/10.5194/egusphere-egu24-10024, 2024.

EGU24-10135 | Posters on site | HS5.2.1

Addressing Water Challenges in Southern Spain: A Comprehensive Assessment and Sustainable Management Approach 

Safa Baccour, Julio Berbel, Carlos Gutierrez, and Esther Diaz-Cano

Increasing climate-related water stress and growing water demand are challenging the goal of achieving food and water security in many basins around the world.. Addressing the problem requires the integration of sectoral policies based on interdisciplinary knowledge and sustainable management strategies. This study presents the development of an innovative and dynamic optimization framework that integrates a detailed representation of hydrological and technological constraints while accounting for the feedback between sectors (agriculture, urban, industrial, golf, and livestock). The hydroeconomic model has been applied in Axarquía (Spain) as a case study to evaluate the performance of water allocation and management among several users, determine the cost of water scarcity, and design sustainable water management interventions under future climate conditions. The policy analysis offers insights into the effects of alternative management strategies regarding cost of water supply from different water sources (including surface water diversion, groundwater pumping, non-conventional water production, and reservoirs). Our results highlight the potential of policy options for increasing water availability and suggest the most cost-effective and feasible options. The findings provide efficient water allocation plans between competing sectors, emphasizing the importance of using non-conventional water resources, such as desalinated water and wastewater, which help to save limited conventional resources and play an increasingly important role in meeting rising water demands. These critical results could help decision-makers to bring about efficient water allocation planning among sectors and advance resilience and adaptation to climate water stress. Axarquía’s issues and challenges light a path to relevance for other river basins internationally.

How to cite: Baccour, S., Berbel, J., Gutierrez, C., and Diaz-Cano, E.: Addressing Water Challenges in Southern Spain: A Comprehensive Assessment and Sustainable Management Approach, EGU General Assembly 2024, Vienna, Austria, 14–19 Apr 2024, EGU24-10135, https://doi.org/10.5194/egusphere-egu24-10135, 2024.

EGU24-10214 | ECS | Orals | HS5.2.1

Quantifying the feedbacks between climate change and the WEFE nexus in the transboundary Syr Darya basin 

Brecht D'Haeyer, Sonu Khanal, Hester Biemans, Arthur Lutz, Johannes Hunink, and Walter Immerzeel

The Syr Darya River Basin is a transboundary glacier-fed river system, supporting the livelihoods of millions of people across Central Asia. The sustainable allocation of water resources in this basin has become a pressing concern due to the increasing demands coupled with environmental degradation and climate uncertainty. Consequently, developing robust water allocation mechanisms that acknowledge the Water-Energy-Food-Environment-Nexus (WEFE) is vital for sustaining human and ecosystem needs. This study scrutinizes the relationship between upstream and downstream water users in the upper Syr Darya Basin, which encompasses the Uzbek and Kyrgyz Republics, including the Fergana Valley, Central Asia's "breadbasket”.

Whereas the individual effect of climate change on either water demand or supply is widely studied, the interaction between these two, considering local nexus-related systemic dependencies, requires a better understanding to improve sustainable water allocation in the region. For example, climate change may reduce upstream hydropower demands in winter, favouring water supplies in summer elsewhere. Recognizing the intricate relationships among water, energy, food, and the environment, especially in regions with geopolitical complexities like Central Asia, we aim to uncover the feedback mechanisms shaping the WEFE nexus by defining and assessing storylines representing climate and socio-economic change in a coupled cyrospheric-hydrological and water allocation model (SPHY-WEAP).

First, we assess the influence of climate change on reservoir inflows of Toktogul and Andijan, key reservoirs regulating water availability within Ferghana Valley. We force the model with CMIP6 climate simulations to assess changes in reservoir storage and inflows for multiple future time horizons, thereby focussing on potential storage gaps as glaciers shrink and its effect on existing reservoir release patterns. Secondly, we assess the future evolution of water, energy, food, and environmental demands under the combined influence of climate and related socio-economic changes. Hereto, we define representative storylines, integrating insights from policy documents and local stakeholder consultations to depict plausible future pathways. Finally, forcing the coupled SPHY-WEAP allocation model with quantitative storylines, we explore local feedbacks in the intricate relationship between climate change and water availability, supply, and demands. Specific focus will be on how the equilibrium between water supply and demand shifts for varying storylines, thereby pinpointing tipping points where water demands can no longer be met for a given season or throughout the year.

The results of this study are expected to provide a systematic assessment of water-energy-food-environment storylines, revealing how these storylines either facilitate or impede sustainable water management practices in the basin. This study aligns with SDG 6 and lays the groundwork for promoting efficient water allocation strategies and decision-making under climate change to promote transboundary cooperation and long-term water security for all. 

How to cite: D'Haeyer, B., Khanal, S., Biemans, H., Lutz, A., Hunink, J., and Immerzeel, W.: Quantifying the feedbacks between climate change and the WEFE nexus in the transboundary Syr Darya basin, EGU General Assembly 2024, Vienna, Austria, 14–19 Apr 2024, EGU24-10214, https://doi.org/10.5194/egusphere-egu24-10214, 2024.

EGU24-15428 | ECS | Posters on site | HS5.2.1

Unravelling the role of groundwater in the Water-Energy-Food NEXUS 

Xinyuan Yue, Ata Joodavi, Laura Ercoli, Luca Sebastiani, Fernando Nardi, and Rudy Rossetto

Human societies and the whole planet are facing a number of challenges, due to climate and global changes, including freshwater scarcity and increase in demand for food and energy. Groundwater is a valuable resource supporting life, ecosystems, agriculture, and in general several human activities. Compared to surface water, groundwater has a longer temporal buffer, wider spatial distribution and more reliable water quality, making it a major source of freshwater in many areas of the world.

The concept of Water-Energy-Food (WEF) Nexus has been proposed to highlight the complex interactions between water, agricultural production and energy, in order to ensure an integrated planning and management for these main assets. In such a context, groundwater plays a key role in the WEF Nexus, but the interdependencies with the agricultural and the energy sectors and their synergistic impacts have been rarely evaluated.

This work aims at addressing this issue by means of a systematic review searching the Scopus database for scientific articles published up to December 2023. Our search resulted in a total of 392 papers, and after analyzing all of them, we identified 217 papers suitable for our current research objectives, and an additional 3 papers were included by snowballing.

Groundwater is the main source for irrigation in many parts of the world. Inefficient irrigation may be one cause of aquifer overexploitation, while increasing efficiency may be thought of as a way to save groundwater. However, there are several cases where technological improvements in turn, may call for larger irrigated areas, hence creating a loop. At the same time irrigated agriculture increases the use of fertilizers and pesticides, which in turn means larger energy consumption and CO2 emissions for their production, transportation and distribution. Energy is needed in farming for groundwater pumping, and in some cases routing. Energy may be needed also for treating groundwater to drinking standards. Competition for groundwater may exist between the industrial (including energy production) sectors and the agricultural one. Solutions to reduce groundwater exploitation (i.e. reuse of treated wastewater or desalinated water) may in turn increase energy consumption and decrease environmental quality. Our work provides a matrix to highlight the most relevant interdependencies among the groundwater resource, energy and agricultural production in order to support sustainable planning and development.


Acknowledgement

This contribution is presented within the framework of the NEXUS-NESS project. The NEXUS-NESS received funding from the PRIMA Programme, an Art.185 initiative supported and funded under Horizon 2020, the European Union’s Framework Programme for Research and Innovation.

How to cite: Yue, X., Joodavi, A., Ercoli, L., Sebastiani, L., Nardi, F., and Rossetto, R.: Unravelling the role of groundwater in the Water-Energy-Food NEXUS, EGU General Assembly 2024, Vienna, Austria, 14–19 Apr 2024, EGU24-15428, https://doi.org/10.5194/egusphere-egu24-15428, 2024.

EGU24-16004 | ECS | Posters on site | HS5.2.1

Increasing the Spatial Resolution in CLEWs Studies: An Integrated Modelling Approach for Water-Energy-Food Systems 

Derya Sadak, Nick van de Giesen, and Edo Abraham

Integrated modelling of energy and water systems in the CLEWs (Climate, Land, Energy, and Water-systems) framework has significantly advanced our understanding of the intricate interactions among scarce sources such as water, energy, and food. This framework brings meaningful insights and quantitative results using modelling tools aligned with practical planning scenarios. Accordingly, this nexus approach enables policy and scenario analyses tailored to the sustainable development goals and the specific needs of countries, governments, and sectoral authorities.

Some open-source modelling tools provide a broad interface for incorporating water and energy planning assessments, which contribute to the development of various soft-linking models. In general, open-source energy modelling systems (such as OSeMOSYS) facilitate the simulation and optimization of energy systems on a regional and national level. However, OSeMOSYS has a notable limitation in modelling the spatial distribution of energy sources, demand, and infrastructure. In particular, the geographical location of energy sources impacts various factors, such as extraction costs, transmission and distribution efficiency, and environmental concerns such as carbon emissions.

This study aims to develop an integrated modelling approach for these associated costs, environmental impacts, and potential interdependencies between energy and water systems by explicitly capturing the spatial distribution of energy storage, energy sources, demand, and supply infrastructure. Integrating the Next Energy Modeling system for Optimization (NEMO), Water Evaluation and Planning (WEAP), and Geographic Information System (GIS) analysis aims to identify optimal energy pathways considering environmental aspects, cost-effectiveness, and sustainable development goals. The proposed methodology aims to enable dispatch modelling of energy options with a sufficient temporal resolution and structure the interactions of CLEWs by explicitly accounting for the spatial distribution of energy sources, water resources, and infrastructure. This approach can provide a more accurate assessment of interdependencies and potential trade-offs.

The research outcomes will contribute to basin management and CLEWs studies, advancing the understanding of energy-water dynamics and offering insights into sustainable solutions for the Volta and Tana River Basins, in West and East Africa respectively. We present a systematic outline of our project and a preliminary example of an energy transition in the Volta River Basin using a spatially explicit modelling approach.  


How to cite: Sadak, D., van de Giesen, N., and Abraham, E.: Increasing the Spatial Resolution in CLEWs Studies: An Integrated Modelling Approach for Water-Energy-Food Systems, EGU General Assembly 2024, Vienna, Austria, 14–19 Apr 2024, EGU24-16004, https://doi.org/10.5194/egusphere-egu24-16004, 2024.

EGU24-17546 | ECS | Posters on site | HS5.2.1

Hydro-economic assessment of the impact of climate and socio-economic changes on water resources in the MENA region 

Samar Asad, Reetik-Kumar Sahu, Dor Fridman, Barbara Willaarts, and Taher Kahil

The Middle East and North Africa (MENA) region is struggling with a continuous decline in water availability, attributed to climate change and variability, exacerbating the existing water scarcity. At the same time, factors such as population growth, urbanization, economic development and mismanagement further stress the scarce water resources. This study aims to assess the impact of climate and socioeconomic changes on the availability and use of water resources and related economic and environmental conditions in the MENA region at high spatial and temporal resolutions, in order to provide insights into cost-effective and sustainable water management options to reduce water scarcity. To do so, we apply a set of potential future climate and socio-economic change scenarios, based on combinations of the Shared Socio-economic Pathways (SSPs) and Representative Concentration Pathways (RCPs) and informed by a review of regional development visions and consultations with key regional experts. Scenario simulations are conducted using the hydro-economic model ECHO in combination with the hydrological model CWatM at subbasin and monthly levels for the whole MENA region. Results of this study shows the escalating deficit in renewable water resources and the rising water demand, exacerbating water scarcity across the majority of the MENA countries. Therefore, meeting the increasing water demand becomes an even greater challenge in the region. To address this challenge, our results underscore the need for a more efficient allocation of water resources among sectors and subbasins at the regional level and a shift towards more advanced water conservation and reliable water supply technologies.

Keywords: Hydro-economic assessment, Water scenarios, Water scarcity, MENA region.      

How to cite: Asad, S., Sahu, R.-K., Fridman, D., Willaarts, B., and Kahil, T.: Hydro-economic assessment of the impact of climate and socio-economic changes on water resources in the MENA region, EGU General Assembly 2024, Vienna, Austria, 14–19 Apr 2024, EGU24-17546, https://doi.org/10.5194/egusphere-egu24-17546, 2024.

EGU24-18042 | ECS | Orals | HS5.2.1

Bottom-up vulnerability assessment for climate change adaptation in water resource systemsintegrating weather generators and hydroeconomic and ecosystem modelling 

Sebastian Arias-Lopez, Hector Macian-Sorribes, Francisco Martinez-Capel, Alberto Garcia-Prats, and Manuel Pulido-Velazquez

Traditional evaluations of the impact of climate change scenarios in water resource management involve top-down approaches, based on predictions from global climate models (GCMs). In contrast, bottom-up strategies provide a more comprehensive understanding of the system's behaviour applying a wide range of climate scenarios based on parametric climatic alterations. By doing so, climate change impacts and subsequent adaptation measures can be assessed taking into account the limits of their availability and how their performance level varies depending on the changing climate conditions, which is quite useful especially when faced with substantial uncertainty.

This study develops a bottom-up approach to evaluate climate change impacts combining weather generators to obtain a wide range of future climates based on parametric alternations of the main climatic patterns; hydroeconomic models to assess the costs and benefits associated with those impacts; and ecosystem models to evaluate how the habitat of fish species would be impacted by climate change. The weather generator for climate variables (precipitation, temperature, and evapotranspiration) is coupled with a parameter-lumped conceptual hydrological model to generate future time series of streamflow, which are further integrated into a hydroeconomic model that simulate reservoir operation and assesses the economic performance of the river basin water uses.

The weather generator is implemented using MATLAB, in which the annual temperature is modelled by an AR(2) autoregressive model, while annual precipitation follows an AR(0) autoregressive model. Monthly time series are obtained through the method of fragments. The correlation between subbasins is modelled using a linear relationship of the residuals. Monthly evapotranspiration is computed by applying a transformation factor linked to monthly temperature, smoothed through a Fourier Transform series. The conceptual hydrological model is also implemented in a MATLAB script that transforms climate variables into streamflows, which serve as input for the hydroeconomic model of the basin.

The methodology was applied to the semi-arid Jucar River Basin (JRB) in Spain, characterized by multi-annual droughts combined with significant development of irrigated agriculture, which implies a distinct vulnerability to climate change impacts. The methodology maps climate change impacts, defined as parametric changes of precipitation (% of change) and temperature (increase in ºC), to economic benefits and fish habitat. Results show how the economic and environmental performance of the JRB are affected by climate changes, and determines when tipping points demanding adaptation are reached, locating the areas in which the impacts steeply increase.

Acknowledgements:

This study has received funding from the SOS-WATER project under the European Union’s Horizon Europe research and innovation programme under (GA No. 101059264).

How to cite: Arias-Lopez, S., Macian-Sorribes, H., Martinez-Capel, F., Garcia-Prats, A., and Pulido-Velazquez, M.: Bottom-up vulnerability assessment for climate change adaptation in water resource systemsintegrating weather generators and hydroeconomic and ecosystem modelling, EGU General Assembly 2024, Vienna, Austria, 14–19 Apr 2024, EGU24-18042, https://doi.org/10.5194/egusphere-egu24-18042, 2024.

China faces challenging issues of water scarcity, energy security, and climate change in this century. The Chinese government has committed to reaching carbon peak by 2030 and carbon neutrality by 2060 and this requires ambitious energy transition strategies. It has also deployed the Three Red Lines (TRLs) policy which aims to limit total annual water use to below 700 km3 by 2030, with different targets for each province. Yet, these water guidelines fail to consider the local water endowment of each province and do not shed light on how current and future water use could put stress on our water resources. This gap could be filled by considering regional freshwater boundary (RFB) instead, which sets a limit for freshwater use based on monthly flow and corresponding environmental flow requirements. By comparing the TRLs targets with RFB, we could identify the gap between these policy-based goals and their practical implementation, and thus design specific regional economic strategies to achieve water targets in a carbon-neutral future. In this study, we first calculate RFBs for each Chinese province using a bottom-up approach by aggregating grid level (0.5°) RFB obtained from 15 different hydrological models to the provincial level. This is then used alongside the TRLs targets within a computable generable equilibrium (CGE) model. The CGE model evaluates the economic and environmental impacts of various scenarios considering carbon neutrality, water use targets, and solutions aimed at mitigating RFB exceedance, such as the South-to-North Water Diversion Project, water efficiency improvement and water reuse strategies. The holistic assessment of China’s climate and water policies reveals opportunities for coordinated policymaking among provinces and elucidates possible pathways for China to balance water, energy, climate and economic goals.

How to cite: Ng, J. Y., Zhao, X., and Dai, H.: Balancing regional freshwater boundaries and carbon neutrality goals in China’s water-energy-environment nexus, EGU General Assembly 2024, Vienna, Austria, 14–19 Apr 2024, EGU24-18411, https://doi.org/10.5194/egusphere-egu24-18411, 2024.

EGU24-22014 | ECS | Orals | HS5.2.1

Integrating land-atmosphere interactions in the water footprint indicator   

Elena De Petrillo, Lan Wang Erlandsson, Marta Tuninetti, Luca Ridolfi, and Francesco Laio

Green water (i.e., precipitation water that infiltrates into the soil and becomes available for plants’ root uptake) is the pillar for food production and biosphere sustainment. However, food production can also compromise the resilience of green water and thus, its potential to sustain the land-water-food-human system.

Despite a large number of scholars having quantified the spatio-temporal evolution of the green water, so far the critical role of local green water resilience to sustain the ecosystem has not been quantified adequately. This means that green water overexploitation due to local factors (which is other than measuring a high green WF) went undetected, whereas omitting moisture recycling implies that the land-use-induced gains and losses of moisture supply to downwind rainfall are ignored that is significant, as around 60-70% of mean global evapotranspiration returns as precipitation over land. Indeed, due to land cover changes in a precipitationshed (i.e., the area supplying evaporation to a downwind location’s rainfall ), gains and losses in precipitation may occur in the evaporationshed (i.e, the downwind region where evaporation from upwind areas precipitates as rainfall).

The aim of this study is  to redefine the green water footprint, which can be used for assessing the resilience and sustainability of green water use for food production addressing feedbacks between upwind land cover changes and downwind changes in precipitation, which can subsequently lead to changes in actual crop evapotranspiration, yields and the relative associated irrigation water demand.

Therefore, we define green water use as a function of the change in evapotranspiration patterns in downwind areas in the emblematic case of deforestation in upwind areas.

By coupling the STEAM water balance model with atmospheric moisture tracking model, we simulate the impact of land cover changes on downwind precipitation. These simulated changes in downwind precipitation allow then the evaluation on crop evapotranspiration in the agricultural hubs in the affected downwind areas, by means of the crop-hydrological model WaterCrop.

Our results shed light on the feedback between perturbation on potential vegetation evapotranspiration, downwind precipitation, actual crop evapotranspiration, crop yield and associated irrigation water demand changes in the downwind regions to better frame the sustainability and resilience of land-water-human systems for food production in the context of land-atmosphere interactions.

How to cite: De Petrillo, E., Erlandsson, L. W., Tuninetti, M., Ridolfi, L., and Laio, F.: Integrating land-atmosphere interactions in the water footprint indicator  , EGU General Assembly 2024, Vienna, Austria, 14–19 Apr 2024, EGU24-22014, https://doi.org/10.5194/egusphere-egu24-22014, 2024.

EGU24-1187 | ECS | Posters on site | HS5.2.2

Transdisciplinary planning using WEF Nexus serious games: Towards watershed management implementation 

Tania Santos, Camilo Gonzalez, Christopher Scott, Julian Prieto, Magnolia Lungo, Martha Tarazona, and Sergio Alonso Orrego

Water resource planning has been promoted to improve access to water in terms of quality and quantity. To make planning a reality, both resources and engagement of stakeholders in the areas of analysis are required. However, based on our experience in several Latin American countries, taking watershed management plans through to implementation is complex. The integration of sectoral water users in a more active way, especially where agricultural and other producers can evaluate the benefits of water and environmental planning to have continued access to sufficient quantity and quality of water is essential for implementation.  We conducted a transdisciplinary research project for the sustainable management of water, energy, and food (WEF) resources of the Sevilla River, Colombia, one of five rivers that originate in the Sierra Nevada and flow to the Ciénaga Grande de Santa Marta on the Caribbean coast. Río Sevilla is the main source of surface and groundwater for domestic supply, agricultural irrigation, and livestock in the Zona Bananera municipality. Various natural factors including scarce rainfall during El Niño years, the intermittent surface water regime of tributary streams, and concurrent human impacts of water diversion and land use change, the watershed is experiencing significant decreases in flow, the loss of water connectivity with the Ciénaga, and the resulting ecological fragmentation. By applying the WEF Nexus framework, the study assessed the relationship between oil palm, banana, and coffee production, and the water volumes and estimates of energy consumed. Using national databases and information provided by local associations of these sectors (Fedepalma, Cenipalma, Federación Nacional de Cafeteros, Asbama, and Agrosavia) as well as conservation organizations (WWF and the Water Stewardship Platform it coordinates) and the Magadalena Departmental Environmental Authority, we developed a Water Evaluation and Planning System WEAP model to quantify water supply, demand, and their interrelationships. These and other stakeholders together with the research team jointly identified problems and evaluated alternative actions to address identified challenges. The participatory Scenariothon ‘serious games’ methodology promoted dialogue, communication, and consensus-building in three stages: 1) a social mapping workshop to identify the main WEF problems and locations, 2) identification of actions that could be implemented by individual stakeholders and their expert knowledge to reduce water and energy consumption and achieve water-efficient crop production, and 3) a synthesis workshop to identify and evaluate collective and coordinated actions and compare these with individual actions from (2) using the WEAP model. The model includes all users and simulates different outcomes of the actions, including crop production and energy consumption by type of irrigation system (flood, sprinkler, or drip). Indicators were defined to compare actions, considering crop production efficiency, water availability, and energy consumption. Scenariothon WEAP simulations of the impacts of stakeholder-identified actions were assessed (https://latinoamericasei.shinyapps.io/JuegoSerio_CuencasSevillaFrio/). This methodology and indicators can be used as a robust planning process to better integrate environmental and sectoral water planning, gain stakeholder support for the implementation of plans, and improve river basin management outcomes. 

How to cite: Santos, T., Gonzalez, C., Scott, C., Prieto, J., Lungo, M., Tarazona, M., and Orrego, S. A.: Transdisciplinary planning using WEF Nexus serious games: Towards watershed management implementation, EGU General Assembly 2024, Vienna, Austria, 14–19 Apr 2024, EGU24-1187, https://doi.org/10.5194/egusphere-egu24-1187, 2024.

EGU24-2128 | ECS | Orals | HS5.2.2

Global energy consumption for desalination and wastewater treatment 

Michele Magni, Edward R. Jones, Marc F. P. Bierkens, and Michelle T. H. van Vliet

An estimated 2 billion people across the globe lack access to a safe source of drinking water, while 3.6 billion people are not connected to safely managed sanitation. Expansion of technologies for drinking water and wastewater treatment is key to tackling global challenges in water supply and sanitation. Unconventional water resources, such as desalination and wastewater reuse, are also increasingly being adopted to alleviate water scarcity.

Modelling the current energy use of these technologies is essential to improve our understanding of the interdependencies between the water and energy sectors, and to prevent conflicts between mitigation of anthropogenic climate change, energy security and alleviation of global water scarcity. However, most research on energy-for-water has been conducted at local to regional scales, with inter-comparisons limited to a few cities or countries worldwide. Previous studies have also typically lacked spatial or temporal distribution, limiting their application in larger-scale assessments.

The aim of this research is to estimate global energy consumption for desalination and wastewater treatment at 5 arcmin resolution. Preliminary model results show that desalination required 0.74 – 1.04 EJ in 2015 to produce 29.8 km3 of freshwater, while 0.30 – 0.79 EJ were consumed in the same year to treat 186.4 km3 of wastewater. Large uncertainties in energy consumption for wastewater treatment are mostly caused by lack of data on advanced purification. The gridded output of our model may enable spatial representation of these processes in Integrated Assessment Models and Energy Supply Models, and the evaluation of future energy demands towards global clean water provision. Future work aims to shine light on global hotspots of energy consumption for clean water supply and the effects of unconventional water resources on the water-energy nexus.

How to cite: Magni, M., Jones, E. R., Bierkens, M. F. P., and van Vliet, M. T. H.: Global energy consumption for desalination and wastewater treatment, EGU General Assembly 2024, Vienna, Austria, 14–19 Apr 2024, EGU24-2128, https://doi.org/10.5194/egusphere-egu24-2128, 2024.

EGU24-2313 | ECS | Posters on site | HS5.2.2 | Highlight

Targeting irrigation investments for people and planet: A novel big-data approach 

Anton Urfels, Andrew McDonald, Maxwell Mkdondiwa, Laura Arena Calles, Hari Nayak Shankar, Saral Karki, Amit Srivastava, Sonam Sherpa, and Virender Kumar

Irrigated agriculture plays a foundational role for global food security while also being the largest water consumer worldwide. With little room to expand surface water irrigation, agricultural planners turn increasingly to groundwater for building climate resilience food security. This strategy has transformed major food baskets into highly productive but groundwater depleting systems. Outside these 'hotspots' however, there is still ample scope for promoting productive and sustainable groundwater use for agriculture. Here we present a big data approach for targeting groundwater irrigation investments in rice production across 4 states of India in safe shallow groundwater zones. Our results indicate that promoting one additional irrigation in parts of safe shallow groundwater zones where yield responses are especially high, can provide annual rice consumption needs for another 50m people. The spatial strucuture of the irrigation investment priority zones can further aid research and sustainable development planning. We conclude that combining increasingly abundant agronomic and hydrological data for sustainable development in low and middle income countries can help to guide the financing of more targeted and cost-effective sustainable development programs.

How to cite: Urfels, A., McDonald, A., Mkdondiwa, M., Arena Calles, L., Shankar, H. N., Karki, S., Srivastava, A., Sherpa, S., and Kumar, V.: Targeting irrigation investments for people and planet: A novel big-data approach, EGU General Assembly 2024, Vienna, Austria, 14–19 Apr 2024, EGU24-2313, https://doi.org/10.5194/egusphere-egu24-2313, 2024.

EGU24-5071 | ECS | Posters virtual | HS5.2.2

Impacts of Interannual Climate Variability on Direct and Virtual Water Shortage Risks in China 

Yaoping Wang, Tao Cao, Shuo Zhang, and Xiaogang He

Water scarcity can have far-reaching sectoral impacts beyond where it physically occurred through the propagation of virtual water flows. Both fast (e.g., interannual meteorological variability) and slow physical processes (e.g., phase changes in sea surface temperature [SST] modes) can affect water availability and use, leading to changes in both direct and virtual water scarcity. In this study, we use a two-stage regression to investigate how interannual meteorological variability and SST-phase changes contribute to variations in water shortage in China, both locally (through the Local Water Scarcity Risk index, LWSR) and remotely (through the Virtual Water Scarcity Risk index, VWSR). More specifically, LWSR and VWSR are estimated using the regression-based water stress indices and agricultural water uses under varying meteorological forcings and SST phases, holding the region-by-sector input-output relationships constant. Our findings indicate that interannual meteorological variability affects LWSR on the order of 10–1000% and VWSR on the order of 10% in most sectors and provinces, with a limited portion of impacts attributable to SST-phase changes. In particular, the positive phase of the second investigated SST mode results in significantly higher (on the order of 5%) LWSR and VWSR for nearly all sectors and provinces compared to the negative phase. These results highlight the importance of using longer time series to accurately assess local and virtual water scarcity situations. Decision makers in susceptible provinces and sectors should consider interannual variabilities in LWSR and VWSR and plan for potential occurrences of extreme conditions.

How to cite: Wang, Y., Cao, T., Zhang, S., and He, X.: Impacts of Interannual Climate Variability on Direct and Virtual Water Shortage Risks in China, EGU General Assembly 2024, Vienna, Austria, 14–19 Apr 2024, EGU24-5071, https://doi.org/10.5194/egusphere-egu24-5071, 2024.

Reservoir hydropower offers a compelling combination of stability and flexibility services for modern water and power grids. However, its operating flexibility is poorly characterized in energy system planning, missing opportunities to cost-effectively uptake variable renewable energy (VRE) for a clean energy transition. In this study, we have developed a fully coupled reservoir operation and energy expansion model to quantify the economic and environmental benefits attained from adaptive hydropower operation in a high VRE future. Our case study of the China Southern Power Grid reveals that, in a 2050 net-zero grid, simply adapting hydropower operations to balance VRE can reduce 2018–2050 total system costs by 7% (that is, US$28.2 billion) and simultaneously save 123.8 km3 of water each year (that is, more than three times the reservoir capacity of the Three Gorges Dam). These vast, yet overlooked, cost- and water-saving potentials highlight the importance of incorporating balancing-oriented hydropower operation into future pathways to jointly decarbonize and secure power and water grids.

How to cite: He, X. and Liu, Z.: Balancing-oriented hydropower operation makes the clean energy transition more affordable and simultaneously boosts water security, EGU General Assembly 2024, Vienna, Austria, 14–19 Apr 2024, EGU24-5916, https://doi.org/10.5194/egusphere-egu24-5916, 2024.

EGU24-5993 | ECS | Orals | HS5.2.2 | Highlight

Impact of Socio-Economic and Climatic Scenarios on Power Trade Vulnerability in Africa 

Teresa Bonserio, Angelo Carlino, Matteo Giuliani, and Andrea Francesco Castelletti

Energy security in Africa is seriously compromised by the continent's degree of political instability. Corruption, armed conflicts, and ineffective governmental institutions impede the maintenance of the existing energy infrastructure and deter new foreign investment. As a result, many African nations face unreliable power supplies, hampering economic growth. This effect, however, is usually overlooked in large-scale energy systems planning, which is often uniquely based on cost optimality considerations. This study aims to quantify the vulnerability of the cost-optimal African power systems and the potential power deficits arising from countries' political instability. 

To do so, we examine African countries' generation mixes and power trades over 2020-2050 using six scenarios obtained with the OSeMOSYS-TEMBA energy system model. The six scenarios harmonize assumptions regarding socio-economic development, land-use change, and climate change impact on water availability for hydropower using the SSP-RCP framework. Moreover, capacity factors for existing and planned hydropower projects are included, considering both median and very dry hydrological regimes.

In each scenario, we assess the degree of power trade-related political risk at the continental and country scales. This measure expresses the vulnerability of international power trades according to the political instability of participating countries. The governance indicators, reflecting the countries' degree of political instability, are projected for each SSP until 2050. Moreover, we stochastically quantify the power deficits due to operational deviations from cost-optimal international power trades caused by countries' political instability.

Our results show that countries representing hotspots of political risk are located in western, southern and central-eastern Africa. These results are aligned with those obtained from an evaluation of the ecosystem impact of hydropower projects in Africa. Moreover, scenarios with more ambitious climate policy show higher political risk, especially in southern Africa. Instead, very dry hydrology scenarios are associated with reduced risk in eastern Africa and increased risk in southern Africa. 

These results underscore a crucial need for stable governance frameworks and international cooperation to foster sustainable energy development in the region. Strategic interventions can indeed produce tangible impacts by reducing risks in the short term.

How to cite: Bonserio, T., Carlino, A., Giuliani, M., and Castelletti, A. F.: Impact of Socio-Economic and Climatic Scenarios on Power Trade Vulnerability in Africa, EGU General Assembly 2024, Vienna, Austria, 14–19 Apr 2024, EGU24-5993, https://doi.org/10.5194/egusphere-egu24-5993, 2024.

Water, energy and the environment are inextricably linked. Complex and volatile global situations pose serious challenges to long-term stable and sustainable social development, resulting in many uncertainties in maintaining regular water and energy supplies and avoiding environmental degradation. Based on the nexus theory, it has become an urgent global and regional need for policy makers and scientists to consider water, energy, and the environment nexus (WEEN) as a complex system in order to deal with the water and energy issues brought about by rapid urbanization, the synergistic response of the environment under climate change, and the corresponding potential risks. Aiming at these problems, a simulation and optimization framework for WEEN complex systems is proposed by combining the system dynamics model, Gaussian white noise, and NSGA-II method. A system dynamics model integrated with Gaussian white noise is used to characterize the feedback relationships among the elements within the different subsystems of water resources, energy, and environment under uncertainty. Taking the city cluster in the middle reaches of the Yangtze River (CCMRYR) in China as the research object, the evolution of the WEEN complex system is simulated under different uncertainty conditions such as climate change conditions and policy backgrounds. In addition, an optimization method based on NSGA-II algorithm is constructed for solving the optimal development strategy of WEEN complex system. The results show that: Following the current development path, by increasing the proportion of energy conservation and environmental protection expenditures by 0.033%, as well as adjusting the ratio of the primary, secondary, and tertiary industries from 5.8:29.0:59.1 to 6.9:28.3:59.7, it is possible for CCMRYR to achieve a reduction of 1.31 billion tons of total water consumption, a reduction of 12.17 million tce of total energy consumption, and a decrease of 0.13×10⁶ of total pollution equivalent in 2035.

How to cite: Liu, H. and Zhang, X.: An optimization and simulation framework for water-energy-environmental nexus under uncertainties: A case study in the city cluster along the middle reach of the Yangtze River, China, EGU General Assembly 2024, Vienna, Austria, 14–19 Apr 2024, EGU24-6429, https://doi.org/10.5194/egusphere-egu24-6429, 2024.

The Seine River is one of the best examples of heavily populated rivers where the imprint of human activities on the biogeochemistry of the water can be tracked throughout many centuries. The downstream sector of the river opens out into a large macro tidal estuary, which, like the rest of the watershed, is subject to great human pressure: the estuarine basin hosts ca. 1M inhabitants and plays a fundamental role in the industrial and logistics sectors in France. This thriving activity has led to many morphological changes over the past century, and these deep physical transformations have impacted the role of the estuary as a biogeochemical buffer.

We here use a deterministic biogeochemical representation of the land-to-sea continuum that successively involves the GRAFS model of the agro-food system, the Riverstrahler model of the river network and an extended configuration of the ECO-MARS3D that allows assessing the role of the estuary in the transformation, storage, and elimination of nutrients, analysing what are the main biogeochemical processes and what are the estuarine sections where these occur.

We then use this unique modelling chain to project different future scenarios, placing particular emphasis on the changes in the agro-food system. The first scenario assumes the pursuit of the current trend of opening and specialisation of agriculture, as well as of the concentration of population within the Paris agglomeration. The second scenario assesses the generalisation of agroecological practices and a healthier human diet. A third hybrid scenario was elaborated assuming that agroecological practices were implemented only in some protected areas, making up about one-third of the total watershed area (in line with the EC Farm to Fork strategy). Results show that only the full agroecological scenario would be able to restore good water quality everywhere in the river network, as well as significantly decrease the risks of toxic algal blooms in the coastal zone. Intermediate situations, such as protecting specific areas, however attractive as a solution, are not enough to offset the impacts of intensive human activities unless the protected areas dedicated to compensating for damage are sufficiently large.

How to cite: Romero, E., Garnier, J., Le Gendre, R., and Billen, G.: From Farm to Fork and from Land to Sea: using a biogeochemical model to understand the impact of agro-food scenarios on the quality of freshwaters and marine waters, EGU General Assembly 2024, Vienna, Austria, 14–19 Apr 2024, EGU24-10359, https://doi.org/10.5194/egusphere-egu24-10359, 2024.

EGU24-11378 | ECS | Posters on site | HS5.2.2

Quantifying the buffer storage effects of a plant 

Vinod S Pathak and Venkatraman Srinivasan

Plant water storage (PWS), which protects plants from water stress during severe droughts, also regulates a number of aspects of the spatio-temporal dynamics of water transport in the soil-plant system. Overestimation or underestimation of transpiration is possible if we equate the amount of water that is absorbed by the roots to the total sap flux that is transpired to the atmosphere through the leaves. Experiments suggest that shoot/stem storage fluxes contribute to 2-15% of the total sap flux in trees. Most of the above ground storage fluxes contributing to the total sap flux in trees come from the middle segment of the plant stem. While experiments have been done to measure shoot storage contribution to sap flux, root storage contributions to sap flux still remains unknown. Experiments have also shown that root biomass contributes up to 40% of the total tree biomass which is significant, it
becomes important to quantify root storage fluxes in the trees. There are models available estimating water storage fluxes within the trees. Nevertheless, these models do not quantify the water storage fluxes and its contribution to the sap flux explicitly within the roots.

How to cite: Pathak, V. S. and Srinivasan, V.: Quantifying the buffer storage effects of a plant, EGU General Assembly 2024, Vienna, Austria, 14–19 Apr 2024, EGU24-11378, https://doi.org/10.5194/egusphere-egu24-11378, 2024.

EGU24-12668 | ECS | Orals | HS5.2.2

Participatory development of indicators to support WEFE Nexus management in the Mediterranean 

Tommaso Pacetti, Mohammad Merheb, Marco Lompi, Xenia Schneider, Christophe Cudennec, Leonor Rodriguez-Sinobas, Mohamed Bahnassy, Fethi Abdelli, Rudy Rossetto, Elena Bresci, Giulio Castelli, Jerome El Jeitany, Enrico Lucca, Enrica Caporali, and Fernando Nardi

Summarizing the various dimensions of the Water-Energy-Food-Ecosystem (WEFE) Nexus and articulating their interconnections through indicators can improve the understanding of the Nexus among both experts and stakeholders without specialized knowledge, supporting the transition towards implementing a WEFE Nexus approach for effective management of socio-ecological systems. As part of the EU PRIMA-funded project NEXUS-NESS, a participatory approach has been devised for identifying indicators related to the WEFE Nexus. The project's objective is to collaboratively develop WEFE Nexus management strategies within four Living Labs, designated as Nexus Ecosystem Labs (NELs), situated in distinct Mediterranean countries (namely, Egypt, Italy, Spain, and Tunisia). To achieve this, the concept of Responsible Research and Innovation (RRI) has been implemented through the RRI Roadmap (The RRI Roadmap©™ is under the ownership of XPRO Consulting Limited) methodology to establish a stakeholders’ participatory and interactive process. This involves active engagement between societal stakeholders and scientists, fostering knowledge-sharing and co-defining the indicators used to represent the WEFE Nexus within the NELs. Specifically, the work done has led to the formulation of a comprehensive inventory of WEFE Nexus indicators, applicable across all NELs. Additionally, a simplified representation has been developed to provide a preliminary assessment of the Nexus within the NELs under current conditions and future scenarios. Subsequently, a matrix approach has been devised to systematically map and evaluate all interconnections within the WEFE Nexus within a given NEL, utilizing indicators tailored to the specific needs of that NEL and its stakeholders.These indicators will play a crucial role in assessing the advantages and trade-offs associated with proposed solutions to the main Nexus-related challenges identified within the NEL. Furthermore, they will support the cost-benefit analysis, serving as a pivotal element in the identification of the most suitable WEFE Nexus-based management strategies. The methodology can be applied to any waterbody that wishes to develop a WEFE Nexus management strategy and achieve ownership and willingness for change by the waterbody’s stakeholders.

How to cite: Pacetti, T., Merheb, M., Lompi, M., Schneider, X., Cudennec, C., Rodriguez-Sinobas, L., Bahnassy, M., Abdelli, F., Rossetto, R., Bresci, E., Castelli, G., El Jeitany, J., Lucca, E., Caporali, E., and Nardi, F.: Participatory development of indicators to support WEFE Nexus management in the Mediterranean, EGU General Assembly 2024, Vienna, Austria, 14–19 Apr 2024, EGU24-12668, https://doi.org/10.5194/egusphere-egu24-12668, 2024.

EGU24-13190 | Posters on site | HS5.2.2

Modelling the Water-Energy-Food NEXUS in the Val di Cornia UNESCO Ecohydrological Observatory. A FREEWAT-Q3 implementation. 

Rudy Rossetto, Ata Joodavi, Laura Ercoli, Luca Sebastiani, Marco Masi, Alessandro Fabbrizzi, Roberto Benvenuto, Iacopo Borsi, and Fernando Nardi

Effectively addressing the water-energy-food-environment (WEFE) Nexus at watershed scale requires the need of software tools to support planning towards sustainable development, even in the medium-long term. Because spatial data are largely available and hydrologic models starts to be common tools to manage the water resources, expanding modelling capabilities to the WEFE Nexus may provide valuable support.

Within the NEXUS NESS PRIMA project (www.prima-nexus-ness.org/) the free & open source FREEWAT-Q3 software for water resources management is developed. FREEWAT is a free and open source, QGIS integrated interface for planning and management of water resources, with specific reference to groundwater. The FREEWAT platform couples the power of GIS geo-processing and post-processing tools in spatial data analysis with that of process-based simulation models. The FREEWAT environment allows storage of large spatial datasets, data management and visualization, and running of several distributed modelling codes (mainly belonging to the USGS MODFLOW family). The ongoing FREEWAT-Q3 version works from QGIS 3.30 version. It includes the following codes: MODFLOW-2005, MODPATH, MT3D-USGS, SEAWAT, along with codes for conjunctive use of surface and groundwater (MF-OWHM v.2.0) and for the simulation of crop yield at harvest. A WEFE NEXUS toolbox provides capabilities to include NEXUS related indicators in the analyses. The code is freely distributed along with a set of tutorials, dataset, and learning material.

The software is applied to the Val di Cornia Ecohydrological Observatory (Italy), a watershed scale laboratory for investigating the long-term impact of climate change and the intertwined direct impacts caused by human activities on the water resources, and to assess nature-based solutions effectiveness. The implementation of a model whose construction and maintenance is shared with the main stakeholders in the area (united under the umbrella of a NEXUS Ecosystem Lab) greatly supports the path towards sustainable development at the watershed scale.


Acknowledgement

This contribution is presented within the framework of the NEXUS-NESS project. The NEXUS-NESS received funding from the PRIMA Programme, an Art.185 initiative supported and funded under Horizon 2020, the European Union’s Framework Programme for Research and Innovation.


How to cite: Rossetto, R., Joodavi, A., Ercoli, L., Sebastiani, L., Masi, M., Fabbrizzi, A., Benvenuto, R., Borsi, I., and Nardi, F.: Modelling the Water-Energy-Food NEXUS in the Val di Cornia UNESCO Ecohydrological Observatory. A FREEWAT-Q3 implementation., EGU General Assembly 2024, Vienna, Austria, 14–19 Apr 2024, EGU24-13190, https://doi.org/10.5194/egusphere-egu24-13190, 2024.

EGU24-13216 | ECS | Posters virtual | HS5.2.2

Behavioural Insights for Climate Information and Services in Africa 

Denyse S. Dookie and Declan Conway

A shift from stating ‘what the weather will be’ to understanding ‘what the weather will do’ marks the importance of early warning and early action and highlights the role and potential value of climate information and services. Within this recognition, however, there is an implicit assumption of availability of and access to credible, salient, and legitimate information about the hazard threat as well as understanding of locational exposure and vulnerability. Effective communication of threat is also implied, as it is vital to align with the risk perceptions of users, communities, and organisations in order to motivate responses which are available and perceived to be feasible and helpful.

This research explores these underpinning assumptions of climate information and climate risk management practices through a behavioural and psychological science lens. We do this within the construct of the CLARE “Behavioural Adaptation for water Security and Inclusion” (BASIN) project, which focuses on improving water security and inclusion in a changing climate in Africa. Noting that progress towards inclusive water security and equitable climate adaptation is underscored by understanding risk management decisions, the BASIN project focuses on how such decisions are shaped by social structures to support behaviour change in the water community and wider society. As such, this paper will synthesise behavioural and psychological science insights to support equitable and effective climate information use given a review of available early warning information and consideration of local knowledge and decision-making realities.

How to cite: Dookie, D. S. and Conway, D.: Behavioural Insights for Climate Information and Services in Africa, EGU General Assembly 2024, Vienna, Austria, 14–19 Apr 2024, EGU24-13216, https://doi.org/10.5194/egusphere-egu24-13216, 2024.

EGU24-13453 | ECS | Posters on site | HS5.2.2

Water Competition within The Water-Energy-Food Nexus in The Yellow River Basin: Insights from Water Quantity and Quality Dimensions 

Xinxueqi Han, En Hua, Jiajie Guan, Jieling Yin, Bernie A Engel, Shikun Sun, and Yubao Wang

Water is a critical shared resource for food and energy production, and its scarcity is becoming more evident under the combined effects of economic expansion and climate change. This has heightened the debate on the competition for increasingly scarce water resources between the food and energy industries. To comprehensively assess water competition and synergy mechanisms, both water quantity and quality dimensions must be considered. Here, we establish two scenarios based on the water footprint perspective: water quantity (blue water footprint) and water quality-quantity (blue and grey water footprints). By integrating the Lotka-Volterra model with water footprint theory, we propose a method to assess water synergy and competition within the food and energy industries, illustrated through a case study in the Yellow River Basin (YRB). Results show that from 2000 to 2020, urbanization and industrialization have reshaped water competition in the YRB, shifting it from food-producing areas to those focused on energy production. The inclusion of water quality exacerbates the water competition within the food and energy industries, particularly in resource-rich and economically developed cities. Moreover, our study highlights the sensitivity of water competition in the YRB to fluctuations in industrial structural configuration, advancements in water utilization efficiency, and the shifts in policy directives. This indicates that, in charting a path forward, the YRB should consistently enforce water pollution control regulations and embrace advanced water-saving technologies to effectively mitigating conflicts that may arise from water competition.

How to cite: Han, X., Hua, E., Guan, J., Yin, J., Engel, B. A., Sun, S., and Wang, Y.: Water Competition within The Water-Energy-Food Nexus in The Yellow River Basin: Insights from Water Quantity and Quality Dimensions, EGU General Assembly 2024, Vienna, Austria, 14–19 Apr 2024, EGU24-13453, https://doi.org/10.5194/egusphere-egu24-13453, 2024.

EGU24-16815 | Posters on site | HS5.2.2 | Highlight

Unraveling the Dynamics of Irrigation Water Use in North China: Patterns and Influencing Factors over the Early 21st Century 

Di Long, Caijin Zhang, Yingjie Cui, and Liang Dong

Abstract: The Haihe River Basin (HRB) in North China, characterized by a warm and humid environment, has witnessed a transformation in agricultural water supply patterns, influenced by both climatic changes and groundwater withdrawal restrictions. Despite the impact of these changes on irrigation activities, comprehensive monitoring of irrigation water use (IWU) is lacking, with existing studies predominantly focusing on the influence of irrigation on climatic factors and crop yield. Few studies address the effects of warming and humidification on IWU, and the impacts of human activities associated with groundwater withdrawal restrictions remain underexplored. This study introduces a novel IWU estimation method and examines changes in IWU across the HRB from 2003 to 2022. By quantifying the contribution of irrigation water to different destinations (evapotranspiration consumption, root zone soil water increment, and groundwater recharge), key drivers of IWU change are revealed. The accuracy of IWU estimates proves high, effectively reflecting spatiotemporal changes in irrigation activities.

Results demonstrate declining trends in irrigation water intensity and the proportion of irrigation area, with changes in irrigation water intensity dominating overall IWU variations. Shifts in cropping patterns, such as the southward relocation of winter wheat planting and increased drought-tolerant corn cultivation after 2012, explain regional disparities in IWU values. The proportion of irrigation water consumed by evapotranspiration and root zone water increment was 0.58 and 0.39, respectively. Utilizing the least partial square regression method, cropping pattern changes emerge as common drivers for irrigation water intensity in the three main administrative regions (Hebei Province, Beijing, and Tianjin). Irrigation management factors prevail in Hebei Province and Tianjin, while climate factors, particularly in Beijing, play a significant role. Increased water supply and a wetter climate over the past 20 years contributed to decreased irrigation water intensity, particularly in Hebei Province and Beijing. Additionally, optimization of cropping patterns and the adoption of water-saving agriculture further reduced irrigation water intensity in the HRB. This study provides a thorough understanding of the evolving irrigation landscape and associated mechanisms in the HRB over the past two decades. The findings offer insights into combatting climate change and groundwater depletion, informing strategies for sustainable water resource management.

Keywords: Irrigation water use; drivers; cropping patterns; North China Plain

How to cite: Long, D., Zhang, C., Cui, Y., and Dong, L.: Unraveling the Dynamics of Irrigation Water Use in North China: Patterns and Influencing Factors over the Early 21st Century, EGU General Assembly 2024, Vienna, Austria, 14–19 Apr 2024, EGU24-16815, https://doi.org/10.5194/egusphere-egu24-16815, 2024.

EGU24-18915 | ECS | Orals | HS5.2.2

Groundwater storage recovery in the North China Plain: Impacts of river replenishment, land use change, and climate variability 

Yuancheng Xu, Di Long, Yingjie Cui, Liang Dong, and Yoshihide Wada

The North China Plain (NCP) has faced substantial groundwater depletion driven by rapid population growth, socioeconomic development, and high irrigation water demand in recent decades. Responding to this challenge, the Chinese government has implemented significant measures, including the construction of the South-to-North Water Diversion Project's middle route (SNWD-M) and the curtailment of groundwater use, aiming to alleviate water scarcity and overexploitation. The river replenishment initiative, utilizing surplus SNWD-M water, has injected over 9.5 km3 into NCP rivers. Simultaneously, policy-induced shifts in agricultural land use, such as transforming winter wheat and summer maize rotation to single crops through seasonal fallow, have reshaped the landscape. Additionally, extreme events like the record flood in the summer of 2023 have become influential contributors to groundwater recharge in the NCP under changing climate conditions.

To evaluate the joint impact of these anthropogenic and natural factors on groundwater levels and surface water-groundwater interactions, we established a coupled surface water-groundwater model across the NCP. Our findings reveal that river replenishment, coupled with the 2023 record flood, played a pivotal role in the rebound of groundwater levels. However, changes in agricultural land use introduce uncertainties. This study provides a holistic understanding of the drivers behind the recovery of groundwater storage in the NCP over the past decade, offering valuable insights for the enhanced management of the SNWD-M initiative.

How to cite: Xu, Y., Long, D., Cui, Y., Dong, L., and Wada, Y.: Groundwater storage recovery in the North China Plain: Impacts of river replenishment, land use change, and climate variability, EGU General Assembly 2024, Vienna, Austria, 14–19 Apr 2024, EGU24-18915, https://doi.org/10.5194/egusphere-egu24-18915, 2024.

EGU24-19626 | Posters on site | HS5.2.2

Improving Maize Water Use Efficiency: Strategies for Mitigating Water Demand Challenges in a Changing Environment 

Antriksh Srivastava and Venkatraman Srinivasan

Improving Maize Water Use Efficiency: Strategies for Mitigating Water Demand Challenges in a Changing Environment


Abstract

Maize, a significant food source compared to other crops, has seen yield improvements due to genetic enhancements. However, to meet future demands, further enhancements are essential. Stagnant crop water use efficiency (WUE) poses a challenge to food security, emphasizing the importance of addressing inefficient crop water use. The current CO2 saturation in maize crop photosynthesis (Anet) offers a potential avenue for enhancing water use efficiency by genetically reducing stomatal conductance (gs). While this reduction in gs is anticipated to lower transpiration without impacting Anet, it simultaneously raises leaf temperature (Tleaf) and water vapor pressure deficits (VPD). Here, we use a mechanistic C4 leaf model (vLeaf) to explore the impact of gs reduction on leaf-level processes, revealing both direct effect (primary) and indirect feedback (secondary) of gs reduction on leaf WUE. Our simulations show that secondary effects can counteract the water-saving advantages derived from decreased transpiration, leading to a decline in WUE gains from 40% to 20%. Despite this notable decrease, it is important to highlight that these reductions do not nullify the WUE benefits associated with lowered gs. Moreover, simulations conducted under anticipated future conditions, characterized by elevated CO2 levels and drier air, indicate that a reduction of gs by 29% can yield WUE improvements of up to 28%. This study emphasizes the potential of reducing gs as an effective strategy to tackle the issue of water demand.

How to cite: Srivastava, A. and Srinivasan, V.: Improving Maize Water Use Efficiency: Strategies for Mitigating Water Demand Challenges in a Changing Environment, EGU General Assembly 2024, Vienna, Austria, 14–19 Apr 2024, EGU24-19626, https://doi.org/10.5194/egusphere-egu24-19626, 2024.

EGU24-20135 | ECS | Posters on site | HS5.2.2

Utilizing crop water stress index for efficient irrigation scheduling of wheat (Triticum Aestivum L.) 

Aschalew Cherie Workneh, K.S. Hari Prasad, and Chandra Shekhar Prasad Ojha

The study aimed to assess the viability of utilizing canopy temperature-based crop water stress index (CWSI) for scheduling of irrigation in wheat crop (Triticum Aestivum L.). Field experiments were carried out for 2021-2022 and 2022-2023 cropping periods at irrigation laboratory of Civil Engineering Department at Indian Institute of Technology Roorkee, Roorkee, India. The experimental field was divided into six plots, each subjected to different irrigation treatments based on the depletion of total available soil water (ASW) within the crop's root zone. These irrigation treatments maintained varying levels of water depletion in the soil (WDS) of TASW, encompassing 10%, 25%, 35% and 50%, as well as fully irrigated (non-stressed) and extremely dry (fully stressed) conditions. To establish a baseline, multiple regression analysis between meteorological variable and crop parameters were conducted.  The CWSI was subsequently calculated for various levels of WDS of ASW using an empirical method. It was found that the irrigation treatment corresponding to 50% WDS, with a mean CWSI of 0.36, resulted in optimal yield and maximum water use efficiency. The findings of the study suggest that the established CWSI value can effectively identify stress levels and serve as a valuable tool for scheduling irrigation in wheat crop.

How to cite: Workneh, A. C., Prasad, K. S. H., and Ojha, C. S. P.: Utilizing crop water stress index for efficient irrigation scheduling of wheat (Triticum Aestivum L.), EGU General Assembly 2024, Vienna, Austria, 14–19 Apr 2024, EGU24-20135, https://doi.org/10.5194/egusphere-egu24-20135, 2024.

Water, energy, and food (WEF) are interlinked and create a dynamic system that impacts both human well-being and ecology. Given the importance of ecology within the WEF system, water resources serve as the core issue. The allocation of water resources in irrigation districts is a challenging problem for the coordinated development of agricultural production, water resources, and the ecological environment. The integration of stochastic multi-objective programming, fuzzy credibility-constrained programming, and mixed integer programming offers a solution to this issue, with the construction of a fuzzy credibility-constrained stochastic multi-objective mixed-integer nonlinear programming model. The applicability and validity of this model were verified by applying it to the Kaikong Irrigation District (KID) of the Tarim River Basin in northwest China, with notable findings indicating that the optimized system reduces agricultural costs by 5.82%, increases irrigation water use efficiency by 1.80%, and reduces global warming potential by 6.45%. This study investigates the effects of diverse allocation strategies of water and land resources on the social, economic, and ecological subsystems and their interactions by downscaling four subprocesses PBs to the KID scale. The optimization model reveals that only the nitrogen footprint of Kuerle City surpasses the nitrogen boundary of the KID. The proposed solutions based on the model can encourage the green and ecologically-friendly development of agricultural production and can be applied to agricultural systems in arid regions with similar conditions. 

How to cite: Zhang, Y. and Yang, P.: An inexact multi-objective mixed-integer nonlinear programming approach for water-soil-fertilizer management under uncertainty considering “footprint family-planetary boundary” assessment, EGU General Assembly 2024, Vienna, Austria, 14–19 Apr 2024, EGU24-20431, https://doi.org/10.5194/egusphere-egu24-20431, 2024.

EGU24-20586 | Posters on site | HS5.2.2

Case study of Water-Energy-Food Nexus management in Northwest China 

Xiaojun Wang, Jiaqi Sun, Jianyun Zhang, and Yanan Jiang

Water, energy, and food constitute essential resources crucial for human survival and development. Water security, energy security, and food security are critical issues related to human sustainable development. Northwest China is endowed with abundant energy and mineral resources. Simultaneously, the region serves as a significant reserve base for grain production in China. However, Northwest China faces challenges related to water scarcity. The rapid increase in water demand for energy development and agricultural production intensifies competition for water resources among food and energy. Water scarcity has emerged as a significant constraint on the development of the energy and food industries in the region. Given the interrelated, mutually restrictive, and interdependent nature of water, energy, and food, scientifically revealing and coordinating the Water-Energy-Food (WEF) interaction in Northwest China holds great scientific significance. To address this, we selected two cases in Northwest China: Ningdong Energy and Chemical Industry Base and Yulin City. Firstly, we proposed and developed an agent-based water–energy–food model based on MESA library for Ningdong Energy and Chemical Base. This model aims to simulate the complex dynamic interactions in the supply and demand process of WEF sectors under different scenarios. Secondly, for Yulin City, we constructed a Water-Energy-Food Integrated Management Model to deal with multiple Uncertainties, called IMMU-WEF model. This model was employed to explore the water resources allocation mode, agricultural planting structure, energy exploitation and production mode in Yulin City under uncertain conditions. Through the two cases, we aim to provide a valuable reference for the management of WEF nexus in Northwest China. This has significant implications for ensuring the sustainable economic and social development of Northwest China.


Keywords: Water-energy-food nexus; multi-agent based modeling; IMMU-WEF model; Northwest China

How to cite: Wang, X., Sun, J., Zhang, J., and Jiang, Y.: Case study of Water-Energy-Food Nexus management in Northwest China, EGU General Assembly 2024, Vienna, Austria, 14–19 Apr 2024, EGU24-20586, https://doi.org/10.5194/egusphere-egu24-20586, 2024.

EGU24-20794 | ECS | Orals | HS5.2.2 | Highlight

Identifying and addressing global hotspots of climate-related crop production losses 

Marta Tuninetti and Kyle Davis

Meeting future food demand will require transformations toward sustainable and resilient food systems that simultaneously increase production, minimize environmental impacts, and adapt to climate change. With fluctuations in temperature and precipitation exercising a growing influence on production stability across the planet, a detailed understanding of where cropping patterns are vulnerable to climatic stresses is a missing yet critical step for developing solutions that enhance the climate resilience of crop production. Here we address this urgent need by combining gridded climate data, spatially-explicit agricultural statistics, and process-based crop modeling to quantify global patterns of rainfed and irrigated crop climate sensitivity (measured as the percent reduction in median yield under extreme climate conditions) and climate-associated production losses for 17 major crops, accounting for 75% of global primary production. This climate sensitivity metric is ideally suited for identifying locations where each crop tends to be subject to high climate variability and where crop production may be susceptible to high climate-related production losses. We estimate -10.1% and -6.8% losses in global rainfed and irrigated production (respectively) under historically observed extreme climate conditions - enough calories to feed 2.1 billion people - and find hotspots of climate sensitivity in the central US, eastern Brazil, the Mediterranean basin, and South Asia, among other regions. We then focus on monsoon cereals (rice, maize, millet, sorghum) to illustrate how sustainable irrigation expansion and targeted crop switching could reduce climate sensitivity, finding that 62% of production losses could be avoided while increasing overall production by 14%. Our new scalable and universal approach to measuring the climate sensitivity of crops enables the assessment of where climate-related production losses tend to be largest and where mitigating actions and investments can be proactively targeted to better ensure the stability and increased supply of global crop production.

How to cite: Tuninetti, M. and Davis, K.: Identifying and addressing global hotspots of climate-related crop production losses, EGU General Assembly 2024, Vienna, Austria, 14–19 Apr 2024, EGU24-20794, https://doi.org/10.5194/egusphere-egu24-20794, 2024.

EGU24-216 | ECS | PICO | HS5.2.3 | Highlight

Assessment of Hydropower Generation and Green Hydrogen Production Potential in Jebba Dam, Nigeria, West Africa 

Emmanuel Olorunyomi Aremu, Agnidé Emmanuel Lawin, David Olukanni, Harrie-Jan Hendricks Franssen, and Nathalie Voisin

Hydropower can play a significant role in advancing the production of green hydrogen. However, hydro-climatic variability impacts hydropower production and thus the hydrogen potential. In this study, we developed novel analytics to understand how hydropower inter-annual variability translates to hydrogen production. We address this by; (i) analyzing Jebba dam hydro-climatic variables and associated hydropower generation (ii) translating the annual and quarterly hydropower production into hydrogen using five assumed scenarios; (iii) estimating the re-electrification potential and (iv) determining the quantity of petrol (or gasoline) that would be replaced and the amount of CO2 and CO that would be avoided. We find that hydropower energy generation has increased significantly at the station. The estimated annual and quarterly green hydrogen potentials indicated that the highest potentials were 59,111 tons and 18,744 tons and have a re-electrification potential of 1,182 GWh and 374 GWh, which can replace 0.224 million liters and 0.071 million liters of petrol (or gasoline) in the year 2021 and the fourth quarter of 2021–04, respectively. This would prevent 0.52 million kg of CO2, 0.92 thousand kg of CO in the year 2021, and 0.163 million kg of CO2, 0.293 thousand kg of CO emissions in the fourth quarter of 2021–04. The study concludes that the impact of hydro-climatic variation on hydropower generation affects green hydrogen production potential. Nevertheless, using a percentage of hydropower energy can present a unique opportunity to move the nation toward the production of green hydrogen energy as a long-storage solution for rural areas' re-electrification and to meet electricity demand when the hydropower dam’s water storage is low. Furthermore, the adoption of a green hydrogen energy solution can contribute to the nation's and global climate change mitigation efforts.

How to cite: Aremu, E. O., Lawin, A. E., Olukanni, D., Hendricks Franssen, H.-J., and Voisin, N.: Assessment of Hydropower Generation and Green Hydrogen Production Potential in Jebba Dam, Nigeria, West Africa, EGU General Assembly 2024, Vienna, Austria, 14–19 Apr 2024, EGU24-216, https://doi.org/10.5194/egusphere-egu24-216, 2024.

In comparison to traditional fossil fuels, hydropower has the potential to significantly reduce greenhouse gas emissions and play a crucial role in promoting a low-carbon energy structure transformation. However, the reliability and stability of the hydropower system in the warming future remain unclear. Here, we evaluate the impact of future climate change on hydropower production, regional electricity demand, and energy system supply-demand balance in the Yangtze River Basin (YRB), which is China's largest hydropower production base. We have utilized two indexes, i.e., Energy Production Drought (EPD) and Energy Supply Drought (ESD), to characterize the changes in the hydropower energy system. EPD refers to a series of days with low hydropower production, while ESD refers to a series of days with mismatched production/demand. We utilize 15 global climate models from CMIP6 to force the Conjunctive Surface-Subsurface Process version 2 (CSSPv2) land surface model with consideration of reservoir regulations, to estimate the generation capacity of 86 mainly hydropower plants in YRB. In addition, an empirical electricity demand model considering socio-economic and climate factors is adopted to evaluate the changes in electricity demand in the receiving areas of southern China. Under climate change, the projected hydropower generation in the YRB is expected to increase throughout the 21st century. However, the future electricity demand will also rise due to GDP growth. Climate change will alter the distribution of seasonal electricity demand, resulting in an increasing mismatch between electricity demand and hydropower supply. Therefore, hydropower EPD and ESD are also being investigated, and the study is crucial for understanding future changes in the electricity supply and demand balance, as well as mitigating the impact of global warming.

How to cite: Liu, X. and Yuan, X.: Future changes in hydropower energy system in the Yangtze River Basin under different warming levels, EGU General Assembly 2024, Vienna, Austria, 14–19 Apr 2024, EGU24-264, https://doi.org/10.5194/egusphere-egu24-264, 2024.

El Niño events pose a significant threat to water security in the Godavari river basin (GRB), leading to adverse impacts on water-energy nexus. To enhance long-term energy security, we developed an integrated framework combining the hydrological model, variable infiltration capacity (VIC) model, and geospatial tools to identify potential sites for run-of-river small hydropower (RoR-SHP) plants. The study utilized long-term (1951-2020) daily streamflow data, simulated with the VIC model for design discharge computation at 30%, 75%, and 90% flow dependability. The analysis revealed considerable potential for RoR-SHP development within the GRB, identifying 226 initial sites based on the head along the river, with a combined power and annual energy generation estimate of 92 MW and 0.4 TWh/yr, respectively, at 90% flow dependability. After meticulous screening, 11 potential sites based on the head and the power potential were identified. The detailed analysis during El Niño years demonstrated a decline of approximately 46%, 38%, and 18% in total annual energy at 30%, 75%, and 90% flow dependability, respectively, compared to normal years. Consequently, we proposed nine potential sites based on the head, power potential, and viability under El Niño for RoR-SHP development, capable of maintaining the firm power even during El Niño years. Our findings highlighted the increased risk of power shortages in the GRB during El Niño years, emphasizing the imperative need for implementing water-energy nexus strategies to cope with the risks associated with El Niño events.

How to cite: Kasiviswanathan, K. S. and Thakur, C.: An Integrated Hydrological Modeling Framework for Enhancing Water-Energy Nexus during El Niño Events in the Godavari River Basin, India , EGU General Assembly 2024, Vienna, Austria, 14–19 Apr 2024, EGU24-1567, https://doi.org/10.5194/egusphere-egu24-1567, 2024.

EGU24-2281 | ECS | PICO | HS5.2.3

Assessing Carbon Emissions from Reservoirs in China: Insights from the G-res Model and Implications for Hydropower Planning 

Zilin Wang, Meili Feng, Faith Chan, and Matthew Johnson

Reservoirs are an important source of emissions of carbon-based greenhouse gases (GHGs). China has about tens of thousands of reservoirs, about half of the world's total reservoirs, and therefore needs a more accurate estimate of current carbon emissions from reservoirs. This study utilizes the Greenhouse Gas from Reservoirs (G-res) model to assess CO2 and CH4 fluxes for 1479 reservoirs in China. The findings reveal that Chinese reservoirs contribute 0.156 Tg CO2 eq yr−1 in CO2 emissions and 6.657 Tg CO2 eq yr−1 in CH4 emissions. Across the nine main river basins in China, negative CO2 diffusive emissions from reservoirs are observed where large size reservoirs were attributed specifically the Northern inland and Xinjiang basin, southwest international basin, Yangtze basin, and Pearl basin. Similarly, CH4 fluxes through degassing and ebullition diffusion pathways exhibit a decreasing trend from small to large in the categorisation according to storage capacity. The findings in this study investigated significant GHG emissions from reservoirs in China, but also highlighted the different circumstances under which certain large reservoirs have the potential to act as CO2 carbon sinks. In order to reduce greenhouse gas emissions, it is crucial to strategically review hydropower planning, in which the cumulative effects of small reservoirs and the large impacts of large reservoirs should be considered.

How to cite: Wang, Z., Feng, M., Chan, F., and Johnson, M.: Assessing Carbon Emissions from Reservoirs in China: Insights from the G-res Model and Implications for Hydropower Planning, EGU General Assembly 2024, Vienna, Austria, 14–19 Apr 2024, EGU24-2281, https://doi.org/10.5194/egusphere-egu24-2281, 2024.

EGU24-3867 | ECS | PICO | HS5.2.3

Automatic estimation of reservoir inflows of Alpine hydropower cascade systems using level and outflow data 

Nicola Crippa, Pietro Marzaroli, and Marco Tarabini

Alpine hydropower reservoirs play a crucial role in the energy system as a source of renewable energy and energy storage, as well as in water management mitigating the impacts of extreme events and augmenting freshwater availability. The effective operation of hydropower reservoirs requires knowledge of the expected inflows, and the inflows prediction methods usually require the historical series of observed inflows. The reservoir inflow is often estimated because it is hardly measurable due to its spatial distribution along the reservoir sides. However, traditional methods such as the Simple Water Balance for estimating inflows can yield fluctuating and potentially negative results due to errors in water level measurement and stage-storage relationships. This study focuses on the estimation of inflow to ten reservoirs belonging to three different hydropower cascade systems situated in the Italian Alps. Two new methodologies to estimate reservoir inflow are proposed. The first (Optimized Inflow Estimation from Water Balance, OIEWB) consists of an optimization-based method and extends a known literature optimization technique to cascade reservoirs. In particular, the OIEWB method estimates the inflows to cascade reservoirs solving a bi-objective optimization problem aiming to minimize both the differences between consecutive inflow and the differences between observed and estimated water levels. It also includes an automatic calibration of the weight of the objectives according to the physical characteristics of each reservoir, avoiding any a priori calibration. The second (Filtered Inflow Estimation from Water Balance, FIEWB) consists of a low-pass filter shaped as a piecewise linear function whose slope is defined, again, by the physical characteristics of each reservoir. The low-pass filter is applied to the SWB cascade reservoir inflow to remove the high-frequency fluctuations that can be generated by measurement and estimation errors. The proposed procedures have been compared with the traditionally used ones in terms of Inflow Variability (the difference between inflow at two consecutive time steps) and Storage Error (the difference between the estimated reservoir storage and the observed one). Results show that both the OIEWB and FIEWB methods generate smoother inflows compared to the SWB, reducing the average Inflow Variability standard deviation, of 86.6% and 79.3%, respectively. However, the FIEWB does not guarantee the positivity of the inflows and can lead to large Storage Errors. The OIEWB method has been found to be more flexible and automatically adaptable to reservoirs with a wide range of physical characteristics. Nevertheless, a relationship between the OIEWB and the FIEWB has emerged. This relationship can be used to design new low-pass filters that can emulate the behavior of the OIEWB, combining the flexibility of the latter with the simplicity of the FIEWB. By contributing to provide more accurate and reliable inflow predictions, the proposed methodologies reveal their utility in optimizing cascade reservoir operation, thereby facilitating better decision-making.

How to cite: Crippa, N., Marzaroli, P., and Tarabini, M.: Automatic estimation of reservoir inflows of Alpine hydropower cascade systems using level and outflow data, EGU General Assembly 2024, Vienna, Austria, 14–19 Apr 2024, EGU24-3867, https://doi.org/10.5194/egusphere-egu24-3867, 2024.

EGU24-6751 | ECS | PICO | HS5.2.3

Hydropeaking Mitigation with Re-Regulation Reservoirs 

Ali Mchayk, Ali Torabi Haghighi, Hannu Marttila, and Björn Klöve

The role of hydropower as a renewable and balancing power source is expected to significantly increase in a scenario of Net Zero Emissions by 2050. As a common phenomenon in hydropower plants, hydropeaking will become more prominent, resulting in additional stresses on the ecological status of rivers. Here we propose a novel engineering approach to operate auxiliary reservoirs, termed re-regulation reservoirs to address the challenges posed by hydropeaking on river flow regimes. A re-regulation reservoir aims at smoothing flow fluctuations caused by hydropeaking by diverting and retaining parts of high flows and returning them back to river corridors during low flows. The regulatory performance of re-regulation reservoirs is a function of its geometry and volume availability, and It is defined and optimized by restricting the thresholds of various flow components.

In this study we developed a methodology and an open-access algorithm to operate re-regulation reservoirs using data from Kemijoki River, one of the most regulated rivers in Finland. The theoretical foundation of the algorithm was based on two main objectives, with the first aiming to reduce the hourly peak flow and increase the minimum hourly flow induced by hydropeaking. While the second objective aims to reduce the up- and down- ramping rates to increase the timespan of water level changes in the river’s corridor. Thus, the algorithm establishes a hierarchy of conditions to restrict peak flow, minimum flow, up-ramping rates, and down-ramping rates. However, as the ideal flow conditions for various ecosystem services may be different, a range of thresholds was utilized in each of the algorithm’s conditions resulting in thirty-five possible hydropeaking mitigation scenarios.

In all of the thirty-five tested scenarios, the re-regulation reservoir limits peak and minimum hourly flows and ramp rates according to thresholds defined by the algorithm. The results demonstrated that in most cases the required volume of the re-regulation reservoir increased as the thresholds for flow components became more stringent. However, for some scenarios this trend was not observed, indicating that matching the peak and minimum hourly flow with the ramping rates thresholds is required to achieve optimal re-regulation reservoir design. Nonetheless, our calculations show clear theoretical possibilities for regulating hydropeaking with re-regulation reservoirs.

Compared to other mitigation measures, such as the installation of downstream flow control devices or modifying the operation of hydropower facilities, re-regulation reservoirs offer greater flexibility and adaptability to changing environmental conditions, power, and water demand without increasing the operational cost of power systems.

How to cite: Mchayk, A., Torabi Haghighi, A., Marttila, H., and Klöve, B.: Hydropeaking Mitigation with Re-Regulation Reservoirs, EGU General Assembly 2024, Vienna, Austria, 14–19 Apr 2024, EGU24-6751, https://doi.org/10.5194/egusphere-egu24-6751, 2024.

EGU24-7354 | PICO | HS5.2.3 | Highlight

Reconsidering hydropower in the African energy transition 

Matteo Giuliani, Andrea Castelletti, Angelo Carlino, and Wyatt Arnold

African nations are striving to meet increasing energy demands driven by population growth and improving living standards. To reduce emissions, many national capacity expansion plans are attempting to use low-carbon electricity sources and exploit the untapped continental hydropower potential with 300 new hydropower projects planned for a total of around 100 GW of new installed capacity. However, climate, socio-economic, and technological changes are making these investments in new dams more risky and less economically efficient.

In this talk, we discuss the role of hydropower projects across different power capacity expansion pathways in Africa. Our multi-scale analysis is built on an integrated modeling framework that combines an Integrated Assessment Model (GCAM), an energy system planning model (OSeMOSYS-TEMBA), a power system model (PowNet), and a strategic river basin-scale reservoir system model. This framework allows the simulation of different future scenarios that harmonize global climate policies, land-use change, climate impacts on water availability, final energy demands, and multipurpose reservoir operations.

Our results show that, depending on the scenario considered, between 32 and 60% of the proposed hydropower capacity is not cost-optimal. Moreover, our analysis suggests that hardly any new hydropower will be built after 2030, meaning that its role in terms of installed capacity and generation will gradually decrease in favor of solar and wind power. Besides, floating photovoltaics might also represent a low-impact alternative to hydroelectric dams, producing 20-100% of the electricity from planned hydroelectric dams depending on the scale of deployment of this new technology on existing hydroelectric infrastructure at the African power pool scale. Lastly, we show how policy fragmentation between developed and developing countries in their approach to land use change emissions can have negative side effects on local water demands, producing favorable conditions for the realization of extensive agricultural projects in Africa that increase local irrigation demands and constrain the availability of water resources for hydropower production.

These findings show that strategic planning of water-energy systems is essential to navigate the complex landscape of hydropower development in Africa. By adopting a systemic approach, African nations can identify cost-efficient climate-resilient hydropower projects that will contribute in securing a sustainable and resilient energy future.

How to cite: Giuliani, M., Castelletti, A., Carlino, A., and Arnold, W.: Reconsidering hydropower in the African energy transition, EGU General Assembly 2024, Vienna, Austria, 14–19 Apr 2024, EGU24-7354, https://doi.org/10.5194/egusphere-egu24-7354, 2024.

EGU24-8003 | ECS | PICO | HS5.2.3

A Life cycle assessment of energy harvesters in existing European water networks for distributed network monitoring 

Bethany Bronkema, David C. Finger, Bjarnhédinn Gudlaugsson, and Dogan Gezer

Recent developments in eastern Europe, increasing climate disasters and the continuous threat of volcanic eruptions have revealed the vulnerability of present energy and water supply systems. To enhance the resistance of existing water and energy infrastructure, holistic monitoring relies on decentralized energy production. Energy harvesters (EH) utilize kinetic energy in existing water pipelines to produce an electric current to power sensors and other components related to water infrastructure monitoring, replacing vulnerable and cost intensive diesel generators.  EHs could represent an ideal solution to provide reliable and continuous power to decentralized monitoring systems. To characterize and assess the environmental impacts of EH, a complete life cycle assessment (LCA) was conducted using GaBi software and the ecoinvent database, as well as data collected from various case studies. This LCA focuses on EH in existing water facilities and networks and includes manufacturing, transport, usage, and decommission stages for the EH. In modeling this technology from cradle-to-grave, a more complete understanding of its environmental impacts can be obtained. Special focus in this LCA was given to the allocation of impacts to services provided by water networks, e.g., drinking water supply, heat supply and water purification. Preliminary results suggest that a scale up of these harvesters could bring their global warming potential – measured in g CO2, eq/kWh – down to a level that is competitive with conventional hydropower while having significantly less impacts on surrounding natural areas. Our results focus on the case study in Iceland, the district heating system in Reykjavik. The preliminary results suggest that most impacts stem from the production of the material needed for the harvester, with little coming from the operation phase. As discussed above, EHs could provide a solution to decentralized monitoring systems. One application being explored for these harvesters is to power sensors along the existing water facility network, thus adding not only to the reliability of power supply, but to the overall reliability of the water network and provided a cleaner source of power than traditional diesel generation. If considered as part of an allocation LCA, these emissions savings constitute an additional reduction in the harvesters’ impacts. Essentially, the results of this LCA suggest that EH in existing water systems represents a crucial element in the low-carbon energy transition. EH could increase resiliency and energy security, while tapping into already existing water supply networks, ideally without adverse effects on these systems. While our results focus on a case study in Iceland, we plan to apply the approach to drinking water supply systems in Ferlach, Austria and Izmir Turkey, water purification in Padova, Italy and natural currents in the lagoon of Venice, Italy. The ensemble of the results from all case studies could reveal the full potential of EH across Europe.

How to cite: Bronkema, B., Finger, D. C., Gudlaugsson, B., and Gezer, D.: A Life cycle assessment of energy harvesters in existing European water networks for distributed network monitoring, EGU General Assembly 2024, Vienna, Austria, 14–19 Apr 2024, EGU24-8003, https://doi.org/10.5194/egusphere-egu24-8003, 2024.

EGU24-8551 | ECS | PICO | HS5.2.3

Global loss in global hydropower supply under droughts using a hybrid model 

Jignesh Shah, Jing Hu, Oreane Edelenbosch, and Michelle van Vliet

Hydropower is considered as an important source of renewable energy due to its flexibility and storage capabilities. However, hydropower faces significant challenges with climate change and especially the increasing risks of extreme weather events such as droughts.

In this study, we analysed the impact of historical droughts on hydropower at a global scale by developing a hybrid model that combines a physically based hydropower model with a machine learning model. This integrated approach enables us to capture important features affecting hydropower generation beyond water availability, considering the details of local specific conditions at hydropower plant sites while it can be applied across the globe. A new open-source global dataset is developed that contains key information of the hydropower plant characteristics and their reservoir attributes by merging various plant sources with a global reservoir database. The hybrid model is trained against observed monthly hydropower generation data at the power plant level. By employing this approach, we aim not only to enhance the realism of simulating hydropower output compared to the simplistic physically based equation but also to leverage the flexibility of machine learning. Additionally, this method enables us to circumvent detailed power system modelling which requires significant computing power and extensive data.

We found that the performance of our hybrid hydropower model surpasses the simple physics-based hydropower equation at most hydropower plant sites. Key findings highlight the significant losses of hydropower generation during major historical drought events across the globe.

How to cite: Shah, J., Hu, J., Edelenbosch, O., and van Vliet, M.: Global loss in global hydropower supply under droughts using a hybrid model, EGU General Assembly 2024, Vienna, Austria, 14–19 Apr 2024, EGU24-8551, https://doi.org/10.5194/egusphere-egu24-8551, 2024.

EGU24-9612 | PICO | HS5.2.3

Modernising RoR Hydropower: A Study on Retrofitting Aged Turbines for Optimal Performance 

Solomon Brown, Veysel Yildiz, and Charles Rougé

Hydropower stands out as an economical, reliable, sustainable, and renewable source of energy. It has been the leading source of renewable energy across the world, generating more than 15 % of total electricity in 2022. Therefore, it will likely play a crucial role as the energy system shifts towards a carbon-free future. The turbine system is at the heart of the hydropower plant and converts flowing water into mechanical energy. Remarkably, around 154 gigawatts, or one-fifth of the installed hydropower turbines, will be more than 55 years old by 2030 globally. Modernising these aged turbines is essential for sustaining optimal plant performance and this will create opportunities to retrofit hydropower facilities to improve their adaptability to changing hydrological conditions. A well-defined methodology is necessary to evaluate feasibility and select optimal solutions for upgrades. 

This study addresses this critical necessity in the context of run-of-river (RoR) hydropower plants with the HYPEROP toolbox to efficiently evaluate and choose optimal turbine replacement or upgrade options. HYPEROP provides operational optimization capabilities coupled with design flexibility and expanded simulation features for complex turbine configurations. It facilitates the selection of turbine systems featuring large and small turbines. The effectiveness of this toolbox is illustrated through the  case study of the Bonnington RoR hydropower plant, commissioned in 1927 on the upper reaches of the River Clyde in Scotland, United Kingdom. Bonnington RoR features a pair of two identical Francis turbines, each designed for a discharge of 12 m³/s and equipped with an installed capacity of 5.5 MW.

Our analysis indicates that, by prioritising Net Present Value (NPV) maximisation through a single objective function and considering historical discharge records, HYPEROP offers a novel configuration featuring non-identical Francis turbines with design discharges of 16.13 and 9.13 m³/s.  Optimal design increases power production by approximately 3.4 GWh (~7 %) annually by providing operational flexibility and retaining high efficiency over a range of discharge values. The optimal design yields an NPV of approximately 3 million dollars (USD), factoring in the additional energy increase as revenue, turbine replacement cost, and lifetime operation cost. The payback period for this investment is projected to be 15 years when considering only the additional energy as revenue. It's worth highlighting that the optimised design notably outperforms the current configuration, particularly in response to variable streamflows, including both high and low flows. Therefore, optimal design is expected to be less vulnerable to climate change due to higher efficient configuration. 

How to cite: Brown, S., Yildiz, V., and Rougé, C.: Modernising RoR Hydropower: A Study on Retrofitting Aged Turbines for Optimal Performance, EGU General Assembly 2024, Vienna, Austria, 14–19 Apr 2024, EGU24-9612, https://doi.org/10.5194/egusphere-egu24-9612, 2024.

EGU24-9908 | ECS | PICO | HS5.2.3

Vary me a river: investigating the impacts of climate variability on hydropower and electricity systems planning in Switzerland 

Yann Yasser Haddad, Lukas Gudmundsson, Elena Raycheva, Jonas Savelsberg, Tobias Wechsler, Massimiliano Zappa, Gabriela Hug, and Sonia Isabelle Seneviratne

Clean and renewable energy systems play a pivotal role in climate change mitigation strategies. Nevertheless, climate change constitutes a threat to current and future supply of clean energy.  

In this study, we investigate how climate variability affects hydropower production and electricity systems planning in Switzerland. As the “water tower of Europe”, Switzerland encompasses a wide range of hydro-climatological conditions and showcases a high share of hydropower in its energy mix, making it a relevant case study.

Focusing on all hydropower plants with a capacity > 300 kW, we used daily runoff simulations from the PREVAH model, at 500 m resolution spanning 1991-2022, to estimate water availability and hydropower production for each power plant. The climate-impacted hydropower production time series are then given as input to Nexus-e, an integrated electricity systems modeling framework. This enables us to model the future state of the electricity system in Switzerland while considering climate variability.

Our method provides an accurate estimation of national hydropower generation and its variations. The integration of climate informed inputs into Nexus-e yields strong impacts on simulated investments in renewable energy and economic indicators such as power prices and imports/exports. Notably, in case of a projected decrease in hydropower generation due to increased drought occurrence, an increase in wind turbine and alpine PV capacity is needed to meet electricity demand. This scenario poses several societal and political questions regarding the implementation of a resilient energy system for Switzerland in the context of increasing changes in the climate system and pressure on ecosystems and biodiversity.

How to cite: Haddad, Y. Y., Gudmundsson, L., Raycheva, E., Savelsberg, J., Wechsler, T., Zappa, M., Hug, G., and Seneviratne, S. I.: Vary me a river: investigating the impacts of climate variability on hydropower and electricity systems planning in Switzerland, EGU General Assembly 2024, Vienna, Austria, 14–19 Apr 2024, EGU24-9908, https://doi.org/10.5194/egusphere-egu24-9908, 2024.

EGU24-9926 | PICO | HS5.2.3

Climate change, water resources and the hydropower system in Iceland 

Andri Gunnarsson, Hörður B. Helgason, Óli G. B. Sveinsson, and Gunnar G. Tómasson

In Iceland, hydropower represents around 72% of the gross electricity generation annually, with energy production capabilities around 13.8 TWh/a. Most of the hydropower infrastructure is in the central highlands, relying on water resources temporarily stored as snow and ice. These resources are vulnerable to climate change, projected to undergo substantial changes in the coming decades. Changes in flow volumes, seasonality of flow and extremes will have a strong impact on the hydropower system in Iceland as over 50% of inflow energy to the system originates from glacier ablation during summer. The high natural climate variability and energy system isolation pose a risk to the energy security of the power system as droughts and cold periods are usually not foreseen with great advance. Changes in hydrological flow dynamics, e.g.: onset of snow- and glacier melt, melt magnitudes and precipitation patterns pose a series of challenges for the hydropower system.

In glacier-dominated catchments, climate warming will initially increase glacier meltwater runoff to a maximum and then runoff will reside as the glacier area and volume decrease over time. The timing of the discharge peak is influenced by the catchment topoclimate characteristics and location. Understanding and quantifying these changes is important both for operational control and planning of energy infrastructure on shorter timescales (days, months, years) and climate change adaptation, on longer time scales, for both current energy projects as well as future development to maximize efficient water resource utilization.

To assess the impacts of changes in inflow dynamics on the hydropower system, hydrological models were developed to create inflow scenarios. Historical inflows were first reconstructed, followed by a construction of future runoff scenarios using climate projections and different glacier geometry evolution. This allowed for the assessment of meltwater-induced changes in runoff, although generally increasing in the next decades, certain areas are closer to reaching maximum meltwater production and will decrease in the coming decades. In all cases meltwater-induced increase in runoff is temporary, while large uncertainties exist with the timing of maximum peak inflow.

Utlization of the inflow scenarios created include current day operation to optimize reservoir management strategies and the design of future power projects, including refurbishments and capacity increases. This accommodates the expected increased flow rates 10–50 years into the future.


How to cite: Gunnarsson, A., Helgason, H. B., Sveinsson, Ó. G. B., and Tómasson, G. G.: Climate change, water resources and the hydropower system in Iceland, EGU General Assembly 2024, Vienna, Austria, 14–19 Apr 2024, EGU24-9926, https://doi.org/10.5194/egusphere-egu24-9926, 2024.

EGU24-14292 | ECS | PICO | HS5.2.3

Deriving dynamic reservoir operating policy under the changing precipitation and inflow patterns in snow-dominated Himalayan regions  

Balasundaram Pattabiraman and Kasipillai Sudalaimuthu Kasiviswanathan

The impacts of climate change and complex local weather in the Himalayan region tend to change the characteristics of the precipitation, leading to a high non-stationarity. While studies have been performed to analyse the change in the rainfall pattern due to climate change, no attempts were made for the quantifiable impacts linking with reservoir operating policy. The assumption of stationary while deriving the operating policy of reservoirs is prevalent due to less computational effort. Reservoirs built for hydropower generation is expected to meet the energy demands that largely varies. Thus, adopting the conventional stationary operating policy derived based on the historical data might lead to create a havoc leading to underutilized when the reservoir operation is mainly meant for hydropower generation. In this study, the influence of alterations in the meteorological and inflow pattern on the dynamics of operation policy is explored for the reservoirs located in the snow dominated Himalayan region (Tehri reservoir). To demonstrate the proposed simulation optimization framework, the daily gridded rainfall data (0.25o x 0.25o) for the period 1901 - 2021 collected from Indian Meteorological Department and monthly inflow of tehri reservoir for the period 1965 - 2021 was used.  Several statistical methods were employed to quantify the alterations in the precipitation data and inflow to the reservoirs. A stochastic optimization algorithm was applied to derive the dynamic reservoir rule curves for maximizing the hydropower generation including the weighted over-shifting and seasonality. The statistical analysis of both precipitation and inflow shows negative trend during the drawdown periods (January, March, October, and December) with a mean release of 170 MCM. Further, the alteration in precipitation and inflow is dynamically accounted in operating policy under two release scenarios (i.e. scenario 1 by increasing reservoir release (10%, 20%, 30%) in the negative trend period and decreasing release in the positive trend period and scenario 2 by only increasing release during negative trend period). It is found that the scenario 2 (only increase in release) have resulted in higher hydropower generation. In addition, the changing pattern of the precipitation and inflow is performed by superimposing principle the assessed similar performance in hydropower generation. The outcome of the study indicates the adaptivity of developed framework and applied in other reservoirs under changing environment.

Keywords: Reservoir Operation, Rule curve, Pumped storage, Hydropower.

How to cite: Pattabiraman, B. and Kasiviswanathan, K. S.: Deriving dynamic reservoir operating policy under the changing precipitation and inflow patterns in snow-dominated Himalayan regions , EGU General Assembly 2024, Vienna, Austria, 14–19 Apr 2024, EGU24-14292, https://doi.org/10.5194/egusphere-egu24-14292, 2024.

EGU24-15780 | ECS | PICO | HS5.2.3

Hydrological flow modelling with SWAT: a useful GIS based tool to assess hydropower production. 

Arianna Paschetto, Chiara Caselle, Sabrina Bonetto, and Claudia Leso

Europe's pursuit of climate neutrality by 2050 necessitates innovative strategies in renewable energy deployment. The European Union has championed policies to harness clean energy sources as hydroelectric energy. This study delves in Piedmont region (North-West of Italy), evaluating its residual potential for run-of-river hydroelectric plants.


More in detail, the research focuses on the Sangone catchment, aiming at performing a regional-scale study made to identify the best sites for potential hydroelectric plants. To ensure alignment with European Union biodiversity and environmental conservation directives, particularly the Habitats Directive and Birds Directive, the research prioritizes sites that are not in areas dedicated to environmental protection.

Moreover, the study includes landscape analysis and evaluation of geological and geomorphological constraints, such as landslide and hydraulic hazard, and technical and economic feasibility of plants.

After that, utilizing freely accessible data encompassing temperature, precipitation, land use, and soil characteristics specific to Piedmont, the study employed the Soil and Water Assessment Tool (SWAT).This GIS-integrated hydraulic model extrapolated flow rate metrics for water catchment areas devoid of direct measurement, optimizing site selection for maximal hydroelectric energy yield.The simulation used 17 years of meteorological data from 42 measuring stations and the model was run over the Sangone stream catchment. The model has also been calibrated to simulate runoff in the Sangone catchment. The outputs divide the stream in sections with equivalent potential power production.


Preliminary findings underscore the effectiveness of SWAT by using free data and free tools. It can be a useful planning tool for hydropower implementation by locating sites suitable for run-of-river plants, considering environmental impact and geo-hydrological hazard. As Europe navigates its green transition, such integrative approaches emphasize the feasibility and sustainability of hydroelectricity as a linchpin in the continent's renewable energy matrix.

How to cite: Paschetto, A., Caselle, C., Bonetto, S., and Leso, C.: Hydrological flow modelling with SWAT: a useful GIS based tool to assess hydropower production., EGU General Assembly 2024, Vienna, Austria, 14–19 Apr 2024, EGU24-15780, https://doi.org/10.5194/egusphere-egu24-15780, 2024.

EGU24-20054 | ECS | PICO | HS5.2.3

Machine learning power system emulation for rapid screening of multi-sector policies 

Adil Ashraf, Mikiyas Etichia, Mohammed Basheer, and Julien Harou

Linking integrated water-energy simulation with multi-objective search algorithms provides a practical design tool for interdependent river basins and power systems. However, this approach is typically limited by the computational resources required to complete the many thousands of simulations to discover efficient solutions. We introduce an artificial neural network-based power system emulator to enable optimized design of large-scale detailed multi-sector water-energy systems. The proposed framework links an integrated power system emulator and river system simulator to an AI-driven multi-objective search design process. We compare optimized designs using both the power system emulator and simulator to check the emulators’ computational speed and accuracy. The framework is applied to the Sudanese power system and its link to the Eastern Nile river basin, to investigate how optimized operational strategies of the Grand Ethiopian Renaissance Dam (GERD) could affect Sudan’s resource systems. Results are similar for the power system emulator and simulator, showing the emulator helps to significantly reduce the computational cost of using sophisticated multi-sector policy design approaches.

How to cite: Ashraf, A., Etichia, M., Basheer, M., and Harou, J.: Machine learning power system emulation for rapid screening of multi-sector policies, EGU General Assembly 2024, Vienna, Austria, 14–19 Apr 2024, EGU24-20054, https://doi.org/10.5194/egusphere-egu24-20054, 2024.

EGU24-454 | ECS | PICO | HS5.2.4

Combining a hydrological model with ecological planning for optimal placement of water-sensitive solutions 

Merav Tal-maon, Dani Broitman, Michelle E. Portman, and Mashor Housh

Newer water management approaches aim to better utilize runoff by treating it as a resource rather than a nuisance and by promoting a more holistic handling of runoff. These approaches use nature-based green infrastructure solutions to increase infiltration and detain water. Identifying optimal placement for these solutions is challenging due to multiple and sometimes competing objectives. Here, we propose a methodology to help planners and stakeholders maximize the benefits of flood mitigation projects by identifying opportunities for sustainable development. Most studies examine placement decisions based on metrics obtained from hydrological models. However, solely depending on hydrological indicators, without accounting for social and ecological indicators, might bias the placement decisions. We propose combining hydrological and land-use planning models. We used the revised version of the Soil and Water Assessment Tool (SWAT) known as SWAT+ to simulate existing hydrological conditions and the results as initial input for the conservation decision support software MARXAN. We added data on endangered species and distance from the human population as ecological and social indicators. This addition shifted the selected areas and provided a more complete view of runoff management than only hydrological indicators. Furthermore, we show that coupling SWAT+ and MARXAN can effectively balance hydrological concerns with ecological and social factors.

How to cite: Tal-maon, M., Broitman, D., Portman, M. E., and Housh, M.: Combining a hydrological model with ecological planning for optimal placement of water-sensitive solutions, EGU General Assembly 2024, Vienna, Austria, 14–19 Apr 2024, EGU24-454, https://doi.org/10.5194/egusphere-egu24-454, 2024.

Over the past few decades, the Curve Number (SCS-CN or CN) approach has been employed to estimate direct surface runoff. In the times of urban sprawl, rapidly growing socioeconomic anthropogenic activities, and environmental changes all have a rapid growth that leads to spatial and temporal variability in the land use/land cover (LULC) complex which in a way affects the direct surface runoff, LST, and Vegetative cover. The study utilized the pixel based (PB), object directed (OD) machine learning algorithm i.e., Random Forest (RF) classifier for the LULC change study of the Google Earth Engine (GEE) platform for the verification of the SCS-CN, LST, and vegetative cover variability over 4 decades from 1980 to 2020 of the Ong River sub-basin (area = 4650 sq. km) of the Mahanadi River Basin of India. Sentinel-2 and Landsat satellite products were processed and utilized to conduct the LULC change analysis. The Kappa Coefficients of LULC maps for each decade from 1980 to 2020 equaled 0.86, 0.90, 0.891, and 0.895 with overall accuracy percentages of 97.89, 96.16, 96.79, and 96.44, respectively. The study determined the associated effects of each LULC class (i.e., built-up areas, Barren land, Water Bodies, Cropland, and Forest) on CN variability, LST, and vegetation index i.e., Normalized difference vegetation index (NDVI). The CN values varied from 64 to 78 in the 4 decades, suggesting the effects of decrease in forest cover and an increase in the built up. The LULC change analysis revealed a considerable decrease in the forest area from 1864.8 sq. km to 1098.34 sq. km and a sizeable increment in built-up area from 123.3 sq. km to 458.9 sq. km.  Furthermore, the study investigated and correlated each LULC class with the LST and NDVI. LST and NDVI for the forest and built-up areas were correlated with R2 equal to 0.91 and 0.72, respectively. Overall, the results suggest considering dominating LULC class change led to a rise in the average LST of the watershed from 28.06 °C to 28.68 °C. The increase in the average LST and increasing Curve Number value is a consequence of the scanty forest area combined with the reduction in the greenness of vegetative cover due to an increase in the built-up area indicating the alteration in the land-use patterns, land management practices, and streamflow due to anthropogenic activities. This type of study is helpful for watershed planning and management.

How to cite: Prashant, P., Kumar Mishra, S., and Kumar Lohani, A.: Investigating the effects of Changing Land Use/Land Cover on Curve Number, Land Surface Temperature, and Vegetative Cover in the Ong Sub-Basin of the Mahanadi River, India, EGU General Assembly 2024, Vienna, Austria, 14–19 Apr 2024, EGU24-884, https://doi.org/10.5194/egusphere-egu24-884, 2024.

EGU24-5248 | ECS | PICO | HS5.2.4

Investigating the intercorrelations of ecosystem services related to water resources at the catchment scale 

Zi-Rong Yu, Jia-Ling Yuan, Li-chi Chiang, and Yung-Chieh Wang

Ecosystems provide various direct and indirect benefits for human society, which are closely intertwined with human life, health, and economic well-being. However, pressures such as climate change, changes in land use/land cover, and human activities may pose threats or undermine the stability of ecosystems, consequently impacting the provision of ecosystem services. In recent years, climate change has altered precipitation patterns and increased the occurrence of extreme weather events, resulting in variations in watershed dynamics and affecting the stability of water resources. The impact on water resources has intensified, leading to changes in watershed ecosystem services and influencing the quality of human life and property security. This study is based on simulations using the Soil and Water Assessment Tool (SWAT) model in the Jhuoshuei River basin. Simulations cover historical periods (2002-2020) and near-future (2021-2040) and far-future (2081-2100) scenarios under RCP2.6 and RCP8.5 of CMIP5 models. Five indicators, which include freshwater provision index (FPI), green water scarcity (GWS), green water vulnerability (GWV), flood regulation index (FRI), and erosion regulation index (ERI), were selected for quantitative assessment and analysis of dry and wet season water provisioning and regulating services in the Jhuoshuei River basin. Spatial autocorrelation analysis was employed to identify high and low zones of ecosystem services, and Spearman correlation analysis was used to determine the trade-offs and synergies among the five ecosystem services indicators. The results indicate significant differences in the five indicators between dry and wet seasons. The FPI performs better in the wet season, while the other four indicators exhibit better performance in the dry season. Across historical and climate change scenarios, the relationships among the five indicators remain consistent. The FPI demonstrates a trade-off relationship with the other four ecosystem services, while the FRI, ERI, GWS, and GWV exhibit mutual synergies. This study shows the intercorrelations among the ecosystem services related to water resources, and the results serve as the references for water resources regulations and watershed management.

Keywords: SWAT model, Provisioning services, Regulating services, Green water security, Jhuoshuei River basin

How to cite: Yu, Z.-R., Yuan, J.-L., Chiang, L., and Wang, Y.-C.: Investigating the intercorrelations of ecosystem services related to water resources at the catchment scale, EGU General Assembly 2024, Vienna, Austria, 14–19 Apr 2024, EGU24-5248, https://doi.org/10.5194/egusphere-egu24-5248, 2024.

EGU24-7592 | ECS | PICO | HS5.2.4

Understanding urbanization's impact on flash flood risks from past to future: A Case study of a rapidly growing MENA city 

Ahmad Awad, Clara Hohmann, Christina Maus, Wafaa Abu Hamour, Maram Al Naimat, and Katja Brinkmann

Jordan has experienced several flash floods in recent years, causing property damage and fatalities. Because of the high rates of urbanization since the 1950s, flash flood damage is more likely and the risk to infrastructure and people is increasing. However, the contribution of land use and land cover changes (LULCC) to flash flood risk in urban areas is still poorly understood. Our aims were, therefore, to (i) examine LULCC and urbanization trends and their drivers in Amman, the capital of Jordan (ii) simulate future land cover trends and (iii) investigate the impact of urban expansion on flash flood related damages in the past, present and future.

A mixed-method approach combining quantitative (remote sensing, statistical modelling) and qualitative methods (semi-structured interviews and stakeholder workshops) was used. Past long-term LULCC from 1968 to 2021 were analyzed via object-based classification of panchromatic Corona and multispectral Spot images. Semi-structured expert interviews were conducted to explore historic and current LULCC drivers and their dynamics. The simulation of future land cover trends was based on past LULCC and the identified main drivers using an MLP-MC model then refined with local experts’ knowledge of future urban planning through stakeholder workshops. The resulting LULC-maps were used in hydrological modeling with HEC-HMS to assess LULCC effects on runoff generation.

In the last six decades, the built-up area in Amman's watershed has increased significantly, by a total of 203 km² between 1968 and 2021 (from 20 km² to 223 km²). This trend was mainly at the expense of rainfed cultivated plots and green retention areas (157 km² from 1968 to 2021), resulting in reduced water infiltration and accelerated rates of runoff. The LULCC and urbanization patterns stem from intricate feedback loops involving various socio-economic and bio-physical drivers. Key urbanization drivers include demographic trends (population growth and density), topographic conditions (slope, elevation) as well as the accessibility and location of an area (density of former built-up area, distance to formal/informal refugee settlements, major roads, built-up areas, city centers, and employment hubs). The inadequate policy interventions coupled with mismanagement and unbalanced land-use allocations highly influenced the urbanization pattern that has favored the loss of retention areas in the past. For future land cover changes, the conducted stakeholder workshops revealed that development plans will focus particularly on the dry eastern region of Amman’s watershed (areas that generally receive less rainfall). However, measures and actionable plans to maintain the remaining retention areas are still lacking. The simulated future land cover trend indicates a continued loss of retention areas while areas prone to flash floods will increase emphasizing an urgent need to integrate flash flood risk management in urban development plans. Here, our LULCC analysis gives decision support for urban planners, especially for spatial planning and allocation of future measures and retention areas.

How to cite: Awad, A., Hohmann, C., Maus, C., Abu Hamour, W., Al Naimat, M., and Brinkmann, K.: Understanding urbanization's impact on flash flood risks from past to future: A Case study of a rapidly growing MENA city, EGU General Assembly 2024, Vienna, Austria, 14–19 Apr 2024, EGU24-7592, https://doi.org/10.5194/egusphere-egu24-7592, 2024.

EGU24-9350 | ECS | PICO | HS5.2.4

Spatio-temporal evolution of Land Use Land Cover and hydrological components in the Lake Kivu catchment, Rwanda. 

Naomie Kayitesi, Alphonce Guzha C., Marj Tonini, and Gregoire Mariethoz

The African Great Lakes Region has experienced substantial Land Use and Land Cover Change (LULCC) over the last decades, significantly impacting landscapes and ecosystems. The main drivers of LULCC in the region involve a complex interplay of political, economic, and socio-demographic factors. This study focused on the Lake Kivu catchment in Rwanda, a critical ecosystem in the African Great Lakes Regions, exploring both historical and future LULC scenarios. The methodology involved supervised image classification using seasonal composites and integrating spectral indices with topographic features to capture dynamic seasonal variations. Historical LULCC analysis showed significant changes, particularly the first decade of the study (1990-2000) marked by substantial forest loss (from 26.6% to 18.7%) and a notable increase in agricultural land (from 27.7% to 43%). These changes were attributed to conflicts in the region and population movements. Subsequent decades (2000-2010 and 2010-2020) witnessed marked forest recovery (24.8% by 2020) and a balance between agricultural increase and loss, reflecting Rwanda's commitment to environmental conservation. Additionally, a multi-layer perceptron artificial neural network was employed to predict future LULC scenarios, considering natural and socio-economic explanatory variables with historical LULC transitions. The predicted future LULC for 2030 and 2050 indicate distinct trajectories influenced by factors like political will, demographic trends, and socio-economic developments. By integrating the observed historical trends and predicted future LULC, along with climate scenarios, this study will use a hydrological model to understand the impacts of these changes on the catchment’s hydrological components. Providing essential insights for policy and strategic planning, we explore how the intricate dynamics of water-related ecosystem services are influenced by LULC and climate changes, with the ultimate goal of harmonizing ecological sustainability with socio-economic development in the Lake Kivu catchment and similar environments.

How to cite: Kayitesi, N., Guzha C., A., Tonini, M., and Mariethoz, G.: Spatio-temporal evolution of Land Use Land Cover and hydrological components in the Lake Kivu catchment, Rwanda., EGU General Assembly 2024, Vienna, Austria, 14–19 Apr 2024, EGU24-9350, https://doi.org/10.5194/egusphere-egu24-9350, 2024.

EGU24-10623 | ECS | PICO | HS5.2.4

Integrated Modelling of Landscape Functions: Testing the Impact of Land Use Change 

Borjana Bogatinoska, Angelique Lansu, Jean Hugé, Stefan C. Dekker, and Jetse Stoorvogel

Recognizing the limitations of disciplinary mathematical models for assessing diverse landscape functions, we present a conceptual framework for their integration. This study addresses the challenge of analysing multifunctional landscapes by proposing an integrated modelling approach. We demonstrate the feasibility and effectiveness of this approach in terms of model integration. A thorough analysis of endogenous and exogenous variables in each of the models is an important part of the framework. Through a case study in the Netherlands (catchment Aa of Weerijs) we evaluate the impact of land use change scenarios on drought resilience and on carbon sequestration.

The results indicate that this framework of softly (loosely) coupling a hydrodynamic and a soil carbon model, is effective in understanding the relationship between water and carbon. The framework worked well through multiple model runs and iterations. When applied on a land use scenario of afforestation, the study area showed an average increase in soil moisture during a dry period (increase in drought resilience) and an increase in soil organic carbon (increase in sequestration).

This softly coupled approach contributes valuable insights to environmental modelling, offering a pathway for researchers and practitioners to navigate complex model integration challenges. Such a softly coupled way of working with existing disciplinary models gives practitioners the opportunity to make informed decisions for sustainable landscape management. The thorough variables analysis as part of the framework enhances transparency in modelling, addressing situations where it may not always be obvious which variables and processes are represented and how.

How to cite: Bogatinoska, B., Lansu, A., Hugé, J., C. Dekker, S., and Stoorvogel, J.: Integrated Modelling of Landscape Functions: Testing the Impact of Land Use Change, EGU General Assembly 2024, Vienna, Austria, 14–19 Apr 2024, EGU24-10623, https://doi.org/10.5194/egusphere-egu24-10623, 2024.

EGU24-11451 | ECS | PICO | HS5.2.4 | Highlight

Towards assessing the impacts of large ground-mounted solar parks on the hydrological cycle: an analysis of runoff changes with EPA-SWMM software  

Aurora Gullotta, Tagele Mossie Aschale, David J. Peres, Guido Sciuto, and Antonino Cancelliere

Among all the renewable energy sources, solar photovoltaic (PV) is one of the most widespread in the word. Although solar energy is universally recognised as environmentally friendly energy source, impacts on surface hydrology of large parks have not been comprehensively addressed in literature. With growing concern over the impact of land use changes on stormwater runoff, the construction of large-scale solar power plants may face obstacles in the future unless appropriate quantification of this impact is addressed, and proper measures are taken to mitigate potential increment of flow peak and volume discharge. Assessment of runoff generation in PV solar parks can be carried out by modelling-based approaches, that have the advantage, with respect to purely experimental studies, to allow the investigation of the influence of different hydrological conditions. Moreover, the modelling-based approach enables the possibility to assess the park behavior in the short and in the long-term conditions. Analysis of the literature on the topic highlights a research gap consisting in the lack of a comprehensive tool for the assessment of the impacts of real-scale solar parks on stormwater runoff, by considering the hydrological processes occurring within the park and all the variables affecting the park response to precipitation events. In this work, we propose a novel conceptualization of PV solar parks response to precipitation events capitalizing on the use of the free and open-source Storm Water Management Model (SWMM). The conceptualization allows to take into account the complex hydrological process occurring in the solar parks during precipitation events and to assess how the process of runoff in the park is affected by the extension of the PV installation, soil properties and the characteristics of the rainfall events. Moreover, effects of long-term changes in roughness surface induced by the presence of the panels are taken into account in the analysis. We demonstrate the potentialities of the proposed approach considering a layout of the PV installation (panels size and inclination) as well as characteristics of the precipitation events that are encountered in Sicily (south Italy). In all the simulations, outflow discharge from the park is compared to that from a reference catchment to evaluate variations of peak flow and runoff volume. Results highlight no practical changes in runoff in the short term after installation. However, in the long term, modifications in soil cover may lead to some potential increase of runoff. For instance, increments of the peak flow from the solar park up to 21% and 35% are obtained for roughness coefficient reductions of 10% and 20%, respectively. The proposed modelling approach can be beneficial for studying hydrological impacts of solar parks and thus for planning measures for their mitigation.

How to cite: Gullotta, A., Aschale, T. M., Peres, D. J., Sciuto, G., and Cancelliere, A.: Towards assessing the impacts of large ground-mounted solar parks on the hydrological cycle: an analysis of runoff changes with EPA-SWMM software , EGU General Assembly 2024, Vienna, Austria, 14–19 Apr 2024, EGU24-11451, https://doi.org/10.5194/egusphere-egu24-11451, 2024.

EGU24-15309 | ECS | PICO | HS5.2.4

Relevance  of Landscape Metrics in Predicting Water-Related Ecosystem Services demonstrated on the Arno River Basin Italy 

Jerome El Jeitany, Madlene Nussbaum, Tommaso Pacetti, Boris Schröder, and Enrica Caporali

Quantification of the impact of Land Use and Land Cover Change on ecosystem services is crucial for identifying critical areas requiring conservation efforts and sustainable land practices. Landscape metrics, which quantify the spatial arrangement of land cover types within a landscape, have emerged as valuable tools for systematically understanding such impacts and operationalize land use changes. In this study, we explored the contribution of landscape metrics to predicting water-related ecosystem services, mainly water provisioning at the watershed scale represented by runoff. We employed a random forest model to approximate   distributed  maps of runoff  for the Arno River Basin in Italy, obtained from a nationally used gridded hydrological water balance model .   Open access earth observation data were used as environmental predictors, including hydroclimatic variables, land use classes, and of landscape metrics related to runoff. The out of bag error is used to assess model performance along with variance and bias, and a leave one sub-watershed out a time is used for validation.  Our results demonstrated that despite a relatively low feature importance compared to other direct hydrological predictors like precipitation and temperature, landscape metrics, especially the core area index of forest and agricultural land use, captured significant interactions between forest and agricultural land use and their influence on water provision. In wet and normal conditions where precipitation is the predominant factor, the significance of these metrics intensifies, whereas in dry conditions characterized by dominant groundwater recharge processes, their relevance diminishes.  Leveraging land use data and earth observations, this approach clarifies the complex LULCC-ecosystem service relationships, informing strategies that balance ecosystem multifunctionality with environmental sustainability despite limitations in comparison to process based models.

How to cite: El Jeitany, J., Nussbaum, M., Pacetti, T., Schröder, B., and Caporali, E.: Relevance  of Landscape Metrics in Predicting Water-Related Ecosystem Services demonstrated on the Arno River Basin Italy, EGU General Assembly 2024, Vienna, Austria, 14–19 Apr 2024, EGU24-15309, https://doi.org/10.5194/egusphere-egu24-15309, 2024.

EGU24-16091 | ECS | PICO | HS5.2.4

An automated remote sensing approach for monitoring hydrological impacts of vegetation cover changes  

Paolo Tamagnone, Chloe Campo, and Guy Schumann

Landscapes are constantly changing under the pressure of human activities or climate instability. In particular, variations in vegetation cover have a significant impact on the hydrological cycle and the response of the landscape to hydrometeorological forcing. Greenery depletion caused by human activities, such as deforestation for agricultural purposes or uncontrolled urbanisation, or by climate, such as desertification, can lead to an unbalanced hydrological partitioning, exacerbating runoff production. In recent years, an increased awareness and concern about more frequent climate extremes has led scientists and decision-makers to seek solutions for restoring degraded ecosystems. Among these, targeted land use and land cover (LULC) changes, such as regreening initiatives aimed at increasing vegetation coverage and the associated ecosystem services (ES), have been shown to be effective for restoration purposes. Once planned and implemented, it is imperative to have tools to assess the effectiveness of such LULC changes and the associated impacts on the hydrological behaviour of the restored landscape.

The aim of this study is to present HydroSENS, an algorithm for the automated tracking of the spatio-temporal evolution of vegetation based on multispectral satellite imagery. Furthermore, the algorithm can be adopted for the monitoring of water-related ES concerning infiltration capacity and runoff management.  

HydroSENS allows the user to evaluate the composition of the satellite imagery, calculating the greenery fraction and properties through a spectral unmixing analysis, and retrieve hydrological parameters at the sub-pixel scale. Thus, these features make it a flexible tool for quantitatively understanding the impacts of LULC changes on hydrological processes and associated water-related ES.

The approach has been used to assess and monitor the effectiveness of a regreening project on a portion of land severely afflicted by land degradation as a result of unsustainable land management and climate changes in Tanzania. The project promoted the adoption of agroforestry practices by implementing rainwater harvesting techniques to improve localized water retention and increase the likelihood of survival of seasonal and perennial vegetation.

The site has been monitored for several years by analysing Sentinel-2 images acquired during both the wet and dry seasons. The monotonous positive trend of the Normalized Difference Vegetation Index (NDVI) and vegetation fraction over the period, in both the wet and dry seasons, indicates an increase in healthy vegetation.

The LULC alteration significantly influences the hydrological processes at the site scale, implying a high infiltration rate and an overall reduction in runoff. The benefits are twofold: first, better runoff management, reducing the consequences of flooding during heavy storms; second, larger water intake, decreasing water stress during dry spells. In addition, these regreening-induced effects improve the evapotranspiration capacity of the vegetation, maximising the crop yield as a favourable implication for the local populations.

How to cite: Tamagnone, P., Campo, C., and Schumann, G.: An automated remote sensing approach for monitoring hydrological impacts of vegetation cover changes , EGU General Assembly 2024, Vienna, Austria, 14–19 Apr 2024, EGU24-16091, https://doi.org/10.5194/egusphere-egu24-16091, 2024.

EGU24-16661 | ECS | PICO | HS5.2.4

Improving flood management assessing seasonal flood regulating ecosystem services  

Nikolas Galli, Marco Lompi, Maria Cristina Rulli, and Enrica Caporali

Changes in land use can influence flood hazard, as land cover is one of the main factors determining runoff during an extreme rain event. Flood-regulating ecosystem services (FRES) are generally evaluated to assess how much water the environment can hold in a storm event, providing a reduction of runoff and flood hazard in a given river basin. Agriculture areas can be seen as part of the ecosystem that provides flood regulation, as they decrease the runoff with respect to barren areas or urbanized surfaces.  Methodologies developed to evaluate FRES usually assess the reduction of runoff due to land use changes without considering differences in initial soil moisture conditions before the storm event depending on crop rotation or irrigation management during the year.

Here we provide a methodology to assess FRES on a seasonal basis, evaluating crops and irrigation management practices that may exacerbate flood hazards in small agricultural river basins. We do so by coupling two hydrological models. Watneeds, an agro-hydrological model which determines the water demand in agriculture, is used to derive daily soil moisture conditions. Mobidic, a fully distributed rainfall-runoff model, sets the soil moisture conditions of Watneeds as initial soil moisture before an extreme event to evaluate the associated flood hazard.

We test the methodology on the upper Ombrone Grossetano river basin (Tuscany, central Italy), as more than 60% of its land cover is represented by agricultural areas. Gridded dataset and ground measurements are used to inform and calibrate the models and to perform the analysis. Particularly, the Chirps dataset is bias corrected with ground observation and used to perform the hydrological balance in Watneeds. Rain gauge measurement provided by the Hydrological Regional Service are used in a frequency analysis of extreme rainfall to extract the rainfall quantiles to be modeled in Mobidic.

Results show that each crop provides different soil moisture conditions under identical meteorological conditions, impacting the flood hazard accordingly. Indeed, different agricultural scenarios and practices may produce different responses to similar events in different seasons with potential management applications. This underlines how FRES should be evaluated seasonally in agricultural river basins and how crop selection, irrigation scheduling and crop calendarization in small agricultural river basins could be subject to policies that also consider potential impacts on flood risk management.

This work is part of the FLORAES project, funded by the Premio Florisa Melone 2023, awarded by the Italian Hydrological Society to stimulate independent research and collaboration among young Italian Hydrologists.

How to cite: Galli, N., Lompi, M., Rulli, M. C., and Caporali, E.: Improving flood management assessing seasonal flood regulating ecosystem services , EGU General Assembly 2024, Vienna, Austria, 14–19 Apr 2024, EGU24-16661, https://doi.org/10.5194/egusphere-egu24-16661, 2024.

EGU24-16978 | ECS | PICO | HS5.2.4 | Highlight

Assessing the potential of land use adaptation measures with eco-hydrological modelling to increase drought resilience. 

Sven F. Grantz, Paul D. Wagner, Jens Kiesel, and Nicola Fohrer

Droughts jeopardize both ecosystem services and economic productivity within river basins - especially as their frequency and intensity are expected to increase as a result of climate change. One aim of climate adaptation measures is therefore to increase resilience through water retention in landscapes. In this contribution we aim at identifying suitable land use adaptation measures to increase drought resilience. To this end, the eco-hydrological model SWAT+ is used to analyze the hydrological response of different land use classes under drought conditions in the Lippe catchment in Germany. The model represents catchment specific land use information on crops and crop rotations, tree species and imperviousness of urban and industrial areas. Anthropogenic effects such as water exchange with the Western German transportation canal network and tile drainages are also modeled. The model is calibrated specifically with regard to representing low flow periods based on available discharge measurements from several gauges. The hydrologic response of different land use classes shows variations in evapotranspiration, soil moisture, ground water recharge as well as surface runoff and lateral flow during a drought period. This illustrates the potential of land use changes to improve drought resilience, by promoting land uses that increase water retention. Based on these findings, further research will be conducted to investigate the potential of combined land use measures to increase resilience on the catchment scale and under different climate and adaptation scenarios. In the future, the modeling approach will serve as a planning tool for river basin management of the Lippe and the potential to transfer these measures to other catchment areas will be determined in the KliMaWerk research project funded by the German Federal Ministry of Education and Research as part of the "Water Extreme Events" (WaX) research programme.

How to cite: Grantz, S. F., Wagner, P. D., Kiesel, J., and Fohrer, N.: Assessing the potential of land use adaptation measures with eco-hydrological modelling to increase drought resilience., EGU General Assembly 2024, Vienna, Austria, 14–19 Apr 2024, EGU24-16978, https://doi.org/10.5194/egusphere-egu24-16978, 2024.

EGU24-19717 | PICO | HS5.2.4

Joint Knowledge Production in the Water-Soil-Carbon-Nexus – stakeholders in ex-ante modelling on drought resilience 

Angelique Lansu, Borjana Bogatinoska, Frank van Lamoen, and Jetse Stoorvogel

Practitioners in water boards in NW-Europe are mostly focused on the prevention of flooding and inundation issues, due to their legal obligations and historical responsibilities. In order to spatially plan the necessary transitions, water board practitioners consult with their stakeholders (municipalities, land managers, farmers). Global and climate change are causing disruptions in the hydrological cycle. More and more of the tasks of water board practitioners are focused on drought mitigation, water distribution and water quality. This focus on water-related issues indicate that water boards are very strong in monitoring and managing hydrological data and hydrological models. Hence, in an optimally functioning soil-water system, carbon management is directly correlated to these hydrological tasks. Since water management requires soil carbon management (infiltration and water holding capacity), carbon sequestration can facilitate water management. So if we invest in carbon sequestration, it will also have a positive impact on water management. Therefore we need joint knowledge production among practitioners involved in water and in carbon management to understand the water-soil-carbon nexus. In recent years, water boards have been tasked with countering these effects of drought and flooding by implementing nature-based solution in their catchments – in co-design with spatial governance bodies, residents and land users . Often, these solutions have a clear spatial component and depend on their land users by changes in land use, in land management and in the soil-water system. For these land users, arguments other than hydrology may play a role in this process of co-design. In this study, we show the importance of interactions (using ex-ante modelling in a catchment) and how understanding these insights in a water-soil-carbon nexus scaffolds stakeholders in joint knowledge production. We investigated this research question based on the field expertise of about 40 water and land use professionals involved in the co-creation and implementation of NbS in headwater catchments in Brabant (Nl/B). We collected and evaluated arguments from these meetings in order to better facilitate water & carbon management in these spatially relevant transitions towards nature-based solutions.

How to cite: Lansu, A., Bogatinoska, B., van Lamoen, F., and Stoorvogel, J.: Joint Knowledge Production in the Water-Soil-Carbon-Nexus – stakeholders in ex-ante modelling on drought resilience, EGU General Assembly 2024, Vienna, Austria, 14–19 Apr 2024, EGU24-19717, https://doi.org/10.5194/egusphere-egu24-19717, 2024.

EGU24-19880 | ECS | PICO | HS5.2.4 | Highlight

Time to recognize the ecosystem service of vegetation-supplied precipitation in management and governance  

Lan Wang-Erlandsson, Patrick Keys, Arie Staal, Jolanda Theeuwen, Nico Wunderling, Stefan Dekker, Agnes Pranindita, Adriaan J. Teuling, Maganizo Kruger Nyasulu, Ingo Fetzer, Rafaela Flach, Michael J. Lathuillière, Simon Fahrländer, Fernando Jaramillo, Line Gordon, Chandrakant Singh, Ruud van der Ent, Jose Andres Posada, Michele-Lee Moore, and Mingzhu Cao

Globally, 60% of the evaporation from land returns as precipitation over land and a fifth of annual precipitation over land is directly dependent on the presence of vegetation-supplied moisture. In many regions, particularly in dry seasons, a majority of the precipitation relies on moisture from vegetation and is therefore vulnerable to changes in upwind land use that modify water moisture supply to the atmosphere. The benefits of precipitation for societies are invaluable, ranging from food production to carbon sequestration, and the role of ecosystems for supplying moisture for rainfall can be therefore be considered an important, albeit under-appreciated, ecosystem service.  

Our research shows that loss of moisture-supplying ecosystems, such as deforestation in the Amazon, can disrupt such moisture supplies, thereby reducing precipitation and negatively impacting crop yield, wetlands, and forest resilience in downwind regions. Conversely, some human activities, such as afforestation and irrigation, bring untapped subsoil water resources into the atmosphere and can help mitigate dry spells both locally and remotely. While they can have the potential to bring moisture-supplying benefits similar to moisture-supplying ecosystems, they also carry the risk of depleting local surface and groundwater resources and bringing about other adverse trade-offs. 

The past decade has seen rapid developments in moisture tracking models and data, which have brought to light previously ignored long-distance moisture flow relationships among different land areas, land users, and land-use decisions. These scientific advances mean that it is now possible to map out the ecosystem service of vegetation-supplied precipitation at a global scale in great detail, as well as to track their dependencies and interdependencies. 

We argue that the time is ripe for moisture-supplying ecosystems to be widely considered in land management and governance contexts. Nevertheless, a few important challenges remain. Particularly, future research needs to better constrain the uncertainties of moisture recycling relationships under climate change and atmospheric circulation change; to understand the effects of ecosystem adaptation, regime shifts, and social-ecological feedbacks; as well as to quantify the multiple benefits and trade-offs of the ecosystem service of vegetation-supplied precipitation. A better understanding of the relationships between moisture supply, drought mitigation, ecosystem resilience, and terrestrial carbon is especially relevant under the current UN Decade of Ecosystem Restoration as well as for achieving the Paris Agreement temperature target.

How to cite: Wang-Erlandsson, L., Keys, P., Staal, A., Theeuwen, J., Wunderling, N., Dekker, S., Pranindita, A., Teuling, A. J., Nyasulu, M. K., Fetzer, I., Flach, R., Lathuillière, M. J., Fahrländer, S., Jaramillo, F., Gordon, L., Singh, C., van der Ent, R., Posada, J. A., Moore, M.-L., and Cao, M.: Time to recognize the ecosystem service of vegetation-supplied precipitation in management and governance , EGU General Assembly 2024, Vienna, Austria, 14–19 Apr 2024, EGU24-19880, https://doi.org/10.5194/egusphere-egu24-19880, 2024.

EGU24-20916 | ECS | PICO | HS5.2.4

Long-term dynamics of crop water consumption in the irrigated lands of the Amu Darya basin  

Mayra Daniela Peña-Guerrero, Atabek Umirbekov, Larisa Tarasova, Philippe Rufin, Gabriel Senay, and Daniel Müller

The most water-stressed basins accommodate almost one third of the global irrigated agriculture. Future food production in these basins is threatened not only by excessive water consumption but also by climate change impacts that endanger irrigation water availability and increase water requirements of crops through increasing evapotranspiration (ET). Endorheic river basins in Central Asia are particularly susceptible to climate change. Large-scale irrigation projects during the Soviet period, mainly for water- intensive cotton cultivation, already contributed to the rapid desiccation and salinization of the Aral Sea, formerly the world’s fourth-largest inland water body. Changes in cropping practices after the collapse of the Soviet Union in 1991 included planning less water intensive winter wheat along with an increase in cropping frequency, however the impacts of these changes in land use and of climate change on water consumption remain unknown. Here, we estimated the spatial and temporal dynamics of crop ET and its driving factors across the Amu Darya basin, from 1987 to 2019 using hydrometeorological data, Landsat imagery, yearly maps of cropping practices, and ET estimations derived from the Operational Simplified Surface Energy Balance (SSEBop) model. The results show an overall increase of 20% in crop water consumption despite the decrease in water intensive cropping. Downstream countries Turkmenistan and Uzbekistan have the highest contribution to water consumption. Although changes in cropping practices contributed positively to water demand, annual ET increased in the last 30 years in accordance with the exacerbating temperature rise. Our study provides the first long-term and high-resolution analysis of crop water consumption in the Amu Darya Basin which can support water managers and policy makers towards improved water management decision and planning in a changing climate. 

How to cite: Peña-Guerrero, M. D., Umirbekov, A., Tarasova, L., Rufin, P., Senay, G., and Müller, D.: Long-term dynamics of crop water consumption in the irrigated lands of the Amu Darya basin , EGU General Assembly 2024, Vienna, Austria, 14–19 Apr 2024, EGU24-20916, https://doi.org/10.5194/egusphere-egu24-20916, 2024.

HS5.3 – Human-Water Systems, Infrastructure, and the City

EGU24-30 | ECS | Orals | HS5.3.1

Collaborative mutli-scale water resources planning in England and Wales 

Ali Leonard, Jaime Amezaga, Richard Blackwell, Elizabeth Lewis, and Chris Kilsby

Water regulators in England and Wales have called on water companies to meet higher standards of supply resilience in response to growing pressures from climate change, environmental needs and growth whilst still maintaining affordability. New national and regional governance structures have been established with the aim of enabling better collaboration across regulators, water companies (also known as public water supply (PWS) abstractors), other abstractors (non-PWS), and wider stakeholders to find and deliver the most efficient and robust water supply infrastructure schemes and demand initiatives.

This study uses qualitative data from interviews, workshops, observations, and planning documents. It identifies successes (e.g., increased ambition, improved consistency, collaboration, and nationally consistent water transfers) and failures (e.g., uncertainty, complexity, and lack of investment frameworks beyond PWS). To address gaps, a phased approach towards an explicit multi-scale governance framework is recommended, starting with national program management and trust-building across regulators, PWS, non-PWS, and stakeholders.

If new forums are set up to improve water resources planning there are difficult choices at each level regarding form, function and funding that require consideration of trade-offs, possible unintended consequences, and feasibility within the constraints of broader structures of decision-making and politics. A process of information gathering and engagement is necessary to bring on board relevant stakeholders. This engagement would provide insight on how best to implement the proposed collaborative multi-scale architecture, and would help clarify (1) the vision, (2) the approach, (3) appropriate metrics and performance indicators, (4) the compliance model, and (5) reporting requirements etc.

Decision-makers will always face gaps in understanding, new issues will continue to arise, and approaches and methods will continually evolve. Therefore, it is important to build adaptive structures of collaboration and scrutiny that can accommodate the changing and imperfect landscape. Transparency is at the core of this challenge, enabling feedback loops to (1) improve our understanding supported by evidence, and therefore (2) refine our objectives, and (3) the rules and governance required to achieve them.

As lessons are learnt through transparent, collaborative engagement with stakeholders across scales, the framework can be built upon to enable a more informed transition to adaptive, integrated water management at multiple scales.

How to cite: Leonard, A., Amezaga, J., Blackwell, R., Lewis, E., and Kilsby, C.: Collaborative mutli-scale water resources planning in England and Wales, EGU General Assembly 2024, Vienna, Austria, 14–19 Apr 2024, EGU24-30, https://doi.org/10.5194/egusphere-egu24-30, 2024.

EGU24-606 | ECS | Posters on site | HS5.3.1 | Highlight

When can we prioritise environmental flow release without affecting hydropower and water demand satisfaction? 

Akshay Sunil and Riddhi Singh

Large multi-purpose reservoirs are required to support socioeconomic development in many parts of the world. However, impoundment of streamflow also negatively impacts instream aquatic ecology. Simultaneously, there are often conflicts between different objectives of multi-purpose reservoirs, such as hydropower generation and water storage for sustaining demands using dry seasons. Thus, releasing environmental flows, while ideal, is often accorded secondary priority unless there are legislative norms in place to facilitate their release. Here, we quantify the compromises between environmental flow maintenance, hydropower generation, and water demand satisfaction across five major multi-purpose reservoirs in India. We investigate these compromises for two type of release priority orders, which are reflected in two versions of a multi-objective decision problem (a) one that prioritizes environmental flow releases over demand satisfaction (PF_MEF) and another that does not (PF_nMEF). Pareto approximate strategies for reservoir operation are identified for each formulation using the Borg multi-objective evolutionary algorithm considering multiple objectives related to annual demand deficits (minimize), hydropower production (maximize), reliability of maintaining environmental flows downstream (maximize), and reliability of non-exceedance of high flows downstream (maximize). In each case, radial basis functions (RBFs) are used to develop flexible release rules as a function of reservoir storage. The resultant Pareto approximate strategies are analyzed to understand when environmental flow prioritization over other releases is practical. In all five projects, hydropower generation exhibits trade-offs with both demand satisfaction and environmental flow reliability. However, the slope and the nature of tradeoffs are governed by other factors such as the storage inflow ratio and the demand-to-inflow ratio at annual time scales. We aim to provide a generalized guideline as to – when prioritizing environmental flow does not impact other objectives of the multi-purpose reservoir project.

How to cite: Sunil, A. and Singh, R.: When can we prioritise environmental flow release without affecting hydropower and water demand satisfaction?, EGU General Assembly 2024, Vienna, Austria, 14–19 Apr 2024, EGU24-606, https://doi.org/10.5194/egusphere-egu24-606, 2024.

EGU24-1816 | Orals | HS5.3.1

Do tragedies of the commons contribute to the premature depletion of transboundary aquifers? 

Marc F. Muller, Fenwei Hung, Kyle Davis, and Davide Chiarelli

Many of the 500+ internationally shared aquifers are rapidly depleting but poorly regulated with less than 10 international treaties focusing on shared groundwater. The common-pool nature of groundwater has long been identified as an important complicating factor.  Pumping by any user increases pumping costs for all users by decreasing groundwater levels throughout the aquifer. This creates a tragedy of the commons, where all users have incentives to over-pump, thus prematurely depleting the resource. While this mechanism is well documented in domestic aquifers, large geographic distances between demand centers and heterogeneous economic and hydrogeologic conditions on either side of the border affects  incentives to over-pump in transboundary aquifers.   Whether -- and where -- common-pool incentives might lead to the premature depletion of transboundary aquifers remain poorly understood. 

We fill these gaps by combining remote sensing and large scale hydrologic and agricultural modeling datasets in a global analysis of known transboundary aquifers. We first evaluate the proportion of global irrigation water demand that is sourced from transboundary aquifers, and the proportion of these withdrawals associated with unsustainable pumping. We then identify regions, where unsustainable irrigation arises close enough to a political border to affect transboundary groundwater levels and pumping costs. Finally, we leverage recent theoretical results to identify the subset of these regions where heterogeneous economic conditions on either side of the border creates substantial incentives to over-pump. Results provide key insights on the role played by common-pool overdraft incentives on the premature depletion of transboundary aquifers and identify hotspots where international groundwater regulation is most urgently needed. 

How to cite: Muller, M. F., Hung, F., Davis, K., and Chiarelli, D.: Do tragedies of the commons contribute to the premature depletion of transboundary aquifers?, EGU General Assembly 2024, Vienna, Austria, 14–19 Apr 2024, EGU24-1816, https://doi.org/10.5194/egusphere-egu24-1816, 2024.

EGU24-2433 | Orals | HS5.3.1 | Highlight

Merging social learning and behavior modelling to reinforce farmers adaptation to climate change 

Sandra Ricart, Paolo Gazzotti, Claudio Gandolfi, and Andrea Castelletti

Agriculture is one of the most sensitive and vulnerable activities to climate variations, motivating farmers’ actions to face climate change-induced stressors and shocks. Traditional management approaches based on linear growth optimization strategies, overseen by command-and-control policies, have proven inadequate for effective water management and climate change adaptation because they partially failed to account for the inherent unpredictability and irreducible uncertain risk conditions. Furthermore, this approach overlooks the necessity of addressing changes in human behavior, knowledge sharing, and motivations as part of climate change adaptation pathways. Conversely, accurate bottom-up approaches focusing on social learning input, enhance system transformation by building collaborative problem solving. Surveys and interviews, both forms of associative processing, have proven effective in delving into knowledge-based information and tracking the impact of personal experiences on water management and climate change action. Additionally, Agent-Based Models (ABM) have been utilized to enhance the interplay between social and physical surroundings, depicting individuals’ and stakeholders’ narratives, and charting the hydrosocial landscape.

Assuming water has different physical, social, political, and symbolic value(s) for individuals and communities, it is crucial to strengthen the involvement of stakeholders in order to gain a deeper understanding of their preferences, potential solutions and persistent constraints that are conditioning decision-making processes in coupled human-nature systems. This underscores the need for holistic and systemic approaches that can integrate the domains of water and climate in specific arrangements, fostering direct engagement among users, stakeholders, and decision-makers through social learning. In this context, the insights and observations of farmers and irrigation districts managers are highly valuable in gauging climate change awareness, perceived impacts, and adaptive capacity. Their understanding is imperative to provide informed decisions to policy-makers, and the first step to minimizing misconceptions or maladaptation practices that could affect the water management and governance processes.

This work presents a transdisciplinary approach that combines farmers’ clustering with behavior and agrohydrological modelling to support water management and address climate change risks. We consider a case study in northern Italy 1) to identify farmers’ and managers’ perspectives regarding climate change, 2) to anticipate farmers’ decisions by testing different rationality and risk preferences in an ABM, and 3) to assess how farmers’ and managers’ feedback loops can be incorporated into regional adaptation strategies. Results indicate that farmers and managers are aware of climate change, perceive climate variability and impacts, and combine preventive and reactive measures to reduce climate vulnerability. After first running simulations, the ABM effectively represents the heterogeneity of farmers, creating a more diverse representation of their behavior, while identifying how risk aversion influences how farmers adopt cropping patterns and irrigation methods. A better understanding of the farmers’ behavior in terms of risk assessment and adaptability can facilitate the transferability of bottom-up findings and the customization of targeted and flexible adaptation instruments to avoid maladaptation or inefficient transformation when facing water management and climate change in coupled human-nature systems.

How to cite: Ricart, S., Gazzotti, P., Gandolfi, C., and Castelletti, A.: Merging social learning and behavior modelling to reinforce farmers adaptation to climate change, EGU General Assembly 2024, Vienna, Austria, 14–19 Apr 2024, EGU24-2433, https://doi.org/10.5194/egusphere-egu24-2433, 2024.

EGU24-3886 | Orals | HS5.3.1

Satellite-based monitoring of irrigated cropland dynamics in data-sparse environments 

Timothy Foster, Thomas Higginbottom, Roshan Adhikari, and Sarah Redicker

Water scarcity is a major constraint to agricultural productivity, food security, and economic development, in particular in low- and middle-income countries in regions such as Sub-Saharan Africa (SSA). However, our ability to effectively design, target, and implement interventions to reduce agricultural water insecurity is limited by a lack of data on the locations, dynamics, and outcomes of irrigated croplands in these regions. In this talk, we demonstrate how satellite remote sensing can be combined with machine learning methods to develop continuous fine-resolution maps of irrigated cropland areas in data-sparse environments distributed across SSA. Our results demonstrate that past large-scale irrigation projects initiated by governments and donors in SSA have failed to deliver on promises of agricultural expansion and intensification. In contrast, our mapping shows a more rapid recent growth in small-scale informal irrigation in SSA, typically initiated by farmers themselves and outside of official irrigation infrastructure and monitoring systems. We contextualise the economic, political, and social drivers of these historic irrigated cropland dynamics in SSA, while also discussing some of the opportunities and challenges that exist for mainstreaming use of satellite-based monitoring in future water management and policy in SSA.

How to cite: Foster, T., Higginbottom, T., Adhikari, R., and Redicker, S.: Satellite-based monitoring of irrigated cropland dynamics in data-sparse environments, EGU General Assembly 2024, Vienna, Austria, 14–19 Apr 2024, EGU24-3886, https://doi.org/10.5194/egusphere-egu24-3886, 2024.

EGU24-4764 | ECS | Posters on site | HS5.3.1

Multi-model and multi-system ensemble assessment to inform adaptation to climate change in agriculture 

Mónica Serrano-García, Francesco Sapino, Megi Xhepo, Laura Gil-García, Carlos Gutiérrez-Martín, Pablo Saiz-Santiago, and C. Dionisio Pérez-Blanco

In the Anthropocene, the geological epoch when human activity has started to have a significant impact on the planet's climate and ecosystems, the understanding, forecasting, and treatment of key emerging phenomena is not possible without explicitly including human behavior and responses in models. As additional human and ecological systems are connected, uncertainties across systems cascade and amplify, challenging our forecasting capacities. All the above calls for major renovations of current modeling approaches to better integrate human agency into ensemble experiments, so as to achieve a more accurate characterization of uncertainties and improved assessment of the effectiveness of adaptation and mitigation strategies (UNDRR, 2021).

This research proposes a methodology to expand the modular hierarchy of ecological systems adopted in conventional ensemble experiments with socioeconomic systems that represent key aspects of human agency and behavior. The proposed hierarchical framework mimics the structure of conventional ensembles, only in this case a human module is incorporated to account for non-linearities in human agency and their impacts on key socioeconomic variables such as income and employment, and how they affect ecological system dynamics. We illustrate our framework with an application to water resources management in an agricultural river basin in central Spain, the Douro River Basin.

The hierarchy uses data of the Global Gridded Crop Models (GGCMs), Global Hydrological Models (GHMs), and Global Circulation Models (GCMs) provided in the framework of the Inter-Sectoral Impact Model Intercomparison Project Protocol 2b (ISIMIP, 2022) to force an ensemble of microeconomic mathematical programming models capable of representing irrigators behavior and adaptive responses. This is done in different stages. In a first step, the ensemble of GHMs and GCMs provides information about water discharge. This information, fed into AQUATOOL, a decision-making system used in the study area, allows us to determine the amount of water available for irrigated agriculture. Furthermore, the ensemble of GGCMs and GCMs inform us about changes in crop production due to climate variations. All these data are then used to drive microeconomic models, which simulate the adaptive responses of irrigators. Through these simulations, we obtain valuable information on profit, employment, and the distribution of crops.

The resultant hierarchy of ensembles can be used to explore the consequences of multiple strategies under alternative scenarios and models, while accounting for cascading impacts across ecological and human systems. The result is a large database of simulations in which each simulation represents the socioeconomic and environmental consequences of climate change under one specific scenario and combination of ecological and socioeconomic models—thus thoroughly assessing the fundamental sources of uncertainty and providing comprehensive data to inform the adoption of robust strategies that achieve a satisfactory performance under most plausible futures.

How to cite: Serrano-García, M., Sapino, F., Xhepo, M., Gil-García, L., Gutiérrez-Martín, C., Saiz-Santiago, P., and Pérez-Blanco, C. D.: Multi-model and multi-system ensemble assessment to inform adaptation to climate change in agriculture, EGU General Assembly 2024, Vienna, Austria, 14–19 Apr 2024, EGU24-4764, https://doi.org/10.5194/egusphere-egu24-4764, 2024.

EGU24-5463 | ECS | Posters on site | HS5.3.1

Bound by the river – modelling the impact of water availability on human-wildlife coexistence. 

Indushree Banerjee and Maurits Ertsen

Throughout this century, an unprecedented decline in biodiversity loss has been witnessed worldwide. Animal habitats have been increasingly encroached upon, transforming into urban landscapes and imperilling numerous wildlife. Therefore, preserving natural habitats is essential for maintaining critical feeding, breeding, and nesting grounds to curb species extinction. This has resulted in allocating land for environmental protection, such as buffer zones and national parks designated as protected areas. However, as climate change becomes a constant factor leading to changes in rainfall patterns, water sources that feed into protected areas and buffer zones are declining. Rivers that once fed into forest ecosystems are now the primary source of hydropower and irrigation projects. This shift raises concerns about the repercussions of water scarcity in natural habitats and the impact on the coexistence of humans and wildlife.

To investigate the impact of water scarcity on natural habitats and human-wildlife coexistence, we utilize an agent-based model to investigate the interplay between water availability and coexistence within a buffer zone. Our study draws from empirical data gathered at Bardia National Park (BNP) and its buffer zone in Nepal. Covering an area of 968 sq km, the National Park houses 125 tigers and is complemented by a 507 sq km buffer zone. The buffer zone is distributed into 19 districts with a human population 116,000 living alongside the national park. A large portion of this population consists of farmers. The Karnali and Babai River, a pivotal water source for wildlife and surrounding communities, is a natural boundary between animals and local populations.

The agent-based model illustrates the intricate temporal and spatial interactions between agents—tigers, rivers, and communities—mapping their migration patterns in response to fluctuating water levels resulting from altered rainfall patterns. This model is instrumental in:

  • including a diversity of agents with specific characteristics and attributes,
  • estimating long-term consequences of local interactions and behaviours,
  • establishing emergent properties (such as territories and conflict) that arise from water scarcity and
  • co-creating integrated water management approaches for increasing water availability for communities and animals. 

Over the past decade, both rivers have experienced a decline in water discharge, resulting in a dried riverbed dissolving the natural barrier between humans and wildlife.  Declining rainfall has led to dwindling water sources for irrigation, forcing farmers to look for alternative sources of sustenance. People venture into forests for fodder and natural reeds; meanwhile, lack of water forces wildlife into communities for prey and water. Prey march into grazing fields inside communities, and tigers follow their prey. As the water availability changes, the tigers shift their territories, often venturing into farms.

Increasing overlapping of territories over a shared space and resource increases human-wildlife conflicts. The river acts not merely as a boundary but as a vital resource that maintains a spatial equilibrium, keeping these two species in their spaces bound and preventing conflict. 

Our research addresses the following question: How to analyze the impact of water availability on human-wildlife coexistence effectively? 

How to cite: Banerjee, I. and Ertsen, M.: Bound by the river – modelling the impact of water availability on human-wildlife coexistence., EGU General Assembly 2024, Vienna, Austria, 14–19 Apr 2024, EGU24-5463, https://doi.org/10.5194/egusphere-egu24-5463, 2024.

EGU24-5635 | ECS | Orals | HS5.3.1

Empowering Human-Water System Analysis through ABSESpy: An Agent-Based Modeling Framework of SES 

Shuang Song, Shuai Wang, Chentai Jiao, and Elías José Mantilla

ABSESpy emerges as an agent-based modeling (ABM) framework for socio-ecological systems (SES) research. By adeptly addressing pivotal needs in SES studies, such as decision-making complexity and data integration, ABSESpy sets a new tool for integrating human and natural subsystems, ensuring replicability and effective model coupling. Here, we demonstrate ABSESpy’s prowess in human-water systems analysis through two real-world application cases. The first delves into the impact of water management policy changes over the past fifty years on river basin water usage. This case underscores ABSESpy's proficiency in modeling policy effects and capturing human responses within water management. The second case takes a deep dive into the millennia-long evolution of human livelihood patterns, influenced by dynamic shifts in the water environment. This exploration showcases ABSESpy's capability to simulate extensive, temporal, socio-hydrological phenomena, providing profound insights into enduring human-water interplays. Our belief is firm: socio-hydrological systems, as quintessential SESs, can be effectively studied through data-driven agent-based modeling. ABSESpy is a testament to this approach, enhancing efficiency and depth in SES research.


How to cite: Song, S., Wang, S., Jiao, C., and José Mantilla, E.: Empowering Human-Water System Analysis through ABSESpy: An Agent-Based Modeling Framework of SES, EGU General Assembly 2024, Vienna, Austria, 14–19 Apr 2024, EGU24-5635, https://doi.org/10.5194/egusphere-egu24-5635, 2024.

EGU24-6257 | ECS | Orals | HS5.3.1

Revolutionizing water risk management in industry: A comprehensive framework for strategic basin prioritization 

Chinchu Mohan, Agustin Begue, Jeronimo Misa, Hemant Servia, and Matias Comercio

Globally, industries act as one of the key consumers of water, driving a critical need for responsible and sustainable water usage practices to address the escalating water demands. Despite the industry’s significant impact on water availability, a notable void exists in the accessibility of precise, reliable, and readily available hydrological data essential for understanding water-related risks and formulating effective mitigation strategies. In addressing the challenge of water risk identification and management within the industrial sector, Waterplan, a Y-Combinator startup and science-driven B2B SaaS company, has developed a user-friendly and value-driven water risk framework. This comprehensive water risk framework assesses three distinct water risks: scarcity, flooding, and water quality. Each category of risk is evaluated using a set of hydrologically relevant basin-level indicators. The framework incorporates a total of 17 indicators (including 5 dynamic ones), derived from ground-based and remotely sensed observations or advanced state-of-the-art hydrological models. Using this framework, Waterplan ranked over 53,000 basins across the globe for various water risks, aiding basin assessment and strategic decision-making for industrial clients. The ranking of basins involves an evaluation of historical average hydrologic characteristics from 1988 to 2017 (called baseline), coupled with an analysis of the historical (1988 to 2023) and recent (2018 to 2023) trends (called direction) in these attributes. Both components are established through the application of globally comparable thresholds. Moreover, the scores for each risk type (scarcity, flood, and water quality) were computed using a default equal-weight ensemble method, with the added flexibility to customize the weights of indicators according to the specific client requirements. The framework finds applications in strategic basin/facility prioritization, resource allocation, raw material sourcing decisions, and evidence-based budgeting. Notably, the framework demonstrated strong agreement with locally collected data, showcasing its reliability. While designed for industrial clients, the framework's versatility suggests potential value for water managers and policymakers seeking insights into basin hydrological conditions. This holistic risk framework, integrating advanced technology, scientific rigor, and user-friendly design, can revolutionize how we understand, assess, and manage industrial water risks on a global scale.

How to cite: Mohan, C., Begue, A., Misa, J., Servia, H., and Comercio, M.: Revolutionizing water risk management in industry: A comprehensive framework for strategic basin prioritization, EGU General Assembly 2024, Vienna, Austria, 14–19 Apr 2024, EGU24-6257, https://doi.org/10.5194/egusphere-egu24-6257, 2024.

As the longest river in Asia, the Yangtze River has shown its impact on human societies with floods recorded since 12th century. In 1931, the Yangtze River has manifested its force again with one of the deadliest floods ever recorded in Chinese history, causing 422,499 deaths, damages to more than 25.2 million people and 58.7 billion m2 farmland. Similar flood occurred again in 1954, resulting in 31,762 deaths, damages to 18.9 million people and 31.7 billion m2 farmland. Researches have shown that 1954 flood being larger and higher compared to 1931 flood. However, it is still unclear for what reason that a more severe flood leading to less damage. Here we assumed such discrepancy could be ascribed to drastic society transformation in 1930s and 1950s (e.g., increase of absentee landlords in 1930s, and the land reform movement in 1950s). To further understand its effect on flood responses among farmers, an agent-based model named Farmer Landlord Inundation Production (FLIP) was developed. The model was constructed by simulating each farmer’s movement decision during floods based on different hydrological and economic circumstances. Then it was applied to the simulation of multiple villages in Hubei Province (along the mid-reach of Yangtze River) on the basis of reconstructed daily inundation from July to September, 1931 and 1954. Our results have shown that the farmers’ mitigation decision was highly sensitive to the relief amount and distribution timing, indicating a possible decrease of refugees from 70% to 15% between 1931 and 1954. Overall, we demonstrate how society transformation are likely to affect the damage of and response to floods in a different (sometimes more important) way from traditional countermeasures in modern Chinese history. We anticipate our research to be a starting point towards deeper understanding of human and hazard, and the knowledge of which is likely to be applicable to many other regions and times.

How to cite: Liu, C., Kawasaki, A., and Shiroyama, T.: Exploring the effect of abrupt society transformation on flood responses among farmers in China using an agent-based model, EGU General Assembly 2024, Vienna, Austria, 14–19 Apr 2024, EGU24-6870, https://doi.org/10.5194/egusphere-egu24-6870, 2024.

Freshwater change is a crucial component of the planetary boundary. It has exceeded the safe operating space due to intensified human activities, highlighting the urgency of rationalizing the use and effective management of water resource. The moisture recycling is the process by which water enters the atmosphere through evaporation and transpiration, travels with prevailing winds, and eventually falls as precipitation. It’s pivotal for transboundary water resource management, ecological protection and climate change adaptation. To analyze the spatial pattern of freshwater provisioning service flows through moisture recycling in each Chinese province, we used a moisture trajectory dataset from the UTrack model. The analysis reveals that the overall moisture flow within China is oriented towards the northeast, at an angle of 27 degrees north of east. Moisture in the northwestern, southwestern, and southern provinces flows eastward to generate precipitation, influenced by the westerlies. While in the eastern provinces, most of the moisture moves northwestward due to the influence of the southeast monsoon. Combining the socio-economic statistic data, we assessed freshwater provisioning service value of moisture in each province. Results indicate that Xizang has the most precipitation and surface water generated by moisture (200 km3), followed by Sichuan (122 km3) and Yunnan (95 km3). Regarding economic production, the impact of moisture on Gross Domestic Product (GDP) is most significant in Sichuan (2312 billion RMB), Hubei (1976 billion RMB), and Henan (1669 billion RMB). Western regions of China have made significant contributions to the surface water resources and economic development of the eastern regions through moisture recycling. The difference of the moisture contributions in each province highlights the intricate dynamics of moisture flow and its significant role in regional resource allocation and sustainable development. The results can provide innovative insights and practical references to guide water resource management endeavors, especially in transboundary water management, thereby contributing to mitigating freshwater change risks.

How to cite: sang, S. and Li, Y.: The interprovincial moisture recycling in China and its tele-connected effects on socio-economy, EGU General Assembly 2024, Vienna, Austria, 14–19 Apr 2024, EGU24-7201, https://doi.org/10.5194/egusphere-egu24-7201, 2024.

EGU24-7777 | ECS | Orals | HS5.3.1

Remote Sensing-based Agricultural Water Accounting Projections for irrigated maize under different climate change scenarios in 5 European locations 

Jesús Garrido-Rubio, José González-Piqueras, Anna Osann, Marina Antoniadou, Christina Papadaskalopoulou, and Dimitris Tassopoulos

The latest update on planetary boundaries states both the blue and green freshwater change are beyond the safe operating space for the first time since the initial findings in 2009. Moreover, agricultural water use, which nowadays accounts for about two-thirds of global freshwater resources, is projected to increase by 2080. Under this scenario, river basin management plans include short-term crop water requirements projections. The presented abstract therefore proposes a remote sensing-based approach combined with climate change scenarios to provide short-, medium- and long-term green and blue crop water use (CWU) projections at 5 different European locations for irrigated maize.

The methodological framework for the Remote Sensing-based Agricultural Water Accounting  Projections (RS-AWA) here presented is based on: a) using current and locally adapted crop behaviour monitored through remote sensing Sentinel 2 satellite images time series to derive NDVI crop pattern profile; b) using daily future climate projections (temperature and precipitation) based on an ensemble of 4 different Regional Climate Models that are driven by 3 different Global Climate Models, under the Representative Concentration Pathways (RCP) 4.5 and RCP 8.5; c) combining actual crop behaviour and daily climate projections in a Remote Sensing-based Soil Water Balance based on FAO56 to obtain both the green and blue CWU along short-, medium- and long-term periods; and d) obtaining changes in CWU regarding the baseline period. It was applied for irrigated maize within the Júcar River Basin (Spain), the Isonzo River Basin (Italy), the Soča River Basin (Slovenia), the Pinios River Basin (Greece) and the Dolj municipality (Lower Danube River Basin, Romania).

The 5 locations' results showed a common decline in the green CWU and a rise in the blue CWU, indicating lower CWU from precipitation events with the consequent increase in blue CWU from groundwater or superficial reservoirs, hence more irrigation requirements. By location, Pinios and Júcar present the lower increasements in irrigation requirements ranging from 6 to 10 % (RCP 4.5) and 10 to 17 % (RCP 8.5), followed by the Dolj location that ranges from 15 to 20 % (RCP 4.5) and 10 to 17 % (RCP 8.5), then the Isonzo location where ranges from 26 % (RCP 4.5) and 14 to 59 % (RCP 8.5), and finally the highest increasements corresponds to the Soča location that ranges from 45 to 73 % (RCP 4.5) and 50 to 147 % (RCP 8.5).

The presented results incorporate to the climate change family results and indicators, a locally adapted crop pattern derived from actual NDVI time series that will support better knowledge to water managers, as it could be adapted to the crops that are most interested in their managing areas, as we did in the project that support these research, the EU Horizon 2020 project REXUS (Managing Resilient Nexus Systems Through Participatory Systems Dynamics Modelling), in which stakeholders from water user associations to river basin water managers are evaluating the information. Finally, the authors acknowledge the contribution of land use map providers for irrigated maize in each of the locations considered.

How to cite: Garrido-Rubio, J., González-Piqueras, J., Osann, A., Antoniadou, M., Papadaskalopoulou, C., and Tassopoulos, D.: Remote Sensing-based Agricultural Water Accounting Projections for irrigated maize under different climate change scenarios in 5 European locations, EGU General Assembly 2024, Vienna, Austria, 14–19 Apr 2024, EGU24-7777, https://doi.org/10.5194/egusphere-egu24-7777, 2024.

EGU24-8398 | Orals | HS5.3.1

Mapping the water-economic cascading risks within a multilayer network of supply chains 

Jinling Li, Kehan Wu, Miaomiao Liu, Jianxun Yang, Yuli Shan, and Jun Bi

      Trade linkages within the supply chain can be mapped onto a complex network. Disruptions in regional resource supplies (i.e., water scarcity) have the potential to generate industrial losses in remote areas due to the interconnected flow of goods and services. While numerous studies have assessed the economic and virtual water supply networks, they assumed rapid and linear transmission of industrial risks in the network, without modeling the transmission process and vulnerability between nodes. Such oversights can lead to the misestimation of risks, especially in the context of climate change. Therefore, it is urgent to construct a cascading model for the supply economic and water supply network that consider step-by-step avalanche in nodes, to help identify vulnerable sectors and mitigate economic risks.

      In this research, we utilize the 2017 multi-region environmental multiregional input-output (E-MRIO) table in China to construct a comprehensive multilayer network. Each province is represented as a distinct layer within this network, incorporating 42 economic sectors(nodes). These layers and nodes are interconnected through trade linkages. To simulate the cascade process, we introduce the concept of net fragility for a node, calculated as the difference between the ratio of the sum of net inflows and net outflows of a node to its own total output and the threshold. Once a node fails (i.e., net fragility less than 1) the cascade process is triggered, then we quantify the total number of collapsed adjacent nodes, i.e., avalanche size. The bigger avalanche size refers to the province-sector higher vulnerability to economic shocks. Furthermore, we use the risk probability of province-sectors suffering from water scarcity as external shocks to describe the supply network response process under different water quantity and quality constraints. By comparing with the economic impact results, we can further identify vulnerable nodes affected by the dual restraints of water scarcity and economic shocks.

How to cite: Li, J., Wu, K., Liu, M., Yang, J., Shan, Y., and Bi, J.: Mapping the water-economic cascading risks within a multilayer network of supply chains, EGU General Assembly 2024, Vienna, Austria, 14–19 Apr 2024, EGU24-8398, https://doi.org/10.5194/egusphere-egu24-8398, 2024.

EGU24-8858 | Posters on site | HS5.3.1

Participatory development of mobile agricultural advisory driven by behavioral determinants of adoption 

Soham Adla, Ashray Tyagi, Aiswarya Aravindakshan, Ramesh Guntha, Mario Alberto Ponce Pacheco, Anukool Nagi, Prashant Pastore, and Saket Pande

Mobile applications have the potential to revolutionize agricultural advisories, providing farmers with real-time information and insights for improved decision-making. Agricultural advisories are aimed at improved adoption of best management practices, which include water management techniques. Hence, adoption of mobile applications, and consequently advisories and water management practices have implications on the human-water dynamics in agriculture. 

However, the adoption of such apps is influenced by various behavioral factors, necessitating a participatory approach of development with the stakeholders. This study describes the steps taken towards co-designing a mobile agricultural advisory app through iterative feedback and training sessions with farmers. The objectives of this study include the determination of factors influencing mobile advisory adoption via a farmer survey, and using this knowledge as a basis for iteratively developing the app over a period of around one year, via multiple in-person and remote feedback sessions with technologically progressive farmer stakeholders. The co-developed mobile application is called Makara (https://solidaridad.makarainit.com/), which was initially promoted as a predictive model based application that integrates climate and price movements and allows farmers to reduce their financial risk to ensure sustainable livelihoods. 

The Theory of Change approach of Contzen et al. (2023), a successor of the Risk-Attitude-Norms-Abilities-Self-Regulation (RANAS) model (Mosler, 2012) was used to develop a digital survey to determine major socio-economic and behavioral factors driving and hindering agricultural mobile advisory adoption. Linear regression models based on data collected from 1200 farmers conducted in Maharashtra (India) during April-May 2023 were used to determine these significant factors. Using this as a basis, multiple in-person and online feedback sessions were undertaken with farmers from the same region (from March 2023 to January 2024), iteratively working on developing different features of the Makara app.

The surveys on behavioral determinants emphasized the influence of norms, trust, abilities, and attitudes in app. adoption. The app's development process was enriched by participatory design, integrating features such as multi-lingual support, intercropping and multi-cropping options, and multi-component budgeting. Frontend features were also transformed to enhance user-friendliness and incorporate redundancy (e.g., text and audio-visual communication) in communicating the application outputs. Overall, the app is now promoted as a farmer's assistant for on-farm accounting and for suggesting best practice recommendations rather than a tool to explicitly estimate the risk to their yields, incomes and profits, which are now more ancillary features.

The conclusion underscores the success of the participatory development approach, incorporating farmer feedback into the app's design. The study contributes to the evolving landscape of agricultural technology by demonstrating the complementarity of behavioral approaches to technology adoption and participatory development of mobile agricultural advisories.

How to cite: Adla, S., Tyagi, A., Aravindakshan, A., Guntha, R., Ponce Pacheco, M. A., Nagi, A., Pastore, P., and Pande, S.: Participatory development of mobile agricultural advisory driven by behavioral determinants of adoption, EGU General Assembly 2024, Vienna, Austria, 14–19 Apr 2024, EGU24-8858, https://doi.org/10.5194/egusphere-egu24-8858, 2024.

EGU24-11969 | Orals | HS5.3.1

Participatory approaches for fostering non-conventional waters in agriculture: insights from 4 Living Labs in the Mediterranean region 

Elena Bresci, Eleonora Forzini, Lorenzo Villani, Luigi Piemontese, Mohamed Bahnassy, Basma Hassan, Rasha Badr, Osama Rady, Sami Z. Mohamed, Fatma Karaouli, Fethi Abdelli, Omar Rahal, Layachi Gouaidia, Luis Garrote, Alvaro Sordo-Ward, Paola Bianucci, Enrica Caporali, Gabriele Bertoli, Tommaso Pacetti, and Giulio Castelli

The Mediterranean region is increasingly suffering from water scarcity in summer as a consequence of climate change. Drier conditions call for increased use of irrigation to avoid severe production losses, increasing the pressure on overexploited surface and subsurface water resources. The use of non-conventional waters (NCW) - such as desalination, water reuse and water harvesting - can provide a sustainable alternative to face future climate change conditions. However, the adoption of NCW has several barriers and challenges related to environmental, technical, socio-economic and policy issues. These barriers need to be holistically addressed for effective delivery of NCW solutions. We present the implementation of Living Labs (LL) as tools for testing technical solutions in field conditions, with the involvement of stakeholders in a participatory co-production approach. The four LLs span from Italy, Spain, Egypt and include a transboundary LL between Algeria and Tunisia. Workshops were carried out according to the principles of Responsible Research and Innovation, with  stakeholders’ involvement through a series of methodologies such as World Cafè and SWOT analyses.

The main insights from the workshop concerned inefficient regulations in water-related infrastructures, insufficient funding availability for farmers, groundwater overexploitation, poor water quality and water scarcity as the main challenges. Actions which could contribute to tackle these problems could be farmer education and training, the introduction of drought and salt-tolerant plant cultivars, soil and water conservation practices, community-managed irrigation instead of individual one and better coordination among water management institutions.

Our study provides a unique example of application of the LL approach in rural contexts across the Mediterranean. The same procedure can be applied in any similar contexts to involve stakeholders in water management and allocation and to help them familiarize with the use of NCW. 

This research was carried out within the AG-WaMED project, funded by the Partnership for Research and Innovation in the Mediterranean Area Programme (PRIMA), an Art.185 initiative supported and funded under Horizon 2020, the European Union’s Framework Programme for Research and Innovation, Grant Agreement Number No. [Italy: 391 del 20/10/2022, Egypt: ٍSTDF #45878, Tunisia: 0005874-004-18-2022-3, Greece: ΓΓP21-0474657, Spain: PCI2022-132929, Algeria N° 04/PRIMA_section 2/2021].

The content of this abstract reflects the views of the authors, and the Commission cannot be held responsible for any use that may be made of the information contained therein.

How to cite: Bresci, E., Forzini, E., Villani, L., Piemontese, L., Bahnassy, M., Hassan, B., Badr, R., Rady, O., Mohamed, S. Z., Karaouli, F., Abdelli, F., Rahal, O., Gouaidia, L., Garrote, L., Sordo-Ward, A., Bianucci, P., Caporali, E., Bertoli, G., Pacetti, T., and Castelli, G.: Participatory approaches for fostering non-conventional waters in agriculture: insights from 4 Living Labs in the Mediterranean region, EGU General Assembly 2024, Vienna, Austria, 14–19 Apr 2024, EGU24-11969, https://doi.org/10.5194/egusphere-egu24-11969, 2024.

EGU24-12437 | ECS | Orals | HS5.3.1 | Highlight

Interactive decision-support for participatory water planning under multiple sources of uncertainty 

Marta Zaniolo, Sarah Fletcher, and Meagan Mauter

Urban water resources planning is complicated by unprecedented uncertainty in supply and demand. Real-world planning often simplifies the full range of uncertainty faced by a system into a limited set of deterministic scenarios to enhance accessibility for decision-makers and the public. However, overlooking uncertainty can expose the system to failures. The academic literature has developed tools, such as scenario analysis, to test water systems across various uncertain futures, assessing their responses to diverse drivers. Applying scenario analysis to the full set of uncertain drivers can identify system vulnerabilities, but current approaches to visualizing this information are difficult to communicate and therefore have limited practical applications. There is a lack of water planning frameworks that effectively integrate a rigorous treatment of uncertainty with accessible, user-friendly visual and interactive tools to enhance understanding and implementation for users.

In this work, we develop an example of such framework for the case study of the city of Santa Barbara, CA. Santa Barbara faces multiple uncertainties in their water supply portfolio and demand, from pending state and federal regulations, to changing hydrology and water demand. The city seeks to increase their water portfolio robustness by expanding its seawater desalination plant, but must determine the expansion capacity. We introduced computational tools that enable a comprehensive assessment of uncertainty across nine uncertain drivers, identified with the help of water planners in Santa Barbara. To allow public participation in the desalination expansion decision, we develop interactive visual analytics to aid decision-makers and stakeholders in navigating complex scenario analysis outcomes. Our results quantify the tradeoffs between increased capacity and system robustness. We also categorize uncertain drivers according to their criticality and the level of control that the municipality can exert over them, for instance the city's water demand can be partially controlled through water efficiency campaigns. This work aims to enhance participation and uncertainty characterization of urban water planning efforts.

How to cite: Zaniolo, M., Fletcher, S., and Mauter, M.: Interactive decision-support for participatory water planning under multiple sources of uncertainty, EGU General Assembly 2024, Vienna, Austria, 14–19 Apr 2024, EGU24-12437, https://doi.org/10.5194/egusphere-egu24-12437, 2024.

EGU24-13450 | ECS | Orals | HS5.3.1 | Highlight

Analysing Trade-offs and Synergies in Land Use for Flood Resilience and Compactness 

Fuko Nakai, Seiya Kito, and Kazuaki Okubo

As cities globally face climate change risks, they are increasingly adopting innovative climate adaptation policies, including 'Nature-based Solutions (NBS)' and advanced planning and social policies. However, the implementation of these strategies by local governments remains limited. Integrating these strategies into urban governance requires interdisciplinary collaboration and inclusive interventions to overcome existing governance inertia (Hölscher et al., 2023). Effective policymaking must align these innovative strategies with new narratives considering wider urban development goals, fostering synergies and co-benefits (Keith et al., 2023). Multi-objective optimisation models play a key role here, involving stakeholders in generating and evaluating alternative land use proposals within spatial decision-making processes. These models focus on balancing competing objectives, using Pareto-optimal solutions to find practical compromises in urban development.

Our focus is on exploring (1) flood-resilient land use and (2) the compatibility of land uses between prioritising flood resilience and compactness, through scenario-based analysis using land use spatial optimisation (LUSO). The target is Toyohashi City, a central city in Japan, which confronts issues dealing with flood risk and strategic land use under the shrinking population. In previous LUSO models, the unit of each objective is different; therefore, it has been difficult to discuss its marginal cost (Yoon et al., 2017). To address this issue, our model adopts the city's 'profit' as a scalarised objective of LUSO, encompassing revenue and expenses influenced by flood resistance, compactness, and minimal land use conversions. (1) Flood-resilient land use is analysed under two types of hazard scenarios: 'uncertain' and 'deterministic'. These scenarios reflect our understanding of which part of the levee might break during a flood. In the 'uncertain' scenario, the specific point of the levee breach is unknown, leading the city to incorporate flood considerations into land use planning across the entire area. Conversely, the 'deterministic' scenario operates on the assumption that the weak point in the levee is known, thereby focusing hazard considerations only on the area surrounding the anticipated breach point. (2) The compatibility of land uses is examined by comparing the land use pattern of ‘never considering compactness’ with that of ‘never considering flood occurrence’. As a result of two analyses, we found that the 'uncertain' scenario is not better than the 'deterministic' scenario in terms of the city’s total 'profit': ensuring equity of flood hazard risk may be costly. In addition, the compatibility analysis identified specific areas that could confront trade-offs between flood avoidance and urban development. This research contributes to understanding the complex dynamics of land use planning in the context of climate change adaptation and demographic shifts.

Hölscher et al. (2023) ‘Strategies for Mainstreaming Nature-Based Solutions in Urban Governance Capacities in Ten European Cities’. Npj Urban Sustainability 3, no. 1. https://doi.org/10.1038/s42949-023-00134-9.

Keith et al. (2023). ‘A New Urban Narrative for Sustainable Development’. Nature Sustainability 6, no. 2: 115–17. https://doi.org/10.1038/s41893-022-00979-5.

Yoon et al. (2017) ‘Multi-Objective Land-Use Allocation Considering Landslide Risk under Climate Change: Case Study in Pyeongchang-Gun, Korea’. Sustainability (Switzerland) 9, no. 12. https://doi.org/10.3390/su9122306.

How to cite: Nakai, F., Kito, S., and Okubo, K.: Analysing Trade-offs and Synergies in Land Use for Flood Resilience and Compactness, EGU General Assembly 2024, Vienna, Austria, 14–19 Apr 2024, EGU24-13450, https://doi.org/10.5194/egusphere-egu24-13450, 2024.

EGU24-14961 | ECS | Posters on site | HS5.3.1

Urban soils as interdisciplinary archives of urban co-evolution – informing historical analysis and ecohydrological modelling: A case study of Gaußbergpark, Braunschweig, Germany 

Mikael Gillefalk, Ilhan Özgen-Xian, Gregor Rickert, Fabian Weigl, Anneke Neber, Sascha Iden, Matthias Bücker, Nicolas Martin-StPaul, and Franziska Neumann

Anthrosols and technosols are urban soils that have been heavily influenced by anthropogenic activities. We hypothesise that such soils store information that can give insights into the system's co-evolution. In a case study of the urban green space Gaußbergpark, Braunschweig, Germany, we demonstrate how an interdisciplinary study of anthrosols yields complementary data sets that provide a more complete picture of the processes involved in urban co-evolution. Gaußbergpark is a public park, located at the northern part of the historical city wall, close to the Oker river. The hill that constitutes the Gaußbergpark was heaped up as a part of the defensive fortifications built during the early modern period. After the abandonment of the fortifications, the area was temporarily used as a landfill during the 18th century before it became part of a band of parks and green areas in the early 19th century. We explore this area from a historical, geophysical, and ecohydrological perspective. In this contribution, we will discuss data from historical archives, geophysical measurements (ERT), and ecohydrological modelling paired with soil moisture observations. As an example, the geophysical measurements clearly showed differences in soil properties between the hilltop and the areas below the slopes. The hill containing mainly sandy soils (fill) while the surroundings contained silty and clayey soils (natural origin to be expected). Simultaneously, this information is valuable for both historical as well as ecohydrological analyses of the area. Our synthesis shows that key ecohydrological processes, such as transpiration, soil moisture dynamics, and runoff partitioning, depend on the specific geophysical properties of the underground, which in turn are explained through the area's history.

How to cite: Gillefalk, M., Özgen-Xian, I., Rickert, G., Weigl, F., Neber, A., Iden, S., Bücker, M., Martin-StPaul, N., and Neumann, F.: Urban soils as interdisciplinary archives of urban co-evolution – informing historical analysis and ecohydrological modelling: A case study of Gaußbergpark, Braunschweig, Germany, EGU General Assembly 2024, Vienna, Austria, 14–19 Apr 2024, EGU24-14961, https://doi.org/10.5194/egusphere-egu24-14961, 2024.

EGU24-15666 | ECS | Posters on site | HS5.3.1 | Highlight

Adaptive capacity in the water sector under socio-economic and climate uncertainty. 

Adriano Vinca, Marina Andrijevic, and Edward Byers

Under the impelling challenges posed by climate change, population growth, and evolving socio-economic landscapes, the ability of water systems to adapt to changing conditions is critical for ensuring resilience and sustainable resource management. As various regions face escalating water scarcity and more intense occurrences of droughts and floods, many of these areas also deal with underdeveloped infrastructure, a lack of access to sanitation services and essential water resources for both population and agricultural activities.

When rainfall patterns change and groundwater is at risk of exploitation, water-saving techniques and alternative water sources such as desalination and water recycling need to be made available, which implies higher costs than conventional water sources.

Using different datasets on technology adoption and country survey data, we assess the historical development of potential adaptation technologies (desalination and wastewater treatment), as well as trends in water infrastructure providing access and sanitation services. We then study the relation of these variables to socio-economic factors (e.g. population, GDP, governance) and climate variables (temperature increase, water stress, flood intensity). We use regression models to understand the future capacity to develop and adapt under different socio-economic futures (identified with the Shared Socio-economic Pathways, SSPs) and climate scenarios, defined by levels of warming.

Preliminary results show a strong linkage between water access and sanitation indicators with GDP and inequality, while governance structure seems to play a significant role in the deployment of desalination technologies.

Comparative analyses of different technologies will help modelling communities explore the effectiveness of different adaptive strategies and inform policy decisions on the most suitable and challenging adaptation options in the water sector.

How to cite: Vinca, A., Andrijevic, M., and Byers, E.: Adaptive capacity in the water sector under socio-economic and climate uncertainty., EGU General Assembly 2024, Vienna, Austria, 14–19 Apr 2024, EGU24-15666, https://doi.org/10.5194/egusphere-egu24-15666, 2024.

EGU24-16137 | ECS | Orals | HS5.3.1

A social-physical approach to question the scaling of local innovations for improving agricultural water management in the Mediterranean 

Kevin Daudin, Gilles Belaud, Zhour Bouzidi, Crystele Leauthaud, Caroline Lejars, and Louis Schwien

Against a backdrop of increasing scarcity and pressure on water resources in the Mediterranean, technical informational innovations for existing irrigation systems have potential to support farmers and Water User Association in these critical times. The capacity to track water flows and transfers at various spatial and temporal scales is now clearly identified as one avenue to improve irrigation management. Information and Communication Technologies (ICT) are being developed at an unprecedented rate, but they are still not as widespread as the increasing conflictual situations may require. The objective of this communication is to propose a methodology to overcome barriers to larger uptake of ICT due to technical and organizational specificities. We developed a specific method, cross-referencing spatial information and analyzing innovation processes. It relies on a reflexive and analytical project perspective and a corresponding process between physical and social sciences. Following-up eight local experimentations of the participatory design of tailor-made decision support systems (https://prima-hubis.org/, 2020-2024), in the course of the project we focused on the how to widen local developments in space and time. We suppose the existence of common pathways, or patterns, that unfold in collaborations at different scales, from the plot, farm, scheme spatial scales, to the territory, watershed, or administrative region. The methodology consist of two simultaneous steps:

  • building of a Geographic Information System to support the agro-hydrological description of irrigated systems to understand the possibility for geographical expansion, e.g. developing a Multi-Criteria Analysis integrating spatial analysis with collective expertise to draw patterns of irrigation technical infrastructures at a Mediterranean scale;
  • recomposing social patterns of local innovation temporalities: using a context-mechanism-outcome framework to guide research on multifaceted collaboration, we draw and analyze innovation timelines and storylines to understand how contextual factors hinder or foster causal chains.

This research was triggered from an overall aim of HubIS project’s consortium to build recommendations at the regional Mediterranean scale to improve local irrigation performance. Acknowledging the importance of contextual conditions on the success of projects, we suppose that innovation “scaling potential”, or percolation rate, depends both on local socio-hydrological system dynamics and on trends at other scales.

We believe that this case of searching common interfaces between disciplines based on a set of collaborative innovation situations may profit the environmental scientific community. Indeed, as any other multi-site projects, spatially and temporally bounded, it remains difficult to understand the processes of diffusion of technological innovations. System dynamics are often ignored in conventional policy approaches, assuming a singular path to progress and a singular view of the problem, and hybrid methods not so common. We want to prove here that we may begin to draw generalizations through multiple case-study comparisons. A composition work is under progress. Obviously, mapping of the ability of irrigated areas to “receive” water-conservation technologies is very ambitious. We finally want to open a discussion about the potential development of some kind of digital platform which would be dedicated to the observation of sustainability narratives, that may help analyze and represent sociotechnical dynamics and model future trajectories.

How to cite: Daudin, K., Belaud, G., Bouzidi, Z., Leauthaud, C., Lejars, C., and Schwien, L.: A social-physical approach to question the scaling of local innovations for improving agricultural water management in the Mediterranean, EGU General Assembly 2024, Vienna, Austria, 14–19 Apr 2024, EGU24-16137, https://doi.org/10.5194/egusphere-egu24-16137, 2024.

EGU24-16197 | ECS | Orals | HS5.3.1

Leveraging explainable Machine Learning to discover trade-offs between water supply and demand management strategies in California 

Marie-Philine Gross, Alvar Escriva-Bou, Erik Porse, and Andrea Cominola

As water scarcity becomes the new norm in the Western United States, states such as California have increased their efforts to improve water resilience. Achieving water security under climate change and population growth requires an integrated multi-sectoral approach, where adaptation strategies combine water supply and demand management interventions. Yet, most studies consider supply-side and demand-side water management strategies separately. Further, publicly available data to assess the effectiveness of these strategies and their dependency on individual and collective human behavior is often hard to find and unstructured. Water conservation efforts are driven by water scarcity and policy requirements, with conservation targets and water use restrictions often designed assuming a degree of rationality of human behavior and based on cost-effective options and ease of implementation.

In this work, we develop a data-driven analysis aimed at evaluating historical synergies and possible trade-offs between water supply and demand management strategies in California. Our analysis is based on CaRDS – the statewide California Residential water Demand and Supply open dataset, which contains monthly values of water supply and residential water demand for 404 water suppliers in California from 2013 to 2021. In this time span, Californian water agencies had to adapt and mitigate the effects of two droughts (in 2012-2016 and 2020-2022) through residential water demand reductions, as well as address rapid changes in demand associated with the global COVID-19 pandemic (2020). Our trade-off analysis integrates the following three sequential steps: (i) trend analysis – we use Random Forest regression to control for seasonal factors (i.e., temperature and precipitation) that affect water supply and demand at the utility scale; (ii) multi-criteria trade-off analysis – we examine the temporal relationship between water supply and demand by utilizing Dynamic Time Warping to identify trade-offs and management patterns. Next, we cluster water suppliers in 6 groups based on their combined management patterns; (iii) and driver analysis – we utilize explainable Machine Learning by combining SHAP (Shapley values) with LGBM (Light Gradient Boosting Method) to identify the drivers of each cluster. Potential drivers include climatic region, water supply portfolio, indoor vs. outdoor water use, local and state policies,  population, supplier size, and income. We finally validate the results of our analysis by comparing our findings with responses from water supplier interviews carried out in 2017 and reveal differences between intended and actual water management outcomes. This research contributes insights into the combined effects of policies on water supply and demand at a statewide level. Further it facilitates the formulation of adaptive resilience strategies for human actors in water management and decision makers alike to address vulnerability of small and large water systems to a rapidly changing climate and a society with non-linear changes in human behavior.

How to cite: Gross, M.-P., Escriva-Bou, A., Porse, E., and Cominola, A.: Leveraging explainable Machine Learning to discover trade-offs between water supply and demand management strategies in California, EGU General Assembly 2024, Vienna, Austria, 14–19 Apr 2024, EGU24-16197, https://doi.org/10.5194/egusphere-egu24-16197, 2024.

EGU24-17260 | ECS | Posters on site | HS5.3.1

A meso-scale simulation of future household and commercial water use under socio-economic and climatic scenarios in Thuringia 

Simon Werner, Christian Klassert, Bernd Klauer, and Erik Gawel

Understanding water use conflicts and anticipating their possible future trajectories requires knowledge of the drivers of household and commercial water use. Water demand is primarily shaped by long-term demographic and socio-economic trends, alongside seasonal fluctuations in weather, which are susceptible to the impacts of climate change. Because the availability of water resources and their use by the various economic sectors are spatially very heterogeneous, it is necessary to use spatially explicit models to investigate water conflicts, which differentiate in particular between rural and urban regions. Here we simulate the regional water use of households and commercial enterprises for the Free State of Thuringia at a high spatial resolution. The model is based on household water demand functions for representative household types and regions.  The household and communal water use is then simulated based on local characteristics of each supply area. The model distinguishes between base water demand, which is explained by socio-demographic factors, and seasonal water demand, which is explained by weather factors. To parametrize the model, we use various regression techniques with public data, and daily water discharge of representative suppliers. Our results show different trajectories of water consumption quantities. Thereby we combine socio-demographic scenarios using statistically downscaled Shared Socio-Economic Pathways and climate scenarios using Regionalized Concentration Pathways. We provide a range of different distributions of water use patterns in Thuringia, informing decision makers about integrated water management options and the effect of demand-side policy measures such as tariffs. 

How to cite: Werner, S., Klassert, C., Klauer, B., and Gawel, E.: A meso-scale simulation of future household and commercial water use under socio-economic and climatic scenarios in Thuringia, EGU General Assembly 2024, Vienna, Austria, 14–19 Apr 2024, EGU24-17260, https://doi.org/10.5194/egusphere-egu24-17260, 2024.

EGU24-17698 | ECS | Orals | HS5.3.1

Assessing climate change impacts in the Tagus-Segura water transfer (Spain) through artificial intelligence 

Ivan Lagos-Castro, Manuel Pulido-Velazquez, Hector Macian-Sorribes, Simon Mason, and Jose Aranda-Domingo

Being the most extensive water infrastructure in Spain, the future of the Tagus-Segura interbasin transfer is contested by climate change and increasing controversy regarding its use. It is a crucial infrastructure for regional socioeconomic development since it significantly contributes to the sustainability of one of Europe's most important agricultural areas. Diverse stakeholders' interests have generated conflicts impacting its decision-making processes. Several regulations have established maximum transferable volumes in the last decades depending on water availability and demands in the involved basins. However, the volumes transferred do not only account for those limits but also include expert criteria and ad-hoc considerations, making it complex to predict them. Artificial intelligence emerges as an effective solution to address this challenge and to reconcile all the factors affecting its current operating rules.

To this end, this contribution combines artificial intelligence (fuzzy logic) with climate change scenarios and hydrological and water resource management models to predict future water transfers from the upper Tagus (donor basin) to the Segura (receiver basin). Climate change scenarios refer to five CMIP6 (Coupled Model Intercomparison Project Phase 6) climate models and four scenarios: historical (1979-2014), SSP126, SSP370, and SSP585 (2015-2100). Using their meteorological projections, the eco-hydrological model TETIS is used to obtain future time series of streamflows in response to them. The current operation of the water transfer is inferred through fuzzy logic systems that take into account the hydrological discharge of the upper Tagus estimated by TETIS, the storage level of the upper Tagus reservoirs (Entrepeñas and Buendia), the storage levels of the rest of the Tagus and the Segura basins, the regulatory limits, and the month of the year. The results show how foreseen streamflows in the upper Tagus would affect the transfer, providing valuable information for water planning in both basins, particularly in the Segura, for its adaptation to any decrease in water received from the Tagus basin.

Acknowledgments

This study has received funding from the European Union's Horizon 2020 research and innovation programme under the GoNEXUS project (grant agreement No 101003722); and from the SOS-WATER project under the European Union's Horizon Europe research and innovation programme under grant agreement No. 101059264.

How to cite: Lagos-Castro, I., Pulido-Velazquez, M., Macian-Sorribes, H., Mason, S., and Aranda-Domingo, J.: Assessing climate change impacts in the Tagus-Segura water transfer (Spain) through artificial intelligence, EGU General Assembly 2024, Vienna, Austria, 14–19 Apr 2024, EGU24-17698, https://doi.org/10.5194/egusphere-egu24-17698, 2024.

EGU24-18748 | Posters on site | HS5.3.1

Steering agricultural interventions towards sustained irrigation adoption by farmers 

Saket Pande, Soham Adla, Anja Šaponjić, Ashray Tyagi, Anukool Nagi, and Prashant Pastore

Agriculture, the largest global freshwater consumer, necessitates water-saving techniques like efficient irrigation. However, the adoption of such technologies is influenced by complex contextual and sociopsychological factors. This study used the sociopsychological RANAS framework to examine the factors impacting irrigation adoption in Maharashtra (India). Logistic regression modeling was conducted with data from cross-sectional surveys in 2019 and 2022, with interim interventions promoting risk-awareness and irrigation technology training. Effects of the interventions on the psychological variables in 2022 were corrected using instrumental variable regression. While micro-irrigation adoption rose from 36.9% to 62.8% (as anticipated), overall irrigation counterproductively decreased from 81.8% to 70.5%. Results indicated that wealth and risk-aversion remained relevant, while self-perceived ability and attitude towards irrigation became non-significant to irrigation adoption. Based on these unintended consequences of the intervention, this study highlights the necessity to also transform attitudes, and promote psychological ownership and trust for sustained irrigation technology adoption behavior.

How to cite: Pande, S., Adla, S., Šaponjić, A., Tyagi, A., Nagi, A., and Pastore, P.: Steering agricultural interventions towards sustained irrigation adoption by farmers, EGU General Assembly 2024, Vienna, Austria, 14–19 Apr 2024, EGU24-18748, https://doi.org/10.5194/egusphere-egu24-18748, 2024.

EGU24-19852 | ECS | Orals | HS5.3.1

Adaptations in agricultural water management in arid regions: modelling farmer behaviour and cooperation on irrigation sustainability 

Imane El Fartassi, Helen Metcalfe, Alice E. Milne, Rafiq El Alami, Alhousseine Diarra, Vasthi Alonso-Chavez, Toby W. Waine, Joanna Zawadzka, and Ron Corstanje

The disruptions in weather patterns and intensified drought imposed by climate change in arid and semi-arid areas require prompt adaptation of irrigation strategies to sustain production and build resilience. Our research develops a quantitative methodological framework outlining irrigation management strategies, focusing on groundwater governance and drip irrigation adoption, to pinpoint influential factors steering decision-making. Extensive interviews undertaken in Al Haouz Basin, Morocco, provided insights into irrigation choices. We identified themes through inductive encoding and translated these into an integrative modelling framework relying on a fusion of planned behaviour theory and structural equation modelling. This enabled analysis of relationships among attitudes, norms, perceived behavioural control and intentions to adopt practices and technologies. We tested hypothesized pathways through which these factors influence adoption. Structural equation modelling estimates relationship strengths while accounting for interacting variables. The results show farmers' attitudes towards the efficiency of drip irrigation, the sustainability of groundwater resources, and salinity increase in groundwater play a crucial role in their decision-making processes regarding water usage. Land ownership provides a sense of long-term control over sustainable water usage. However, complexities in subsidy applications and uncertainties in land tenure present substantial barriers to adopting drip irrigation, particularly for small-scale farmers, thereby limiting their capacity to adapt to climate change. Our study uncovers the key factors influencing evolving agricultural practices and delves into the policy implications surrounding these changes. By examining the adaptive strategies of farmers, our research lays a foundation for formulating evidence-based policy reforms to increase agricultural resilience and water sustainability in arid and semi-arid climates.

How to cite: El Fartassi, I., Metcalfe, H., Milne, A. E., El Alami, R., Diarra, A., Alonso-Chavez, V., Waine, T. W., Zawadzka, J., and Corstanje, R.: Adaptations in agricultural water management in arid regions: modelling farmer behaviour and cooperation on irrigation sustainability, EGU General Assembly 2024, Vienna, Austria, 14–19 Apr 2024, EGU24-19852, https://doi.org/10.5194/egusphere-egu24-19852, 2024.

EGU24-20379 | Posters on site | HS5.3.1

Modeling levee system transformation with human-flood interaction in the Kiso River basin, Japan 

Shinichiro Nakamura, Fuko Nakai, Tomoko Nitta, and Taikan Oki

The form of the levee system defines the dynamics of human-water interaction on the floodplain: societies with indigenous levee system, such as ring levees and discontinuous levees, are more likely to adapt to flooding, while those relying on modern continuous levees fight against floods. However, those societies are not binary, and in some regions, such as flood-prone areas in Asia, one society has changed from an adapting society to a fighting society along with the levee system transformation (Nakamura et al., 2023). Previous coupled human-flood system models have assumed a fixed society of one or the other. In this study, the coupled human-flood system model was improved to simulate the levee system transformation and the associated changes in the dynamics of human-flood interaction. The improved model was applied to the Kiso River basin in Japan, where levee system transformation has been observed over the past century. The time series results reproduced the process of levee system transformation and human-flood interactions, and the regime shift from an adapting society to a fighting society. This study shows that the improved model has a potential to support the implementation of flood management and governance that integrates indigenous and modern technologies.


References:

Nakamura, S., Nakai, F., Ito, Y., Okada, G., and Oki, T.: Levee system transformation in coevolution between human and water systems along the Kiso River, Japan, EGUsphere [preprint], https://doi.org/10.5194/egusphere-2023-2866, 2023.

Nakamura, S., Nakai, F., and Oki, T.: Levee system transformation and its impacts on the human-water system in the Kiso River Basin, Japan, EGU General Assembly 2023, Vienna, Austria, 24–28 Apr 2023, EGU23-15847, https://doi.org/10.5194/egusphere-egu23-15847, 2023.

How to cite: Nakamura, S., Nakai, F., Nitta, T., and Oki, T.: Modeling levee system transformation with human-flood interaction in the Kiso River basin, Japan, EGU General Assembly 2024, Vienna, Austria, 14–19 Apr 2024, EGU24-20379, https://doi.org/10.5194/egusphere-egu24-20379, 2024.

EGU24-21381 | Orals | HS5.3.1

Guidelines for Scenathons. A framework for co-creating Transformational Adaptation Policies. 

Tania Santos, Gustavo Ayala, and David Purkey

The use of information and models is key to making decisions related to water management, considering the interaction between the natural supply and the economic and socio-cultural systems. However this data-based decision-making is generally complex due to the uncertainties associated with these models, the various individual interests that stakeholders have regarding the water that prevail over the collective interest, and the institutional framework that frames the decisions. In a system limited by the quantity and quality of water available, and where users want to respond to their growing water needs, it requires tools that allow objective decisions to be made based on the common benefit of concurrent users. In this context, a methodological guide has been developed for the development of water resource planning processes based on data and models, which integrates the robust decision support framework (Purkey, David et al., 2018) with the development of serious games or scenathons, called guidelines for scenathons.

Robust Decision Support is a framework that guides water resource planning processes through a series of steps starting from defining decision space, mapping key actors, problem formulation, tool construction, scenario definition, system vulnerability, options analysis, results exploration, and decision-making. The process includes three workshops for problem definition and vulnerability These participatory processes have shown the usefulness of having systematized information and models that make it possible, on the one hand, to understand the vulnerabilities of the system in its current condition, and to simulate scenarios of analysis of the impacts that may be generated by climate change, population growth and economic activities.

In these processes, it has been understood that it is not only important to have models that accurately and precisely describe reality, but it is also fundamental how the model is built, using information and models that have credibility in the region and validating the results with the actors knowledgeable about their environment.

However, interaction with stakeholders directly using the models is not easy due to multiple user profiles and knowledge. To this end, methodologies have been developed that allow interaction with complex data through visualization platforms for model results and various simulated scenarios. This interaction has been complemented with the use of serious games to generate an exchange with users using a narrative that allows transcending from existing roles and conflicts to a more purposeful dialogue. Examples of the serious games and visualization tools will be provided in the presentation https://latinoamericasei.shinyapps.io/Juego_Serio_POMCA_Campoalegre/

In this context, in the framework of the TRANSCEND project (Transformational and Robust AdaptatioN to water Scarcity and ClimatE chaNge under Deep uncertainty) we proposed a guideline for scenathons, which integrates the process of participation in the four years of the project and the development of each Scenathon for the co-creation of TAPs. The guidelines for scenathons is the roadmap to guide the process of co-creation of TAPs using models in 7 living labs and considering the associated uncertainty that may affect decision-making. We are currently developing the first year of the project where the main problems have been identified.

How to cite: Santos, T., Ayala, G., and Purkey, D.: Guidelines for Scenathons. A framework for co-creating Transformational Adaptation Policies., EGU General Assembly 2024, Vienna, Austria, 14–19 Apr 2024, EGU24-21381, https://doi.org/10.5194/egusphere-egu24-21381, 2024.

EGU24-22374 | Posters on site | HS5.3.1

Can integration of local water users bring us closer to achieving the SDGs 6.1, 6.2 and 6.3? 

Kamshat Tussupova and Yerlan Kabiyev

While Millennium Development Goals prioritised piped water coverage and access to flashed toilets, Sustainable Development Goals (SDG) consider all water sources and equally accepts both cetralized and decentralized water supply systems (SDG 6.1); seperately assess the acces to sanitation services (SDG 6.2) considering the feaces are disposed; and the access to wastewater system (SDG 6.3). This approach has broadened the scope of water and sanitation infrastructure to be considered safe if properly managed.

Full coverage with safely managed drinking water and sanitation is an SDG 6.1., 6.2. and 6.3 target challenge and urbanization is a global challenge for many countries. However, developing countries face the rural population growth as well. Kazakhstan is recently fast population growing middle income country with 20 million people and 43% of them living in 6200 rural settlements. 

Soviet Union tried to tacke rural water supply issues, providing the centralized piped water; this tradition has been continued during after the independency of Kazakhstan. Since 2002 it has invested around 3.2 trillion tenge into provision of water pipes, particularly, in rural areas within five Governmental programs; and none considered rural sanitaiton and wastewater treatment.

This paper investigates the access to drinking water (SDG 6.1), sanitation services (SDG 6.2) and wastewater treatment (SDG 6.3) among rural citizens in one of the donor regions in Kazakhstan –Atyrau region - as well as assessed the responsibility level of local households for water and wastewater systems (WWS). 1360 questionnaires were collected based on online survey conducted in 153 villages in Atyrau region – naturally dry and arid area with poor water resources – during September 2022.

The results show that 2/3 of the rural population use water from centralized water sources which help people enjoy the considerable amount of water for hygiene purposes, and only 11% have access to sewer system representing imbalance in the circular loop: «centralized piped drinking water – sewer system». Moreover, the rural wastwewater from sewer system is not treated and collected in the natural ponds that is accessible for village live stock.

2/3 of people collect wastewater in septic tanks and take the full responsibility for its disposal. 80% of households use pitlaterines which are considered to be one of the sustainable ways dealing with feacal disposal and no mixing feaces with wastewater and letting used drinking water be «grey water» and recycled furtheon. Perceived responsibility level of local households for disposal of feaces, treating wastwewater and maintaining the decentralized water sources is very high.

This servey shows the local water users' high responsibility level for maintaing particuarly decentralized WWS; while neither central government nor municipalities have state functions on community water supply and the funding to support decentralized water and wastwater systems. The managerial tools to integrate the local water users and a system approach are needed to better manage access to decentralized WWS.

How to cite: Tussupova, K. and Kabiyev, Y.: Can integration of local water users bring us closer to achieving the SDGs 6.1, 6.2 and 6.3?, EGU General Assembly 2024, Vienna, Austria, 14–19 Apr 2024, EGU24-22374, https://doi.org/10.5194/egusphere-egu24-22374, 2024.

EGU24-22424 | Posters on site | HS5.3.1

Can integration of local water users bring us closer to achieving the SDGs 6.1, 6.2 and 6.3?

Kamshat Tussupova and Yerlan Kabiyev

EGU24-676 | ECS | PICO | HS5.3.3

The effect of commercial export farms on drought risk and adaptation of agropastoral communities in the drylands of Kenya 

Ileen Streefkerk, Jeroen Aerts, Jens de Bruijn, Khalid Hassaballah, Rhoda Odongo, Teun Schrieks, Oliver Wasonga, and Anne Van Loon

Drought poses a thread in the already existing water challenges in dryland regions. Drought hazard and risk are, however, not merely a natural phenomenon. Instead they are shaped and influenced by human behaviour and interventions. This raises questions about how to distribute the limited available water in an equitable manner, especially in drought prone areas such as drylands where water is key to people’s livelihood and fragile ecosystems.

In the Horn of Africa Drylands (HAD) conflict over water and vegetation is prominent. On top of that, large-scale land acquisitions (LSLAs) are increasing the competition of water, putting local communities at increased risk. A key impact of increasing LSLA's is the decrease in water and land availability for vulnerable agropastoral communities. For such communities, drought adaptation is key to reduce drought risk, especially under climate change. Despite these recent studies, there is still a lack of research that includes the influence of upstream-downstream dynamics on drought risk and adaptation behaviour with a focus on the impacts of agropastoralists.

This study, therefore, further develops an agent-based model (ADOPT-AP) to investigate how upstream large scale commercial farms influence downstream drought risk and adaptation of agropastoralists. We apply and test the ADOPT-AP model for the Ewaso N’giro north catchment in Kenya. Main novelties of our method are the ability to capture heterogeneous and dynamic drought-human interactions (including different water users) in a spatially-explicit manner. After the model has been calibrated and validated, we test how commercial exporting farms affect drought risk and impact of downstream communities by simulating different scenarios. We show for various drought periods how both drought characteristics (soil moisture, discharge and groundwater levels) and impacts (milk production, crop production, distance to water) differ among the scenarios.

How to cite: Streefkerk, I., Aerts, J., de Bruijn, J., Hassaballah, K., Odongo, R., Schrieks, T., Wasonga, O., and Van Loon, A.: The effect of commercial export farms on drought risk and adaptation of agropastoral communities in the drylands of Kenya, EGU General Assembly 2024, Vienna, Austria, 14–19 Apr 2024, EGU24-676, https://doi.org/10.5194/egusphere-egu24-676, 2024.

EGU24-1415 | PICO | HS5.3.3

Capturing geospatial data on farm management practices in vulnerable farmer-water systems: Lessons from the Sahel 

Nadir Ahmed Elagib, Bashir M. Ahmed, Hussein M. Sulieman, Abbas E. Rahma, Marwan M.A. Ali, and Karl Schneider

 Emphasis has been placed worldwide recently on the need to view social sensing and geospatial big data as an analogue of remote sensing data. The attempt to establishing a firm footing of this kind of data is essential, for example, to: 1) understand the complex coupling of human and natural systems and 2) make useful policy interventions related to sustainable land and water management. However, most vulnerable communities to natural disasters, whose livelihood and economies are dependent on farming, lack such data. Without suitable socio-economic and farm management data, agricultural governance becomes less responsive or even fails, particularly when the agricultural systems are affected by natural disasters. In this study, we highlight nine lessons learned from our first experience during extensive and comprehensive household surveys of farm management practices recently conducted in the arid and semi-arid zones of Sudan. The aim here is to offer guidelines for researchers and practitioners to carry out successful campaigns in similar settings. These campaigns were implemented as part of the DFG funded SHADRESS project, “Sociohydrological analysis of drought resilience in Sahelian Sudan farming systems”. The surveys were conducted by means of Information and Communication Technology (ICT) via smartphone app and traditional paper-based approach. Two hypotheses were assessed: First, the two survey methods can be integrated and utilized to generate direct and ongoing communication between farming stakeholders. Second, this stakeholder network and dialogue can help acquire big social datasets to fill the data gap within the agriculture sector and, subsequently, address water and food security. We categorize the lessons and guidelines as logistics, technology, culture and behavior related. More than 70 questions related to the socio-hydrological farming system were addressed. The surveys resulted in capturing responses from ~1640 households distributed over three farming systems, namely traditional rainfed, mechanized rainfed and irrigated systems. This dataset contains rich information to enable detailed spatial analyses of farm management strategies and understanding of generic concepts of farmer-water interactions in a drought-vulnerable region. 

How to cite: Elagib, N. A., Ahmed, B. M., Sulieman, H. M., Rahma, A. E., Ali, M. M. A., and Schneider, K.: Capturing geospatial data on farm management practices in vulnerable farmer-water systems: Lessons from the Sahel, EGU General Assembly 2024, Vienna, Austria, 14–19 Apr 2024, EGU24-1415, https://doi.org/10.5194/egusphere-egu24-1415, 2024.

EGU24-4678 | ECS | PICO | HS5.3.3

Assessing the Impact of Climate Change on Water Scarcity in the Tormes ‎Catchment, Spain: A Human-Water System Modeling Approach 

Osama Gasimelseed Bakhit Hassan, C. Dionisio Pérez-Blanco, and Héctor González-López

Climate change presents a pressing challenge to global water availability resulting in ‎increased variability in precipitation and increased temperatures, imposing more stress ‎on existing water resources and the economic activities that depend on them. The ‎Tormes catchment, located in a semi-arid region, is facing increasingly severe water ‎shortages, which may be further aggravated under climate change. This catchment is ‎extensively employed for agricultural purposes, and a potential reduction in the ‎availability of water for irrigation emerges as a significant concern.‎
This study evaluates the impact of climate change on water availability, and the ‎responses implemented by irrigators to adapt to growing scarcity, in the Tormes ‎catchment. To this end, we develop a human-water system model that couples the Soil ‎and Water Assessment Tool (SWAT) model and a Positive Multi-Attribute Utility ‎Programming (PMAUP) model using a dynamic and modular approach. The coupled ‎model runs the water (SWAT) and human (PMAUP) system models iteratively and ‎over time using inputs from six different bias-corrected Global Climate ‎Models(GCMs) under CMIP6 scenarios, as follows: i) CMIP6 climate change scenario ‎simulations are fed to the SWAT model to estimate relevant hydrological data ‎including water availability in March (beginning of the irrigation campaign); ii) ‎information on water availability is fed to the PMAUP model to simulate the adaptive ‎responses of irrigators in terms of water and land allocation; iii) land and water use ‎choices by irrigators are fed into the SWAT model, which reproduces the ‎consequences of human decisions on the water system; iv) when the hydrological year ‎is over, a new iteration starts where CMIP6 climate change scenario simulations for ‎the following year are fed into the SWAT model and the process is repeated again. The ‎non-linearity and modular approach in both the hydrological and economic models ‎imply complex and interconnected interactions within these systems, with behaviors ‎that may or may not follow linear patterns.‎
Six bias-corrected GCMs under CMIP6 scenarios were employed for the climate ‎change scenario simulations. The dataset covered precipitation, maximum and ‎minimum temperatures for the historical period (1981–2010) and projections for ‎SSP245 and SSP585. Future data was analyzed for three periods: 2020–2039, 2040–‎‎2059, and 2060–2100. A multi-model ensemble approach was applied, averaging ‎outputs from the six models. Precipitation and temperature data were integrated into ‎the SWAT model.‎
The hydrological analysis revealed a downward trend in projected precipitation, with ‎reductions of 0.7% (2020s), 0.3% (2040s), and up to 5.3% (2060s) under SSP245. ‎SSP585 showed declines of 6.4% (2020s), 6.6% (2040s), and 16.1% (2060s). ‎Maximum and minimum temperatures exhibited an upward trend under both ‎scenarios. Simulated mean annual runoff under SSP245 experienced a drastic ‎reduction of 48.1% in the 2020s, followed by 43.8% (2040s) and 53% (2060s). ‎Similarly, under SSP585, mean annual runoff decreased by 47.2% over the entire ‎projection period. While the hydrological analysis reveals concerning trends in ‎precipitation, temperature, and mean annual runoff under different scenarios, the ‎economic results, reflecting the effects of these hydrological changes on human ‎activities, are still being investigated and are not yet finalized.‎

How to cite: Hassan, O. G. B., Pérez-Blanco, C. D., and González-López, H.: Assessing the Impact of Climate Change on Water Scarcity in the Tormes ‎Catchment, Spain: A Human-Water System Modeling Approach, EGU General Assembly 2024, Vienna, Austria, 14–19 Apr 2024, EGU24-4678, https://doi.org/10.5194/egusphere-egu24-4678, 2024.

EGU24-5621 | PICO | HS5.3.3 | Highlight

The Water System Explorer: understanding interactions between the natural and anthropogenic water system on a regional scale 

Marjolein van Huijgevoort, Sija Stofberg, Klaasjan Raat, and Ruud Bartholomeus

In the Netherlands the natural water system has been altered significantly to address human needs. Historically, the main water issues were related to water excess. However, recent dry years (2018-2020, 2022) have made it clear that drought affects many sectors as well. To deal with both extremes, a transition of the water system is needed with integral solutions.

Exploring the effects of measures needed to improve the water system is challenging and needs to be done in an integrated way that considers the natural water system as well as the anthropogenic influence on that system. Often these effects are investigated using complex, spatially-distributed models that usually don’t include all interactions between water users and the water system, have long calculation times and require a certain computer capacity. To attain a first crude estimate of the effects, it is also possible to use a different approach like system dynamics models. System dynamics models provide less details and include less spatial variation, but can include more interactions between the different subsystems and have short calculation times.

We have developed a system dynamics model, the Water System Explorer, that can be used to simulate the effect of human interventions on the water system. The Water System Explorer provides insight into the water system at a regional scale and can be used as a tool to support conversations between different stakeholders in a region. It is a strong simplification of reality, so it serves to give a first indication of potential measures and their effects, including trade-offs, in a specific region.

The Water System Explorer includes the natural and anthropogenic system. For the natural system, four different landuse types are defined: agriculture, urban area, groundwater-dependent nature and groundwater-independent nature. The phreatic groundwater level is determined for each land use type, which interacts with the surface water and deep groundwater. The anthropogenic system includes the water demand of industry and households, drinking water supply and a wastewater treatment plant. Several interventions are included, for example, a ban on water abstractions for agriculture, introducing separated sewers, increasing surface water levels, applying managed aquifer recharge and re-use of effluent in agriculture, industry, or drinking water supply.

The Water System Explorer has been applied for a region in the Netherlands. The tool reproduced general characteristics of the water system and illustrated the side-effects of water system interventions as a result of feedback mechanisms. The tool shows much potential for gaining insight into a regional water system to discuss measures with all stakeholders and for education purposes. 

How to cite: van Huijgevoort, M., Stofberg, S., Raat, K., and Bartholomeus, R.: The Water System Explorer: understanding interactions between the natural and anthropogenic water system on a regional scale, EGU General Assembly 2024, Vienna, Austria, 14–19 Apr 2024, EGU24-5621, https://doi.org/10.5194/egusphere-egu24-5621, 2024.

Resilience has been defined as the ability of a system to withstand stressors while preserving its structure and functions. Various resilience assessment frameworks and metrics have been developed for understanding individual water system behaviour. However, in coupled human-water systems, the increased complexity presents new challenges in the application of these frameworks. This exploratory study first conducted a literature review on system performance indicators, failure thresholds, and resilience metrics, across urban water supply, drainage, wastewater, groundwater, and river systems. Challenges are identified in intercomparison between system performance indicators, robustness of thresholds selection, and resilience metrics synthesis as well as their applicability to inform water management. Based on the insights, a bottom-up resilience assessment framework for coupled human-water systems is developed. This framework sets double thresholds to characterise the vulnerable and critical systems state during a disruptive period. Four shape-based resilience metrics are designed and uniformly applied to various performance indicators to facilitate intercomparison between subsystems. The application of the metrics crosses temporal scales, from event-level assessments for understanding system behaviour to annual-level evaluations of system reliability, which are ultimately synthesised at the system level for multi-stakeholder decision-making. The efficacy of this framework is demonstrated through its application with the integrated water system model (WSIMOD) in Luton, UK, serving as a case study. The findings highlight river water quality as the least resilient subsystem that needs prioritised management. Sensitivity analysis is conducted to examine the robustness of results, with subsequent interpretation linking these metrics to specific design variables for enhanced management. This framework can be further applied with stakeholder engagement and multi-criteria analysis for more effective decision-making to achieve better system performance under deep uncertainties. 


How to cite: Mijic, A. and Liu, L.: An exploratory bottom-up resilience assessment framework for coupled human-water systems, EGU General Assembly 2024, Vienna, Austria, 14–19 Apr 2024, EGU24-6073, https://doi.org/10.5194/egusphere-egu24-6073, 2024.

EGU24-7616 | ECS | PICO | HS5.3.3

Societal Pathways of Cooperation for Water-related Conflict Mitigation 

Elisie Kåresdotter, Zipan Cai, Haozhi Pan, and Zahra Kalantari

Over the past decade, water conflicts have risen, and cooperation has declined. Research highlights multiple factors driving this change, with climate change acting as a threat multiplier. Human activities, like dam construction and irrigation, and climate-induced hydro-climatic shifts, including extreme precipitation and prolonged droughts, contribute to the risk of increased water conflicts. To guide interventions and reverse this trend, our focus is on enhancing the understanding of factors that facilitate successful cooperation and mitigate water conflicts effectively. In this study, we investigate cooperation and conflict events worldwide in the last 70 years, together with climatic and socioeconomic factors, such as wealth, export dependency, demographics, water use, and hydro-climate trends. The dataset on cooperation and conflict events used is based on the Transboundary Freshwater Dispute Database and Water Conflict Chronology in combination with more current cooperation events extracted from media news reports. Relationships between investigated factors and cooperation are analyzed by combining panel data analysis and qualitative text content analysis of events. The results provide a deeper understanding of the factors behind why certain events are more successful in achieving conflict mitigation than others. We found that cooperation between countries struggling with water-related challenges can reduce expected conflicts over the next five years. The economic benefits of cooperation show a positive correlation between water-related cooperation and improved wealth (measured by GDP growth), particularly in countries with high export dependency. As such, economic collaboration can be an effective tool for enhancing resilience in high-water stress areas, where collaboration in these areas can contribute to a substantial reduction in future conflicts while simultaneously improving economic prosperity. Engaging in cooperation with other countries can therefore contribute to economic growth and resilience, as well as decreasing conflict risk. Understanding successful conflict mitigation factors can provide helpful insights to global policymakers and leaders in water management to avoid future conflict based on current and projected water availability.


Keywords: water conflict; collaboration; conflict mitigation; mixed methods; socioeconomic factors;

How to cite: Kåresdotter, E., Cai, Z., Pan, H., and Kalantari, Z.: Societal Pathways of Cooperation for Water-related Conflict Mitigation, EGU General Assembly 2024, Vienna, Austria, 14–19 Apr 2024, EGU24-7616, https://doi.org/10.5194/egusphere-egu24-7616, 2024.

EGU24-9372 | ECS | PICO | HS5.3.3 | Highlight

Human drivers of flood losses in Europe since 1950 

Dominik Paprotny, Aloïs Tilloy, Michalis I. Vousdoukas, Heidi Kreibich, Luc Feyen, Oswaldo Morales Nápoles, and Matthias Mengel

Human drivers significantly influence flood occurrence and impacts  through multiple avenues. In this work, we explore how human drivers contributed to flood risk in 42 European countries between 1950 and 2020, with particular focus on 1504 historical floods that caused significant socioeconomic impacts. Our modelling chain covers both riverine and coastal floods and is able to reconstruct past extreme events including the influence of (1) human impact on catchment hydrology through changing land use, water demand and reservoir capacity, (2) increase in exposure related to land use change, demographic and economic growth, and evolving structure of the economy, and (3) changes in flood preparedness, exhibited by flood protection levels (primarily from structural defences) and flood vulnerability (relative loss at given intensity of hazard). The results indicate that although construction of large reservoirs (the number of which increased six-fold in the study area since 1950) has locally led to a pronounced decline in riverine flood risk, human alterations to catchments overall increased the flood risk in Europe due to land-use change, particularly through strong increase in soil sealing caused by urbanization. An even stronger relative effect on the increase in flood impacts is caused by exposure growth, consisting of population growth, particularly in cities, a rapid increase in gross domestic product per capita, and further compounded by growth in capital-to-income ratio. Exposure growth is more pronounced for coastal floods compared to riverine floods. On the other hand, historical flood impact data analysed in this study show evidence of improving preparedness over time. Flood defences currently protect against higher return periods of floods than before, particularly for coastal floods, though they are mostly much lower than assumed in previous pan-European studies. A decline in flood vulnerability (relative losses) over time is also observed, partially compensating for negative human influences on flood risk.

How to cite: Paprotny, D., Tilloy, A., Vousdoukas, M. I., Kreibich, H., Feyen, L., Morales Nápoles, O., and Mengel, M.: Human drivers of flood losses in Europe since 1950, EGU General Assembly 2024, Vienna, Austria, 14–19 Apr 2024, EGU24-9372, https://doi.org/10.5194/egusphere-egu24-9372, 2024.

EGU24-9602 | PICO | HS5.3.3

Droughts influence changes in human settlement patterns in Africa 

Serena Ceola, Johanna Maard, and Giuliano Di Baldassarre

Human displacements due to climate and weather extremes are dramatically increasing worldwide, mainly across areas where extreme events interact with high vulnerability and low adaptive capacity, such that they are now recognized as a primary humanitarian challenge of the 21st century. Human mobility from droughts is multifaceted and depends on environmental, political, social, demographic and economic factors. Although droughts cannot be considered as the single trigger, they significantly influence people's decision to move. Yet, the ways in which droughts influence patterns of human settlements have remained poorly understood.

Here we explore the relationships between drought occurrences and changes in the spatial distribution of human settlements across 50 African countries for the period 1992–2013. Since long-term yearly data on human displacements are not consistently available for the entire African continent, we employ both country-based and spatially explicit data sets as reliable proxies. We base our continental study on urban population data and nighttime lights, as a proxy for the spatial and temporal distribution of human settlements. For each country, we evaluate annual relative urban population and human distance to rivers. To identify drought years, we extract annual drought occurrences from two indicators, the international disaster database EM-DAT and the standardized precipitation evapotranspiration index (SPEI-12) records. We then compute human displacements as variations in human distribution between adjacent years, which are then associated with drought (or non-drought) years. We finally examine the consistency between drought occurrences and changes in human settlement patterns to identify macroscopic trends at the continental scale.

Our results show that drought occurrences across Africa are often associated with (other things being equal) human mobility toward rivers or cities. In particular, we found that human settlements tend to get closer to water bodies or urban areas during drought conditions, as compared to non-drought periods, in 70%–81% of African countries.

This large-scale trend clearly highlights that the occurrence of drought events, although not being the single driving factor, significantly influences human mobility. By interpreting this outcome from a broader perspective, which includes consecutive drought-to-flood events, adverse consequences might occur. An increased human presence in urban areas and close to rivers may result into an increased human exposure to floods, and thus leading to a potentially increased flood risk. Therefore, further investigations are foreseen and encouraged to better understand the interplay between human mobility and climate change in order to increase the resilience of vulnerable areas and population to hydrological extreme events and support the development of sustainable and effective planning strategies for the near future.

How to cite: Ceola, S., Maard, J., and Di Baldassarre, G.: Droughts influence changes in human settlement patterns in Africa, EGU General Assembly 2024, Vienna, Austria, 14–19 Apr 2024, EGU24-9602, https://doi.org/10.5194/egusphere-egu24-9602, 2024.

EGU24-11342 | ECS | PICO | HS5.3.3

More Droughts, More Irrigation? Modeling the Adaptive Behavior of German Farmers to Hydrometeorological and Socioeconomic Change  

Jasmin Heilemann, Mansi Nagpal, Simon Werner, Christian Klassert, Bernd Klauer, and Erik Gawel

The shifting precipitation patterns and rising temperatures in Central Europe and Germany present an existential challenge for farmers. Recent severe summer droughts, such as those in 2003 and 2018, underscore the imperative for farmers to adapt to evolving climatic conditions, for instance through the application of irrigation in areas where it was previously unnecessary or economically unfeasible. However, expanding the currently only 3% irrigated agricultural area in Germany has the potential to significantly impact freshwater resources and hydrological processes.

Here, we model the adaptive behavior of farmers regarding irrigation, by employing an empirically validated multi-agent system (MAS) model. This model simultaneously simulates decisions about annual crop choices, acreages, and irrigation water application. Spatially disaggregated, the MAS model is calibrated using an Econometric Mathematical Programming (EMP) approach, based on historical land use data for eight major field crops. To account for the implications of future climate change, we couple the MAS model with a statistical crop yield model driven by meteorological indicators and soil moisture anomalies derived from the mesoscale Hydrologic Model (mHM) for a EURO-CORDEX scenario ensemble (RCP2.6, RCP4.5, RCP8.5). Socioeconomic variables that influence farmers' decisions, including changes in crop prices, costs, and subsidies, are projected based on Shared Socioeconomic Pathway (SSP) scenarios.

Across various combinations of SSP and RCP scenarios, we find a notable surge in irrigation water demand. This development is particularly pronounced in SSP3-RCP8.5, where the MAS model projects several irrigation hotspots with a high irrigation water demand. Shifts in cropping patterns thereby significantly affect the resulting irrigation water demand. To dissect the effects of hydrometeorological, socioeconomic, and policy changes on irrigation water demand, we conduct sensitivity analyses on individual parameters.

The MAS model emerges as a robust tool for analyzing farmers' adaptive behavior and assessing the impact of diverse policies on future irrigation water demand. This research contributes valuable insights into agricultural adaption under changing environmental and socioeconomic conditions.

How to cite: Heilemann, J., Nagpal, M., Werner, S., Klassert, C., Klauer, B., and Gawel, E.: More Droughts, More Irrigation? Modeling the Adaptive Behavior of German Farmers to Hydrometeorological and Socioeconomic Change , EGU General Assembly 2024, Vienna, Austria, 14–19 Apr 2024, EGU24-11342, https://doi.org/10.5194/egusphere-egu24-11342, 2024.

EGU24-11646 | ECS | PICO | HS5.3.3

Correlation of Social Media-Driven Risk Perception and Flood Insurance Uptake for Floods in the US 

Nadja Veigel, Heidi Kreibich, Jens de Bruijn, Jeroen C.J.H. Aerts, and Andrea Cominola

Social media platforms play a key role in enhancing human response to natural hazards. They serve as tools for individuals to share first-hand observations, insights, and experiences, thus contributing to improved resilience. Increased attention of social and communication media content toward natural hazards has the potential to foster take up of private precaution and resilience measures such as purchasing a flood insurance. This study investigates the driving factors behind flood insurance purchase decisions in the US, with a focus on the roles of risk perception and social media as potential drivers for such decisions. We investigate the relationship between household flood insurance uptake and social media attention for flood events that occurred in the continental US from 2014 to 2021. We argue that the surge in insurance uptake in counties affected by flood events is primarily attributed to heightened risk perception resulting from direct exposure to flooding and from citizens’ awareness due to exposure to flood related information. We compare the time series of insurance take-up rate in a county with the number of flood-related social media posts in the adjacent counties using Dynamic Time Warping, which measures the similarity between two time series by optimally aligning their temporal structures. Additionally, we control for time passed since the last flood as well as the number of communities participating in the Community Rating System since these factors have shown to be important drivers of insurance uptake and may otherwise distort the temporal patterns associated to social media exposure. With our data-driven analysis we first evaluate the correlation between exposure to flood-related content on platforms like X (formerly Twitter) and an increased likelihood of purchasing flood insurance. Consecutively, we quantify variations in risk perception and resilience due to exposure to flood-related content on social media. This analysis provides a comprehensive view of risk communication through social media and its implications for resilience-building efforts.

How to cite: Veigel, N., Kreibich, H., de Bruijn, J., Aerts, J. C. J. H., and Cominola, A.: Correlation of Social Media-Driven Risk Perception and Flood Insurance Uptake for Floods in the US, EGU General Assembly 2024, Vienna, Austria, 14–19 Apr 2024, EGU24-11646, https://doi.org/10.5194/egusphere-egu24-11646, 2024.

EGU24-11816 | ECS | PICO | HS5.3.3

Modeling heterogeneous farmers' response to climate change via agent-based simulation 

Paolo Gazzotti, Sandra Ricart, Claudio Gandolfi, and Andrea Castelletti

Farmers' risk preferences significantly shape their decision-making processes, influencing key strategies like crop selection and irrigation practices. Concurrently, climate change poses significant threats to agricultural activities, necessitating an in-depth examination of coupled human-nature systems. Farmers perceive changes in climate patterns, such as severe and more frequent droughts, but their reactions to these changes may be highly heterogeneous, influenced by factors such as individual risk aversion, satisfaction, uncertainty, interaction and comparison with other farmers. Agent-based modeling (ABM) has emerged as a powerful tool to capture the complexities of agricultural systems and simulate the interactions between farmers, their environment, and climate change. However, despite increasing calls to incorporate realistic human behavior, the prevailing paradigm remains the use of representative rational agents.

This study presents an ABM application in the Adda River basin, Italy, where agents represent farmers who make decisions on crop type and irrigation method. The main goal is to understand how the system reacts and withstands the impact of emerging climate-change-driven scenarios. The study attempts to find a more realistic approach to agents' decision-making by implementing different behavioral models. The first model assumes profit maximization under perfect foresight, a traditional approach commonly used in ABM literature. The second model introduces uncertainty about future climate conditions and heterogeneity in farmers' risk aversion preferences on the basis of past performances. The third model embraces a more comprehensive approach to behavioral modeling, incorporating behavioral concepts such as reference points and loss aversion. This model acknowledges that farmers' decision-making is not solely guided by profit maximization, but also influenced by their prior experiences, perceptions of losses, and the potential for regret. This more comprehensive approach aims to offer a more comprehensive representation of farmers' decisions on crop selection and irrigation practices, under conditions of uncertainty and risk.  Agents’ individual preferences have been calibrated using survey data from the domain’s field.

Implementing these different decision modules, we tested the agents’ response to various climate change scenarios, including historical conditions and future projections for representative storylines. Preliminary results reveal notable differences in system dynamics and resilience across the behavioral models and risk aversion levels. These findings provide insights into the appropriateness of behavioral modeling tools for understanding agricultural decision-making under evolving climatic conditions.

How to cite: Gazzotti, P., Ricart, S., Gandolfi, C., and Castelletti, A.: Modeling heterogeneous farmers' response to climate change via agent-based simulation, EGU General Assembly 2024, Vienna, Austria, 14–19 Apr 2024, EGU24-11816, https://doi.org/10.5194/egusphere-egu24-11816, 2024.

EGU24-12542 | ECS | PICO | HS5.3.3 | Highlight

Too little or too dirty? Global modelling framework for analyses of sectoral water use responses under droughts and heatwaves 

Gabriel Antonio Cárdenas Belleza, L.P.H. (Rens) van Beek, Marc F.P. Bierkens, and Michelle T.H. van Vliet

Drought-heatwave events increase water use mainly for domestic and irrigation water use sectors (Cárdenas et al., 2023). Moreover, water quality deterioration caused by human activities is exacerbated by more frequent and longer-lasting extreme hydro-climatic events, such as droughts and heatwaves. These circumstances challenge the supply of water of suitable quality and increase the cross-sectoral competition forclean water.

Water use models are useful in estimating responses in water demand and use ‑in terms of consumption and withdrawals‑ of the main water use sectors (i.e., irrigation, livestock, domestic, energy and manufacturing); however, there are few water use models that account for both water quantity and quality dimensions simultaneously. The main objective of our research is to assess the cross-sectoral water deficit due to sectoral competition for limited clean water resources, explicitly considering water quantity and water quality requirements.

To address this objective a new sectoral water use model framework has been developed, that evaluates simultaneously water quantity and water quality requirements for the main water use sectors. This globally applicable model framework builds on the PCR-GLOBWB 2 hydrological model (Sutanudjaja et al, 2018) and DynQual v1.0 global surface water quality model (Jones et al, 2023), which simulates surface water temperature, salinity as indicated by total dissolved solids (TDS), organic pollution as indicated by biochemical oxygen demand (BOD), and pathogen pollution as indicated by faecal coliform (FC).

Preliminary results show that high salinity (TDS) is the predominant water quality constituent limiting water use for irrigation most of the year; while for the domestic sector it is organic pollution, particularly in regions with limited water treatment capacities. For such sectors, accounting for water quality requirements lead to substantial reductions in surface water withdrawals over the Conterminous United States when compared to results obtained from only water quantity-based models.

This modelling framework provides the basis for an integrated water scarcity assessment driven by changes in water quantity and quality under current and future droughts and heatwaves.

References

Cárdenas B., G.A., Bierkens, M.F.P., van Vliet, M.T.H.: Sectoral water use responses to droughts and heatwaves: analyses from local to global scales for 1990-2019. Environ. Res. Lett. 18 104008. https://doi.org/10.1088/1748-9326/acf82e, 2023.

Sutanudjaja, E. H., van Beek, L. P. H., de Jong, S. M., van Geer, F. C., and Bierkens, M. F. P.: Calibrating a large-extent high-resolution coupled groundwater-land surface model using soil moisture and discharge data, Water Resour. https://doi.org/10.5194/gmd-11-2429-2018, 2018.

Jones, E. R., Bierkens, M. F. P., Wanders, N., Sutanudjaja, E. H., van Beek, L. P. H., and van Vliet, M. T. H.: DynQual v1.0: a high-resolution global surface water quality model, Geosci. Model Dev., 16, 4481–4500, https://doi.org/10.5194/gmd-16-4481-2023, 2023.

How to cite: Cárdenas Belleza, G. A., van Beek, L. P. H. (., Bierkens, M. F. P., and van Vliet, M. T. H.: Too little or too dirty? Global modelling framework for analyses of sectoral water use responses under droughts and heatwaves, EGU General Assembly 2024, Vienna, Austria, 14–19 Apr 2024, EGU24-12542, https://doi.org/10.5194/egusphere-egu24-12542, 2024.

EGU24-13415 | PICO | HS5.3.3

Carbonate deposits from historical aqueducts in urban area: an archive for human impact on water management and quality 

Edwige Pons-Branchu, Philippe Branchu, Arnaud Dapoigny, Eric Douville, Emmanuel Dumont, Mathieu Fernandez, Alexino Progam, and Liliane Jean Soro

We have developed a methodology for constructing diachronic views of the chemical state of water that infiltrates soils and forms perched aquifers in the north and south of Paris (France). These waters have been drained for centuries and distributed by historic underground aqueducts. The CaCO3 layers deposited by these waters in the aqueducts have been studied.

The first challenge is to construct chronologies of these deposits, using uranium-thorium or 14C chronometers and/or lamina counting.

Past water quality has been reconstructed using trace elements measured along the growth axis of CaCO3 deposits, combined with isotope analysis (lead, sulfur and strontium) and, in some cases, carbon isotopes.

With this methodology, we demonstrate that in Paris, over the last 300 years, the transformation of land use is the most important factor affecting water quality, not only through the presence or absence of building industries, but also through the use of certain materials for construction or embankment. 

We use this methodology for the study of ancient aqueducts in archaeological sites to discuss water provenance and quality.

How to cite: Pons-Branchu, E., Branchu, P., Dapoigny, A., Douville, E., Dumont, E., Fernandez, M., Progam, A., and Jean Soro, L.: Carbonate deposits from historical aqueducts in urban area: an archive for human impact on water management and quality, EGU General Assembly 2024, Vienna, Austria, 14–19 Apr 2024, EGU24-13415, https://doi.org/10.5194/egusphere-egu24-13415, 2024.

EGU24-15100 | ECS | PICO | HS5.3.3

A comprehensive inventory of large hydropower systems in the Italian Alpine Region 

Soroush Zarghami Dastjerdi, Andrea Galletti, and Bruno Majone

The threat of climate change and water resource overexploitation to river network ecosystems and their natural flows is evident, particularly in mountainous regions where hydropower production is also responsible for significant alterations of the natural streamflow. Hydrological modeling in these watersheds is hindered by limited knowledge of technical and geometrical information. Key characteristics and parameters related to hydropower operating schedule and their hydraulic infrastructures are usually hard to obtain as they are mostly confidential data producers hold. Consequently, modeling hydropower systems over large domains often relies on simplified methods which may decrease the reliability of these studies. In response to these challenges, we created a comprehensive inventory designed to model the interaction between natural stream networks and hydropower-related infrastructures at the mesoscale. This inventory, tailored for the large hydropower systems in the northern mountainous region of Italy (Italian Alpine Region - IAR), includes detailed hydraulic parameters essential for the reliability of water-energy-nexus modeling implementations. The selected region includes over 300 large hydropower systems with complex infrastructures, among those, nearly 160 plants are reservoir-fed, causing a significant alteration in streamflow. To assess the reliability of the provided inventory, we employed HYPERstreamHS as the reference hydrological model. We assessed the accuracy of our designed inventory by comparing the modelled hydropower production with the finest observations available, which are province-aggregated monthly hydropower production data from 1995 to 2008. The outcomes revealed a commendable similarity ranging from 83% to 100% across simulated areas, with an overall average of 90%, solidly confirming the accuracy of the crafted inventory.

How to cite: Zarghami Dastjerdi, S., Galletti, A., and Majone, B.: A comprehensive inventory of large hydropower systems in the Italian Alpine Region, EGU General Assembly 2024, Vienna, Austria, 14–19 Apr 2024, EGU24-15100, https://doi.org/10.5194/egusphere-egu24-15100, 2024.

EGU24-214 | Orals | HS5.3.4

Impact of hydraulic conductivity on water quality and microbial ecology of rain gardens 

Vernon Phoenix, Erin Corbett, and Umer Ijaz

Rain gardens are a form of sustainable urban drainage which lower flood risk and reduce environmental contamination from stormwater.  A combination of processes including filtration, sedimentation and microbial metabolic processes work to remove contaminants from the stormwater.  In this study we examined the impact of hydraulic conductivity of raingarden soil on raingarden performance, exploring its impact on the removal of contaminants from the stormwater, as well as microbial community composition and function.  This was undertaken as part of a large scale project to install raingardens across the city centre of Glasgow, thus improving the city’s climate resilience.   The study utilized four raingardens fed real stormwater from a busy road.  All raingardens tested reduced contaminant concentrations in the stormwater, and reductions in contaminant concentrations were greatest when pollutant levels in the input water were higher.  Importantly, road salting in the winter did not cause dissolved metals to be released from the raingardens.  DNA was extracted from waters and soils for microbial community and function analysis using Illumina 16S sequencing and a bioinformatics suite.  A diverse community of bacteria capable of hydrocarbon degradation and metal resilience were found in stormwaters and raingarden soil.  Notably, the taxonomic evenness and overall diversity of the stormwater microbial community was increased as it passed through the raingarden. Furthermore, the raingarden soil displayed a greater functional richness compared to the input waters.  This demonstrates that the microbes in the raingardens can undertake a greater range of functions than those in the untreated stormwater, and highlights the importance of the raingarden bacteria in treatment of contaminants.   Microbial community composition and function showed little difference between rain gardens and PERMANOVA analysis identified that hydraulic conductivity had no significant impact on functional Beta diversity in the soil.  Overall, in this study, hydraulic conductivity did not appear to have a significant impact on microbial community composition, nor on the removal of contaminants by the raingarden, with all raingardens performing similarly well. 

How to cite: Phoenix, V., Corbett, E., and Ijaz, U.: Impact of hydraulic conductivity on water quality and microbial ecology of rain gardens, EGU General Assembly 2024, Vienna, Austria, 14–19 Apr 2024, EGU24-214, https://doi.org/10.5194/egusphere-egu24-214, 2024.

EGU24-607 | ECS | Orals | HS5.3.4

Ecosystem services supply-demand mismatches for urban heat mitigation  

Celina Aznarez, Sudeshna Kumar, Alba Márquez-Torres, Unai Pascual, and Francesc Baró

Urban areas, characterized by dense construction, often exhibit elevated land surface temperatures, leading to the formation of urban heat islands (UHIs). These UHIs pose significant environmental hazards, contributing to issues such as heat-related mortality, degraded air quality, and elevated heat stress on biodiversity and ecosystems. Moreover, the impact of UHIs is not uniformly distributed due to the heterogeneous nature of urban landscapes and socio-spatial inequities influencing factors like impervious surfaces and vegetation cover. Urban green infrastructure is increasingly valued as a nature-based solution to mitigate UHIs, offering essential ecosystem services (ES) like urban heat mitigation. To analyze the relationship between users' access and dependence on these benefits, we propose a modeling approach that integrates remote sensing, field, and socio-demographic data, along with Artificial Intelligence for Environment and Sustainability (ARIES) and GIS tools. This approach incorporates: i) indicators of UHI exposure and urban heat vulnerability indices; ii) spatial quantification of the supply and demand of urban green infrastructure related to ES for UHI mitigation; iii) spatially explicit (mis)matches of ES supply and demand balance and iv) coupled modelling. We applied it in the ‘green’ city of Vitoria-Gasteiz, in the Basque Country as a case study. Our findings evidence the unequal distribution of UHI burdens, with individuals vulnerable to heat experiencing disproportionate impacts, including higher exposure and limited access to temperature-regulating ES. This mismatch between the supply and demand of ES particularly affects disadvantaged communities. Conversely, areas associated with higher income levels indicate reduced vulnerability to heat. Incorporating environmental justice principles into UHI mitigation strategies is essential to ensure equitable outcomes for all residents. By considering the socio-spatial inequalities associated with supply-demand mismatches in ES and their impact on vulnerability to heat, our approach enables evidence-based decision-making and spatial prioritization to address the specific needs of vulnerable populations.

How to cite: Aznarez, C., Kumar, S., Márquez-Torres, A., Pascual, U., and Baró, F.: Ecosystem services supply-demand mismatches for urban heat mitigation , EGU General Assembly 2024, Vienna, Austria, 14–19 Apr 2024, EGU24-607, https://doi.org/10.5194/egusphere-egu24-607, 2024.

Most cities have climate goals such as lowering the Urban Heat Island (UHI) effect and reducing flood damages. Green infrastructure (GI) can help mitigate the UHI effects and has the potential to locally delay flood peaks. However, in dense urban infrastructure there is often little space for ground based vegetation. Green roofs are therefore a feasible implementation option even within city centres. While there is a myriad of types of green roofs available for flat roofs, and their performance is tested in various environments, sloped roofs as of yet have few design options available. To this end, Green Panels were developed as a novel type of GI for sloped roofs. As it is a novel design, its performance can be estimated only by literature results of GI applying different designs and materials. To overcome this research gap, in this case study a Green Panel prototype was constructed and its performance was monitored over a period of 3-4 months at the University of Twente, the Netherlands.

The experimental setup consisted of 1 m2 of Green Panels, and 1 m2 of regular roof tiles as control area, both at a slope of 45 degrees. The materials of the Green Panels, mounted on the same railing as solar panels, is High Density Polyethylene, while different substrates were tested: soil, rock wool, recycled fabric, and combinations thereof. Applied sensors were a soil moisture and temperature sensor (Truebner SMT50) and an environmental sensor (BME680), including a thermal sensor, both connected to Sensebox Mini dataloggers. The soil moisture sensors were placed in each of 6 Green Panel trays. The environmental sensors were placed above and below the roof tiles in both control and Green Panel locations, as well as above and below the Green Panels themselves. The measured parameters were air temperature, humidity, atmospheric pressure, VOC, soil temperature, and soil moisture. These values were compared to meteorological data from a local weather station at 5km distance. Other benefits such as increased biodiversity were not monitored, though species such as ladybug (family Coccinellidae) and fly (family Muscidae) were observed.

Analysis of the results shows that there is a small effect of Green Panels on reducing extreme temperatures, and errors in measurement setup and gaps in data continuity did not affect validity. The implications of this analysis were extrapolated to the urban scale for the city of Enschede to help answer what an appropriate performance monitoring scheme is for cities intending to implement GI and still uncertain about when their climate goals are being met.

How to cite: Vink, K.: Green Panel performance testing – Analysis from one season of monitoring data and implications for urban scale applications, EGU General Assembly 2024, Vienna, Austria, 14–19 Apr 2024, EGU24-1874, https://doi.org/10.5194/egusphere-egu24-1874, 2024.

EGU24-2833 | ECS | Posters on site | HS5.3.4 | Highlight

How do multilayer blue-green roofs affect the runoff water quality?  

Elena Cristiano, Alessandra Carucci, Martina Piredda, Emma Dessì, Salvatore Urru, Roberto Deidda, and Francesco Viola

To ensure a sustainable urban development, the large-scale implementation of green roofs and, more in general, of several nature-based solutions is an essential aspect to be considered. Thanks to their multiple benefits (e.g., pluvial flood mitigation, acoustic and thermal insulation of building, urban heat island reduction, air quality improvement, increase of biodiversity and additional aesthetic value) green roofs have been widely investigated. Among them, the multilayer blue-green roofs present an additional storage layer, that enables to accumulate the rainwater that percolates from the soil when it reaches saturation. This water can potentially be used for several domestic non-potable purposes, such as garden irrigation, street cleaning or flushing the toilets. To identify the possible rainwater reuse, it is fundamental to know the physical and chemical properties of this unconventional resource and evaluate whether they respect the regulations limits. Many studies investigated the effects of traditional green roofs on the runoff quality, without reaching a complete agreement. Moreover, the influence of the additional storage layer on the water quality has not been explored yet. In this context, the multilayer blue-green roof prototype installed at the University of Cagliari has been used as case study to analyze the quality of the outflow during three artificial and three natural rainfall events, comparing the runoff with the one obtained from a traditional roof. The prototype is constituted by 8 cm of soil (classified as sand) and 10 cm of storage layer, and it is characterized by Cactacee vegetation, that does not require additional irrigation or maintenance. For each artificial event, three samples every five minutes have been collected from both traditional roof and multilayer blue-green roof, to evaluate how the water quality varies during time. For the natural events only one sample has been collected as representative of the average quality of the accumulated water. The collected samples have been analyzed, evaluating temperature, pH, conductivity, total and volatile suspended solids, Chemical Oxygen Demand (COD), most common cations and anions and heavy metals concentrations. Results showed that suspended solids and heavy metal concentrations observed in the multilayer blue-green roof outflow are lower than by the traditional roofs, underlying the beneficial effects of this Nature-based solution. On the other hand, multilayer blue-green roof outflow presents high COD concentrations, caused by the accumulation of organic matter in the additional storage layer. Hence, the collected water can be used only for irrigation either of the multilayer blue-green roof itself or of gardens. It is important to notice that results obtained in this work are limited to one single soil (sand) and vegetation (Cactacee) type: the response with different vegetation, soil type and thickness, and fertilizer should also be investigated, as well as under different climatological conditions. 

How to cite: Cristiano, E., Carucci, A., Piredda, M., Dessì, E., Urru, S., Deidda, R., and Viola, F.: How do multilayer blue-green roofs affect the runoff water quality? , EGU General Assembly 2024, Vienna, Austria, 14–19 Apr 2024, EGU24-2833, https://doi.org/10.5194/egusphere-egu24-2833, 2024.

EGU24-4670 | Posters on site | HS5.3.4

Investigation on Flood Resistance Characteristics of Waterfront Plants: A Case Study of Baxi Stream in Fujian Province, China 

Jinn-Chyi Chen, Feng-Bin Li, Jian-Qiang Fan, Xi-Zhu Lai, Gui-Liang Li, and Wen-Sun Huang

Urban waterfront green spaces are pivotal in maintaining urban-rural landscape patterns, enhancing habitats and biodiversity, modulating temperature and humidity, purifying air, mitigating noise, and improving the urban microclimate. They play a crucial role in regulating the urban ecological environment and enhancing natural environmental capacity. Several waterfront plants demonstrate a high adaptability to local hydrological and climatic conditions, and are resilient to drastic water level changes. Their roots can stabilize riverbanks or riverbeds during abnormal floods. However, there is a dearth of empirical research data on these native plants. This study focuses on the flood that occurred on June 13, 2022, in Baxi Stream, Yong'an City, Fujian Province, China, causing damage to revetments, sidewalks, plants, roads, and disrupting urban traffic. Utilizing this flood event as a case study, we collected terrain data via real-time kinematic (RTK) surveying and unmanned aerial vehicles (UAV). We examined flood traces on structures, buildings, and trees to determine the water level, water surface slope, and inundation depth of waterfront green space during the flood event. We also investigated several common invasive natural plants, including Gramineae, Cyperaceae, and Polygonaceae families, and artificially cultivated plants like Cannaceae. Using the plant type survey data, we calculated the shear stress and flow velocity during the flood event to comprehend the anti-flow characteristics of waterfront plants in the study area. Our findings revealed that naturally invasive Gramineous plants, such as Saccharum spontaneum L. and Phragmites australis, possess a high flood resilience, withstanding  mean flow velocity exceeding 5m/s. This study can provide a valuable reference for the selection of greening plants for waterfronts or plant engineering methods to safeguard waterfronts or riverbeds.

How to cite: Chen, J.-C., Li, F.-B., Fan, J.-Q., Lai, X.-Z., Li, G.-L., and Huang, W.-S.: Investigation on Flood Resistance Characteristics of Waterfront Plants: A Case Study of Baxi Stream in Fujian Province, China, EGU General Assembly 2024, Vienna, Austria, 14–19 Apr 2024, EGU24-4670, https://doi.org/10.5194/egusphere-egu24-4670, 2024.

EGU24-5209 | Posters on site | HS5.3.4

Retention capacity and thermal properties of a multilayer blue-green roof in Sardinia: two years of monitoring 

Francesco Viola, Elena Cristiano, Salvatore Urru, and Roberto Deidda

Many different nature-based solutions have been proposed in the literature to contribute to the sustainable development of the urban environment. Among them, multilayer blue-green roofs are becoming more and more popular, thanks to their multiple benefits. As traditional green roofs, the multilayer ones guarantee high retention capacity during rainfall events, contributing to the pluvial flood mitigation. Thanks to the additional storage layer, not only the mitigation capacity is increased, but there is the possibility to store the collected water, and reused it for some urban purposes, such as garden irrigation. Moreover, these nature-based solutions ensure thermal insultation for the underneath buildings and they help lowering the air temperature, contributing to the mitigation of the urban heat island effects.  Finally, they improve the air quality, promote the biodiversity, and increase the aesthetic value of the overall city. In June 2019, a multilayer blue-green roof prototype has been installed at the university of Cagliari, and subsequently equipped with multiple sensors to monitor and evaluate the ecohydrological and thermal dynamics. The multilayer blue-green roof, with a surface of 16 m2, presents an 8 cm layer of soil, classified as sand, and a 10 cm additional storage layer. It is characterized by Cactaceae vegetation, which shows resistance to the high temperature and low water availability and does not require additional maintenance. The prototype has been equipped with a Smart Mill, that beside opening and closing of the valve to control the storage layer, enables to measure climatological variables, such as rainfall, air temperature and wind speed, and the water level in the additional layer. Four HOBO thermometers have been installed to measure the temperature in the soil, underneath the structure and on the lateral side. Two soil moisture sensors have been placed at opposite sides of the multilayer blue-green roof. Finally, a tank with a sensor to measure the water level have been collocated at the valve opening, to measure the outflow from the additional storage layer. The collected data have been used to model the ecohydrological and thermal dynamics, with the aim to quantify the potential benefits in terms of pluvial flood mitigation and thermal insulation. Results, collected during two full years of monitoring the prototype in Cagliari, are discussed, highlighting the potential benefits of a large-scale installation for the sustainable development of urban areas.

How to cite: Viola, F., Cristiano, E., Urru, S., and Deidda, R.: Retention capacity and thermal properties of a multilayer blue-green roof in Sardinia: two years of monitoring, EGU General Assembly 2024, Vienna, Austria, 14–19 Apr 2024, EGU24-5209, https://doi.org/10.5194/egusphere-egu24-5209, 2024.

EGU24-5811 | ECS | Posters on site | HS5.3.4

Understanding Soil Characteristics and Hydrology to Optimise FloodWall®: Another Step Towards Effective Green Infrastructure 

Devakunjari Vadibeler, Joseph Holden, Fleur Loveridge, Andrew Sleigh, and Gerbren Haaksma

With rising urbanisation and environmental concerns, green infrastructure has become increasingly used to address a range of environmental issues, including flood hazards. By incorporating green infrastructure into their innovation strategies, cities may achieve a better balance between development and environmental conservation. In accordance with these global initiatives, Andel Ltd.’s FloodWall® stands out as an affordable, green substitute for perimeter flood defence made primarily of non-porous, post-industrial plastic waste, reinforced at the posts with steel pipes for added durability. This flood defence system, made from recycled materials and powered by renewable energy, can be installed in new constructions, existing buildings, and commercial settings. With the goal to maximise the potential of FloodWall® as a sustainable flood defence system, a collaborative effort has been made to develop specific site investigation methods to better understand the local soil hydrology and other characteristics that will control excess water flow beneath the wall and hence determine its effectiveness. Integrated methods are used including analysing geographic information system (GIS) data alongside in-situ and controlled laboratory findings to improve the efficiency of FloodWall® while cutting down its cost. For such green infrastructure solutions to be effectively and successfully implemented, a thorough understanding of site-specific soil properties such as permeability, soil water holding capacity, and the precise location of underground water pipelines and electrical equipment is vital. Accurate temporal and geographical soil hydraulic data are also critically needed for strategic management and accurate flood predictions. Precise soil moisture change measurements across larger areas can be difficult due to the dynamic nature of soil moisture levels. Although AI tools have a lot of potential in tackling this issue, the effectiveness of this approach is restricted by data availability.  As a result, it is critical to prioritise localised research and modelling to maximise flood defence design, reliability, and cost. The main objective of this study is to determine an efficient evidence-based workflow that enables key decisions on how to implement installation of sustainable and cost-effective flood walls around properties in locations where public or private funding for community defences are not viable. Our study uses (i) analysis of satellite imagery, (ii) controlled laboratory experiments, (iii) in-situ analysis using cutting-edge sensors, and (iv) appropriate machine learning (ML) and artificial intelligence (AI) techniques to investigate site-specific soil hydraulic properties. Data feeds a suitable numerical model to estimate soil water flow and water seepage beneath flood defence structures. With this integrated approach, environmental stakeholders and flood researchers are provided with extensive site-specific data as well as comprehensive reports that will allow well-informed decisions regarding the implementation of sustainable flood defence technologies in cities, with a particular focus on the FloodWall®.

How to cite: Vadibeler, D., Holden, J., Loveridge, F., Sleigh, A., and Haaksma, G.: Understanding Soil Characteristics and Hydrology to Optimise FloodWall®: Another Step Towards Effective Green Infrastructure, EGU General Assembly 2024, Vienna, Austria, 14–19 Apr 2024, EGU24-5811, https://doi.org/10.5194/egusphere-egu24-5811, 2024.

EGU24-7564 | ECS | Posters on site | HS5.3.4

Evaluation of the Performance of Green Roof Substrates with Recycled Materials: A Three-Year Comparative Study 

Barbora Rybova, Marek Petreje, Petra Heckova, and Michal Snehota

The aim of this study was to test newly developed green roof substrates with a significant content of recycled materials under real conditions and to compare them with a commercially available substrate.

A two-layer extensive green roof of 7×5 m2 was constructed in 2020 and divided into four sections, two of which had top layers based on new substrates. These two substrates contained the same amount of crushed brick from demolition waste (37.5% by volume) but differed in the amount of pyrolyzed sewage sludge biochar (9.5% by volume in one and none in the other). The commercial substrate was mostly based on expanded shale, lava, and pumice. Hydrophilic mineral wool was used as the bottom layer of the green roof system to improve the water retention layer. Vegetation was established with sedum carpets.

Undisturbed substrate samples were taken in 2021, 2022 and 2023 to monitor changes in hydrophysical properties (retention curves, saturated hydraulic conductivity, grain size). At the same time, vegetation development over time was monitored visually, and substrate temperature and humidity were continuously measured by autonomous sensors.

Plants in the biochar and demolition debris plots rooted faster into the substrate and achieved higher cover. While plants in plots with commercial substrate or without biochar turned red in response to stress during periods of lower rainfall or more extreme temperatures, plants in the biochar-containing plot remained lush green longer. In the following year, a greater number of emergent plants (primarily grasses) that spread from the surrounding area were observed on the biochar-amended substrate. This was thought to be due to the increased availability of nutrients from biochar.

Surface temperature amplitudes were higher than substrate and mineral wool temperatures, locally influenced by the plant biomass surrounding the sensors. Temperatures of the substrate and hydrophilic mineral wool were more stable. Differences in substrate temperatures were observed particularly between substrates containing recycled materials and the commercially available substrate.

How to cite: Rybova, B., Petreje, M., Heckova, P., and Snehota, M.: Evaluation of the Performance of Green Roof Substrates with Recycled Materials: A Three-Year Comparative Study, EGU General Assembly 2024, Vienna, Austria, 14–19 Apr 2024, EGU24-7564, https://doi.org/10.5194/egusphere-egu24-7564, 2024.

EGU24-9959 | Orals | HS5.3.4

Modelling the environmental impact of combined urban drainage systems with a lumped hydrological approach 

Roberto Greco, Alessandro Farina, and Rudy Gargano

The management of combined urban drainage systems is a complex task, as it requires detailed knowledge about precipitation regime, hydrological features of the catchment, hydraulic characteristics of the drainage network, and information about the water use by the served inhabitants. Heavy semi-distributed hydrological and physically based hydraulic models are used for network conduits design. However, in many management problems, the knowledge of the hydraulic flow characteristics in all the conduits is not required, and the uncertainty of the available information hampers the use of complex hydrological models. Hence, simple models with few parameters and small computational effort may be preferable, especially for management and planning problems requiring the execution of many simulations.

In this study, a novel approach is proposed for the definition of effective lumped simplified models of urban drainage systems, the parameters of which can be estimated directly from cartographic information. For several case studies, the hydrographs predicted by lumped simplified models result close to those obtained with semi-distributed models in SWMM. The results show that robust relationships linking lumped model parameters with morphological and topological characteristics of the urban catchment can be established (Farina et al., 2023).

The proposed lumped modelling approach is applied to carry out a sensitivity analysis of the effects of parameters characterizing climate, urban catchment, and overflow discharge device, on several indicators of the environmental impact of combined sewer overflows (CSO) (Farina et al., 2024). In fact, pollution from CSO is still not satisfactorily addressed by current management practices and regulations, usually setting a dilution threshold for the discharged overflow, and enforcing limitations to the number of overflow activations per year. The sensitivity analysis indicates that the percentage of impervious surface of the catchment is the most influent parameter on all the indicators, and its reduction can effectively contain the yearly discharged pollutant mass. The overflow activation threshold, instead, results the second least influent parameter, suggesting that its regulation alone would not be a suitable strategy to control CSO pollution. The results also indicate that neither sustainable urban drainage practices, nor interventions on the CSO device, significantly affect the frequency of the overflows, which is indeed controlled by the local precipitation regime. Furthermore, the yearly discharged pollutant mass and the mean concentration of pollutants in the overflow result independent on the overflow activation frequency. Hence, the regulation of this latter does not seem a suitable means to reduce the environmental impact of combined urban drainage systems.

References.

Farina, A., Di Nardo, A., Gargano, R., van der Werf J.A. & Greco, R. (2023). A simplified approach for the hydrological simulation of urban drainage systems with SWMM. Journal of Hydrology, 623, 129757.

Farina, A., Gargano, R., & Greco, R. (2024). Effects of urban catchment characteristics on combined sewer overflows. Environmental Research, 244, 117945.

How to cite: Greco, R., Farina, A., and Gargano, R.: Modelling the environmental impact of combined urban drainage systems with a lumped hydrological approach, EGU General Assembly 2024, Vienna, Austria, 14–19 Apr 2024, EGU24-9959, https://doi.org/10.5194/egusphere-egu24-9959, 2024.

EGU24-9991 | ECS | Posters on site | HS5.3.4

Study of Filtralite Depletion and pH Influence on Nickel Removal 

Marlon Mederos, Concepción Pla, and Javier Valdes-Abellan

This work delves into the efficiency of Filtralite in managing Sustainable Urban Drainage Systems (SUDS) for nickel (Ni) removal from urban runoff water. It addresses the optimization of green infrastructure in relation to water pollution and public health, due to the toxicity of heavy metals in general and Ni in particular, and their potential accumulation in living organisms (Ricco et al., 2015). The study's relevance lies in the growing need for innovative and sustainable solutions in urban water management, particularly in semi-arid and urbanized areas where runoff carries heavy metals into water sources (Wang et al., 2017).

The experimental procedure was carried out using flow tests in 10 cm-length columns filled with Filtralite. This porous medium has proven effective in removing heavy metals, including Ni (Pla et al., 2021b) jointly with the requirement of a high hydraulic conductivity. A Ni pulse was introduced into the column and the breakthrough curve was continually monitored at the outflow. The laboratory experiment is underpinned by a numerical model in HYDRUS-PHREEQC-1D (HP1), incorporating three Ni removal processes: Dispersion, Chemical Precipitation, and Adsorption, achieving a determination coefficient (R2) of 98%. With the calibrated HP1 model, it is feasible to analyze the impact of pH as a key element in metal removal.

The interaction between the contaminated solution and Filtralite leads to a rapid and noticeable increase in the solution’s pH. Ni solubility is highly dependent on pH (Amiri & Nakhaei, 2021); an increase in pH causes the Saturation Index of Ni to decrease, thereby facilitating its precipitation as hydroxide. The results demonstrated that the final concentration of the pollutant directly depends on pH values, with the lowest concentrations occurring at the highest pH (Pla et al., 2021a).

Laboratory tests were conducted to analyze Filtralite's wear over time in its capacity to modify the pH of the circulating water. Distilled water circulated for 100 days in continuous flow. When Ni was injected at two different pH levels, 9.27 and 8.28, removal efficiencies of 94% and 47% were observed, respectively. This confirms the relationship between pH and pre-removal efficiency, underscoring the importance of pH control for process effectiveness. Representing Filtralite's depletion over time, a gradual decrease in pH is observed as water circulates. Polynomial adjustments with an R2 of 93% help to determine the relationship between pH, time, and flow rate.

This finding is significant for SUDS design, which aims not only for water regeneration but also for the reduction of metal pollution (Ghadim and Hin, 2017). The research underscores the importance of green infrastructure in managing urban risks, demonstrating how nature-based solutions can effectively mitigate complex environmental challenges. The Filtralite study provides a firm foundation for integrating these systems into a broader urban risk management framework, aligned with green infrastructure and sustainability guidelines.

How to cite: Mederos, M., Pla, C., and Valdes-Abellan, J.: Study of Filtralite Depletion and pH Influence on Nickel Removal, EGU General Assembly 2024, Vienna, Austria, 14–19 Apr 2024, EGU24-9991, https://doi.org/10.5194/egusphere-egu24-9991, 2024.

Urban waterlogging has become a frequent and threatening issue in recent years due to rapid urbanization and extreme weather conditions, resulting in economic losses and health hazards. In this context, green roofs (GRs) emerge as a sustainable and innovative solution to mitigate these issues by absorbing rainfall, reducing runoff, and enhancing urban biodiversity. Despite the apparent benefits, the adoption of GRs remains limited, largely due to a lack of quantitative understanding of the factors that influence urban residents' GR adoption willingness.

This study aims to fill this knowledge gap via a survey approach, and distribute and collect survey responses from 999 residents in Shenzhen, a rapidly developing coastal city in China. The survey is designed to capture a range of variables that may influence residents' decision-making regarding GR adoption, including demographic information, housing characteristics, waterlogging experiences, roof utilization preference, knowledge of and preference for GR, and willingness to adopt GR. The GR adoption willingness is collected assuming two policy scenarios, one with government subsidy and the other without. By leveraging a machine learning model for data analysis, the study identifies five key predictors that commonly influence GR adoption willingness with and without subsidy: recognition of the advantages of GRs (GR_advantage), whether a resident lives on the top floor (Top_floor), the degree of concern about GRs (GR_concern), the duration of waterlogging experienced in and around the community (WL_time), and the individual's level of education (Education). Interestingly, the study also reveals that GR adoption willingness is affected differently under scenarios with and without policy incentives. In the absence of subsidies, the property fee (Pro_fee) is a significant factor; conversely, when policy incentives are present, age and house ownership (House_own) emerge as influential factors.

The complexity of these influencing factors is further evaluated using the SHAP (SHapley Additive explanation) model, which provides a nuanced interpretation of how these factors interact and exert nonlinear impacts on residents' willingness to adopt GRs. The insights derived from this analysis are critical for policymakers and urban planners who are looking to promote GRs as part of an integrated urban water management strategy. Specifically, a combination of long-term subsidies and one-time subsidies can be combined to motivate residential adoption. Recognizing the general unfamiliarity with GRs and related policies among residents, relevant outreach and education programs are essential. In addition, targeted subsidy levels could be helpful in stimulating more GR adoptions. An important consideration in this targeting process is the frequency of waterlogging events, which has been shown to significantly influence residents' willingness to pay for GRs.


How to cite: Yang, P. and Wu, J.: An analysis to interpret the heterogeneous resident's willingness to pay for green roofs to improve the understanding of decision heterogeneity, EGU General Assembly 2024, Vienna, Austria, 14–19 Apr 2024, EGU24-11013, https://doi.org/10.5194/egusphere-egu24-11013, 2024.

Groundwater, as the predominant freshwater resource globally, faces a growing scarcity challenge amid the rising global population, making it a critical resource in developing nations. Understanding the key factors influencing groundwater availability under current climatic and human-driven conditions is vital for achieving the sustainable development goals (SDGs). In regions like Assam's shallow alluvial aquifers, located in northeastern India along the flood-prone Brahmaputra River and the Himalayan foothills, the quality of groundwater is of paramount concern for managing its extraction and recharge. Despite its huge water potential, the region accounts for some of the most water-stressed pockets of the country, emphasising the need for thorough groundwater resource assessment for effective protection and management. The present study delves into the high vulnerability of groundwater in Assam due to both natural hydrogeological conditions and human-induced factors using geospatial models. Utilising DRASTIC and Risk Index (RI) models, we discovered that shallow groundwater tables and alluvial deposits are particularly susceptible to adverse effects from unplanned changes in land use and land cover (LULC). The findings indicate a significant correlation between urban-induced LULC changes and groundwater quality deterioration. This highlights the likelihood of industrial and domestic pollutants seeping from the soil into the underground aquifers, thus elevating the vulnerability of groundwater. To remediate the non-biodegradable and persistent heavy metal contaminants exposed to the soil from LULC activities, we propose a Nature-based Solution (NbS): phytoremediation using Chrysopogon zizanioides (vetiver grass). Laboratory-controlled experiments were conducted for two months with initial metal concentrations of lead (Pb), cadmium (Cd), and zinc (Zn) at 500 mg/kg. Results from the atomic absorption spectrometer showed selective metal absorption by the plants. The highest extraction capacity observed was 43% for Zn in the plant shoots, likely due to its role in plant metabolism, while 31% Cd and 35% Pb were removed. The study notes phytotoxicity signs, such as leaf chlorosis and shedding, indicating the plant's response to metal stress. However, with survival rates over 50%, the vetiver grass demonstrates significant metal tolerance. By integrating geospatial vulnerability assessment with the ecological technique of phytoremediation, this research presents a comprehensive strategy to enhance groundwater resilience. It showcases the efficacy of vetiver grass in developing green infrastructure solutions, offering a scalable and eco-friendly approach to mitigate soil and groundwater contamination. This study provides valuable insights for environmental policymakers and advocates, promoting sustainable NbS practices for regions facing similar challenges in groundwater management.

Keywords: Groundwater, LULC, Vulnerability, Phytoremediation, Heavy Metals, Vetiver Grass

How to cite: Deka, D., Ravi, K., and Nair, A. M.: Phytoremediation for mitigating soil heavy metal contamination: A strategic approach to enhance groundwater resilience in vulnerable shallow aquifer systems , EGU General Assembly 2024, Vienna, Austria, 14–19 Apr 2024, EGU24-11423, https://doi.org/10.5194/egusphere-egu24-11423, 2024.

EGU24-13624 | ECS | Orals | HS5.3.4

Role of Vegetation in mitigating urban heat risk in Twelve American Cities - Applying the ARIES Modelling Approach 

Sudeshna Kumar, Alba Marquez, Celina Aznarez, G Darrel Jenerette, Marco Bidoia, Peter C Ibsen, Ken Bagstad, Stefano Balbi, and Ferdinando Villa

The anthropogenic urban realm exacerbates surface urban heat island (UHI) effects, triggering health hazards, such as mortality attributable to heat exposure in cities. The study makes a concerted effort to unravel the complex interplay between various spatial, quantitative, and qualitative attributes of vegetation, aiming to comprehend its pivotal role in mitigating urban heat risks within urban environments. The UHI risk is related to land surface temperature (LST). The study models UHI risk in twelve American cities in diverse Köppen-Geiger Climate zones spanning the contiguous USA. To address this, the Integrated Modelling approach by the ARtificial Intelligence for Environment & Sustainability (ARIES) initiative has been adopted in the study. This approach based on FAIR (Findable, Accessible, Interoperable, and Reusable) principles is accessible at https://aries.integratedmodelling.org/. Utilizing the k.LAB software with semantic reasoning our modeling approach assesses the UHI risk. It maps the spatial distribution of UHI considering hotspots of anthropogenic heat, vegetation, land cover, and land surface temperature. UHI risk is assessed at a resolution of 30 meters alongside census tract-level data using an ordered weighted approach. The study found variations in the relationship between greenness, as indicated by the Normalized Difference Vegetation Index (NDVI), and Land Surface Temperature (LST) across 12 different cities. The findings highlight the cooling effect of the water bodies, especially in areas near the port and green spaces. Linear parks such as roadside tree plantations typically feature uniform tree species and often lack smaller trees and shrubs, making them susceptible to heat infiltration from surrounding areas and resulting in a lesser overall temperature reduction. It identifies at least 30 percent of census tracts across 12 cities necessitate urban greening intervention. The study provides scientific insight into the cooling effects of urban parks, offering valuable guidance for urban planning and aiding decision-makers in addressing the UHI effect and enhancing overall urban sustainability. The study also underscores the significance of open science in developing environmental models addressing global sustainability challenges concerning the pressing issue of assessing urban climate risks. Models and scientific artifacts often face challenges in reusability, transferability, and sharing across diverse programming languages or modeling systems, revealing a significant lack of interoperability. By delving into the factors of LAI, NDVI, and Landscape Shape Index (LSI), the study aims to enhance understanding of the role of vegetation in ameliorating the adverse effects associated with UHI, thus paving the way for more effective urban heat management strategies. 


How to cite: Kumar, S., Marquez, A., Aznarez, C., Jenerette, G. D., Bidoia, M., Ibsen, P. C., Bagstad, K., Balbi, S., and Villa, F.: Role of Vegetation in mitigating urban heat risk in Twelve American Cities - Applying the ARIES Modelling Approach, EGU General Assembly 2024, Vienna, Austria, 14–19 Apr 2024, EGU24-13624, https://doi.org/10.5194/egusphere-egu24-13624, 2024.

EGU24-14278 | ECS | Posters on site | HS5.3.4

Sensitivity Analysis of Bioretention Cells for Stormwater Management: A Study in Secondary Cities of India 

Indra Mani Tripathi and Pranab Kumar Mohapatra

The present study conducts a comprehensive sensitivity analysis of bioretention cells, a green stormwater management infrastructure, in the context of urban stormwater systems in secondary cities of India (Bhopal and Kozhikode). The research aims to enhance our understanding of the performance and effectiveness of bioretention cells in mitigating the impacts of urbanization on stormwater runoff. Utilizing the Storm Water Management Model (SWMM), the study employs a systematic approach to assess the sensitivity of bioretention cells to various design and environmental parameters. The initial screening of diverse design parameters is performed using the one-factor-at-a-time (OAT) sensitivity analysis method. Subsequently, pivotal parameters, namely, conductivity, berm height, vegetation volume, suction head, porosity, wilting point, and soil thickness, are identified for further sensitivity analysis. Around 500 randomly and uniformly distributed samples for each sensitive design parameter are simulated using a Python wrapper for the Storm Water Management Model (PySWMM). These simulations are conducted under varying design storm scenarios. This research contributes valuable insights into the optimal design and configuration of bioretention cells tailored to the specific challenges posed by stormwater in secondary cities of India. By systematically analyzing the sensitivity of these green infrastructure elements, the study aims to inform urban planners, engineers, and policymakers about effective stormwater management strategies.

How to cite: Tripathi, I. M. and Mohapatra, P. K.: Sensitivity Analysis of Bioretention Cells for Stormwater Management: A Study in Secondary Cities of India, EGU General Assembly 2024, Vienna, Austria, 14–19 Apr 2024, EGU24-14278, https://doi.org/10.5194/egusphere-egu24-14278, 2024.

EGU24-14353 | Posters on site | HS5.3.4

Radiation budget and surface energy balance of green roofs using flux profile method 

Yongwon Seo and Woo Chang Jeong

One of the primary advantages offered by a green roof is its ability to regulate indoor temperatures more effectively in response to changing outdoor temperatures, in contrast to a traditional concrete roof on a building. This advantage aids in decreasing the amount of energy needed to cool the building during warm seasons and heat it in colder seasons. This investigation gathered data from four recently constructed detached buildings: one with a bare concrete roof, another with a highly reflective paint roof, and two with green roofs. The focus was on examining the complete radiation budget and surface energy balance of green roofs compared to other roof types during a summer season in Korea. The thorough data collected allowed for a quantitative assessment of how green roofs behave in terms of energy balance, particularly when compared to bare concrete roofs. The monitoring period for this study took place over a week, from July 21, 2021, to July 28, 2021. Results indicated that, on average, green roofs reduced the maximum indoor temperature by 6.83℃ compared to buildings with bare concrete roofs, potentially resulting in significant energy savings required for cooling. Additionally, the analysis of energy balance using the flux profile method highlighted the significance of the difference in ground heat flux in determining indoor building temperature. The findings also revealed that green roofs utilized a substantial portion of net radiation for latent heat flux (70.7%), but a minimal amount for ground heat flux (0.5%). Conversely, bare concrete roofs used a larger portion of net radiation for ground heat flux (16.2%) and sensible heat flux (45.3%), resulting in greater warming of both indoor building areas and the air near the surface. These outcomes illustrate that green roofs not only stabilize indoor temperature fluctuations but also directly assist in mitigating the heat island effect.

How to cite: Seo, Y. and Jeong, W. C.: Radiation budget and surface energy balance of green roofs using flux profile method, EGU General Assembly 2024, Vienna, Austria, 14–19 Apr 2024, EGU24-14353, https://doi.org/10.5194/egusphere-egu24-14353, 2024.

EGU24-15236 | ECS | Posters on site | HS5.3.4

Balancing Urban Heat, Flood and Water Scarcity: Blue-Green Infrastructure in Alpine Cities  

Lisa Ambrosi, Manfred Kleidorfer, Thomas Einfalt, Yannick Back, Alrun Jasper-Tönnies, Claudia Fennig, Martina Hauser, Fabian Funke, and Georg Leitinger

In Alpine cities, water management needs to be adapted to the challenges of climate change, including altering temperature and precipitation patterns. Blue-green infrastructure (i.e., the combination of nature-based and technical solutions) can help to improve the water and energy balance, to increase the evaporative cooling effect, to maintain sufficient soil water availability and to reduce runoff peaks. Thus, it can reduce the risks of heat, drought and flooding, and improve the overall quality of life in cities. The implementation of blue-green infrastructure requires an interdisciplinary approach, as mechanisms of urban water management and ecohydrology (i.e., energy balance and soil-plant-atmosphere continuum) must be optimized with regard to the common goal.

In the research project 'BlueGreenCities', ecological and technical disciplines are integrated to close knowledge gaps regarding (1) land-atmosphere interactions in ecological, hydrological and meteorological systems, and (2) the performance of blue-green adaptation measures under different climate scenarios in alpine urban areas. We present first results of measurement campaigns and eco-hydrological modelling to better understand the energy budget of various green spaces in the city of Innsbruck, Austria. Moreover, we give first insights if the specialty of the alpine setting (increasing summer droughts, but still cold winter temperatures) will be a chance or a burden for the current urban vegetation in the future.

The outcomes of our project underpin the importance of climate-friendly and future-proof planning of urban green spaces to ensure proper functioning of the blue-green infrastructure concept. The results support scientists as well as urban planners, land developers and policy stakeholders in decision-making for sustainable and flexible water management systems that maintain human well-being, economic development and environmental protection. This work is funded by the Austrian Climate and Energy Fund in the project BlueGreenCities (Project No. KR21KB0K00001), funding period: October 2022 until September 2025.

How to cite: Ambrosi, L., Kleidorfer, M., Einfalt, T., Back, Y., Jasper-Tönnies, A., Fennig, C., Hauser, M., Funke, F., and Leitinger, G.: Balancing Urban Heat, Flood and Water Scarcity: Blue-Green Infrastructure in Alpine Cities , EGU General Assembly 2024, Vienna, Austria, 14–19 Apr 2024, EGU24-15236, https://doi.org/10.5194/egusphere-egu24-15236, 2024.

Climate adaptation and climate change prevention have become essential aspects of city planning. Urbanization and changing climatic conditions pose a threat to the sustainability of cities, and excess stormwater exacerbates these challenges by causing flooding and pollution of the receiving water bodies. To address these issues, cities must enhance the sustainability and climate resilience of their stormwater management systems. Nature-Based Solutions (NBS) offer a sustainable alternative to traditional grey infrastructure by providing water retention, detention, and pollutant reduction capabilities. Despite their numerous benefits, the adoption of NBS lags behind, with conventional solutions often being favored. Effective policy measures are crucial for promoting the integration of NBS into urban water management systems and aligning them with overall sustainability goals.

This study uses multilevel analysis that begins with an examination of EU policies and national legislation to understand the regulatory landscape. The focus then shifts to local stormwater regulation practices, which are explored through interviews with stormwater experts from various cities. These interviews provide insights into the practicalities, functionality, and shortcomings of stormwater regulation practices. Finally, this study focuses on Turku, analyzing the impact of the Blue-Green Index (BGI), which has been used to direct new constructions to use Green Infrastructure and NBS. The analysis of Turku's construction plans serves as a real-world case study to evaluate the actual effects of BGI on NBS implementation.

This research adds to the academic conversation by examining the complex relationship between regulatory measures and the practical application of Nature-Based Solutions (NBS) in urban water management. By analyzing decision-making processes at various levels, this study offers detailed insights into the difficulties and potential opportunities associated with promoting environmentally sustainable water solutions in cities. The findings of this research have significant implications for policymakers, urban planners, and environmental practitioners and could help inform strategies that encourage the adoption of NBS and create more resilient and sustainable urban water management systems.

How to cite: Saarinen, A., Leskinen, P., Reini, A., and Kasvi, E.: Examining the Impact of Regulatory Measures on the Implementation of Nature-Based Solutions in Urban Water Management: Insights from Finland, EGU General Assembly 2024, Vienna, Austria, 14–19 Apr 2024, EGU24-16057, https://doi.org/10.5194/egusphere-egu24-16057, 2024.

EGU24-16239 | ECS | Orals | HS5.3.4

Nature-based solution enhances resilience to saturation excess flooding in coastal cities in the Global South 

Emmanuel Dubois, Saleck Moulaye Ahmed Cherif, Montana Marshall, Mohamed Mahmoud Abidine, Charlotte Grossiord, and Paolo Perona

Coastal cities are facing a rise in groundwater levels induced by sea level rise, further triggering saturation excess flooding where groundwater levels reach the topographic surface or reduce the storage capacity of the soil, thus putting stress on the existing infrastructure. Lowering groundwater levels is therefore a priority for sustaining the long-term livelihood and resilience of coastal cities. This project discusses the feasibility of using tree-planting as a Nature-based solution to alleviate saturation excess flooding as a result of rising groundwater levels in coastal cities in the Global South. In environments with shallow groundwater, trees uptake groundwater by intercepting water that percolates in the unsaturated zone or reduce groundwater recharge by canopy interception of rainwater. These contributions, in turn, lower groundwater levels and increase the unsaturated zone thickness, further mitigating the risk of saturation excess flooding. A case study was conducted in Nouakchott City (Mauritania) where rising groundwater levels has led to permanent saturation excess flooding for more than a decade, making parts of the city inhabitable and posing long-term health threats. Consequently, this work presents an interdisciplinary approach using both ecohydrogeology and plant physiology to model the dewatering capacity of five local tree species. These species were selected based on their tolerance to the exceptionally challenging conditions for vegetation posed by the hot desert climate and the shallow and brackish groundwater table. Preliminary results from a 3D groundwater model indicate that a city-scale tree-planting program could induce a groundwater drawdown of up to 70 cm within a 40-year horizon. Thus, a tree-planting program is anticipated to lower the groundwater levels, thereby reducing flooding during the wet season. Tree-planting programs constitute long-term solutions, sustained by environmental factors, that complement conventional engineering solutions. The multi benefits of such Nature-based solutions, as well as the expected positive environmental, economic, and social outcomes, makes them particularly promising for alleviation of saturation excess flooding.

How to cite: Dubois, E., Cherif, S. M. A., Marshall, M., Abidine, M. M., Grossiord, C., and Perona, P.: Nature-based solution enhances resilience to saturation excess flooding in coastal cities in the Global South, EGU General Assembly 2024, Vienna, Austria, 14–19 Apr 2024, EGU24-16239, https://doi.org/10.5194/egusphere-egu24-16239, 2024.

The concept of water-sensitive cities continues to gain traction globally, as the disruptive effects of urbanisation on local hydrological processes and the potential benefits of green infrastructure become increasingly evident. Despite this, in many planning instances, consideration is only given to how the water balance will be altered and hazard risk reduced from the current urbanised state to the state after implementation of green infrastructure. Why is the understanding of the natural water balance in the pre-urbanisation state often not considered as reference point for planning? If urban green infrastructure should provide hydrological and ecosystem services, should these services be similar to those in the natural condition before urbanisation?

For our study, we recreated the daily near-natural water balance for the city of Hamburg to quantify how urbanisation has already affected the water balance, particularly in years of hydrological extremes that represent hydrological hazards. Using the fully-distributed daily water balance model mGROWA, we developed two very high resolution (25 m) models for the city of Hamburg for 1991–2020; one representing the current hydrological situation and one representing a theoretical near-natural situation. To generate the near-natural scenario, the input datasets for topography, soil and land cover were adjusted through the integration of various datasets representing non-anthropogenic conditions, while sealed surfaces and artificially drained areas were removed from the datasets. As expected, due to the lack of runoff from sealed surfaces the actual evapotranspiration is much higher (+40%) in the near-natural scenario than in the current one. Groundwater recharge was also higher in the near-natural scenario (+27%), mainly due to the lack of surface sealing. We then compared the water balance components for the two models against the SPEI meteorological drought index to assess differences in the extremely wet and extremely dry periods that represent potential hydrological hazards. This revealed an increasing divergence in some water balance components between the scenarios for the extreme conditions, quantifying the extent to which the urbanisation of the city has exacerbated hydrological hazard risks. Our study presents a transferable methodology for assessing how urbanisation has affected the natural water balance of a region, which can be used as a starting point for defining targeted solutions for green infrastructure, with the aim of achieving water-sensitive cities.

How to cite: McNamara, I., Wolters, T., Schröder, M., Wotha, N., and Wendland, F.: How has urbanisation already altered a city’s natural water balance? The case study of Hamburg to present a commonly missing step before considering green infrastructure interventions, EGU General Assembly 2024, Vienna, Austria, 14–19 Apr 2024, EGU24-17797, https://doi.org/10.5194/egusphere-egu24-17797, 2024.

EGU24-19732 | ECS | Orals | HS5.3.4

Insights on permeable pavement hydraulic performance from large-scale laboratory experiments and physically based modelling 

Giulia Mazzarotto, Matteo Camporese, and Paolo Salandin

Among other Sustainable Urban Drainage Systems, Permeable Pavements (PPs) are one can be easily retrofitted in  the urban environment. However, they suffer of clogging phenomena that reduces their efficiency over time. Laboratory experiments to assess the hydraulic performance of a newly constructed PP subjected to different rainfall intensities have been conducted using a large-scale laboratory model (2x6 m2 with 1.2\% slope). The surface of the upstream portion (1.7x2 m2) is impermeable to simulate runoff generation over impermeable surfaces, while the downstream portion (4.3x2 m2) is realized with PICP. The downstream vertical side of the PP is made of permeable bricks and two gutter channels are placed crosswise to separately collect runoff and subsurface discharge. The remaining sides, as well as the bottom of the model, are impermeable. The filter package below the PICP consists of three layers: 5 cm bedding (3-6 mm gravel), a 10 cm base layer (8-12 mm gravel) and a 30 cm sub-base layer (20/40 mm gravel), which is laid on top of a 40 cm layer of native sand (silty sand with d50=0.23 mm). A geotextile separates the bedding and base layers and a 4m long drainpipe (D=150 mm) was inserted in the sub-base layer. The facility is equipped with probes on both lateral sides: 6 tensiometers in the native sand, 4 water content reflectometers in the base and sub-base layers, and 3 piezometers to record water table evolution throughout the experiments and degree of saturation of the filter layer package. Runoff and subsurface discharge are separately conveyed to two tipping bucket rain gauges. A rainfall simulator is used to generate quite uniform rainfall distribution (80 - 150 mm/h intensity) for 15 minutes or 30 minutes. Moreover, an Integrated Surface-Subsurface Hydrological model (CatHy) has been used to model the permeable pavement, assess and support data collected from the laboratory experiments.

Results from the laboratory experiments performed have proven the efficiency of a newly constructed permeable pavement to very intense rainfall events. The monitoring with spatially distributed sensors allowed to assess the evolution in time of the water table as well the “recovery” phase to pre-event conditions after the event. This is useful to assess the effect of repeated rainfall events at short distance in time. For each experiment performed, a rapid increase of subsurface discharges was recorded by the tipping bucket, whereas surface runoff occurred only for short and intense rainfall events (approximately 150 mm/h for 15 min). The system did not reach saturated conditions in any of the performed experiments due to the high permeability of the filter layer package. The monitoring with spatially distributed sensors also allowed to assess the heterogeneities of the physical processes (synthetic rainfall events, infiltration processes) as well as of the filter layer package. 

Future laboratory experiments simulating clogging phenomena will be performed and compared to the results obtained from the developed experiments up to now and of the ISSH model.

How to cite: Mazzarotto, G., Camporese, M., and Salandin, P.: Insights on permeable pavement hydraulic performance from large-scale laboratory experiments and physically based modelling, EGU General Assembly 2024, Vienna, Austria, 14–19 Apr 2024, EGU24-19732, https://doi.org/10.5194/egusphere-egu24-19732, 2024.

EGU24-20460 | ECS | Orals | HS5.3.4

Integration of Nature-based Solutions for stormwater control and management 

Noemi Maglia and Anita Raimondi

In the last decades, all over the world, cities have been characterized by the growth of urban population and urbanization. This involves some issues related to water resource management in terms of water supply during drought periods and stormwater control during rainfall events.

In this context, Nature-based Solutions (NBSs) are increasingly encouraged and used as support for traditional urban drainage systems to make urban areas more sustainable and resilient to the effects of climate change. They contribute to runoff control and management and natural water balance restoration, providing several benefits to the environment and communities. Moreover, NBSs meet several Sustainable Development Goals (SDG) of United Nations Agenda 2030, such as Goal 6 (“Clean Water and Sanitation”), Goal 11 (“Sustainable Cities and Communities”), and Goal 13 (“Climate Action”).

The study presents the integration of a rainwater tank with an infiltration system to limit both the water demand for drinking supplies and the overload of sewers. An analytical probabilistic approach is developed to balance the different purposes of the system and to overcome the limits of the traditional methods for performing multi-objective analysis. The proposed method enables the relationship between the main characteristics of the system and a return period and considers the possibility of storage capacity pre-filling from previous rainfall events. It can be applied under different climatic scenarios and management rules of the system.

The goodness of the theoretical framework is verified by applying it to a real case study in Milano (Italy) and successfully tested by comparing the results of its application with those from the traditional methods proposed in the literature. The use of integrated NBSs can be useful for the optimization of both water supply and urban drainage systems in terms of limiting drinking water waste and flood risk and also acting on water resource protection in terms of high-quality source preservation and aquifer recharge.

How to cite: Maglia, N. and Raimondi, A.: Integration of Nature-based Solutions for stormwater control and management, EGU General Assembly 2024, Vienna, Austria, 14–19 Apr 2024, EGU24-20460, https://doi.org/10.5194/egusphere-egu24-20460, 2024.

EGU24-5953 | ECS | PICO | HS5.3.5

On the impact of operational uncertainties on water distribution system design 

Dennis Zanutto, Andrea Castelletti, and Dragan Savic

The long-term design of Water Distribution Systems is a difficult task, with complex non-linear relationships, multiple objectives, and a decision space constrained by a discrete set of feasible actions. Numerous and heterogeneous sources of uncertainty also influence the complex landscape of solutions the decision-makers must explore. In response to this complexity, much of the current research is devoted to developing innovative methodologies to design systems that cope with these uncertainties, aiming at robust or flexible solutions.

In this study, we investigate a source of uncertainty whose role in the long-term design and planning of the infrastructure is often overlooked: operational uncertainty, i.e., the uncertainty stemming from the missing knowledge on the future values of the operational variables (e.g., pumping speeds and valve positions). From the design perspective, this represents an additional source of uncertainty for two reasons: first, the implemented control strategy is unknown (e.g., pump scheduling vs Model Predictive Control), and finally, in the case of any feedback control strategy, the optimal control actions depend on the uncertainties’ realisation, unknown during the design phase. Unlike other types of uncertainty, which stem from external factors beyond our control, operational uncertainty comes from the control decision variables, which can be subjected to cost-effective adjustments in the future.


The "Anytown" (Walski et al. 1987) case study is used as a benchmark to optimise reliability and cost, accounting for design and operational aspects. This classical optimisation problem combines irreversible design decision variables (e.g., pipe duplication) and adjustable controls (e.g., pump speed). Conventional and widely accepted optimisation techniques (e.g., Evolutionary Algorithms and Linear Programming) are used to solve the coupled operation and design problem, with the focus being the interplay between the control and design decision variables.


Gaining insight into the relationship between these variables will help us develop a metric to assess operational flexibility, a measure of a system's ability to adapt to changing conditions over time, adjusting its operations without requiring expensive changes in design. Developing such a metric would be particularly beneficial to create adaptive WDS, where the systems are built in phases, and the adaptation of the control decision variables allows for a delay of costly capital expenditure associated with design actions.


We show preliminary results on the influence of different problem formulations on the Pareto set of ideal designs and their operational uncertainty.


Walski, Thomas M., E. Downey Brill, Johannes Gessler, Ian C. Goulter, Roland M. Jeppson, Kevin Lansey, Han-Lin Lee, et al. 1987. “Battle of the Network Models: Epilogue.” Journal of Water Resources Planning and Management 113 (2): 191–203. https://doi.org/10.1061/(ASCE)0733-9496(1987)113:2(191).

How to cite: Zanutto, D., Castelletti, A., and Savic, D.: On the impact of operational uncertainties on water distribution system design, EGU General Assembly 2024, Vienna, Austria, 14–19 Apr 2024, EGU24-5953, https://doi.org/10.5194/egusphere-egu24-5953, 2024.

EGU24-6446 | ECS | PICO | HS5.3.5

Assessments of Brazilian water utilities' perception and potential uptake of index-based insurance schemes to cope with hydroclimatic extremes 

Greicelene Jesus da Silva, Heidi Kreibich, Andrea Cominola, and Eduardo Mario Mendiondo

Risk management is of paramount importance in the water supply sector, as the occurrence of drought and flood events can directly affect water availability and damage water utility infrastructure, leading to water supply interruptions and increased infrastructure maintenance costs. Index-based insurance schemes may reduce the vulnerability of water utilities in the face of such extreme hydrological events. However, there is scarce knowledge and practical adoption of index-based insurance schemes for water utilities in Brazil, despite the new regulatory framework for water security under climate change. To gain a clearer picture of the potential uptake of index-based insurance in the water utility sector in Brazil and foster the development of new schemes, we interviewed experts from 10 selected Brazilian water utilities, responsible for the supply of 30 municipalities in the southeast region of the country. Respondents are involved in strategic decision-making in the respective water utilities. For the interviews, we developed a structured questionnaire containing information on how index-based insurance works, followed by questions regarding how often the utility was hit historically by droughts and floods, their willingness to pay for index-based insurance schemes covering damage from drought and flood, and their perceived importance and likelihood of acquisition. When asked about the importance and likelihood of adopting at least one of the proposed index-based insurance on a scale from 0 (no importance/not likely at all) to 5 (significant/high likelihood of acquiring insurance), interviewees gave an average score of 2.7 (importance) and 2.2 (probability of uptaking). The detailed results from our survey presented here show that the majority of the water utilities are willing to pay for at least one of the presented index-based insurance schemes, as they attribute a relevant degree of importance to them. The majority of them would uptake flood insurance schemes. However, half of the respondents declared they would not be willing to pay anything for drought index-based insurance. The reasons given for no uptake were: (i) utilities were not affected by drought or flood events during the last 10 years, (ii) there is disagreement with the proposed trigger and the type of financial losses covered, and (iii) the availability of other surface and groundwater resources can mitigate supply interruptions from the main source. Overall, our results demonstrate that there is quite some uncertainty regarding the perception and design of new index-based insurance products in the water utilities sector, which emphasizes the need for further research and co-design with utility stakeholders.

How to cite: Jesus da Silva, G., Kreibich, H., Cominola, A., and Mendiondo, E. M.: Assessments of Brazilian water utilities' perception and potential uptake of index-based insurance schemes to cope with hydroclimatic extremes, EGU General Assembly 2024, Vienna, Austria, 14–19 Apr 2024, EGU24-6446, https://doi.org/10.5194/egusphere-egu24-6446, 2024.

EGU24-6491 | ECS | PICO | HS5.3.5

An efficient hybrid method of uncertainty estimation on defective pipe diagnosis in urban drainage system 

Chutian Zhou, Pan Liu, Xinran Luo, Yang Liu, Huan Xu, and Weibo Liu

Urban drainage system (UDS) plays an import role in city urbanization. Defective pipes in UDS can lead to unanticipated damages such as blockage or seepage. Previous studies have identified the locations of defects in UDS using inverse optimization models. However, these studies overlook the uncertainty introduced by errors in monitoring and simulation. In addition, the multi-point defect problem is computationally slow for Markov chain Monte Carlo methods due to high dimensional parameters space. To address these issues, the paper employs a hybrid approach on USEPA Stormwater Management Model, leveraging the efficiency of a genetic algorithm (GA) to identify an optimal solution space and the precision of an adaptive Metropolis (AM) algorithm to yield a dependable estimation of the posterior probability distribution (PPD). Firstly, a modified multi-population GA is applied to maximize the exploration of the model space, generating an initial PPD. Then, AM algorithm is used to explore the final PPD of each pipe health status variable.

Two UDS cases are used to validate the method. The first case generates 400 sets of randomized multi-point seepage scenarios with monitoring flow sequences. The metrics accuracy and Matthews correlation coefficient are used to evaluate the binary diagnosis performance. The statistical results of metrics suggest that the method is effective in diagnosing the location and seepage extent of defective pipes, including in complex scenarios of multi-point seepage. The effects of seepage location, monitoring error, and data richness on the results are also analysed. In addition, comparison reveals that appropriate GA can maximize the exploration of the model space and attenuate the “genetic drift” effect. The second case considers a UDS with multi-point blockage. The application results suggest that the proposed method offers a comprehensive representation of the PPD on each pipe blockage status. The proposed method is easy to implement and can present uncertainty in the form of probability, which will help to narrow down the scope of defect monitoring and reduce the cost of detection.

How to cite: Zhou, C., Liu, P., Luo, X., Liu, Y., Xu, H., and Liu, W.: An efficient hybrid method of uncertainty estimation on defective pipe diagnosis in urban drainage system, EGU General Assembly 2024, Vienna, Austria, 14–19 Apr 2024, EGU24-6491, https://doi.org/10.5194/egusphere-egu24-6491, 2024.

EGU24-8150 | ECS | PICO | HS5.3.5

Experiences from a large-scale implementation of digital water meters used for improved leakage management 

Martin Oberascher, Claudia Maussner, Petra Hinteregger, Jürgen Knapp, Andreas Halm, Mario Kaiser, Wolfgang Gruber, Dietmar Truppe, Eva Eggeling, and Robert Sitzenfrei

Similar to other infrastructure sectors, the water distribution network is also undergoing increasing digitalisation, including real-time measurement of current system statuses. While high-resolution data is frequently available at the main points of the networks, the main challenge lies in remotely obtaining high-resolution water consumption data. Water meters are usually installed at remote and underground locations without a connection to the power grid, requiring battery-powered devices and reliable and energy-efficient wireless communication technologies. For an efficient large-scale implementation, documented practical experiences in real world applications are rare.

In this work, the experiences gained of a large-scale implementation of digital water meters in a demonstration project are presented. The case study includes 163 customer sites with the majority of single-family houses, aiming to measure water consumption data at a temporal resolution of 15 min in near real-time. In contrast to the electricity sector, there is no EU-wide legal regulation for the installation of digital meters. Instead, the requirements are depending on the specifications of the digital water meter type and are subject to the European General Data Protection Regulation (GDPR) at the intended spatial and temporal resolution, as detailed information about the user behaviour can be revealed. Subsequently, active costumer agreement was obtained in form of a signed declaration of consent and the approval rate was significantly increased through a pro-active approach of the network operator (e.g., detailed and personal information about the project). In total, around 70% of households were equipped with a commercially available digital water meter, using mioty® for the remote read-out. Initially facing data gap problems, after comprehensive software updates and improved antenna positions, the quality of service (as the ratio between received data packages and theoretically expected measurement data) still varies between 10 and 100% depending on the installation site, but during the last month of operation, 84% of the meters transmitted at least 75% of the expected data.

In combination with inflow and pressure measurement data, the measured water consumption data is afterwards used for an early warning system designed for detecting new leakages, serving as an exemplary application for digital water meters. The leakage detection and leakage localisation are implemented as data-based and model-based approach, respectively, and the system was tested on ten engineered leakage events with leakage sizes between 0.1 and 2.0 l/s. Despite a temporal failure in the data communication, strong fluctuations in the pressure data, and changing operating conditions, even small leakages could be timely detected, and the possible leakage area could be successfully narrowed down to 10 to 40% of the network length for the subsequent on-site fine search.

How to cite: Oberascher, M., Maussner, C., Hinteregger, P., Knapp, J., Halm, A., Kaiser, M., Gruber, W., Truppe, D., Eggeling, E., and Sitzenfrei, R.: Experiences from a large-scale implementation of digital water meters used for improved leakage management, EGU General Assembly 2024, Vienna, Austria, 14–19 Apr 2024, EGU24-8150, https://doi.org/10.5194/egusphere-egu24-8150, 2024.

EGU24-8882 | ECS | PICO | HS5.3.5

Environmental impact assessment of digital water meters throughout urban water cycle 

Mohsen Hajibabaei, Martin Oberascher, Seyyed Ahmadreza Shahangian, Florian Gschösser, and Robert Sitzenfrei

Utilizing digital measurement devices enhances the efficiency and reliability of urban water systems. For instance, digital water meters (DWMs) measure high-resolution water consumption at customer sites, serving both personal awareness raising and advanced water loss management in water distribution networks (WDNs). However, the pros and cons of these devices in terms of environmental impacts have yet to be fully unrevealed. This research aims to bridge this gap by conducting a comprehensive environmental assessment focused on the implementation of DWMs. The assessment considers not only the direct environmental impact of DWMs (e.g., due to production, installation, etc.) but also their indirect effects on the entire urban water cycle due to their usage. As an example of an indirect effect, using DWMs can reduce household water demand by promoting awareness. This leads to less freshwater treatment and pumping, decreased hot water and energy consumption in households, and a lower volume of wastewater generation. Thus, the current study categorizes the indirect effects on the urban water cycle into three scales: freshwater scale (including freshwater treatment and pumping energy), water user scale (involving energy consumption for water heating), and wastewater scale (including wastewater treatment).

Life cycle assessment (LCA) is used as a holistic approach to quantify environmental impacts. Accordingly, the system boundary is defined to encompass the entire life cycle of DWMs (from production to end-of-life), as well as the three scales reflecting indirect effects. An Alpine city in Austria with 105,000 inhabitants is selected as a case study, where the impacts of deploying DWMs are evaluated by defining three scenarios according to the requirements of the study area. These scenarios include: (1) Reducing 5% of total leakage, (2) Reducing 15% of water demand, and (3) combining (1) and (2). For each scenario, comprehensive datasets on resources, processes, and energy consumption are compiled, and impacts are quantified using the LCA software SimaPro 9.0.

Evaluating the environmental impacts of the study area in the existing situation (i.e., without any DWMs) shows that the water user scale (including energy for water heating) contributes to 80% of the total impacts. Thus, applying the second and third scenarios results in substantial energy savings across all scales (particularly water users) compared to the existing situation, reducing the environmental impacts ranging from 3 to 4 million kilograms of CO2 equivalent per year. This fluctuation is tied to the lifespan of the DWMs, extending from 2 to 8 years.

The proposed framework can explore the extent to which DWM deployment is sustainable, providing a blueprint for decision-makers to assess the effectiveness of similar interventions in different urban settings.

How to cite: Hajibabaei, M., Oberascher, M., Shahangian, S. A., Gschösser, F., and Sitzenfrei, R.: Environmental impact assessment of digital water meters throughout urban water cycle, EGU General Assembly 2024, Vienna, Austria, 14–19 Apr 2024, EGU24-8882, https://doi.org/10.5194/egusphere-egu24-8882, 2024.

EGU24-12778 | ECS | PICO | HS5.3.5

A Water Demand Forecast-informed Framework for Optimal Control of Urban Water Distribution Networks 

Wenjin Hao, Andrea Cominola, Ina Vertommen, and Andrea Castelletti

Water Distribution Networks (WDNs) are crucial for meeting current and future urban water demands. Knowledge of future water demand at different time scales is fundamental for optimal WDN design and operations. Various predictive models of water demand have been proposed in the literature, ranging from traditional time series analysis to cutting-edge machine learning and deep learning techniques. However, the task of forecasting urban water demand remains mostly decoupled from the design of the optimal control of the related WDN. Current performance assessment of demand predictive models focuses predominantly on forecast accuracy, overlooking their practical implications on WDN operations. Meanwhile, the existing research on WDN management often assumes either perfect knowledge of future water demands or employs empirical approximations and aggregate statistics to estimate future water needs. This study bridges this gap by scrutinizing the actual operational value of water demand forecasts in designing optimal operations of WDNs.

Here, we develop a forecast-informed optimal WDN control framework to evaluate the operational value of water demand forecasts for WDN operations. Our framework comprises two main modules. The first module computes water demand forecasts. We comparatively evaluate a suite of different forecasting models —including Seasonal Auto-Regressive Integrated Moving Average with eXogenous factors, Multilayer Perceptron, Convolutional Neural Network, and Long Short-Term Memory (a network augmented with an attention mechanism) —across various forecast horizons (1/6/12 hours and 1/3/7/14 days ahead). The most accurate forecasts are integrated into the second module, an economic nonlinear Model Predictive Control (MPC) algorithm designed to optimize WDN operations. Within this module, an Artificial Neural Network (ANN) – based surrogate model encapsulates the hydraulics of the physical WDN, enhancing the optimization process while reducing complexity.

We demonstrate our forecast-informed optimal WDN control framework on a real WDN of a rural town with approximately 10,000 inhabitants. Water demand data collected in the Netherlands for a period of 10 years (2007-2017) at 5-minute resolution and corresponding meteorological data are used to train the water demand forecasting models. The MPC module computes the optimal control sequence for 7 pumps and 1 valve in the WDN to minimize pump energy costs while meeting water demands and ensuring safety storage in 5 tanks. Initial findings reveal that the ANN-based surrogate model can accurately incorporate the WDN characteristics (R2 > 0.85), facilitating its integration into the MPC for an efficient and simplified representation of a real-world WDN. Further, MPC fed by 24-hour ahead water demand forecasts achieves potential energy savings of approximately 18% compared to a benchmark rule-based control strategy. Our framework yields a versatile simulation-based optimization tool for evaluating the impact of demand forecasts on WDN management. Future research efforts will aim at refining and comparing deterministic and stochastic water demand forecasts within the MPC framework, under diverse operational objectives.

How to cite: Hao, W., Cominola, A., Vertommen, I., and Castelletti, A.: A Water Demand Forecast-informed Framework for Optimal Control of Urban Water Distribution Networks, EGU General Assembly 2024, Vienna, Austria, 14–19 Apr 2024, EGU24-12778, https://doi.org/10.5194/egusphere-egu24-12778, 2024.

EGU24-15003 | PICO | HS5.3.5

Numerical optimization for drinking water distribution network design: ideas and questions provided by practice 

Karel van Laarhoven, Djordje Mitrović, Ina Vertommen, and Bram Hillebrand

In the past decades, the potential of numerical optimization for the automated design of drinking water distribution networks has been extensively studied. In particular, evolutionary algorithms have been shown to be a powerful and versatile tool for several design tasks. In the past few years in the Netherlands, drinking water utilities have started to embrace this approach more and more to explore new design philosophies as well as to address immediate asset management decision challenges. Key to meaningful application has been the possibility to iteratively and flexibly develop the optimization problem throughout the design process. The traditional 'benchmark problems' from academia provide a strong starting point for a design process, giving utility experts a taste of the possibilities. Subsequently, however, the problem definition has to be adapted and fine-tuned in order to keep up with the evolving perspective of the utility experts on the design problem. During this type of practical implementation, it frequently occurs that questions emerge which greatly increase the complexity of the optimization task without an approach being readily available from scientific literature, requiring workarounds to be created on the spot. Here, we present recent examples of such questions and their workarounds, which we ran into while tackling different practical design challanges, namely: how to incorporate deal with the prohibitively large complexity of a pipe dimension optimization for the city of Amsterdam, and how to incorporate topological properties regarding flushability as a performance constraint into a sectorization problem for the city of Rotterdam.

How to cite: van Laarhoven, K., Mitrović, D., Vertommen, I., and Hillebrand, B.: Numerical optimization for drinking water distribution network design: ideas and questions provided by practice, EGU General Assembly 2024, Vienna, Austria, 14–19 Apr 2024, EGU24-15003, https://doi.org/10.5194/egusphere-egu24-15003, 2024.

EGU24-15392 | PICO | HS5.3.5 | Highlight

The Potential of Generative AI for the Urban Water Sector 

Riccardo Taormina

The urban water sector is increasingly turning to AI and deep learning to address the complex challenges posed by growing demographics, climate change, and urbanization. Despite the pressing need, this sector has been relatively slow in adopting these technologies compared to others, primarily due to its conservative nature. However, the recent advancements in generative AI have opened new frontiers for innovation, presenting a crucial opportunity for the urban water sector to accelerate its technological evolution. Expected regulations, particularly from institutions like the European Union, should not be viewed as a hindrance but as a catalyst for enhanced collaboration between academia, industry, and public stakeholders. Such collaboration is essential to finally push the development and adoption of reliable and safe AI systems, ensuring alignment with regulatory frameworks.

In this work, we first provide an overview of the latest trends in generative AI, focusing on how Large Language Models and Large Multimodal Models can benefit the urban water sector. Particularly, Large Multimodal Models can offer an added layer of explainability to predictive models working on imagery or other sensor data, a highly desirable feature for applications related to critical infrastructure. By literally asking these models to explain their decision-making processes with respect to the processed data streams, we can partially demystify the 'black box' nature of AI systems.

This potential is highlighted for a case study on sewer defect detection, utilizing a Large Multimodal Model that processes both text and imagery. The predictive results on the publicly available SewerML dataset are encouraging with respect to existing deep learning methods. More importantly, we show that explanations provided by the Large Multimodal Model can enlighten the decision-making process, making it more transparent. This added layer of explanation offers valuable insights and may set a new trajectory for developing trustworthy AI methodologies in critical water infrastructure management.

How to cite: Taormina, R.: The Potential of Generative AI for the Urban Water Sector, EGU General Assembly 2024, Vienna, Austria, 14–19 Apr 2024, EGU24-15392, https://doi.org/10.5194/egusphere-egu24-15392, 2024.

EGU24-16713 | ECS | PICO | HS5.3.5

Enhancing technology transfer by combining data-driven and model-based leakage detection in drinking water distribution networks 

Ivo Daniel, David Steffelbauer, Ella Steins, and Andrea Cominola

With 120 Mio. m3 per year of lost water globally, leakages in drinking water distribution networks (WDN) still pose a major challenge to water utilities, furthermore, resulting in a multitude of cascading effects such as operational disruptions, environmental hazard, property damage, and sanitary issues. In the last decades there has been a growing focus on leakage detection within the scientific community leading to the development of numerous computer-based solutions for leakage detection. Despite these developments, practical approaches employed by water utilities in their leak management routines still primarily rely on in-situ acoustic devices in combination with periodic water audits, altogether falling short of ensuring continuous system monitoring and leaving much further potential for leakage reduction. Conclusively, further dissemination and widespread implementation of automatic leakage detection technology in the near future will be paramount to contain water losses and foster robust and climate-resilient water supply systems.

Currently available computer-based technologies for leakage detection can be categorized either as data-driven or model-based, primarily depending on their requirement of a hydraulic model. Algorithms for leakage detection based on hydraulic models may accurately detect the occurrence and location of leakages, yet they are highly sensitive to model inputs and, thus, are required to be well calibrated. On the other hand, data-driven models operating on the premise of anomaly detection merely require data without any anomaly, i.e., leakage, for their calibration. However, these data-driven models cannot compete with the localisation accuracy of model-based leakage detection, as they do not incorporate geophysical information about the underlying WDN. Altogether, while yielding great improvement over in-situ technology, the requirements of automatic leakage detection technology still hamper its practical implementation. While both model-based and data-driven approaches have different requirements, their combination may ultimately enable mitigation of high technical requirements and, thus, enhance its practical applicability, thereby potentially facilitating a more efficacious, robust, and widespread implementation of leakage detection technology in water distribution networks.

In this work, we explore the trade-off between model-based and data-driven leakage detection on the basis of two award-winning state-of-the-art leakage detection algorithms developed by our consortium in previous research, i.e., the data-driven LILA and the model-based Dual Model. Through the integration of both algorithms into a unified application, we aim to mitigate technical barriers and bolster detection robustness. To validate our approach, we quantitatively evaluate its performance regarding false alarms, time-to-detection, and localisation accuracy against the individual algorithms while considering different levels of confidence and availability regarding the input data, i.e., hydraulic model, water demand estimation, and pressure data.

How to cite: Daniel, I., Steffelbauer, D., Steins, E., and Cominola, A.: Enhancing technology transfer by combining data-driven and model-based leakage detection in drinking water distribution networks, EGU General Assembly 2024, Vienna, Austria, 14–19 Apr 2024, EGU24-16713, https://doi.org/10.5194/egusphere-egu24-16713, 2024.

EGU24-17202 | PICO | HS5.3.5

Crowd-sourced Turbidity Event Scale for Proactive Management of Drinking Water Quality in Distribution Systems 

Killian Gleeson, Stewart Husband, John Gaffney, and Joby Boxall

Drinking water distribution systems operate to transport high-quality treated water across large distances to entire populations, yet water quality and contamination events occur between treatment and tap. Deployment of water quality instrumentation within drinking water distribution systems enables such events to be better understood. Specifically, in-network turbidity sensors offer a unique opportunity to measure network discolouration events, which are difficult to predict and may pose health risks to end users. However, extracting actionable information from the increasing volume of water quality data represents a major challenge to realising the true benefits of digitalisation. Typically this involves manual interpretation of time series plots, which is time-consuming and impractical for larger sensor networks. There is therefore a need to develop automated algorithmic approaches to process and integrate the turbidity signals. However, the information that is of interest and such algorithms should detect is uncertain. This study employed crowd-sourcing exercises with groups of domain experts to identify significant features within turbidity time series data from real-world distribution systems. The labelled data derived from these exercises delivers valuable insights and a critical benchmark for evaluating algorithmic methods designed to replicate human interpretation. Reflecting on the outcomes of the labelling tasks led to the development of a turbidity event scale that differentiates between advisory (< 2 NTU), alert (2 < NTU < 4), and alarm (> 4 NTU) level events. This event scale provides network operators with tools required to manage discolouration events both reactively and, crucially, proactively. A time-based averaging method, centred on data from the same time each day, proved most effective in identifying the advisory events, when compared to popular time series forecasting approaches. The event scale is demonstrated on a real-world example not included in the labelling exercises, showcasing the practical benefits and scalability of this data-driven approach. The automation of event detection and categorisation developed here offers the potential to obtain actionable insights to protect the quality of drinking water as it passes through ageing network infrastructure.

How to cite: Gleeson, K., Husband, S., Gaffney, J., and Boxall, J.: Crowd-sourced Turbidity Event Scale for Proactive Management of Drinking Water Quality in Distribution Systems, EGU General Assembly 2024, Vienna, Austria, 14–19 Apr 2024, EGU24-17202, https://doi.org/10.5194/egusphere-egu24-17202, 2024.

EGU24-18429 | ECS | PICO | HS5.3.5

Autocalibration of hydraulically simplified model for urban drainage systems 

Rocco Palmitessa, Ryan W. Murray, Henrik Andersson, and Jesper S. Mariegaard

Detailed hydrodynamic models like MIKE+ provide accurate representations of the complex behavior of urban drainage systems. Surrogate models simplify this high-resolution representation to minimize the computational cost at the expense of reduced accuracy. As such, they are particularly useful when timely and repetitive simulations are needed.
Physics-based models of urban drainage systems typically include both hydrological (surface runoff) and hydraulic (network collection) components, with the computational cost mostly associated with the latter. The constructed surrogate model retains the hydrological representation of the original MIKE+ model but lumps the hydraulic network to a single collector downstream. This approach caters use cases where the full catchment description is needed.
We apply Muskingum routing to the catchment runoff to emulate the hydraulic routing between the catchment and the collector. The parameters of the routing function (delay and smoothing factor) are defined for each catchment as a function of the distance from the collector. We calibrate two global proxy parameters to optimize the performance of the surrogate: average velocity as a proxy of the individual delay, and smoothing range as a proxy of the individual smoothing factor.
The calibration of the proxy parameters is fully automated, given upper and lower bounds and the number of trials, and utilizes a Bayesian optimization algorithm. The objective of the autocalibration is minimizing the RMSE of the collector discharge for a synthetic rainfall event with 1-year return period.
To validate the calibrated surrogate, we simulated synthetic rainfalls with return periods both lower and higher than the calibration one and compared the modelled discharge with the results of the original model.
Our results for the 1-year rainfall show that the surrogate achieves a 25 times speedup in execution time compared to the original model, while introducing and 0.1% error in the accumulated volume of the event, a 3 minute error in the peak time, and a 5,8 % error in the peak discharge. A similar or better performance was obtained with lower return periods, but the performance of the surrogate quickly degrades with higher return periods.
Further research could focus on testing additional calibration objectives, e.g. timing and magnitude of the peak, as well as investigate methods to extend the validity of the surrogate beyond the calibration return period.

How to cite: Palmitessa, R., Murray, R. W., Andersson, H., and Mariegaard, J. S.: Autocalibration of hydraulically simplified model for urban drainage systems, EGU General Assembly 2024, Vienna, Austria, 14–19 Apr 2024, EGU24-18429, https://doi.org/10.5194/egusphere-egu24-18429, 2024.

Even if tourism represents only a fraction of water consumption at the global scale, in some regions such demand may represent a critical share. The Mediterranean coast is an emblematic case, since it receives many millions of visitors in summer, when rainfall is scarce and there is competition with water demand for irrigation. Many important tourism locations face permanent limitations or temporary restrictions on urban demand due the occurrence of drought events, including the last one in 2022. As the climate changes, water scarcity events have become more frequent and the need for addressing tourism water demand, starting from its understanding, has become a priority.

The study presents analyses carried out in two important beach tourism cities (Rimini, in Italy, and Benidorm, in Spain), where water demand models were developed and validated over historical data and then applied for future climate scenarios.

Two modelling experiments were carried out:

- Modelling of monthly water demand at municipal scale, through implementation of non-linear (stepwise linear regression) and non-linear (based on parsimonious architectures of artificial neural networks) models for the Rimini urban area;

- Modelling of hotels water demand: the monthly consumption series of the hotels in Benidorm were averaged to obtain the time series of a "typical hotel”, modelling was carried out and its performance assessed also in relation to the anomalous pandemic years 2020 and 2021.

In both types of model implementation (municipal and hotel scale), the input variables included climatic factors (monthly precipitation, number of rainy days, maximum and minimum temperatures) and socio-economic factors (in particular indicators on tourist attendance, resident population and tariff, where available).

Finally, a set of 10 EC-JRC raw and bias-corrected Euro Cordex climate simulations were processed and validated against local ground observations on the control period; the corresponding rainfall and temperature series simulated for the future decades (up to 2100) under the RCP8.5 scenario were then used in input to the water demand models in order to analyse the impact of expected climate change on the water demand.

How to cite: Toth, E. and Neri, M.: Tourism water demand modelling in Mediterranean cities under current and future climate, EGU General Assembly 2024, Vienna, Austria, 14–19 Apr 2024, EGU24-18575, https://doi.org/10.5194/egusphere-egu24-18575, 2024.

EGU24-18948 | PICO | HS5.3.5

Valve isolation placement to mitigate contaminant spreading in water distribution network 

Giovanni Francesco Santonastaso, Armando Di Nardo, and Roberto Greco

A water distribution network (WDN) is a complex system that supplies drinking water from water treatment plants to consumers. WDN consists of various elements that ensure an efficient and reliable water supply. Among all these elements, valves are critical components that control the flow and pressure within the network and can isolate segments (the smallest parts of the WDN that can be isolated without interrupting service in the entire WDN) for maintenance or repair purposes. There are several studies in the literature on the optimal positioning of valves, in general the proposed methods are treated as optimization problems with one or more objectives aimed at reducing installation costs while ensuring high system reliability of the WDN (Creaco et al., 2010).

In recent years, water distribution networks have become increasingly vulnerable to contamination risks (WHO, 2014). Various factors contribute to this vulnerability, such as malfunctions in chlorination equipment, low pressure, contaminants entering water tanks and inadvertent connections between drinking and non-drinking water sources. When contamination is detected, the quickest remedial action that a water utility can take is to isolate the water section by closing gate valves.

The objective of this study is to find the optimal placement of gate valves in the water distribution network (WDN) to address the vulnerability of water quality, effectively isolate the contamination and minimize the residual concentration of contaminants. The proposed methodology is based on community detection algorithms used by sociologists to detect community structures in social networks (Traag, 2014). A community C can be described as a group of nodes with a high density of links between them and low density of links between different groups (or communities).

In this work, the community detection algorithm proposed by Girvan and Newman (2002) is used to identify groups of densely connected nodes in the WDN, and then isolation valves are placed on the boundary pipes between the different groups of nodes without performing hydraulic simulations. Different edge weights are tested to improve the placement of the isolation valves and reduce the risk of water pollution. The proposed methodology will be tested on a real water distribution network in southern Italy.


References

World Health Organization. (2014). Water safety in distribution systems. World Health Organization. https://apps.who.int/iris/handle/10665/204422

Creaco, E., Franchini, M. & Alvisi, S. Optimal Placement of Isolation Valves in Water Distribution Systems Based on Valve Cost and Weighted Average Demand Shortfall.  Water Resour Manage 24, 4317–4338 (2010)

Traag, Vincent. 2014. Algorithms and Dynamical Models for Communities and Reputation in Social Networks. Springer International Publishing.

Girvan , M. E. J. Newman, Community structure in social and biological networks, Proc. Natl. Acad. Sci. 99(12) (2002) 7821–7826.

How to cite: Santonastaso, G. F., Di Nardo, A., and Greco, R.: Valve isolation placement to mitigate contaminant spreading in water distribution network, EGU General Assembly 2024, Vienna, Austria, 14–19 Apr 2024, EGU24-18948, https://doi.org/10.5194/egusphere-egu24-18948, 2024.

HS6 – Remote sensing and data assimilation

EGU24-168 | ECS | Orals | HS6.1

A frequency-domain model to predict surface soil moisture, root zone soil moisture and aquifer recharge   

Ayoob Karami, Laurent Longuevergne, Amen Al-Yaari, Didier Michot, and Youssef Fouad

This study aims to develop and evaluate a new simple unsaturated zone model in frequency domain interconnecting different types of ground or satellite-based observations (effective rainfall, surface soil moisture, root zone soil moisture, groundwater recharge) of a single dynamic system. The proposed formulation based on 5 coherent transfer functions (Tfs) linking observations 2 by 2, with a limited number of parameters, is rooted in the Nash linear reservoir model. The curve shape of the TFs can be adjusted by key parameters such as flow complexity, response time and the share of surface runoff  each of which carries distinct and well-defined physical interpretations.  The model's efficacy was assessed using surface soil moisture, root zone soil moisture and and recharge data in a fractured crystalline-rock aquifer situated in Ploemeur, South Brittany, France. Each TF's was initially independently optimized, with parameters assigned through a detailed review of the literature and consideration of the physical characteristics of the site. The outcomes highlighted the methodology's potential, offering a comprehensive depiction of root-zone soil moisture and aquifer recharge dynamics. In the subsequent phase, the model parameterized via a joint optimization of TFs. we find out that the joint approach has the ability to elevate the accuracy and reliability of the model, ensuring its stable and robust behavior. The simplicity of the procedure, with a small number of easily interpretable parameters, makes it suitable for broader applications in different regions.

How to cite: Karami, A., Longuevergne, L., Al-Yaari, A., Michot, D., and Fouad, Y.: A frequency-domain model to predict surface soil moisture, root zone soil moisture and aquifer recharge  , EGU General Assembly 2024, Vienna, Austria, 14–19 Apr 2024, EGU24-168, https://doi.org/10.5194/egusphere-egu24-168, 2024.

EGU24-1119 | ECS | Posters on site | HS6.1

Causal Insights on the dynamics of Soil Moisture across Agro-climatic regions of India 

Yeswanth Naidu Adigarla and Sarmistha Singh

Soil moisture stands as a pivotal element in land-atmospheric interplay, crucially affecting water, energy, and biogeochemical cycles. At a larger spatial scale, meteorological forces and land cover patterns significantly influence soil moisture dynamics. Prior studies primarily focused on investigating soil
moisture variability with soil texture and topography which have prominent influence factors at small spatial scales. Previous studies have employed various correlation techniques to explore these interactions however, correlation does not necessarily imply causation. Our study employs a causal discovery approach, specifically, Peter Clark Momentary Conditional Independence (PCMCI) using 8-day satellite-based gridded data from NASA's SMAP soil moisture, precipitation, leaf area index (LAI), evapotranspiration (ET), land surface temperature (LST), and vapor pressure deficit (VPD). The data was collected across diverse climate classes in India, and seasonal effects were removed to get valuable causal insights. Our results reveal that precipitation plays a predominant role in arid regions compared to humid ones, while LST and VPD significantly impact sub-arid regions. Notably, ET demonstrates substantial influence in the sub-humid regions. The maximum lag in causation is 2.5 to 3 months between the soil moisture and other variables. These findings significantly enhance our comprehension of soil moisture dynamics across various agro-climatic classes, thereby help in enhancing soil moisture predictions and improving agricultural drought forecasting.

How to cite: Adigarla, Y. N. and Singh, S.: Causal Insights on the dynamics of Soil Moisture across Agro-climatic regions of India, EGU General Assembly 2024, Vienna, Austria, 14–19 Apr 2024, EGU24-1119, https://doi.org/10.5194/egusphere-egu24-1119, 2024.

EGU24-1160 | ECS | Posters virtual | HS6.1

Incorporating Data Assimilation into Land Surface Model simulation for better estimation of Surface Soil Moisture over India 

Arijit Chakraborty, Manabendra Saharia, Sumedha Chakma, Sujay V. Kumar, and Augusto Getirana

Soil moisture is a significant environmental factor that influences both the water and energy balance at the land-atmosphere interface. Therefore, proper assessment of the spatial and temporal distribution of soil moisture is crucial for many hydrological applications such as weather forecasting, agricultural water resource management and drought monitoring. This study involves the assimilation of Soil Moisture Active Passive (SMAP) soil moisture dataset within a land surface model and the evaluation of its performance in precise estimation of soil moisture by comparing the statistics with respect to standard European Space Agency’s Climate Change Initiative (ESA-CCI) soil moisture dataset. The Ensemble Kalman Filter technique has been used for assimilating SMAP soil moisture data using Noah-MP land surface model within NASA Land Information System (LIS) framework. The data assimilation (DA) framework includes Cumulative Distribution Function (CDF) matching for bias correction and twenty ensembles per tile. Meteorological forcings for the simulations have been taken from MERRA2 and IMD. Improvement or degradation due to DA has been analyzed in terms of the difference in anomaly correlation between open loop (OL) and DA soil moisture outputs with respect to the ESA-CCI soil moisture dataset over the entire Indian domain. The DA result shows improvement over larger areas in the case of MERRA2 forced simulations than IMD+MERRA2. The seasonal impact of DA in terms of the differences in DA and OL simulated soil moisture shows less variability in summer than winter. The results are validated with in-situ soil moisture datasets. Overall, the study shows that data assimilation is giving better results than open loop LSM simulation, which can be used for improved estimation of other water balance components.

How to cite: Chakraborty, A., Saharia, M., Chakma, S., Kumar, S. V., and Getirana, A.: Incorporating Data Assimilation into Land Surface Model simulation for better estimation of Surface Soil Moisture over India, EGU General Assembly 2024, Vienna, Austria, 14–19 Apr 2024, EGU24-1160, https://doi.org/10.5194/egusphere-egu24-1160, 2024.

EGU24-1769 | Orals | HS6.1 | Highlight

Adaptive soil moisture bias correction in the ECMWF land data assimilation system 

Peter Weston, Patricia de Rosnay, and David Fairbairn

Bias-correction (BC) is typically needed prior to the assimilation of satellite-derived soil moisture (SM) observations in land surface models. Active ASCAT and passive SMOS satellite-derived SM observations are assimilated in the ECMWF integrated forecasting system (IFS). Prior to assimilation, the ASCAT SM observations are bias-corrected using a seasonal rescaling technique. SMOS level 1 observations are converted to level 2 SM via a neural network, which is trained on the global ECMWF operational SM analysis. However, neither of these techniques allow for non-stationary biases and the globally trained SMOS neural network is affected by local biases. In this presentation a two-stage filter is employed in the ECMWF IFS to dynamically correct biases in the SM observations, whilst allowing the assimilation to correct sub-seasonal scale errors. Over a 3-year test period this adaptive BC approach leads to (i) reduced observation-model biases, (ii) slight improvements in SM analysis performance against in situ data and (iii) reduced mean errors in relative humidity forecasts near the surface in the northern hemisphere midlatitudes. This will benefit the development of a unified coupled land-atmosphere data assimilation system in the context of the CERISE European project (Copernicus Climate Change Service Evolution). Furthermore, it is expected that the assimilation of non-biased ASCAT SM observations will improve the root-zone SM products for the hydrological satellite applications facility (H SAF).  

How to cite: Weston, P., de Rosnay, P., and Fairbairn, D.: Adaptive soil moisture bias correction in the ECMWF land data assimilation system, EGU General Assembly 2024, Vienna, Austria, 14–19 Apr 2024, EGU24-1769, https://doi.org/10.5194/egusphere-egu24-1769, 2024.

EGU24-2102 | ECS | Orals | HS6.1 | Highlight

Quality Assurance for Soil Moisture (QA4SM): A Platform for Validating Satellite Soil Moisture Data Against Fiducial Reference Measurements 

Nicolas Bader, Wolfgang Preimesberger, Monika Tercjak, Alexander Boresch, Daniel Aberer, Irene Himmelbauer, François Gibon, Arnaud Mialon, Raffaele Crapolicchio, and Alexander Gruber

The purpose of the Quality Assurance for Soil Moisture (QA4SM) service is to provide a central, cloud-based platform for soil moisture data validation. QA4SM is an easy-to-use graphical web interface that caters to both producers of satellite soil moisture data as well as users of such products. It provides the means to assess quality requirements for satellite products, as defined by the Global Climate Observing System (GCOS) for example, all the way to the validation and (inter)comparison of satellite data against (fiducial) reference measurements and land surface model data.

QA4SM delivers reproducible validation results based on a consistent methodology and community-agreed best practices. Numerous well-known data products are readily available and periodically kept up to date. This includes satellite products of different levels from SMOS, SMAP, ASCAT, and Sentinel-1 missions. Further, data products from both the Copernicus Climate Change Services (C3S) and the ESA Climate Change Initiative (CCI) are provided, too. Also included is data from the International Soil Moisture Network (ISMN) and reanalysis model data such as NASA’s GLDAS-Noah or ECMWF’s  ERA5(-Land). Beyond that, users can upload custom datasets to the platform in different formats.

QA4SM offers a broad palette of processing tools such as: the filtering of datasets according to flags or versions; spatial and temporal scaling options; the selection of spatial and temporal subsets; temporal matching methods; and different metric and anomaly calculations for up to six datasets simultaneously. Means for a subsequent publication of the results, including the generation of a digital object identifier (DOI), are implemented as well.

In this talk, we will present the functionalities and tools provided by QA4SM, and report on recent updates, the latest features, and planned future developments of the platform. Both scientific and technical aspects will be discussed.

How to cite: Bader, N., Preimesberger, W., Tercjak, M., Boresch, A., Aberer, D., Himmelbauer, I., Gibon, F., Mialon, A., Crapolicchio, R., and Gruber, A.: Quality Assurance for Soil Moisture (QA4SM): A Platform for Validating Satellite Soil Moisture Data Against Fiducial Reference Measurements, EGU General Assembly 2024, Vienna, Austria, 14–19 Apr 2024, EGU24-2102, https://doi.org/10.5194/egusphere-egu24-2102, 2024.

EGU24-3537 | ECS | Orals | HS6.1

A water balance approach for estimating groundwater recharge rates through high-resolution satellite soil moisture 

Jacopo Dari, Paolo Filippucci, Luca Brocca, Renato Morbidelli, Carla Saltalippi, and Alessia Flammini

Groundwater represents a massive portion of the total freshwater available. It is the primary source of water for more than two billion people worldwide and an essential source for agriculture in many areas of the world. It is well known that water resources are expected to face an ever-increasing stress during the upcoming decades because of the combined effects of human exploitation and climate changes, and groundwater is not an exception. Recently, the monitoring of hydrological fluxes through approaches based on the closure of the water cycle budget has been boosted by the availability of multi-source satellite data sets. Under this perspective, this study aims at presenting a novel approach for estimating groundwater recharge rates from satellite surface soil moisture observations through a water balance approach. In order to do this, data from groundwater monitoring networks over selected pilot areas in central Italy have been collected for validation purposes. Several remotely sensed soil moisture products have been evaluated, limiting the selection to latest high-resolution (1 km) data sets, namely an experimental product derived by SMAP (Soil Moisture Active Passive) and developed by Planet Labs, the operational Sentinel-1 soil moisture data delivered by the Copernicus Global Land Service (CGLS) and a newer Sentinel-1 retrieval based on a first-order radiative transfer model (RT1). Preliminary results show a general good agreement between observed and satellite-derived recharge periods, with highest quantitative agreements found for stations monitoring shallower aquifers. Even though further investigation is required, the proposed framework opens the interesting perspective of an innovative hydrological application of satellite soil moisture data and, if successful, it can be potentially upscaled to different targets (i.e., from the regional to the country scale).

How to cite: Dari, J., Filippucci, P., Brocca, L., Morbidelli, R., Saltalippi, C., and Flammini, A.: A water balance approach for estimating groundwater recharge rates through high-resolution satellite soil moisture, EGU General Assembly 2024, Vienna, Austria, 14–19 Apr 2024, EGU24-3537, https://doi.org/10.5194/egusphere-egu24-3537, 2024.

EGU24-4383 | ECS | Posters virtual | HS6.1

Effects of Water Stress on Spectral Reflectance of Potato Crop Grown in Open Field Conditions  

Alok Kumar Maurya and Amey Pathak

Potato belongs to the Solanaceae family, which is known for being highly susceptible to abiotic stress, particularly related to water. Understanding how and to what extent potato plants respond to different wavelengths of light is essential for gaining insights into soil water and plant water status, chlorophyll levels, and optimal timing for watering. Studying the spectral response of potato plants before and after irrigation, particularly focusing on agricultural management, resource optimization, and enhancing crop output. This study aimed to investigate the spectral characteristics of potato plants before and after irrigation, while plants are under varying soil-water conditions. This was achieved by implementing different irrigation schedules that maintained soil moisture levels at 25%, 50%, 65%, and 85% of the Maximum Allowable Depletion (MAD) of Available Soil Moisture (ASW). The plants' spectral responses were measured using a portable spectroradiometer. During the vegetative stage of the potato crop, plants treated with MAD50 and MAD25 experienced a slightly higher spectral reflectance in the green band spectrum before irrigation indicating healthy plants (Chlorophyll abundance). In general, MAD50-treated plants showed a higher spectral reflectance than plants treated with MAD25, MAD65, and MAD85 in the red-edge band (730-750nm) and NIR band spectrum. Furthermore, MAD85-treated plants exhibited higher spectral reflectance in all spectra than MAD65, MAD50, and MAD25-treated plants after irrigation. However, the red band (around 680nm) was almost saturated for all plants treated with MADs before and after irrigation, except MAD85-treated plants, after irrigation.  In addition, we have found the least variations in spectral reflectance of the MAD25 and MAD50-treated plants prior and post-irrigation. Whereas, MAD65 shows a spectral reflectance increase of +1.54-2.97% in the green band and +2.23-12.18% in the red-edge and NIR band after irrigation. Similarly, MAD85 exhibits a reflectance increase of +3.56-6.29% in the green band and +4.24-19.73% in the red-edge and NIR band after irrigation.  These findings highlight that optimum soil moisture is required for plants to be effective in MAD25 and MAD50 compared to the other delayed irrigation conditions. This research suggests an effective irrigation schedule to adapt in situations where adverse impacts of climate change, such as unpredictable water supply, water scarcity, and decreased irrigation expenses affects production. Assessing the baseline spectral response of crops before irrigation aids in detecting indications of water stress, while post-irrigation assessment helps determine whether the provided water has relieved stress and promoted robust plant development.

Keywords: Potato crop, Spectral response, Handheld Spectroradiometer, Water-stress, Irrigation


How to cite: Maurya, A. K. and Pathak, A.: Effects of Water Stress on Spectral Reflectance of Potato Crop Grown in Open Field Conditions , EGU General Assembly 2024, Vienna, Austria, 14–19 Apr 2024, EGU24-4383, https://doi.org/10.5194/egusphere-egu24-4383, 2024.

Soil moisture is a key factor controlling the hydrological phenomena at the land surface, i.e., the state and movement of water on the ground. Microwave remote sensing from space greatly contributes to reducing the lack of information on surface soil moisture. However, there are still challenges in the practical use of satellite-based soil moisture products for difficult situations such as dense vegetation, surface roughness, coarse spatial resolution, complex topography, etc. This is particularly true in South Korea, where more than 70% of the country is mountainous. Here, ground reference data from an observation network is essential for rigorous validation and retrieval of soil moisture. The Cosmic-Ray Neutron Probe (CRNP) is a promising approach for building a ground soil moisture observation network in areas with dense forests and mountainous terrain. CRNP requires no invasive sensor installation (i.e., no damage to vegetation and no interruption to soils) and also has intermediate spatial coverage that minimizes the scale mismatch between traditional ground data and satellite remote sensing products. This study assesses the applicability of CRNP for monitoring soil moisture in Korea. Hongcheon CRNP site, one of the prototype sites for the Korean cOsmic-ray Soil Moisture Observing System (KOSMOS), was established in August 2022, and this study used the Hongcheon site’s soil moisture datasets (one from CRNP and the others from multiple frequency-domain sensors) to calibrate CRNP-derived soil moisture and to evaluate satellite-based surface soil moisture product. Through this study, we discuss the potential of CRNP for enhancing the ground soil moisture observation network and the possibility of expanding the CRNP network throughout South Korea.


Acknowledgment: This research was supported by Basic Science Research Program through the National Research Foundation of Korea (NRF) funded by the Ministry of Education (NRF-2021R1A6A3A01087645), the National Research Foundation of Korea (NRF) grant funded by Ministry of Science and ICT (202300209986), and BK21 FOUR Program of Agriculture-forestry Bioresource Convergence Center (ABC), Seoul National University, Seoul, Korea.

How to cite: Jeong, J., Choi, M., Kim, K., and Kimm, H.: Assessment of soil moisture estimation using cosmic-ray neutron probe: Towards building Korean cOsmic-ray Soil Moisture Observing System (KOSMOS), EGU General Assembly 2024, Vienna, Austria, 14–19 Apr 2024, EGU24-4919, https://doi.org/10.5194/egusphere-egu24-4919, 2024.

EGU24-5023 | ECS | Posters on site | HS6.1

Assessment of SMOS soil moisture considering the heterogeneity of geophysical parameters within the footprint 

François Gibon, Arnaud Mialon, Philippe Richaume, Nemesio Rodriguez-Fernandez, Yann Kerr, Daniel Aberer, Nicolas Bader, Alexander Boresch, Raffaele Crapolicchio, Wouter Dorigo, Alexander Gruber, Irene Himmelbauer, Wolfgang Preimesberger, and Monika Tercjak

Evaluating the uncertainties of satellite soil moisture (as SMOS or SMAP) is crucial for enhancing our comprehension of climate mechanisms, such as the water cycle or the energy balance. The commonly used method is to evaluate the agreement between the satellite data and a reference, which are often ground measurements. However, the measurand in the present case is soil moisture at the satellite footprint scale, which means a much larger spatial and temporal scale than the in situ one. Various methods are employed to address these scale mismatches, such as multiple spatial sampling with in situ measurements within the satellite footprint (dense networks with strategic location installation) or the probes’ classification with representativeness indicators (based on triple collocation analysis, for example). Within ESA's Fiducial Reference Measurement for Soil Moisture project (FRM4SM), we propose to investigate the level of heterogeneity within the SMOS satellite footprint due to its influence on the complexity of the retrieval model and also its influence on the scale mismatch with the reference. To do so, various indices are developed to i) quantify the footprint heterogeneity in terms of the spatial distribution of hydro-geophysical parameters, and ii) analyse the impact on the retrieval quality. We present the analysis using indices of diversity of surface conditions (Shannon and Gini indices), and indices based on the level of similarities of hydro-geophysical conditions between the probes’ environment and the satellite footprint. Results show that even though the Shannon index is not significantly related to the soil moisture retrieval performances, the index based on the similarities of surface conditions better correlates with the retrieval performances.

How to cite: Gibon, F., Mialon, A., Richaume, P., Rodriguez-Fernandez, N., Kerr, Y., Aberer, D., Bader, N., Boresch, A., Crapolicchio, R., Dorigo, W., Gruber, A., Himmelbauer, I., Preimesberger, W., and Tercjak, M.: Assessment of SMOS soil moisture considering the heterogeneity of geophysical parameters within the footprint, EGU General Assembly 2024, Vienna, Austria, 14–19 Apr 2024, EGU24-5023, https://doi.org/10.5194/egusphere-egu24-5023, 2024.

EGU24-5442 | Orals | HS6.1

On the assesment of a new 4D soil moisture product over Basilicata Region 

Raffaele Albano, Arianna Mazzariello, Tedosio Lacava, Raphael Quast, Wolfgang Wagner, and Aurelia Sole

Climate change is already causing suffering and damage, representing the greatest current challenge and threat to our planet. As global temperatures increase, widespread shifts in weather systems occur, making events such as droughts and floods more intense and unpredictable. Both have a direct connection to the variability of Soil Moisture (SM), which therefore needs to be provided at adequate spatiotemporal resolutions and with good accuracy along the soil profile. Currently, there are no satellite SM products that can offer information at high temporal and spatial resolutions, particularly when investigating root zone and large spatial scales. Blending satellite products with similar characteristics but different features in terms of resolution may allow us to face such a gap.  In this light, the 25 km Metop ASCAT Surface Soil Moisture (SSM) product, with a sub-daily temporal resolution (2-6 measurements per day), and the weekly improved SSM S-1 data at 1 km spatial resolution are based on satellite acquisitions in the same microwave spectral region (i.e., the C-band) processed with the RT1 algorithm (Quast et al., 2023)

In this work, we fused, firstly, these products to obtain a daily 1 km soil moisture product, named SCAT- SAR SWI, following the method of Bauer-Marschallinger et al. (2018). As inputs, we used the ASCAT H119 - H120 (Climate Data Record v7 Extension 12.5 km sampling) and an optimized version of SENTINEL 1 SM products made available by the Technological University of Wien for the January 2017 - July 2022 period. Subsequently, we applied the Soil Moisture Analytical Relationship (SMAR) model (Manfreda et al., 2014) to the SCAT-SAR SWI surface product to obtain RZSM information. This made it possible to depict the Basilicata region (southern Italy) test case in four dimensions (time t plus x, y, and z) at high spatiotemporal resolutions. The performance of the developed SCAT- SAR SWI SMAR product, as well as that of the SCAT- SAR SWI, was evaluated for comparison with the 1 km ERA5-Land downscaled SM data (i.e., volumetric_soil_water_layer_1; volumetric_soil_water_layer_2).

The results are encouraging, demonstrating the capability of the product to discriminate the behaviour of areas characterized by different SM contents based on their orography and precipitation regimes. The western part of the region, more affected by precipitation and more mountainous than the other sections of the region, shows indeed a positive correlation (R0.8) with the ERA 5 LAND 1 km product, higher than that obtained for the flatter western subset (R0.6-0.7). This is likely due to the more consistent precipitation patterns in the western part.

Reference

  • Bauer-Marschallinger, B. et al., 2018. Soil Moisture from Fusion of Scatterometer and SAR: Closing the Scale Gap with Temporal Filtering. Remote Sensing 10, 1030.
  • Manfreda, S., et al. 2014. A physically based approach for the estimation of root-zone soil moisture from surface measurements. HESS 18, 1199–1212.
  • Quast, R., et al., 2023. Soil moisture retrieval from Sentinel-1 using a first-order radiative transfer model—A case-study over the Po-Valley. Rem. Sens. Of Env., 295, 113651

How to cite: Albano, R., Mazzariello, A., Lacava, T., Quast, R., Wagner, W., and Sole, A.: On the assesment of a new 4D soil moisture product over Basilicata Region, EGU General Assembly 2024, Vienna, Austria, 14–19 Apr 2024, EGU24-5442, https://doi.org/10.5194/egusphere-egu24-5442, 2024.

EGU24-5538 | Orals | HS6.1

Soil Moisture Estimation Using the Correlation between Dual-Polarization GNSS-R Interference Patterns 

Marcel M. El Hajj, Susan C. Steele-Dunne, Samer K. Almashharawi, Xuemeng Tian, Kasper Johansen, Omar A. López Camargo, Adria Amezaga-Sarries, Andreu Mas-Viñolas, and Matthew F. McCabe

Soil moisture is a key variable routinely used to understand and predict the behavior of Earth’s climate and water cycle. Over the past decade, Global Navigation Satellite Systems Reflectometry (GNSS-R) techniques have emerged as a “signal of opportunity” for continuous and near real-time soil moisture estimation. Since 2007, multipath signals have been used to estimate soil moisture primarily through three ground-based GPS receiver setup configurations. The first configuration uses two antennas, one looking toward the zenith to acquire the direct signal, and the other looking toward the ground to acquire the reflected (multipath) signal. With this ground-based GPS receiver configuration, soil moisture can be estimated from the reflection coefficient computed by dividing the averaged waveforms from direct and reflected GNSS signals. The second configuration employs an interferometric GNSS-R ground-based receiver with a single antenna, and it estimates soil moisture by analyzing the phase, amplitude, and frequency of the interference pattern between the direct and reflected signals. The third ground-based receiver configuration is known as the interference pattern technique (IPT). It employs a dual-polarized antenna oriented horizontally to measure the power fluctuations of the interference of direct and reflected signals at horizontal polarization (H-pol) and vertical polarization (V-pol). With the IPT, soil moisture is currently estimated by determining the so-called notch position, θB: the angular elevation value (θ) of the smallest interference power (IP) oscillation at V-pol. Accurate determination of θB is challenging in real GNSS-R acquisitions, especially when the IP waveform exhibits low-frequency oscillations or maintains constant amplitude over a wide range of θ. Here, we investigate the potential of a ground-based GNSS-R receiver with two linearly polarized antennas that measure the IP of direct and reflected signals in H-pol and V-pol to estimate soil moisture in a patch of very smooth bare soil and an irrigated grassland field harvested every three months. This study provides a practical method to estimate the soil moisture, through the use of the coefficient of determination between the IP waveforms at H-pol and V-pol (R²v/h). A coherent specular reflection model was employed to first explore the relationship between  and soil moisture for different values of soil roughness and vegetation water content. That relationship was applied to estimate soil moisture from  determined from GPS signals acquired continuously between May and December 2022 of bare soil (vegetation water content equal to zero). The results show that the proposed method can estimate the soil moisture of the upper 10 cm layer of bare soil with high accuracy (RMSE of 1.5 vol.%). The use of  in the irrigated grassland field produced inaccurate estimates of soil moisture, likely due to the presence of vegetation causing V-pol and H-pol to consistently oscillate out-of-phase (R²v/h= 0). The work is currently focusing on the use of amplitude and frequency of V-pol and H-pol to improve soil moisture estimation in the irrigated grassland field.

How to cite: El Hajj, M. M., Steele-Dunne, S. C., Almashharawi, S. K., Tian, X., Johansen, K., López Camargo, O. A., Amezaga-Sarries, A., Mas-Viñolas, A., and McCabe, M. F.: Soil Moisture Estimation Using the Correlation between Dual-Polarization GNSS-R Interference Patterns, EGU General Assembly 2024, Vienna, Austria, 14–19 Apr 2024, EGU24-5538, https://doi.org/10.5194/egusphere-egu24-5538, 2024.

EGU24-6502 | ECS | Orals | HS6.1

Improved Soil Moisture SMOS Retrieval using the next generation of AI inversion schemes 

Victor Pellet, Filipe Aires, and Eulalie Boucher

Land surfaces are characterised by strong heterogeneities of, among other variables, soil texture, orography, land cover, snow, or Soil Moisture (SM). SM is of broad scientific interest due to its role in the Earth system and its capital practical value for a wide range of applications from flood forecasting to agriculture. The scientific community has made significant progress in estimating SM from satellite-based passive MicroWave (MW). Most of SM estimates relie on a physical-based inversion to retrieve SM from passive MW. As an alternative to physical-based inversions, Neural Network (NN) retrieval algorithms have been successfully implemented for several sensors in recent years (Aires et al., 2005; Kolassa et al., 2016). The Soil Moisture and Ocean Salinity (SMOS) L3BT product (Al Bitar et al. 2017) uses an angle-binning scheme to organize the measured Brightness Temperature (BT) data. Three points that could improve SM retrieval will be considered in this presentation. (1) For coarse resolution MW instruments such as SMOS, NN algorithms are currently defined at the pixel level. Using the strong spatial patterns at the surface should help the SM retrieval, and we intend here to use an image-processing-based retrieval to investigate its potential. (2) Despite the important scanning angle information available on SMOS, not all angles are available for every pixel: The need to specify a limited angle configuration can drastically reduce the number of retrieved pixels, and the potential use of some large angle information is lost (Rodriguez-Fernandez et al. 2015). These missing data (both pixels and some angle configurations) could impede the use of image-based retrieval approaches. To tackle this issue, innovative machine learning techniques, such as “partial convolutional layers”, have been suggested very recently (Boucher et al. 2023), where missing data can be managed for both the spatial and the angle dimensions. This expands significantly the spatial coverage of the SMOS retrieval, especially for pixels with incomplete angle information. (3) A concept called “Localization” is also exploited, helping the ML retrieval to adapt its behaviour to specific local conditions to reduce local retrieval biases. By specializing its behaviour to local conditions, the relation between passive MW and SM is “simplified” over a particular pixel, this allows to reduce the impact of missing local information needed for a truly global model. We propose several NN and ML architectures to incorporate localization information into the networks, reducing significantly local biases.

Experiments are conducted over the CONUS using several years of SMOS data. Impacts of the image- versus the pixel-scale processing is measured, as well the spatial extension of the SM retrieval due to better missing-data handling, and the effect of the localization is analysed too. The best configuration for a global-scale retrieval is yet to be found because the spatial domain to consider is strategic for image-processing schemes, but original and important technical solutions are proposed here that could pave the way for the next generation of SM retrievals.

How to cite: Pellet, V., Aires, F., and Boucher, E.: Improved Soil Moisture SMOS Retrieval using the next generation of AI inversion schemes, EGU General Assembly 2024, Vienna, Austria, 14–19 Apr 2024, EGU24-6502, https://doi.org/10.5194/egusphere-egu24-6502, 2024.

EGU24-6782 | ECS | Orals | HS6.1

A Case Study on Agricultural Drought Monitoring using ASCAT Surface Soil Moisture at 6.25 km sampling over Eastern Africa 

Pavan Muguda Sanjeevamurthy, Mariette Vreugdenhil, Sebastian Hahn, Samuel Massart, Carina Villegas-Lituma, Roland Lindorfer, and Wolfgang Wagner

Agriculture faces increased challenges due to intense and frequent droughts caused by climate change. Accurate and timely monitoring of drought conditions, therefore, becomes paramount to taking quick and decisive actions towards its impact mitigation. Agricultural droughts occur due to prolonged periods of low rainfall and high temperatures, which lead to soil moisture deficits, increasing plant water stress and adversely affecting crops. This study explores the potential use of a new demonstrational ASCAT surface soil moisture (SSM) product sampled at 6.25 km provided by EUMETSAT's Satellite Application Facility on Support to Operational Hydrology and Water Management (H SAF) to monitor agricultural droughts. The study focuses on East Africa, a region severely affected by consecutive years of droughts, resulting in acute food and water shortages that have put the livelihood of millions at risk. 

This study offers a preliminary quality assurance of the ASCAT SSM 6.25 km product with ERA5-Land and ESA CCI (passive) SSM, respectively, focusing on the effects of subsurface scattering and changes in land cover. We first conducted a correlation analysis to gain insights into the general quality and subsurface scattering effects in arid regions of East Africa. Furthermore, to address significant wetting trends caused by land cover changes, which were previously observed in the H SAF ASCAT SSM 12.5 km climate data record product (H119), the dry and wet backscatter reference parameters are estimated on a yearly basis as part of the TU Wien change detection algorithm. The effectiveness of this novel approach is then quantified by comparing trends of ASCAT SSM 6.25 km product with trends of the other SSM datasets.

To assess the potential for agricultural drought monitoring, a convergence of evidence approach was used. Here, the ASCAT SSM 6.25 km anomalies are compared to anomalies in CHIRPS precipitation, LSA SAF (Land Surface Analysis of EUMETSAT) land surface temperature, and CGLS (Copernicus Global Land Service) vegetation datasets for previously recorded drought events. We also generated two drought indicators based on anomalies using the ASCAT SSM 6.25 km product: SMAPI (Soil Moisture Anomaly Percentage Index) and Z-scores, which were evaluated with SPEI (Standardised Precipitation and Evapotranspiration Index) to assess the similarity in spatial patterns of droughts.

Our assessments show that the demonstrational ASCAT SSM 6.25 km product corresponds well with other SSM datasets. Moreover, the drought indicators derived from it effectively capture precipitation deficits and increased land surface temperature compared to SPEI (drought conditions), indicating its potential for agricultural drought monitoring.

How to cite: Muguda Sanjeevamurthy, P., Vreugdenhil, M., Hahn, S., Massart, S., Villegas-Lituma, C., Lindorfer, R., and Wagner, W.: A Case Study on Agricultural Drought Monitoring using ASCAT Surface Soil Moisture at 6.25 km sampling over Eastern Africa, EGU General Assembly 2024, Vienna, Austria, 14–19 Apr 2024, EGU24-6782, https://doi.org/10.5194/egusphere-egu24-6782, 2024.

EGU24-7555 | Orals | HS6.1 | Highlight

30 years of scatterometer soil moisture research at TU Wien: What’s next? 

Wolfgang Wagner

Scatterometer soil moisture research started at the Vienna University of Technology (TU Wien) 30 years ago when attempting to use the first European C-band scatterometer flown on board of the ERS-1 satellite for wet snow mapping over the Canadian Prairies. While it quickly turned out that the detection of wet snow is impossible when the snowpack is shallow, the strong link between C-band backscatter and soil moisture under snow-free conditions became evident [1]. This motivated research on how to disentangle the backscatter contributions from soil moisture and vegetation, which cumulated in the public release of the first global satellite derived soil moisture data set in 2002 [2]. Despite the strong criticism that the scatterometer derived soil moisture data depict in reality only vegetation signals that happen to be correlated with soil moisture dynamics, the positive outcome of independent validation studies led to the decision by EUMETSAT to develop a near-real-time soil moisture service for the Advanced Scatterometer (ASCAT) flown on board of the METOP satellites. This service, being the first of its kind, became operational in 2008, and was later integrated into the Satellite Application Facility for Support to Operational Hydrology and Water Management (H SAF). For continuously improving this ASCAT service, TU Wien has carried out extensive research to quantify the soil moisture retrieval errors and improve the retrieval algorithm and workflows. In this presentation, I will provide an overview of the main developments over the past years, discuss open research challenges, and provide an outlook to the next ASCAT product releases and the upcoming, next-generation scatterometer instrument called SCA, to be flown on the Metop-SG B-satellites.

References

[1] Wagner et al. (1995) Application of Low-Resolution Active Microwave Remote Sensing (C-Band) over the Canadian Prairies, in Proc. of the 17th Canadian Symposium on Remote Sensing, Saskatoon, Saskatchewan, Canada 13-15 June 1995, 21-28.

[2] Scipal et al. (2002) The Global Soil Moisture Archive 1992-2000 from ERS Scatterometer Data: First Results, In: Proceedings IEEE Geoscience and Remote Sensing Symposium (IGARRS2002), Toronto, Canada, 24-28 June 2002, 1399-1401.

How to cite: Wagner, W.: 30 years of scatterometer soil moisture research at TU Wien: What’s next?, EGU General Assembly 2024, Vienna, Austria, 14–19 Apr 2024, EGU24-7555, https://doi.org/10.5194/egusphere-egu24-7555, 2024.

EGU24-8721 | ECS | Orals | HS6.1

Strenghts and limitations of common soil moisture products for operational drought monitoring 

Jaime Gaona, Davide Bavera, Guido Fioravanti, Luca Ciabatta, Paolo Filippucci, Stefania Camici, Hamidreza Mosaffa, Silvia Puca, Nicoletta Roberto, Pietro Stradiotti, and Luca Brocca

Soil moisture is a crucial state variable for understanding the water cycle. The increasingly available soil moisture data from remote sensing and models is rapidly facilitating improved hydrological analysis and evaluation of climate change impacts. To discern the degree of alteration of soil moisture, the patterns of spatiotemporal anomalies must be considered, but often product-specific uncertainties are overlooked. Such limitations are of particular concern for the operational monitoring and long-term evaluation of soil moisture.

Among the sources of uncertainty jeopardizing remotely sensed and modeled soil moisture, this study evaluates over Europe (1) the heterogeneous spatial patches of validity, (2) the residual trends in the series, and (3) the sensitivity of anomaly detection to the baseline period of popular soil moisture products such as the Satellite Application Facility on Support to Operational Hydrology and Water Management (H SAF), the passive subset of the Climate Change initiative on SM (CCIp) and the European Drought Observatory (EDO) datasets.

The inter-comparison of these remotely sensed and modeled soil moisture products by triple collocation analysis and against data of the international soil moisture network (ISMN) provides insightful results regarding (1) the contrasting patches of accurate soil moisture estimates, (2) the existence of residual temporal trends in the series, and (3) the differing sensitivity of the products to the baseline period for anomaly analysis. The factors impacting products are subject to debate, particularly concerning spatial and temporal consistency.

Merged products combining H SAF, EDO and CCIp are also assessed to elucidate their potential and limitations for operational monitoring in comparison to individual products. Overall, the combined products equal or exceed the performance of individual products while incorporating specific benefits and drawbacks. Outcomes also inform about the best-performing product by area and period.

All in all, the study illustrates the notable degree of consistency of commonly available soil moisture databases for multiple applications, despite some constraints, while highlighting the potential of merged soil moisture products for the operational monitoring of droughts within the European Drought Observatory (EDO) system.

How to cite: Gaona, J., Bavera, D., Fioravanti, G., Ciabatta, L., Filippucci, P., Camici, S., Mosaffa, H., Puca, S., Roberto, N., Stradiotti, P., and Brocca, L.: Strenghts and limitations of common soil moisture products for operational drought monitoring, EGU General Assembly 2024, Vienna, Austria, 14–19 Apr 2024, EGU24-8721, https://doi.org/10.5194/egusphere-egu24-8721, 2024.

EGU24-8930 | ECS | Orals | HS6.1

Exploring the importance of auxiliary datasets for soil moisture retrieval based on GNSS Reflectometry 

Hamed Izadgoshasb, Emanuele Santi, Leila Guerriero, Veronica Ambrogioni, and Nazzareno Pierdicca

Various remote sensing satellites can be used for extracting soil moisture (SM), each characterized by unique spatial and temporal resolutions. Missions such as Soil Moisture Active Passive (SMAP) have provided fresh insights into the storage of near-surface soil moisture through L-band radiometry, achieving a spatial resolution of 30–50 km and the full Earth coverage in 2-3 days. The demonstrated sensitivity of the L-band electromagnetic signal to the water content of observed targets and its significant penetration depth underscores the potential of Global Navigation Satellite System-Reflectometry (GNSS-R) techniques in diverse land applications. An illustrative example of this advancing application is evident in missions like the NASA's Cyclone GNSS (CyGNSS), originally designed to detect wind speed at sea in tropical cyclones measuring the Earth surface reflections of GNSS signals of opportunity.

Within this context, the capability to retrieve soil moisture through the exploitation of GNSS-R reflections by Artificial Neural Networks has been confirmed in the literature (e.g., see [1] and [2]). In this paper, a sophisticated Artificial Neural Network (ANN) algorithm is used to explore the impact of additional auxiliary data able to account for other factors affecting the GNSS-R signal. They include topography, Above Ground Biomass (AGB), land use, roughness, soil texture, soil porosity, and dynamic variables like Vegetation Water Content (VWC) and Vegetation Optical Depth (VOD) from Soil Moisture Active Passive (SMAP). It also considers data such as Land Surface Temperature (LST), Normalized Difference Vegetation Index (NDVI), Normalized Difference Water Index (NDWI) and Solar Induced Fluorescence (SIF) from Moderate Resolution Imaging Spectroradiometer (MODIS). Moreover, the effect of using latitude/longitude as input on the performances of the algorithm is assessed. The study also aims at evaluating the impact of different stratification approaches, setting up different ANN’s in different geographical and landcover-based stratifications. To assess how these variables contribute to improving the accuracy of soil moisture retrieval, the datasets are collocated in space and time and resampled onto the EASE grid v2.0 projection at 25km resolution. The algorithm is subsequently trained and validated using target soil moisture values derived from SMAP L3 global daily products and in-situ measurements from the International Soil Moisture Network (ISMN). The work has been carried out in the framework of the ESA Scout 2 HydroGNSS mission development, expected to be launched at the end of 2024.


Reference

[1]       E. Santi et al., “Combining Cygnss and Machine Learning for Soil Moisture and Forest Biomass Retrieval in View of the ESA Scout Hydrognss Mission,” Sep. 2022, doi: 10.1109/IGARSS46834.2022.9884738.

[2]       O. Eroglu, M. Kurum, D. Boyd, and A. C. Gurbuz, “High Spatio-Temporal Resolution CYGNSS Soil Moisture Estimates Using Artificial Neural Networks,” Remote Sensing 2019, Sep. 2019, doi: 10.3390/RS11192272.

How to cite: Izadgoshasb, H., Santi, E., Guerriero, L., Ambrogioni, V., and Pierdicca, N.: Exploring the importance of auxiliary datasets for soil moisture retrieval based on GNSS Reflectometry, EGU General Assembly 2024, Vienna, Austria, 14–19 Apr 2024, EGU24-8930, https://doi.org/10.5194/egusphere-egu24-8930, 2024.

EGU24-9030 | Orals | HS6.1

Project SoMMet - Metrology for multi-scale monitoring of soil moisture 

Miroslav Zboril and María de los Ángeles Millán Callado and the SoMMet Consortium

Soil moisture is one of the Essential Climate Variables as defined by the WMO Global Climate Observing System. Several soil moisture observation systems exist on multiple scales, however, poorly harmonized due to the lack of interlinks. There is a need to establish the chain of traceability, the metrological assessment of uncertainties and the harmonisation of soil moisture measurements within the hydrological cycle, on multiple scales ranging from point-scale sensors to satellite remote sensing techniques. In addition, there is an urgent need for real-time, continuous, high-quality, high-resolution and metrologically traceable and harmonised data on soil moisture.

To address these needs, the project SoMMet (Soil Moisture Metrology) has been set up in the framework of the European Partnership on Metrology of EURAMET. The aim of the project is to develop sound metrological tools and establish a metrological foundation for soil moisture measurement methods on multiple scales, supporting the traceability and harmonisation initiatives.

On the point scale (10-1 m – 101 m), novel primary and secondary standards of humidity measurement will be developed specifically for soil samples. On the intermediate range (102 m – 103 m), the metrological basis of the cosmic-ray neutron sensing (CRNS) method will be established. On the large scale (103 m – 104 m), satellite-based remote sensing techniques will be utilized to derive the soil moisture products. Based on dedicated comparison measurement campaigns, tools for cross-disciplinary harmonisation of the individual methods will be developed. Furthermore, soil moisture data fusion approaches will be researched, aiming at integrating the multi-scale soil moisture measurements to provide new schemes and recommendations to facilitate the generation of high-quality, temporally and spatially consistent soil moisture information useful for land surface sciences and applications.

The project consortium consists of nine National and Designated Metrology Institutes and nine research institutions. It cooperates with other projects and networks currently dealing with soil moisture monitoring and open issues of missing soil moisture harmonisation. The project 21GRD08 SoMMet has received funding from the European Partnership on Metrology, co-financed from the European Union’s Horizon Europe Research and Innovation Programme and by the Participating States.

How to cite: Zboril, M. and Millán Callado, M. D. L. Á. and the SoMMet Consortium: Project SoMMet - Metrology for multi-scale monitoring of soil moisture, EGU General Assembly 2024, Vienna, Austria, 14–19 Apr 2024, EGU24-9030, https://doi.org/10.5194/egusphere-egu24-9030, 2024.

EGU24-9990 | ECS | Posters on site | HS6.1

A Self-learning Weight Calibration Based Residual Dense Network for Soil Moisture Downscaling 

Yingtao Wei, Liupeng Lin, Jie Li, Ruyi Feng, and Huifang Li

Soil moisture is a key state variable in the ecosystem. However, existing soil moisture products often cannot have both high spatial resolution and long time series. Therefore, it is important to downscale the soil moisture products for fine application. So far,the soil moisture downscaling methods can be summarized as satellite-based methods, model-based methods, and learning-based methods. Satellite-based methods can integrate the advantageous features of different satellite, but face challenging in practical applications due to spatiotemporal differences and cloud coverage. Model-based methods offer superior interpretability of physical processes, but the model parameters are difficult to obtain and cannot fully characterize the non-linear mapping relationship in real physical processes. Learning-based methods have the prominent ability to fit nonlinear relationship, while existing learning-based methods do not take the correlation and redundancy between various covariates into consideration, and the extraction of key features is insufficient. Hence, we proposed Self-learning Weight calibration based soil moisture Downscaling Network (SWDN) to couple the learning-based model with the weight calibration strategy for improving the products accuracy, as shown in Fig 1.

The proposed SWDN constructs a complex mapping relationship model from multi-factor geoscience parameters to soil moisture. Under this framework, the residual dense connection network is adopted as the backbone for feature extraction and guides the reconstruction of soil moisture spatial information. The spatial weight and multi-factor weight self-learning modules are designed to adaptively calibrate feature weights of spatial direction and multi-factors, respectively. By updating parameters of above two modules, the weights of key features are enhanced and the weights of redundant features are weakened to achieve efficient extraction of discriminative features. Subsequently, under the assumption of scale invariance, model from geoscience parameters to soil moisture is fully trained on low spatial resolution data and applied on high spatial resolution geoscience parameters to generate high-precision soil moisture products. Experiments on the Western Continental United States dataset show that the proposed SWDN method exhibits superior performance with higher consistency with in-situ measurements and richer spatial texture information over the comparison methods. Compared to the state of the art downscaling methods, results demonstrate that the R and RMSE reach 0.44 and 0.077 , which improve 16% and 5% respectively. The maps of soil moisture distribution before and after downscaling are shown in Fig 2.

Fig.1. The structure of the SWDN method for soil moisture downscaling.

Fig.2. Mapping of SM distribution before and after downscaling on 2017.7.17. (a) Original SMAP; (b) BPNN downscaled SM; (c) DBN downscaled SM; (d) RDN downscaled SM;(e) SWDN downscaled SM.

How to cite: Wei, Y., Lin, L., Li, J., Feng, R., and Li, H.: A Self-learning Weight Calibration Based Residual Dense Network for Soil Moisture Downscaling, EGU General Assembly 2024, Vienna, Austria, 14–19 Apr 2024, EGU24-9990, https://doi.org/10.5194/egusphere-egu24-9990, 2024.

EGU24-10374 | ECS | Orals | HS6.1

High Resolution Soil Hydraulic Properties estimation from remotely sensed soil moisture time series. 

Robert Carles-Marqueño, Martí Perpinyà-Vallès, and Maria José Escorihuela

Accurate estimation of soil hydraulic properties, specifically field capacity (FC) and wilting point (WP), collectively known as Water Holding Capacity (WHC), is crucial for effective water resource management in agriculture and the environment. Traditionally, WHC is obtained through soil sampling and laboratory analysis. Pedo Transfer Functions (PTFs) have been developed to estimate WHC from soil composition data, simplifying the process but still relying on accurate soil measurements.

In response, we propose a novel algorithm for dynamic FC and WP estimation based on continuous soil moisture time series from remote sensing. This study includes a preliminary accuracy assessment of the downscaled 100-m soil-moisture time-series obtained from a combination of SMAP and Landsat data against in-situ stations from the International Soil Moisture Network (ISMN) which also include WP and FC measurements. Leveraging these long time series of soil moisture data enables a more nuanced and adaptive characterization of soil hydraulic properties over time. This approach recognizes the influence of factors such as precipitation, evapotranspiration, and land management practices on soil moisture variability.

Furthermore, we perform a comparative analysis with SoilHydroGrids’ WP and FC as a benchmark, to underscore the advancements, enhancements and potential limitations of our approach. Our results demonstrate a noteworthy enhancement in the estimation of Field Capacity, reducing the Root Mean Square Error (RMSE) from 0.15m³/m³ to 0.09m³/m³. Moreover, our algorithm exhibits slightly superior predictions for the wilting point when compared against laboratory measurements. Generally, our approach is capable of identifying a larger range of WP and FC values, which is also seen in the in-situ data.

How to cite: Carles-Marqueño, R., Perpinyà-Vallès, M., and Escorihuela, M. J.: High Resolution Soil Hydraulic Properties estimation from remotely sensed soil moisture time series., EGU General Assembly 2024, Vienna, Austria, 14–19 Apr 2024, EGU24-10374, https://doi.org/10.5194/egusphere-egu24-10374, 2024.

EGU24-11026 | ECS | Posters on site | HS6.1

Downscaling ESA CCI Soil Moisture: From 0.25° to 0.01° using a two-step machine learning approach 

Thomas Himmer, Carolina Damm, Luca Zappa, and Wouter Dorigo

Soil moisture (SM) is a key component of the Earth system and a key factor in climatological and hydrological processes as it regulates water, carbon and energy fluxes between land and atmosphere. For various applications – including monitoring and forecasting of hydro-climatic extremes (floods, droughts), forest fires, and crop yield estimation – high-resolution SM information is required. Currently, the ESA CCI (Climate Change Initiative) product provides a long-term, global record of SM with daily temporal resolution and a spatial resolution of 25km (0.25°). This coarse resolution can limit its usefulness in some of the mentioned fields of application.

This study aims to improve the spatial resolution of the ESA CCI SM product to 1km (0.01°) through machine learning, incorporating dynamic and static ancillary variables influencing the spatial organization of SM at this finer scale. This procedure consists of two steps, in which the coarse resolution data is first downscaled to 0.05° and then further to 0.01°. Currently, the ancillary variables used in the downscaling process consist of land cover information from the Copernicus Global Land Service (CGLS) including soil properties, land cover types, the Normalized Difference Vegetation Index (NDVI) and a digital elevation model. Recent assessments against in-situ measurements from the International Soil Moisture Network (ISMN) across Europe reveal that the downscaled SM offers a more detailed portrayal of the spatial distribution of SM compared to the original ESA CCI product while retaining the high temporal accuracy. However, these investigations also show that the impact of the NDVI on the model prediction is small.

In future iterations of the downscaling model, the goal is to explore possibilities for incorporating more influential variables that achieve greater information gain (e.g. Land surface temperature) and to examine other machine learning approaches in addition to the currently used random forest regressor to further improve the downscaling accuracy.

How to cite: Himmer, T., Damm, C., Zappa, L., and Dorigo, W.: Downscaling ESA CCI Soil Moisture: From 0.25° to 0.01° using a two-step machine learning approach, EGU General Assembly 2024, Vienna, Austria, 14–19 Apr 2024, EGU24-11026, https://doi.org/10.5194/egusphere-egu24-11026, 2024.

EGU24-11072 | ECS | Posters on site | HS6.1

Examining the Impact of Modeling Resolution on Soil Moisture Simulation Using Multi-Faceted Remote Sensing Data 

Shirin Moradi, Fang Li, David Mengen, Harry Vereecken, and Carsten Montzka

Sustainable irrigation practices are crucial for efficient water management, particularly as over 70% of the Earth's freshwater is dedicated to agricultural production. This study delves into the importance of optimizing modeling resolution to achieve reliable soil moisture assessments.

Here, we investigate the spatio-temporal soil moisture simulation at the root zone on the Rur catchment in western Germany (covering approximately 2300 km2). Employing high spatial resolutions of 500 and 250 meters, our investigation utilizes CosmoRea6 atmospheric data and World Soil Information (ISRIC) soil grid and texture data to comprehensively characterize soil properties. The coupled land surface-subsurface model (CLM-ParFlow) is applied, considering intricate hydrological processes within the soil-plant-atmosphere system. Validation is conducted through a multi-faceted approach, incorporating data from the Soil Moisture Active Passive (SMAP) satellite, Cosmic-ray Neutron Sensor (CRNS) stations, and Synthetic Aperture Radar (SAR)-Sentinel-1, with a specific focus on the soil moisture assimilation using high-resolution Sentinel-1 data.

The study explores the belief that increasing the resolution of input data and employing data assimilation techniques with high-resolution remote sensing data enhance the reliability of simulated soil moisture, particularly in areas with diverse soil textures and land uses. The outcomes bear significant implications for optimized modeling resolution, considering computational costs and sustainable irrigation practices. This understanding of soil moisture dynamics empowers stakeholders in agriculture to optimize water usage, improve crop productivity, and minimize environmental impacts.

How to cite: Moradi, S., Li, F., Mengen, D., Vereecken, H., and Montzka, C.: Examining the Impact of Modeling Resolution on Soil Moisture Simulation Using Multi-Faceted Remote Sensing Data, EGU General Assembly 2024, Vienna, Austria, 14–19 Apr 2024, EGU24-11072, https://doi.org/10.5194/egusphere-egu24-11072, 2024.

EGU24-11186 | ECS | Orals | HS6.1 | Highlight

Fiducial Reference Measurements for Soil Moisture (FRM4SM): recent progress in error source identification and traceable uncertainty budget calculation 

Irene Himmelbauer, Daniel Aberer, Nicolas Bader, Wolfgang Preimesberger, Wouter Dorigo, François Gibon, Arnaud Mialon, Philipp Richaume, Monika Tercjak, Alexander Boresch, Raffaele Crapolicchio, and Alexander Gruber

In situ soil moisture data is used as the main reference for the validation of satellite soil moisture products.  Although in situ measurements are often referred to as the “ground truth” and we have an understanding of the error sources, the magnitudes of the uncertainties associated with in situ measurements and methods to eliminate these uncertainties are hardly known. However, in order to achieve the best possible Return Of Investment (ROI) for a satellite mission, reliable and fully characterized in situ reference datatsets are crucial.

ESA`s Fiducial Reference Measurement for Soil Moisture project (FRM4SM) was launched in 2021 to tackle the establishment of comprehensive and fully characterized, traceable uncertainty budgets for in situ soil moisture observations at the satellite footprint scale. The project aims to address the following scientific questions to facilitate the creation and exploitation of such Fiducial Reference Measurements (FRMs), using the International Soil Moisture Network (ISMN) as the in situ source and ESA’s Soil Moisture and Ocean Salinity (SMOS) mission as an example satellite product:

(1) understand the status quo and means to establish an (SI-)traceable uncertainty budget for in situ soil moisture measurements

(2) identify error sources that impact the in situ measurement

(3) create quality indicators that allow to identify the most reliable “soil moisture FRMs” from the ISMN

(4) verify and demonstrate the merit of these select soil moisture FRMs within validation case studies,

(5) create protocols and procedures for the creation and use of such an FRM subset,  which are built upon community=agreed standards and practices

(6) integrate the established FRM dataset and all developed validation methods into the freely-accessible Quality Assurance for Soil Moisture (QA4SM) online validation service

In this presentation, we will introduce the FRM4SM project and highlight our latest achievements and ongoing developments. Furthermore, we will discuss future directions, and give insights into challenges that need to be overcome in order to achieve a traceable uncertainty budget calculation for in situ soil moisture data at the satellite footprint scale.

How to cite: Himmelbauer, I., Aberer, D., Bader, N., Preimesberger, W., Dorigo, W., Gibon, F., Mialon, A., Richaume, P., Tercjak, M., Boresch, A., Crapolicchio, R., and Gruber, A.: Fiducial Reference Measurements for Soil Moisture (FRM4SM): recent progress in error source identification and traceable uncertainty budget calculation, EGU General Assembly 2024, Vienna, Austria, 14–19 Apr 2024, EGU24-11186, https://doi.org/10.5194/egusphere-egu24-11186, 2024.

EGU24-11338 | Orals | HS6.1 | Highlight

SMOS after 14 years in orbit:Status, Achievements, and future plans 

Yann Kerr

The ESA (European Space Agency) led SMOS (Soil Moisture and Ocean Salinity) mission, operating since November 2009, is the first satellite dedicated to measuring surface soil moisture and ocean salinity. It has been now in operation continuously for more than 14 years, delivering a wealth of new measurements including the first time ever global, frequent, quantitative and absolute measurements of soil moisture and ocean salinity. From these measurements a large number of science and applied products have emerged ranging from strong wing or thin sea ice thickness to root zone soil moisture or biomass but also fire or flood risks prediction, snow density or freeze thaw to name but a few. Operational users (such as numerical weather prediction) have also emerged. To obtain such results several challenges had to be addressed and overcome but results show the uniqueness of L band radiometry for some crucial water cycle measurements.

Currently, using the long term data set and developing approaches to extend it in time, climate trends can start to be considered as well as teleconnections and SMOS is contributing to a large number of ECV (Essential Climate Variables) / CCI (Climate Change Initiative). At the time of writing SMOS is in very good condition and can last for a few more years, extending the length of the data sets but will not last forever. Consequently the team is both investing time in new or improved science and application products but also on potential follow on mission which would be very much similar to SMOS (or SMAP) but with a significantly improved spatial resolution.

The presentation will give an overview of the most striking new results as well as future plans.

How to cite: Kerr, Y.: SMOS after 14 years in orbit:Status, Achievements, and future plans, EGU General Assembly 2024, Vienna, Austria, 14–19 Apr 2024, EGU24-11338, https://doi.org/10.5194/egusphere-egu24-11338, 2024.

EGU24-11565 | ECS | Orals | HS6.1 | Highlight

Advancing soil moisture estimation across scales: insights from the SoMMet Project  

Sadra Emamalizadeh, Alessandro Pirola, Cinzia Alessandrini, Anna Balenzano, and Gabriele Baroni

The accurate estimation of soil moisture is fundamental for understanding hydrological processes and optimizing water resource management, particularly in agricultural areas. The SoMMet project, a joint research project within the Programme 'European Partnership on Metrology' of EURAMET, contributes significantly to this field by developing and establishing a metrological framework for soil moisture measurements covering lateral scales ranging from the decimetre to kilometre. Among the different research activities, the project aims to compare and harmonize various soil moisture observation methods, addressing their uncertainty, sensing volume, and systematic effects. This involves a systematic review of methods, comparison of their spatial and temporal characteristics, and the development of a harmonization approach.

In line with these activities, in this contribution we present the comparison performed between a remote sensing product, Soil Water Index (SWI) by Copernicus Global Land Service (CGLS), and soil moisture estimated by ground-based Cosmic-Ray Neutron Sensors (CRNS). The study, conducted in 4 sites in Northern Italy, spans the entire growing season of 2021 and incorporates SWI data at multiple depths. We explore the correlation between vegetation vigor (NDVI) and soil moisture trends to understand the spatial mismatch among soil moisture products. The results show a general good correlation between remote sensing and ground measurements. The agreement between the two soil moisture observations, however, is not consistent in time. The differences are mainly attributed to the role of the vegetation.

This research is pivotal for identifying representative spots for ground measurements, enhancing the utility of soil moisture products across applications. In conclusion, our abstract showcases the importance of advancing soil moisture estimation methods, addressing uncertainties and representativeness. The integration of metrological principles, harmonization approaches, and comparisons between different observation methods demonstrates the holistic approach in enhancing our understanding of soil-water dynamics.

How to cite: Emamalizadeh, S., Pirola, A., Alessandrini, C., Balenzano, A., and Baroni, G.: Advancing soil moisture estimation across scales: insights from the SoMMet Project , EGU General Assembly 2024, Vienna, Austria, 14–19 Apr 2024, EGU24-11565, https://doi.org/10.5194/egusphere-egu24-11565, 2024.

EGU24-11751 | Posters virtual | HS6.1

Evaluation of Copernicus and SMAP soil moisture products in an almond orchard in southeastern Spain 

Juan Manuel Sánchez, Elisabet Walker, Álvaro Sánchez-Virosta, and Alfonso Calera

Soil moisture (SM) plays an important role in the interactions between the atmosphere and the land surface, and has been widely recognized as a key variable of the climate system. Over the last decades, several global satellite products have been generated to monitor SM at different spatial and temporal resolutions. To use these products it is important to validate them with in-situ observations. In this study, the performance of the Soil Water Index (SWI) and Surface Soil Moisture (SSM) Copernicus’s products and the Soil Moisture Active Passive (SMAP) SMAP L3_SM_P_E product was evaluated over an irrigated almond orchard located in the semiarid area of Tarazona de la Mancha, Spain (39.2660N, -1.9397W). The almond trees were planted in 2017 in a homogeneous field of about 10-ha. The Copernicus SSM and SWI products at 1-km spatial resolution provide daily SM images covering Europe since 2015. The SSM is retrieved from the Sentinel-1 radar backscattering and SWI combines Sentinel-1 and Metop ASCAT data. The Level-3 SMAP product provides SM data every 2-3 days retrieved by the SMAP radiometer. SMAP L3_SM_P_E has a spatial resolution of 9 km. Here, the moisture content in the topsoil (5 cm) estimated by the satellite products was evaluated against observed SM measurements for the 2019-2023 period. Even though the field sensor registers SM data at different depths (10-120 cm), the SM observations of the first 10 cm were used to analyze the remote sensing products. The accuracy of the products was defined using the following statistics; the determination coefficient (R2), the root mean square difference (RMSD), bias, and the unbiased root mean square difference (ubRMSD). The results obtained show that in general, the evaluated products capture the temporal variability of the SM measurements. For SSM and SMAP differences against in-situ data resulted in RMSD of about 4.34 vol% and 4.85 vol%, respectively. Also, SMAP overestimates the observed data with a considerable bias of 3.60 vol%. These deviations could be due to the coarse spatial resolution, however, it achieves the highest correlation (R2=0.64). SSM shows a good agreement with in-situ measurements, yielding the lowest bias (bias=0.10 vol%), but poorer R2 than the other evaluated datasets (R2=0.22). The SWI product (RMSD=3.79 vol%, ubRMSD=3.73 vol%, R2=0.36, and bias=0.66 vol%) performs the best compared to SMAP and SSM. These results obtained in almonds are comparable to validation results published for other regions and land covers. Therefore, it is possible to indicate that satellite SM data and, specifically the SWI product could benefit the local water resources management.

How to cite: Sánchez, J. M., Walker, E., Sánchez-Virosta, Á., and Calera, A.: Evaluation of Copernicus and SMAP soil moisture products in an almond orchard in southeastern Spain, EGU General Assembly 2024, Vienna, Austria, 14–19 Apr 2024, EGU24-11751, https://doi.org/10.5194/egusphere-egu24-11751, 2024.

EGU24-12005 | ECS | Posters virtual | HS6.1

A Machine Learning Framework for Extending SMOS Surface Soil Moisture Observations over Canada 

Jeenu John, Laxmi Sushama, and Shinto Roose

Continuous and long-term surface soil moisture (SSM) data is essential for advancing the understanding of land-atmospheric interactions and climate change studies. Despite the contributions of different satellite missions in acquiring SSM measurements, the presence of data gaps poses a significant challenge. In this study, a machine learning (ML) framework is developed to expand the Soil Moisture Ocean Salinity (SMOS) SSM observations in both spatial and temporal domains over Canada. In the initial phase of the proposed framework, ML models, including random forest (RF) and convolutional neural network (CNN), are trained and validated using SSM-relevant climatic and geophysical variables extracted from the fifth-generation European Centre for Medium-Range Weather Forecasts (ECMWF) reanalysis data (ERA5) for the 2011 to 2020 period and SMOS SSM for the same period as the target variable. While evaluating the developed models with unseen data from the years 2021 and 2022, the RF model shows slightly better performance when compared to that of CNN. The average root mean square error (RMSE) for RF is 0.0369 m3/m3 (Pearson correlation coefficient, R=0.94), while for CNN, the RMSE is 0.0494 m3/m3 (R= 0.89), with prediction biases mostly noted for regions with large inter-annual variability. Similarly, RF and CNN yield average RMSE values of 0.014 m3/m3 and 0.0635 m3/m3, respectively, when evaluated for spatial filling for the case of grid cells excluded during the training process. Hence, in the second phase of the proposed framework, the RF model is selected to extend the SMOS dataset for the 2008-2010 period. The temporal correlation analysis between the extended SMOS and Advanced Scatterometer (ASCAT) indicates reasonable correlations with values above 0.6, while the spatial correlation analysis reveals similar patterns between the two datasets, with smaller values for the summer season owing to the importance of local processes on SSM during this period. However, spatiotemporal extension of SSM to encompass surface types excluded during training remains a challenge and needs further studies. The developed framework holds the potential to address the spatio-temporal data gaps in other regions since both datasets are globally available.

How to cite: John, J., Sushama, L., and Roose, S.: A Machine Learning Framework for Extending SMOS Surface Soil Moisture Observations over Canada, EGU General Assembly 2024, Vienna, Austria, 14–19 Apr 2024, EGU24-12005, https://doi.org/10.5194/egusphere-egu24-12005, 2024.

EGU24-12837 | ECS | Orals | HS6.1

Mapping Regional Sub-Surface Soil Moisture Dynamics and Extremes on the Large Scale Through Data Fusion 

Toni Schmidt, Martin Schrön, Steffen Zacharias, Till Francke, and Jian Peng

Soil moisture products play a pivotal role in monitoring and predicting droughts that affect crop yield, water supply, and land–atmosphere interactions. The availability of various satellite-based soil moisture products allows for a comprehensive investigation of droughts on a large scale. However, limitations in their spatial sampling impact their suitability for regional applications. Accurately inferring sub-pixel heterogeneity is crucial for a representative understanding of regional dynamics and their implications for drought assessment across diverse landscapes. Furthermore, the shallow vertical support of satellite-based soil moisture products hinder the detection and quantification of droughts within the sub-surface. This study leverages multi-scale data fusion, aiming to replicate soil moisture extremes both regionally and in the sub-surface. We integrate ground-based Cosmic-Ray Neutron Sensing (CRNS) data, representing soil moisture within an extensive soil volume, with high-resolution Sentinel-1 data. Employing machine learning models that account for spatiotemporal autocorrelations, our objective is to generate gridded soil moisture data representing regional sub-surface dynamics. Tested in a German catchment, our approach tackles challenges associated with the scarcity of CRNS stations and the complexities of integrating multi-scale data. Our findings establish a foundation for monitoring regional droughts in the sub-surface across extensive areas.

How to cite: Schmidt, T., Schrön, M., Zacharias, S., Francke, T., and Peng, J.: Mapping Regional Sub-Surface Soil Moisture Dynamics and Extremes on the Large Scale Through Data Fusion, EGU General Assembly 2024, Vienna, Austria, 14–19 Apr 2024, EGU24-12837, https://doi.org/10.5194/egusphere-egu24-12837, 2024.

Soil moisture is a significant factor in Earth’s hydrological cycles that influences weather, drought, climate, and water resources on land and in water bodies. However, throughout most of the 20th century, soil moisture received less attention and was not included in many hydrological studies. In the 1978, J. W. Deardorff with the United States’ National Center for Atmospheric Research started to demonstrate the relationship between soil moisture and meteorologic conditions. Just two years later in 1980, G. C. Topp at the University of Toronto developed the Topp Equation - the first empirical calibration for soil moisture using time domain reflectometry (TDR). Additionally, that same year, M. T. van Genuchten published the van Genuchten Equation, which established a numerical relationship between soil moisture an unsaturated hydrologic head. Starting in the 1990s, the United States Department of Agriculture began using impedance-based soil moisture sensor technology to equip SNOTEL sites for water shed scale water supply forecasts. Since then, numerous large-scale regional meteorological networks incorporate soil moisture sensors, often referred to as ‘mesonets’, have emerged worldwide.


Soil water dynamics is complex often not well understood. Analytical methods using electromagnetic principles rely on the behavior and distribution electromagnetic energy in soil, making the operational theory of commercial sensors unclear at times. Soil moisture exhibits significant variabilities in space and time, as well as being influenced by hydrological and mineralogical properties of the soil. These factors give rise to several misconceptions about soil moisture monitoring.


This presentation discusses the growing importance of soil moisture as a critical parameter of the Earth’s hydrological cycle. This discussion also focuses on the objective and goals of North American soil moisture monitoring networks. Furthermore, the availability and emerging electromagnetic sensor technologies are reviewed. Lastly, calibration and validation soil sensors are also examined.

How to cite: Farsad, A. and Bellingham, K.: A Review of Regional and National Meteorological Networks offering soil moisture sensors and a review of the analytical methodology, EGU General Assembly 2024, Vienna, Austria, 14–19 Apr 2024, EGU24-13050, https://doi.org/10.5194/egusphere-egu24-13050, 2024.

High-resolution soil moisture is key for a wide range of applications such as water resources management, agriculture, and natural hazard monitoring and prediction. In the last few decades, the prominent approach for deriving high resolution soil moisture fields over large areas has been downscaling of satellite observations. These approaches, which are mainly machine learning based, use the coarse resolution estimate from the satellite, combine it with other variables which impact soil moisture distribution (e.g., landcover, topography, soil characteristics) and/or other remote sensed products with higher spatial resolution, and use the in-situ soil moisture observations for training/testing.

Here, we follow a different approach, which takes advantage of physics-based hydrological simulations. First, we create a downscaling playground by using historical simulations of the hydrological model ParFlow-CLM over the continental USA (CONUS). We use the 1 km2 run as our high-resolution estimate, and an upscaled version (averages over 10x10 km2 gridcells) as representative of the coarse resolution estimate. By doing this, we remove two of the biggest issues when downscaling soil moisture: first, we know there’s a perfect match between high- and low-resolution soil moisture and second, we can train and test the model freely over the entire domain, as information is available for every gridcell, without being constrained by the number/locations of in-situ stations. In terms of downscaling approach, we use a random forest model, trained on coarse resolution soil moisture, drainage area, slope, elevation, hydraulic conductivity, porosity, and landcover. We carry out several experiments changing the locations and timing of both the training and testing sets. These experiments allow us, for example, to test whether the in-situ stations available are adequate in number and representative of the entire domain for reliable downscaled products.

Finally, we take advantage of this playground to develop a new downscaling product. We train the same random forest model, but over the CONUS domain, using all gridcells. This results into a model that has learned the spatial scaling of soil moisture between the two resolutions and can predict the 1 km2 over CONUS, fed by a 10x10 km2 estimate in addition to static predictors. We then use the model in a predictive mode, feeding it the coarse resolution estimate from Soil Moisture Active Passive (SMAP) satellite, creating a high-resolution (1 km2) version of SMAP soil moisture.

How to cite: Leonarduzzi, E. and Maxwell, R. M.: Soil moisture downscaling based on physics-based hydrological simulations: a downscaling playground and a novel high-resolution downscaling product for the continental USA, EGU General Assembly 2024, Vienna, Austria, 14–19 Apr 2024, EGU24-13282, https://doi.org/10.5194/egusphere-egu24-13282, 2024.

EGU24-14333 | ECS | Posters virtual | HS6.1

Soil Moisture estimation using GNSS- A spatiotemporal analysis 

Kirthana Somaskandan, Ravi prakash Kumar, and Balaji Devaraju

Soil moisture plays a predominant role in driving the hydrological cycle, being the initial terrestrial variable to interact with precipitation. Its inherent temporal and spatial variability leads to complexity in estimation. Numerous hydrological and climate models adopt a simplified approach by treating soil moisture as a constant parameter in certain regions. While this simplification is intended to streamline complexity, it often introduces inaccuracies and uncertainties into these models. Conventional methods of measuring soil moisture are point-based, requiring labor-intensive, time-consuming, and often destructive procedures. The Soil Moisture Active Passive (SMAP) satellite, designed for soil moisture estimation, operates with a temporal resolution of 3 days and fails to capture the occurrences of extreme events. This study tries to overcome those limitations by estimating soil moisture daily using GNSS-Reflectrometry mission CYGNSS, which has a temporal resolution of 7 hours. The primary observable is the surface reflectance which depends on the surface property of the ground. Ulaby developed a water cloud model to estimate soil moisture using surface reflectance irrespective of LULC. An extended water cloud model was proposed that includes the Leaf Area Index of the land cover in the Chambal sub-basin of Ganga Basin, India. Using SMAP as a reference, The extended water cloud model achieved a correlation of 76.16 % in barren land (RMSE of 0.014) which is higher than in vegetated land with a correlation of 74.42 %. 

How to cite: Somaskandan, K., Kumar, R. P., and Devaraju, B.: Soil Moisture estimation using GNSS- A spatiotemporal analysis, EGU General Assembly 2024, Vienna, Austria, 14–19 Apr 2024, EGU24-14333, https://doi.org/10.5194/egusphere-egu24-14333, 2024.

This study aims to improve the ESA CCI soil moisture dataset uncertainty estimates by including the sampling uncertainty of the triple collocation analysis in the uncertainty propagation of the data merging scheme. The ESA CCI soil moisture product merges data from multiple sensors through a weighted average. This strategy aims to increase both the temporal and spatial sampling density while reducing random retrieval errors. Optimal error reduction is obtained by assigning the weights according to each sensor’s specific uncertainty characteristics, expressed as σi-2/(∑σj-2) . The uncertainties σi are determined via triple collocation analysis (TCA) applied to soil moisture estimates from a land surface model, and from a passive and an active microwave satellite instrument.

However, the uncertainty estimates obtained from TCA are themselves uncertain as a result of finite sample size. Notably, this ‘uncertainty of the uncertainty’ (UU) can be derived analytically for simple error models, but lacks a similar analytical solution for the affine error model (which includes both additive and multiplicative biases) employed in the CCI SM algorithm.

The magnitude of the UU has serious implications for the weighted averaging and the resulting uncertainty of the merged products: 1) it introduces an additional term in the uncertainty of the merged product stemming from the uncertainty of the weights themselves, and 2) the UU can reach a threshold, where the weighted average yields worse results than an unweighted average. In this study, we calculate the UU via bootstrapping of the TCA results for three sensors (ASCAT, SMAP and SMOS) and investigate its impact on the uncertainty of the merged dataset.

How to cite: Formanek, M., Gruber, A., and Stradiotti, P.: What is the uncertainty of the uncertainty and (why) does it matter?  Propagating uncertainties of weight estimates through soil moisture data merging, EGU General Assembly 2024, Vienna, Austria, 14–19 Apr 2024, EGU24-14987, https://doi.org/10.5194/egusphere-egu24-14987, 2024.

Satellite products of hydrological variables are essential to understanding the spatial and temporal variability of the earth's system of systems, for example, the hydrosphere and its intricate interactions with the biosphere and the atmosphere. Hydrological products from multiple satellites are regularly harmonised to produce long-term synoptic climate data records. The fidelity of these satellite-based climate records forms the backbone to quantify and analyse the variability of the water cycle and the effect of climate change over extended temporal and spatial scales. This fidelity is assessed with statistical metrics that measure the goodness of fit (GoF) between satellite products and in-situ measurements. Commonly used GoF metrics include: the slope and intercept of type-II regression, determination coefficient R2, and difference metrics like bias, root means squared differences, mean absolute differences (MAD) and their relative measures. These metrics do not need to be in harmony, for example, a high R2 value is not necessarily associated with a close-to-unity slope, or a low bias is not ineludibly translated to a low MAD. Presenting these metrics in a table for comparing various retrieval models makes it even more challenging to draw clear conclusions. In part, this confusion could be mitigated by using statistical charts, for example, Taylor or radar diagrams. These diagrams offer the capability to graphically summarise how closely satellite products match the measurements. Nonetheless, there is no unique measure that can be used to describe the GoF. In this essay, we develop a universal methodology with the capability of providing the scientific community with a quantitative and holistic measure of GoF of satellite products. The method ingests statistical validation metrics commonly employed in hydrology or any specific discipline of geoscience, transforms them into unity scalars with the same direction (0 is low and one is high accuracy) and projects them into a unity circle.  The resulting area is then calculated and normalised to the maximum expected area for a percentage GoF measure. As the projection is equiangular, each unique sequence of the employed metrics will give a different answer. With permutation, the GoF values are calculated from all possible sequences. The maximum possible accuracy and the largest probable uncertainty are subsequently derived from the resulting population. This procedure results in a unique GoF that integrates all used validation metrics and provides a collective measure of accuracy. Although it was developed for satellite-derived hydrological products, the proposed method can be applied to any statistical metrics used to measure the goodness of fit between modelled and measured biophysical variables.

How to cite: Salama, S.: Validation of satellite hydrological products: which goodness-of-fit to use?, EGU General Assembly 2024, Vienna, Austria, 14–19 Apr 2024, EGU24-15155, https://doi.org/10.5194/egusphere-egu24-15155, 2024.

EGU24-16013 | Posters on site | HS6.1

Potential of Deep Learning based quality control methods for soil moisture time series in an operational data service 

Wolfgang Korres, Tunde Olarinoye, Fay Boehmer, Kasjen Kramer, Stephan Dietrich, Marcel Reinhardt, and Matthias Zink

Soil moisture and its measurements are important in various fields and applications, from agriculture and hydrology to climate modelling, ecology and ecosystem health management. The monitoring of soil moisture gained widespread recognition in the early 2000s as an integral component of the hydrological and meteorological observation systems. This momentum was accelerated with the establishment of several soil moisture monitoring networks. The collection of data from different networks with a diversity of sensors and data formats, harmonization, quality control, archiving of in situ soil moisture data and ensuring the free accessibility of this data for end-users underline the motivation behind the foundation of the International Soil Moisture Network (ISMN) in 2009.

All in situ data sourced from the different providers undergo two quality checks. First, a visual inspection of the data excluding near real-time data and second, a rule-based automatic quality control procedure before inclusion in the ISMN database to ensure high quality research-ready soil moisture data for end-user. Thirteen different plausibility checks are applied to every singular hourly observation, which is flagged then as dubious if one of these checks fail, otherwise as “good”. These plausibility checks can be categorized into: i) a geophysical range verification, detecting the exceedance of certain thresholds (e.g., soil moisture values below 0 Vol.-%), ii) geophysical consistency methods, taking either ancillary in situ data if available or NASA’s GLDAS Noah data into account. An example is the flagging of soil moisture where soil temperature is negative). And iii) spectrum-based approaches, using the first and second derivatives of the entire soil moisture timeseries to detect dubious soil moisture patterns (i.e., spikes, breaks, and plateaus).

Publications in recent years point to the great potential of Deep Learning (DL) based methods for identifying anomalies in time series data. In this study, the potential of Long Short-Term Memory (LSTM) and Transformer models for anomaly detection in soil moisture time series is being investigated. Therefore, randomly selected time series from the ISMN are manually (visually) quality flagged (labelled). In order to be able to label these data we developed a guidance how to visually quality control in situ soil moisture data. Different Deep Learning methods in combination with varying external data sets (e.g. precipitation time series) are validated against the manually labelled data and compared to the previously implemented flagging method. The method will be further developed and evaluated for its use in ISMN operations. The incorporation of additional flagging information, especially when enhanced by Deep Learning methods, is anticipated to lead to a better usability of soil moisture data, as well as promoting a more robust quality control by the ISMN for its users in the future.

How to cite: Korres, W., Olarinoye, T., Boehmer, F., Kramer, K., Dietrich, S., Reinhardt, M., and Zink, M.: Potential of Deep Learning based quality control methods for soil moisture time series in an operational data service, EGU General Assembly 2024, Vienna, Austria, 14–19 Apr 2024, EGU24-16013, https://doi.org/10.5194/egusphere-egu24-16013, 2024.

EGU24-16136 | ECS | Posters on site | HS6.1

Using fiducial reference measurements for assessing soil moisture product stability 

Daniel Aberer, Nicolas Bader, Irene Himmelbauer, Wolfgang Preimesberger, Alexander Boresch, Monika Tercjak, François Gibon, Arnaud Mialon, Raffaele Crapolicchio, Wouter Dorigo, and Alexander Gruber

The Global Climate Observing System Essential Climate Variables (GCOS ECVs) requirements define a target threshold of 0.005 m³/m³ per decade for satellite soil moisture product stability. As admitted by GCOS, this threshold lacks robust justification in the scientific literature, prompting critical assessment. Moreover, no commonly-accepted method exists to assess satellite soil moisture product stability to begin with.

In this study, we investigate the suitability of existing in situ soil moisture monitoring networks contained in the International Soil Moisture Network (ISMN) for stability assessment. The selection of such stable reference sites is based on two criteria: (i) sites that are considered “fiducial reference sites” as defined by the Fiducial Reference Measurements for Soil Moisture (FRM4SM) project; and (ii) sites that provide suitable temporal coverage for the time spans over which satellite product stability is required (i.e., 10 years or more).  Using these select reference sites, we assess the stability of various common satellite soil moisture products (e.g., ASCAT, SMOS) using Theil-Sen slopes that are calculated for various validation metrics (e.g., median annual Pearson correlations or unbiased Root Mean Square Differences). In addition, we investigate the impact of data gaps and scarcity on the calculated stability metrics.

Analyses were carried out using the the python toolbox for evaluating soil moisture observations (pytesmo; https://github.com/TUW-GEO/pytesmo). The goal is to include stability metrics as part of the QA4SM online validation service in the future (https://qa4sm.eu/).

How to cite: Aberer, D., Bader, N., Himmelbauer, I., Preimesberger, W., Boresch, A., Tercjak, M., Gibon, F., Mialon, A., Crapolicchio, R., Dorigo, W., and Gruber, A.: Using fiducial reference measurements for assessing soil moisture product stability, EGU General Assembly 2024, Vienna, Austria, 14–19 Apr 2024, EGU24-16136, https://doi.org/10.5194/egusphere-egu24-16136, 2024.

EGU24-16181 | ECS | Orals | HS6.1

SoilMoist: A global network of soil moisture observations based on emerging low-cost technologies. 

Katoria Lesaalon Lekarkar, Jonas Lembrechts, Stefaan Dondeyne, and Ann van Griensven

Soil moisture plays a crucial role in the earth's system cycle by connecting the water, energy, and carbon cycles. It actively influences hydrological processes and affects the occurrence of climate-related hazards, such as droughts, heatwaves, and wildfires.

This places soil moisture at the centre of agro- and biometeorological monitoring and forecasting. Despite its crucial role, the global network of soil moisture observations remains the least developed among the major land-based components of the hydrological cycle, with strong regional imbalances in coverage. Remote sensing products provide spatially and time-continuous alternatives to in-situ soil moisture data. However, these products remain coarse in spatial resolution and the lack of in-situ validation data in data-scarce regions such as Africa undermines the application of such products.

The emergence of low-cost technologies has enabled the deployment of monitoring networks that provide large spatial coverage at a fraction of the cost of traditional monitoring networks, offering unique opportunities to upscale coverage and address data scarcity. One such device is the TMS-4 logger from TOMST which has found wide application globally due to its robustness, high temporal resolution, large data storage, and long battery life, guaranteeing independent data collection over an extended period. TMS loggers also offer the advantage that a large amount of georeferenced timeseries data from these devices has already been compiled into the global SoilTemp-database (a database currently largely focused on temperature data). The available timeseries of observations from these devices already covers all the continents (including Antarctica) and comprise observations from close to 10,000 locations that are currently hosted within SoilTemp, with ongoing deployment in at least 9 African countries. Our mission is thus firstly, to consolidate this data as submitted in its raw form to the SoilTemp database, adequately calibrate it, and ultimately avail it as an open-access resource. This global coordination and standardization offer the opportunity to integrate this data into the existing global database of soil moisture monitoring (the International Soil Moisture Network). Secondly, we aim to increase global coverage of soil moisture monitoring using the low-cost TOMST TMS-4, and further facilitate its use by non-scientists in citizen science projects across the globe. The result of this initiative should be a drastic increase in the global coverage of soil moisture data, especially in data-scarce areas such as Africa, which would provide an indispensable resource for validating satellite products, improving drought monitoring, and countless other environmental applications.

How to cite: Lekarkar, K. L., Lembrechts, J., Dondeyne, S., and van Griensven, A.: SoilMoist: A global network of soil moisture observations based on emerging low-cost technologies., EGU General Assembly 2024, Vienna, Austria, 14–19 Apr 2024, EGU24-16181, https://doi.org/10.5194/egusphere-egu24-16181, 2024.

EGU24-16418 | ECS | Orals | HS6.1

Surface Soil Moisture retrieval via change detection using SAOCOM L-band data over the Po Valley (Italy) 

Benedetta Brunelli, Davide Festa, Francesco Mancini, and Wolfgang Wagner

Synthetic Aperture Radar (SAR) has a high potential for measuring superficial soil moisture (SSM) dynamics over regional and global scales. Taking advantage of the continuous supply of Sentinel-1 C-band acquisitions, soil moisture is operationally mapped at kilometer-scale resolution using a change detection method (https://land.copernicus.eu/global/). However, the superimposed effect of the vegetation layer causes significant biases in the retrieval over densely vegetated areas or crop fields characterized by seasonal variations. L-band SAR data, due to their penetration capabilities through the canopy, are sensitive to SSM even where higher-frequency signal gets strongly attenuated. However, data availability has remained limited to a few space missions, e.g. ALOS and ALOS-2. Accordingly, limited applications have investigated the use of change detection models using L-band SAR satellite data.

In the context of the current development of new active L-band satellites, such as SAOCOM (2018), ALOS-4 (2023), NISAR (2024), Tandem-L (2024), and Rose-L (2028) this work aims to explore the potential of SAOCOM data, which has become available since July 2022 over the European territory, to track soil moisture variations underneath crops and natural vegetation. L-band backscattering responses have been jointly evaluated in respect of Sentinel-1 data.

A preprocessing workflow for SAOCOM Single Look Complex (SLC) acquisitions is developed to produce a 1 km co-polarized backscattering time series. The topics addressed are i) the improvement of coregistration between the different SAR sensors; ii) the use of radiometric terrain corrected gamma nought compared to the standard ground range detected (sigma nought) data; iii) the effect of SAOCOM acquisition strategies, such as incidence angle variation and inhomogeneous coverage, on the backscattering trends; iv) the optimization of the dynamic masking procedure to exclude low sensitivity pixel. Subsequently, the preprocessed scenes are ingested into an EO data cube (TUW-GEO/yeoda) and the well-established change detection method is implemented. The methodology is tested over the Po Valley (Italy), where the constellation achieves the highest revisit frequency. The resulting SSM product is compared to Sentinel-1 gamma nought retrievals and to modeled SSM from ERA5-Land reanalysis.

Preliminary results show the potential of SAOCOM data for soil moisture mapping below the vegetation layer, which is essential for studying the effect of SSM climate-linked variations on vegetation growth, and could serve as a foundation for the development of multifrequency approaches.

How to cite: Brunelli, B., Festa, D., Mancini, F., and Wagner, W.: Surface Soil Moisture retrieval via change detection using SAOCOM L-band data over the Po Valley (Italy), EGU General Assembly 2024, Vienna, Austria, 14–19 Apr 2024, EGU24-16418, https://doi.org/10.5194/egusphere-egu24-16418, 2024.

Land data assimilation systems, by assimilating land surface remote sensing observations, such as soil moisture (SM) products from SMAP, SMOS, and AMSR2, and combining the advantages of the land surface model, are able to produce spatiotemporally seamless data on the state of the land surface, including soil moisture and temperature in the surface layer and rooting zone, as well as energy fluxes at the surface. However, because of the coarse resolution of prevailing passive microwave soil moisture remote sensing products as well as the lesser accuracy of high-resolution soil moisture products, there is no high-resolution land data assimilation system available.

In this study, we developed a high-resolution land data assimilation system by using a machine learning algorithm in combination with a dual-cycle assimilation system. We first used random forests to generate high-resolution soil moisture products from passive microwave soil moisture, and then used the dual-cycle assimilation system to correct the bias of the soil moisture products and assimilated them into the land surface model, and finally produced high-resolution land surface state datasets.  The high-resolution assimilation system was validated on observations from three soil moisture observation networks on the Tibetan Plateau. The results show that the system is capable of producing reliable soil moisture products at different resolutions, such as 5 km, 10 km, etc., with ubRMSE less than 0.06m3/m3.

How to cite: Lu, H., Tian, J., and Jiang, R.: Development of a high-resolution land data assimilation system with integrated machine learning, EGU General Assembly 2024, Vienna, Austria, 14–19 Apr 2024, EGU24-16429, https://doi.org/10.5194/egusphere-egu24-16429, 2024.

EGU24-16611 | ECS | Orals | HS6.1

A gap-filled global long-term satellite soil moisture climate data record from ESA CCI SM 

Wolfgang Preimesberger, Pietro Stradiotti, Thomas Frederikse, Martin Hirschi, Nemesio Rodriguez-Fernandez, Alexander Gruber, and Wouter Dorigo

ESA CCI Soil Moisture is a multi-satellite climate data record that consists of harmonized, daily observations coming at present from 19 satellites operating in the microwave domain. The wealth of satellite information, particularly over the last decade, facilitates the creation of a data record with the highest possible data consistency and coverage.
However, data gaps are still found in the record. This is particularly notable in earlier periods when a limited number of satellites were in operation, but can also arise from various retrieval issues, such as frozen soils, dense vegetation, and radio frequency interference (RFI). These data gaps present a challenge for many users, as they have the potential to obscure relevant events within a study area or are incompatible with (machine learning) software that often relies on gap-free inputs.
Since the requirement of a gap-filled ESA CCI SM product was identified, various studies have demonstrated the suitability of different statistical methods to achieve this goal. A fundamental feature of such gap-filling method is to rely only on the original observational record, without need for ancillary variable or model-based information. Due to the intrinsic challenge, there was until present no global, long-term univariate gap-filled product available.
In this study we address this requirement and introduce the ESA CCI SM GAP-FILLED product. We present the framework around a widely used discrete cosine transform based method (DCT-PLS), and discuss the interpolation of soil moisture in the case of frozen soils and dense vegetation cover. We demonstrate a method to model the expected uncertainty introduced by the interpolation process. We evaluate the impact of gap-filling on the data set and thereof derived statistics such as anomalies and long-term trends. 

How to cite: Preimesberger, W., Stradiotti, P., Frederikse, T., Hirschi, M., Rodriguez-Fernandez, N., Gruber, A., and Dorigo, W.: A gap-filled global long-term satellite soil moisture climate data record from ESA CCI SM, EGU General Assembly 2024, Vienna, Austria, 14–19 Apr 2024, EGU24-16611, https://doi.org/10.5194/egusphere-egu24-16611, 2024.

EGU24-18051 | Posters on site | HS6.1

Implementation of quality control in a national soil moisture monitoring system 

Verena Jagersberger, Valentina Pelzmann, Johannes Ehrendorfer, Jutta Eybl, Korbinian Breinl, Peter Strauss, Gernot Klammler, and Thomas Weninger

The Austrian Hydrographic Service operates an extensive network of hydrographic measuring stations all over the country. The soil water measuring network comprises 62 stations where, among others, water content, matric potential, and soil temperature are measured. Only through the implementation of a consistent quality control system and data harmonization is it possible to provide expedient datasets that can be published or used for further purposes. Although automated quality control procedures for soil moisture are integrated in some national and international networks, there is currently no uniform quality control and harmonization of measurement data implemented in the Austrian network. Thus, the goal of this study was to evaluate existing options for the implementation of a system for the control of data quality with the highest possible degree of automatization.

Technical implementation and structure of the stations vary greatly in the monitoring network in terms of measuring depths and installed sensors. Of the 62 measuring stations, 15 were set up as so-called type-2 measuring stations with a lower number of sensors and an IOT data transmitter. The aim of this type of station being reduced installation and maintenance effort as well as lower costs. On the other end of the complexity range, weighing lysimeters with field reference are maintained since decades.

To establish the most appropriate procedure, established systems from international literature, like ISMN and SaQC or NASMD, were compiled and tested for their applicability in the Austrian monitoring network. For evaluation, the results of the automated quality check routines were compared to those of a visual expert check via an error matrix. The aim was to determine which quality control procedures are most effective and lead to the best results in terms of flagging different quality levels or likely errors. Leaning on the findings of the quality control procedures for soil moisture, a procedure for the matric potential shall be developed and implemented in the network, since this state variable of soils is crucial for understanding soil water processes.

How to cite: Jagersberger, V., Pelzmann, V., Ehrendorfer, J., Eybl, J., Breinl, K., Strauss, P., Klammler, G., and Weninger, T.: Implementation of quality control in a national soil moisture monitoring system, EGU General Assembly 2024, Vienna, Austria, 14–19 Apr 2024, EGU24-18051, https://doi.org/10.5194/egusphere-egu24-18051, 2024.

EGU24-18167 | ECS | Posters on site | HS6.1

A 20-meter root-zone soil moisture dataset using Earth Observations and water balance modelling 

Cecile M.M. Kittel, Radoslaw M. Guzinski, and Mikkel H. Bojesen

At the interface of the surface energy balance and land surface hydrology, soil moisture is a key descriptor for hydrology, ecosystem dynamics and climate variables. Monitoring of soil moisture is of high value in multiple contexts, including water resources management through irrigation detection and quantification, and in land management and climate initiatives. In Denmark, drained organic low-lying soils represent 7% of agricultural land but are responsible for around 50% of the greenhouse gas emissions from agriculture. Soil moisture monitoring is key to prioritizing the decommissioning of relevant farmland. Soil moisture can be observed from space with radar or radiometer instruments; however, applications are often limited by the sensor penetration depth, which restricts the vertical spatial resolution to the top few centimeters of the soil. Spatial sampling is often in the order of kilometers, and too coarse for field-scale screening.

In this study, we propose to use the widely applied FAO-56 soil water balance model for crop evapotranspiration (ET) estimates and use it to estimate soil moisture in the root zone through reverse modelling. Using EO estimates of ET at high resolution derived from Sentinel-2 optical images, downscaled Sentinel-3 thermal images, and the TSEB (Two-Source Energy Balance) ET model, we derive a map of soil moisture in Denmark at 20 m daily resolution. Precipitation is obtained from ECMWF Era-5 and the OpenLand soil texture and characteristics dataset is used to parameterize the soil column. Landuse information at parcel scale from the Danish Agricultural Agency is used to estimate the root zone depth along with time series of Leaf Area Index. The approach is based on optical observations which have limited applicability in cloudy regions and winter months. We therefore apply gap filling using temporal interpolation of the ET time series or assumptions on soil moisture conditions to obtain the final decadal and monthly soil moisture time series.

The map is validated against probe measurements of soil moisture at 21 different sites across Denmark. Overall, the RMSE is around 5% m3/m3 and spatio-temporal patterns are well captured. The main limitations can be attributed to the soil parameterization as well as uncertainties in the coarser climate forcing. This study presents a unique dataset at national scale using publicly available datasets and combining Earth Observations with physical and conceptual modelling to obtain a key hydrological and biophysical parameter. The approach can be extended to most farm and grasslands and can be adjusted, where more precise local parameterization is available. The dataset as presented here, is used to inform a screening and management tool for the Danish Environmental Protection Agency to evaluate the impact of decommissioning low-lying farmlands, and to support research efforts in quantifying nitrogen dioxide emissions from poorly drained soils.

How to cite: Kittel, C. M. M., Guzinski, R. M., and Bojesen, M. H.: A 20-meter root-zone soil moisture dataset using Earth Observations and water balance modelling, EGU General Assembly 2024, Vienna, Austria, 14–19 Apr 2024, EGU24-18167, https://doi.org/10.5194/egusphere-egu24-18167, 2024.

Development of multi-sensor algorithm for enhancing the spatial and temporal resolution of Surface Soil Moisture
Ananya Sharma1, Manika Gupta1, Vikrant Maurya1, Juby Thomas1, Prashant K Srivastava2
1) Department of Geology, University of Delhi, Delhi, India
2) Institute of Environment and Sustainable Development, Banaras Hindu University, Banaras, India

Abstract

Surface soil moisture (SSM) is a crucial antecedent parameter for determination of various hydro-geomorphological conditions in the field of atmospheric and agricultural science. The available remotely sensed SSM datasets (AMSR-2, SMAP, SMOS) present with significantly degraded accuracy when compared to the in-situ measurements in heterogenous regions of India, as soil moisture retrievals through earth observation satellites are considerably sensitive to varying vegetation cover, biomass and surface roughness. A notable trade-off exists between the enhancement of spatial and temporal resolution. Advancements in methodological innovations must continually be sought to mitigate this trade-off, pushing the boundaries of what is achievable in both spatial and temporal dimensions. In the present study, we have utilized two distinct methodologies for the derivation of SSM product at a spatial resolution of 20 meters. The first approach involves the utilization of an enhanced Land Surface Temperature Product (LST) at a spatial resolution of 20 meters, in conjunction with Landsat-8 Normalized Difference Vegetation Index (NDVI) data to derive SM using the Soil Evaporative Efficiency Model. The second 
approach employs Sentinel-1 backscatter coefficients, specifically at VV polarization, coupled with MODIS Leaf Area Index (LAI). These datasets areintegrated within a modified water cloud model, facilitating the derivation of the SSM product. This methodology exploits the sensitivity of Sentinel-1 radar backscatter to surface moisture variations and complements this information with LAI, ensuring a robust characterization of soil moisture content. A single algorithm has been devised to harmoniously integrate the two approaches, thereby yielding the temporal resolution within the range of 2 to 5 days. In the algorithm, on instances where the data modeling from the former approach encounters limitations by virtue of the scarcity of input datasets, recourse is sought through the latter approach. Such a sequential approach ensures a comprehensive and adaptable analytical framework, allowing for an increased spatial as well as temporal resolution of SSM datasets.

How to cite: Sharma, A.: Development of multi-sensor algorithm for enhancing the spatial and temporal resolution of Surface Soil Moisture , EGU General Assembly 2024, Vienna, Austria, 14–19 Apr 2024, EGU24-18841, https://doi.org/10.5194/egusphere-egu24-18841, 2024.

EGU24-18930 | Orals | HS6.1

Next-generation ASCAT surface soil moisture near real-time service 

Sebastian Hahn, Wolfgang Wagner, Thomas Melzer, and Mariette Vreugdenhil

The European Organisation for the Exploitation of Meteorological Satellites (EUMETSAT) has been operationally distributing a global Surface Soil Moisture (SSM) product derived from the Advanced Scatterometer (ASCAT) on board the series of Metop satellites since December 2008. The first Metop mission (Metop-A launched in October 2006) has been successfully concluded in November 2021, while two Metop satellites are still operational at the moment (Metop-B launched in September 2012 and Metop-C launched in November 2018), both providing an ASCAT SSM product in near real-time (NRT) sampled at 12.5 km and 25 km. EUMETSAT directly manages the ASCAT SSM NRT service, with the soil moisture processing chain implemented as part of the EUMETSAT Polar System (EPS) Core Ground Segment (CGS). In September 2015 the EUMETSAT Satellite Application Facility on Support to Operational Hydrology and Water Management (H SAF) formally took over the ASCAT SSM NRT product evolution and maintenance, while product generation stayed at the EUMETSAT EPS CGS. At that time, H SAF has already been responsible for the development and generation of the ASCAT SSM Data Record (DR) products, which consistently advanced through multiple algorithmic iterations in recent years. Beyond minor updates and occasional model parameter substitutions, the ASCAT SSM NRT products do not incorporate the latest algorithmic developments. Hence, a next-generation ASCAT SSM NRT service is currently being set up, aiming to enhance various aspects including spatial resolution and vegetation correction. The new service will run alongside the current NRT system, ensuring that users will experience a seamless transition.

In this study, we introduce the scientific innovations and algorithmic updates of the upcoming H SAF ASCAT SSM NRT products sampled at both 6.25 km and 12.5 km. A validation was performed by comparing the old and new ASCAT SSM with other satellite soil moisture products, in-situ data, and soil moisture information derived from land surface models. The results show an improved performance particularly with respect to the capability of the data to characterise extremes. Furthermore, we will discuss product format changes, such as a new Discrete Global Grid (DGG) defining a more homogeneous sampling distribution of grid points on the Earth's surface.

How to cite: Hahn, S., Wagner, W., Melzer, T., and Vreugdenhil, M.: Next-generation ASCAT surface soil moisture near real-time service, EGU General Assembly 2024, Vienna, Austria, 14–19 Apr 2024, EGU24-18930, https://doi.org/10.5194/egusphere-egu24-18930, 2024.

EGU24-19160 | Orals | HS6.1

Towards SI-traceable calibration of soil moisture sensors 

Emil Andreasen Klahn, Peter Friis Østergaard, Henrik Kjeldsen, and Jan Nielsen

Soil moisture is one of the essential climate variables, and it is interesting from both meteorological and agricultural perspectives. At the same time, soil moisture measurements span several length scales, from in-field studies with point scale sensors, to field scale with CRNS-probes to even larger study areas investigated with remote sensing. These different techniques make use of fundamentally different physical principles for obtaining soil moisture measurements, and harmonizing these measurements requires that SI-traceability can be demonstrated. For the common metric of volumetric water content, this requires demonstrating traceability of both water and soil volume.

The Danish Technological Institute (DTI) has implemented a dedicated setup for determination of water content. The setup takes samples ranging from 100 g up to 2 kg and a volume up to 2 liters, which makes measurements on representative soil samples feasible. In contrast to the to the traditional loss-on-drying method, the DTI reference setup provides SI-traceability of the water content, through measurements of air flow and dew point temperature.

In this presentation, the design principles of the setup and the utilization of the setup for SI-traceable calibration of point scale soil moisture sensors are described.

How to cite: Andreasen Klahn, E., Friis Østergaard, P., Kjeldsen, H., and Nielsen, J.: Towards SI-traceable calibration of soil moisture sensors, EGU General Assembly 2024, Vienna, Austria, 14–19 Apr 2024, EGU24-19160, https://doi.org/10.5194/egusphere-egu24-19160, 2024.


Soil moisture, a critical parameter influencing various environmental processes, is a key focus in Earth observation. This study evaluates and validates Spire's GNSS-R-based soil moisture products, presenting an innovative retrieval methodology capturing spatiotemporal dynamics with enhanced precision.  

Leveraging extensive observations from Spire's GNSS-R and NASA’s CYGNSS (Cyclone Global Navigation Satellite System) satellites, our assessment involves a comprehensive comparison and validation of Spire's soil moisture data. Ground truth measurements from ISMN (International Soil Moisture Network) provide a crucial benchmark, while concurrent validation with established satellite-derived soil moisture products such as SMAP (Soil Moisture Active Passive) and ESA-CCI (Climate Change Initiative for Soil Moisture) ensures a robust understanding of Spire's GNSS-R products' performance across diverse regions. 

The insights gained from this comparative study not only contribute to the validation of Spire's products but also provides perspectives on the strengths and limitations of distinct soil moisture measurement techniques. 

How to cite: Savastano, G., Freeman, V., and Jales, P.: Assessment of Spire GNSS-R Based Soil Moisture Products: A Comparative Analysis with In-Situ and Other Satellite-Based Datasets , EGU General Assembly 2024, Vienna, Austria, 14–19 Apr 2024, EGU24-19243, https://doi.org/10.5194/egusphere-egu24-19243, 2024.

Evapotranspiration (ET) is the loss of water from both the soil and plants, and it is an important component of the hydrologic cycle. In the recent decades, ET estimation has improved due to developments in remote sensing technologies, particularly in the agricultural domain. ET is affected by a variety of factors, including weather and crop conditions, which are difficult to estimate for larger regions at fine resolution. Therefore, the current study intends to employ the Surface Energy Balance Algorithms for Land (SEBAL) model using satellite images to estimate and provide spatial ET variation using crop growth biophysical parameters such as land surface temperature, albedo, Normalized Difference Vegetation Index (NDVI), Soil Adjusted Vegetation Index (SAVI), Leaf Area Index (LAI), net radiation, sensible heat flux, and soil heat flux. The pixel-based SEBAL technique was used for the Haridwar district (area = 2360 sq. km) of Uttarakhand, India. The study utilized 5 cloud-free harmonized Landsat 8 and sentinel 2 satellite data for winter wheat crop at the beginning, middle, and end of the season. The area of cultivated wheat fields was initially identified using a machine learning support vector machine technique based on time series-threshold values of NDVI. This showed a wheat area of 526.86 sq. km, while the observed wheat acreage was 446.44 sq. km. The results showed that, for the research region, the support vector machine produced a significantly accurate assessment, with a kappa coefficient of 0.89, producer accuracy of 0.89, user accuracy of 0.82, and overall accuracy of 0.84. The estimated mean actual ET values were found to be 3.7 mm/day, 3.0 mm/day,  4.1 mm/day, 0.6 mm/day, 0.8 mm/day, and potential ET calculated by FAO-56 Penman-Monteith method were 4.4 mm/day, 4 mm/day, 4.1 mm/day, 3.7 mm/day, 2.1 mm/day dated 14th and 6th March, 2023, 26th and 18th February 2023, 17th January 2023, respectively.  Based on the findings, ET maps and NDVI maps showing spatial variation were developed for the study area. These maps can be helpful for hydrological modeling, drought management, crop yield estimation, and irrigation scheduling.

How to cite: Singh, P. and Kothari, K.: Integrating Satellite-Derived Data and Machine Learning Algorithm for Assessing Winter Wheat Evapotranspiration, EGU General Assembly 2024, Vienna, Austria, 14–19 Apr 2024, EGU24-927, https://doi.org/10.5194/egusphere-egu24-927, 2024.

EGU24-2606 | Posters on site | HS6.3

Evaluating ECOSTRESS data across the Australia and Korea 

Kijin Park, Chanyoung Kim, Kiyoung Kim, and Jongmin Park

The effects of extreme weather events due to climate change are causing localized energy imbalances (that are) affecting evapotranspiration and drought. Thus, quantifying hydrological cycle components is essential for efficient water resource management. Generally, hydrometeorological variables are acquired from point-based observations, while it has limitations in representing the spatial distribution of hydrometeorological variables. As an alternative, remote sensing imagery has been widely utilized to overcome the limitation.

Remote sensing-based land surface temperature (LST) and evapotranspiration (ET) have been estimated by the Moderate-resolution Imaging Spectro-radiometer (MODIS) sensor operated by the National Aeronautics and Space Administration (NASA) since 1999.  However, the MODIS sensor's coarse spatial resolution (LST: 500 m, 1 km; ET: 500 m) limits its ability to capture the spatial distribution of hydrometeorological variables over complex terrain. On the other hand, Ecosystem Spaceborne Thermal Radiometer Experiment on Space Station (ECOSTRESS) developed by NASA Jet Propulsion Laboratory and launched in 2018, provides a variety of outputs (LST, ET, etc.) at a higher spatial resolution (70m) than existing MODIS outputs. The main purpose of this study is to evaluate the applicability of ECOSTRESS LST and ET by comparing against eddy covariance-based flux tower observations (from 25 stations) as well as MODIS products across Korea and Australia from June 2018 to December 2022.

The comparison of ECOSTRESS LST against flux tower LST revealed similar trends in Korea (Correlation coefficient [R]: 0.64, Index of Agreement [IOA]: 0.77) compared to Australia (R: 0.26, IOA: 0.32). In terms of magnitude, ECOSTRESS LST showed underestimation with high root mean square error (RMSE) for both Australia (bias: -8.05℃, RMSE: 19.22℃) and Korea (bias: -4.19℃, RMSE: 10.73℃). Seasonal behavior of ECORSTRESS LST showed the highest uncertainty during summer for both Australia and Korea. For the Australia, either forest or grassland sites located in northern part (classified as tropical or arid climate zone) of Australia revealed high magnitude of bias and RMSE.

Evaluation of ECOSTRESS daily ET by comparing to latent heat (LE) measured from flux towers yielded a poor agreement over both Australia (bias: 4.92 mm/day, RMSE: 6.59 mm/day, R: 0.14, IOA: 0.17) and Korea (bias: 8.80 mm/day, RMSE: 11. 61 mm/day, R: -0.02, IOA: 0.12) with the positive bias indicating that the ECOSTRESS ET is overestimated. Spatial analysis of error statistics revealed that northern tropical area over Australia with high precipitation during summer yielded high magnitude of bias and RMSE.

Overall result showed that ECOSTRESS LST and ET tended to be underestimated and overestimated, respectively. For the Australia, northern part of Australia classified as tropical zone yielded highest uncertainty for both ET and LST. Therefore, it is judged that additional validation and calibration processes with consideration of various geomorphological and hydrological characteristics should be performed to increase the applicability of ECOSTRESS outputs.

Acknowledgement: This research was supported by Korea National University of Transportation in 2024.


How to cite: Park, K., Kim, C., Kim, K., and Park, J.: Evaluating ECOSTRESS data across the Australia and Korea, EGU General Assembly 2024, Vienna, Austria, 14–19 Apr 2024, EGU24-2606, https://doi.org/10.5194/egusphere-egu24-2606, 2024.

EGU24-3899 | ECS | Orals | HS6.3

Exploring the physical consistency of evapotranspiration estimates over Madagascar using remote sensing. 

rojin alimohammad nejad, Simon D. Carrière, Albert Olioso, and Ludovic Oudin

Evapotranspiration (ET) plays a major role in climate processes by facilitating water redistribution between continental surfaces and the atmosphere. Accurately quantifying ET remains a challenge due to the scarcity of direct ET measurements, particularly in some regions with poor climate monitoring like Madagascar. Moreover the island has a very different climate, from semi-arid in the southwest to humid in the east. Estimating ET from remote sensing and climate reanalysis appears as a relevant way to provide spatially distributed data at a regional scale. Several operational or pre-operational usually, they providing quite different results. How to choose the most relevant product for a study area is a key question for any hydrological study.

Our study focused on evaluating five popular evapotranspiration products over Madagascar: GLDAS-NOAH, ERA5, ERA5-LAND, WAPOR, and GLEAM. The data covers years from 2009 to 2021. The analysis aims to provide a comprehensive understanding of their utility and accuracy in estimating ET over the different climatic zone.

Our initial findings involved a comprehensive assessment of various datasets, focusing on their differences and evaluating their validity in maintaining water and energy balance. This comprehensive analysis encompassed (i) analyzing jointly evapotranspiration estimates, potential evapotranspiration, and precipitation used by each ET dataset and (ii) validating ET estimates on the few catchments where streamflow data are available. The results indicate significant differences in ET estimates, as well as in each climate zone in Madagascar (in average 550 mm/year in semi-arid area and 1050 mm/year in humid area). The observed differences warrant a deeper exploration of the factors contributing to these differences and a careful assessment of the strengths and limitations of each datasets.

How to cite: alimohammad nejad, R., D. Carrière, S., Olioso, A., and Oudin, L.: Exploring the physical consistency of evapotranspiration estimates over Madagascar using remote sensing., EGU General Assembly 2024, Vienna, Austria, 14–19 Apr 2024, EGU24-3899, https://doi.org/10.5194/egusphere-egu24-3899, 2024.

EGU24-4199 | Posters on site | HS6.3

Riparian Corridors of the Sonoran Desert: New Estimates of Riparian Evapotranspiration Change Using Daymet and Landsat Vegetation Index Methods 

Pamela Nagler, Ibrahima Sall, Armando Barreto-Muñoz, and Kamel Didan

Accurate estimates of riparian vegetation water use are import-ant to quantify, particularly in arid environments. In these narrow riparian corridors, we quantify loss of water from leaves and soil as one variable, actual evapotranspiration (ETa). ETa is one of the most difficult components of the water cycle to measure, but our remote sensing estimates of ETa have been validated for dryland riparian corridor species using ground-based sensors (e.g., sap flow, tower). Increases in ETa are indicative of increasing vegetation cover and therefore increasing ‘losses’ of water through ETa represent positive trends in riparian ecosystem health; decreasing ETa may indicate dwindling riparian cover due to less available water for canopy growth due to drought, groundwater flux, beetle defoliation, fire, increasing salinity.

The objective of this study was to calculate actual annual ETa (mmyr-1) for selected riparian areas in the Sonoran Desert in the southwestern U.S. Riparian reaches for a dozen rivers in the Lower Colorado River Basin, mostly in Arizona, were delineated and monitored using the two-band Enhanced Vegetation Index (EVI2). We acquired 30-m resolution Landsat scenes, processed and performed a pixel-wise quality assessment to remove pixels with high aerosols and clouds, and computed EVI2 every 16-days over 20 years. We then computed daily potential ET using the Blaney-Criddle formula with input temperature data from gridded weather data using Daymet (1 km). Riparian ETa was quantified using the Nagler ET(EVI2) model to produce time-series data for the period 2000-2021.

From 2000 to 2021, various rivers were studied to determine the average annual ET(EVI2) (mmyr-1) for riparian corridors, unrestored areas, and restored areas. The findings indicate that the Salt River experienced a 13.7% increase from 800 mmyr-1 to 910 mmyr-1, whereas the Gila River only saw a 2.7% increase from 725 mmyr-1 to 745 mmyr-1 during the same period, with occasional periods of decreases (e.g., 2002, 2013) followed by increases. The San Pedro increased 7.4%. The Santa Cruz River showed the most significant increase in average annual ET(EVI2) with a 24.0% increase from 770 mmyr-1 to 955 mmyr-1 (2000-2021). The increasing trends on these rivers could be due to riparian species composition altered by the tamarisk beetle followed by secondary or replacement species which established green canopies, restoration efforts or other changes in water or land management. This study provides valuable estimates of riparian water use that may assist with decision-making by natural resource managers tasked with allocating water and managing habitat along these riparian corridors. Our findings have continued to be used to assist managers with decision-making for ecological restoration success. These data, tools, methods, and results can be utilized by decision makers in their quest to mitigate and understand how declines of riparian ecosystems can be slowed or possibly reversed.

How to cite: Nagler, P., Sall, I., Barreto-Muñoz, A., and Didan, K.: Riparian Corridors of the Sonoran Desert: New Estimates of Riparian Evapotranspiration Change Using Daymet and Landsat Vegetation Index Methods, EGU General Assembly 2024, Vienna, Austria, 14–19 Apr 2024, EGU24-4199, https://doi.org/10.5194/egusphere-egu24-4199, 2024.

EGU24-4278 | ECS | Posters on site | HS6.3

A high-resolution (1d, 9km) and long-term (1950-2022) gridded evapotranspiration dataset 

Qingchen Xu, Lu Li, and Zhongwang Wei

Evapotranspiration (ET) is the second largest hydrological flux over land surface and connects water, energy, and carbon cycles. Quantifying spatio-temporal ET variability remains greatly challenging due to limited site observations and significant model uncertainties. To address this issue, we develop a multimodal machine-learning framework integrating diverse machine-learning approaches and various available ET datasets to produce high-resolution, long-term ET estimates. We combine direct site observations and 13 different ET products that span remote sensing, machine-learning outputs, data fusion techniques, land surface models, and reanalysis datasets to create fused datasets. Our machine-learning framework integrated cutting-edge tools such as Automated Machine Learning (AutoML), Deep Neural Networks (DNN), Light Gradient Boosting Machine (LightGBM), and Random Forest (RF) algorithms to rigorously evaluate model efficacy. Our product exhibits a significantly improved spatiotemporal resolution (0.1 degree, daily) and extended temporal coverage (from 1950 to 2022) compared to existing datasets. In summary, this novel data integration framework overcomes previous ET data limitations through improved quality, spatiotemporal resolution, coverage, and advanced machine learning techniques. The resulting product will enable more accurate ET estimates for water, energy, and carbon cycle applications.

How to cite: Xu, Q., Li, L., and Wei, Z.: A high-resolution (1d, 9km) and long-term (1950-2022) gridded evapotranspiration dataset, EGU General Assembly 2024, Vienna, Austria, 14–19 Apr 2024, EGU24-4278, https://doi.org/10.5194/egusphere-egu24-4278, 2024.

EGU24-4530 | ECS | Posters on site | HS6.3

Evapotranspiration for Ireland (ET4I): Ground-Truthing Satellite-Driven Evapotranspiration Products. 

Haneen Muhammad, Klara Finkele, Padraig Flattery, Caren Jarmain, Gary Lanigan, and Conor Sweeney

Evapotranspiration (ET) has been recognized as one of the largest yet most uncertain component of the agricultural water balance and the surface water balance simulated by land surface models. Ireland’s National Meteorological Service (Met Éireann) currently produces 1 km gridded products of rainfall and temperature based on climatological observations. These would be greatly complemented if the potential evapotranspiration (ETo) and actual evapotranspiration (ETa) could be estimated on this grid to provide input into hydrological models and agricultural decision support systems on a daily time scale. Due to the limited availability of observed ET data and the heterogeneous aspect of land use in Ireland, it is difficult to use a statistical interpolation approach to produce gridded maps of ET. Instead, satellite-derived ET products are commonly used, which use remote sensing data to estimate ET at different temporal and spatial resolutions.

Open-access satellite ET products that cover the region of Ireland include MOD16, ECOSTRESS PT-JPL, GLEAM, SSEBop, BESS, and WaPOR V3. Utilizing these satellite-derived ET products serves as a clear initial step for the development of a national gridded ET product. However, assessing the accuracy of these products is a prerequisite. While satellite-derived products have been shown to have good agreement with field observations in some regions like Africa, clouded regions such as Ireland are more challenging. As most satellite-based models used to derive ET are based on data in the visible spectrum and involve interpolations between observations, extensive cloud cover in Ireland results in few cloud-free days, leading to inaccuracies and prolonged periods of interpolation.

This poster will present the results from a systematic evaluation of these satellite ET products by comparing them to field measurements from flux towers and lysimeters, using a variety of evaluation metrics. Daily ET data from lysimeters and flux towers will be compared to pixel data extracted from satellite ET products at corresponding locations and on the available dates, depending on each product. The flux tower data to be used in ground-truthing is available for a number of sites across Ireland. The temporal range of data availability varies for different sites, with the earliest analysis starting from 2002. Lysimeter data from different locations will also be used for ground-truthing. Analysis using lysimeter data starts from 1990. Some of this data was previously unavailable for analysis, as it existed only in paper records. This project has performed the data rescue necessary to digitize the lysimeter data.

This data comparison allows the spatial and temporal accuracy of satellite ET products to be quantified. Additionally, it identifies gaps and limitations in these ET products for Ireland and proposes avenues for refining and advancing ET mapping techniques. This includes the exploration of innovative approaches, such as the integration of machine learning techniques with satellite images and field observations. The study is part of the broader framework of the Evapotranspiration Maps for Ireland (ET4I) project, which aims to highlight the need for enhanced ET modeling and the development of high-resolution gridded daily ET maps for Ireland.

How to cite: Muhammad, H., Finkele, K., Flattery, P., Jarmain, C., Lanigan, G., and Sweeney, C.: Evapotranspiration for Ireland (ET4I): Ground-Truthing Satellite-Driven Evapotranspiration Products., EGU General Assembly 2024, Vienna, Austria, 14–19 Apr 2024, EGU24-4530, https://doi.org/10.5194/egusphere-egu24-4530, 2024.

EGU24-5279 | Posters on site | HS6.3

Assessment of different methods for Evapotranspiration and Soil Moisture for various land use areas across Poland 

Katarzyna Dabrowska-Zielinska, Ewa Panek - Chwastyk, and maciej Jurzyk

The main goal of the study w as to determine the evapotranspiration and soil moisture for
different ecosystems as grasslands, grassland wetlands and agriculture fields in Pokand. There is a
significant potential to estimate water usage by plants and to illustrate how they return water to
the atmosphere by applying the soil vegetation temperature measured now days by satellites.
The proper assessment of evapotranspiration and soil moisture content are essential in food
security research, land management, climate change observations and hydrological modelling
Collected ground data covers grasslands areas (intensive and extensive management), at the
JECAM Joint Experiment for Crop Assessment and Monitoring. Ground data collection
included measurements of soil moisture, biomass samples and agrometeorological parameters.
It was possible to collect the data from ECOSTRESS (temperature and latent heat flux LE )
for JECAM fields for different dates during vegetation growth and few acquisitions of
ECOSTRESS  for the grasslands for the whole NUTS2 where the JECAM area exists. For the
grassland of wetlands in the North of Poland there were only two ECOSTRES S acquisition s.
At the same time of ECOSTRES S acquisition the data from Terra MODIS, Sentinel 2 and
Sentinel 3 were collected in order to calculate the vegetation indices and get the surface
temperature. At the JECAM field we conducted the measurements of meteorological
parameters. At the grass area of wetlands we installed the Eddy Covariance tower for flux
measurements and twenty soil moisture sondes with permanent measurements. The LE values
obtained from ECOSTRESS data were compared to the latent heat (calculated as the component
of energy budget). Surface temperature derived from thermal channels of Terra MODIS and
Sentinel 3 in conjunction with meteorological data have been used for calculation of LE as a
residual of the of the simplified energy budget equation (Dabrowska Zielinska et al., 2022 ). At
the same time different vegetation parameters were calculated from Sentinel’s index NDVI to
establish the correlation between the vegetation phase of development soil moisture values and
evapotranspiration conditions. Climate conditions influence evapotranspiration through
available soil moisture. Vegetation influence evapotranspiration through its biomass, plant
height and vegetation response to soil moisture. Created models applying measured LE by
ECOSTRESS and vegetation parameters allowed to transfer the water demand by plants to
other areas. For understanding the mechanistic responses of ecosystem processes to
environmental change it is important to examine evapotranspiration its annual change for
different ecosystems with the available data for vali dation. The study used artificial intelligence
methods including machine learning techniques for modelling evapotranspiration
Dąbrowska - Zielińska K., Misiura K., Malińska A., Gurdak R., Grzybowski P., Bartold M., Kluczek M., 2022,
Spatiotemporal estimation of gross primary production for terrestrial wetlands using satellite and field data,
Remote Sens. Appl.: Soc. Environ. doi:10.1016/j.rsase.2022.100786
The study has been done for the project: GrasSat "Tools for information to farmers on grasslands yields under
stressed conditions to support management practices" NOR/POLNOR/GrasSAT/0031/2019  financed by
Narodowe Centrum Badań i Rozwoju (NCBIR) Norwegian Funds

How to cite: Dabrowska-Zielinska, K., Panek - Chwastyk, E., and Jurzyk, M.: Assessment of different methods for Evapotranspiration and Soil Moisture for various land use areas across Poland, EGU General Assembly 2024, Vienna, Austria, 14–19 Apr 2024, EGU24-5279, https://doi.org/10.5194/egusphere-egu24-5279, 2024.

EGU24-5593 | ECS | Orals | HS6.3

Deriving Daily Transpiration from Instantaneous Measurements in Almond Orchards with Varied Water Stress and Production Systems 

Manuel Quintanilla-Albornoz, Joaquim Bellvert Rios, Hector Nieto Solana, Ana Pelecha, and Xavier Miarnau Prim

For the purpose of managing irrigation water and raising agricultural water yield, the daily transpiration (Td) monitoring is essential. The estimation of evapotranspiration (ET) and its components, which include crop transpiration (T) and soil evaporation (E), for a variety of crops has shown to be robust when using remote sensing energy balance models. However, as measurements from remote sensing are instantaneous, daily upscaling methods are required in order to estimate Td from remote sensing models. Although upscaling methods for daily ET have been validated by multiple studies, those techniques have not been validated for estimating Td separately in woody crops. The purpose of this study is to assess upscaling methods for recovering Td in almond crops with varying water status and production systems. Sap flow sensors were used to monitor the T in-situ (T-SF), allowing for a continuous measurement for each plant every 15 minutes. The stem water potential (Ψs), stomatal conductance (gs) and leaf transpiration (Eleaf) were also measured at 7:00, 9:00, 12:00, 14:00 and 16:00 solar time for two days in the same trees where sap flow sensors were installed. High-resolution images were used to estimate hourly T using the two-source energy balance model (TSEB). The upscaling methods were evaluated with in situ sap flow data and then implemented to the TSEB estimations. The evaluated upscaling methods were the simulated evaporative fraction variable (EFsim), irradiance (Rs) and potential evapotranspiration (ETp) methods. As a results, the EFsim and ETp methods were more correlated with T-SF, reducing the observed potential underestimation using the Rs method. The improvement was especially important at midday in the tress subjected to severe water stress, where the EFsim reduced the error by 17.61% and the ETp reduced it by 10.6% compared to the Rs method, respectively. Nevertheless, the daily T-SF revealed significant differences across production systems that the daily upscaling methods used in the TSEB were unable to identify. One issue in determining Td on surfaces with discontinuous architectural features was the insufficient sensitivity of daily TSEB between production systems. This issue might be resolved by applying more sophisticated ETp models or enhanced ETp as an upscaling parameter, since ETp can account for variations in canopy structures that have an impact on daily T curves.

How to cite: Quintanilla-Albornoz, M., Bellvert Rios, J., Nieto Solana, H., Pelecha, A., and Miarnau Prim, X.: Deriving Daily Transpiration from Instantaneous Measurements in Almond Orchards with Varied Water Stress and Production Systems, EGU General Assembly 2024, Vienna, Austria, 14–19 Apr 2024, EGU24-5593, https://doi.org/10.5194/egusphere-egu24-5593, 2024.

EGU24-5661 | Orals | HS6.3

Integrating machine learning with analytical surface energy balance model improved terrestrial evaporation through biophysical regulation 

Yun Bai, Kanishka Mallick, Tian Hu, Sha Zhang, Shanshan Yang, and Arman Ahmadi

Global evaporation modeling faces challenges in understanding the combined biophysical controls imposed by aerodynamic and canopy-surface conductance, particularly in water-scarce environments. We addressed this by integrating a machine learning (ML) model estimating surface relative humidity (RH0) into an analytical model (Surface Temperature Initiated Closure - STIC), creating a hybrid model called HSTIC. This approach significantly enhanced the accuracy of modeling water stress and conductance regulation. Our results, based on the FLUXNET2015 dataset, showed that ML-RH0 markedly improved the precision of surface water stress variations. HSTIC performed well in reproducing latent and sensible heat fluxes on both half-hourly/hourly and daily scales. Notably, HSTIC surpassed the analytical STIC model, particularly in dry conditions, owing to its more precise simulation of canopy-surface conductance (gSurf) response to water stress. Our findings suggest that HSTIC gSurf can effectively capture physiological trait variations across ecosystems, reflecting the eco-evolutionary optimality of plants. This provides a fresh perspective for process-based models in simulating terrestrial evaporation.

How to cite: Bai, Y., Mallick, K., Hu, T., Zhang, S., Yang, S., and Ahmadi, A.: Integrating machine learning with analytical surface energy balance model improved terrestrial evaporation through biophysical regulation, EGU General Assembly 2024, Vienna, Austria, 14–19 Apr 2024, EGU24-5661, https://doi.org/10.5194/egusphere-egu24-5661, 2024.

EGU24-6094 | ECS | Posters on site | HS6.3

Two-source energy balance modelling of evapotranspiration over complex terrain 

Paolo Deidda, Paulina Bartkowiak, and Mariapina Castelli

In recent years the Adige basin, in northeastern Italy, has experienced extreme drought events which resulted in agricultural and water management issues. Evapotranspiration (ET), one major indicator of water use, plays an important role under drought conditions. On the other side, reliable estimates of ET are currently missing over mountainous and heterogeneous areas such as the Adige basin. This study aims to provide an estimate of ET which will be of benefit both to research and agricultural services. In the framework of the project RETURN (Multi-risk science for resilient communities under a changing climate) and of the Italian National Drought Hydrological Monitoring System, we estimate daily ET at high spatial resolution (below 100 m) over the Adige catchment for the period 2017-2022. Remote sensing has been widely used to compute spatially distributed ET maps from thermal infrared datasets. In particular, the two-source energy balance (TSEB) model has proven to perform well over different land types and climates. An implementation of TSEB was already developed to estimate high-resolution ET from Copernicus globally available products (Sen-ET), adopting the Sentinel-3 and Sentinel-2 constellations for estimating fine-scale land surface temperature. Moreover, the ERA5 reanalysis data and the Climate Change Initiative land cover map have been used to retrieve solar radiation and vegetation structural parameters. However, the use of these datasets presents some shortcomings over such a complex area as the Adige basin, mainly due to their coarse spatial resolution. In this study, Sen-ET is adapted for complex terrains by replacing the ERA5 solar radiation data, available at 30 km, with the Meteosat Second Generation (MSG) radiation dataset (3.5 km) and, additionally, substituting the current land cover map (300 m) with the 100 m grid size Corine Land Cover product. Furthermore, a correction factor is applied to the radiation dataset to consider topographic shading, slope, and aspect. A comparison with daily aggregated global solar radiation from 79 weather stations in the Alpine region, covering a wide range of elevations, resulted in an R2 of 0.95 and 0.75 for MSG and ERA5 respectively, showing that this approach could greatly improve the reliability of ET estimation. Future steps will focus on the impact of changing radiation and land cover input data on the accuracy of modelled ET. The results will be validated against observations at Eddy-covariance sites.

How to cite: Deidda, P., Bartkowiak, P., and Castelli, M.: Two-source energy balance modelling of evapotranspiration over complex terrain, EGU General Assembly 2024, Vienna, Austria, 14–19 Apr 2024, EGU24-6094, https://doi.org/10.5194/egusphere-egu24-6094, 2024.

EGU24-7465 | Posters on site | HS6.3

A forest floor evapotranspiration model incorporating forest structure for estimating under-canopy climate conditions in conifer plantations 

Chenwei Chiu, Asahi Hashimoto, Shodai Inokoshi, Takashi Gomi, Yuichi Onda, and Xinchao Sun

This study focuses on forest floor evapotranspiration (Ef), a critical part of the water cycle involving the atmosphere, vegetation, and soil. It specifically involves transpiration from understory vegetation and evaporation from soil surface. We acknowledge that forest structure, such as stand density and tree height, influences Ef by altering under-canopy meteorological conditions (e.g., temperature, solar radiation, and wind speed). Despite its importance, few models incorporate changes in forest structure. We address this gap by developing a model based on the Penman equation, incorporating under-canopy meteorological conditions affected by forest structure. We introduce a relative yield index (Ry), calculated as the current timber volume to the maximum timber volume ratio for specific tree heights and stand densities, with a theoretical maximum value of less than one.

 We tested our model in two Japanese cypress plantations with different structures (FM Karasawa and Kaisawa). Three and five micro-lysimeters were used to measure EF in a 12×13m plot in FM Karasawa and a 10×10m plot in Kaisawa, respectively. Measurements showed Ef variations from 0.0 to 2.1 mm/day in FM Karasawa and 0.1 to 2.5 mm/day in Kaisawa. The model estimated Ef in the range of 0.1 to 2.0 mm/day in FM Karasawa and 0.0 to 2.9 mm/day in Kaisawa. These results confirm the model's ability to estimate daily Ef, considering the impact of varying forest structures on micrometeorological conditions. Our findings highlight the model's potential for predicting Ef responses to different forest management strategies, offering valuable insights for sustainable ecosystem management.

How to cite: Chiu, C., Hashimoto, A., Inokoshi, S., Gomi, T., Onda, Y., and Sun, X.: A forest floor evapotranspiration model incorporating forest structure for estimating under-canopy climate conditions in conifer plantations, EGU General Assembly 2024, Vienna, Austria, 14–19 Apr 2024, EGU24-7465, https://doi.org/10.5194/egusphere-egu24-7465, 2024.

Urban hydrological processes are mainly influenced by anthropogenic activities, such as the expansion of impermeable surfaces which reduces infiltration of rainwater, increases runoff generation processes, and reduces evapotranspiration. Urban trees contribute positively to moving the urban water cycle closer to a natural one through their ecohydrological processes (e.g. transpiration). However, high heterogeneity within urban environments and increasing drought periods create multiple stressors to trees’ ecophysiology. We conducted intensive field measurements on Norway maple (Acer platanoides) and small-leaved lime (Tilia cordata) in the city of Freiburg, Germany, to advance our process understanding of transpiration behaviour of urban trees at contrasting growing and microclimatic environments and to determine the main hydrometeorological factors influencing transpiration. Soil water content, sap flux, crown solar radiation transmissivity, and meteorological measurements within the crown were carried out on 11 trees per species on sites with different degrees of surface sealing underneath tree crowns, in particular parks, parking lots, grass verges and tree pits.

Throughout the investigation period (2021-2022), average daily transpiration rates during the growing season were higher for small-leaved lime (1.76 ± 0.53 mm) than for Norway maple (1.53 ± 0.51 mm). We observed significantly reduced daily transpiration rates (1.13 ± 0.31 mm) at tree planting sites (e.g. tree pits) with 90% impermeable surface underneath the tree crowns. On average, the main hydrometeorological drivers for day-to-day transpiration dynamics were solar radiation (39.7%), followed by vapour pressure deficit (22.4%), and soil water content (4.8%). Additionally, tree morphological traits, such as leaf area index (LAI) and leaf area density (LAD), as well as the degree of surface sealing affected transpiration significantly (p-value < 0.05) among sites. Furthermore, LAI is significantly correlated with the proportion of surface sealing within the crown projection area. With this study, we created a highly needed dataset for the main urban tree species in Central European cities and provided a solid knowledge base for transpiration processes of trees in various urban environments. The study revealed that long-term field measurements with multiple tree species under contrasting urban growing conditions are a necessity to quantify tree transpiration dynamics and their contribution to the urban water cycle and to the cooling potentials of urban trees. In addition, relevant factors to plan resilient urban ecosystems can be extracted with such datasets and analysis.

How to cite: Anys, M. and Weiler, M.: Urban and meteorological factors controlling transpiration dynamics of two common deciduous tree species in the city of Freiburg, Germany, EGU General Assembly 2024, Vienna, Austria, 14–19 Apr 2024, EGU24-7816, https://doi.org/10.5194/egusphere-egu24-7816, 2024.

EGU24-8549 | ECS | Orals | HS6.3

Energy and vapour transfer in evaporation processes over saturated soil textures and water surface 

Wanxin Li, Wenke Wang, Yi Wang, Xiao Lu, Chenan Fu, Zilin Wang, Shouliang Ma, Zhaodi Sun, Jiahui Peng, Jiawei Wang, and Deming Gu

Evaporation from water (PEw) is generally considered equivalent to evaporation from saturated bare soils (PEs) as a starting point to estimate actual evaporation Ea. This simplification considers that the PE value is mainly determined by meteorological variables. The influences of the surface type on PE, as well as the energy and vapour transfer in evaporation processes over saturated soil textures and water surface have so far received little attention. In this research, evaporation over two saturated sandy soils including coarse sand (PEcoarse), fine sand (PEfine) and water were assessed for lysimeters installed in the Guanzhong Basin, China. Evaporation from Class A Pan (PEpan), meteorological variables and temperatures in soil and water were also captured at a high temporal resolution (5 min.) for more than 14 consecutive months. Observed PE rates demonstrated evident differences in both absolute values and diurnal dynamics between saturated soils and water. PEs is ~12% higher than PEw on a yearly scale. Annual PEfine exceeded PEcoarse by 7.3%, with the differences more obvious during daytime in spring and summer. The cumulative evaporation rates over water column and Class A Pan showed minor differences. PEs is higher than PEw at day but smaller at night, with the peak value of PEw lagging ~4 hours behind PEs. Compared with PEw-curve, the PEpan-curve resembles more the PEs-curves over a sub-daily scale.

Our research revealed that these observed PE dynamics and energy transfer processes can be quantitatively explained with detailed calculations of the surface energy balance. It is found that differences in PE are governed by differences in available energy (related to different albedos, different thermal properties and different surface temperature T) between soils and water. Moreover, the observed differences in PE and vapour transfer processes were reproduced and described by improving the vapour diffusion equation, with considering the influence of different surfaces and boundary layer thicknesses. PE dynamics were mainly characterized by the surface temperature T, which further determined the vapour gradients between the evaporation surfaces and airflow. Previous research considered surface temperature T to be an independent external forcing that determines ‘wet surface’ evaporation. Our research suggests that T is a significant internal forcing for both energy and vapour transfer during the evaporation process since it influences the redistribution of energy fluxes at the surface (the ground heat flux G and the variation in water heat storage N), the outgoing longwave radiation (Rlu), as well as the vapour gradients above the surface (Δe).

How to cite: Li, W., Wang, W., Wang, Y., Lu, X., Fu, C., Wang, Z., Ma, S., Sun, Z., Peng, J., Wang, J., and Gu, D.: Energy and vapour transfer in evaporation processes over saturated soil textures and water surface, EGU General Assembly 2024, Vienna, Austria, 14–19 Apr 2024, EGU24-8549, https://doi.org/10.5194/egusphere-egu24-8549, 2024.

EGU24-8972 | Orals | HS6.3

Towards a continuous, multiyear, high resolution dataset of evaporation  over Europe and Africa 

Oscar Manuel Baez-Villanueva, Akash Koppa, Olivier Bonte, and Diego G. Miralles

High resolution accurate evaporation (E) estimates are crucial for large-scale agricultural, ecological, and hydrological applications. However, field observations are sparse, traditional satellite-based datasets based on thermal and optical imagery are unavailable during cloudy times, and most continuous global records are too coarse in terms of spatial resolution.  One of the latter, the Global Land Evaporation Amsterdam Model (GLEAM)¹ dataset, has been widely used in climate studies in recent years, but the realm of hydrological and agricultural applications was prohibited until recently due to its coarse spatial resolution². Ongoing developments have led to the development of high-resolution (1-km) E estimates over the Mediterranean region covering the period 2015–2021. The Mediterranean region, characterised by diverse hydroclimatic conditions and seasonal rainfall, experiences challenges related to droughts, floods, and landslides, making it an ideal testbed for GLEAM datasets at a high spatial resolution (GLEAM-HR).

This work summarises current activities and future plans for GLEAM-HR. Our ongoing efforts include extending coverage from the Mediterranean to embrace the entire Meteosat disk (including Europe and Africa). This expansion involves incorporating modifications in the interception module³, addressing groundwater effects⁴, and using deep learning for transpirational stress estimation⁵. These advancements enhance the utility of GLEAM-HR for addressing water-related challenges, supporting sustainable water management practices, and contributing to evidence-based decision-making.


¹Miralles, D. G., Holmes, T. R. H., De Jeu, R. A. M., Gash, J. H., Meesters, A. G. C. A., and Dolman, A. J.: Global land-surface evaporation estimated from satellite-based observations, Hydrol. Earth Syst. Sci., 15, 453–469, https://doi.org/10.5194/hess-15-453-2011, 2011.

²Koppa, A., Rains, D., Hulsman, P., Poyatos, R., Miralles, D. G., 2022: A deep learning-based hybrid model of global terrestrial evaporation. Nature Communications, 13 (1), 1912.

³Zhong, F., Jiang, S., van Dijk, A. I. J. M., Ren, L., Schellekens, J., and Miralles, D. G.: Revisiting large-scale interception patterns constrained by a synthesis of global experimental data, Hydrol. Earth Syst. Sci., 26, 5647–5667, https://doi.org/10.5194/hess-26-5647-2022, 2022.

⁴Hulsman, P., Keune, J., Koppa, A., Schellekens, J., and Miralles, D. G: Incorporating plant access to groundwater in existing global, satellite-based evaporation estimates, Water Resources Research, https://doi.org/10.1029/2022WR033731, 2023.

⁵Koppa, A., Rains, D., Hulsman, P., Poyatos, R., and Miralles, D. G.: A deep learning-based hybrid model of global terrestrial evaporation, Nat. Commun., 13, 1912, https://doi.org/10.1038/s41467-022-29543-7, 2022.

How to cite: Baez-Villanueva, O. M., Koppa, A., Bonte, O., and Miralles, D. G.: Towards a continuous, multiyear, high resolution dataset of evaporation  over Europe and Africa, EGU General Assembly 2024, Vienna, Austria, 14–19 Apr 2024, EGU24-8972, https://doi.org/10.5194/egusphere-egu24-8972, 2024.

Water balance observations in forest stands are challenging. Sap flow measurements in trees are promising for a direct measurement of transpiration in individual trees. The estimation of stand level transpiration from individual sap flow measurements requires scaling to the individual scale, mainly by estimation of the associated sap wood area, and then to the stand level. All involved steps are associated with uncertainties. Thus, this study was set up to answer four main questions:

  • 1. Which uncertainties are involved in determining the stem-circumference-sapwood-area-relationship?
  • 2. Do single-point measurements provide reliable sap flux density data or is the radial variability of the sapwood and thus the water transport too great?
  • 3. Is it feasible to determine water balance components from sapflow measurements in quercus robur under the conditions of uncertainties and sources of error?
  • 4. How do sap flow estimates of evapotranspiration compare to alternative methods, such as lysimeters, soil water profile observations or passive capillary wick samplers?

The study was carried out at a long term soil monitoring site in the floodplain area of the Parthe river in the lowlands of Leipzig, Germany, with Quercus robur as the site dominant tree species.

A site-specific relationship between circumference and sap flow area for Quercus robur was established based on the colour change method (methyl-orange) and drill cores from 20 trees of varying circumference. The results show that the main uncertainties of estimating sapwood area come from deviation of the sapwood area from an optimal circular ring (± 31,2%) and the variability of the sapwood depths (± 9,2%). Furthermore, analysis of sap flow velocities at various depths in the trunk, shows that there is a radial heterogeneity of the axial water transport and thus a single-point measurement can lead to both a possible over- and underestimation of the sap flow under certain circumstances. When scaling the transpiration from tree to stand level, a comparative water balance equation was set up with the aid of infiltration meters in order to investigate the significance of the estimated transpiration.

The investigated low land stand of Quercus robur shows a distinct, but uncertain, relationship between circumference and sapwood area, which is unique compared to relationships of other oak species. In conclusion the results of the study show that the transpiration using sap flow und sap wood measurements cannot be obtained with high sufficient precision due to uncertainties: (1) in the relationship between circumference and sapwood area, (2) in sap flux densities within individual trees and (3) sap flow measurements themselves. As a direct result it is shown, that scaling transpiration from individual trees to the stand level needs to consider the associated uncertainties and leads to comparable results with other estimates.

How to cite: Tiedke, A. and Werisch, S.: Determination of effective sapwood areas of Common oaks (Quercus robur) and analysis of uncertainties for estimation of the water balance component evapotranspiration in lowland floodplain forests, EGU General Assembly 2024, Vienna, Austria, 14–19 Apr 2024, EGU24-9066, https://doi.org/10.5194/egusphere-egu24-9066, 2024.

EGU24-9508 | ECS | Orals | HS6.3

High-resolution Mapping of Terrestrial Evapotranspiration using ECOSTRESS: Insights into Surface Energy Balance Modeling 

Tian Hu, Kanishka Mallick, Patrik Hitzelberger, Yoanne Didry, Zoltan Szantoi, Gilles Boulet, Albert Olioso, Jean-Louis Roujean, Philippe Gamet, and Simon Hook

ECOsystem Spaceborne Thermal Radiometer Experiment on Space Station (ECOSTRESS) has been providing high spatio-temporal thermal infrared (TIR) observations (~70 m, 1-5 days) since August 2018. Land surface temperature (LST) retrieval obtained from TIR observations indicates the thermal status of the surface as a consequence of the land-atmosphere exchange of energy and water. It carries the imprint of vegetation water use and stress, thus serving as a pivotal lower boundary condition for retrieving evapotranspiration (ET). Taking advantage of the ECOSTRESS observations, the European ECOSTRESS Hub (EEH) funded by the European Space Agency (ESA) retrieves high-resolution ET for terrestrial ecosystems.

In EEH Phase 1 (2020-2022), instantaneous ET data between 2018 and 2021 were generated from three models with different structures and parameterization schemes over Europe and Africa, including the Surface Energy Balance System (SEBS) and Two Source Energy Balance (TSEB) parametric models, as well as the analytical Surface Temperature Initiated Closure (STIC) model. The evaluation by comparing against ground measurements at 19 eddy covariance sites for 6 different biomes over Europe showed that the physically based STIC model had relatively better consistency and higher accuracy across varying aridity and diverse biomes. Also, an advantage of STIC was found as compared to the official ECOSTRESS ET product obtained using the PT-JPL model, especially over arid and semiarid regions due to the weak LST control in PT-JPL.

Taking advantage of the recalibrated ECOSTRESS Collection 2 data, EEH Phase 2 (2023-2025) analyses the impacts of LST estimates from different algorithms on ET retrieval and related biophysical conductances over different biomes. It is found that ET estimates of STIC driven by LST retrieved from the two most commonly used algorithms (i.e., split window, SW, and temperature and emissivity separation, TES) have comparable accuracies. The sensitivity of ET to LST over savannas is almost three times of those over biomes over lower aridity. Surface-canopy conductance is more sensitive to surface temperature as compared to aerodynamic conductance.

Overall, the EEH is promising to provide quality assured ET estimates for monitoring terrestrial ecosystem water use and stress. Furthermore, it will facilitate the preparation for the next generation high-resolution thermal missions by investigating surface energy balance modeling, including TRISHNA (CNES/ISRO), SBG (NASA), and LSTM (ESA).

How to cite: Hu, T., Mallick, K., Hitzelberger, P., Didry, Y., Szantoi, Z., Boulet, G., Olioso, A., Roujean, J.-L., Gamet, P., and Hook, S.: High-resolution Mapping of Terrestrial Evapotranspiration using ECOSTRESS: Insights into Surface Energy Balance Modeling, EGU General Assembly 2024, Vienna, Austria, 14–19 Apr 2024, EGU24-9508, https://doi.org/10.5194/egusphere-egu24-9508, 2024.

EGU24-9874 | Posters on site | HS6.3

Assessment and Comparison of Sapwood Diameter Measurement Techniques in Scots pine: A Multi-Method Analysis 

Albin Hammerle, Daniel Nußbaumer, Georg Wohlfahrt, and Stefan Mayr

Accurate determination of the sapwood area in trees is crucial for understanding stem hydraulic capacities and sap to heartwood transitions. Hence it is essential to analyse sap flow data.

This study investigates the efficacy of various methods - electric resistivity tomography (ERT), visual inspection, thermography and staining - in measuring sapwood widths in Scots pine (Pinus sylvestris) growing in a mountainous pine forest in Mieming, Austria (AT-Mmg). Twenty trees were probed at breast height utilizing these techniques, and comparative analyses were conducted to assess their accuracy and efficiency.

ERT was performed with a PICUS system (Argus electronic, Germany). Low resistivities indicated high water content, and values along west and east oriented radii were extracted to determine sap wood borders. For the remaining measurements, wood cores (diameter 5mm, west and east oriented) were taken with an increment borer. Visual determination of the sapwood width was carried out immediately after coring, right before thermal images of the cores were taken. Thermography relied on temperature variation along the core, due to evaporative cooling of the sapwood. Finally, cores were sealed in a chamber which enabled axial flow of safranin solution and thus staining of sap wood areas.

All methods allowed identifying the transition zone between sap and heartwood. Remarkably, the comparative analysis among these methods unveiled close alignment and consistency in sapwood width measurements. Compared with staining, serving as the benchmark as based on the xylem hydraulic function, visual inspection, thermography, and ERT yielded results congruent with the stained cores.

The results demonstrate that all techniques under study enabled reliable measurements of sap wood widths in Scots pine. Analyses based on wood cores were easy and less time consuming than ERT, though the latter enabled insights into the entire cross-sectional sapwood. The capability and agreement of these methods for use with other conifers and/or angiosperms remains to be tested.

How to cite: Hammerle, A., Nußbaumer, D., Wohlfahrt, G., and Mayr, S.: Assessment and Comparison of Sapwood Diameter Measurement Techniques in Scots pine: A Multi-Method Analysis, EGU General Assembly 2024, Vienna, Austria, 14–19 Apr 2024, EGU24-9874, https://doi.org/10.5194/egusphere-egu24-9874, 2024.

EGU24-10616 | ECS | Orals | HS6.3

Spatially remotely sensed evapotranspiration estimates in Sahel regions using an ensemble contextual model : structural uncertainty estimation and reduction  

Nesrine Farhani, Jordi Etchanchu, Alain Dezetter, Pape Biteye Thiam, Aubin Allies, Ansoumana Bodian, Gilles Boulet, Nanee Chahinian, Lamine Diop, Ibrahim Mainassara, Pape Malick Ndiaye, Chloé Ollivier, Albert Olioso, Olivier Roupsard, and Jérôme Demarty

The Sahel region, identified as a "hot spot" for climate change, is characterized by a water scarcity and an inter-annual variability of water resources. Indeed, ongoing climate changes intensify the evaporative demand which could lead to more frequent period of droughts. Therefore, an important issue in these countries is to provide accurate estimation of evapotranspiration (ET) in a spatially distributed manner. The growing number of spatial ET products, including simple empirical equations (e.g., Penman-Monteith), land surface models (LSM), energy balance models, interpolated in-situ measurements, neural network approaches, or data fusion, form an interesting alternative in these areas scarcely gauged. However, until recently, there is no product combining simultaneously good spatiotemporal resolution (i.e., <1km, <daily) and good performances. Remote Sensing (RS) data in the thermal infrared domain, used in energy balance models, is particularly useful because it allows for spatial ET estimates at various space-time resolutions. A well-adapted method for the Sahelian context was proposed based on an ensemble contextual energy balance model combining thermal and visible satellite information (EVASPA S-SEBI Sahel method; E3S, Allies et al, 2020, 2022). This contextual method is based on the thermal contrast (hot/dry and cold/wet pixels) observed in a given thermal image to provide an ensemble of instantaneous estimation of evapotranspiration conditions. The applicability and accuracy of this approach suppose: (1) The presence of sufficient heterogeneity between dry and wet pixels within the same image and (2) the correct identification of the driest and wettest pixels, also known as dry and wet boundaries. These two hypotheses are rarely checked before computation within contextual models, leading to high uncertainties in ET estimation. Therefore, the aim of this study is firstly to allow for a systematic detection of the heterogeneity conditions and a dynamic selection of adapted methods for the determination of wet and dry boundaries by using only the image information without prior knowledge of local conditions. Secondly, our aim is also to assess the added value of using a thermal information from high spatial resolution (Landsat or Ecostress data) compared to medium resolution (Modis data) on the image heterogeneity and consequently on ET estimation. The proposed method shows higher performance in comparison with reference ET products in our study area in central Senegal, with a lower RMSE value (around 0.5 mm.day-1) compared to eddy-covariance measurements. Moreover, it reduces significantly structural uncertainties by around 0.6 mm.day-1 in dry season and around 0.4 mm.day-1 in wet season. Thermal information from higher resolution data are expected to further improve ET simulation due to a higher perceived heterogeneity in satellite images. It could lead to more accurate estimates of surface water deficit in semi-arid areas. The use of high-resolution data also makes this study a good demonstrator for the upcoming thermal earth observation missions like TRISHNA (CNES/ISRO), which this work is part of, LSTM (ESA) and SBG (NASA).  

How to cite: Farhani, N., Etchanchu, J., Dezetter, A., Thiam, P. B., Allies, A., Bodian, A., Boulet, G., Chahinian, N., Diop, L., Mainassara, I., Ndiaye, P. M., Ollivier, C., Olioso, A., Roupsard, O., and Demarty, J.: Spatially remotely sensed evapotranspiration estimates in Sahel regions using an ensemble contextual model : structural uncertainty estimation and reduction , EGU General Assembly 2024, Vienna, Austria, 14–19 Apr 2024, EGU24-10616, https://doi.org/10.5194/egusphere-egu24-10616, 2024.

EGU24-10913 | Posters on site | HS6.3

Comparison between the trapezoid method and two energy balance models (TSEB and 3SEB) to estimate evapotranspiration of a tree-grass ecosystem 

Karine Adeline, Vicente Burchard-Levine, Ana Andreu, Jean-Claude Krapez, Christian Chatelard, Dennis Baldocchi, and Susan Ustin

Tree-grass ecosystems (TGEs) comprise nearly 1/6th of Earth's surface in many climates while being biodiversity hotspots. These transitory landscapes dominate global biogeochemical cycles and are one of the most sensitive to global climate change. Indeed, these issues, combined with increasing pressures from agricultural land conversion, livestock grazing, and wildfires, require better characterization of these ecosystems. 

Actually, the performance of evapotranspiration (ET) remote sensing algorithms tends to have more significant uncertainties in these landscapes due to the poor representation of both (i) the vertical multiple-layered vegetation strata (i.e., overstory with tree/shrub canopies over a herbaceous understory) having distinct phenological variations and bare soil, and (ii) the openness of the horizontally distributed high vegetation, causing inherent pixel heterogeneity at the conventional satellite scale.

This study assessed and inter-compared remote sensing-based ET models having different modelling assumptions and data requirements. In this case, we applied an empirical and analytical vegetation index-temperature trapezoid method (VITT) and two different surface energy balance models: the two-source energy balance (TSEB) and three-source energy balance (3SEB). TSEB decouples the energy balance between vegetation and soil, while 3SEB incorporates an extra vegetation layer within the TSEB model structure to better depict ecosystems with multiple vegetation layers, such as TGEs. The VITT method considers as TSEB the decoupling of soil and vegetation, but the latter only in its photosynthetically active state. 

The study sites are a grass-oak-pine savanna and grassland, two experimental core sites from the Ameriflux network, Tonzi and Vaira sites, located in California, USA. The dataset comprises flux tower data, meteorological data, land cover data, and airborne images from Aviris-Classic (reflectance) and MASTER (temperature) sensors downsampled to 35m spatial resolution.

We evaluated the robustness of the methods to estimate ET through key phenological stages (e.g., drying of the grass layer, biomass peaks, and inter-intra annual variations). We analysed how well each method portrays vegetation water stress. The simpler the vegetation structure of the ecosystem, the more similar methods' behaviors and capabilities were. Methods that separate the ET from the different layers were more suitable for assessing the different layer influences for this open and partially covered system. The VITT method raised some limitations as used in a nonconventional way by accounting for two vegetation layers. One may expect better results to be achieved when at least one of the vegetation layers is senescent. Finally, our results can help us understand the possible constraints to face when applying these types of ET algorithms with future satellite missions (TRISHNA, SBG).

How to cite: Adeline, K., Burchard-Levine, V., Andreu, A., Krapez, J.-C., Chatelard, C., Baldocchi, D., and Ustin, S.: Comparison between the trapezoid method and two energy balance models (TSEB and 3SEB) to estimate evapotranspiration of a tree-grass ecosystem, EGU General Assembly 2024, Vienna, Austria, 14–19 Apr 2024, EGU24-10913, https://doi.org/10.5194/egusphere-egu24-10913, 2024.

The forested area is growing in Italy. The eco-hydrological monitoring of such an ecosystem is not trivial, because of canopy height, deep root system and soil heterogeneity. Hence, it is important to merge multiple measurement approaches to quantify the ecohydrological dynamics at the sites. In addition, it is also important to consider multiple temporal and spatial scales from point measurements to areal measurements of the soil-atmosphere interactions. At the Bussoleno - Grangia dell’Alpe forest site (Piedmont, Northwest Italy), we monitored two years, and in particular, two growing seasons (2021 and 2022, with a severe drought in Italy) with areal measures in the atmosphere of actual evapotranspiration (ETa) estimated via eddy covariance technique overcanopy (25 m mast) and areal estimates of soil water content measured continuously with cosmic ray sensors. Moreover, the soil resistivity was measured at the plot scale with Electrical Resistivity Tomography (ERT) technique with several campaigns in which two measurement transects were explored. The point scale with continuous measurements was monitored via soil water content and matric potential probes installed at several depths between 0.1 m and 2 m. In addition, during the ERT campaigns, the soil water content of the first 30 cm profile was also measured via TDR probes in different locations of the experimental site. All this effort allows the reconstruction of a forest volume from about 3 m of soil depth to 23 m of height (height of the eddy covariance setup), including the whole canopy effect. Results highlight the consistency of the soil water content estimation with different approaches (cosmic ray sensors, ERT technique, TDR and capacitive probes). Moreover, using different soil moisture measurements, the ETa regimes can be correctly and well identified. Furthermore, the drought effects are explored also using eddy covariance technique, highlighting that, despite a very low water content above 2 m of soil depth, the vegetation is not severely stressed, likely because of its resilience (the site is characterized by low precipitation, usually below 600 mm/year).

This publication is part of the project NODES which has received funding from the MUR –M4C2 1.5 of PNRR with grant agreement no. ECS00000036.

How to cite: Gisolo, D., Canone, D., Comina, C., Vagnon, F., Gentile, A., and Ferraris, S.: Drought effects investigation of a forested site at different spatial scales with eddy covariance technique, cosmic ray sensors, electrical resistivity tomography and 2 meters deep soil moisture and matric potential profile, EGU General Assembly 2024, Vienna, Austria, 14–19 Apr 2024, EGU24-11292, https://doi.org/10.5194/egusphere-egu24-11292, 2024.

The Satellite Application Facility on Land Surface Analysis Programme (LSA SAF, http://lsa-saf.eumetsat.int/) has developed an operational service that delivers satellite-based information on the land’s surface. The portfolio of the LSA SAF comprises estimates of evapotranspiration (ET) and surface energy fluxes (SEF) on the basis of observations by the geostationary Meteosat Second Generation (MSG) satellite. Those estimates are generated every 30 minutes across Europe, Africa and Eastern South America at the spatial resolution of the SEVIRI instrument of MSG. The time step and timeliness of these products are seldom found in operational and ET/SEF products in spite of the relevance of accounting for the variability in energy exchange between land surface and atmosphere in the course of the day.

The operational character of the LSA SAF programme has ensured the generation of a nearly 20 years-long archive of ET and SEF estimates (Barrios et al., 2024). The archive keeps growing as the ET/SEF estimates are generated in near-real time. The near real time operational data is freely available through the LSA SAF internet portal (https://landsaf2.ipma.pt/geonetwork/).

The recent launch of the Meteosat Third Generation (MTG) satellite will bring improvements in the spatial detail of the ET/SEF products of the LSA SAF programme while remaining compatible with the existing archive. The imager onboard MSG (SEVIRI) delivers observations at ~3 km spatial resolution at sub-satellite position whereas the spatial detail derived from Flexible Combined Imager (FCI) onboard the MTG exhibits a spatial resolution of 1-2 km. 

This contribution will discuss the expected advances  in the LSA SAF ET/SEF products as a consequence of the operational ingestion of MTG-based observations in the forcing of the LSA SAF algorithm. Other synergies with spatial missions to further improve ET/SEF estimates will be discussed as well.

Reference:

Barrios, J. M., Arboleda, A., Dutra, E., Trigo, I., Gellens-Meulenberghs, F. 2024: Evapotranspiration and surface energy fluxes across Europe, Africa and Eastern South America throughout the operational life of the Meteosat second generation satellite. Geoscience Data Journal (accepted).

How to cite: Barrios, J. M., Arboleda, A., and Gellens-Meulenberghs, F.: The Meteosat Third Generation satellite, advantages for an enhancement of evapotranspiration and surface energy fluxes estimates in the LSA SAF Programme, EGU General Assembly 2024, Vienna, Austria, 14–19 Apr 2024, EGU24-12126, https://doi.org/10.5194/egusphere-egu24-12126, 2024.

Climate change poses fundamental challenges to viticulture, such as more frequent droughts in Central Europe. This development requires precise, site-specific methods to determine plant water status. Especially in steep sloped vineyards, the spatial variability of drought stress can be high and depends on different factors such as slope, aspect and soil characteristics.      

Most established methods for determining plant water status are destructive, labor-intensive, or provide point-in-time measurements, or e.g. non-destructive modeling approaches need to be well referenced. UAV campaigns using thermal and multispectral imagery, as well as in-field sensor networks, provide non-destructive solutions with high spatio-temporal resolution. This study aims to combine both solutions to measure the high spatial and temporal variability of drought stress in a steep sloped vineyard. The goal is to develop a continuous, cross-scale, and resource-efficient method that can be used directly for irrigation scheduling or as a reference method for cross-scale modeling approaches at high spatial resolution.  

During the growing season of 2022, UAV campaigns were conducted every two weeks to generate  thermal and multispectral imagery over a vineyard of 1 ha in Saxony, Germany. The vineyard was divided into five management zones (MZ), which differ in terms of slope, aspect, soil characteristics and grape varieties. A monitoring system has been established in each management zone to continuously collect data on local climate, as well as soil and plant water properties. Simultaneously with the UAV campaigns, the water status and physiological stage of the vines were determined as reference measurements. Therefore, predawn leaf water potential (Ψpd) was measured using a Scholander pressure chamber. Based on the processed aerial images and the in-situ sensor-based measurements the Crop Water Stress Index (CWSI) was computed and then validated by comparing it’s values to in-field reference measurements such as soil water status and Ψpd. Weather and plant physiological in-situ measurements were also integrated into a grapevine water balance model to derive quantitative information on plant and soil water status.   

In-situ measurements of plant and soil water potentials correlated well with the results of the modeling approach. This was a good representation of the spatial heterogeneity of the vineyard, especially the differences in plant water availability between MZs. CWSI values from the UAV campaigns will be compared with the in-situ measurements in terms of spatial  variability, and also temporal variability to reproduce drought and other seasonal events. 

The combination of sensor data, simulation modeling and UAV-based thermal and multispectral imagery offers great potential to provide site-specific information with high spatio-temporal resolution about the plant water status. In particular, the inclusion of UAV campaigns can help to optimize the implemented sensor network and minimize the number of in-situ reference measurements. However, this cross-scale method also depends on a large number of influencing factors that need to be considered and discussed in depth in order to allow a valid assessment of drought stress dynamics and to set thresholds for irrigation or other management measures.  

How to cite: Boedeker, H., Graß, R., Mollenhauer, H., and Ohnemus, T.: Site-specific determination of plant water status in a steep sloped vineyard using a microclimatic monitoring system in combination with a water balance model and UAV-based thermal and multispectral imagery, EGU General Assembly 2024, Vienna, Austria, 14–19 Apr 2024, EGU24-12533, https://doi.org/10.5194/egusphere-egu24-12533, 2024.

EGU24-13113 | Orals | HS6.3

Multimodel – multidata simulations for mapping evapotranspiration and its uncertainty of estimation from remote sensing data 

Albert Olioso, Samuel Mwangi, Hugo Desrutins, José Sobrino, Drazen Skoković, Simon Carrière, Nesrine Farhani, Jordi Etchanchu, Jérôme Demarty, Tian Hu, Kanishka Mallick, Aolin Jia, Samuel Buis, Marie Weiss, Chloé Ollivier, and Gilles Boulet

Evapotranspiration (ET) is a fundamental element of the hydrological cycle which plays a major role on surface water balance and surface energy balance. At local scale, ET can be estimated from detailed ground observations, for example using flux towers, but these measurements are only representative of very limited homogeneous area. When regional information is required, e.g.  for monitoring ground water resources, ET can be mapped using thermal infrared and spectral reflectance data. Various ET models have been developed but there was no competitive evaluation of them over a large range of situations, so that it is not possible to evaluate the intrinsic performance of one model compared to another. In such situation, ensemble model averaging may provide a coherent estimation of ET with an increased overall accuracy. In this work the ensemble modelling approach is extended to a multi-model – multi-data framework that provides ET estimations together with an uncertainty of estimation.

We developed the EVASPA framework for estimating ET through ensemble averaging with the objective of providing estimates of ET together with an estimation uncertainty. In this presentation we present a full analysis of the uncertainties of ET estimation in relation to uncertainties in input variables and models. Airborne remote sensing data were acquired over the Grosseto area in Italy in the frame of the ESA SurfSense experiment (high spatio-temporal Resolution Land Surface Temperature Experiment) in support of the LSTM mission project (Copernicus Land Surface Temperature Monitoring). Evapotranspiration was computed using two different types of models considering: -1) the evaporative fraction (EF) computed from the variability of surface temperature versus vegetation amount (fraction cover) or albedo over the investigated areas ('triangle' approach) and -2) the residual aerodynamic equation. Two types of uncertainties were computed: the ‘novice user’ uncertainty and the ‘expert user’ uncertainty which differed by the previous knowledge on the accuracy of input data and on the performances of models that was available to users. Evapotranspiration uncertainties ranged between 0.8 mm.d-1 (EF model, expert case) and 2.7 mm.d-1 (aerodynamic model, novice case). The analysis showed that the main uncertainty sources were related to model formulations (evaporative fraction calculation and ground heat flux calculation for both types of models) and to solar radiation (both types of models), wind speed and air temperature (aerodynamic model).

The EVASPA framework is presently used for the definition of the ET product in the frame of the TRISHNA thermal infrared space mission (CNES/ISRO).

How to cite: Olioso, A., Mwangi, S., Desrutins, H., Sobrino, J., Skoković, D., Carrière, S., Farhani, N., Etchanchu, J., Demarty, J., Hu, T., Mallick, K., Jia, A., Buis, S., Weiss, M., Ollivier, C., and Boulet, G.: Multimodel – multidata simulations for mapping evapotranspiration and its uncertainty of estimation from remote sensing data, EGU General Assembly 2024, Vienna, Austria, 14–19 Apr 2024, EGU24-13113, https://doi.org/10.5194/egusphere-egu24-13113, 2024.

EGU24-13406 | Posters virtual | HS6.3

Integration of Sentinel-1A and FAO Penman-Monteith method for assessment of Evapotranspiration Dynamics using advanced Geospatial Data Analytics 

Selvaprakash Ramalingam, Padigapati Venkata Naga Sindhuja, and Aatralarasi Saravanan

Evapotranspiration (ETo), vital for agricultural and environmental management, faces challenges from climate change and spatial variability. Accurate Land Use-specific ETo estimates are essential for sectors like agriculture, forestry, and water management. Leveraging remote sensing technology, particularly optical remote sensing, holds promise in overcoming limitations posed by scarce weather station data and cloud cover issues. The study encompasses a wide array of meteorological parameters, including Solar Radiation (SR), Temperature (T), Relative Humidity (RH), Wind Speed (WS), and Rainfall (RF), gathered from the archive of Public Works Department archives for the period 2016-2017. Employing the FAO Penman-Monteith method, we calculated reference ETo, representing ETo under standard conditions. This involved intricate steps, such as determining mean T, vapor pressure, the slope of the vapor pressure curve, psychrometric constant, net radiation, and, ultimately, ETo. To enhance our understanding, we employed Partial Least Squares Regression (PLSR) to model the relationship between predictor variables (VV and VH Polarized sigma naught values from Sentinel-1A) and ETo. We generated equations for both monthly mean datasets and overall study period mean, offering insights into short-term fluctuations and long-term trends. Comparative analyses across land cover types unveiled intriguing patterns. Urban transportation areas exhibited stability, while deciduous forests and wetlands showcased temporal variations. In the ETo comparative analysis, each land cover category exhibited distinctive patterns, providing valuable insights into the dynamics of ETo. Among the land cover parameters, ETo was significantly impacted by relative humidity (RH) (70.80% to 89.89%), and temperature (T). Urban vegetated areas had stable T values (29.37°C), while forests showed dynamic variations in T (24.24°C to 28.94°C). The VH polarization captured a diverse range of climatic influences, resulting in a broader range of dynamic ETo values (7.38 to 10.76 mm/day) compared to the VV polarization (6.74 to 9.34 mm/day). The performance of the VH sensor varied; moderate accuracy was observed in October 2016 (R 2 = 0.50) with slight underestimation (Bias = -0.08), whereas exceptional accuracy was seen in December 2017 (R 2 = 1.00) with positive bias (0.57) and excellent agreement (KGE = 0.92). The VV sensors in October 2016 had a firm fit (R 2 = 0.55), moderate underestimation (Bias = -0.87), and December 2017 showed a good fit (R 2 = 0.57), slight overestimation (Bias = 0.44), and good agreement (KGE = 0.44). Thus, integrating machine learning and satellite imagery improves ETo accuracy for real-time monitoring in adaptive management amid climate change, showcasing sensor-specific variations. For precise estimation of ETo, future research should integrate multi-source satellite data and machine learning, which is crucial for adaptive environmental management.

How to cite: Ramalingam, S., Sindhuja, P. V. N., and Saravanan, A.: Integration of Sentinel-1A and FAO Penman-Monteith method for assessment of Evapotranspiration Dynamics using advanced Geospatial Data Analytics, EGU General Assembly 2024, Vienna, Austria, 14–19 Apr 2024, EGU24-13406, https://doi.org/10.5194/egusphere-egu24-13406, 2024.

The source region of Yangtze river has experienced permafrost degradation and ecological deterioration since 1980s. Accurately estimating the evapotranspiration (ET) and analyzing the spatiotemporal variation in the region is crucial for understanding the change in permafrost and ecological environment. The universal Ts-VI model, transforming the Ts-VI feature space from regional to pixel scale, has been performed over a poorly gauged region with arid ecosystems in the Qinghai-Tibetan Plateau with high spatial resolution and daily continuity. However, the aerodynamic resistance formulation in this universal Ts-VI model only holds true under neutral stability conditions. This study proposes a scheme for improving the estimation of ET based on the universal Ts-VI model by integrating an aerodynamic resistance formulation without the assumption of the neutral stability conditions. The daily ET in the source region of Yangtze river on the Qinghai-Tibetan Plateau from 2003 to 2018 is achieved based on the modified universal Ts-VI model by using the MODIS, Daily 1-km all-weather land surface temperature dataset for Western China (TRIMS LST-TP), and China meteorological forcing dataset (CMFD) and is evaluated by comparing it with eddy covariance measurements in two sites located in permafrost, modeled ET from original universal Ts-VI model, and a readily available daily ET product. Our results indicate that incorporating the aerodynamic resistance formulation without requirement of neutral stability conditions into the universal Ts-VI model can improve the estimation of ET in the plateau of cold and arid region and thus provide more accurate ET maps for study of permafrost degradation and ecological deterioration.

How to cite: Li, Y. and Zhao, L.: Mapping daily evapotranspiration (2003-2018) based on a modified universal Ts-VI triangle method in the source region of Yangtze river on the Qinghai-Tibetan Plateau, EGU General Assembly 2024, Vienna, Austria, 14–19 Apr 2024, EGU24-13657, https://doi.org/10.5194/egusphere-egu24-13657, 2024.

EGU24-13995 | ECS | Orals | HS6.3

Water and carbon dioxide fluxes in contrasting land covers typical from Brazilian Cerrado: Modeling and methodological challenges using eddy covariance data 

Jamil Alexandre Ayach Anache, David Holl, Alex Kobayashi, Yuqing Zhao, Paulo Berardo Pessoa de Souza, and Edson Wendland

The tropics play a pivotal role in the terrestrial energy and water cycles, as well as regulating the carbon cycle. The increasing pressures over the remaining natural vegetation areas in Brazilian tropical forests, allied to climate change, are likely expected to alter these cycles. Despite the existence of studies that have already observed changes on water and energy fluxes, questions regarding heat and mass exchange mechanisms and the biophysical processes in tropical ecosystems and crops for food and energy production remain. Studies involving carbon exchanges and water fluxes in the Cerrado ecoregion are mostly related to agricultural land uses (e.g., pasture, eucalyptus, and sugarcane). Thus, empirical answers from undisturbed areas of this ecoregion are important to understand the whole of pristine vegetation in carbon and water flux related processes in tropical ecosystems, which generally lacks on-site observations. Here, the complex land use pattern (contrasting land use in the footprint area) of an experimental site challenges the data processing and the representativeness of a dataset obtained using eddy covariance technique. However, these challenges may also create scientific opportunities to obtain responses from contrasting land uses at the same measurement tower if a consistent data processing along fluxes calculations is performed. The purpose of this study is to compare contrasting land uses responses concerning the water and carbon dioxide fluxed observed from an eddy covariance experiment deployed in a complex site, which measures an undisturbed tropical woodland and a mixed agricultural site (pasture, sparse trees, and sugarcane). This complex landscape created methodological challenges concerning the flux footprint representativeness for data filtering to allow modelling water and carbon dioxide fluxes. Thus, this study also evaluated a workflow to calculate fluxes considering a dynamic metadata that varied canopy height, displacement height, and roughness length binned by the wind direction. The evapotranspiration in wooded Cerrado is higher than the agricultural land along the entire year, mainly due to the increased transpiration along the whole year including the dry season. In addition, this remarkable plant activity difference between the observed land covers can also be seen in the carbon dioxide flux, as its absorption tend to be higher in the wooded Cerrado than what was observed in the agricultural site. Thus, through the sampling context of this site-specific studies, it is possible to assume that the plants water-use strategies are driven by vegetation height, and the ecosystem carbon flux is controlled by vegetation structure and water availability.

How to cite: Ayach Anache, J. A., Holl, D., Kobayashi, A., Zhao, Y., Pessoa de Souza, P. B., and Wendland, E.: Water and carbon dioxide fluxes in contrasting land covers typical from Brazilian Cerrado: Modeling and methodological challenges using eddy covariance data, EGU General Assembly 2024, Vienna, Austria, 14–19 Apr 2024, EGU24-13995, https://doi.org/10.5194/egusphere-egu24-13995, 2024.

EGU24-14185 | ECS | Orals | HS6.3

A new post-hoc method to improve the eddy-covariance-based evapotranspiration measurements 

Weijie Zhang, Jacob Nelson, Diego Miralles, Matthias Mauder, Mirco Migliavacca, Rafael Poyatos, Markus Reichstein, and Martin Jung

Terrestrial evapotranspiration (ET) is the nexus of the water, energy and carbon cycles, and therefore accurate quantification of ET is important for understanding the climate and the Earth system. However, current ET estimates derived from process-based models and remotely sensed observations are subject to significant uncertainty, a major reason for which is the limited availability and quality of ground validation data. The eddy covariance (EC) technique provides an excellent opportunity for continuous ET measurements at ecosystem scales with high temporal resolution (half-hourly or hourly resolution), and nowadays eddy towers are deployed in almost all types of terrestrial ecosystems and climatic conditions. Most EC-based ET estimates, however, suffer from an energy imbalance: the sum of sensible and latent heat fluxes is often lower than the available energy (i.e. the difference between net radiation and soil heat flux). The general consensus on the causes includes instrumental bias, missing stored fluxes, different footprints for different variables, and imperfect assumptions in the eddy covariance approach.

In this presentation, we propose a generalised correction method (Zhang et al., 2023, 2024) across the site network. The method, statistical in nature, can improve the energy imbalance from ~80% to ~98% across the site network. The results are markedly better than those by the standard correction method implemented in the dataset processed by the ONEFlux pipeline, which tends to over-correct turbulent flux measurements. We further evaluate the corrected ET by comparing it with independent regional measurements in terms of spatial patterns and temporal variations, after upscaling the ecosystem-level data to the global scale using the latest FLUXCOM framework. The results show that the corrected ET-based upscaled estimates are closer to the ET derived from the water balance perspective and from the balloon-sounding observations. Our method provides a state-of-the-art alternative to improve the energy balance closure by correcting the site-level ET, and the improved global ET estimates can be of great value for water cycle studies and for model development.

References:

Zhang, W., Jung, M., Migliavacca, M., Poyatos, R., Miralles, D. G., El-Madany, T. S., . . . Nelson, J. A. (2023). The effect of relative humidity on eddy covariance latent heat flux measurements and its implication for partitioning into transpiration and evaporation. Agric. For. Meteorol., 330, 109305. doi:10.1016/j.agrformet.2022.109305

Zhang, W., Nelson, J. A., Miralles, D. G., Mauder, M., Migliavacca, M., Poyatos, R., Reichstein, M., Jung, M. (2024). A new post-hoc method to reduce the energy imbalance in eddy covariance measurements. Geophys. Res. Lett., (accecpted)

How to cite: Zhang, W., Nelson, J., Miralles, D., Mauder, M., Migliavacca, M., Poyatos, R., Reichstein, M., and Jung, M.: A new post-hoc method to improve the eddy-covariance-based evapotranspiration measurements, EGU General Assembly 2024, Vienna, Austria, 14–19 Apr 2024, EGU24-14185, https://doi.org/10.5194/egusphere-egu24-14185, 2024.

In the pursuit of optimizing use of limited water resources in agriculture, leveraging high-resolution aerial imagery to estimate ETa (actual crop evapotranspiration) is of interest to farmers and water managers. However, there remains a dearth of information regarding the efficacy of energy balancing algorithms—initially developed for satellite remote sensing for estimating ETa from aerial imagery. This study presents an approach that estimates ETa for processing tomatoes employing high-resolution aerial data and the pySEBAL (Surface Energy Balance Algorithm for Land) remote sensing algorithm. During the 2021 growing season, an aircraft captured multispectral and thermal imagery over a processing tomato farm near Esparto, California, USA. Simultaneously, low-frequency biometeorological data essential for energy balance assessment, along with high-frequency turbulent fluxes, were measured by an eddy covariance flux tower installed within the field. Extensive evaluation of ETa and other energy balance components showed that pySEBAL produced accurate, high-resolution estimates of ETa. The root mean square error (RMSE) for the energy balance components were as follows: 33 Wm-2 for the latent heat flux, 29 Wm-2 for the sensible heat flux, 24 Wm-2 for the net radiation, and 10 Wm-2 for the soil heat flux. Moreover, the RMSE for ETa was 0.26 mm d-1. Notably, each component exhibited an R2 value exceeding 0.92. Furthermore, the ETa mapping of the processing tomato field delineated spatial variability linked to irrigation schedules, crop development, areas affected by disease, and soil heterogeneity, visually representing these aspects. This research underscores the pivotal role of high-resolution spatial aerial imagery and the pySEBAL algorithm in estimating ETa variability within fields, demonstrating high potential for improving precision irrigation management and maximizing the judicious utilization of water resources in agriculture.

How to cite: Peddinti, S. R. and Kisekka, I.: Estimating Crop Evapotranspiration Variability in Processing Tomatoes Using High-Resolution Aerial Imagery and pySEBAL Algorithm, EGU General Assembly 2024, Vienna, Austria, 14–19 Apr 2024, EGU24-14187, https://doi.org/10.5194/egusphere-egu24-14187, 2024.

EGU24-14382 | Orals | HS6.3

Evapotranspiration estimates from eddy covariance and from UAV imagery 

Przemysław Wachniew, Radosław Szostak, Alina Jasek-Kamińska, and Mirosław Zimnoch

This study compares evapotranspiration (ET) estimates obtained from 42 hours (7 – 9 July 2023) of continuous eddy covariance measurements with ET estimates derived from UAV thermal and multispectral imagery collected in 12 flight missions completed in the same period. Meteorological conditions were stable during the measurement campaign with mostly clear sky, weak wind and air temperatures fluctuating diurnally between +8 to +30°C. The eddy covariance estimates averaged over 30 minute intervals corresponded to the source area covered mostly by oat field and freshly cut meadow. The algorithm for ET estimation was based on the Priestley-Taylor scheme applied in the ECOSTRESS Level-3 Evapotranspiration product, however, with a number of variables (components of radiative energy balance, relative humidity, ground heat flux) obtained from direct measurements. The NDVI and SAVI indices obtained from multispectral UAV images were used to estimate fractions of absorbed and intercepted photosynthetically active radiation. UAV-based ET estimates obtained at ca. 8 cm spatial resolution were averaged over the eddy covariance footprint area and interpolated for the times of EC-based ET measurements. Our results show that the approach combining UAV-based thermal and multispectral imagery with point measurements of meteorological variables and energy balance components might provide robust spatial ET estimates for agricultural areas of the size covered by one UAV mission, this is of the order of up to tens of hectares.

This research was funded by National Science Centre, Poland, project WATERLINE (2020/02/Y/ST10/00065), under the CHISTERA IV programme of the EU Horizon 2020 (Grant no 857925) and the "Excellence Initiative - Research University" programme at AGH University of Kraków.

How to cite: Wachniew, P., Szostak, R., Jasek-Kamińska, A., and Zimnoch, M.: Evapotranspiration estimates from eddy covariance and from UAV imagery, EGU General Assembly 2024, Vienna, Austria, 14–19 Apr 2024, EGU24-14382, https://doi.org/10.5194/egusphere-egu24-14382, 2024.

EGU24-14542 | ECS | Orals | HS6.3

A new technique of measuring sap flow that accurately measures a wide range of sap flow rates 

Spandan s b and Venketraman srinivasan

Accurate estimation of sap flow is vital for plant models and significantly impacts existing management policies, particularly when scaling from the plant level to plot levels. The heat pulse method (HPM) is widely used for measuring sap flow in plants because of its added benefits compared to other traditional methods. In HPM, there are many approaches, all of which follow the Marshall theory. The existing HPM fails to measure a wide range of sap flow rates in a single approach. The literature suggests that those limitations may be because of factors such as wounding, sensor resolution, and others. However, these reasons apply only within specific heat pulse velocity ranges. These methods typically rely on 1-3 data points for sap flow estimation. In some methods, the data points for particular flow rates may be susceptible to noise, resulting errors in sap flow estimates. While a combination of different methods could potentially address this issue, they often require different probe configurations, additional probes, and complex switching algorithms. However, none of the existing techniques have successfully measured the full range of sap flow rates. In this study, we present a new approach capable of measuring a wide range of sap flow rates by minimizing the sum of square errors between modeled and observed temperature data points, utilizing 180 data points. Additionally, we demonstrate that the signal-to-noise ratio as an explanatory framework shows the limitations of existing methods within specific heat pulse velocity ranges. We show that the signal-to-noise ratio can be increased by utilizing all available data points. The Sum of Square Errors Minimization method can accurately measure a wide range of sap flow rates without the need to change probe configurations, contributing to improved scaling from plant level to plot levels.

How to cite: s b, S. and srinivasan, V.: A new technique of measuring sap flow that accurately measures a wide range of sap flow rates, EGU General Assembly 2024, Vienna, Austria, 14–19 Apr 2024, EGU24-14542, https://doi.org/10.5194/egusphere-egu24-14542, 2024.

EGU24-15285 | ECS | Orals | HS6.3

Generalising Tree–Level Sap Flow Across the European Continent using LSTMs 

Ralf Loritz, Chen Huan Wu, Daniel Klotz, Martin Gauch, Frederik Kratzert, and Maoya Bassiouni

In this presentation, we explore the application of Long Short-Term Memory networks (LSTMs) to predict hourly tree-level sap flow across Europe, utilizing the comprehensive SAPFLUXNET database. This study emphasizes the potential of deep learning in estimating transpiration and understanding forest water use dynamics and plant-climate interactions. By developing LSTM models with varied training sets, we assess their capability to perform in previously unencountered conditions. Our research reveals that these models achieve an average Kling-Gupta Efficiency of 0.77 when trained on 50% of the time series across all forest stands, and 0.52 for models trained on 50% of the forest stands without prior gauging. These continental-scale models not only meet but often exceed the performance of specialized and baseline models across all tree genera and forest types. In this submission, we will discuss the methodologies employed, the challenges faced, and the insights gained from this research. The presentation will also highlight the broader implications of this study for ecohydrological investigations, particularly the enhanced capacity of deep learning models to generalize sap flow data, thereby improving our understanding of ecohydrology from individual trees to a continental scale.

How to cite: Loritz, R., Wu, C. H., Klotz, D., Gauch, M., Kratzert, F., and Bassiouni, M.: Generalising Tree–Level Sap Flow Across the European Continent using LSTMs, EGU General Assembly 2024, Vienna, Austria, 14–19 Apr 2024, EGU24-15285, https://doi.org/10.5194/egusphere-egu24-15285, 2024.

EGU24-15876 | ECS | Orals | HS6.3

Assessing the potential of future sub-daily microwave observations for estimating evaporation 

Emma Tronquo, Susan C. Steele-Dunne, Hans Lievens, Niko E.C. Verhoest, and Diego G. Miralles

Evaporation (E) plays a key role in the terrestrial water, energy, and carbon cycles, and modulates climate change through multiple feedback mechanisms. Its accurate monitoring is thus crucial for water management, meteorological forecasts, and agriculture. However, traditional in situ measurements of E are limited in terms of availability and spatial coverage. As an alternative, global monitoring of E using satellite remote sensing, while indirect, holds the potential to fill this need. Today, different models exist that yield E estimates by combining observable satellite-based drivers of this flux, but typically work at daily or oven monthly time scales. As natural evaporation processes occur at sub-daily resolution, there is a need to estimate evaporation at finer temporal scales to capture the diurnal variability of this flux and to monitor water stress impacts on transpiration. Likewise, interception loss shows high intra-day variability, mainly concentrated during precipitation events and shortly after. Moreover, the moisture redistribution within the soil–plant–atmosphere continuum as a consequence of transpiration is highly non-linear and has a strong daily cycle.

Sub-daily microwave data could inform about these short-term processes, and as such improve process understanding and monitoring of E and its different components, while providing all-skies retrievals. The Sub-daily Land Atmosphere INTEractions (SLAINTE) mission, a mission idea submitted in response to ESA’s 12th call for Earth Explorers, will aim to provide sub-daily SAR observations of soil moisture, vegetation optical depth (VOD) and wet/dry canopy state, enabling a more accurate estimation of E and the potential to advance E science beyond its current boundaries.

This study investigates the potential value of future SLAINTE observations for improving the estimation of E at four eddy covariance sites. In this regard, Observing System Simulation Experiments (OSSEs) are assembled. In total, three experiments using synthetic microwave observations are implemented, focusing on the role of (1) sub-daily soil moisture in improving bare soil evaporation and transpiration estimates, (2) sub-daily VOD in improving transpiration estimates, and (3) sub-daily microwave observations that inform about the wetness state of the canopy, to address the uncertainties related to rainfall interception loss. The Global Land Evaporation Amsterdam Model (GLEAM; Miralles et al., 2011) is used for the simulations. GLEAM is a state-of-the-art E model that estimates the different E components (mainly transpiration, soil evaporation, and interception loss) using satellite data, including microwave observations of surface soil moisture and VOD. The model is here adapted to work at sub-daily resolution. The results of the OSSEs illustrate that prospective sub-daily microwave data would lead to improvements in the estimation of evaporation and its separate components, even if based on current-generation evaporation models, and highlight the need for missions like SLAINTE to better comprehend the flow of water in ecosystems.

How to cite: Tronquo, E., Steele-Dunne, S. C., Lievens, H., Verhoest, N. E. C., and Miralles, D. G.: Assessing the potential of future sub-daily microwave observations for estimating evaporation, EGU General Assembly 2024, Vienna, Austria, 14–19 Apr 2024, EGU24-15876, https://doi.org/10.5194/egusphere-egu24-15876, 2024.

EGU24-16071 | Orals | HS6.3

Surface water balance estimation in a mountainous and forested Mediterranean protected area using remote sensing estimates of evapotranspiration 

Jordi Cristóbal, Jérôme Latron, Mahsa Bozorgi, Joaquim Bellvert, and Magí Pàmies

Drought, as an extreme climatic event with a growing presence worldwide, plays an important role in forestry as well as in the management and conservation of natural areas, especially in the Mediterranean basin. Currently, the abandonment of primary activities because of the lack of economic profitability and the lack of generational relief is detrimental to agroforestry mosaics. The expansion of the forest mass due to the afforestation of former crops and pasture fields favors naturalization, but also leads to an alteration of the water balance at both local and regional levels. In addition, one of the effects of climate change will be an increase in the demand for atmospheric water for natural vegetation caused by the increase in temperatures and the decrease in precipitation and water reserves. This will have an important effect on the increase in wildfire risk as well as water flow decrease to maintain fauna and flora, especially in riparian habitats. Thus, in a global change scenario, the next challenge in the 21st century for the conservation and management of biodiversity and natural resources will be on how to adopt a set of technologies that allow monitoring and estimating water resources at regional scales. Evapotranspiration (ET) plays a significant role in the hydrologic cycle of Mediterranean basins, where surface-atmosphere exchanges due to ET may be more than 70% of annual precipitation. Together with precipitation (P), the surface water balance (P-ET), key parameter in the management and conservation natural resources, can be estimated. Even though ET is a significant component of the hydrologic cycle in this region, bulk estimates do not accurately account for spatial and temporal variability due to vegetation type or topography. The main objective of this study is to estimate the surface water balance at a regional scale on a mountainous protected area, the Montseny Biosphere Reserve, through the analysis of ET remote sensing estimates from 2017 to 2022 in a long-term gauged catchment. To estimate ET, the SEN-ET modelling framework (http://esa-sen4et.org) based on the Two-Source Energy Balance model that allows estimating high-resolution ET daily estimates at a spatial resolution of 20 m by sharpening thermal observations from Sentinel-3 satellites (1km, daily) and optical observations from Sentinel-2 satellites (20m, every 5 days) was applied. To estimate the surface water balance, daily precipitation was obtained by multiple regression analysis of meteorological stations. Preliminary evaluation of ET remote sensing estimates with ET derived from the long-term gauged catchment yielded an RMSE of around 1.5 mm·day-1 that allowed computing a reasonable surface water balance for this period. Due to a severe drought within the study period, the annual surface water budget showed a decrease pattern. A water balance anomaly analysis showed that 80% of the reserve forest were under a negative anomaly for three consecutive years, pointing out that surface water balance derived from ET remote sensing estimates can be used to improve forest management by focusing on those areas that will become more affected by drought episodes.

How to cite: Cristóbal, J., Latron, J., Bozorgi, M., Bellvert, J., and Pàmies, M.: Surface water balance estimation in a mountainous and forested Mediterranean protected area using remote sensing estimates of evapotranspiration, EGU General Assembly 2024, Vienna, Austria, 14–19 Apr 2024, EGU24-16071, https://doi.org/10.5194/egusphere-egu24-16071, 2024.

EGU24-17116 | ECS | Orals | HS6.3

Soil hydraulic conductivity determines the onset of water-limited evapotranspiration across scales 

Fabian J. P. Wankmüller, Louis Delval, Peter Lehmann, Martin J. Baur, Sebastian Wolf, Dani Or, Mathieu Javaux, and Andrea Carminati

Terrestrial vegetation, central to water-energy-carbon interactions between land and atmosphere, such as evapotranspiration, is under severe pressure due to human disturbances and changing climate. Evapotranspiration switches from being energy to being water limited at critical soil water thresholds. Despite the importance of such soil water thresholds for terrestrial ecosystems, the key mechanisms and drivers (being them related to plants, soils or the atmosphere) controlling their values remain unclear at the ecosystem scale.

Soil water thresholds have recently been estimated from global networks of terrestrial flux measurements based on Eddy-Covariance method (FLUXNET). However, this approach does not allow to partition between soil evaporation and plant transpiration, which might have different thresholds. Therefore, we also estimated soil water thresholds from a complementary monitoring network based on sapflow measurements (SAPFLUXNET), which provides the actual flow velocity along the xylem being closely related to transpiration rate. Besides comparing the two measurements approach, we aimed to explain the key mechanisms controlling soil water thresholds.

We found that the two monitoring approaches provide similar values of soil water thresholds. These thresholds, expressed as either soil moisture θcrit or soil matric potential ψcrit, are function of soil texture globally. By applying a soil-plant hydraulic model (considering the key soil, plant, and atmospheric parameters) at plant and ecosystem scale, we show that at both scales, θcrit and ψcrit are determined by the abrupt decrease of soil hydraulic conductivity with decreasing soil moisture content, causing a loss in leaf water potential that triggers stomatal closure. For soils with a moderate decrease of hydraulic conductivity (loam), atmospheric conditions and vegetation properties become more relevant, resulting in a higher variability of soil water thresholds compared to sandy soils (sharpest decrease of hydraulic conductivity).

Overall, our results show that soil texture modulates land-atmosphere exchange globally across scales, biomes, and climates, highlighting the importance of soil water flow for predicting and understanding evapotranspiration dynamics.

How to cite: Wankmüller, F. J. P., Delval, L., Lehmann, P., Baur, M. J., Wolf, S., Or, D., Javaux, M., and Carminati, A.: Soil hydraulic conductivity determines the onset of water-limited evapotranspiration across scales, EGU General Assembly 2024, Vienna, Austria, 14–19 Apr 2024, EGU24-17116, https://doi.org/10.5194/egusphere-egu24-17116, 2024.

EGU24-18879 | Orals | HS6.3

 evapotranspiration measurements at the landscape scale using a Micro-Wave scintillometer prototype: Evaluation from two field campaigns. 

Jean-Martial Cohard, Hélène Barral, Catherine Coulaud, Bernard Mercier, Davy Regneau, Jacob Arrivé, and Fabienne Lohou

Quantification of evapotranspiration over complex terrain is still challenging because all the known methods are indirect and rely on strong assumptions. The bichromatic scintillometry method, combining optical/near-infrared and microwave scintillometers, is probably one of the closest methods to the turbulent theoretical framework as it measures turbulent parameters for temperature and moisture fluctuations. However, since its description in the 90s, very few works have been published using this method, mainly because of the availability of manufactured instruments but also because of technical and methodological issues.

In this study we present evapotranspiration series from two different campaigns with the combination of two scintillometers operating, one in the near infra-red domain and the other in the radiofrequency domain (94GHz), a prototype developed in collaboration with the Rutherford Appleton Laboratory (UK). The first 18-month time series has been measured over a crop mosaic These instruments have been installed in the Critical Zone observatory Oracle, located east of Paris in the Seine Catchment, and have run continuously since May 2016 to the end of year 2017 on a 4.5km pathlength. The data processing has been developed from raw received intensity data logged at 1kHz for both scintillometers. Turbulent fluxes have been processed from Cn² measurements using the bichromatic method. The data processing toolbox has been fully developed at IGE. Fluxes are then compared with aggregated fluxes from Eddy-Covariance stations representative of the different land cover within the footprint. Results are very encouraging with very good energy balance closure on short periods. However an underestimation of fluxes during summer times suggests some possible saturation impacts. To address this issue we installed a renewed scintillometry setup on a shorter 600m path length at the P2OA facility site near Lannemezan (South of France). The presentation will focus on these new results. 

How to cite: Cohard, J.-M., Barral, H., Coulaud, C., Mercier, B., Regneau, D., Arrivé, J., and Lohou, F.:  evapotranspiration measurements at the landscape scale using a Micro-Wave scintillometer prototype: Evaluation from two field campaigns., EGU General Assembly 2024, Vienna, Austria, 14–19 Apr 2024, EGU24-18879, https://doi.org/10.5194/egusphere-egu24-18879, 2024.

EGU24-19901 | ECS | Posters on site | HS6.3

Partitioning of evaporation into interception and transpiration for the overstory, understory, and forest floor in a coniferous forest in the Netherlands 

Gijs Vis, Michiel van der Molen, Maxine Luger, and Miriam Coenders-Gerrits

Forests play a significant role in altering precipitation patterns by interception and transpiration. Interception causes a redistribution and (mostly) a reduction of the plant available water, which has direct feedback on the transpiration. Additionally, most forests have an overstory, an understory, and a forest floor, which makes this feedback mechanism even more complex to unravel. In this study we aim to partition total evaporation into interception and transpiration for the overstory, understory, and forest floor for a coniferous forest in The Netherlands.

At the Ruisdael Observatory Loobos, an eddy covariance system on top of a 38-meter-high tower measures total evaporation of the forest. Along this tower, vapour pressure deficit is probed at 11 different heights. Net radiation is measured at ground level and the top of the tower. By applying the Bowen Ratio Energy Balance - method (BREB) between the different sensors, we can partition the total evaporation flux above and below the overstory. Additionally, fiber optic cables are installed along the tower, where one cable measures the air temperature over the height and another cable, which has a wet cloth, the wet bulb temperature. By applying BREB, the fiber optic cables will provide a near-continuous total evaporation profile from the forest floor to far above the canopy. To partition evaporation into interception and transpiration, we will make use of leaf wetness sensors by assuming that transpiration only occurs when the leaves or needles are dry. To verify this assumption, we also installed a rain gauge above the canopy and several gauges below to measure throughfall.

Having multiple instruments to measure the different evaporation components, allows us to partition total evaporation into interception and transpiration for the different layers and cross-validate it. This poster combines previous experimental research into an integrated approach. The set-up is outlined and first results using data from the summer of 2023 and spring of 2024 are presented.

How to cite: Vis, G., van der Molen, M., Luger, M., and Coenders-Gerrits, M.: Partitioning of evaporation into interception and transpiration for the overstory, understory, and forest floor in a coniferous forest in the Netherlands, EGU General Assembly 2024, Vienna, Austria, 14–19 Apr 2024, EGU24-19901, https://doi.org/10.5194/egusphere-egu24-19901, 2024.

EGU24-20059 | ECS | Posters on site | HS6.3

Assessment of a bespoken remote-sensing Evapotranspiration model for Seasonally Dry Tropical Forests 

Davi Melo, John Cunha, Ulisses Bezerra, Rodolfo Nóbrega, and Aldrin Perez-Marin

Evapotranspiration (ET) plays an essential role in the water cycle, particularly in biodiverse environments with pronounced seasonal variability, such as the Caatinga. Accurately representing ET spatially and temporally in these ecosystems is indispensable, not only for understanding hydrological dynamics but also for natural resource management. However, the intricate nature of these environments poses significant challenges in modelling ET, which demands adaptive, site-specific approaches to capture their complex spatial and temporal variations. In this context, the STEEP (Seasonal Tropical Surface Energy Balance) model has been developed with the objective of capturing intrinsicalities of the dynamics and energy balance of the Caatinga forest. Despite its relatively good performance when compared to ground-based and global ET products, STEEP has not been extensively compared to other RS-based ET models. In this study, we used daily data from 2014 to revisit STEEP modelling outputs by comparing them to eddy covariance data and against five ET remote sensing models: PT-JPL, GLEAM, PM-MOD, SEBAL, and S-SEBI. We used the following statistics for performance evaluation: root mean squared error (RMSE), percent bias (PBIAS), and concordance correlation coefficient (CCC). Evaluation metrics for all models varied as follows: 0.69–1.31 mm day-1 (RMSE), -13.54–41.13% (PBIAS), and 0.53–0.85 (CCC). STEEP overperformed four out of five models (i.e. SEBAL, S-SEBI, PT-JPL, and GLEAM), with RMSE = 0.80 mm/day, PBIAS = 11%, and CCC = 0.80. PM-MOD model exhibited the best performance metrics when driven with ground-truth data. We ascribe the best results of this model to its complex algorithm, which makes use of a wide range of spectral responses and environmental variables. Overall, all models exhibit some degree of ET overestimation during the dry season. This study highlights the ongoing need for precise model evaluation and adaptation to environmental nuances for improved ET estimation in biodiverse ecosystems like the Caatinga

Research Funding: National Council for Scientific and Technological Development (CNPq): grants nº 409341/2021–5 and 442799/2023-3

How to cite: Melo, D., Cunha, J., Bezerra, U., Nóbrega, R., and Perez-Marin, A.: Assessment of a bespoken remote-sensing Evapotranspiration model for Seasonally Dry Tropical Forests, EGU General Assembly 2024, Vienna, Austria, 14–19 Apr 2024, EGU24-20059, https://doi.org/10.5194/egusphere-egu24-20059, 2024.

Evapotranspiration (ET) is the combined result of two highly dynamic processes: transpiration, which is the water loss from plants through their stomata, and evaporation, which is the conversion of water on the surface into water vapor. Thus, ET is a key factor in crop growth and yield. To efficiently estimate ET with high temporal and spatial coverage, satellite data provide essential input, such as input to the well-developed models utilizing the energy balance method. Spaceborne thermal infrared data allow the derivation of land surface temperature (LST), a vital component for many ET models that utilize the energy balance theory.


Spaceborne-based modelling of ET using energy balance approaches requires input of atmospheric and surface variables with biophysical parameters of the plants covering the surface. Latent heat flux is a critical component that is modelled, as it is the transfer of energy from the surface to the atmosphere that results from evaporation and the transpiration of water from plants. With the lack of validation data worldwide, estimating ET with more than one model has allowed the identification of suitable input, improvement of assumptions, detection of outliers, and assessment of uncertainty.


In this research, two models are used to estimate ET: (1) two-source energy balance (TSEB), (2) Priestley-Taylor Jet Propulsion Laboratory model (PT-JPL). They are two-source models; thus, they consider vegetation and soil to be independent regarding heat flux estimation, yet with distinct characteristics.  PT-JPL uses empirical environmental constraints to scale an equilibrium ET to the actual ET, yet it can have bias when there is a saturated evaporating front (i.e., after a heavy rainfall event or irrigation). TSEB attempts to iteratively estimate soil and canopy temperatures. Yet, it tends to overestimate the latent heat flux and underestimate the sensible heat flux in certain cases.


This research aims to assess the ET estimation characteristics of the two models throughout several years of full crop growth periods. It aims to understand the impact of specific parametrization on their output and the added value of utilizing a next generation of high resolution LST data, the constellr LST30 data product. constellr LST30 is used as precursor data of the upcoming constellr HiVE thermal satellite constellation. This LST dataset has a spatial resolution of 30m and is utilized as input data for the ET estimation. The modelled latent heat flux is compared to flux tower measurement for this purpose. Flux tower footprints are calculated using the two-dimensional parameterisation Flux Footprint Prediction approach that is based on a scaling of the crosswind distribution of the flux. The outcomes of the research bring information about the suitability of each model to certain environmental and crop conditions and highlights the importance of high quality LST to ET modelling.

How to cite: Pregel Hoderlein, A., Ibrahim, E., Berhin, J., Spengler, D., and Taymans, M.: Comparative analysis of two evapotranspiration models: Unveiling insights into their dynamics over crop growth cycles and the contribution of land surface temperature to their performance, EGU General Assembly 2024, Vienna, Austria, 14–19 Apr 2024, EGU24-22493, https://doi.org/10.5194/egusphere-egu24-22493, 2024.

EGU24-1603 | PICO | HS6.4

Spatial extent of rain-on-snow (ROS) events in the Arctic (Svalbard) : combining wet snow maps from TerraSAR-X and Radarsat Constellation Mission with ERA5 reanalysis, glaciological measurements, and optical Planet images 

Jean-Pierre Dedieu, Marion Momber, Olivier Champagne, Anna Wendleder, Benoit Montpetit, Eric Bernard, Jean-Michel Friedt, Olga Zolina, and Hans-Werner Jacobi

In the Arctic, extreme weather conditions such as rain-on-snow events (ROS) make the monitoring of the snowpack with remote sensing techniques increasingly relevant and necessary. In recent years, remote sensing methods based on active radar images (SAR) are well described for mapping the spatial extent of ROS events in the terrestrial Arctic (Vickers, 2022; Bartsch, 2023). However, few methods are proposed to validate the relationship between ROS and elevation for such events over glaciers likely due to the lack of in-situ measurement networks in these high latitude areas. Svalbard provides several meteorological and snow monitoring sites, which is a great value for detecting the occurrence of these ROS events and validation of the remote sensing methods.

The purpose of this study is to investigate the spatial and temporal effects of recent ROS events over the Brøgger peninsula (210 km2) in Svalbard (N 78°55’ / E 11° 55’), using remote sensing methods, local meteorological measurements and reanalyses. For each ROS event of the 2017-2023 time period, remote sensing SAR maps of wet snow (Nagler and Rott, 2000) are produced from images obtained with the TerraSAR-X (DLR) and RCM (CSA) high resolution sensors (5-m), respectively at X- and C-band frequency.

The validation of the affected areas is based (i) on ERA5 reanalysis data used to estimate the altitude of the 0°C isoline and (ii) on a network of temperature sensors installed on the Austre Lovén glacier. SAR maps, ERA5 isoline, and in-situ data are in good agreement, resulting in altitude differences between 10 and 25 m for the transition of wet and dry snow, depending on the event.

Although optical images availability is limited due to polar night and cloud cover during precipitation, it was further possible to use optical Planet images at high temporal and spatial resolution (3-m) to determine the ROS impact after the events on the properties of the snow cover. The decreasing signal of the red-edge and near-infrared bands indicate higher snow densities and a stronger wetness of the snowpack, which closely aligns with in-situ observations through snow stratigraphy.

How to cite: Dedieu, J.-P., Momber, M., Champagne, O., Wendleder, A., Montpetit, B., Bernard, E., Friedt, J.-M., Zolina, O., and Jacobi, H.-W.: Spatial extent of rain-on-snow (ROS) events in the Arctic (Svalbard) : combining wet snow maps from TerraSAR-X and Radarsat Constellation Mission with ERA5 reanalysis, glaciological measurements, and optical Planet images, EGU General Assembly 2024, Vienna, Austria, 14–19 Apr 2024, EGU24-1603, https://doi.org/10.5194/egusphere-egu24-1603, 2024.

EGU24-1915 | ECS | PICO | HS6.4

Evaluating MODIS snow products using an extensive wildlife camera network 

Catherine Breen, Carrie Vuyovich, John Odden, Dorothy Hall, and Laura Prugh

Snow covers a maximum of 47 million km2 of Earth ’s northern hemisphere each winter and is an important component of the planet ’s energy balance, hydrology cycles, and ecosystems. Monitoring regional and global snow cover has increased in urgency in recent years due to warming temperatures and declines in snow cover extent. Optical satellite instruments provide large-scale observations of snow cover, but cloud cover and dense forest canopy can reduce accuracy in mapping snow cover. Remote camera networks deployed for wildlife monitoring operate below cloud cover and in forests, representing a virtually untapped source of snow cover observations to supplement satellite observations. Using images from 1181 wildlife cameras deployed by the Norwegian Institute for Nature Research (NINA), we compared snow cover extracted from camera images to Moderate Resolution Imaging Spectroradiometer (MODIS) snow cover products during winter months of 2018–2020. Ordinal snow classifications (scale = 0–4) from cameras were closely related to normalized difference snow index (NDSI) values from the MODIS Terra Snow Cover Daily L3 Global 500 m (MOD10A1) Collection 6 product (R2 = 0.70). Tree canopy cover, the normalized difference vegetation index (NDVI), and image color mode influenced agreement between camera images and MOD10A1 NDSI values. For MOD10A1F, MOD10A1’s corresponding cloud-gap filled product, agreement with cloud-gap filled values decreased from 78.5% to 56.4% in the first three days of cloudy periods and stabilized thereafter. Using our camera data as validation, we derived a threshold to create daily binary maps of snow cover from the MOD10A1 product. The threshold corresponding to snow presence was an NDSI value of 40.50, which closely matched a previously defined global binary threshold of 40 using the MOD10A2 8-day product. These analyses demonstrate the utility of camera trap networks for validation of snow cover products from satellite remote sensing, as well as their potential to identify sources of inaccuracy.

How to cite: Breen, C., Vuyovich, C., Odden, J., Hall, D., and Prugh, L.: Evaluating MODIS snow products using an extensive wildlife camera network, EGU General Assembly 2024, Vienna, Austria, 14–19 Apr 2024, EGU24-1915, https://doi.org/10.5194/egusphere-egu24-1915, 2024.

EGU24-10881 | PICO | HS6.4

SNOWTRAN: a software package for the solution of direct and inverse problems of snow optics 

Alexander Kokhanovsky, Maximillian Brell, Karl Segl, and Sabine Chabrillat

We present a software suite SNOWTRAN aimed at the solution of forward and inverse problems of snow optics. The numerical procedure is based on the approximate solutions of the radiative transfer equation and the geometrical optics approximation for local optical parameters of snow such as the probability of photon absorption and the average cosine of the single light scattering angle. The model is validated using EnMAP and PRISMA spaceborne imaging spectroscopy data close to the Concordia research station in Antarctica. The SNOWTRAN is applied for the determination of the total ozone, the precipitable water vapor, the snow grain size and the assessment of the snowpack vertical inhomogeneity using EnMAP imagery over the Aviator Glacier and in the vicinity of the Concordia research station in Antarctica. The remote sensing results based on EnMAP measurements revealed a large increase in precipitable water vapor at the Concordia research station in February 2023 linked to warming event, and a 4 times larger grain size at Aviator Glacier compared to the Concordia station.

How to cite: Kokhanovsky, A., Brell, M., Segl, K., and Chabrillat, S.: SNOWTRAN: a software package for the solution of direct and inverse problems of snow optics, EGU General Assembly 2024, Vienna, Austria, 14–19 Apr 2024, EGU24-10881, https://doi.org/10.5194/egusphere-egu24-10881, 2024.

EGU24-11034 | ECS | PICO | HS6.4

Using Multitemporal Sentinel-1 imagery for wet snow dynamics characterization in Mediterranean mountain catchments: a case study in Sierra Nevada, Spain 

Pedro Torralbo Muñoz, Rafael Pimentel Leiva, María José Polo Gómez, and Claudia Notarnicola

Monitoring snowmelt dynamics in mountainous catchments  is essential for comprehending downstream water release, streamflow response and consequently, for a better management of water resources at the catchment scale.  In a consolidated snowpack when external inputs become positive, the snow turns into wet snow and the melting phase begins. This change modifies the dielectric constant of the snowpack which can be detected remotely using information in the microwave region of the electromagnetic spectrum. Sentinel-1 (S-1) synthetic-aperture radar (SAR) has emerged as a widely utilized technique for this purpose due to its frequent acquisitions and all-weather capability. 

This study seeks to, first, explore the capabilities of C-band S-1 SAR imagery, which has been demonstrated in previous studies in other regions such as the Alps, in capturing multi-seasonal snowmelt dynamics and, second to linked these wet-dynamics to changes in streamflow response over Mediterranean mountain areas . The study was carried out at two scales: plot and catchment: At the plot scale, the Refugio Poqueira experimental site, which is located at 2500 m a.s.l. was chosen. At the catchment scale, the headwaters of the Poqueria River, which is a  snow-driven catchment  located in the southern face of Sierra Nevada, was selected. Four hydrological years with high hydroclimatic variability, from 2016-2017 to 2019-2020, were used in the study to capture the heterogeneity of the area. 

The general change detection approach for identifying wet snow was adapted for these regions, utilizing the average S-1 SAR image from the preceding summer as  reference imagery and employing a threshold of −3.00 dB for discriminating wet snow. This adaptation was validated using Landsat images as a reference dataset, yielding a general accuracy of 0.79. The local scale analysis demonstrates that S-1 SAR imagery was  able to capture four types of melting cycles including the well-known main melting event during the spring season. The other three melting cycles are linked to the Mediterranean mountains climate and can occur throughout the hydrological year. When applied at the catchment scale, distributed melting-runoff onset maps were developed to enhance understanding of the spatiotemporal evolution of melting dynamics. Finally, a linear correlation between melting dynamics and streamflow was established for prolonged melting cycles, with a determination coefficient (R2) ranging from 0.62 to 0.83 and an average delay of approximately 21 days between melting onset and streamflow peak.

Acknowledgments: This work has been funded by the project PID2021-12323SNB-I00, HYPOMED—“Incorporating hydrological uncertainty and risk analysis to the operation of hydropower facilities in Mediterranean mountain watersheds”.

How to cite: Torralbo Muñoz, P., Pimentel Leiva, R., Polo Gómez, M. J., and Notarnicola, C.: Using Multitemporal Sentinel-1 imagery for wet snow dynamics characterization in Mediterranean mountain catchments: a case study in Sierra Nevada, Spain, EGU General Assembly 2024, Vienna, Austria, 14–19 Apr 2024, EGU24-11034, https://doi.org/10.5194/egusphere-egu24-11034, 2024.

EGU24-11542 | ECS | PICO | HS6.4

Trends in snow persistence at the Central Pyrenees derived from 40 years of Landsat satellite images 

Martí Navarro Planes, Cristina Cea López, Xavier Pons, Lluís Pesquer Mayos, and Lluís Gómez Gener

An accurate quantification of the spatiotemporal dynamics of seasonal snow is essential for understanding and predicting the impacts of climate change on mountain regions and their feedback on global climate. This is especially critical in southernmost Mediterranean mountains such as the Pyrenees, where the extent of seasonally snow-covered zones (or persistent snow areas) are expected to decrease more abruptly than other mountain regions of the world. Here we use 40 years of Landsat satellite images (from 1984 to 2023) to study the trend in snow surface area and snow persistence (the fraction of time that the snow remains on the ground) across different spatial scales (from catchment to region) within the Central Pyrenees, Spain. In addition, snow surface data has been correlated with altitude and incident solar radiation to understand the role of topography on driving snow persistence distribution patterns.

How to cite: Navarro Planes, M., Cea López, C., Pons, X., Pesquer Mayos, L., and Gómez Gener, L.: Trends in snow persistence at the Central Pyrenees derived from 40 years of Landsat satellite images, EGU General Assembly 2024, Vienna, Austria, 14–19 Apr 2024, EGU24-11542, https://doi.org/10.5194/egusphere-egu24-11542, 2024.

EGU24-11557 | ECS | PICO | HS6.4 | Highlight

Correlation of Land Surface Temperature and air temperature with albedo in Maritime Antarctica using MODIS and in situ data. 

Alejandro Corbea-Pérez, Carmen Recondo, and Javier F. Calleja

In this work, we analyze the relationship between albedo and temperature using albedo and Land Surface Temperature (LST) MODIS collection 6 (C6) and in situ data at Livingston Island, Maritime Antarctica. It is known that the relationship between temperature and albedo could have an important impact on global climate models, especially in places where permafrost distribution is complex, as in the South Shetland Islands (SSI) archipelago. Our results show that LST is not well correlated with albedo, which is consistent with the fact that air temperature (Ta) and surface temperature (Ts) do not separately explain the albedo drop, as previous work in the study area has shown. The best agreement was obtained between Aqua and Terra LST and in situ albedo, while the comparison between albedo MODIS and LST yields the worst results, which could be due to the difference in pixel size of MODIS albedo and LST products (500 m and 1000 m, respectively). However, for Ta versus albedo for all data, the decreasing slope of the fit suggests that higher temperatures are associated with lower snow albedo values. This reaffirms the idea that in polar areas, due to their characteristics, the decrease in snow albedo depends not only or mainly on temperature, but also on multiple factors such as the evolution of snow grain size and precipitation rates, among others. 

How to cite: Corbea-Pérez, A., Recondo, C., and Calleja, J. F.: Correlation of Land Surface Temperature and air temperature with albedo in Maritime Antarctica using MODIS and in situ data., EGU General Assembly 2024, Vienna, Austria, 14–19 Apr 2024, EGU24-11557, https://doi.org/10.5194/egusphere-egu24-11557, 2024.

EGU24-11620 | ECS | PICO | HS6.4

Towards operational mapping and estimation of snow cover phenology parameters in the Atlas Mountains, Morocco, using multi-sensor satellite data and Google Earth Engine.  

youssra El jabiri, Abdelghani Boudhar, Abdelaziz Htitiou, Eric Sproles, Mostafa Bousbaa, Hafsa Bouamri, and Abdelghani Chehbouni

The lack of knowledge about the temporal variability, or snow cover phenology and its spatial variation poses enormous challenges to water resource managers who mostly rely on a few weather stations with limited spatial coverage which prevents them from having a complete understanding of snow changes as a whole. Meanwhile, the free availability, wide-coverage, frequent updating, and long-term time horizon make data from programs such as Landsat and Sentinel-2 a valuable data source for reliable snow data information at an unprecedented spatial scale.

In this context, this research aims to derive the snow phenology parameters (first day of snowfall, last day of snow melt; and snow duration) over Morocco’s Atlas Mountains by combining over 10,000 images from Landsat-8 and Sentinel-2 satellites for four hydrological years (2016-2021) to create a harmonized product with a time interval of about 3 days using Google Earth Engine platform. The time series produced allowed us to create detailed maps of snow cover and extract a homogeneous normalized difference snow index (NDSI) profile over the four years whereby we were able to determine the optimal threshold to separate the presence of snow from its absence.

  The results showed that derived seasonality snow metrics provide considerable variation in both time and space, where an increase in snowpack measurement values at higher elevations can be observed. The experimental results demonstrate that the proposed workflow can accurately derive snow seasonality timing with almost a day and a half delay than the in-situ observed dates and with an overall accuracy equal to 0.96.

  We expect these results to benefit various applications such as hydrological modeling, natural hazards, and regional climate change studies.

How to cite: El jabiri, Y., Boudhar, A., Htitiou, A., Sproles, E., Bousbaa, M., Bouamri, H., and Chehbouni, A.: Towards operational mapping and estimation of snow cover phenology parameters in the Atlas Mountains, Morocco, using multi-sensor satellite data and Google Earth Engine. , EGU General Assembly 2024, Vienna, Austria, 14–19 Apr 2024, EGU24-11620, https://doi.org/10.5194/egusphere-egu24-11620, 2024.

EGU24-11677 | ECS | PICO | HS6.4

A novel machine learning approach for estimating snow depth in the European Alps from Sentinel-1 imagery 

Devon Dunmire, Hans Lievens, Isis Brangers, Lucas Boeykens, and Gabriëlle De Lannoy

Despite the critical importance of understanding trends in snow depth and mass for making informed decisions about water resources and adaptation to climate change, these properties are challenging to quantify, especially in remote, mountainous areas with complex topography.  The increasing availability of frequent, high resolution synthetic aperture radar (SAR) observations from active microwave satellites has provided the opportunity to provide high-resolution estimates of mountain snow depth at large spatial and frequent temporal scales. As a result, novel approaches have been developed for SAR-based snow depth retrievals utilizing C-band microwave imagery. These SAR-based methods are not without their own set of limitations and are challenged by shallow snowpacks, high vegetation cover, and wet snow conditions. Here, we seek to overcome these existing challenges by developing a machine learning approach to estimate snow depth over the European Alps using Sentinel-1 imagery, an optical satellite-based snow cover product, and static information such as elevation, slope, aspect, topographical position index and forest cover fraction. We demonstrate that our machine learning approach can more accurately estimate snow depth than existing methods at independent in-situ test sites throughout the Alps and has especially improved performance in deep snow and wet snow conditions. Using feature importance scores, we also investigate when and where the Sentinel-1 data provides the most benefit for snow depth estimation. Our approach optimizes the use of Sentinel-1 imagery by learning when these observations are effective for retrieving snow depth, while relying on other topographical information when Sentinel-1 observations are not suitable.

How to cite: Dunmire, D., Lievens, H., Brangers, I., Boeykens, L., and De Lannoy, G.: A novel machine learning approach for estimating snow depth in the European Alps from Sentinel-1 imagery, EGU General Assembly 2024, Vienna, Austria, 14–19 Apr 2024, EGU24-11677, https://doi.org/10.5194/egusphere-egu24-11677, 2024.

EGU24-13030 | ECS | PICO | HS6.4

Towards a Deep Learning-based Spatio-temporal Fusion Approach for Accurately Improving Snow Cover Mapping: A Case Study in the Moroccan Atlas Mountains with Performance Evaluation 

Mostafa Bousbaa, Abdelghani Boudhar, Christoph Kinnard, Haytam Elyoussfi, Nadir Elbouanani, Abdelaziz Htitiou, Bouchra Bargam, Karima Nifa, and Abdelghani Chehbouni

Remote sensing technologies provide continuous and detailed observations of various land surface parameters, including snow cover, vegetation, land surface temperature, soil moisture, and evapotranspiration, offering invaluable information at various scales and contexts. One of the major uses is the precise mapping and monitoring of seasonal snow cover dynamics, which are essential for water management and global water balance modeling. Since an intelligent ecosystem based on accurate snow cover estimation requires a collection of high-resolution satellite images, both temporally and spatially, to capture snow dynamics, particularly in semi-arid areas where snowfall is extremely variable. These requirements can be difficult to achieve based on a single sensor, mainly due to the trade-offs between the temporal, spectral, and spatial resolutions of the available satellites. In addition, atmospheric conditions and cloud contamination can increase the number of missing satellite observations. However, there is a promising solution to these limitations. Exploiting the complementary capabilities of the new-generation multispectral sensors aboard Landsat-8 (L8) and Sentinel-2 (S2), with spatial resolutions ranging from 10 to 30 meters, offers an unprecedented opportunity to significantly advance the accuracy of snow cover mapping. Hence, this study aims to investigate the effectiveness of the combined use of optical sensors through deep learning-based spatiotemporal image fusion to capture snow dynamics and produce detailed and dense Normalized Snow Difference Index (NDSI) time series in a semi-arid context. Three distinct deep learning models, namely Very Deep Super Resolution (VDSR), Super Resolution Unet (SR-Unet), and Residual Convolutional Neural Network (RCNN), were evaluated and compared to fuse L8 and S2 data. The findings indicate that all three approaches can provide accurate estimates for a coarse-resolution image at a given fusion date, although there are notable disparities in prediction quality between the different approaches. Specifically, R-squared values were measured at 0.94, 0.92, and 0.96 for RCNN, SR-Unet, and VDSR, respectively, with corresponding root mean square error (RMSE) values of 0.09, 0.11, and 0.08. Our results suggest that the VDSR model is particularly effective in producing high-resolution merged snow time series and can compensate for the absence of ground snow cover data.

How to cite: Bousbaa, M., Boudhar, A., Kinnard, C., Elyoussfi, H., Elbouanani, N., Htitiou, A., Bargam, B., Nifa, K., and Chehbouni, A.: Towards a Deep Learning-based Spatio-temporal Fusion Approach for Accurately Improving Snow Cover Mapping: A Case Study in the Moroccan Atlas Mountains with Performance Evaluation, EGU General Assembly 2024, Vienna, Austria, 14–19 Apr 2024, EGU24-13030, https://doi.org/10.5194/egusphere-egu24-13030, 2024.

EGU24-14040 | PICO | HS6.4

Snow-depth Spatial Distribution Analysis Technology linked to Ground Observation Network 

Narae Kang, Jungsoo Yoon, and Seokhwan Hwang

In this study, we attempted to classify snowfall patterns using multiple dual-polarization radars and quantitatively review the amount of snowfall observed from radar using a ground observation network (snow depth). In order to more quantitatively compare the difference between radar reflectivity and precipitation (snow) intensity compared to ground observed snow depth, comparison was made on an hourly basis, taking into account the Korea Meteorological Administration's snow observation data provision period (1 hour). Radar observation data were compared with precipitation intensity based on cumulative reflectivity, differential reflectivity, and specific differential phase difference. Compared to radar reflectivity, there were various delays ranging from 2 to 7 hours from the time the precipitation intensity accumulated with the snow depth. In addition, the difference between the time of increase in snow cover is judged to be an error generated by the wind, and it is necessary to expand the range of radar pixels as well as the blinding factor to take into account the influence of wind.


Acknowledgments

This research was supported by a grant(2022-MOIS61-003(RS-2022-ND634022)) of Development Risk Prediction Technology of Storm and Flood for Climate Change based on Artificial Intelligence funded by Ministry of Interior and Safety(MOIS, Korea).

How to cite: Kang, N., Yoon, J., and Hwang, S.: Snow-depth Spatial Distribution Analysis Technology linked to Ground Observation Network, EGU General Assembly 2024, Vienna, Austria, 14–19 Apr 2024, EGU24-14040, https://doi.org/10.5194/egusphere-egu24-14040, 2024.

EGU24-15736 | PICO | HS6.4

A new snow depth forecast data using cumulative distribution function matching in South Korea 

Hyunho Jeon, Seulchan Lee, and Minha Choi

Over the past decade, heavy snow has caused the third-largest amount of disaster damage in South Korea, following typhoons and heavy rain. To prevent damage from heavy snow effectively, it is necessary to forecast weather conditions. The Korea Meteorological Administration uses the Local Data Assimilation and Prediction System (LDAPS) to forecast hydrometeorological factors. However, the performance of LDAPS snow depth data is inferior to that of other models and requires correction. In this study, a cumulative distribution function (CDF) matching was used to correct LDAPS snow depth data. The CDF matching was carried out by utilizing ERA5-Land snow depth data to generate snow depth forecasting data for 12, 24, and 36-hour intervals. The forecasting data for snow depth is expected to generate snow disaster risk prediction data that can help reduce disaster losses on the Korean Peninsula.

How to cite: Jeon, H., Lee, S., and Choi, M.: A new snow depth forecast data using cumulative distribution function matching in South Korea, EGU General Assembly 2024, Vienna, Austria, 14–19 Apr 2024, EGU24-15736, https://doi.org/10.5194/egusphere-egu24-15736, 2024.

EGU24-16806 | ECS | PICO | HS6.4

Snow accumulation patterns from 2023 Airborne Laser Scanning data in Trail Valley Creek, Western Canadian Arctic 

Daniela Hollenbach Borges, Inge Grünberg, Jennika Hammar, Nick Rutter, Thomas Krumpen, and Julia Boike

Snow cover plays a pivotal role in the Arctic's climate, hydrology, and ecology, making the understanding of its deposition and accumulation dynamics crucial. Snow depth and its duration can directly influence soil temperature: the insulating properties of snow increase with greater snow depth, which prevents soil temperatures from declining in winter.  Trail Valley Creek, NWT, Canada, is located at the northern boundary of the tundra-taiga transition zone, approximately 45 km north of Inuvik, and is underlain by continuous permafrost. The region’s rapid warming points to a trend of vegetation changes such as shrub expansion northwards into the tundra.

Topography and vegetation cover are the main drivers of spatial variation of snow depth across different landscapes, while wind significantly influences snow redistribution. This reallocation causes snow to accumulate preferably in terrain features such as valleys and leeward sides of ridges, and taller vegetation, as their height and intricate structure can favour snow trapping. Understanding the relationships among snow distribution, topography features, and vegetation types is vital, though it is often limited by the scarcity of high-resolution data with broad spatial cover.

To investigate the spatial snow distribution in Trail Valley Creek, we analyzed how snow depth varies according to different topography classes and slope aspects, as well as the region’s different vegetation classes and heights. 

For this purpose, we explored records from Aerial Laser Scanning (ALS) collected during both winter and summer of 2023, covering an area of over 170 km2. We generated a high-resolution Digital Elevation Model (DEM) from the winter snow-covered surface (2023-04-02), a Digital Terrain Model (DTM) from the summer snow-free terrain (2023-07-10), and by combining both, created a 1-m resolution snow depth map of the area. Additionally, we used 3129 Magnaprobe ground-based snow depth measurements for validation (2023-03-26 to 2023-03-29). 

For the topography analysis, we classified the slope aspects, and subdivided the terrain into 10 geomorphological classes using the geomorphons approach. This method calculates terrain forms, such as plateaus, slopes, ridges and valleys, and their associated geometry using a machine vision approach. To analyze the role of vegetation cover, we used a 13-class map that categorizes land-cover features and vegetation types, such as graminoids, shrubs and trees, and vegetation height rasters, derived from the ALS summer data.

Snow is the main driver of the hydrological system in Trail Valley Creek, and the outcomes of this study will provide insights in the important interplay between vegetation, snow depth and terrain characteristics in a permafrost landscape.

How to cite: Hollenbach Borges, D., Grünberg, I., Hammar, J., Rutter, N., Krumpen, T., and Boike, J.: Snow accumulation patterns from 2023 Airborne Laser Scanning data in Trail Valley Creek, Western Canadian Arctic, EGU General Assembly 2024, Vienna, Austria, 14–19 Apr 2024, EGU24-16806, https://doi.org/10.5194/egusphere-egu24-16806, 2024.

EGU24-146 | ECS | Posters on site | HS6.5 | Highlight

Improving Flood Mapping Capabilities and Hydrological Model Calibration in India through the Surface Water and Ocean Topography (SWOT) Mission 

Girish Patidar, Jayaluxmi Indu, and Subhankar Karmakar

Even though altimetry has redefined our understanding of global rivers and lakes, the sparse temporal sampling of altimeters is often a cause of concern for many applications. This study explores the efficiency of temporal sampling offered by the recently launched Surface Water and Ocean Topography (SWOT) mission for hydrological applications over India. In particular, two research hypotheses are being investigated, namely a). Potential of SWOT data for enhancing flood mapping capabilities across India and b) Impact of SWOT-based discharges for calibrating a hydrological model calibration. Toward answering the first hypothesis, we considered a hypothetical launch date for SWOT, generating overpass data based on the mission's spatiotemporal orbital configuration. These overpass data were then compared with flood-affected areas identified in the Indian Flood Inventory (IFI) data to assess SWOT's potential for flood mapping. Results show that the spatio-temporal resolution of SWOT facilitates the monitoring of diverse proportions of Indian districts based on the cycle. More specifically, 0.67%, 15.79%, 29.24%, 45.54%, and 8.06% of Indian districts have one, two, three, four, and more than four observations per SWOT cycle (~21 days), respectively. To evaluate the second hypothesis, namely, the feasibility of SWOT discharge in hydrological model calibration, we created proxy-SWOT data by sampling in-situ data in accordance with the SWOT orbit configuration. Subsequently, errors were introduced into the in-situ gauge data based on recommendations from the SWOT science team. Results are presented over selected case study region of the Mahanadi river basin in India.

How to cite: Patidar, G., Indu, J., and Karmakar, S.: Improving Flood Mapping Capabilities and Hydrological Model Calibration in India through the Surface Water and Ocean Topography (SWOT) Mission, EGU General Assembly 2024, Vienna, Austria, 14–19 Apr 2024, EGU24-146, https://doi.org/10.5194/egusphere-egu24-146, 2024.

EGU24-242 | ECS | Orals | HS6.5

Assessment of Surface Water Dynamics between 1984-2021 in Madhya Pradesh, Central India, using Remotely Sensed Dataset 

Somil Swarnkar, Asari Sushma Surjibhai, Roshan Nath, Shobhit Singh, and Biswajit Patra

The measurement of surface water bodies plays a vital role in assessing the magnitude of floods and droughts despite their relatively little contribution to the overall hydrosphere on Earth's surface. The distribution and accessibility of water resources have been greatly impacted by global climate change and unsustainable human activities. These factors have resulted in heightened strain on surface water supplies, causing shortages that hinder both human consumption and socioeconomic progress. Therefore, the mapping and identification of surface water reserves are essential for achieving optimal utilization and sustainable management. Madhya Pradesh, henceforth referred to as MP, possesses a highly diverse range of geographical features within the Central Indian area. According to prior research, a total of thirty-six out of fifty-one districts within the state of Madhya Pradesh have seen significant hydrological drought conditions in recent years, mostly attributed to the scarcity of surface water resources. Despite the challenges faced in the MP area, there remains a lack of sufficient understanding of the long-term and seasonal variations in surface water dynamics within districts, as well as the overall availability and accessibility of surface water resources. Field-based observations of surface water bodies in regions with vast expanses, such as Madhya Pradesh (MP), pose considerable obstacles. However, the comprehension of spatiotemporal fluctuations in surface water can be enhanced with the utilization of remote sensing datasets for observations. Hence, to gain an understanding of the long-term fluctuations in surface water patterns in different regions of Madhya Pradesh, India, over a span of 38 years, we employed a publicly accessible global surface water dataset provided by the Joint Research Centre (JRC) of the European Commission. This dataset covers the time period from 1984 to 2021. Based on the results of our investigation, it is apparent that a disparity exists in the per capita accessibility of permanent water resources in the majority of MP districts, notably during periods of low precipitation, as well as in the per capita availability of seasonal water resources, particularly during months characterized by high levels of rainfall. While the monsoon period generally results in increased surface water availability, the Bundelkhand and Malwa Plateau regions experience severe shortages of surface water during dry periods, which, therefore, leads to the over-exploitation of groundwater resources. The implications of these findings are significant for the management of freshwater bodies in the Madhya Pradesh area, particularly in light of their depletion caused by climate change and human activities. Furthermore, these findings have broader implications for promoting sustainable development in the region.

How to cite: Swarnkar, S., Surjibhai, A. S., Nath, R., Singh, S., and Patra, B.: Assessment of Surface Water Dynamics between 1984-2021 in Madhya Pradesh, Central India, using Remotely Sensed Dataset, EGU General Assembly 2024, Vienna, Austria, 14–19 Apr 2024, EGU24-242, https://doi.org/10.5194/egusphere-egu24-242, 2024.

EGU24-1621 | ECS | Posters on site | HS6.5

Groundwater storage change in Victoria, Australia observed by GRACE and ESA CCI soil moisture products 

Taejun Park, Ki-Weon Seo, and Dongryeol Ryu

Accelerating groundwater depletion, driven by climate change and growing groundwater extraction for irrigation, has increased the need for accurate monitoring of this indispensable resource. Traditional methods, such as in-situ water table observations and pumping tests, have proven valuable for continued monitoring of groundwater availability and aquifer characteristics but are limited in assessing groundwater variations at a larger basin scale. In contrast, the Gravity Recovery and Climate Experiment (GRACE) offers a method to estimate basin-scale groundwater changes, although its estimates encompass not only groundwater in the aquifer but also surface water (e.g., lakes, rivers) and soil moisture in the vadose zone. To delineate groundwater variations accurately from GRACE observations, additional data sources are necessary.

In this study, we use the European Space Agency’s Climate Change Initiative for Soil Moisture (ESA CCI SM) in the surface layer (top 0-2cm), which is extrapolated to the profile moisture content for the entire root zone (0-120cm). Utilizing the estimated profile soil moisture, we derive groundwater variations in the southern Victoria region of Australia by subtracting the ESA CCI SM derived soil moisture component from GRACE observations. The estimated groundwater variations agree well with the groundwater mass changes estimated from in-situ observations. This study presents an approach that integrates GRACE observations with profile soil moisture estimates derived from the ESA CCI SM product to assess groundwater variations. The validation against in-situ data indicates that satellite observations of soil moisture and gravity changes can provide robust estimation of basin-scale variations in both profile soil moisture and groundwater.

How to cite: Park, T., Seo, K.-W., and Ryu, D.: Groundwater storage change in Victoria, Australia observed by GRACE and ESA CCI soil moisture products, EGU General Assembly 2024, Vienna, Austria, 14–19 Apr 2024, EGU24-1621, https://doi.org/10.5194/egusphere-egu24-1621, 2024.

EGU24-2399 | ECS | Orals | HS6.5

Satellite-based water surface slope in small mountain river 

Haoyang Lyu and Fuqiang Tian

Satellite altimetry has emerged as a key alternative for inland water level measurement in addition to ground observations. Water surface slope (WSS) is one of the basic parameters of river morphology for discharge calculation. Estimation of WSS can also avoid systematic bias in satellite water levels relative to gauged data. A range of satellite data products are available to provide accurate river water level measurements and estimates of river WSS on a worldwide scale. Nonetheless, satellite-based observation of river water surface remains challenging in small rivers, such as the mountainous river reaches with narrow water surfaces. In this study, we examined the accuracy of the ICESat-2 ATL03 photon height data in estimating WSS over the mountainous river reach of Yongding River flowing across Hebei Province and Beijing City in northern China. With minimum along-track sampling interval of 0.7m, the ICESat-2 ATL03 data provided reliable estimation of WSS over narrow river reaches which are 50 to 100m wide. Satellite virtual stations were located mainly with a histogram-based statistical method, seeking for photon height that corresponds to the peak frequency. The twelve groups of satellite virtual stations chosen for river WSS estimation finally show an overall correlation coefficient of 0.96 in validation. Relative error of WSS estimation ranges from 0.13% to 14.51%. Findings of this study provide further implications for satellite-based river water surface measurement in small mountain river basins that lack of ground observation conditions, bringing in reliable estimation of key hydrological parameters based on satellite observation.

How to cite: Lyu, H. and Tian, F.: Satellite-based water surface slope in small mountain river, EGU General Assembly 2024, Vienna, Austria, 14–19 Apr 2024, EGU24-2399, https://doi.org/10.5194/egusphere-egu24-2399, 2024.

EGU24-2603 | ECS | Posters on site | HS6.5

Estimating lake water storage and water level using Sentinel-1 C-band SAR 

Jongmin Park, Yangwan Kim, and Kijin Park

Intensification of climate change and extreme climate conditions around the world caused an increase in the frequency and intensity of water disasters (e.g., drought and flood). Particularly, the Korean Peninsula underwent a significant amount of rainfall during the summer monsoon, along with the increased number of typhoons passing through. In early August 2020, heavy rainfall occurred across the southern part of the Korean Peninsula (e.g., Jeolla and Chungcheong provinces), which resulted in the loss of life and properties. Accordingly, there is a continuous need to establish flood system monitoring over a wide region.

Accordingly, various studies have utilized different types of satellite imagery (e.g., optical, synthetic aperture radar [SAR], LiDAR) for flood inundation mapping. For example, optical satellite imagery (e.g., MODIS, Landsat, Sentinel-2/3) has been widely utilized for flood mapping, while it has limitations with regard to weather conditions. Synthetic Aperture Radar (SAR) imagery has been brought as an alternative as it is not hindered by weather conditions and has relatively high spatial resolution. Therefore, this study utilizes Sentinel-1 C-band backscatter (from 01/2016 to 12/2022) provided by the European Space Agency (ESA) to estimate the inland water body storage as well as water level at Naju Lake located in the Yeongsan River basin, South Korea.

 Prior to estimating the water body storage and water level, two threshold-based methods (i.e., Otsu threshold method, k-mean clustering) were used to distinguish water and no-water pixels based on the bimodal histogram of Sentinel-1 C-band backscatter. The validation of the water body area is conducted by comparing against optical image-based modified normalized difference water index calculated from the harmonized Landsat sentinel-2 (HLS) imagery. The overall evaluation confirmed that the accuracy of the water body area with k-mean clustering (0.8) showed better performance than that from the Otsu threshold method. Especially, the water body area from the Otsu threshold method showed a clear overestimation during the monsoon period. Afterwards, we established support vector regression (SVR) with the number of water pixels and ground-based water storage datasets. Estimation of water storage with SVR showed similar trend with observed water storage with the coefficient of determination (R2) of 0.92, while estimated water storage showed slight underestimation (bias = -899 m3).

Overall, Sentinel-1 C-band backscatter showed the capability to capture the inland water body as well as the volume of the inland lake. Even though there are several limitations (e.g., sensitivity toward vegetation, coarse revisit frequency) in the context of near real-time flood monitoring, it still has value in monitoring the spatio-temporal behavior of inland water body.

Acknowledgement: This work was supported by Korea Environment Industry & Technology Institute(KEITI) through R&D Program for Innovative Flood Protection Technologies against Climate Crisis Program(or Project), funded by Korea Ministry of Environment(MOE)(RS-2023-00218873)

How to cite: Park, J., Kim, Y., and Park, K.: Estimating lake water storage and water level using Sentinel-1 C-band SAR, EGU General Assembly 2024, Vienna, Austria, 14–19 Apr 2024, EGU24-2603, https://doi.org/10.5194/egusphere-egu24-2603, 2024.

EGU24-2637 | Posters on site | HS6.5

A framework for surface water and groundwater modeling by multiple satellites. 

Liwei Chang, Lei Cheng, Lu Zhang, and Pan Liu

A comprehensive understanding of renewable water resources, including surface water and groundwater, is crucial for human sustenance, societal advancement, and ecosystem well-being at both local and global levels. Remote sensing technology offers an opportunity to rapidly and conveniently monitor inland water resources on a large scale. This study presents a framework for modeling water storage changes by integrating data from multiple satellites. Specifically, the GRACE and GRACE-FO gravity satellites are utilized to observe changes in terrestrial water storage (TWS), while the Landsat multispectral and ICESat / ICESat-2 altimetry satellites are employed to simulate changes in surface water storage (SWS). Groundwater changes are calculated by subtracting SWS and soil moisture storage (SM) from TWS, with SM data obtained from GLDAS 2.1. The innovation of this framework lies in the improved simulation of surface water, facilitated by the fine resolution of ICESat-2, enabling the establishment of an area-elevation relationship for very small water bodies (< 1 km2). This framework does not account for variations in river channel storage, making it suitable for regions where river discharge can be disregarded. The framework is applied to four provinces or cities in the North China Plain, where water scarcity constrains the demand of drinking water, irrigation, and environment. The study reveals a decrease in TWS from 2002 to 2020 in the study area. Although surface water increased following the operation of the Middle Route of the South-to-North Water Diversion Project in December 2014, groundwater continued to decline until 2020 and remained stable from 2020 to 2022. This study represents the first use of 4-year ICESat-2 data to monitor water bodies of all sizes (from <1 km2 to >100 km2). Leveraging the exceptional capability of ICESat-2 data in modeling small water bodies, this study advances the prospect of achieving a comprehensive simulation of inland water resources.

How to cite: Chang, L., Cheng, L., Zhang, L., and Liu, P.: A framework for surface water and groundwater modeling by multiple satellites., EGU General Assembly 2024, Vienna, Austria, 14–19 Apr 2024, EGU24-2637, https://doi.org/10.5194/egusphere-egu24-2637, 2024.

EGU24-3091 | Posters on site | HS6.5

DREAMing in River Basins 

Philippa Berry and Jerome Benveniste

The contribution of  satellite radar altimetry to river monitoring is well-established, with data forming  valuable inputs to river models.
Surface soil moisture can also be determined from altimetry using DRy EArth Models (DREAMs) which model the response of a completely dry surface to Ku band nadir illumination. New DREAMs over Africa now cover more than 70% of the continent, encompassing more than 30 river basins including the Congo, Niger, Okavango, Zambezi and Volta.  

It was decided to fly multi-mission altimetry over these river DREAMs to assess the potential of this technique to contribute to studies in river basins. As a detailed DREAM exists for the Amazon basin, this was also included. Envisat, ERS-1/2, Jason-1/2, CryoSat-2 and Sentinel-3A altimeter data were utilised in this study, together with a database of over 86000 graded altimeter River and Lake height time series. Soil moisture estimates were generated and validated.

Summative conclusions: the highest data retrieval rate over river DREAMs is found over ‘river’ and ‘wetland’ pixels, with lower percentages over ‘soil’ pixels where soil moisture estimates can be generated. This is an expected outcome, as targeting ‘soil’ pixels will select for rougher topography. 
Within the constraints of satellite orbit and repeat period, data can be successfully gathered over the majority of these overflown DREAM surfaces. It is also clear that very detailed DREAM models, at least 10 arc seconds resolution, are required to capture the intricate structure in river basins. It is noted that many tributaries are below the current 10 arc seconds spatial resolution of the DREAMs, and are classified with their surrounding terrain as wetland pixels.
ERS-2 and Envisat performed best; Sentinel-3A OLTC mask is found to preclude monitoring of almost all ‘soil’ pixels, except those adjacent to the largest rivers.
The ability of nadir-pointing altimeters to penetrate vegetation canopy gives a unique perspective in rainforest areas. Amazon soil moisture time series in the lower Amazon are seen to correlate to river height variations: in the upper Amazon basin the annual rainfall signature is dominant.
Over much of the river DREAMs, along-track time series of soil moisture can be generated at the spatial resolution of the underlying DREAM, currently 10 arc seconds.  The major constraint, as with altimeter height measurements, is the spatio-temporal sampling, so use is envisaged in combination with other remote sensed and in-situ data.  However, DREAMing provides a valuable independent dataset which can be used to validate soil moisture estimates from other techniques.

How to cite: Berry, P. and Benveniste, J.: DREAMing in River Basins, EGU General Assembly 2024, Vienna, Austria, 14–19 Apr 2024, EGU24-3091, https://doi.org/10.5194/egusphere-egu24-3091, 2024.

EGU24-3426 | Orals | HS6.5

Swath altimetry simulations with Radarspy, in preparation of Copernicus mission Sentinel-3 Next Generation - Topography 

Louise Yu, François Boy, Damien Desroches, and Alejandro Bohe

We wish to present the CNES contribution to the Sentinel-3 Next Generation - Topography (S3NG-T) project. In the wake of the SWOT mission, which pioneered the use of SAR interferometry for surface water altimetry, ESA is considering using this new approach for the successor to its current operational mission Sentinel-3 (S3), S3NG. Such so-called “swath altimetry” enables the access to two-dimensional features on water surfaces, much more directly than traditional Nadir altimetry (such as that used aboard S3) does, but it must also stand the test of accuracy requirements.

Scheduled to take flight in 2033, the altimetry component of S3NG, called S3NG-T, is wrapping up its development phase B1 wherein two consortia designed their proposal of a swath altimetry mission, and during which SWOT’s very promising first data released. A Mission Gate Review in early 2024 should lead to the definitive decision whether to adopt this new measurement technique for S3NG-T or not. Rich with the heritage of their contribution to SWOT and convinced of the potential of swath altimetry, the CNES teams bring a technical expertise to the S3NG table.

As such, we developed evolutions for Radarspy, our in-house simulator of swath altimeter data, in order to assess S3NG’s performances over oceans and inland waters. The swath altimetry instrument aboard S3NG-T, called SAOOH, differs from SWOT’s instrument mainly in its 3-meter baseline, its multiple receptors (four per swath – left or right – in order to flatten the gain pattern), and its interleaved observation pattern, where bursts of 128 Radar pulses are sent alternatively left and right. We wish to present the results of our simulations, which test SAOOH over scenes of various reflectivity, water content and topography. These simulations yield encouraging first results and let us see how some choices made in its on-board processing algorithm affect the random noise, the water detection performance and the point-target response.

How to cite: Yu, L., Boy, F., Desroches, D., and Bohe, A.: Swath altimetry simulations with Radarspy, in preparation of Copernicus mission Sentinel-3 Next Generation - Topography, EGU General Assembly 2024, Vienna, Austria, 14–19 Apr 2024, EGU24-3426, https://doi.org/10.5194/egusphere-egu24-3426, 2024.

EGU24-4412 | ECS | Orals | HS6.5

Effect of Climate Change on Water Level and Surface Area of Lake Iznik (NW Türkiye)  

Muharrem Hilmi Erkoç, Uğur Doğan, Büşra Keser, and Bülent Bayram

The aim of the study is to investigate the changes in the water level and surface area of Lake Iznik in Northwestern Anatolia, Türkiye, between 2014 and 2024. In this context, High-Resolution Satellite images provided by European Space Agency (ESA)'s Sentinel-2 are used to determine the lake surface area, and satellite altimetry data provided by Copernicus Land Service is utilized to determine the lake water level. Additionally, temperature and precipitation data from a meteorological station near the lake are obtained from the Turkish State Meteorological Service due to their significant impact on the lake's water level and surface area changes.

The estimated trend for the change in the water level from 2014 to 2024 is -23±1.9 cm/yr, and the change in the surface area trend is estimated as -1.2±0.2 km²/yr. The results indicate a decrease in both the lake's water level and surface area. Furthermore, Standardized Precipitation Index (SPI) and Standardized Precipitation-Evapotranspiration Index (SPIE) are calculated from precipitation and temperature data obtained from meteorological stations near the lake. These indices reveal a decrease in precipitation and an increase in temperatures in the Lake Iznik basin over the past 10 years.

Consequently, it is observed that the changes in the water level and surface of Lake Iznik are influenced by climate change, and hence,necessary measures need to be taken for the conservation and sustainable use of the lake.

How to cite: Erkoç, M. H., Doğan, U., Keser, B., and Bayram, B.: Effect of Climate Change on Water Level and Surface Area of Lake Iznik (NW Türkiye) , EGU General Assembly 2024, Vienna, Austria, 14–19 Apr 2024, EGU24-4412, https://doi.org/10.5194/egusphere-egu24-4412, 2024.

EGU24-4660 | Posters virtual | HS6.5

Water Balance Analysis for Reservoirs through Remote Sensing: A Case Study of the Karun (IV) Reservoir in Iran. 

Mohammad Hosein Kachoue, Mahdieh Goli, Ali Bakhtiari, Mohsen Sedghi, Mahdi Hosseinipoor, and Farkhondeh Khorashadi Zadeh

Dams are essential for effectively managing water resources as they serve multiple vital purposes, such as water storage, flood control, hydroelectric power generation, recreation and tourism and ecosystem regulation. The rising number of reservoirs, prompted by population growth, and the urgency for climate change adaptation and mitigation strategies emphasize the importance of developing efficient methods for calculating reservoirs water balance. In this study, we propose a remote sensing-based method for water balance analysis, aiming to facilitate the monitoring and management processes of water storage. The Karun (IV) reservoir, a dam situated in the southwestern region of Iran, is selected as the case study for this research. A conceptual rainfall-runoff model is employed to simulate the daily inflow rate of the reservoir by utilizing hydrological data obtained through remote sensing techniques. This data includes various parameters such as precipitation, evaporation and transpiration, soil moisture, vegetation, and land use. Moreover, a sensitivity analysis of model parameters is conducted to assess the significance of each parameter and simplify the model for future applications. Reservoir water evaporation is estimated by utilizing the reservoir area of the dam, which is obtained from the NDWI water index and the evaporation rate extracted from the WAPOR dataset. Then, altimetry data and reservoir area data are utilized to calculate changes in water storage. Finally, the water balance equation incorporating the calculated balance elements above is applied to determine the daily output of the dam reservoir. This study showcases the utilization of remote sensing data in estimating the output of the Karun (IV) reservoir. The accuracy of the proposed method is verified through comparisons with field data, making it a valuable tool for reservoirs where field data collection is costly or challenging.

How to cite: Kachoue, M. H., Goli, M., Bakhtiari, A., Sedghi, M., Hosseinipoor, M., and Khorashadi Zadeh, F.: Water Balance Analysis for Reservoirs through Remote Sensing: A Case Study of the Karun (IV) Reservoir in Iran., EGU General Assembly 2024, Vienna, Austria, 14–19 Apr 2024, EGU24-4660, https://doi.org/10.5194/egusphere-egu24-4660, 2024.

EGU24-5773 | Orals | HS6.5

Performance assessment of Lake Water Level estimation from Sentinel-6 Fully-Focused SAR observations and comparison to SWOT mission 

Carlos Yanez, François Boy, Gabriel Calassou, Jean-Alexis Daguzé, and Kassem Asfour

Remote sensing techniques are crucial for sustaining a continuous and global climate monitoring of inland waters. In particular, recent progress in satellite radar altimetry has enabled the observation of an increasing number of small and medium size lakes and reservoirs, even in complex topography. The arrival of nadir radar altimeters operating in Synthetic Aperture Radar (SAR) mode has considerably improved the resolution of the observations in the along-track direction, passing from several kilometers in conventional limited-pulse altimeters, to hundreds of meters in close-burst altimeters when applying unfocused SAR (UFSAR) processing and even to the theoretical limit of half the along track antenna length in open-burst altimeters that can totally exploit the Fully-Focused SAR (FFSAR) processing technique. Sentinel-6 is the first operational mission to operate in open-burst mode allowing this enhanced performance over inland waters [1]. Complementary to nadir radar altimetry, SWOT mission provides since the beginning of 2023 radar interferometry observations over wide-swaths that could entail great advances in hydrology [2].

The inversion methods to estimate geophysical parameters, such as Lake Water Level (LWL), from the backscattered altimetry signal are commonly called retrackers. These retrackers can be empirical, such as the widely used OCOG method or physically-based, that is to say, a background waveform model is derived from the theoretical knowledge of the microwave scattering process and then fitted to the real backscattered signal received on-board. Several retrackers of the second type have been developed for processing conventional pulse-limited radar observations, like the Brown-like models, and also for UFSAR observations in the case, for example, of the SAMOSA model. Nevertheless, no specific retracker for FFSAR observations has been developed yet. One of the limitations of analytical and numerical physical-based retrackers concerns the assumption that the radar footprint is completely covered by water. This assumption, that holds for large lakes, begins to degrade the accuracy on the retrieved geophysical parameters when monitoring smaller water bodies. For this reason, a retracker based on numerical simulations was proposed in 2021 adapted to UFSAR observations [3]. This latter model has the advantage of taking into account a prior knowledge of the lake contour and, in this way, only in-water areas of the radar footprint contributes to the simulated backscattered waveform. In this work, the derivation of a similar retracker taking into account the FFSAR processing particularities is presented. This results in the first retracking model specifically developed for FFSAR observations. Preliminary performance is assessed with a variety of lakes for which in-situ observations of LWL are available. Furthermore, a comparison with the recently delivered first products of the SWOT mission over lakes will be presented.

[1] Donlon, C.J., et al, 2021. The Copernicus Sentinel-6 mission: Enhanced continuity of satellite sea level measurements from space. Remote Sensing of Environment, 258, p.112395.

[2] Biancamaria, S., et al, 2016. The SWOT mission and its capabilities for land hydrology. Remote sensing and water resources, 117-147.

[3] Boy, F., et al, 2021. Improving Sentinel-3 SAR mode processing over lake using numerical simulations. IEEE Transactions on Geoscience and Remote Sensing, 60, pp.1-18.

How to cite: Yanez, C., Boy, F., Calassou, G., Daguzé, J.-A., and Asfour, K.: Performance assessment of Lake Water Level estimation from Sentinel-6 Fully-Focused SAR observations and comparison to SWOT mission, EGU General Assembly 2024, Vienna, Austria, 14–19 Apr 2024, EGU24-5773, https://doi.org/10.5194/egusphere-egu24-5773, 2024.

EGU24-5830 | Orals | HS6.5 | Highlight

Estimation of water level time series for lakes and rivers using SWOT KaRIn measurements  

Christian Schwatke, Daniel Scherer, and Denise Dettmering

For more than three decades classical satellite altimetry has been successfully used to monitor water levels of inland waters such as rivers, lakes and reservoirs. In December 2022, a new generation of altimeter mission called Surface Water and Ocean Topography (SWOT) was successfully launched. SWOT is equipped with a classical radar nadir altimeter comparable to Jason-3, but also with a new Ka-band Radar Interferometer (KaRIn). KaRIn uses the principle of SAR interferometry, which has the capability to monitor almost every inland water body worldwide because of its swath. 

In this contribution, we present a new approach to derive water level time series for lakes and rivers using the high-resolution SWOT pixel cloud dataset. This dataset allows us to monitor water levels of very small lakes (> 100m²). We use SWOT data measured on the fast sampling orbit (03/2023 – 07/2023, 1-day repeat cycle) and the science orbit (since 07/2023, 21-day repeat cycle). For quality assessment, the resulting water level time series will be validated with in-situ data. All water level time series will be freely available on the web portal of the "Database of Hydrological Time Series of Inland Waters" (DAHITI, https://dahiti.dgfi.tum.de). 


How to cite: Schwatke, C., Scherer, D., and Dettmering, D.: Estimation of water level time series for lakes and rivers using SWOT KaRIn measurements , EGU General Assembly 2024, Vienna, Austria, 14–19 Apr 2024, EGU24-5830, https://doi.org/10.5194/egusphere-egu24-5830, 2024.

EGU24-6828 | ECS | Posters on site | HS6.5

Trends and variability of lake surface water storage in the source region of the Yellow River based on deep learning 

Weixiao Han, Chunlin Huang, Weizhen Wang, Jinliang Hou, Gabriela Schaepman-Strub, Juan Gu, Yanfei Peng, Ying Zhang, and Peng Dou

The source region of the Yellow River is one of the main regions of the Asian water tower, lakes storing standing or slowly flowing water that provides essential ecosystem services of fresh water and food supply, waterbird habitat, cycling of pollutants and nutrients, and recreational services. Lakes are also key components of biogeochemical processes and regulate climate through cycling of carbon. Thus the estimation of trends and variability of the lake surface water storage is very critical, the direct human activities (damming and water consuption) and the natural factors (precipitation, runoff, temperature and potential evaporation) is gradually changing this environmentally sensitive region, especially the glacier retreat and permafrost thawing partially drive alpine lake expansion.

The objective is mainly estimating the trends and variability of lake surface water storage using the deep learning module and long-term multi-source remote sensing data from the source region of the Yellow River. Optical remote sensing time-series images (Landsat 5-9, MODIS, and Sentinel-2) are employed to generate high-resolution, complete and closed lake surface shorelines and areas based on the Deep Convolutional Generative Adversarial Networks (DCGAN) deep learning method. Additionally, radar altimeters (GFO, T/P, Jason-1/2/3, Sentinel-6, ERS-2, Envisat, Cryosat-2, Saral/AltiKa, Sentinel 3/SRAL, ICESat, and ICESat-2) are utilized to recover lake water levels through the application of the Spatial-Temporal Graph Neural Networks (ST-GAN) deep learning method, providing insights into the long-term changes in lake water surface storage from 1992 to 2022. The study aims to assess the contributions of human activities and natural factors, and provids the valuable guidelines for water resource management.

How to cite: Han, W., Huang, C., Wang, W., Hou, J., Schaepman-Strub, G., Gu, J., Peng, Y., Zhang, Y., and Dou, P.: Trends and variability of lake surface water storage in the source region of the Yellow River based on deep learning, EGU General Assembly 2024, Vienna, Austria, 14–19 Apr 2024, EGU24-6828, https://doi.org/10.5194/egusphere-egu24-6828, 2024.

EGU24-8341 | Orals | HS6.5 | Highlight

Understanding the interaction between inland waters and the coastal zone during extreme events over the Po Delta from space 

Angelica Tarpanelli, Francesco De Biasio, Karina Nielsen, Paolo Filippucci, Rosa Maria Cavalli, and Stefano Vignudelli

The alternation of extreme events is a source of great stress on the territory and forces us to adopt solutions to help mitigate their consequences. In this study, an attempt is made to exploit Earth Observation from space as a means to point out the interaction of inland waters and the coastal areas during hydrological extreme events, i.e. floods and droughts. During a flood event, large volume of water from the river reaches the coast, adding a considerable volume of freshwater. Conversely, during a drought event salt water from the sea enters inland causing severe damage to agriculture and the local population. With this study we attempt to investigate how the systems of sea and river interact during particularly intense events using satellite optical (Sentinel-2 and Sentinel-3) and altimeter (Sentinel-3, Cryosat-2, Icesat-2) sensor data. The area selected is the Po River delta (up to 200 km from the mouth), which in recent years has been exposed to severe events: in November 2019, the Po River was subject to a copious flood that had not occurred since 2000, while in the summer of 2022, it experienced the worst drought in the last 70 years.

The analysis aims at evaluating three fundamental aspects: 1) the ability of satellite altimetry to identify extreme events in the river; 2) the potential of satellite altimetry to detect salt wedge intrusion in the Po River delta; and 3) the potential correlation between the altimetry observations and optical imagery of the river’s plume along the Adriatic coast.

The analysis was conducted by analysing long time series (of about 10 years) for the first objective and by focusing on the drought event of 2022 and the flood events that occurred in the last 5 years for the other two objectives.

The results of the analysis confirm that the satellite observed the significant increase and decrease in water levels in correspondence of the extreme events. In addition, the analysis of the data at the virtual stations in the downstream part of the Po River, together with the data along the tracks crossing the plume closer to the mouth of the river, showed the interaction between the sea and the river. In particular, the temporal series of the river clearly highlight the influence of the sea water several km upstream the river (more than 40 km as reported in the news), probably related to the salt wedge intrusion, which has caused significant damage to agriculture and drinking water aquifers for a long time after the event. The study qualitatively shows that extreme hydrological events can also be captured in the open sea in this region.

The analysis illustrates the great potential of satellite sensors to monitor extreme events and the interaction of inland and coastal waters.

How to cite: Tarpanelli, A., De Biasio, F., Nielsen, K., Filippucci, P., Cavalli, R. M., and Vignudelli, S.: Understanding the interaction between inland waters and the coastal zone during extreme events over the Po Delta from space, EGU General Assembly 2024, Vienna, Austria, 14–19 Apr 2024, EGU24-8341, https://doi.org/10.5194/egusphere-egu24-8341, 2024.

The current global water body maps offer an approximate resolution of 30 meters, contingent on available remote sensing data. However, to address the needs of advanced applications like global carbon cycle analysis and real-time flood predictions, a water body map with higher spatial resolution becomes imperative, especially for resolving smaller rivers. Traditional water extraction methods rely on water indexes that combine visible and infrared spectra. State-of-the-art remote sensing data, including aerial photography with spatial resolutions in the order of a few meters, often includes only the visible spectrum.

In response to this challenge, we have developed a water extraction method at an impressive 60cm resolution utilizing Bayesian inference based solely on the visible spectrum from aerial photography, without using the infrared spectrum. To enhance our methodology, we integrated references of water existence from a Landsat-based dataset called G1WBM and Open Street Map (OSM), along with a hydrography dataset (J-FlwDir) presumed to be linked to water bodies.

Our method successfully detected the main streams of the Tsurumi River and Tama River in Japan, including their previously unrecognized tributaries in the Landsat-based dataset. Notably, this study identified rivers with a width exceeding 10 meters. Furthermore, it contributed valuable area information for 37% of small rivers represented as "line" features in the OSM.

These findings underscore the effectiveness of our Bayesian water detection approach, which leverages hydrography data and existing water body maps to improve the spatial resolution of large-scale water mapping significantly. Notably, this improvement is achieved using remote sensing data that lacks infrared spectra, showcasing the potential of our method in advancing the accuracy and precision of global water mapping efforts.

How to cite: Watanabe, M. and Yamazaki, D.: A 60-cm Aerial Photography-based Water Body Mapping: Application to the Tama and Tsurumi Rivers in Japan, EGU General Assembly 2024, Vienna, Austria, 14–19 Apr 2024, EGU24-8805, https://doi.org/10.5194/egusphere-egu24-8805, 2024.

EGU24-8949 | ECS | Orals | HS6.5

Looking beyond nadir: Measuring densely sampled river elevation profiles with the Sentinel-6 altimeter 

Frithjof Ehlers, Cornelis Slobbe, Martin Verlaan, and Marcel Kleinherenbrink

For almost 30 years radar altimeters provide water elevations of rivers and lakes only where a target intersects the satellite’s ground track, called Virtual Stations (VS). This way, the observations have both limited temporal and spatial resolution, because on one hand such intersections occur by chance and because on the other hand the repeat cycle of the orbit ranges from 10 to 35 days, depending on the mission.

Boy et al. [1] illustrated recently that river signals may also be captured when the river is located at cross-track distances of several kilometers, when utilizing high resolution SAR altimeter products (particularly fully-focused SAR [2], FFSAR). Therefore, the concept of the altimeter river measurements can be revisited completely. Based on the idea presented in [1], we developed a novel algorithm to calculate water surface elevations (WSE) of rivers within a ground swath of approximately 14 km width, and with along-track resolutions as fine as 10 m from the Sentinel-6 altimeter signal. All that is needed additionally to the FFSAR-processed signal is an a-priori river polygon or centerline to correct for non-zero cross-track distances.

Our algorithm can provide WSE along most parts of the river that fall within the swath, thus delivering densely sampled WSE profiles instead of a few point measurements over only the nadir crossings (VS). This marks a drastic improvement in the number of available WSE observations and opens completely new research possibilities, as water surface slopes and level changes due to rapids and dams can be studied directly. Essentially, these new Sentinel-6 WSE measurements resemble the river WSE product obtained with the recently launched SWOT mission (albeit with more limited coverage). As such, they can be exploited in similar manners to provide much additional information for hydrological research, e.g. for assimilation in hydrological models and more reliable estimation of river discharge.

We demonstrate and validate the new measurement approach and our algorithm over two rivers in France, the Creuse river and the Garonne river, showing biases that are typically on the order of +-4 cm and random errors on the order of 5 cm, both on 30 m along-track resolution. In our presentation, we will concentrate our attention on the new challenges of the method, including a sophisticated signal detection algorithm, the altered error budget of off-nadir WSE measurements and the limitations due to signal folding, clutter, lacking contrast and the complexity of the scene.

[1] Francois Boy et al. “Measuring longitudinal river profiles from Sentinel-6 Fully-Focused SAR mode”. In: Ocean Surface Topography Science Team (OSTST) meeting. Nov. 2023. doi: 10.24400/527896/a03-2023.3781.

[2] Alejandro Egido and Walter H. F. Smith. “Fully Focused SAR Altimetry: Theory and Applications”. In: IEEE Transactions on Geoscience and Remote Sensing 55.1 (Jan. 2017), pp. 392–406. doi: 10.1109/TGRS.2016.2607122.

How to cite: Ehlers, F., Slobbe, C., Verlaan, M., and Kleinherenbrink, M.: Looking beyond nadir: Measuring densely sampled river elevation profiles with the Sentinel-6 altimeter, EGU General Assembly 2024, Vienna, Austria, 14–19 Apr 2024, EGU24-8949, https://doi.org/10.5194/egusphere-egu24-8949, 2024.

EGU24-10126 | ECS | Orals | HS6.5

Development of a global and dynamic map of wetland and inundated areas based on microwave remote sensing product (GIEMS-2) over 1992-2020 

Juliette Bernard, Catherine Prigent, Carlos Jimenez, Marielle Saunois, Frederic Frappart, Cassandra Normandin, Pierre Zeiger, Shushi Peng, Yi Xi, Etienne Fluet-Chouinard, and Zhen Zhang

Wetlands and inundated areas cover only a few percent of the Earth's surface. However, they play an important role in freshwater regulation, biodiversity, and climate. In particular, a significant proportion of atmospheric methane is emitted from these areas [1]. There is therefore a need for data that can reliably capture surface water interannual variability over the past decades. 

The Global Inundation Extent from Multi-Satellites (GIEMS-2) [2] is based on microwave remote sensing data (SSM/I and SSMIS). It provides a 0.25° global monthly estimate of inundated and saturated areas and has been extended to 2020 to cover three decades (1992-2020). 

First, an evaluation of GIEMS-2 together with other products is presented. Key findings include consistent spatial patterns, seasonal cycles and time series anomalies observed by GIEMS-2 with the other observational datasets studied (MODIS-derived surface water, CYGNSS-derived surface water, river discharge). This highlights the interest of such a product for the calibration of hydrological models, as has been achieved for example by Xi et al. (2022) for TOPMODEL [3]. 

In a second part, the use of GIEMS-2 for the estimation of methane emissions from wetlands and inundated areas is discussed. GIEMS-2 has been processed with other data sources to derive a dynamic map of wetlands (including peatlands), open water (lakes, rivers, reservoirs) and rice paddies. This comprehensive product allows a consistent view of the area between the different classes, limiting problems of double counting and miss counting. This new database can then be used to constrain the extent of the water surface in models estimating methane flux rates, in order to study the influence of surface water changes on interannual variations in methane emissions.


[1] Marielle Saunois et al. “The Global Methane Budget 2000–2017”. In: Earth System Science Data 12.3 (July 2020), pp. 1561–1623. doi: 10.5194/essd-
12-1561-2020. url: https://doi.org/10.5194/essd-12-1561-2020.
[2] C. Prigent, C. Jimenez, and P. Bousquet. “Satellite-Derived Global Surface Water Extent and Dynamics Over the Last 25 Years (GIEMS-2)”. In: Jour-
nal of Geophysical Research: Atmospheres 125.3 (Feb. 2020). doi: 10.1029/2019jd030711. url: https://doi.org/10.1029/2019jd030711.
[3] Yi Xi et al. “Gridded Maps of Wetlands Dynamics over Mid-Low Latitudes for 1980–2020 Based on TOPMODEL”. In: Scientific Data 9.1 (June 2022), p. 347. issn: 2052-4463. doi: 10.1038/s41597-022-01460-w

How to cite: Bernard, J., Prigent, C., Jimenez, C., Saunois, M., Frappart, F., Normandin, C., Zeiger, P., Peng, S., Xi, Y., Fluet-Chouinard, E., and Zhang, Z.: Development of a global and dynamic map of wetland and inundated areas based on microwave remote sensing product (GIEMS-2) over 1992-2020, EGU General Assembly 2024, Vienna, Austria, 14–19 Apr 2024, EGU24-10126, https://doi.org/10.5194/egusphere-egu24-10126, 2024.

EGU24-10856 | ECS | Orals | HS6.5

Toward a global scale runoff estimation through satellite observations: the STREAM model 

Francesco Leopardi, Luca Brocca, Carla Saltalippi, Jacopo Dari, Karina Nielsen, Nico Sneeuw, Mohammad J. Tourian, Marco Restano, Jérôme Benveniste, and Stefania Camici

River discharge monitoring is critical for many activities ranging from water resource management to flood risk reduction. Due to limitations of in situ stations (e.g. low station density, incomplete temporal coverage and delays in data access), river discharge is not always continuously monitored in time and space. This has led researchers and space agencies, among others, to develop new methods based on satellite observations for estimating river discharge.

In recent years, ESA has funded the SaTellite-based Runoff Evaluation And Mapping (STREAM) and STREAM-NEXT projects, which propose to use satellite observations of precipitation, soil moisture and terrestrial water storage within a simple and conceptually parsimonious model, STREAM, to estimate runoff.

The model, applied to five large basins in the world (Mississippi-Missouri basin, Amazon basin, Danube basin, Murray-Darling basin and Niger basin)  has demonstrated a high ability to estimate runoff and river discharge in both natural and non-natural basins with a high anthropogenic impact (i.e. in basins where flow is regulated by the presence of dams, reservoirs or floodplains along the river; or in heavily irrigated areas). In particular, the good results obtained paved the way for the application of the STREAM approach on a global scale. For this purpose, the STREAM-NEXT project will generalise the STREAM model to make it applicable to more than forty basins worldwide. Depending on the availability of in situ discharge data, the selected basins shall be grouped into calibration and validation clusters. The purpose is to use the basins into the calibration cluster to tune the parameters of the regionalized STREAM model and apply the regionalised model parameters to the validation cluster basins to estimate the accuracy of the STREAM model.  Additional satellite observations, such as altimetric water levels, will be used to estimate the water stored in the reservoirs; gravimetric data with different spatial/temporal resolutions will be explored to investigate the impact of these data on the model results.

Finally, a calibration procedure and a regionalisation approach will be developed to make the STREAM model applicable to non-calibrated basins.

Here we present the STREAM-NEXT project and some preliminary results related to the generalization of the STREAM model framework. Different basins with different climate, topography and level of anthropisation will be selected to demonstrate the suitability of the approach for a global scale application. 

How to cite: Leopardi, F., Brocca, L., Saltalippi, C., Dari, J., Nielsen, K., Sneeuw, N., Tourian, M. J., Restano, M., Benveniste, J., and Camici, S.: Toward a global scale runoff estimation through satellite observations: the STREAM model, EGU General Assembly 2024, Vienna, Austria, 14–19 Apr 2024, EGU24-10856, https://doi.org/10.5194/egusphere-egu24-10856, 2024.

EGU24-10929 | Orals | HS6.5 | Highlight

SWOT lake processing and products 

Claire Pottier, Cécile Cazals, Marjorie Battude, Manon Delhoume, Jean-François Crétaux, and Roger Fjørtoft

The Surface Water and Ocean Topography (SWOT) satellite, launched on December 16th 2022, is a CNES and NASA joint project, in collaboration with the Canadian Space Agency (CSA) and the United Kingdom Space Agency (UKSA). SWOT represents a major breakthrough in space altimetry by using a new technical concept based on interferometric synthetic aperture radar (InSAR): in comparison with conventional altimetry, which provides point data along profiles at resolutions of tens or hundreds of kilometres, wide-swath altimetry provides a two-dimensional image with a horizontal resolution of the order of tens or hundreds of meters. Therefore, this mission will significantly improve both offshore and coastal ocean observation, while enabling global measurement also of the water levels (and their variations over time and space) of rivers, lakes and flood zones, with a repeat period of 21 days.

Over land, SWOT is planned to survey lakes with a surface area larger than 250 m by 250 m (objective: 100 m by 100 m). To do so, three main products are available to the user community. The pixel cloud (L2_HR_PIXC) product provides longitude, latitude, height, corrections and uncertainties for pixels classified as water and pixels in a buffer zone around these water bodies, as well as in systematically included areas (defined by an a priori water occurrence mask). The product specific to lakes (L2_HR_LakeSP) is computed from the pixel cloud for each water feature observed by SWOT and not assigned to a regular river. It consists of polygon shapefiles, delineating the lake boundary and providing the area and average height of each observed lake. A Prior Lake Database (PLD) allows to link the SWOT observations to known lakes and help monitoring them over time. The L2_HR_LakeAvg product aggregates L2_HR_LakeSP data over a 21-day cycle.

The validation of L2_HR_LakeSP water surface elevations is mainly based on existing gauge networks. It is a challenge to obtain reference height data that have an absolute accuracy well below what is required for the SWOT lake products we are validating (10 cm 1-sigma at the lake level). The validation of water surface areas relies on reference water masks obtained mainly from (Very-) High-Resolution optical or radar satellite images (Pléiades, Sentinel-2, Sentinel-1, RCM…), pre-processed so that comparisons can be made at the lake scale.

This presentation will first outline the lake processing and the Prior Lake Database. Then examples of products, preliminary accuracy assessments and associated Cal/Val activities will be presented.

How to cite: Pottier, C., Cazals, C., Battude, M., Delhoume, M., Crétaux, J.-F., and Fjørtoft, R.: SWOT lake processing and products, EGU General Assembly 2024, Vienna, Austria, 14–19 Apr 2024, EGU24-10929, https://doi.org/10.5194/egusphere-egu24-10929, 2024.

Comprehensive and accurate quantification of inland surface water dynamics is vital to our understanding of terrestrial water cycle. Declining trend in availability of in-situ gauge stations elevates a need to switch to alternate measurement sources. In this context, satellite radar altimetric observations of Water Surface Elevations (WSE) offer vast possibilities, especially in poorly gauged basins.  The potential of altimetry is expected to escalate with the availability of high-resolution point cloud measurements of surface waters from the recently launched Surface Water and Ocean Topography (SWOT) mission. In the proposed research, we evaluate the potential of node averaged vector product of river WSE from SWOT to improve discharge estimation through assimilated hydrodynamic modelling over an entire river basin in India. The study uses proxy SWOT river products generated using an Observing System Simulation Experiment (OSSE), the CNES Large Scale SWOT Hydrology Simulator (Elmer et al., 2020; Nair et al., 2022) and RiverObs software. Here, we use the state-of-the-art CaMa-Flood (Catchment-based Macro-scale Floodplain Model) hydrodynamic model (Yamazaki et al., 2011) and the Local Ensemble Transform Kalman Filter (LETKF) assimilation algorithm (Hunt et al., 2007) with a physically based empirical localization approach (Revel et al., 2019). Normalized assimilation approach is adopted to handle the bias between modelled WSE and observed WSE from SWOT. The integration of SWOT altimetric observations in river modelling presents a promising avenue, considering its unprecedented spatiotemporal resolution and accuracy. The research addresses the challenges associated with the terrestrial water cycle, acknowledging the limitations of hydrodynamic modelling and uncertain space-borne observations. Results provide valuable insights into the potential of node averaged products of WSE from the SWOT mission in enhancing discharge estimation in the context of Indian river systems. The study is highly beneficial to sparsely gauged or ungauged basins, which are very common in India.

How to cite: K Soman, M. and Jayaluxmi, I.: Assimilation of high-resolution node averaged water surface elevations from the SWOT mission towards improve discharge estimates., EGU General Assembly 2024, Vienna, Austria, 14–19 Apr 2024, EGU24-11731, https://doi.org/10.5194/egusphere-egu24-11731, 2024.

EGU24-13107 | Orals | HS6.5

Higher Temporal Resolution Global GRACE/GRACE-FO Total Water Storage Products for Assimilation in Hydrology Models 

Himanshu Save, Mark Tamisiea, Nadege Pie, and Srinivas Bettadpur

The Gravity Recovery and Climate Experiment (GRACE) and its Follow-On (GRACE-FO) missions have provided near continuous and unique measurement of total water storage  (TWS) since 2002. These international partnership missions have provided valuable insights in the fields of Hydrology, Oceanography, Ocean dynamics, Cryosphere Sciences, Solid Earth etc. These data from GRACE/GRACE-FO have improved our understanding of the Earth’s water cycle since launch and have become indispensable for climate related studies.

The spatial resolution of the data products from GRACE/GRACE-FO are roughly 300km and they typically have a temporal resolution of a month. These products provide the unique measurement of the total water storage of the entire water column and can provide a constraint for hydrological and ocean models. Several studies have used GRACE products for assimilation into the hydrological models for improved assessment of the reality on the ground and for downscaling the information to a higher spatial resolution using data assimilation. This paper will introduce the techniques that improve of temporal resolution of GRACE/GRACE-FO products from month to shorter than 5 days. That includes production of global 5-day TWS solution and the daily TWS product from GRACE that is estimated as a “swath” over the daily satellite ground-track.  The paper will discuss the analysis results over hydrological and ocean basins and validate the higher frequency signals captured by this product.  The goal for the production of this higher temporal resolution GRACE/GRACE-FO product is to be able to use these signals with a latency of a few days for ingestion into machine learning algorithms for early flood detection applications and for daily assimilation into hydrological models at short latency.

How to cite: Save, H., Tamisiea, M., Pie, N., and Bettadpur, S.: Higher Temporal Resolution Global GRACE/GRACE-FO Total Water Storage Products for Assimilation in Hydrology Models, EGU General Assembly 2024, Vienna, Austria, 14–19 Apr 2024, EGU24-13107, https://doi.org/10.5194/egusphere-egu24-13107, 2024.

EGU24-14002 | Posters on site | HS6.5

Synthetic Aperture Radar Altimetry Processing on Demand at ESA’s Altimetry Virtual Lab 

Jérôme Benveniste, Marco Restano, Salvatore Dinardo, Christopher Buchhaupt, Michele Scagliola, Marcello Passaro, Luciana Fenoglio-Marc, Américo Ambrózio, and Carla Orrù

This presentation updates on the ESA Altimetry Virtual Lab for the exploitation of CryoSat-2 (CS-2), Sentinel-3 (S-3) and Sentinel-6 Michael Freilich (S-6MF) data from L1A (FBR) data products up to SAR/SARin L2 geophysical data products. The following on-line & on-demand state-of-the-art research  algorithm services compose the portfolio:

  • The ESA-ESRIN SARvatore service for CS-2 and S-3 services, which allow users to customise the processing at L1b & L2 (a list of configurable options for, e.g., SAMOSA+/++ and ALES+ SAR retrackers, not yet available in the ESA Ground Segment).
  • The ESA SAMPY (Cryo-TEMPO project) for CryoSat-2, which appends the SAMOSA+ retracker output to official CryoSat-2 Level-2 GOP products.
  • The TUDaBo SAR-RDSAR (TU Darmstadt–U Bonn SAR-Reduced SAR) for CS-2 and S-3, which allows users to generate reduced SAR, unfocused SAR & LRMC data, with configurable L1b & L2 processing options and retrackers (BMLE3, SINC2, TALES, SINCS, SINCS OV).
  • The TU München ALES+ SAR for CS-2 and S-3, which allows users to process official L1b data and produces L2 products by applying the empirical ALES+ SAR subwaveform retracker, including a dedicated Sea State Bias solution.
  • The Aresys Fully-Focused SAR for CS-2 & S-3, to produce L1b products with configurable options and appending the ALES+ FFSAR output.

These services will be extended with the following new services:

  • Appending the SAMOSA+ retracker output in all services.
  • The Aresys FF-SAR service for S-6MF
  • The CLS SMAP S-3 FF-SAR processor extended to process S-6MF
  • The UBonn FF-SAR Omega-Kappa processor for S-3 and S-6MF
  • An upgrade of the TUDaBo SAR-RDSAR extended to S-6MF with new ocean and coastal retrackers.
  • The ESA-ESTEC/isardSAT L1 S-6MF Ground Prototype Processor.
  • SAR services updated to process S-6MF

Output products are generated in netCDF, therefore compatible with the multi-mission “Broadview Radar Altimetry Toolbox” (BRAT, http://www.altimetry.info).

The ESA Altimetry Virtual Lab, a community space for simplified services and knowledge-sharing, is hosted on the EarthConsole® (https://earthconsole.eu), supported by the ESA Network of Resources. This service has more than 120 users and sponsored so far more than 500 CPU years, leading to more than 30 publications and 3 PhD theses.

Brochure at https://earthconsole.eu/knowledge-base/. Info at altimetry.info@esa.int.

How to cite: Benveniste, J., Restano, M., Dinardo, S., Buchhaupt, C., Scagliola, M., Passaro, M., Fenoglio-Marc, L., Ambrózio, A., and Orrù, C.: Synthetic Aperture Radar Altimetry Processing on Demand at ESA’s Altimetry Virtual Lab, EGU General Assembly 2024, Vienna, Austria, 14–19 Apr 2024, EGU24-14002, https://doi.org/10.5194/egusphere-egu24-14002, 2024.

EGU24-15163 | ECS | Posters on site | HS6.5

Fault tolerant approach to regenerate Level 1B SAR altimetry waveforms for enhancing Level 2 retrackers performance 

Shahin Khalili, Mohammad J. Tourian, Omid Elmi, Johannes Engels, and Nico Sneeuw

This study deals with the identification and retrieval of anomalous waveforms generated in Level 1B processing chain of satellite altimetry over coastal areas and inland water bodies. Efficient identification of anomalous waveforms greatly improves the retracking performance, leading to the generation of precise water level time series that serve as vital inputs for hydrological studies. Abnormal behaviour in waveforms may be an indication of environmental changes, instrument malfunctions or other critical factors. To find anomalous waveforms, our framework utilizes an unsupervised machine learning technique. We categorise different parameters of the satellite's altimeter like AGC parameter, tracker range and features related to shape of waveforms for instance waveform’s skewness, number and location of peaks and so on for each sample in the dataset. Then we identify abnormal waveforms using a two-step density distribution probability analysis.

The secondary purpose of this study is proposing a robust strategy to retrieve abnormal waveforms in the level 1B SAR processing chain. This step is vital for narrow rivers and small inland water bodies, in which low number of measurements on related cycle cause missing hydrology data. In contrast to previous studies focusing solely on investigating L2 waveforms to determine precise retracking gates for multipeak and noisy waveforms, we propose an additional step in the L1B processing chain, specifically tailored to coastal and inland waters, enabling the retrieval of abnormal waveforms. In both fully focused and unfocused SAR processing, the final waveform is formed through the combination of various beam looks from the altimeter during fixed illumination time in stacks to the desired point on the surface, certain looks in the stack may exhibit undesirable patterns due to variations in environmental characterization, antenna footprint, and sidelobe gain. The proposed methods will mitigate the presence of undesirable waveforms in the stack prior to the generation of the final waveforms.

We apply the proposed methodology for Sentinel 3A and 3B datasets over different inland waters and validated our results against in-situ data. The results demonstrate that the water level time series, obtained by regenerated waveforms have significantly improved. The results show the potential of our proposed framework for detecting and retrieving anomalous waveforms leading to robust water level estimates from satellite altimetry data.

How to cite: Khalili, S., Tourian, M. J., Elmi, O., Engels, J., and Sneeuw, N.: Fault tolerant approach to regenerate Level 1B SAR altimetry waveforms for enhancing Level 2 retrackers performance, EGU General Assembly 2024, Vienna, Austria, 14–19 Apr 2024, EGU24-15163, https://doi.org/10.5194/egusphere-egu24-15163, 2024.

EGU24-15263 | Posters on site | HS6.5

New Open-Loop Tracking Command (OLTC) platform : AltiGIS 

Florian Wery, François Boy, Sophie Le Gac, Alexandre Homerin, Malik Boussaroque, and Jeremie Aublanc

Over the last decade, there has been a burgeoning interest in altimetry measurements for inland waters, with a focus on comprehensive studies of water levels in lakes, reservoirs, and rivers on a global scale. This research is crucial for the hydrology community to accurately assess the Earth's freshwater resources. Significant advancements have been achieved in enhancing altimeters' capacity to obtain high-quality measurements over inland waters.

The Open-Loop Tracking Command (OLTC) stands out as a noteworthy development in altimeter on-board tracking modes. Its effectiveness has been proven through successful implementation in previous missions and is now designated as the operational mode for current missions, including Sentinel-3, Sentinel-6, and SWOT nadir.

Over the past decade, OLTC data, crucial in tracking inland water bodies from radar altimetry satellites, has undergone substantial refinement. Originally developed for Jason-2, new missions as Jason-3, Sentinel-3A&B, Sentinel-3B, Sentinel-6, SWOT nadir have been incorporated. Algorithms and procedures to compute location and elevation of inland waters targets (rivers, lakes, reservoirs) have also been largely improved. The number of hydrological targets has increased fivefold with an acquisition success rate which is now close to 90%. Presently, each mission tracks between 30,000 to 70,000 hydrological targets.

Despite modifications to a software developed 15 years ago, ongoing advancements and the necessity for covering  land ice surfaces in preparation of upcoming S3C&D missionshave prompted the development of a new software. In addition, the availability of new input data provided by the SWOT mission (water mask and elevation) required also to revise the current software to make their usage efficient. Work is currently underway to establish a new OLTC platform, named AltiGIS. The platform is designed with three primary objectives: facilitate collaboration, enhance data generation validity, and broaden dissemination through the use of DevOps practices. The presentation aims at harvesting new user needs but will also cover both the undergoing software development and roadmap.

How to cite: Wery, F., Boy, F., Le Gac, S., Homerin, A., Boussaroque, M., and Aublanc, J.: New Open-Loop Tracking Command (OLTC) platform : AltiGIS, EGU General Assembly 2024, Vienna, Austria, 14–19 Apr 2024, EGU24-15263, https://doi.org/10.5194/egusphere-egu24-15263, 2024.

EGU24-15510 | Posters on site | HS6.5

Riparian monitoring using SAR image-based water body detection technique 

Shinhyeon Cho, Seongkeun Cho, Yeji Kim, HyunOk Kim, and Minha Choi

Sandbars on the riparian are ecologically important as they provide and protect habitats for organisms and act as natural septic tanks to filter and purify pollutants. In recent years, the role of sandbars in water pollution in rivers has been highlighted, and monitoring of the riparian is required. Sandbars are common in the lower reaches of deltas and at downstream of rivers, especially where the river is wide, and the flow velocity is relatively slow so that remote sensing can be used effectively. Synthetic Aperture Radar (SAR) imagery is an effective tool for spatial monitoring of the riparian because it provides high resolution and can detect regardless of weather conditions. In recent years, research has been conducted to use SAR imagery with AI to improve accuracy of detecting both riparian and sandbars. In this study, we utilized Sentinel-1 SAR (VV, VH polarized backscatter coefficient imagery), Sentinel-2 optical imagery Normalized Difference Water Index (NDWI), and Normalized Difference Vegetation Index (NDVI) data to identify changes of riparian and sandbars using AI-based clustering techniques. The confusion matrix is performed to validate the performance of deep learning techniques and waterbody detection. Technological advances in remote sensing will improve the data resolution of SAR and optical imagery, allowing detailed features to be observed. In further study is expected to improve the monitoring and management of sandbars on the riparian as monitoring technology advances.

Keywords: Riparian, sandbars, Water body detection, Sentinel-1, Sentinel-2, Deep learning

Acknowledgement
This work was supported by the “Development of Application Technologies and Supporting System for Microsatellite Constellation”project through the National Research Foundation of Korea(NRF) grant funded by the Korea government(MSIT) (No. 2021M1A3A4A11032019). This research was supported by the BK21 FOUR (Fostering Outstanding Universities for Research) funded by the Ministry of Education (MOE, Korea) and National Research Foundation of Korea (NRF). This work is financially supported by Korea Ministry of Land, Infrastructure and Transport (MOLIT) as 「Innovative Talent Education Program for Smart City」

How to cite: Cho, S., Cho, S., Kim, Y., Kim, H., and Choi, M.: Riparian monitoring using SAR image-based water body detection technique, EGU General Assembly 2024, Vienna, Austria, 14–19 Apr 2024, EGU24-15510, https://doi.org/10.5194/egusphere-egu24-15510, 2024.

EGU24-15514 | Posters on site | HS6.5

Remotely-sensed spatiotemporal dynamics of the coupled Trichonida – Lysimachia lake system in Western Greece at the seasonal, annual, and decadal time scale 

Konstantinos Panousis, Konstantinos M. Andreadis, Andreas Langousis, Nikolaos Th. Fourniotis, and Christoforos Pappas

Understanding how the combined effects of hydroclimatic variability and anthropogenic interventions shape lake reservoirs is crucial for sustainable water resources management as well as for numerous ecosystem services. In the present study, we focus on the interplay between two lakes in Western Greece that are part of the Natura 2000 network of protected areas, namely the Trichonida – Lysimachia lake system. Lake Trichonida is the largest natural lake in Greece and is connected to the substantially smaller lake Lysimachia through an open channel. The two lakes, together with the connecting channel, constitute a couple system. The channel regulates the flow from Trichonida to Lysimachia lake based on irrigation needs (summer time) and peak flows in the main river corridor (winter-time discharge of Acheloos river). The spatial variability in the extent of the two lakes was quantified at the seasonal, annual, and decadal time scales with remote sensing spectral indices, compiling a wealth of Earth observations. Moreover, water level data from satellite altimetry and ground measurements were combined to characterize water level fluctuations in each lake and their cross-correlation. Gridded data of key meteorological variables (air temperature, precipitation, etc.) as well as drought indices were used to characterize the hydroclimatic variability in the watersheds associated with the two examined lakes. The combined used of ground measurements together with multivariate Earth observations offers new insights into the spatiotemporal dynamics of the coupled Trichonida – Lysimachia lake system that could support and guide sustainable water resource management in the area under environmental change.

How to cite: Panousis, K., Andreadis, K. M., Langousis, A., Fourniotis, N. Th., and Pappas, C.: Remotely-sensed spatiotemporal dynamics of the coupled Trichonida – Lysimachia lake system in Western Greece at the seasonal, annual, and decadal time scale, EGU General Assembly 2024, Vienna, Austria, 14–19 Apr 2024, EGU24-15514, https://doi.org/10.5194/egusphere-egu24-15514, 2024.

EGU24-15723 | ECS | Posters on site | HS6.5

Monitoring water level and lake extent change with nadir-altimeters and SWOT 

Hakan Uyanik, Jiaming Chen, Luciana Fenoglio, and Jürgen Kusche

Water level and lake extent are estimated from combined in-situ, Sentinel-3 and Sentinel-6 nadir altimeters and SWOT-altimetry. Accuracy and precision of the various techniques are compared, the goal is the validation of the new SWOT data in the river Rhine and in Swiss lakes.


The main challenge is the interference among multiple water surfaces which contaminate the signal. Fully-focus and Unfocused SAR and individual echoes processed data have a different sensitivity to the signal coming from non-nadir targets. For nadir-altimeters the accuracy and precision of water level depend on the frequency selected for the low level processing. The accuracy ranges from 10-30 cm and depends on the location. The precision is of few centimeters at 80-140 Hz and decreases with increasing frequency selected in low level processing.


SWOT derived parameters are validated against the nadir derived equivalent. A more accurate river slope parameter is expected from the SWOT high spatial resolution data. Water extent is another new parameter from SWOT, which is used to derive river discharge and water storage change. In rivers, Sentinel-3A pass 156, that is parallel to the river centerline for about 30 km, is a test area for a direct comparison of water height, slope and discharge parameters from nadir-altimeters and SWOT.


In lakes, SWOT water level and water extent are validated against in-situ lake bathymetry, water area extent from Sentinel-1 and Sentinel-2 satellite imagery and water level from nadir-altimeters. In its 21-day phase, SWOT is used to monitor storage change of lakes and reservoirs.

How to cite: Uyanik, H., Chen, J., Fenoglio, L., and Kusche, J.: Monitoring water level and lake extent change with nadir-altimeters and SWOT, EGU General Assembly 2024, Vienna, Austria, 14–19 Apr 2024, EGU24-15723, https://doi.org/10.5194/egusphere-egu24-15723, 2024.

EGU24-16275 | Orals | HS6.5

Cal/Val of HR SWOT products using in-situ networks and in-flight nadir altimetry missions 

Maxime Vayre, Julien Renou, Roger Fjortoft, and Nicolas Picot

The Surface Water and Ocean Topography (SWOT) mission, conducted by CNES and NASA was successfully launched on 16 December 2022. It aims at providing unprecedented 2D observations of the sea-surface height and mesoscale structures as well as water surface elevation, water stocks estimates and discharge over hydrological areas. A SAR-interferometry wide-swath altimeter, namely the Ka-band Radar Interferometer (KaRIn), is designed to cover two 50-km cross-track swaths. During its Calibration (Cal/Val) phase (January to July 2023), SWOT mission provided daily measurements for each swath due to its 1-day repeat cycle. While the spatial coverage during this phase is not as large as for the nominal phase with a 21-day repeat cycle, such short revisit time is relevant for Cal/Val purposes.  


The High Rate (HR) mode of KaRIn, dedicated to hydrology surfaces, provides HR SWOT products that are calibrated during the Cal/Val phase. The performance assessment of these SWOT observations can be achieved through the comparison against reference measurements. Although specific in-situ Cal/Val sites have been purposely designed for the validation of HR SWOT products on lakes and rivers, additional in-situ networks can also be useful, particularly if their spatial coverage allows a monitoring of lakes and rivers also observed by the SWOT mission. Such conditions are met for the French network (SCHAPI), providing several hundreds of georeferenced in-situ stations over rivers, and for the Swiss network (BAFU) which measures water surface elevation of main rivers and lakes. Moreover, the combination of measurements from current nadir altimetry missions (e.g. Sentinel-3, Sentinel-6 or ICESat-2) has also the potential to generate reference measurements on a large number of lakes and rivers. 


Our analysis will essentially propose a preliminary performance assessment of the distinct high-level HR SWOT products during the Cal/Val phase, using existing in-situ networks and measurements from Sentinel-3, Sentinel-6 and ICESat-2. We will first take advantage of hydrological areas being densely monitored below SWOT swaths, which are relevant to assess the quality and current limitations of the products.

How to cite: Vayre, M., Renou, J., Fjortoft, R., and Picot, N.: Cal/Val of HR SWOT products using in-situ networks and in-flight nadir altimetry missions, EGU General Assembly 2024, Vienna, Austria, 14–19 Apr 2024, EGU24-16275, https://doi.org/10.5194/egusphere-egu24-16275, 2024.

EGU24-16780 | Orals | HS6.5 | Highlight

SMASH: a constellation of small altimetry satellites to monitor daily inland surface waters 

Sylvain Biancamaria, Stephane Calmant, Frederic Frappart, Pierre-Andre Garambois, Marielle Gosset, Manuela Grippa, Alexei Kouraev, Pierre-Olivier Malaterre, Simon Munier, Fabrice Papa, Herve Yesou, Thierry Amiot, Cecile Cheymol, and Sophie Le Gac

At global scale, there is still considerable uncertainty about the spatial and temporal variability of water storage and fluxes at the surface of continents. This is even more critical in the context of global climate change and the increasing human pressure on water resources. Despite this context, the following scientific questions remain difficult to answer, due to the coarse spatio-temporal resolution of current data: what is the global distribution of the heterogeneous change undergone by continental surface waters? What is the impact of anthropogenic pressure on water flows and stocks? What is the impact of these changes on the frequency and intensity of hydrological extremes (high and low waters)? To answer these questions, the Global Climate Observing System (GCOS) has identified river levels/discharges and lake/reservoir levels/volumes as essential climate variables, and recommends daily sampling (GCOS, 2022). Besides, extreme events, such as floods or droughts, cover a wide range of spatio-temporal scales. At present, water volume variations can only be observed by satellite at the coarsest scales (and are therefore of interest only for floods on the scale of the world's largest watersheds). The lack of observation of these events in basins with little or no in situ instrumentation is a major issue to understand, simulate and forecast these events. Observing these events globally, at least on a daily scale, would make it possible to quantify local flooding, thus greatly improving our knowledge of these events.

One of the main issue to tackle these questions is the still rather coarse temporal sampling of current satellite missions, particularly altimetry missions. To overcome it, we are proposing the SMall Altimetry Satellites for Hydrology (SMASH) mission. This is a constellation of around 10 compact nadir radar altimeters optimized to provide daily observations of water levels in rivers, lakes and reservoirs along the constellation tracks. The specifications of the SMASH mission are the following: daily temporal sampling, observe water bodies larger than 100 m x 100 m and rivers as narrow as 50 m, with an accuracy on water elevation ~10 cm, and should provide products in near-real time and over the long term (10 years) in open access (open science and FAIR principles).

Combining "high temporal frequency/low spatial frequency" measurements from the SMASH mission with "high spatial frequency/low temporal frequency" measurements from swath altimetry missions (current SWOT or futur Sentinel-3 Next Generation Topography missions) would cover unprecedented time and space scales and should open new fields of research.

How to cite: Biancamaria, S., Calmant, S., Frappart, F., Garambois, P.-A., Gosset, M., Grippa, M., Kouraev, A., Malaterre, P.-O., Munier, S., Papa, F., Yesou, H., Amiot, T., Cheymol, C., and Le Gac, S.: SMASH: a constellation of small altimetry satellites to monitor daily inland surface waters, EGU General Assembly 2024, Vienna, Austria, 14–19 Apr 2024, EGU24-16780, https://doi.org/10.5194/egusphere-egu24-16780, 2024.

EGU24-16879 | ECS | Posters virtual | HS6.5

Advancing Inland Water Body Mapping with Self-Supervised Machine Learning 

Ankit Sharma, Mukund Narayanan, and Idhayachandhiran Ilampooranan

Traditional methods of mapping inland water bodies involve labor-intensive and manual data labeling, limiting their scalability to a larger extent. This study introduces a novel approach: self-supervised machine learning (SSML) for mapping inland water bodies. SSML is a training method where a model learns from data without the need for explicit human-labeled annotations. Using this technique, the study mapped inland water bodies in Pudukkottai, India, using LANDSAT-8 imagery from 2021. The training data for SSML were derived from two spectral indices: the Normalized Difference Vegetation Index and the Modified Normalized Difference Water Index. These indices were used to establish a threshold for automatically generating pseudo labels for two categories: water and non-water. This pseudo-labeled dataset was then utilized to train various machine learning models, including random forest, support vector machine, classification and regression tree, and gradient boosting. The accuracy of the final classified map was assessed using a spatial agreement test, which measures the degree of agreement of the classified map in relation to a reference dataset. The spatial agreement test used the Joint Research Commission (JRC) water map of 2021 as the reference dataset. The final inland water body map, derived from the SSML approach, demonstrated a high spatial agreement of 91% with the JRC water map. Among the SSML models, the random forest model outperformed others due to its ensemble nature. Compared to traditionally supervised classifiers (trained with 137 water points and 74 non-water points), the SSML models exhibited superior performance with a spatial agreement of 91%, significantly higher than the 67% achieved by the supervised model. This study is the first to demonstrate the application of SSML for mapping inland water bodies, offering an efficient and cost-effective alternative to traditional manual labeling. This approach holds significant potential for advancing remote sensing applications, particularly in regions where obtaining ground truth labeling is costly or impractical.

How to cite: Sharma, A., Narayanan, M., and Ilampooranan, I.: Advancing Inland Water Body Mapping with Self-Supervised Machine Learning, EGU General Assembly 2024, Vienna, Austria, 14–19 Apr 2024, EGU24-16879, https://doi.org/10.5194/egusphere-egu24-16879, 2024.

EGU24-17133 | ECS | Orals | HS6.5

Global 1D river bathymetry estimation from remotely sensed observations 

Isadora Rezende de Oliveira Silva, Pierre-Olivier Malaterre, Christophe Fatras, Hind Oubanas, Igor Gejadze, and Santiago Peña-Luque

Flooding has major economic, social, and environmental implications. Its modeling provides insights into potential risks and contributes to the protection of lives, natural resources, and infrastructure. In flood hazard assessment, the topography representation is a key factor as it dictates the water extent resulting from the simulations. In particular, for small and medium flood scenarios, it is imperative to have good knowledge of the modeled in-channel water height, especially for the river's bank full discharge. As these constitute the majority of flood events, the risk assessment is severely impacted by the quality of their estimates. However, the determination of the water profile can be a challenging task in data-sparse areas, as the bathymetry of the river channels is not well described in open-access digital elevation models (DEMs). Using the global coverage of remote sensing derived water levels and extents, this study builds towards a global estimation of river bathymetry. 
The methodology to achieve this can be divided into two parts, the correction of the river topography that can be directly observed by the sensors, above a minimum water level (the dry bathymetry), and the estimate of the part under the minimum observed water line (wet bathymetry). For the improvement of the dry bathymetry, the contours from water masks derived by optical sensors are projected in DEMs and a smooth profile is built from upstream to downstream. The wet bathymetry is calculated using hydraulic simulation and inverse problem methodologies. It requires as inputs the corrected dry bathymetry, observed water surface elevation and slope, and a prior discharge. The algorithm computes the flow using an integrated version of a modified Manning–Strickler’s equation and probability from beta distribution. It computes the roughness and the bottom depth of the section assuming a rectangular shape. 
Preliminary results are promising; a good agreement with in-situ discharge was achieved for the Po River (NSE > 0.8). It shows the potential and importance of accurate estimates of the river bathymetry for future flood monitoring and forecast.

How to cite: Rezende de Oliveira Silva, I., Malaterre, P.-O., Fatras, C., Oubanas, H., Gejadze, I., and Peña-Luque, S.: Global 1D river bathymetry estimation from remotely sensed observations, EGU General Assembly 2024, Vienna, Austria, 14–19 Apr 2024, EGU24-17133, https://doi.org/10.5194/egusphere-egu24-17133, 2024.

EGU24-17653 | Orals | HS6.5

Merits of Data Assimilation on Improving Flood Forecasting - A case study of Ohio Cannelton-Newburgh 

Sophie Ricci, Thanh Huy Nguyen, Andrea Piacentini, Raquel Rodriguez-Suquet, Santiago Pena-Luque, Quentin Bonassies, Christophe Fatras, Brian Astifan, Raymond Davis, Michael Durand, and Stephen Coss

Flooding is represented with a 2D hydrodynamic model over a reach of the Ohio river between Cannelton and Newburgh locks and dams. The geometry of the river and floodplain was provided by the National Oceanic and Atmospheric Administration (NOAA), based on U.S. Army Corps of Engineers (USACE) survey channel data merged with United States Geological Survey (USGS) LiDAR in the overbank regions. The description of hydraulic structures from USACE and in-situ water depth measurements from USGS stations were also used. Working from the 1D HEC-RAS model from Ohio University that covers a much larger area, the friction for our 2D local model was set uniformly over the floodplain. These values were further calibrated to 45 m1/3s-1 over the river bed and 17 m1/3s-1 with in-situ water depth measurements from USGS stations at Cannelton, Owensboro, and Newburgh over high flows periods in 2022 and 2023. 

The performance of the model was first assessed for the significant flooding event in February 2018, with RMSEs of the order of a few tens of centimeters. Remote-sensing (RS) products provided by satellite missions such as Sentinel-1 SAR, Sentinel-2 optical and Landsat-8 optical imagery undoubtedly offer opportunities to improve our ability to monitor and forecast flooding. For this study, the performance of the TELEMAC-2D (www.opentelemac.org) Ohio model was improved with the joint assimilation of in-situ and remote-sensing data within an EnKF framework that accommodates 2D RS-derived observations alongside with in-situ water level time-series. The RS-derived flood extent maps are expressed in terms of wet surface ratios (WSR) in selected subdomains of the floodplain. The assimilation of in-situ data reduces the RMSE to tenths of a centimeter. Ongoing work on the assimilation of WSR aims at improving the dynamic of the floodplain.  This 2D Ohio model will serve as a demonstrative test case for the FloodDAM-DT (https://www.spaceclimateobservatory.org/flooddam-dt) prototype dedicated to flood detection, mapping, prediction and risk assessment.

How to cite: Ricci, S., Nguyen, T. H., Piacentini, A., Rodriguez-Suquet, R., Pena-Luque, S., Bonassies, Q., Fatras, C., Astifan, B., Davis, R., Durand, M., and Coss, S.: Merits of Data Assimilation on Improving Flood Forecasting - A case study of Ohio Cannelton-Newburgh, EGU General Assembly 2024, Vienna, Austria, 14–19 Apr 2024, EGU24-17653, https://doi.org/10.5194/egusphere-egu24-17653, 2024.

EGU24-18194 | ECS | Posters on site | HS6.5

TITRE: ARARAS (Algorithm for Radar Altimetry Retracking on speculAr waveformS), application over the Mana river for long-term multimission Time Series 

Malik Boussaroque, Fernando Niño, Adrien Paris, and Stéphane Calmant

In the context of climate change, it is imperative to have a global understanding of water resources and their use. Long-term water level time series play an essential role in analyzing long-term trends, detecting inter-annual variations, understanding seasonal cycles and estimating long-term hydrological changes. Unfortunately, long time series from in situ stations are seldom available at the global scale, and particularly in remote areas such as tropical forests. Altimetry is emerging as an effective alternative.

We have developed an innovative processing method to optimize the use of historical altimetry missions in low-resolution mode (LRM) and generate extended time series. This retracker uses a physical model to search for sinc-squared patterns in echoes. Adapted to the specific features of each altimeter, it enables the processing of clipped waveforms, a common phenomenon for narrow rivers. This is particularly relevant for Poseidon altimeters, where conventional retracking methods, such as Offset Center of Gravity (OCOG), struggle to produce accurate results with such clipped echoes.

Applying this retracker, we generated time series of water levels along the Mana River in French Guiana, using data from the Jason family missions. These results illustrate the influence exerted on the water cycle by the construction of a run-of-river hydroelectric power plant near Saut Maman Valentin.


Keywords – Altimetry, Jason, Topex/Poseidon, Low Resolution Mode Altimetry, Inland Water Altimetry, River

How to cite: Boussaroque, M., Niño, F., Paris, A., and Calmant, S.: TITRE: ARARAS (Algorithm for Radar Altimetry Retracking on speculAr waveformS), application over the Mana river for long-term multimission Time Series, EGU General Assembly 2024, Vienna, Austria, 14–19 Apr 2024, EGU24-18194, https://doi.org/10.5194/egusphere-egu24-18194, 2024.

EGU24-19761 | ECS | Orals | HS6.5 | Highlight

Establishment of Virtual Station based on Multi-mission Satellites for Near-daily River Discharge Observation 

Debi Prasad Sahoo, Paolo Filippucci, Silvia Barbetta, Sylvain Biancamaria, Alice Andral, Laetitia Gal, and Angelica Tarpanelli

The implementation of action plans for sustainable water resources management requires daily river discharge time series at gauging stations, which are already decreasing in number worldwide. Although the development of remote sensing-based methods for river discharge estimation has proven its effectiveness worldwide, the temporal frequency especially at the daily scale for river discharge estimation is the most important research question to be explored. In this context, the study proposed a methodological framework to establish a virtual station (VS) where the information retrieved from the multi-mission satellites was merged using the non-parametric copula function for river discharge estimation. Here, in the first step, both passive (C/M) and active (altimeter) remote sensing signals can be integrated by deriving the joint probability distribution using the copula functions of the Archimedean family. Subsequently, the Frank copula was evaluated as the best-fit copula function as measured by the goodness-of-fit-test and subsequently selected for establishing the VS by merging the information. The proposed framework was tested on more than 10 rivers around the world. Here, MODIS from Aqua and Terra, Landsat series, and MSI from Sentinel-2 images were used for the C/M approach, whereas SARAL AltiKa, Sentinel-3 A and B, and Cryosat-2 mission altimeters were considered for water level retrieval. The established VSs along the river can be able to derive long near daily discharge time series while evaluating against the in situ discharge with reasonable accuracy measured by Nash-Sutcliffe efficiency, Root Mean Square Error, and Kling-Gupta efficiency. Conclusively, the establishment of this kind of VSs along the river can be able to derive missing discharge data records and long near-daily discharge time series along any world river which is one of the key variables for hydro climatological studies.  

Keywords: Remote Sensing, Virtual Station, Copula, Satellite merging, River Discharge, Altimeters

How to cite: Sahoo, D. P., Filippucci, P., Barbetta, S., Biancamaria, S., Andral, A., Gal, L., and Tarpanelli, A.: Establishment of Virtual Station based on Multi-mission Satellites for Near-daily River Discharge Observation, EGU General Assembly 2024, Vienna, Austria, 14–19 Apr 2024, EGU24-19761, https://doi.org/10.5194/egusphere-egu24-19761, 2024.

EGU24-20523 | Orals | HS6.5 | Highlight

Coupled hydrological-hydrodynamic and data assimilation of the entire river network of the Maroni basin using SWOT river products and other EO missions 

Kevin Larnier, Pierre-André Garambois, Charlotte Emery, Laetitia Gal, and Adrien Paris

The SWOT mission (NASA, CNES, UK-SA, CSA) launched in December 2022 provides observations of surface of inland water bodies at unprecedented resolution and accuracy. Here we focus on the Level 2 river products (heights and widths at 200m scale) and we assess their usability in creating coupled hydrological-hydrodynamic simulations of large scale basin where in-situ data are sparse. First we use an automated toolchain that generates (i) the mesh and processed input data for the hydrological models SMASH [1] or MGB [2], (ii) the coupling points between the hydrological and the hydrodynamic models, (iii) the mesh for the hydrodynamic 1D model (DassFlow-1D [3]) using either SWOT Level2 river observations of water heights and widths or other EO missions (ICESat-2, Copernicus Sentinels).

Then we conduct experiments of data-assimilation of conventionnal altimetry missions (ICESat-2, Sentinel 3), in-situ level heights and SWOT Level 2 river heights in order to correct the unobserved quantities (channel bathymetry and friction coefficient) and the inflow discharges using advanced techniques taking into account correlated effects of control variables and simulated water surface properties. The accuracy obtained using this method is assessed by comparing with the sparse existing in-situ data and in terms of physical consistency of simulated flow signatures with some EO data selected for validation.

This methodology and the inference capabilities are illustrated on the Maroni basin (French Guyana) which is the first application of variational data assimilation over a multi-branch river network at basin scale. A large parameter vector composed of spatially distributed friction coefficient and channel bathymetry plus inflow/lateral hydrographs are successfully estimated at various spatio-temporal resolution given data cocktails of varying spatio-temporal densities and informative content.


[1] SMASH (Spatially distributed Modelling and ASsimilation for Hydrology) -

https://smash.recover.inrae.fr/

[2] https://www.ufrgs.br/lsh/mgb/what-is-mgb-iph/

[3] https://mathhydronum.insa-toulouse.fr/codes_presentation/pres_dassflow/

How to cite: Larnier, K., Garambois, P.-A., Emery, C., Gal, L., and Paris, A.: Coupled hydrological-hydrodynamic and data assimilation of the entire river network of the Maroni basin using SWOT river products and other EO missions, EGU General Assembly 2024, Vienna, Austria, 14–19 Apr 2024, EGU24-20523, https://doi.org/10.5194/egusphere-egu24-20523, 2024.

EGU24-969 | ECS | Posters on site | HS6.6

Integration of Sentinel-1 and Sentinel-2 Datasets for River Discharge Estimation 

Ceren Yazıgülü Tural, Koray K. Yilmaz, and Angellica Tarpanelli

Rivers are corridors of freshwater that provide vital services for sustainable development and ecosystem functioning. Moreover, increase in frequency and severity of droughts and floods due to climatic change necessitates innovative and reliable techniques enabling continuous monitoring of river discharge to effectively manage risk. Since ground-based flow gauging stations are difficult to install and maintain, especially in remote regions, remote sensing methodologies have gained attention over the last decades.

In this study, we integrate Sentinel-1 Synthetic Aperture Radar (SAR) data and Sentinel-2 optical data to make best use of their advantages, namely, observation capability on cloudy-days and higher spatio-temporal resolutions, respectively. In our methodology, we first identify the water surface area at selected river reaches where flow observations are also available. The conceptual framework for computing water surface areas within the specified study boundaries entails the utilization of water indices, specifically the Normalized Difference Water Index (NDWI) and Modified Normalized Water Index (MNDWI), for Sentinel-2 and histogram-based backscattering intensity thresholding for the Sentinel-1 platform. Later, we establish relationships between the computed surface water areas and corresponding flow measurements. The Google Earth Engine (GEE) platform serves as the operational foundation for executing the methodology. We validate the satellite-based discharge estimations using observed in-situ discharge data obtained from three selected USGS gauging stations along the Mississippi River, USA. According to our preliminary results, the coefficient of determination values between estimated and observed discharge datasets range between 0.49-0.79, 0.44-0.77 and 0.49-0.74 for the studied river reaches. The methodology is being tested for other river reaches along the globe to test and improve its river discharge estimation accuracy.

How to cite: Tural, C. Y., Yilmaz, K. K., and Tarpanelli, A.: Integration of Sentinel-1 and Sentinel-2 Datasets for River Discharge Estimation, EGU General Assembly 2024, Vienna, Austria, 14–19 Apr 2024, EGU24-969, https://doi.org/10.5194/egusphere-egu24-969, 2024.

EGU24-1141 | ECS | Orals | HS6.6

Towards Accurate Flood Mapping in Arid Regions: Sentinel-1 SAR-based insights and explainable machine learning.  

Shagun Garg, Antara Dasgupta, Sakthy Selvakumaran, Mahdi Motagh, and Sandro Martinis

Floods are not only frequent but also one of the costliest natural disasters. The use of satellite remote sensing is a cost-effective and widely adopted method for near real-time flood monitoring. Optical satellite imagery excels at distinguishing water from other land cover types by leveraging the spectral behavior in visible and infrared ranges. However, a major limitation of optical sensors is their inability to penetrate through clouds. This results in images with missing information, impeding their use for flood monitoring. In the past decade, Sentinel-1 Synthetic Aperture Radar (SAR) imagery has emerged as a valuable tool in operational flood management, overcoming the challenges posed by optical sensors. SAR is an active imaging technique that provides cloud-free images day and night by utilizing specular reflection from smooth water surfaces. In SAR imagery, water appears dark due to its unique backscatter characteristics. While SAR amplitude has been widely used for flood detection and monitoring, it tends to overestimate flooded areas, especially in arid and semi-arid regions, because the radar backscatter over sand and open water surfaces is similar. 

In our study, we explore the potential of Sentinel-1 amplitude and interferometric coherence in arid-flood mapping. We conduct multiple case studies and employ the random forest method to train, test, and validate our model predictions against flood masks derived from cloud-free optical imagery. We design several scenarios to investigate the contribution of different layers of information in improving flood mapping accuracy in arid regions along with feature importance analysis to understand the role of each feature to reduce model complexity. Our results demonstrate the effectiveness of fusing amplitude and coherence information in flood mapping,  as compared to coherence or amplitude alone. By utilizing the key features derived using permutation feature importance, flood mapping accuracy was significantly improved by approximately 50%, while also reducing response time, which is crucial for effective emergency management. The findings hold promise and emphasize the versatility of the proposed approach across different sensors and scenes. This offers significant potential for global flood mapping in arid regions, particularly in countries with limited resources. As future missions and advancements in SAR systems continue to evolve, the detection capabilities for floods will further improve, leading to enhanced flood management in arid areas. 

How to cite: Garg, S., Dasgupta, A., Selvakumaran, S., Motagh, M., and Martinis, S.: Towards Accurate Flood Mapping in Arid Regions: Sentinel-1 SAR-based insights and explainable machine learning. , EGU General Assembly 2024, Vienna, Austria, 14–19 Apr 2024, EGU24-1141, https://doi.org/10.5194/egusphere-egu24-1141, 2024.

EGU24-1789 | ECS | Posters virtual | HS6.6

Applicability Of Multi-National Digital Elevation Model (DEM) For Cross-Boundary Flash Flood Modeling 

Mohammedawel Jeneto Mohammed

In July 2021, the northwestern European continent experienced a devastating flood caused by unusually high rainfall, resulting in significant socio-economic destruction. One of the areas that was highly affected by this flooding was Southern Limburg (Geul River) in the Netherlands. The Geul River, located between Belgium, Germany, and the Netherlands, posed a challenging situation for modeling the catchment due to its cross-boundary nature. The need to harmonize input datasets from different countries with varying characteristics arose despite the abundance of available data in the study area. This study assesses the feasibility of combining multi-national Digital Elevation Models (DEM) for cross-boundary flash flood modeling purposes.

The quality of the DEM significantly impacts the accuracy of flood dynamics. However, it should be noted that elevation data from various sources creates elevation mismatches, particularly in the overlapping areas between different DEMs. A comprehensive quality assessment is indispensable to ensure the compatibility and reliability of these datasets for hydrology and flood modeling. Thus, To evaluate the accuracy of the DEMs, various statistical measures such as Root Mean Square Error (RMSE), Mean and Standard Deviation (STD) have been calculated. Initially, a pixel-by-pixel-based elevation difference map was generated. Upon analysis, it was observed that the overall elevation differences ranged from -7.0 to 7.0 meters. Despite certain pixels exhibiting pronounced differences in elevation, the overall statistical analysis indicated minimal variation. The calculated RMSE and STD values were both ≤ 0.3 meters for the overlapping parts of the DEM. These errors were considered negligible in relation to the actual slope values and had no significant impact on the flow direction within the catchment. This merged dataset provides a comprehensive representation of the terrain, enabling more accurate and reliable flood modeling simulations compared with calibrated result.

How to cite: Mohammed, M. J.: Applicability Of Multi-National Digital Elevation Model (DEM) For Cross-Boundary Flash Flood Modeling, EGU General Assembly 2024, Vienna, Austria, 14–19 Apr 2024, EGU24-1789, https://doi.org/10.5194/egusphere-egu24-1789, 2024.

EGU24-2941 | Posters on site | HS6.6

Use of Remote Sensing Flood Inundation Maps (FIM) for Evaluating Model-predicted FIM: Challenges and Strategies 

Sagy Cohen, Dan Tian, Anupal Baruah, Hongxing Liu, and Parvaneh Nikrou

Remote sensing (RS)-derived Flood Inundation Maps (RS-FIM) are, in principle, a desirable source of observed data for the development, calibration, and validation of (model) predicted FIM. Advantages of using RS-FIM for evaluating predicted FIM include its spatial continuity (compared to point observations), and the representation of real flooding events (compared to synthetic events (e.g. 100-yr) or other models). Disadvantages may include low/mismatched spatial resolution, insufficient classification accuracy, lack of water depth information, and gaps in coverage (due to dense vegetation, buildings, clouds, etc.). Gaps in inundation coverage are very common in RS-FIM. While these may not be a major issue for some RS-FIM applications, they are a major, yet unacknowledged, issue for fair and robust evaluation of predicted FIM. This is because the evaluated model may correctly predict flooding in these gaps while the (RS-FIM) benchmark data is classified as non-flooded (leading to inaccurate identification of 'False-positives'). Techniques for 'closing the gaps' in RS-FIM using hydraulic models or terrain analysis can yield improved FIM but, depending on the scale of the 'gap-filling', can result in an RS-model hybrid which undermines the observational nature of RS-FIM. Here we will demonstrate and discuss the challenges in using RS-FIM for the evaluation of predicted FIM and present tools and analysis demonstrating a new framework for fair and robust evaluation of FIM predictions using RS-FIM.

How to cite: Cohen, S., Tian, D., Baruah, A., Liu, H., and Nikrou, P.: Use of Remote Sensing Flood Inundation Maps (FIM) for Evaluating Model-predicted FIM: Challenges and Strategies, EGU General Assembly 2024, Vienna, Austria, 14–19 Apr 2024, EGU24-2941, https://doi.org/10.5194/egusphere-egu24-2941, 2024.

EGU24-4031 | Orals | HS6.6 | Highlight

 Satellite Video Remote Sensing for Flood Model Validation  

Christopher Masafu and Richard Williams

Satellite-based optical video sensors are poised as the next frontier in remote sensing. Satellite video offers the unique advantage of capturing the transient dynamics of floods with the potential to supply hitherto unavailable data for the assessment of hydraulic models. A prerequisite for the successful application of hydraulic models is their proper calibration and validation. In this investigation, we validate 2D flood model predictions using satellite video-derived flood extents and velocities. Hydraulic simulations of a flood event with a 5-year return period (discharge of 722 m3 s-1) were conducted using HEC-RAS 2D in the Darling River at Tilpa, Australia. To extract flood extents from satellite video of the studied flood event, we use a hybrid transformer-encoder convolutional neural network (CNN)-decoder deep neural network. We evaluate the influence of test-time augmentation (TTA) – the application of transformations on test satellite video image ensembles, during deep neural network inference. We employ Large Scale Particle Image Velocimetry (LSPIV) for non-contact-based river surface velocity estimation from sequential satellite video frames.When validating hydraulic model simulations using deep neural network segmented flood extents, critical success index peaked at 94% and on average improved by 9.5% when TTA was implemented. We show that TTA offers significant value in deep neural network-based image segmentation, compensating for aleatoric uncertainties. The correlations between model predictions and LSPIV velocities were reasonable and averaged 0.78. Overall, our investigation demonstrates the potential of optical space-based video sensors for validating flood models and studying flood dynamics.

How to cite: Masafu, C. and Williams, R.:  Satellite Video Remote Sensing for Flood Model Validation , EGU General Assembly 2024, Vienna, Austria, 14–19 Apr 2024, EGU24-4031, https://doi.org/10.5194/egusphere-egu24-4031, 2024.

EGU24-5438 | ECS | Posters virtual | HS6.6

A novel framework for the selection of spectral input to pixel-based river discharge estimation model using Sentinel-2 imagery 

Amirhossein Tayebi-Alashti and Mohammad Danesh-Yazdi

While access to discharge data is key to hydrologic studies, it is a serious obstacle in ungauged basins. Currently, Sentinel-2 imagery at high spatiotemporal resolution offers a unique opportunity to infer the relation between pixel-based discharge rate and surface reflectance. One promising approach in this respect has been to find the complex relationship between river discharge and the spectral ratio between two benchmark pixels, namely the wet and dry pixels, whose dynamics resembles river discharge variation. However, this has been challenging due to the adverse impact of soil moisture and mixed land cover on the spectral behavior of the dry pixel. The selection of the wet pixel must also guarantee sufficient sensitivity of its spectral response to water depth fluctuations. To tackle the above issues, in this study, we developed a novel framework that automatizes the selection of the wet and dry pixels by using Sentinel-2 imagery. We also introduced the Normalized Difference Discharge Index (NDDI), as the best band combination, to predict river discharge. We used linear regression with leave-one-out cross-validation as the prediction model, which leverages limited satellite data due to the cloud cover. By implementing the developed framework at multiple gauged points across the continental United States, the best location of the dry pixel was consistently found in urban pixels whose longwave reflectance fall within a certain range. By analyzing the pixel-wised correlation coefficient between surface reflectance at NIR band and river discharge across the studied river widths, we found that the best wet pixels are located along river banks with shallow water depth. These pixels were characterized by the average reflectance higher than the 98th percentile in the green band. Finally, by testing over 4000 band combinations as input to the river discharge prediction model, we found that the normalized difference between B11 and B4 for the wet pixel, as well as the B11 ratioing between the dry and wet pixels yielded the most accurate predictions with R2 = 0.88 and R2 = 0.73, respectively.

How to cite: Tayebi-Alashti, A. and Danesh-Yazdi, M.: A novel framework for the selection of spectral input to pixel-based river discharge estimation model using Sentinel-2 imagery, EGU General Assembly 2024, Vienna, Austria, 14–19 Apr 2024, EGU24-5438, https://doi.org/10.5194/egusphere-egu24-5438, 2024.

EGU24-5543 | ECS | Posters on site | HS6.6

Satellite-based Mapping of Flood Extent in Denmark 

Mark Hansen, Jacob Vejby, and Julian Koch

Floods stand out as the most frequent and costly natural disaster in Europe. In the EU alone, there have been documented more than 1500 flood events since 1980, causing over 4300 deaths and more than €170 billion in economic damages.

Due to the compounded developments of urbanization and climate change, the frequency of floods is expected to increase with severe impacts, possibly endangering lives and leading to economic losses. Moreover, floods mobilize pollutants stored in the subsurface and urban areas. Thus, current efforts, such as coastal barriers, restoration of river courses, or resilient city and landscape planning, focus on reducing vulnerability and risks from flooding. But to implement such measures, detailed information on where and when flooding occurs is necessary. This study aims to improve and implement satellite-based mapping of flood extent under Danish conditions by presenting different methods and algorithms utilizing Sentinel-1 (S1) Synthetic Aperture Radar (SAR) imagery, digital elevation models (DEM) and river geometry. In the broader literature, various methods have been proven to successfully map flood extent, such as deep learning (DL) and change detection (CD) as employed in the Global Flood Awareness System. However, DL require extensive training and labeled data that are often not available, and CD is reliant on a comprehensive pre-processing procedure of antecedent satellite imagery or accompanied with a datacube-based algorithm that exploits the satellite orbit repetition. While these methods can provide excellent results, the steep data requirements and pre-processing procedures hinder practical usage. On the other hand, single-temporal image flood extent mapping algorithms relying on histogram analysis offering a straightforward approach potentially yielding satisfying results, especially when accompanied by techniques such as image decomposition, region-growing, active contour models or image texture algorithms. But for single-temporal image histogram analysis to work in an automated setup, the two main problems, namely class imbalance and class overlap must be addressed properly. This study proposes a novel approach for single-temporal image histogram analysis by combining automatic local histogram thresholding with two image decomposition techniques for image tiling using a quadtree and a novel combination of k-means clustering and box tiling. This study implements a bimodality test and a subsequent local-threshold selection using gaussian mixture modelling and kernel-density smoothening, followed by contextual segmentation using region-growing. Furthermore, a novel approach for improving flood extent segmentation using a combination of DEM information, geographical stream location and region-growing is presented. The proposed method is showcased for two different flood events in Denmark from 2015 to 2022 using 10 x 10 m interferometric wide swath S1 SAR imagery. Results are evaluated using Sentinel-2 optical imagery where available, and otherwise evaluated against high-precision permanent water maps. Moreover, we utilize gauged timeseries of stream water level to evaluate the temporal evolution of flood extent over the period of a flood event.  

How to cite: Hansen, M., Vejby, J., and Koch, J.: Satellite-based Mapping of Flood Extent in Denmark, EGU General Assembly 2024, Vienna, Austria, 14–19 Apr 2024, EGU24-5543, https://doi.org/10.5194/egusphere-egu24-5543, 2024.

EGU24-6430 | ECS | Posters on site | HS6.6

A Stacking Ensemble Method for Comprehensive Flood Susceptibility Mapping in Yemen 

Mustafa Ghaleb, Ahmed Al-Areeq, Nabil Al-Areeq, Radhwan Saleh, Anas AbuDaqa, and Atef kawara

The necessity of flood risk mapping is critical for effective planning and disaster response, particularly in flood-prone regions like the Qaa'Jahran watersheds in Dhamar, Yemen. This research implements various machine learning methods, including Support Vector Machines (SVM), K-Nearest Neighbors (kNN), Random Forest (RF), Artificial Neural Networks (ANN), and Logistic Regression (LR), with the latter also functioning as the meta-model in our stacking ensemble approach for mapping flood susceptibility. The process began with creating a flood inventory map using SAR images and historical flood records. Our model integrates the individual strengths of each technique and employs a meta-model to synthesize their forecasts. This stacked ensemble approach demonstrated superior performance over each model alone, achieving a remarkable AUC score of 0.9848 compared to the individual scores of SVM, LR, kNN, ANN, and RF. It also surpassed two innovative models, ABRBF and TPOT, in accurately pinpointing all high-risk zones identified in historical flood data. This advancement in flood risk mapping for the Qaa'Jahran watersheds exemplifies the potential of our model in enhancing disaster management and prevention efforts. It offers a significant tool for identifying at-risk areas and guiding mitigation strategies to safeguard communities in Dhamar, Yemen, against the catastrophic impacts of flooding.

How to cite: Ghaleb, M., Al-Areeq, A., Al-Areeq, N., Saleh, R., AbuDaqa, A., and kawara, A.: A Stacking Ensemble Method for Comprehensive Flood Susceptibility Mapping in Yemen, EGU General Assembly 2024, Vienna, Austria, 14–19 Apr 2024, EGU24-6430, https://doi.org/10.5194/egusphere-egu24-6430, 2024.

EGU24-8214 | ECS | Posters on site | HS6.6

Multi-source in situ and satellite variational data assimilation into a fully distributed hydrological model for floods and droughts modeling over poorly gauged and ungauged areas 

Mouad Ettalbi, Pierre-Andre Garambois, Nicolas Baghdadi, Emmanuel Ferreira, and Ngo-Nghi-Truyen Huynh

Estimating water flows and stocks in surface hydrology is crucial for addressing important socio-economic issues, such as managing water resources and predicting extreme events like floods and droughts. These challenges become more significant with the ongoing global climate change, which may intensify the hydrological cycle. Advanced modeling tools are necessary for making precise and reliable local forecasts. However, hydrological models, regardless of their complexity and status, encounter difficulties in accurately and reliably predicting quantities of interest such as river flows or soil moisture states, and in accounting for meteorological-climatic effects on hydrology. Given the complexity of the physical processes involved and their heterogeneous and limited observability, hydrological modeling is a challenging task, and internal flows often have significant uncertainties. These uncertainties could be reduced by integrating new observations from remote sensing applied to continental surfaces, which is rapidly evolving. A variety of satellites and sensors now allow the observation of watershed surface characteristics and hydrological responses with increasing spatial-temporal resolutions. In particular, products of soil moisture, evaporation, and land use are now available at relatively high spatial-temporal resolution. This work focuses on improving the integration of satellite and in-situ land surface data into spatially distributed hydrological models. The Hybrid Data Assimilation and Parameter Regionalization (HDA-PR) approach incorporating learnable regionalization mappings, based on neural networks into the differentiable hydrological model SMASH, is modified to account for satellite moisture maps in addition to discharge at gauging stations and basins physical descriptors maps. Regional optimizations are performed on flash-flood-prone areas located in the South of France and their accuracy and robustness is evaluated in terms of simulated discharge and moisture against observations. 

How to cite: Ettalbi, M., Garambois, P.-A., Baghdadi, N., Ferreira, E., and Huynh, N.-N.-T.: Multi-source in situ and satellite variational data assimilation into a fully distributed hydrological model for floods and droughts modeling over poorly gauged and ungauged areas, EGU General Assembly 2024, Vienna, Austria, 14–19 Apr 2024, EGU24-8214, https://doi.org/10.5194/egusphere-egu24-8214, 2024.

Synthetic Aperture Radar (SAR) satellites have emerged as the predominant information source for large-scale flood mapping, owing to their ability to map the Earth's surface regardless of weather conditions. Additionally, the classification of permanent water bodies and inundated areas from SAR images appears to be relatively straightforward given that calm water surfaces show up as dark patches in SAR images. Yet, a naïve approach to water body and flood classification from single SAR images can be misleading for many reasons. Firstly, in most environments SAR sensors under-detect the surface water extent due to challenging land cover and rough water surfaces. Secondly, there are water-look-alike surfaces such as tarmac or grasslands that are misclassified as water. Last but not least, the definition of permanent water bodies, wetlands, and floods is not trivial and only possible when using historic observations as reference. Some of this challenges can be addressed by experts when classifying only a limited set of SAR images. However, the difficulty significantly increases when attempting to map water bodies and floods in a fully automatic manner without prior knowledge of the environmental conditions. This becomes essential, for instance, when investigating the dynamics of wetland areas or the recurrence of floods over extended time periods or regions, or when employing SAR data for near-real-time flood monitoring. In this presentation, I will provide an overview of these challenges, drawing on the outcomes of research on this topic carried out at TU Wien over the last two decades and the preliminary experiences gained from the operationalization of the new fully-automated Sentinel-1 based Global Flood Monitoring service, which is operated as one of the components of the Copernicus Emergency Management Service.

How to cite: Wagner, W.: Scientific challenges when using SAR images for mapping of water bodies and floods everywhere and anytime, EGU General Assembly 2024, Vienna, Austria, 14–19 Apr 2024, EGU24-8642, https://doi.org/10.5194/egusphere-egu24-8642, 2024.

EGU24-11162 | ECS | Orals | HS6.6 | Highlight

Urban Flood Classification in SAR Images 

Rotem Mayo, Tal Ikan, and Adi Gerzi Rosenthal

Detecting flooding in Synthetic Aperture Radar (SAR) satellite imagery is crucial for the ability of Google’s flood forecasting team to train predictive models and identify regions at risk of flooding, making it possible to give prior warning to people in soon to be flooded areas.  However, flood detection in urban areas is currently very poor, preventing the extension of these advanced warning systems to large parts of the population. This is a long known challenge in the field of flood detection using remote sensing methods. In this study, we discuss a possible method to overcome this problem.

SAR satellites are preferred for flood monitoring due to their effectiveness regardless of weather or environmental conditions. They operate by sending pulse signals to Earth and measuring the reflected backscatter. Smooth surfaces like water typically reflect signals away, appearing darker in SAR images. However, in urban areas, the 'Double Bounce' effect caused by 90-degree surfaces, causes larger backscatter, making water detection challenging.

Our methodology involves analyzing abnormally bright pixels in urban areas, attributed to the amplification of the double bounce effect by flooding. We deviate from the traditional thresholding per image approach used in rural settings, instead focusing on the historical brightness levels of each pixel separately to identify significant deviations. We then aggregate the data over large urban areas to infer potential flooding.

We optimize and evaluate the model using a train-validation split of a dataset consisting of approximately 70 urban flood events, manually curated from news stories and paired with corresponding SAR images. The evaluation, which compares these images with randomly selected images, yields a precision of 86% and a recall of 62%.  Acquiring high quality ground truth data proved to be one of the big challenges in this project, and we are currently working on other ways to evaluate the model and improve its accuracy.

These results demonstrate the potential of using SAR images for urban flood classification by focusing on the unique characteristics of urban areas, such as the double bounce effect. This method shows promise in providing alerts and forecasts for urban regions, a crucial need for disaster management. Further research and more accurate ground truth data could enhance the effectiveness and accuracy of detecting urban floods through SAR images.

How to cite: Mayo, R., Ikan, T., and Gerzi Rosenthal, A.: Urban Flood Classification in SAR Images, EGU General Assembly 2024, Vienna, Austria, 14–19 Apr 2024, EGU24-11162, https://doi.org/10.5194/egusphere-egu24-11162, 2024.

EGU24-11215 | ECS | Posters on site | HS6.6

Flood inundation Mapping for the Sept. 2023 Derna, Libya flood event using Sentinel-1 SAR data: An Integration of SAR intensity and interferometric coherence 

M. Sulaiman Fayez Hotaki, Mahdi Motagh, and Mahmud Haghshenas Haghighi

Flood mapping, particularly in data-scarce regions, poses challenges including inadequate observational data to understand the hydrological characteristics of the floods. This study addresses this research gap by utilizing remotely sensed data, specifically Sentinel-1 Synthetic Aperture Radar (SAR) images, to delineate flood extent related to the September 11, 2023 Derna flood event in Libya. The objective is to extract flood extent from both SAR intensity and coherence and integrate these characteristics to generate a confidence flood map.

Our approach involves radiometric terrain correction of SAR data, flood pixel identification using anomaly detection techniques based on SAR intensity, and coherence analysis of pre-and post-flood SAR images. Flooded areas are categorized into 3 main classes. These include (1) High Confidence Flood (HCF), which is the intersection of SAR intensity and coherence in VV and VH bands in both Ascending and Descending directions; (2) Medium Confidence Flood (MCF), extracted from intensity and coherence in either the Ascending or Descending direction in both VV and VH bands; and (3) Low Confidence Flood (LCF), extracted from a single direction in either VV or VH band. LCF includes all pixels not confidently identified as part of either HCF or MCF.  The effectiveness of flood segmentation utilizing the integration of anomaly detection of SAR intensity and coherence analysis method is evaluated through a comparison between Sentinel-1 SAR data and optical Planet imagery.

Our findings indicate HCF covering approximately 8 hectares, MCF covering around 24 hectares, and LCF covering more than 227 hectares. These findings offer valuable insights into the observed flood extent at varying confidence levels. However, the moderate temporal resolution of Sentinel-1 data, with a revisit time of 12 days, introduces challenges in promptly detecting the entire extent of the flood. Overall, this study underscores the significance of remote sensing technology in near-real-time flood monitoring, emphasizing its role in identifying vulnerable areas, prioritizing resources, planning for potential risks, and supporting decision-making in relief efforts.

How to cite: Hotaki, M. S. F., Motagh, M., and Haghshenas Haghighi, M.: Flood inundation Mapping for the Sept. 2023 Derna, Libya flood event using Sentinel-1 SAR data: An Integration of SAR intensity and interferometric coherence, EGU General Assembly 2024, Vienna, Austria, 14–19 Apr 2024, EGU24-11215, https://doi.org/10.5194/egusphere-egu24-11215, 2024.

EGU24-13278 | Orals | HS6.6 | Highlight

Leveraging SWOT's water elevation pixel cloud to comprehend analyse the spatial dynamics of flood events 

Nicolas Gasnier, Roger Fjørtoft, Lionel Zawadzki, Damien Desroches, Santiago Pena Luque, Pottier Claire, Thérèse Barroso, and Picot Nicolas

Satellite data have been used for over 40 years, along with airborne and in situ measurements, for monitoring extreme hydrological events, and enabled major progress in our understanding of floods. The available satellite data have long been mostly limited to imagery (SAR, optical, and thermal) providing a map of the flood extent and conventional nadir altimetry providing a 1-dimensional water elevation along the satellite ground track. Since its launch in late 20232, SWOT has opened a new dimension in space altimetry by providing two-dimensional maps of water elevation. Its main instrument is a near-nadir, bistatic, Ka-band SAR altimeter that uses interferometry to measure the elevation of the water pixels (10-60x22m resolution). Although its revisit time (at least twice per 21-day nominal cycle up to 78° latitude) and spatial resolution limits its usability for operational flood monitoring, SWOT opens new perspectives in the understanding of flood dynamics, particularly if used in synergy with high-resolution imagery and real-time in situ measurements. Indeed, water elevation maps can be used to calibrate and validate hydraulic models through their comparison with the elevation of the modeled free surface at the corresponding point in time. In addition, estimations of the river flows are part of the standard SWOT products distributed on the PODAAC and hydroweb.next platforms.

While the early results on recent flood events demonstrated the utility of the SWOT data for understanding the dynamics of floods, research efforts are still needed to fully leverage its scientific and socioeconomic benefits. On the one hand, there is a scope for improvement in the production of the water elevation pixel cloud from the SLC images: the baseline data processing is dedicated to lakes and river monitoring, and custom processing for flood events may improve the quality of the water elevation data in flooded areas. On the other hand, due to their relative novelty, further adaptations will be needed to operationalize their use for key applications (e.g., more accurate modeling of floods to engineer flood-risk infrastructure, assimilation in operational hydraulic models along with other sources of data, improved risk assessment on buildings through better forecasting of water levels,...). Further research works will be able to draw on SWOT's open data, including the calibration and validation phase, which lasted from end of  March to early July 2023 on selected orbits with a 1-day repeat cycle. This phase enabled SWOT acquisitions every 24 hours for multiple flood events, including the flooding caused by the destruction of the Kakhovka Dam in Ukraine. This high temporal revisit allows for fine-scale analysis of the temporal evolution of the water elevation of the flooded area.

In our contribution, we will present early results on selected examples of flood events, and some scientific and technical issues that we believe to be of particular interest.

How to cite: Gasnier, N., Fjørtoft, R., Zawadzki, L., Desroches, D., Pena Luque, S., Claire, P., Barroso, T., and Nicolas, P.: Leveraging SWOT's water elevation pixel cloud to comprehend analyse the spatial dynamics of flood events, EGU General Assembly 2024, Vienna, Austria, 14–19 Apr 2024, EGU24-13278, https://doi.org/10.5194/egusphere-egu24-13278, 2024.

EGU24-13550 | ECS | Posters on site | HS6.6

Initial steps towards implementation of an early warning system with distributed hydrologic-hydrodynamic modeling for an urban basin with quantitative precipitation estimation (QPE) from meteorology radar. 

Mateo Hernandez Sanchez, Luis Miguel Castillo Rapalo, Pedro Gustavo Silva, and Eduardo Mario Mediondo

Continuous megacities' development, aging infrastructure, and increasing frequency and magnitude of extreme events, the lack of flood resilience becomes a pressing issue due to inadequate planning of existing hydraulic structures to handle future threats. A more resilient urban flood risk management strategy is required to efficiently mitigate the impacts of climate change, particularly floods resulting from river and urban channel overflows. This is evident within the Aricanduva River watershed area in the east zone of São Paulo City, Brazil, a region with flood challenges arise because existent hydraulic infrastructures are ineffective in inundation control, due to extensive urbanization in the lower and middle parts of the basin. To achieve resilience in urbanized areas and reduce the risk of flash floods, the development of Early Warning Systems (EWS) is crucial. An EWS serves as a predictive tool for accurately forecasting water levels in rivers or channels in real-time, providing enough time to take action in order to reduce potential risk. Hydrologic-hydrodynamic models are increasingly employed in EWS to enhance their effectiveness. However, many urban basins lack monitoring systems, whereas products such as meteorological radar represent a feasible option since they effectively capture the spatial and temporal distribution of rainfall. In urban basins like the Aricanduva River, where the quantity and distribution of pluviometers are insufficient to spatially represent an event, the use of Quantitative Precipitation Estimation (QPE) from meteorology radar becomes essential to improve hydrological-hydrodynamic analyses. The objective of this work is to propose the presentation of a distributed hydrological-hydrodynamic model (HydroPol2D) for the Aricanduva basin, calibrated with QPEs from meteorological radar. Additionally, rainfall data from 15 gauges within and around the basin were utilized, covering a 5-year period, to generate spatial rainfall using Inverse Distance Weighted (IDW) interpolation. The results of the two rainfall databases were compared using metrics such as the Nash-Sutcliffe efficiency index, Efficiency of Kling-Gupta (KGE) index, and the percentage of bias to assess model accuracy. The findings indicate that (i) the distributed model coupled with QPEs produces favorable results and better represents the basin's dynamics, (ii) the model accurately reflects the hydraulics of existing flood control infrastructure within the basin, and (iii) the generation of an accurate and rapid rainfall-runoff model forms the initial steps in identifying risk areas, establish critical points for the early warning systems and analyzing the factors contributing to or generating the risk. The next step of this work is to assess the model with more events and to include in the model strategies to automate flow control in existing flood control infrastructures.  

Keywords: Urban flooding risk management, Early Warning Systems (EWS), Hydrological-hydrodynamic models, Radar Quantitative Precipitation Estimation (QPE), Climate Change.

How to cite: Hernandez Sanchez, M., Castillo Rapalo, L. M., Silva, P. G., and Mediondo, E. M.: Initial steps towards implementation of an early warning system with distributed hydrologic-hydrodynamic modeling for an urban basin with quantitative precipitation estimation (QPE) from meteorology radar., EGU General Assembly 2024, Vienna, Austria, 14–19 Apr 2024, EGU24-13550, https://doi.org/10.5194/egusphere-egu24-13550, 2024.

EGU24-13922 | Orals | HS6.6

Developing near-real time flood mapping capabilities in Australia 

Jiawei Hou, Wendy Sharples, Luigi Renzullo, Fitsum Woldemeskel, Christoph Rudiger, and Elisabetta Carrara

Floods rank as the second-most deadly natural hazard in Australia, surpassed only by heatwaves. The ability to monitor flood extent and depth in near real-time is key to mitigating the loss of human life and minimizing the adverse socio-economic and environmental impacts. This study aims to discover the best way to map flood extent and depth in near-real time based on the most up-to-date  available information (i.e., gauge data, hydrological and hydrodynamic models, earth observations) in Australia. High resolution (i.e., 1-5 metres) airborne LiDAR DEMs are available across most of Australia's flood-prone east coast regions. The accessibility  of this information facilitates the creation of detailed, LiDAR-derived Height above Nearest Drainage (HAND) maps, which serve as an essential baseline for accurately mapping flood events. In gauged catchments, we utilized the Bureau of Meteorology’s environmental data management system, WISKI, an API solution that provides access to in-situ water levels at gauged locations across Australia. In ungauged catchments, we routed the Bureau’s operational runoff simulations (AWRA-L v7) using CaMa-flood to estimate flood level dynamics. By integrating these estimates into the HAND mapping approach, we generated a dynamic temporal profile of flood events in near-real time, effectively capturing the spatial-temporal onset, peak, and recession stages of flooding - essential information for emergency services. As the accuracy of the modelling approach is affected by uncertainties from runoff simulation and river morphology parameters, we additionally develop a multi-satellites-based flood monitor system to bolster the accuracy of modelled information. This system utilizes data from multiple medium-resolution satellite sources, including Sentinel-1 and -2, and Landsat -7 and -8/9. By extracting updated remote sensing imagery from Google Earth Engine and Digital Earth Australia, our approach simplifies and optimizes the process of deriving flood extent and depth from satellite and airborne LiDAR observations. Notably, this remote sensing approach significantly reduces interference from clouds, cloud shadows, terrain shadows, and vegetation cover, which are common challenges in optical remote sensing. Additionally, it effectively mitigates the 'double-bounce' effects often caused by vegetation and buildings in Synthetic Aperture Radar (SAR). To verify our end to end near real time flood mapping product, we used ICEYE (commercial SAR company) flood product to benchmark flood maps derived in this study and assessed the feasibilities of developing near-real time flood mapping network in Australia. Crucially, the immediate availability of data is essential in facilitating efficient allocation of resources and safeguarding infrastructure. Simultaneously, near real-time flood mapping plays a crucial role in enhancing community preparedness, allowing for strategic planning and swift action in response to hazardous situations.

How to cite: Hou, J., Sharples, W., Renzullo, L., Woldemeskel, F., Rudiger, C., and Carrara, E.: Developing near-real time flood mapping capabilities in Australia, EGU General Assembly 2024, Vienna, Austria, 14–19 Apr 2024, EGU24-13922, https://doi.org/10.5194/egusphere-egu24-13922, 2024.

EGU24-14669 | ECS | Posters on site | HS6.6

Improving 2D hydraulic modeling in floodplain areas with ICESat-2 data: A case study in Upstream Yellow River 

Monica Coppo Frias, Suxia Liu, Xingguo Mo, Daniel Druce, Dai Yamazaki, Aske Folkmann Musaeus, Karina Nielsen, and Peter Bauer-Gottwein

Climate change intensifies the occurrence of severe flood events, increasing the demand for flood modeling studies. Hydrodynamic models can effectively represent flood events, but they are limited by the quality of available observations. Accurate topographic elevation is essential to replicate channel-floodplain interaction. Elevation is normally retrieved using satellite-based DEMs. However, freely available DEMs have a low spatial resolution, which is a limitation in identifying small-scale channel features in complex floodplain topography. In addition, these products can present issues such as vertical offset, random noise, or vegetation biases. These issues can lead to large errors when used in hydraulic modeling to simulate water levels and inundation extent. FABDEM is a 1 arcsec DEM, that removes forest and building artifacts from Copernicus DEM, but to map complex floodplain topography, finer resolution is needed. ICESat-2 mission offers a large spatial coverage with an along-track resolution down to 70 cm in the ATL03 product. This data product has shown great potential when mapping river topography and identifying small-scale channel features. ATL03 can be used as a control point dataset, to correct biases and refine DEMs

To improve the accuracy of 2D hydraulic models, FABDEM was corrected on selected floodplain areas using supplementary data and machine learning methods. Artificial Neural Network (ANN) was used in the correction of FABDEM. This regression algorithm can predict differences between FABDEM floodplain elevation and ATL03 reference elevation, inputting data from Sentinel-2 and water occurrence maps produced from spectral and SAR imagery. The output floodplain elevation has a reduced vertical offset and a spatial resolution of 10 m, which can detect small-scale channel features. Flood inundation was simulated using the updated DEM. The high computational cost of 2D hydraulic models is a limitation when using discharge time series. To deal with computational cost, discharge classes were defined to represent different inundation scenarios that provide a good indicator for flood risk management, and steady-state inundation patterns were simulated for each discharge class.

The method is demonstrated in a section of the Upstream Yellow River characterized by large floodplains with complex topography, and small-scale channels. Discharge observations from the Jimai in-situ station are used to define discharge classes. The discharge classes are defined by calculating the exceedance probability of a discharge value. The inundation scenarios are simulated for high flow discharge values for an exceedance probability of 25% (Q25) and 10% (Q10), and medium flow discharge values with 50% (Q50), and are compared with the corresponding water occurrence map produced from spectral and SAR imagery for the given discharge class. The critical success index (CSI) of the inundation map improves by about 5% using FABDEM corrected version for Q10 and Q25, and about 4% for Q50. In addition, we observe a consistent Bias reduction of about 20% for Q10 and Q25.

How to cite: Coppo Frias, M., Liu, S., Mo, X., Druce, D., Yamazaki, D., Folkmann Musaeus, A., Nielsen, K., and Bauer-Gottwein, P.: Improving 2D hydraulic modeling in floodplain areas with ICESat-2 data: A case study in Upstream Yellow River, EGU General Assembly 2024, Vienna, Austria, 14–19 Apr 2024, EGU24-14669, https://doi.org/10.5194/egusphere-egu24-14669, 2024.

EGU24-15280 | ECS | Posters on site | HS6.6

Flood risk assessment in the Ganga Basin, India: A multi-criteria geospatial analysis with NASA’s Black Marble Nighttime light Data 

Ekta Aggarwal, Marleen C. de Ruiter, Sophie Buijs, Alexander C. Whittaker, Sanjeev Gupta, Kartikeya S. Sangwan, and Ranjay Shrestha

Changing climate, intense rainfall, and geomorphological conditions within the Indo-Gangetic Basin (IGB) have led to recurring flooding within the area in the recent past. The devastating August 2022 floods in Pakistan affected 33 million people causing severe loss of life and property. The occurrence of such flooding events has increased the need to understand the complexities of the interplay between flood hazards, exposure, vulnerability, and risk. This study delves into flood risk within India's Ganga Basin, examining the flood-inducing factors, vulnerability, and exposure through an innovative approach using NASA's Black Marble Nighttime Lights Product Suite (VNP46).  The product suite, available globally on daily, monthly, and annual composite scales, corrects extraneous sources of noise in nighttime light (NTL) radiance signals and has proven effective in disaster monitoring, risk assessment and reduction, humanitarian response, preparedness, resilience, and sustainable development.

Our work to date has successfully utilized these NTL data to quantify flood exposure and the impact of flooding in both urban and rural areas by analyzing changes in radiance across time and space. However, to improve our understanding of human response to floods, we now focus on a more intricate analysis: incorporating geomorphological and socio-hydrological factors into a risk assessment approach.

Our study evaluates flood hazard, exposure, and vulnerability as three separate entities and combines them using a multi-criterion decision tool to assess flood risk within the basin. Flood hazards are studied as a relationship between geomorphological and hydrological parameters, whereas flood vulnerability is studied using land use and land cover data. The novelty of this research is using NASA’s Black Marble nightlights as a proxy to study flood exposure. We argue that the NTL data can more effectively capture the human presence and economic activities compared to some conventional parameters for flood exposure such as population count, household density, and literacy amongst others. By integrating these diverse data layers using the robust Analytical Hierarchical Process (AHP), we generate comprehensive flood risk maps across the Ganga Basin spanning a decade. The accuracy of these maps is validated against historical flood event data from the EM-DAT database. Ultimately, our research culminates in a spatially explicit and data-driven approach to flood risk assessment, which can empower targeted mitigation strategies and proactive planning within the basin.

How to cite: Aggarwal, E., de Ruiter, M. C., Buijs, S., Whittaker, A. C., Gupta, S., Sangwan, K. S., and Shrestha, R.: Flood risk assessment in the Ganga Basin, India: A multi-criteria geospatial analysis with NASA’s Black Marble Nighttime light Data, EGU General Assembly 2024, Vienna, Austria, 14–19 Apr 2024, EGU24-15280, https://doi.org/10.5194/egusphere-egu24-15280, 2024.

EGU24-15378 | Orals | HS6.6 | Highlight

Earth Observation-Driven Flood Response for Emilia-Romagna: The SaferPlaces Platform 

Paolo Mazzoli, Valerio Luzzi, Marco Renzi, Marianne Bargiotti, Sabrina Outmani, Stefania Pasetti, Stefano Bagli, and Francesca Renzi

In May 2023, the region of Emilia-Romagna, Italy, experienced an unprecedented hydrological event when 350 million cubic meters of rain fell over 36 hours, leading to widespread flooding and landslides. This disaster, affecting 100 municipalities, was compounded by antecedent drought conditions that had decreased the soil's water absorption capacity. Earth observation (EO) data became critical, providing emergency services with the means to assess and manage the catastrophe and facilitate post-event damage evaluation.

The SaferPlaces platform, supported by the ESA InCubed programme, played a pivotal role in disaster response. It provided the Civil Protection of Emilia-Romagna with high-resolution flood water and depth maps, crucial for decision-making in the aftermath of the floods. This cloud-based platform integrates satellite data, climatic records, and AI algorithms to generate global flood forecasts.

Leveraging AI, SaferPlaces processed terrain data alongside inundated area information, combining in situ measurements with satellite data from Copernicus Sentinel-2, CosmoSky-Med, Planet, and SPOT. This was further enriched with local data from municipalities and the Emilia-Romagna Civil Protection, enhancing urban flood area accuracy.

Detailed maps illustrating flood extent in the severely hit municipalities of Faenza, Cesena, Forlì, and Conselice were generated. These contained vital data on water depth and volume, forming the basis for a preliminary Flood Damage Assessment. These assessments were crucial for authorities to estimate economic losses swiftly.

The suite of tailored algorithms within SaferPlaces, extracts flood water masks from satellite imagery. This module, accessible on-demand through a user-friendly interface, requires few parameters from users to accurately delineate flooded areas and contribute to the Global Flood Monitoring system.

The main workflow of algorithm includes the GFM procedure for baseline flood extent retrieval, the Hydraflood method for flood mask extraction via GEE, and the CommSNAP pipeline for processing commercial data. The final output is a flood mask for the area and event of interest, which can also feed into the GFI model to identify flood-prone areas.

This study underscores the essential role of integrated EO and AI technologies in managing hydrological disasters. The SaferPlaces platform's capacity to synthesize multi-source data and provide actionable intelligence marks a milestone in the power of interdisciplinary approaches in enhancing disaster resilience and preparedness.

How to cite: Mazzoli, P., Luzzi, V., Renzi, M., Bargiotti, M., Outmani, S., Pasetti, S., Bagli, S., and Renzi, F.: Earth Observation-Driven Flood Response for Emilia-Romagna: The SaferPlaces Platform, EGU General Assembly 2024, Vienna, Austria, 14–19 Apr 2024, EGU24-15378, https://doi.org/10.5194/egusphere-egu24-15378, 2024.

EGU24-15446 | ECS | Posters on site | HS6.6

Floods automatic rapid mapping through Sentinel-2 MSI multitemporal data 

Valeria Satriano, Emanuele Ciancia, Nicola Pergola, and Valerio Tramutoli

Floods are widespread natural disasters on Earth affecting the planet with increasing frequency and intensity. Climate changes are responsible of the increasing number of heavy and persistent rains generating these destructive events often resulting in fatalities, injuries, and extensive infrastructural damages. A near real time monitoring system able to provide timely and accurate information about location and extent of the flooded areas is crucial for the authorities to implement the right mitigation actions. Currently, the Copernicus Emergency Management Service (CEMS) supports at European level the crisis management activities in the immediate aftermath of a flood, exploiting multi-source satellite data to provide flood delineation with a release time ranging from 7 to 48 hours (from the satellite acquisition). Map characterization and relative information are retrieved through semi-automatic or manual methodologies which do not allow for a complete automation of the analysis crucial to speed up the procedure and shorten the release time.

In this study, carried out in the framework of the MITIGO project (funded by MIUR PON R&I 2014-2020 Program), results coming from a multi-temporal optical satellite technique able to quick detect and accurately map flooded areas will be presented. This technique, namely RST-Flood, exploits the statistical characterization of the satellite observed signal to retrieve accurate background information useful to promptly and automatically identify ground changes directly linked to events occurrence. RST-Flood has already been successfully implemented with mid-low spatial resolution (from 1000 to 375m) optical satellite data sensors (i.e., Advanced Very High Resolution Radiometer, Moderate Resolution Imaging Spectroradiometer, Visible Infrared Imaging Radiometer Suite), and here is for the first time exported to Sentinel-2 Multi Spectral Instrument (MSI) data at mid-high spatial resolution (20m) to study recent floods events. The achieved results demonstrated the easy implementation of RST-Flood to different sensors and geographic areas and its capability in providing fast (processing time less than 15 min from data availability) and robust mapping of flooded areas. Furthermore, its design developed to work in the Google Earth Engine (GEE) environment makes it suitable for global scale implementation without altering its performance.

How to cite: Satriano, V., Ciancia, E., Pergola, N., and Tramutoli, V.: Floods automatic rapid mapping through Sentinel-2 MSI multitemporal data, EGU General Assembly 2024, Vienna, Austria, 14–19 Apr 2024, EGU24-15446, https://doi.org/10.5194/egusphere-egu24-15446, 2024.

EGU24-15576 | ECS | Posters virtual | HS6.6

Resilience Assessment of Flood Detention Zones in the 2023 catchment-scale floods in Hai River Basin, China 

Yiling Lin, Xie Hu, Fang Wang, and Yong Zhao

As a typical flood-prone area, the Hai River Basin (HRB) in the Beijing-Tianjin-Hebei metropolis of China has been struck by devastating floods in history. Since the 1960s, a series of flood-control programmes in the HRB have been launched to reduce the flood risks. As planned, flood detention zones serve as the last line by storing and detaining floodwaters when the water levels exceed the defense limits of reservoirs, levees, and diversion channels. Land use crisis has been a long-lasting problem in China. People are allowed to use the flood detention zones as their residential communities when these zones are not in use. A dual role played by these specific zones requires not only an effective floodwater storage in response to floods, but also an efficient floodwater recession in the aftermath of floods. However, we lack a quantitative assessment of the functionability of flood detention zones. Our study synergizes multi-source SAR images from Sentinel-1 and Gaofen-3 satellites in the framework of deep learning to accurately and efficiently extract inundation paths which evolved for two months encompassing HBR. A joint use of digital elevation model allows us to recover the three-dimensional inundation structures. We also propose the flood detention resilient coefficient based on our derived lifespan of floodwaters. Our results demonstrate that the flood detention zones in HRB can effectively trap the floodwater within to secure lives and properties, but resilience of some flood detention zones can still be improved.

How to cite: Lin, Y., Hu, X., Wang, F., and Zhao, Y.: Resilience Assessment of Flood Detention Zones in the 2023 catchment-scale floods in Hai River Basin, China, EGU General Assembly 2024, Vienna, Austria, 14–19 Apr 2024, EGU24-15576, https://doi.org/10.5194/egusphere-egu24-15576, 2024.

EGU24-16923 | ECS | Posters on site | HS6.6

Flood Segmentation with Optical Satellite Images Under Clouds Using Physically Constrained Machine Learning 

Chloe Campo, Paolo Tamagnone, Guillaume Gallion, and Guy Schumann

Timely and accurate flood map production plays a key role in enhancing effective flood risk assessment and management. Satellite imagery is frequently employed in flood mapping as it can capture flooding across vast spatial and temporal scales. Floods are usually caused by prolonged or heavy precipitation correlated with dense cloudy conditions, posing challenges for accurate mapping.

The Synthetic Aperture Radar (SAR) active sensor is a popular option due to its feature of being weather agnostic, penetrating through clouds, fog, and darkness, providing images for the detection of flooded areas regardless of the weather conditions. However, this advantage is at the expense of low temporal resolution and double bounces in urban and heavily vegetated areas, which increase signal processing difficulty and misinterpretation. Passive microwave radiometry has also been explored for flood mapping, but its coarse spatial resolution limits the utility of the resulting flood maps. Multispectral optical imagery offers a balanced trade-off between temporal and spatial resolutions, with the only limitation that the acquired images might be hindered by the presence of clouds. Capitalizing on the utility of optical imagery, FloodSENS, a machine-learning (ML) algorithm consisting of a SENet and UNet, precisely delineates flooded areas from non-flooded areas in clear and partially clouded optical imagery. Although the current algorithm version enforces flood delineation involving topography-derived information in the ML processing, it is not capable of detecting floods under clouds; thus, we propose a new iteration of FloodSENS that utilizes auxiliary data in post-processing to improve the inferred flood maps.

The post-processing pipeline utilizes the inferred flood map generated by FloodSENS and the Digital Elevation Model (DEM) of the target area to accurately delineate the flood extent beneath clouds, adhering to the physical constraints in the topography. First, Pixels at elevations equal to or lower than the water level are designated as flooded pixels. These pixels are further refined with geoprocessing to establish hydrological connectivity and topographic consistency. Pixels that are both marked as flooded and hydrologically connected are confirmed as flooded pixels for the final flood map.

The post-processing proves essential in tropical and subtropical regions that frequently have high cloud cover during the monsoon seasons, making it imperative to map the affected areas during flooding events. The FloodSENS detection with the post-processing pipeline has been tested on partly clouded optical imagery obtained from the 2023 autumn flooding in southern Somalia.

How to cite: Campo, C., Tamagnone, P., Gallion, G., and Schumann, G.: Flood Segmentation with Optical Satellite Images Under Clouds Using Physically Constrained Machine Learning, EGU General Assembly 2024, Vienna, Austria, 14–19 Apr 2024, EGU24-16923, https://doi.org/10.5194/egusphere-egu24-16923, 2024.

EGU24-16998 | ECS | Posters virtual | HS6.6

Assessing the sensitivity of geomorphological attributes to DEM source and Spatial Resolutions  

Saroj Rana and Sagar Rohidas Chavan

Digital Elevation Models (DEMs)are used for extracting the geomorphological attributes of catchments. These attributes play crucial role in determining the hydrological responses of the catchments. However past research has highlighted the sensitivity of the geomorphological attributes to various DEM sources as well as special resolutions. This study is envisaged to assess the impact of different DEM sources and DEM resolutions on geomorphological attributes proposed by Moussa (2008) on Upper Yamuna River Basin which flows in 5 states (Uttarakhand, Himachal Pradesh, Uttar Pradesh, and Haryana) of India. For this purpose, different DEM sources, Shuttle Radar Topography Mission (SRTM), Advanced Spaceborne Thermal Emission and Reflection Radiometer (ASTER), and Advanced Land Observing Satellite (ALOS) Phased Array type L-band Synthetic Aperture Radar (PALSAR) DEMs are used. To investigate the impact of DEM spatial resolution, 5 different resampled scenarios (grid size 90m, 120m, 150m, 180m, 210m) for each source of DEM was considered using the SRTM 30m DEM as a base DEM. The comparative assessment revealed notable discrepancies in the derived attributes among the DEMs of different resolutions and sources. The evaluation of variation in geomorphological attributes derived from various DEM sources and resolutions, yielded insightful observations. Furthermore, variations were observed between the different satellite sources, highlighting inherent differences in elevation data acquisition and processing methodologies. These findings underscore the critical influence of spatial resolution and data source on the accuracy and reliability of geomorphological attributes derived from DEMs, emphasizing the significance of careful consideration in selecting DEMs for terrain analysis and related applications.

How to cite: Rana, S. and Chavan, S. R.: Assessing the sensitivity of geomorphological attributes to DEM source and Spatial Resolutions , EGU General Assembly 2024, Vienna, Austria, 14–19 Apr 2024, EGU24-16998, https://doi.org/10.5194/egusphere-egu24-16998, 2024.

EGU24-18873 | ECS | Orals | HS6.6 | Highlight

A Comparative Analysis of Flood Frequency Mapping Approaches for Climate-Resilience in South Sudan 

Ignacio Borlaf-Mena, Èlia Cantoni, Antonio Franco-Nieto, Marta Toro-Bermejo, Beatriz Revilla-Romero, Antonio Rodriguez Serrano, Lukas Loescher, Danielle Monsef Abboud, Carlos Domenech, and Clément Albergel

In 2022, South Sudan was ranked as the world’s most vulnerable country to climate change and the one most lacking in coping capacity. Furthermore, it is also one of the world’s most politically fragile nations. The country is facing challenges related to riverine flooding, including four consecutive years of floods (2019-2022) that have displaced hundreds of thousands of people and left many struggling to access food.

Flood extent and frequency mapping based on remote sensing products is being explored by the European Space Agency's Global Development Assistance (GDA) programme's thematic area of Climate Resilience, as a collaboration between GMV and the World Bank in South Sudan.

Floods are mapped with Synthetic Aperture Radar (SAR) imagery from Sentinel-1 (S-1), and the 5-day VIIRS flood fraction product. The former has a native pixel size of 10 m (GRD), whereas it is 375 m for the latter. This resolution disparity is bridged aggregating 9x9 S-1 pixels (which also reduces speckle “noise”) and downscaling the VIIRS product using the flood fraction and the 90 m Copernicus Digital Elevation Model to determine which pixels are more likely to be flooded.

Sentinel-1 flood delineation detects significant deviations from the standard 'dry' stratus using by-track geo-median (sigma-nought) or terrain-flattened gamma-nought image classification. The latter method includes the closest VIIRS 8-day mosaics to prevent false positives in semi-arid regions. Both approaches aim to identify flooding, even beneath vegetation canopies.

Due to the absence of in-situ data, it was not possible to validate the results but an intercomparison was conducted, including different S-1 methods. The downscaled VIIRS product yielded the largest flood extents and frequencies, likely due to its higher imaging frequency (14 h). Consequently, the deviation-based Sentinel-1 products exhibit similar spatial patterns but with lower frequencies and extents due to longer revisit times. These S-1 methods failed to detect flooding in some areas marked as high-frequency flooding by VIIRS, this is attributed to a mischaracterization when the reference image is already flooded. In contrast, the classification-based Sentinel-1 product captured actual flood frequency but was prone to omission and commission errors. Combining maximum flood frequency from both Sentinel-1 products, while masking false positives with VIIRS, reduces errors while preserving maximum spatial detail.

The resulting Earth Observation (EO)-based maps provide key information on the extent, frequency, and persistence of recent flooding seasons (2017-2022). This detailed flood hazard information can raise awareness of flood risk among local institutions and communities. For such purpose, EO data is consolidating its role in helping reduce flood risk to citizens’ lives and livelihoods, as ground data is very sparse across many countries. By combining EO-based flood hazard maps with exposure datasets such as for population, building or crops, we provide additional country-wide information on the potential impacts of recent floods. The service covers the entire country of South Sudan and enables the creation of a flood hazard and exposure index, allowing the World Bank team to detect flooding hotspots and prioritize investment accordingly. These efforts will help the government develop detailed flood risk management plans.

How to cite: Borlaf-Mena, I., Cantoni, È., Franco-Nieto, A., Toro-Bermejo, M., Revilla-Romero, B., Rodriguez Serrano, A., Loescher, L., Monsef Abboud, D., Domenech, C., and Albergel, C.: A Comparative Analysis of Flood Frequency Mapping Approaches for Climate-Resilience in South Sudan, EGU General Assembly 2024, Vienna, Austria, 14–19 Apr 2024, EGU24-18873, https://doi.org/10.5194/egusphere-egu24-18873, 2024.

EGU24-18986 | ECS | Orals | HS6.6

Rapid flood mapping: Fusion of Synthetic Aperture Radar flood extents with flood hazard maps 

Ambika Khadka, Annett Anders, and Ian Millinship

Rigorous flood monitoring by ICEYE is enabled by the large-scale and systematic availability of synthetic aperture radar (SAR) data from the satellite constellation deployed and operated by ICEYE [1, 2]. However, in dense urban areas and under tree canopy cover, using single X-band based SAR images directly for rapid flood detection inherits large uncertainties due to its complex backscattering mechanisms. This study addresses this gap by proposing an approach to rapidly detect flooding in urban areas by merging real-time SAR flood extents from surrounding rural areas with hydrodynamically modeled flood hazard maps. If a flood is fully contained within an urban area, other auxiliary flood evidences are merged with JBA’s high resolution global flood hazard maps at 5 and 30m resolution. 


The precomputed simulation library approach used in Mason et al. 2021 appeared as a challenge, as floods are dynamic in nature [3], they suggested the benefits of using assimilation to integrate SAR data and model outputs in dynamic situations. Thus, the proposed approach builds upon Mason et al. 2021[3] and the framework for improved near real-time flood mapping [2], wherein SAR data is assimilated to enhance future flood predictions and improve the quality of flood hazard maps. This process, in turn, enhances further real-time rapid flood mapping aiding governments, NGOs and disaster responder to make accurate timely decisions in the immediate aftermath of an event. 


References:

[1] Dupeyrat, A., Almaksour, A., Vinholi, J., and Friberg, T.: Deep learning for automatic flood mapping from high resolution SAR images, EGU General Assembly 2023, Vienna, Austria, 24–28 Apr 2023, EGU23-6790, https://doi.org/10.5194/egusphere-egu23-6790, 2023.

[2] Friberg, T., Khadka, A., and Dupeyrat, A.: A framework for improved near real-time flood mapping, EGU General Assembly 2023, Vienna, Austria, 24–28 Apr 2023, EGU23-8520, https://doi.org/10.5194/egusphere-egu23-8520, 2023.

[3] Mason, D.C., Bevington, J., Dance, S.L., Revilla-Romero, B., Smith, R., Vetra-Carvalho, S., Cloke, H.L.: Improving Urban Flood Mapping by Merging Synthetic Aperture Radar-Derived Flood Footprints with Flood Hazard Maps, Water 2021, 13, 1577, https://doi.org/10.3390/w13111577

How to cite: Khadka, A., Anders, A., and Millinship, I.: Rapid flood mapping: Fusion of Synthetic Aperture Radar flood extents with flood hazard maps, EGU General Assembly 2024, Vienna, Austria, 14–19 Apr 2024, EGU24-18986, https://doi.org/10.5194/egusphere-egu24-18986, 2024.

EGU24-19378 | ECS | Posters on site | HS6.6

Integrated GIS analysis for flood risk assessment in Norwegian Rivers: a case study of Sokna river 

Adina Moraru, Raffa Ahmed, Mulubirhan G. Tekle, Knut Alfredsen, and Oddbjørn Bruland

This research aims to simplify and enhance the analysis and visualization of flood-prone areas in Norwegian rivers, with a primary emphasis on Sokna river. Utilizing remote sensing and GIS analysis, our objective is to advance flood risk assessment and management by integrating hydraulic data from numerical models, remotely sensed geomorphic features, and publicly available natural hazard maps. In this study, we develop GIS models, analyze geomorphic features related to erosion and deposition processes, and optimize flood risk analysis using hydro-morphodynamic indicators such as shear stress, stream power, Froude number, Shields formula, and the Hjulström diagram.

To locate flood-prone areas and estimate their severity, different influencing factors to flood risk were identified, among them fluvial dynamics, terrain characteristics, land use, and anthropic activities. Within the 12.65 km lowermost reach of Sokna river, near its confluence with Gaula river and Lundamo urban area, we conducted a comprehensive analysis of the geomorphological features (e.g. river width, soil type), natural hazards maps, and anthropic footprint (i.e. land use, infrastructure, safety measures), supported by hydrodynamics information from HEC-RAS models. Special attention was given to the analysis of sediments, erodible materials, and land use along the riverbanks while integrating flood areas with return periods ranging from 10 to 500 years, as well as other natural hazards such as rockfall- and snow erosion and deposition areas, avalanche records, landslides, debris, and quick clay landslide areas.

A temporal analysis was conducted using orthophotos from 1956, 2011, and 2021. The river channels in these orthophotos, captured in the same month to ensure similar discharges, were digitized to assess changes in river width and deposition processes. Additionally, DEM of Differences (DoD) supported refining documented river changes. The erodible sediment particle size was estimated using the Shields formula based on HEC-RAS model outputs, including Froude number, shear stress, and stream power. The erodible fraction was plotted into Shields and Hjulström diagrams and compared with the soil map. Identified locations with erodible material were complemented with land use data and other anthropic activities. Vulnerable infrastructure to erosion and deposition processes, such as culverts and bridges, were considered in flood risk assessments, with areas having safety measures (such as channel embankments) marked as having lower flood risk.

The step-by-step workflow, integrated into a GIS model using the Model Builder feature in ArcGIS Pro, is replicable for other rivers. These findings provide insights into the factors influencing flood risk, including potential erosion areas, the impact of natural hazards, and the temporal evolution of river channels. This methodology serves as a versatile tool for flood risk assessment and management in other river systems, contributing to the broader field of fluvial geomorphology and hydraulic engineering.

How to cite: Moraru, A., Ahmed, R., Tekle, M. G., Alfredsen, K., and Bruland, O.: Integrated GIS analysis for flood risk assessment in Norwegian Rivers: a case study of Sokna river, EGU General Assembly 2024, Vienna, Austria, 14–19 Apr 2024, EGU24-19378, https://doi.org/10.5194/egusphere-egu24-19378, 2024.

EGU24-20575 | Orals | HS6.6 | Highlight

Low-latency flood inundation mapping with airborne GNSS-R 

Konstantinos Andreadis and Delwyn Moller

The Rongowai project, based in New Zealand, represents a groundbreaking initiative in earth observation using next-generation Global Navigation Satellite Systems Reflectometry (GNSS-R) sensors. A NASA-developed sensor mounted on an Air New Zealand Q300 passenger aircraft collects land-surface and coastal data daily between airport hubs across the country. This project builds upon NASA's CYGNSS constellation, initially designed for sensing ocean surface winds but later expanded to terrestrial sensing due to the sensitivity of GNSS-R measurements to various surface properties of water. The next-generation GNSS-R receiver (NGRx) offers enhanced capabilities beyond CYGNSS, providing increased simultaneous measurements and introducing new measurement capabilities like polarimetry for improved land characterization. The unique mission model of Rongowai emphasizes sustainability while maintaining high-quality observations, utilizing an existing commercial Air New Zealand aircraft for data collection, thereby achieving unprecedented spatio-temporal sampling throughout New Zealand. The Air New Zealand Q300 operates approximately 7-8 flights daily in a hub-and-spoke pattern across major centers in New Zealand, offering near-ideal operational characteristics for capturing dynamic events. Here, we present a system that leverages the flight characteristics of the Q300 to deliver low-latency inundation observations immediately after landing, providing near real-time data transmission from the preceding flight. The framework, named the Flood Assessment Spatial Triage (FAST) addresses the challenge of data latency in flood reconnaissance by providing rapid inundation detection and visualization on an on-demand flight-by-flight basis within an hour after landing. The processing chain of FAST involves geolocation of specular points, coherence detection, and overlaying transects on a high-resolution digital elevation model (DEM) using a simplified flood inundation model. Analysis of GNSS-R waveforms demonstrates the ability to robustly observe inundation even in challenging conditions such as cloud cover, nighttime, and vegetated areas. Our study period captured flooding events in New Zealand's North Island during the Southern hemisphere summer of 2023, particularly in areas affected by Cyclone Gabrielle. The inundation observations from February 2023 depicted regions with surface water not classified as permanent water bodies, and a combination with a physically-based algorithm allowed for mapping flood inundation from the relatively sparse Rongowai observations. Our results align with ground reports of flooding, highlighting the potential for valuable reconnaissance information from GNSS-R when transiting affected regions. Rongowai's higher spatial resolution, combined with its hub-and-spoke flight pattern, enables rapid revisits over affected regions, making it well-suited for dynamic and rapidly evolving processes like floods.

How to cite: Andreadis, K. and Moller, D.: Low-latency flood inundation mapping with airborne GNSS-R, EGU General Assembly 2024, Vienna, Austria, 14–19 Apr 2024, EGU24-20575, https://doi.org/10.5194/egusphere-egu24-20575, 2024.

EGU24-20702 | ECS | Posters on site | HS6.6

 DeepFuse: Towards Frequent Flood Inundation Monitoring using AI and EO 

Antara Dasgupta, Rakesh Sahu, Lasse Hybbeneth, and Björn Waske

Despite the increase in the number of Earth Observation satellites with active microwave sensors suitable for flood mapping, the frequency of observations still limits adequate characterization of inundation dynamics. Particularly, capturing the flood peak or maximum inundation extent, still remains elusive and a major research gap in the remote sensing of floods. Rapidly growing archives of multimodal satellite hydrology datasets combined with the recent deep learning revolution provide an opportunity to solve this problem adequate observation frequency. DeepFuse is a scalable data fusion methodology, leveraging deep learning (DL) and Earth Observation data, to estimate daily flood inundation at scale with a high spatial resolution. In this proof-of-concept study, the potential of Convolutional Neural Networks (CNN) to simulate flood inundation at the Sentinel-1 (S1) spatial resolution is demonstrated. Leveraging coarse resolution but temporally frequent datasets such as soil moisture/accumulated precipitation data from NASA’s SMAP/GPM missions and static topographical/land-use predictors, a CNN was trained on flood maps derived from S1 to predict high-resolution flood inundation. The proposed methodology was tested in southwest France at the confluence of its two main rivers, Adour and Luy, for the December 2019 flood event. The predicted high-resolution maps were independently evaluated against flood masks derived from Sentinel-2 using the Random Forest Classifier. First results confirm that the CNN can generalize some hydrological/hydraulic relationships leading to inundation based on the provided inputs, even for some rather complex topographies. However, further tests in catchments with strongly divergent land-use, hydrological, and elevation profiles is necessary to evaluate model sensitivity towards different land surface conditions. Achieving daily cadence for flood monitoring will enable an improved understanding of spatial inundation dynamics, as well as help develop better parametric hazard re/insurance products to effectively bridge the flood protection gap.

How to cite: Dasgupta, A., Sahu, R., Hybbeneth, L., and Waske, B.:  DeepFuse: Towards Frequent Flood Inundation Monitoring using AI and EO, EGU General Assembly 2024, Vienna, Austria, 14–19 Apr 2024, EGU24-20702, https://doi.org/10.5194/egusphere-egu24-20702, 2024.

Hydrological models are traditionally calibrated using observed flow records. This challenge is magnified in distributed modeling due to the increased dimensionality of the problem, where parameters must be estimated for hydrologically homogeneous subareas (HRUs). Regardless, the estimated flows can present significant inconsistencies, even though the modeled flows are quite similar to those observed. Products derived from remote sensing techniques have been employed to circumvent this problem. In summary, spatial patterns of hydroclimatological variables are used to assess the consistency of the modeled flows. In this study, the mesoscale hydrologic model (mHM) was used to simulate a mesoscale basin in Brazil, located in the savanna biome. In addition to the flows monitored at different fluvial stations, estimates of actual evapotranspiration (AET) and total water stored in the basin (TWS) obtained from remote sensing were used for parameter calibration. Comparison occurred from scenarios where these variables were considered independently, in pairs, and together. The similarity between monitored and modeled flows was assessed using KGE metric, while spatial similarity was characterized through the SPAEF. In the multi-objective scenarios, these indices were aggregated using weightings to compose a single objective function. The results obtained demonstrated that similar degrees of agreement between flows can be obtained for completely disparate spatial flows. Furthermore, the spatial consistency of these flows generally implies a reduction in the similarity between flows. Lastly, the weightings proved to be an interesting alternative, meriting further analysis, as they facilitate the definition of priorities in the search for optimal solutions.

How to cite: Moreira, V., Silva, F., and Welerson, C.: Progressive assessment of multivariate parameter estimation in distributed hydrological modelling using spatial patterns of remote sensing data, EGU General Assembly 2024, Vienna, Austria, 14–19 Apr 2024, EGU24-790, https://doi.org/10.5194/egusphere-egu24-790, 2024.

EGU24-940 | ECS | Orals | HS6.8

Investigation of Spatio-Temporal Variations of Ground and Water Temperatures Using UAV-Based Thermal Camera in the High Arctic Catchments, SW Spitsbergen 

Abhishek Bamby Alphonse, Tomasz Wawrzyniak, Nicole Hanselmann, and Marzena Osuch

The High Arctic region is experiencing rapid climate changes, with rising temperatures impacting one of the most fragile environments on the planet. This study employs Uncrewed Aerial Vehicle (UAV) technology equipped with Zenmuse H20T thermal camera to investigate the spatio-temporal variations of ground and water temperatures in the catchments of Southwest Spitsbergen. The UAV-based thermal imaging provides high-resolution and real-time data, allowing for a comprehensive understanding of temperature dynamics in this remote and challenging environment. The integration of UAV technology and in-situ measurements facilitates the collection of data at unprecedented spatial and temporal scales, allowing for a more detailed analysis of temperature trends and patterns.

The study focuses on assessing ground temperature variations across different land cover types to discern the influence of seasonal variations on these components. Moreover, this study extends its scrutiny to the thermal patterns of Arctic hydrological systems, encompassing channels and ponds. This multidimensional approach enables the identification of flow paths in the catchments, including groundwater intrusion and surface mixing. The study aims to contribute valuable insights into the complex interplay between cryo-, hydro-, and meteorological dynamics in the High Arctic.

The study was carried out with the SONATA BIS project financed by the Polish National Science Centre (grant no. 2020/38/E/ST10/00139).


Keywords: UAV, Zenmuse H20T, Land Surface Temperature, Hornsund, Spitsbergen

How to cite: Alphonse, A. B., Wawrzyniak, T., Hanselmann, N., and Osuch, M.: Investigation of Spatio-Temporal Variations of Ground and Water Temperatures Using UAV-Based Thermal Camera in the High Arctic Catchments, SW Spitsbergen, EGU General Assembly 2024, Vienna, Austria, 14–19 Apr 2024, EGU24-940, https://doi.org/10.5194/egusphere-egu24-940, 2024.

EGU24-2076 | ECS | Posters on site | HS6.8

Enhancing flash flood simulations through appropriate assimilation of remotely sensed soil moisture 

Yan Liu, Yong Chang, Ingo Haag, Julia Krumm, Visakh Sivaprasad, Dirk Aigner, Harry Vereecken, and Harrie-Jan Hendricks Franssen

The precondition of a catchment, especially soil wetness that can affect remaining soil water storage capacity and infiltration rate, is crucial for flash flood generations. Remotely sensed (RS) soil moisture (SM) can provide valuable information on soil wetness, but typically for the top 5 cm soil. Many flash flood hydrological models only have few or even a single soil layer. How to appropriately represent wetness of the entire soil by RS SM becomes crucial for enhancing flash flood simulations with data assimilation (DA). In this study, we propose a new approach to use a certain amount of historical RS SM to derive total soil water storage such that we can assimilate it into flash flood simulations. We applied this approach for the Körsch and Adenauer catchments in Germany, where we assimilated RS SM from the Soil Moisture Active Passive (SMAP) Mission into the Large Area Runoff Simulation Model (LARSIM). Our results show that we can build a good relationship between RS SM considering different antecedent and present data and soil storage using random forest regression compared to linear, polynomial and long short-term memory (LSTM) regressions, resulting in R2 of 0.85 and 0.94 for Körsch and Adenauer, respectively. Using our approach to assimilate RS-derived soil storage into flash flood simulations, performance of flash flood event simulations was improved by an increase of ~0.19 in KGE (Kling-Gupta efficiency) for our study sites. Errors in flash flood peak can be reduced up to 15% compared to simulations without assimilating RS SM. The uncertainty of soil wetness over space was reduced as expected. We examined the possibility of transferring our approach to other RS SM products. We also noticed that despite of the enhancement by assimilating RS SM, the simulation of flash flood is still primarily affected by precipitation uncertainty. In general, we provided a feasible way to use RS SM for hydrological models only with a single soil layer. Future studies applying it to more catchments and events can help to better verify the general validity of our proposed approach.

How to cite: Liu, Y., Chang, Y., Haag, I., Krumm, J., Sivaprasad, V., Aigner, D., Vereecken, H., and Hendricks Franssen, H.-J.: Enhancing flash flood simulations through appropriate assimilation of remotely sensed soil moisture, EGU General Assembly 2024, Vienna, Austria, 14–19 Apr 2024, EGU24-2076, https://doi.org/10.5194/egusphere-egu24-2076, 2024.

This study addresses the need for accurate runoff data for sustainable water resource management in paddy fields, focusing on China, where agriculture consumes more than 62% of freshwater, and paddy rice is the most water-intensive crop. Given the risk of nitrogen and phosphorus loss through runoff, accurate models are crucial for enabling improved irrigation management and assessing agricultural non-point source pollution.

Modern hydrological models range from semi-empirical models, which are deficient in describing the growth phase of paddy, to process-based models that span either single large-scale paddy fields or the entire watershed. However, variations in historical models—and specifically, models such as SWAT-Paddy—indicate significant uncertainties due to the uniform application of irrigation date, amount and drainage outlet height.

This study introduces a novel method that synthesizes the spatial distribution patterns of drainage outlet height and irrigation information (date and amount), while integrating different irrigation and drainage management protocols across various phenological periods. This method uses Google Earth Engine to build a continuous spatiotemporal resolution evapotranspiration model based on multiple-source remote sensing satellites. It also leverages the water balance equation to automatically identify spatiotemporal patterns of runoff at the field scale.

We anticipate that this inclusive, accurate, and automated method will not only facilitate accurate quantification and assessment of paddy runoff but also provide critical data for studying agricultural non-point source pollution. These findings contribute to the existing body of knowledge on paddy water cycle dynamics and highlight the potential of remote sensing technology in addressing data scarcity challenges.

How to cite: Gao, X., Wang, H., and Ren, R.: A new method for modelling key hydrological processes in paddy-dominated watershed based on water balance and remote sensing, EGU General Assembly 2024, Vienna, Austria, 14–19 Apr 2024, EGU24-2814, https://doi.org/10.5194/egusphere-egu24-2814, 2024.

EGU24-7833 | ECS | Orals | HS6.8

Benefits and challenges of daily GRACE(-FO) satellite Data Assimilation (DA) for predicting fast-evolving hydrological processes. 

Leire Retegui-Schiettekatte, Maike Schumacher, and Ehsan Forootan

Terrestrial Water Storage (TWS) from the Gravity Recovery and Climate Experiment (GRACE, 2002-2017) and its Follow-On mission (GRACE-FO, 2018-now) reflects a vertical summation of large-scale mass changes, globally. Better-than-monthly temporally resolved gravity solutions, such as daily GRACE(-FO) data, have the potential to reflect fast evolving hydrometeorological events. In the DansK-LSM project, supported by the Independent Research Fund Denmark (DFF), we will assess for the first time the benefits and challenges of daily GRACE(-FO) TWS Data Assimilation (DA) into a water-balance model (the modified 10 km resolution World-Wide Water Resources Assessment model, W3RA) for fast-evolving flood monitoring. Therefore, our particular interest is to assess to what extent a remotely sensed TWS data, which has a low spatial resolution, can help improving hydrological modelling during flood events. This experiment is performed within the region of the Ganges-Brahmaputra Delta for major floods occurred in 2004, 2007 and 2008. The daily DA is implemented in-house through a daily Ensemble Kalman Filter (EnKF) along with localization. When compared to the monthly solution, the daily TWS DA succeeds at transferring the High-Frequency (HF) GRACE TWS signal into the model (correlation coefficients of 0.97 between GRACE and daily DA TWS). However, the filter encounters some difficulties at accurately disaggregating the TWS into the different vertical water storage compartments (namely affecting the soil water) as well as horizontal grid cells. The observed irregularities are attributed to the very intensive use of ensemble statistics when the DA step is performed on the daily basis. To address this issue, a few possibilities for more stable filters and regularizations are explored and assessed. In this presentation, we will explore the spatial and temporal impacts of these choices.

How to cite: Retegui-Schiettekatte, L., Schumacher, M., and Forootan, E.: Benefits and challenges of daily GRACE(-FO) satellite Data Assimilation (DA) for predicting fast-evolving hydrological processes., EGU General Assembly 2024, Vienna, Austria, 14–19 Apr 2024, EGU24-7833, https://doi.org/10.5194/egusphere-egu24-7833, 2024.

EGU24-8064 | ECS | Orals | HS6.8

Signatures-based appraisal of global rainfall datasets to capture hydrological trends in a meso-scale catchment 

Muhammad Haris Ali, Markus Hrachowitz, Ioana Popescu, and Andreja Jonoski

Precipitation data is a critical input for hydrological models that regulates the spatio-temporal variability of other hydrological fluxes. However, in many regions worldwide, obtaining in-situ rainfall data remains a challenge. In such situations, global rainfall products can be valuable, providing global/regional coverage but these products are susceptible to errors from various factors. Previous studies have assessed the performance of different rainfall products to simulate hydrological models, primarily on their ability to reproduce time series of output variables (streamflow, groundwater level, evapotranspiration, or soil moisture), quantified using various error metrics. While the comparison of time series using error metrics provides insights into general model performance, it may not adequately highlight the capability of these products to simulate specific catchment characteristics, such as groundwater contribution to streamflow, catchment behaviour in high/low flows, etc. Utilizing hydrological signatures can offer additional insights into the hydrological behaviour of the modelled catchment. Therefore, this study aims to evaluate the potential of global rainfall datasets to capture catchment’s hydrological characteristics using a range of hydrological signatures for streamflow and groundwater levels, beyond the traditional time series comparisons.

The analysis was conducted on a meso-scale transboundary catchment, Aa of Weerijs, covering an area of 346 km2. A fully distributed physically based hydrological model coupled with a hydrodynamic model was setup using the MIKE-SHE and MIKE-11 modelling tools of DHI, Denmark. The base model had a grid size of 500 by 500 m and fed with rainfall data from three local gauge stations (2010-2019). Four rainfall products (MSWEP, IMERG, ERA5 land and E-OBS) were shortlisted based on their comparative fine spatial resolution. To achieve the objective, firstly, a direct comparison of rainfall data from these products was conducted against rainfall data from the gauge stations using metrics such as probability of detection, false alarm ratio, equitable threat score and frequency bias. Secondly, the model was run with each dataset, and the performance assessment of the simulated outputs was done using hydrological signatures. The selected signatures included the flow duration curve's (FDC) high-flow segment volume, FDC's mid segment slope, groundwater duration curve, base flow index, runoff ratio, rising limb density, autocorrelation

The findings indicate that the performance of a rainfall product in direct comparison with a gauge station may not consistently align with its effectiveness in simulating model variables. Furthermore, the quantification of a product’s ability to simulate output variables varies depending on the evaluation criteria or metrics used. We advocate for the use of a range of hydrological signatures in the assessment criteria, as it provides additional insights into the capability of global datasets to simulate hydrological responses.

How to cite: Ali, M. H., Hrachowitz, M., Popescu, I., and Jonoski, A.: Signatures-based appraisal of global rainfall datasets to capture hydrological trends in a meso-scale catchment, EGU General Assembly 2024, Vienna, Austria, 14–19 Apr 2024, EGU24-8064, https://doi.org/10.5194/egusphere-egu24-8064, 2024.

EGU24-10585 | ECS | Posters on site | HS6.8

A fusion retrieval approach for monitoring upstream suspended sediment fluctuations using Sentinel-2 imagery 

bowen Cao, Lorenzo Picco, and Xiankun Yang

Remote sense data are increasingly being developed also to accomplish environmental monitoring activities. In the context of climate change, a growing number of extreme events are being observed worldwide, leading to significant changes in surface hydrological processes. This shift is a crucial factor in the alteration of suspended sediment concentration (SSC) in large rivers. Particularly, large rivers originating in the high mountainous regions of Asia and flowing into densely populated areas of Southeast Asia are more susceptible to erosion due to their geomorphic characteristics and intensive human activities. Faced with grand and complex geomorphic conditions, there is a need to adopt a basin-wide perspective by employing a broader array of monitoring methods. This is particularly important for the Pearl River, a major river in southern China. Retrieval of SSC using remote sensing is one of the popular monitoring methods in the past decades. Unfortunately, its application has mainly focused on the estuary and coastal open water. In this study, we place a stronger emphasis on the basin-wide scale, specifically focusing on the upstream and major tributaries. We recalibrated model parameters using a general index model (Gindex) and a regional high-precision model (CSSC). These recalibration results were combined with Sentinel-2 imagery and field data to establish a basin-wide suspended sediment monitoring program. The results of the integrated model fit (n = 29), R2 = 0.95, RMSE = 14.15 mg/L. The modeling results indicated that the spatial distribution of SSC in the upstream and tributaries of the Pearl River showed a clear concentration pattern, with markedly different concentrations in the upstream and downstream reaches. In the upstream, the SSC distribution was clearly divided into two parts, with concentrations of 104.85 mg/L and 13.43 mg/L, respectively, reflecting a substantial difference. It is worth noting that the monthly SSC statistics were clearly seasonal related to the precipitation. May and June were two months with high SSC concentrations in the whole river, with median values of 85.51 mg/L and 106.48 mg/L, respectively. In addition, we observed an abrupt change in suspended sediment downstream of the large reservoirs. This difference is likely caused by the streamflow resulting from the high drop of the dam or channel narrowing. Consequently, we have analyzed the suspended sediment dynamics of both the mainstem and major tributaries of the entire Pearl River. The results will enhance the understanding of suspended sediment changing in large rivers, serving as a valuable complement to water resource management and soil erosion risk assessment.

How to cite: Cao, B., Picco, L., and Yang, X.: A fusion retrieval approach for monitoring upstream suspended sediment fluctuations using Sentinel-2 imagery, EGU General Assembly 2024, Vienna, Austria, 14–19 Apr 2024, EGU24-10585, https://doi.org/10.5194/egusphere-egu24-10585, 2024.

Remote sensing observations have significant potential for the setup and validation of hydrologic models and, consequently, predict runoff hydrographs in regions with limited runoff measurements. This study aims to analyze the spatial-temporal performance patterns of ASCAT soil moisture and MODIS snow cover to calibrate a conceptual hydrologic model in a large number of catchments in Austria. In the first step, the model (TUWmodel) is calibrated using satellite data only. Next, we analyze the regional and seasonal variability in model performance regarding snow cover error, soil moisture correlation and runoff efficiency. We compare the model efficiency of multiple objective calibrations to satellite data only to the performance of various regionalization strategies that transfer model parameters from the most similar catchments. Finally, we propose an alternative calibration strategy that combines satellite observations with a limited number of runoff observations, representing poorly gauged sites. The analyses are performed in 213 catchments in Austria representing diverse climate and physiographic conditions.

How to cite: Khalil, A. and Parajka, J.: Performance of ASCAT soil moisture and MODIS snow cover satellite data for calibration of hydrologic models in poorly gauged catchments, EGU General Assembly 2024, Vienna, Austria, 14–19 Apr 2024, EGU24-11127, https://doi.org/10.5194/egusphere-egu24-11127, 2024.

Hydrological processes, especially snowmelt-related ones, are crucial in water resource management in cold climate regions. Process-based hydrological models, such as the Precipitation-Runoff Modeling System (PRMS), commonly utilize snow depletion curves to describe snowmelt dynamics. Understanding the seasonal variability of snowmelt processes and accurately simulating them through models is essential for assessing water resource sensitivity to various environmental changes in our climate. This study elucidates the relationship between normalized snow water equivalent (SWE) and snow cover area (SCA) in Estonia, northeastern Europe. The snow depletion curves were constructed for 40 gauged river catchments using SWE measurements from the eleven meteorological stations throughout Estonia and SCA data derived from Sentinel-1 and Sentinel-2 satellite imagery from 2016–2022. The resulting snow depletion curve provides valuable insights into the connection between SWE and SCA, allowing for estimating snow water equivalent using remote sensing data in regions lacking on-site measurements. This approach enables the assessment of snowmelt processes in these areas, contributing to improved streamflow and groundwater level forecasts through hydro(geo)logical models. Ultimately, integrating remotely sensed and in-situ data enhances our ability to understand and model the complex interactions between surface water and groundwater at regional and local scales. This research contributes to advancing the field of hydrology and supports informed water resource management decisions.

How to cite: Hunt, M. and Marandi, A.: Snow Cover Area and Snow Water Equivalent Relation in Estonia to Model Surface Water-Groundwater Interactions, EGU General Assembly 2024, Vienna, Austria, 14–19 Apr 2024, EGU24-11758, https://doi.org/10.5194/egusphere-egu24-11758, 2024.

EGU24-12415 | ECS | Posters on site | HS6.8

Applicability of cloud radar observations for an intra-event analysis of runoff on a steep vineyard 

Tatiana Nomokonova, Alexander Myagkov, Marcella Biddoccu, Giorgio Capello, Gerrit Maschwitz, Davide Canone, and Stefano Ferraris

Studying runoff on steep vineyards is an important topic in the agricultural science. Steep vineyards are especially susceptible to soil erosion due to the force of water runoff. Runoff can also carry sediment, pesticides, and fertilizers thus affecting nutrient efficiency and water quality. Understanding of how runoff depends on properties of rain and state of soil can help to improve soil management practices.

There is a number of studies investigating how runoff depends on properties of rain and soil. Typically, the amount of runoff is related to maximum rain intensity, total precipitation, soil water content, etc. Based on a large number of runoff events, often collected over multiple years of observations, the runoff can be represented as a linear regression of the abovementioned variables. However, these linear regressions are highly variable from time period to time period and also among different sites. In order to better understand possible reasons of such variability, a more detailed analysis of single events is required.   

In this study we make an attempt to characterize the water budget within a single rain event. From summer 2023 we have run a measurement campaign at an operational site in the Alto Monferrato vine-growing area (Piedmont, NW Italy). For the campaign the site, which is already well equipped with state-of-the art soil and runoff sampling tools, was complemented by a polarimetric cloud radar. The cloud radar can obtain range-resolved profiles of drop-size distribution with high spatial and temporal resolution. The radar observations can be used to characterize rain and to check how variable rain properties are over the field. The main advantages of cloud radars over conventional in-situ rain sampling devices are much larger sampling volume and range profiling of rain properties.

During the summer and autumn seasons we have already collected more than 10 runoff events with different duration and intensity. The collected dataset allows us to relate runoff to rain and soil properties on intra-event scale. The rain intensity is characterized based on cloud radar observations. The water content is measured by moisture sensors located at three different depth levels. Finally, the amount of runoff is measured using 12 L tipping buckets. The site is split into plots with different soil management in the inter-row. This makes it possible to also investigate how different cover affects the water budget.

How to cite: Nomokonova, T., Myagkov, A., Biddoccu, M., Capello, G., Maschwitz, G., Canone, D., and Ferraris, S.: Applicability of cloud radar observations for an intra-event analysis of runoff on a steep vineyard, EGU General Assembly 2024, Vienna, Austria, 14–19 Apr 2024, EGU24-12415, https://doi.org/10.5194/egusphere-egu24-12415, 2024.

EGU24-12835 | ECS | Orals | HS6.8

Improving Groundwater Recharge Estimation Using Remote Sensing Information in a Multiobjective Calibration. 

Diego Cortes Ramos and Adriana Patricia Piña Fulano

This study aims to enhance groundwater spatiotemporal recharge estimation by incorporating three different sources of remote sensing information into a hydrological model. Traditional approaches for model calibration using flow rates often encounter equifinality issues, as aggregated variables may not adequately represent the spatial behavior of the watershed. To address these limitations, we hypothesized that including spatial information in the calibration process could lead to improved estimations.

The TETIS model was implemented in the Lebrija river watershed, located in the Magdalena middle valley of Colombia. R and Ostrich were used to couple the model with remote sensing data in a multiobjective calibration process with the Pareto archived dynamically dimensioned search algorithm. Subsequently, four calibration scenarios were executed, with the first one as a control scenario using only flow rates. The other three scenarios progressively integrated evapotranspiration and soil moisture remote sensing information. As a validation step, GRACE information was used to calculate recharge and compared with the simulations.

The inclusion of remote sensing information improved the model spatial behavior in 47.9%. And comparations with GRACE also show an improvement representation of groundwater recharge in 31.9%. In conclusion, the incorporation of remote sensing data in the calibration process significantly increased the reliability of groundwater recharge estimations in the model.

How to cite: Cortes Ramos, D. and Piña Fulano, A. P.: Improving Groundwater Recharge Estimation Using Remote Sensing Information in a Multiobjective Calibration., EGU General Assembly 2024, Vienna, Austria, 14–19 Apr 2024, EGU24-12835, https://doi.org/10.5194/egusphere-egu24-12835, 2024.

EGU24-13370 | ECS | Posters on site | HS6.8

Evaluation of Remote Sensing and Reanalysis based Precipitation Products for hydrological studies in Semi-arid Tropics of Tamil Nadu 

Aatralarasi Saravanan, Niels Schuetze, Daniel Karthe, and Selvaprakash Ramalingam

This study provides a comprehensive evaluation of eight high spatial resolution gridded precipitation products in Semi-Arid regions of Tamil Nadu in India, particularly focusing on Coimbatore, Madurai, Tiruchirapalli and Tuticorin. The study regions lack sufficiently long-term and spatially representative observed precipitation data, which is a crucial component for hydrological management. Hence, the present study evaluates the accuracy of five remote sensing-based precipitation products viz. Tropical Rainfall Measuring Mission (TRMM), Precipitation Estimation from Remotely Sensed Information using Artificial Neural Networks – Climate Data Records (PERSIANN CDR), CPC MORPHing technique(CMORPH), Global Precipitation Measurement (GPM) and Multi-Source Weighted-Ensemble Precipitation (MSWEP) and three reanalysis-based precipitation products viz. National Center for Environmental Prediction (NCEP2) Reanalysis 2, European Centre for Medium-Range Weather Forecast (ECMWF) Reanalysis version 5 Land (ERA 5 Land), Modern-Era Retrospective analysis for Research and Application version 2 (MERRA 2) against the station data obtained from the archives of respective Public Works Department. Initially, precipitation products and ground station data were gridded to a common spatial resolution of 0.1 by linear interpolation. The products were then statistically evaluated at multiple spatial (grid and district-wise) and temporal (daily, weekly, monthly and yearly) resolutions for the period 2003-2014. We found that district-wise analysis at monthly and yearly temporal resolution provided better correlation and significantly reduced biases and errors. Evaluation results showed that in terms of overall statistical metrics, ERA 5 Land, MSWEP, PERSIANN CDR and GPM were the best-performing precipitation products, while NCEP2 performed the worst. ERA 5 Land and MSWEP better represented the daily rainfall characteristics with lower Mean Absolute Error and Root Mean Square Error. This study has significant implications for managing hydrological resources by providing valuable guidance when choosing alternative precipitation products in data-scarce regions.


How to cite: Saravanan, A., Schuetze, N., Karthe, D., and Ramalingam, S.: Evaluation of Remote Sensing and Reanalysis based Precipitation Products for hydrological studies in Semi-arid Tropics of Tamil Nadu, EGU General Assembly 2024, Vienna, Austria, 14–19 Apr 2024, EGU24-13370, https://doi.org/10.5194/egusphere-egu24-13370, 2024.

 Many regions, including developing countries, have limited meteorological observation networks and still lack quantitative rainfall data with basin-scale accuracy that can contribute to water-related disaster prediction.

 This study aims to develop satellite precipitation products with quantitative accuracy in basin-averaged precipitation for water-related disaster forecasting. In recent years, deep learning has been utilized in many fields as an experiential statistical model, and CNN is a useful model for estimating precipitation from meteorological satellites. The purpose of this study is developing a satellite precipitation estimation method that can be used for predicting water-related disasters by using CNN and the brightness temperature of clouds and water vapor from the Himawari meteorological satellite.

 The data used were precisely geometrically corrected data from the Himawari meteorological satellite and elevation data from MERIT DEM. The training period was four months during the summer of 2015 through 2021 (July through October), and the validation period was the summer of 2022. The training domain was the northeastern part of Japan, and the validation watersheds were the Arakawa River in the Kanto region (within the training domain) and the Chikugo River in the Kyushu region (outside the training domain). As a result, this study was able to reproduce the basin-averaged precipitation quantitatively with high accuracy within the training domain. Outside of the training domain, precipitation of rainfall events could be reproduced qualitatively and generally, and some rainfall cases were more accurate than GSMaP's accuracy, however there were cases where no rainfall events were misclassified as rainfall events, therefore we still have room of improvement.

How to cite: Fujimoto, K. and Tebakari, T.: Proposal of Hourly Rainfall Estimation Method by CNN Using Meteorological Satellite Himawari and Its Evaluation of Areal Rainfall in a Watershed Scale, EGU General Assembly 2024, Vienna, Austria, 14–19 Apr 2024, EGU24-13465, https://doi.org/10.5194/egusphere-egu24-13465, 2024.

EGU24-14248 | ECS | Orals | HS6.8 | Highlight

Landscape and Burn Severity Controls on Post-fire Snowpack Response in Montane Forests  

David Rey and Graham Sexstone

Wildfire is becoming a more common landscape disturbance in snow-dominated watersheds as burned area extents have increased within high elevation areas that store key snow-water resources for down-stream communities. In snow-dominated watersheds, fire modifies the surface-energy budget that controls, in part, the magnitude and timing of snow accumulation and ablation. While there is growing recognition of fire-induced changes to seasonal snowpack dynamics, post-fire hydrologic studies have generally focused on changes in water quality or stream discharge as opposed to downstream impacts of fire-modified accumulation and ablation. To bridge these gaps, we use a combination of remotely sensed (i.e., satellite, fixed-wing), continuous plot-scale radiative and meteorological observations, and synoptic snow surveys to evaluate snowpack response to wildfire across a range of elevations, aspects, and canopy disturbances at several snapshots in time, and at eight continuously monitored north-south paired study sites. This approach demonstrated that topographic controls on snow distribution such as elevation and aspect still exhibit a stronger control on post-fire accumulation and ablation than wildfire induced changes. Nuanced radiative feedbacks also drove non-intuitive snow distribution patterns across burn-severities, particularly in areas where canopy was only partially combusted. In contrast, regions of lower burn severities where canopy remained unaffected, experienced insignificant changes in post-fire snow accumulation and ablation. Given the rising prominence of wildfire as a key land surface disturbance in snow-dominated watersheds, this work addresses key knowledge gaps currently inhibiting seasonal and long-term prediction of fire’s impact on snow water resources across burn-severities. 

How to cite: Rey, D. and Sexstone, G.: Landscape and Burn Severity Controls on Post-fire Snowpack Response in Montane Forests , EGU General Assembly 2024, Vienna, Austria, 14–19 Apr 2024, EGU24-14248, https://doi.org/10.5194/egusphere-egu24-14248, 2024.

EGU24-16494 | Orals | HS6.8 | Highlight

CNES Earth Observation Programme and our vision for the monitoring of the water cycle 

Sophie Le Gac, Selma Cherchali, Aurélien Carbonnière, Adrien Deschamps, Yannice Faugere, Philippe Maisongrande, and Annick Sylvestre-Baron

The French Space Agency, Centre National d'Etudes Spatiales (CNES), is responsible for shaping and implementing France’s space policy at national, European and international levels. Among its five key domains (launchers, science, Earth observation, telecommunications and defence), the Earth Observation programme is a fundamental pillar which covers a full scope of activities: from science and technology needs and priorities to the development of applications and services, with a strong core in infrastructure and data management.

Earth Observation (EO) is becoming increasingly accurate and essential to tackle major challenges for the future: advancing our understanding of the functioning of the Earth system, in particular the water, energy and carbon cycles, understanding and assessing climate change and its effects, and the impact of humans on the environment. This research and the development of new space missions both contribute to satisfying major societal needs for up-to-date and qualified environmental information. 
CNES, along with its national and international partners, is working to develop and to renew the space infrastructure needed for continuous innovation to address those needs and, on the other hand, support new actors to develop the market.

In this presentation, we will show how CNES EO program addresses the challenges of the monitoring of the water cycle, from the science and climate drivers to the downstream applications, with a focus on current satellite missions’ achievements such as SWOT. 
Ongoing developments and future missions addressing the different components of the water cycle will also be presented: Trishna, a thermal-infrared mission to measure surface temperature of land surfaces and coastal strips at high temporal and spatial resolution; The Atmosphere Observing System AOS, a mission to examine links between aerosols, clouds, convection and precipitation. C3IEL, an innovative mission dedicated to water vapor, convective clouds and lightning, and their impact on climate. ODYSEA, a mission to understand ocean currents and winds, and the sea-air interactions. SMASH, a high-revisit altimetry mission designed to provide river and lakes water level.

How to cite: Le Gac, S., Cherchali, S., Carbonnière, A., Deschamps, A., Faugere, Y., Maisongrande, P., and Sylvestre-Baron, A.: CNES Earth Observation Programme and our vision for the monitoring of the water cycle, EGU General Assembly 2024, Vienna, Austria, 14–19 Apr 2024, EGU24-16494, https://doi.org/10.5194/egusphere-egu24-16494, 2024.

EGU24-16574 | ECS | Orals | HS6.8

Spatio-temporal mapping of groundwater-related flooding using two methods: piezometric levels and Sentinel-2 based remote sensing 

Montana Marshall, Saleck Moulaye Ahmed Cherif, Emmanuel Dubois, Grégoire Mariéthoz, Charlotte Grossiord, and Paolo Perona

The purpose of this study is to assess the efficacy and validity of using piezometric data and remotely sensed data to spatially and temporally map groundwater-related flooding, using Nouakchott, Mauritania as a case study.

Despite a warm and dry climate, the city of Nouakchott in Mauritania has been experiencing constant flooding for nearly a decade, making portions of the city inhabitable and posing long-term health and socio-economic threats. During the rainy season, a combination of factors has led to the increasing frequency and duration of flooding events, including a shallow groundwater table, limitations of the domestic water system, reduced infiltration caused by rapid urbanization, and climate change.

The goal of the study is to better understand and quantify the extent of flooding in the developed areas of Nouakchott, both in space and in time, and to relate this flooding to seasonal and annual fluctuations in precipitation and hydrogeological conditions. To do this, we estimate the presence of flooding from two different perspectives: (1) by analyzing the piezometric levels from a network of 23 piezometers and comparing the interpolated piezometric surfaces to the topographic elevations, and (2) by using Sentinel-2 multi-spectral satellite imagery and machine learning with in-situ training data to identify pixels that are classified as flooded. Flooded area maps are then developed using these two methods for days with available data within the period of record (since 2015 for both data sources). These results are then used to develop a time series of flooded areas for both methods, allowing for comparison and potential validation of the results with each other and with the available in-situ data and observations. Preliminary results show that the piezometric analysis was sensitive to the topographic information and underestimated the flooded area compared to the remote sensing analysis. The remote sensing analysis showed satisfactory accuracy when compared to validation data but does not provide as detailed of information on the hydrogeological dynamics as the piezometric analysis. These findings demonstrate the complementarity of using both methods in tandem.

This estimation of groundwater-related flooding extents and seasonal variability was useful to better understand the relationships between the flooding dynamics and climatic factors, to identify vulnerable areas and communities, and to calibrate hydrogeological modeling. Additionally, this novel and open-source approach can produce critical data for flood risk assessment and planning in under-monitored and data-poor areas, mitigation scenario development, and urban management strategies. Next steps for the project include further linking the two methods by developing a piezometric record from the flooding information obtained from the remote sensing analysis using the temporal change in flooding extents and known topographic information.

How to cite: Marshall, M., Moulaye Ahmed Cherif, S., Dubois, E., Mariéthoz, G., Grossiord, C., and Perona, P.: Spatio-temporal mapping of groundwater-related flooding using two methods: piezometric levels and Sentinel-2 based remote sensing, EGU General Assembly 2024, Vienna, Austria, 14–19 Apr 2024, EGU24-16574, https://doi.org/10.5194/egusphere-egu24-16574, 2024.

EGU24-18211 | ECS | Posters on site | HS6.8

Inferring the storage of aquifer systems from InSAR measurements via flow and geomechanical modelling 

Yueting Li, Baris Caylak, Alper Elçi, Hakan Ören, Claudia Zoccarato, Elif Aysu Batkan, Pietro Teatini, and Claudia Meisina

In hydrogeological science, it is widely acknowledged that the response of an aquifer to groundwater pumping is predominantly influenced by two key parameters characterizing the aquifer system: saturated hydraulic conductivity Ks and the oedometric bulk compressibility cm. The response must be viewed in terms of changes of pore water pressure p and the deformation of the pore volume which traduces in a movement of the land surface. In a confined aquifer system subjected to groundwater pumping, the variation in groundwater pressure is linearly dependent on Ks, while the deformation of the pore volume is linearly dependent on cm. However, cm also impacts p, particularly the speed of pressure variation over time, as aquifer specific storage Ss is also dependent on cm. The dependency p - cm can be considered “weaker” than that p - Ks.  The RESERVOIR Project, funded by the EU-PRIMA Programme, aims to characterize aquifer properties, with a focus on Ss, by optimizing the use of the available measurements. Pressure measurements from piezometers provide fundamental information to quantify Ks through the groundwater flow equation. Additionally, displacement measurements of the land surface provided by InSAR can be optimally used in equilibrium equations to constrain cm (and consequently Ss). This objective is achieved through a novel procedure utilizing a 3D groundwater flow simulator (MODFLOW) and a 3D geomechanical simulator (GEPS3D) in an iterative one way coupled approach. Spatial variations of Ss and Ks are mathematically described as stationary Gaussian random fields. The procedure is applied to characterize the properties of the alluvial aquifer system in the eastern portion of the Gediz River basin, Turkey. In this region, groundwater withdrawal for irrigation has led to a general decline in pore water pressure and land subsidence of up to 10 cm/year over the past decade. The convergence of the procedure was achieved after four iterations, highlighting the presence of considerable heterogeneity in the distribution of parameters. This heterogeneity cannot be effectively constrained without the aid of satellite-based earth observation measurements.

How to cite: Li, Y., Caylak, B., Elçi, A., Ören, H., Zoccarato, C., Batkan, E. A., Teatini, P., and Meisina, C.: Inferring the storage of aquifer systems from InSAR measurements via flow and geomechanical modelling, EGU General Assembly 2024, Vienna, Austria, 14–19 Apr 2024, EGU24-18211, https://doi.org/10.5194/egusphere-egu24-18211, 2024.

High-resolution gridded 2 m air temperature datasets are important input data for global and regional climate change studies, agrohydrologic model simulations and numerical weather predictions, etc. In this study, the digital elevation model (DEM) is used to correct temperature forecasts produced by ECMWF. The multi-grid variation formulation method is then used to fuse the data from corrected temperature forecasts and ground automatic station observations. The fused dataset covers the area over (0–60°N, 70–140°S), where different un-derlying surfaces exist, such as plains, basins, plateaus, and mountains. The spatial and tem-poral resolutions are 1 km and 1 h, respectively. The comparison of the fusion data with the verification observations, including 2400 weather stations, indicates that the accuracy of the gridded temperature is superior to European Centre for Medium-Range Weather Forecasts (ECMWF) data. This is because a more significant number of stations and high-resolution terrain data are used to generate the fusion data than are utilized in the ECMWF. The obtained dataset can describe the temperature feature of peaks and valleys more precisely. Due to its continuous temporal coverage and consistent quality, the fusion dataset is one of China’s most widely used temperature datasets. However, data uncertainty will increase for areas with sparse observa-tions and high mountains, and we must be cautious when using data from these areas.

How to cite: Han, S.: Development and Evaluation of A Real-Time Hourly One-Kilometre Gridded Multisource Fusion Air Temperature Dataset in China Based on Remote Sensing DEM, EGU General Assembly 2024, Vienna, Austria, 14–19 Apr 2024, EGU24-18649, https://doi.org/10.5194/egusphere-egu24-18649, 2024.

Agricultural drought monitoring using high resolution soil moisture information is particularly useful for management of precision agriculture and drought early warning studies. The soil moisture products obtained from different active microwave remote sensing satellites may not be appropriate for local-level drought studies due to their limited spatial resolution. This study aims to accurately estimate surface soil moisture (SSM) by utilizing high-resolution multispectral imagery available from the Landsat 8 OLI (Optical Land Imager) mission for monitoring agricultural droughts using soil water deficit index (SWDI). The study demonstrates that using the Landsat-derived SWDI at a spatial resolution  of 30 m, and at bimonthly scale, can provide drought information for use in precision irrigation especially at watershed-scale. The red, green, near infrared (NIR), and short-wave infrared (SWIR) bands of Landsat 8 after atmospheric and geometric correction, are utilized for estimating SSM in this study, by considering popular vegetation indices such as normalized difference vegetation index (NDVI), normalized difference moisture index (NDMI), and normalized difference water index (NDWI), as inputs. Field-monitored soil moisture data available for an agricultural watershed in eastern India during 2016-2017 are utilized for SSM model development. The SSM estimation model is developed using conventional linear regression and artificial neural networks (ANN) models. The conventional linear regression algorithm gave correlation coefficient (R) of 0.60 and mean square error (MSE) of 0.012 cm3/cm3. Whereas, the machine learning-based ANN model has performed SSM estimation with R and MSE of 0.67 and 0.011 cm3/cm3 respectively. Further, the study utilized SSM based on the ANN technique for estimation of SWDI at 30 m resolution for long-term drought monitoring over the study watershed. Based on the computed SWDI, seasonal variations in agricultural drought patterns are also evaluated for the study area.
Keywords: Agricultural Drought Monitoring, Surface Soil Moisture, Remote Sensing, Landsat-8, Vegetation Indices, Machine Learning

How to cite: Atnurkar, A. and Ramadas, M.: Integrating Remotely Sensed and Field-monitored Soil Moisture Data for High Resolution Agricultural Drought Monitoring, EGU General Assembly 2024, Vienna, Austria, 14–19 Apr 2024, EGU24-19748, https://doi.org/10.5194/egusphere-egu24-19748, 2024.

EGU24-20083 | Posters on site | HS6.8

Enhancing the rain/no-rain identification in remote sensing-based rainfall products: what impact on streamflow simulation 

Hamza Ouatiki, Taoufik Shit, and Abdelghani Chehbouni

The daily remote sensing-based rainfall estimates have often been problematic in several regions around the globe. This is particularly prevalent in semi-arid regions where, in addition to misestimating the magnitude of the rain events, the spatial rainfall products (SRP) often fail to detect many events correctly. Whether missed or falsely detected, misestimating many events is a real constraint in running (calibrating/validating) hydrological models. Thus, here we are attempting to enhance the capability of some of the well-known SRPs (GPM IMERG, PERSIANN-CDR, and CHIRPS) in rain/no-rain identification (using ancillary data) and how that can impact predicting the hydrological response. To this end, the SRPs were used to drive the HBV and GR4j conceptual hydrological models in watersheds from different climatic contexts.

Using the raw SRPs, the performance of the HBV and GR4j models was relatively poor and temporally unsteady. This was primarily due to uncertainties associated with the SRP estimates. Even the best-performing product (GPM IMERG), was found to largely misestimate rainfall up to 50%. In particular, a prevalence was also observed in terms of detection capacity with non-negligible missed events (according to POD; Probability Of Detection) and many rainfall events detected as false alarms (according to FAR; False alarm Ratio). However, the SRPs blended with remote sensing-based ancillary data allowed us to relatively enhance the streamflow simulation, particularly using the HBV model. This enhancement was possible as using ancillary data allowed us to reduce the number of false alarms and recover some of the missed events. Still, some bias persists in the SRPs, which can be addressed by incorporating in-situ observations employing conventional (e.g., Scaling Factor, CDF matching…) and AI-based bias correction techniques.

How to cite: Ouatiki, H., Shit, T., and Chehbouni, A.: Enhancing the rain/no-rain identification in remote sensing-based rainfall products: what impact on streamflow simulation, EGU General Assembly 2024, Vienna, Austria, 14–19 Apr 2024, EGU24-20083, https://doi.org/10.5194/egusphere-egu24-20083, 2024.

Water clarity is a widely used indicator to monitor water quality and ecological status of lakes. It has been routinely assessed through in situ measurements of the Secchi disk depth (ZSD). Remote sensing (RS) of this parameter could beneficially complement the sparse in situ data set but still remains dependent on the availability of ground-truth data to be validated.

Here, high-spatial resolution satellite missions were compared with in situ ZSD in various water bodies in France . Our objective is to evaluate the contribution of remote sensing for densifying transparency monitoring in the framework of the WFD. First, Sentinel-2 MSI images were processed for atmospheric-correction (AC) and sunglint removal. Then, we applied a pixel-classification by Optical Water Types to infer bio-optical properties of waters, enabling to characterise optically-active compounds in waters to decipher the applicability, and ultimately tune standard ZSD retrieval algorithms. Based on our in situ database, 577 matchups over 76 lakes and reservoirs were successfully established between in situ and satellite data.

Overall performances of the retrievals are satisfactory with RMSE: 1.91 m (40%), MAPE: 46 %, bias: -0.5% and r2: 0.52. This study shows that performances are highly variable with respect to the identified optical water types. Best performances are achieved in clear waters (ZSD > 5m) with RMSE: 1.85 m (35%), MAPE: 37% bias : 8%. On the contrary, turbid waters exhibit larger discrepancies. In case of sediment-laden waters, performances fall to RMSE: 2.8 m (57%), MAPE: 71 %, bias = -34% and r2 = 0.40 while it is even worth in case of hyper-eutrophic waters, due to massive phytoplankton bloom with RMSE: 0.9 m (75%), MAPE: 49 %, bias = -57% and r2 = 0.06.

Nevertheless, those performances make it possible to critically map ecological classes between “high” and “bad”, and to monitor long term tendencies. Optical classification allows criticising the applicability and accuracy of generic RS retrieval algorithms to a country-scale area. It also brings a qualitative interpretation on the factors of degradation of the water quality related to the decrease of transparency, either by increasing sediment content, dissolved carbon inputs or during phytoplanktonic blooms events. Therefore, it provides a additional and valuable information for many users interested in evaluating the ecological status of inland water bodies from RS data such as academics, authorities and stakeholders.

How to cite: Morin, G., Reynaud, N., Harmel, T., Coqué, A., and Tormos, T.: Water clarity derived from multispectral imagery by semi-analytical algorithm in association with optical water types to classify inland waters into ecological classes: sensitivity study case in France., EGU General Assembly 2024, Vienna, Austria, 14–19 Apr 2024, EGU24-20537, https://doi.org/10.5194/egusphere-egu24-20537, 2024.

The Mediterranean region is warming 20% faster than the global average. In addition, climate change is expected to exacerbate this situation in the next decades by increasing potential evapotranspiration, decreasing rainfall and increasing the frequency and intensity of droughts. During the last two years, many irrigated areas of Spain have already suffered from water shortages due to lack of water in reservoirs. In some cases, this has led to impose severe restrictions on water allocations of irrigation districts (ID). Since yield is inextricably linked to the amount of water used by plants, the primary effects of water shortage often appear on crop production. However, water restrictions may vary among irrigation districts, among others, depending on the total available water in the reservoir, land uses, or level of modernization. Thus, any imposition of water restriction has a different impact on crop productivity depending on these parameters. From a decision-making point of view, it would be very useful for watershed policy makers to have a tool capable to simulate the impact of decreases in rainfall and/or water restrictions on crop productivity at irrigation district and/or catchment level. Therefore, this study introduces a novel approach to assess the impact of different climate scenarios and restrictions of irrigation water allocations on crop productivity. The study was conducted in a total of eight irrigation districts located in the north-east Ebro basin (Catalonia, Spain), with different water allocations, which corresponded with a total irrigated area of 150,028 hectares. The following six scenarios were simulated: Control, without water restrictions; Pr25 and Pr50, a reduction in rainfall of 25 and 50%, respectively; Irri25, Irri50, Irri75, a reduction of irrigation water allocation of 25, 50 and 75%, respectively. The crop water productivity functions defined in the literature for multiple crops were used. In addition, actual crop evapotranspiration (ETa) was estimated daily at 20 m resolution using a remote sensing two-source energy balance model with Copernicus-based inputs. Overall, results showed that averaged ETa of all irrigation districts decreased by 14, 19, 29, 50 and 66% respectively for Pr25, Pr50, Irri25, Irri50, Irri75 in comparison to Control. On the other hand, yield losses varied among irrigation districts. Those IDs with higher water allocations showed a significant decrease in yield of around 27% in comparison to Control for scenarios Pr25, Pr50, Irri25 and Irri50, without significant differences among them. On the other hand, yield decreased by 72% in the Irri75. Instead, other irrigation districts with very low water allocations observed an averaged significant decrease in yield of 62% in comparison to Control in all the scenarios. A detailed analysis of the impact of the six simulated scenarios on crop productivity of each irrigation district and crop type is also conducted in this study.

How to cite: Bellvert, J., Casadesus, J., Pamies-Sans, M., and Girona, J.: Assessment of the impact of drought and restrictions on irrigation district water allocations on yield using a remote sensing for evapotranspiration approach, EGU General Assembly 2024, Vienna, Austria, 14–19 Apr 2024, EGU24-1394, https://doi.org/10.5194/egusphere-egu24-1394, 2024.

EGU24-1837 | ECS | Orals | HS6.9

Retrieving the irrigation actually applied at district scale: assimilating high-resolution Sentinel-1-derived soil moisture data into a FAO-56-based model 

Pierre Laluet, Luis Enrique Olivera-Guerra, Víctor Altés, Giovanni Paolini, Nadia Ouaadi, Vincent Rivalland, Wouter Dorigo, Lionel Jarlan, Josep Maria Villar, and Olivier Merlin

Irrigation is the most water consuming activity in the world. Knowing the timing and amount of irrigation that is actually applied is therefore fundamental for water managers. However, this information is rarely available at all scales and is subject to large uncertainties due to the wide variety of existing agricultural practices and associated irrigation regimes (full irrigation, deficit irrigation, or over-irrigation). To fill this gap, we propose a two-step approach based on 15 m resolution Sentinel-1 (S1) surface soil moisture (SSM) data to retrieve the actual irrigation at the weekly scale over an entire irrigation district. In a first step, the S1-derived SSM is assimilated into a FAO-56-based crop water balance model (SAMIR) to retrieve for each crop type both the irrigation amount (Idose) and the soil moisture threshold (SMthreshold) at which irrigation is triggered. To do this, a particle filter method is implemented, with particles reset each month to provide time-varying SMthreshold and Idose. In a second step, the retrieved SMthreshold and Idose values are used as input to SAMIR to estimate the weekly irrigation and its uncertainty. The assimilation approach (SSM-ASSIM) is tested over the 8000 hectare Algerri-Balaguer irrigation district located in northeastern Spain, where in situ irrigation data integrating the whole district are available at the weekly scale during 2019. For evaluation, the performance of SSM-ASSIM is compared with that of the default FAO-56 irrigation module (called FAO56-DEF), which sets the SMthreshold to the critical soil moisture value and systematically fills the soil reservoir for each irrigation event. In 2019, with an observed annual irrigation of 687 mm, SSM-ASSIM (FAO56-DEF) shows a root mean square deviation between retrieved and in situ irrigation of 6.7 (8.8) mm week-1, a bias of +0.3 (-1.4) mm week-1, and a Pearson correlation coefficient of 0.88 (0.78). The SSM-ASSIM approach shows great potential for retrieving the weekly water use over extended areas for any irrigation regime, including over-irrigation.

How to cite: Laluet, P., Olivera-Guerra, L. E., Altés, V., Paolini, G., Ouaadi, N., Rivalland, V., Dorigo, W., Jarlan, L., Villar, J. M., and Merlin, O.: Retrieving the irrigation actually applied at district scale: assimilating high-resolution Sentinel-1-derived soil moisture data into a FAO-56-based model, EGU General Assembly 2024, Vienna, Austria, 14–19 Apr 2024, EGU24-1837, https://doi.org/10.5194/egusphere-egu24-1837, 2024.

EGU24-3839 | ECS | Posters on site | HS6.9

Assessing Global Climate Datasets for Small-Scale Agricultural Applications: The Case of Nemea, Greece 

Evangelos Dosiadis, Aikaterini Katsogiannou, Evangelos Nikitakis, Eleni Valiantza, Stylianos Gerontidis, Konstantinos Soulis, and Dionissios Kalivas

In recent years, extensive research has been conducted to evaluate various surface-, satellite-, and reanalysis-based gridded datasets of climatic variables on a global scale. However, a noticeable gap exists in understanding their effectiveness and accuracy in agricultural applications, particularly in very small-scale areas. While these datasets have proven valuable for assessing global climate patterns, their translation to on-the-ground impacts, especially in agricultural landscapes, remains a challenge. The complexities of agricultural systems, including irrigation management, farming practices, and responses to extreme weather events, demand a closer examination of the suitability and precision of existing climate datasets for informed decision-making in the agricultural sector.

This study seeks to address this gap by focusing on the wine-making region of Nemea, Greece, providing valuable insights into the utility of global climate datasets in agricultural applications and especially irrigation management to streamline precision irrigation management in regions where data scarcity prevails. The primary objective is to explore the applicability of diverse global climate datasets in small-scale areas, emphasizing the unique challenges posed by the very high spatial variability in regions characterized by complex landscapes, very steep relief, and very small farms. The study delves into the intricacies of irrigation management, and the impact of extreme temperatures on vine stress.

The methodology employed involves leveraging a variety of open-source global climate datasets, which are subsequently evaluated for accuracy through validation against local meteorological stations data. A network of 10 agrometeorological stations located throughout the wine-making region of Nemea will be used. The key variables under scrutiny include the variables related to irrigation and crop management, i.e. precipitation, air temperature, air humidity, wind velocity, and solar radiation. The applied methodology includes the assessment of the characteristics of the available grided datasets; the evaluation of the grided datasets accuracy in general and for specific conditions (e.g. heatwaves, frost days, storms etc.); and the comparison of optimum irrigation schedules compiled using detailed meteorological data obtained by local agrometeorological stations for a five-year period with the corresponding schedules compiled using the gridded datasets under evaluation. The effects of gridded datasets inaccuracies on crops development, crop stress, and crop yield quality and quantity are also evaluated.

The results demonstrate the clear influence of spatial resolution on data accuracy. The study underscores the significance of selecting datasets with an optimal spatial resolution to enhance the precision of climatic variables in large-scale areas. This insight contributes to the broader discourse on the practicality and limitations of employing global climate datasets in small scale agricultural applications in regions characterized by complex landscapes. Insights on relevant downscaling and correction methodologies are provided.  

How to cite: Dosiadis, E., Katsogiannou, A., Nikitakis, E., Valiantza, E., Gerontidis, S., Soulis, K., and Kalivas, D.: Assessing Global Climate Datasets for Small-Scale Agricultural Applications: The Case of Nemea, Greece, EGU General Assembly 2024, Vienna, Austria, 14–19 Apr 2024, EGU24-3839, https://doi.org/10.5194/egusphere-egu24-3839, 2024.

EGU24-5126 | ECS | Orals | HS6.9

Synthesizing regional irrigation data using machine learning – towards global upscaling via metamodeling  

Søren Kragh, Raphael Schneider, Simon Stisen, Rasmus Fensholt, and Julian Koch

Knowledge on irrigation is key to sustainable water resource management, but spatio-temporal irrigation data are rarely available. Recent advances are based upon satellite remote sensing data to quantify irrigation at high spatial resolution, and this study utilizes published irrigation datasets at regional scale to develop a metamodel approach to synthesize the available irrigation knowledge. We investigate the potentials and limitations of a Random Forest-based metamodeling approach that predicts irrigation at monthly timescale using only globally available and easily accessible features related to hydroclimatic and vegetation variables. The training dataset consists of three irrigation water use datasets derived from the soil moisture-based inversion framework and covers a variety of climatic conditions and irrigation practices in Spain, Italy, and Australia. Further, the study includes irrigation predictions from three test sites representing major global hot spots for unsustainable irrigation management: the North China Plain, Indus, and Ganges Basins. Our study aims to test the model transferability in space and time based on a series of split-sample experiments. We quantify and outline model transferability based on the area of applicability analysis, showing that although the feature space was mostly well represented, the magnitude of the target variable was equally important for assessing model transferability. A comprehensive feature importance analysis reveals that ranking of the most important input features depends on geographical extent of the training dataset. We find that model transferability was more robust across space than time within the small study areas, mainly because of the small geographical extents of the training datasets. The developed metamodel demonstrates satisfying performance with less than 10% bias and 3 mm/month mean error for a successful model transferability outside the training study areas and predicted spatial patterns of irrigation closely linked to climate and vegetation features. Given the increase in published regional irrigation datasets, we see great potential for further developing metamodel approaches for synthesizing existing knowledge and work towards global upscaling opportunities.

How to cite: Kragh, S., Schneider, R., Stisen, S., Fensholt, R., and Koch, J.: Synthesizing regional irrigation data using machine learning – towards global upscaling via metamodeling , EGU General Assembly 2024, Vienna, Austria, 14–19 Apr 2024, EGU24-5126, https://doi.org/10.5194/egusphere-egu24-5126, 2024.

Soil moisture data is highly valuable for irrigation management, however, soil data can often be difficult for farmers to interpret for making  informed irrigation decisions. Subsurface drip irrigation targets the root zone of crops. It is commonly used and highly efficient at minimizing evaporative loss. Factors, such as long irrigation lines and hilly terrain, influence the timing and duration of irrigation events, which makes arrival time and duration of crop irrigation water unpredictable even if there is a well-managed schedule.  Also, deficit irrigation is a practice where high value crops are intentionally water stressed after the fruiting stage to improve their quality and value. 


In this study, we propose a new modeling method for predicting soil moisture  that addresses the randomness of one of the primary boundary conditions, the irrigation event.  Through machine learning regression, we aim to predict near surface soil moisture values in a subsurface drip irrigated crop in a silt loam soil texture.  Our model focuses specifically on the dewatering portion of the time series soil moisture data at two depths, the soil textural data,  and the evapotranspiration (ET) as the only boundary condition. By predicting future soil moisture values or stress conditions in the absence of irrigation, our model provides valuable insights for farmers making irrigation management decisions. This presentation serves as a feasibility study and reports the results of the first attempt to apply machine learning regressors to time series soil moisture data to predict future near surface soil moisture values.


In our experiment, we placed two HydraProbe Soil Sensors in the root zone  of a blueberry crop located near Wilsonville Oregon in the United States. Soil moisture was logged every five minutes at  depths of   15 and 30 cm. The ET and soil moisture data were aggregated and parameterized into the input features for machine learning regressors. To create a training data set, algorithms were developed to isolate only the dewatering portions of the soil moisture time series data for a single growing season. The machine learning input features include: 1) the sum of ET for a specific duration interval, 2) soil moisture percentage, 3) the sum of the ET for the prior 24 hours, 4) the sum of forward-looking ET and 5) capillary features derived from soil texture pedotransfer functions (PFTs) that are part of the Richard’s Equation. The predicted near future soil moisture values are the output target of the model.


Using the Skikitlearn machine learning regressors, we evaluated random forest, support vector machine, ridge, and LASSO regressions. Each regressor underwent regularization through a grid-search of the hyper-parameters using the training data set. To measure potential overfitting of the models, a 15% holdout was examined using r2 and the RMSE (root mean square error). Additionally, a validation data set was created using seasonal low soil moisture values and time intervals not included in the training set.  Among the regressors evaluated, ridge regression performed well with an r2=0.98, RMSE=0.5% on the 15% holdout, and an r2=0.93, RMSE=1.13% on the validation data set.

How to cite: Bellingham, K.: Irrigation Management using Machine Learning Regressors of Aggregated Soil Moisture Data, EGU General Assembly 2024, Vienna, Austria, 14–19 Apr 2024, EGU24-6626, https://doi.org/10.5194/egusphere-egu24-6626, 2024.

Rapid agricultural development in the Ica Valley of Peru has translated to historic and on-going unsustainable use of groundwater.  Decades of ineffective water resources management threatens the future of agricultural production, requiring an overhaul of water management decisions and actions, particularly for groundwater sustainability.  A key measure of robust groundwater management is an accurate estimate of groundwater use, particularly if groundwater use is thought to exceed regulatory abstraction limits.  In this study, remote sensing estimates of evapotranspiration are combined with precipitation and water use permit databases to quantify groundwater use that exceeds regulatory limits, termed illicit use.  We apply two energy balance approaches, METRIC and SEBAL, combined with gridded climate information to robustly quantify agricultural water use.  Our findings document that illicit groundwater use is approximately twice that of regulation abstraction rates, suggesting current management strategies are failing to mitigate unsustainable groundwater use.  The remote sensing workflow can be applied to quantify groundwater use to inform efficacy of future groundwater management decisions and aid to identify regions for future interventions.

How to cite: Thomas, B.: Landsat-based ET to assess illicit groundwater use: The Ica Valley, Peru, EGU General Assembly 2024, Vienna, Austria, 14–19 Apr 2024, EGU24-11957, https://doi.org/10.5194/egusphere-egu24-11957, 2024.

EGU24-13738 | Posters on site | HS6.9

Rice Field Detection by Dual Polarization SAR Images  

Kuo-Hsin Tseng and Jui-Han Yang

Paddy rice plays a significant role in Asian agriculture, particularly in Taiwan. However, monitoring parcel-level activities and quantifying potential yield during the two crop cycles present challenges. The application of remote sensing to track paddy phenology emerges as a valuable strategy for improving crop management and ensuring food security. Synthetic Aperture Radar (SAR) satellites, among various spaceborne sensors, provide timely and extensive information unaffected by cloud cover. This study aims to extract time series data on paddy-specific phenology using dual-polarized SAR data and subsequently map paddy rice parcels in Taiwan. The process involves three primary steps: (1) Identifying phenological curves in training sites based on the temporal behavior of SAR backscattering coefficients; (2) Utilizing signal decomposition to analyze periodic patterns; (3) Recognizing rice fields by identifying the start and end of each crop cycle in the time series; (4) Validating the results with in situ data. In our preliminary findings, the accuracy in certain townships in western Taiwan achieves a kappa value of >0.6, with an overall accuracy exceeding 0.8. Additionally, we aim to unveil potential connections among crop cycles, groundwater changes, and land subsidence.

How to cite: Tseng, K.-H. and Yang, J.-H.: Rice Field Detection by Dual Polarization SAR Images , EGU General Assembly 2024, Vienna, Austria, 14–19 Apr 2024, EGU24-13738, https://doi.org/10.5194/egusphere-egu24-13738, 2024.

In the context of transboundary water systems, one of the most relevant challenges involves the quantification of water use for large scale activities such as agriculture. Whether due to methodological differences in the consolidation of inventories of agricultural areas, their production calendars, or due to differences in data availability between neighboring countries, the consolidation of detailed information of water use represent a process to be improved for an appropriate allocation of resources in transboundary management. On the other hand, the advantages in the availability and spatiotemporal homogeneity of satellite data, added to the connotation to minimize issues related to neutrality and stakeholder biases involving the use of only local data threatening consensus in a transboundary framework, offers a strategical opportunity to enhance the integrated water management by using satellite data.

Under these considerations, the present study applies Landsat satellite images for the spatial and temporal quantification of agricultural water use in the transboundary region (110 969 km2) of the Titicaca Lake, Desaguadero River, and Poopo Lake System (TDP) located between Bolivia (55%), Chile (1%), and Peru (44%) in South America (Lima-Quispe et al., 2022). Data processing first allows, to define irrigated agricultural areas from those which are not irrigated, through a validation process using the inventory of agricultural areas available in the official repositories of the countries and running an analysis using climate data (precipitation and potential evapotranspiration), second; defines the spatiotemporal pattern of water use through the evaluation and combination of vegetation indices (NDVI, EVI, among others) for the total agricultural area of the TDP water system (Linear Regressions) for the crops with the largest extension and/or use of water (potatoes, bean, quinoa, barley) studied at the local level in a process of calibration and validation (Bretreger et al., 2019). The results, from the analysis make possible to classify divergences attributed to the methodology, and use of the remote sensing data (correlation, BIAS in relation to local data) as well as to identify areas where both at the level of surface extension and temporal pattern, real water use would be exceeding the permitted and feasible values (trend test analysis) and therefore would imply a critical condition of alteration over the water bodies involved, which stakeholders may pay attention whether through increasing monitoring to corroborate or to strength penalties for ecosystem protection.

References:

Lima-Quispe, N., Escobar, M., Wickel, A. J., von Kaenel, M., & Purkey, D. (2021). Untangling the effects of climate variability and irrigation management on water levels in Lakes Titicaca and Poopó. Journal of Hydrology: Regional Studies, 37, 100927.

Bretreger, D., Yeo, I. Y., Quijano, J., Awad, J., Hancock, G., & Willgoose, G. (2019). Monitoring irrigation water use over paddock scales using climate data and landsat observations. Agricultural water management, 221, 175-191.

How to cite: Ayala Ticona, G., Santos, T., Gonzales, C., and Purkey, D.: Application of satellite data for the quantification of agricultural water use in the context of the transboundary water system of Titicaca Lake, Desaguadero River, and Poopo Lake in South America, EGU General Assembly 2024, Vienna, Austria, 14–19 Apr 2024, EGU24-14168, https://doi.org/10.5194/egusphere-egu24-14168, 2024.

EGU24-14901 | Posters on site | HS6.9

Exploring satellite soil moisture products for irrigation. A case study: Braila County, Romania 

Zenaida Chitu, Daniela Trifan, Alin Ghiorghe, Cristian Stroia, Nicolae Popescu, Irina Ontel, Claudiu-Valeriu Angearu, Adrian Irasoc, and Giorgiana Luftner

Irrigated agriculture will be impacted by climate change as average temperatures and rainfall variability increase. This trend will continue in the future, according to numerical experiments with climate models, but how it develops will be strongly influenced by the anthropogenic emission levels of greenhouse gases. However, the effects of climate change have not been, and will not be, uniform across regions or over time because human-induced warming is superimposed on natural climate variability (IPCC, 2021).

Recent studies (Caian et al., 2023) focused on the projected changes in extreme agro-climatic indicators reveal that Southern Romania appears as a regional hot-spot of climate change because the projected changes are higher and more accelerated than other regions of the country. In this context farmers will need to improve crop water allocation for sustainable irrigation as a measure of climate change adaptation.

Irrigation is the largest consumer in the agriculture sector and the efficient use of water is crucial in the next decades. Monitoring soil moisture will improve water allocation in space and time in irrigated agriculture. Braila County has the largest irrigated areas in Romania and efficient water allocation will mitigate the environmental issues related to water scarcity and soil degradation by salinization and erosion. According to the Koeppen-Geiger classification, the climate of this area is warm temperate humid with hot summers (Cfa) (Cheval et al., 2023). The mean annual precipitation is 450 mm, while the mean annual potential evapotranspiration exceeds 800 mm. The agro-climatic conditions require the use of irrigation in order to avoid crop losses and to ensure high crop productivity.

In this study, we focus on investigating the feasibility of satellite soil moisture products (AMSR-2, ASCAT, SMOS and SMAP) to derive amount of water applied for irrigation and the applicability of this approach to climatic and irrigation conditions specific to Braila County, Romania. 

This study has received funding from the European Union Agency for the Space Programme under the European Union’s Horizon Europe research and innovation programme under grant agreement No. 101082189 (MAGDA project).

How to cite: Chitu, Z., Trifan, D., Ghiorghe, A., Stroia, C., Popescu, N., Ontel, I., Angearu, C.-V., Irasoc, A., and Luftner, G.: Exploring satellite soil moisture products for irrigation. A case study: Braila County, Romania, EGU General Assembly 2024, Vienna, Austria, 14–19 Apr 2024, EGU24-14901, https://doi.org/10.5194/egusphere-egu24-14901, 2024.

EGU24-14960 | Orals | HS6.9

Identifying irrigated areas in the Rhine basin using land surface temperature and hydrological modelling 

Devi Purnamasari, Judith ter Maat, Adriaan Teuling, and Albrecht Weerts

In recent years, the Rhine has experienced summer drought which led to extremely low water availability throughout the basin. Additionally, combination of high temperature and low precipitation may increase irrigation demand, putting even more pressure on water availability. Identifying where irrigation occurs and how it evolves over time offers improved insight water use for sustainable water resources planning and management. However, high-resolution maps of irrigated areas for basin-scale studies on water use are often lacking. Here, as part of the HorizonEurope project STARS4Water, we aim to develop a methodology for identifying irrigated areas in the Rhine basin at a 1 km resolution for the period of 2010-2019. This involves utilizing a combination of the hydrological model wflow_sbm to produce land surface temperature (LSTsim) and thermal observations data (LSTobs) from the Moderate Resolution Imaging Spectroradiometer (MODIS) sensor. To provide consistent annual irrigation maps, we employed random forest classification model to further identify irrigated areas from the LST difference between LSTsim and LSTobs. In the absence of ground information data, the irrigated maps are evaluated against national agricultural statistics and compared with existing developed irrigated maps. The results can be used to comprehend the interannual variability in the extent and location of irrigated croplands in the Rhine basin and are a start to assess and model agricultural water use in the Rhine basin.


How to cite: Purnamasari, D., ter Maat, J., Teuling, A., and Weerts, A.: Identifying irrigated areas in the Rhine basin using land surface temperature and hydrological modelling, EGU General Assembly 2024, Vienna, Austria, 14–19 Apr 2024, EGU24-14960, https://doi.org/10.5194/egusphere-egu24-14960, 2024.

EGU24-15215 | Posters on site | HS6.9

SAR imagery and deep learning techniques for reservoir monitoring in Korea 

Wanyub Kim, Doyoung Kim, Yeji Kim, HyunOk Kim, and Minha Choi

Agricultural reservoirs are key structures for water supply on the Korean Peninsula, where the water resources are concentrated seasonally. Monitoring of agricultural reservoirs is essential for efficient management of available water resources. However, in the case of the Korea, there are many unmeasured reservoirs without observation facilities, so it is difficult to monitor available water at a regional scale. Remote sensing-based reservoir monitoring that can observe the water surface in a wide area is essential. In the case of Synthetic Aperture Radar (SAR) image, continuous water body detection is possible regardless of weather conditions. Recently, water body detection research using AI techniques has been actively conducted to improve accuracy. In this study, water body detection was performed on an agricultural reservoir using Sentinel-1 SAR image and AI-based U-net, HR-Net, and Swin-Transformer techniques. The water/non-water binary classification images from the Sentinel-2 satellite were used for validation. In addition, time series validation was performed using in-situ reservoir storage and evaluated the performance of each deep learning techniques. If SAR image with high spatial and temporal resolution can be utilized in the future, it is expected that more efficient management of available water resources will be possible.

Keywords: Sentinel-1, SAR, Deep learning, Water body detection, Reservoir

Acknowlegment: This work was supported by the “Development of Application Technologies and Supporting System for Microsatellite Constellation”project through the National Research Foundation of Korea(NRF) grant funded by the Korea government(MSIT) (No. 2021M1A3A4A11032019). This research was supported by the BK21 FOUR (Fostering Outstanding Universities for Research) funded by the Ministry of Education (MOE, Korea) and National Research Foundation of Korea (NRF). This work is financially supported by Korea Ministry of Land, Infrastructure and Transport (MOLIT) as 「Innovative Talent Education Program for Smart City」

How to cite: Kim, W., Kim, D., Kim, Y., Kim, H., and Choi, M.: SAR imagery and deep learning techniques for reservoir monitoring in Korea, EGU General Assembly 2024, Vienna, Austria, 14–19 Apr 2024, EGU24-15215, https://doi.org/10.5194/egusphere-egu24-15215, 2024.

EGU24-16218 | Orals | HS6.9

Super-resolved Land Surface Temperature for irrigation management  

Lukas Kondmann, Christian Molliére, Julia Gottfriedsen, and Martin Langer

Demographic growth and economic development are putting unprecedented pressure on finite water resources. It is estimated that global water demand will increase by 50% by 2030 resulting in a potentially devastating water shortage [1]. As 70-95% of all water withdrawals are farming-related [2], agriculture plays a key role in this dynamic. 

Inefficient water use in agriculture, often due to the invisibility of crop-specific water requirements, underscores the need for precise irrigation management to optimize water allocation and conservation. Ground sensors and drones can help to tackle this problem but they need to be deployed locally which does not scale. Satellites with instruments in the visible domain such as ESA’s Sentinel-2 reach the necessary spatial resolution but the water needs of crops in the visible spectrum only become apparent once there has been significant damage. Essentially, once a plant is going brown, it is already too late. 

Thermal satellites carry the necessary information to obtain evapotranspiration estimates and observe changes in crop health long before visual signs manifest. Existing thermal missions, however, often do not bring the necessary temporal and spatial resolution for large-scale irrigation management. Recent commercial offerings from the New Space industry, such as OroraTech’s upcoming Forest constellation, are beginning to turn the tide on this. Currently, we have two satellites in orbit with 9 more launches planned this year. With this, we will reach a global sub-daily revisit time for our Land Surface Temperature (LST) product which can serve as a basis for derived evapotranspiration or soil moisture data products, informing smart irrigation management 

At a native resolution of 200m, our LST product faces a trade-off between high temporal and spatial resolution. Exciting breakthroughs in artificial intelligence allow us to artificially enhance the resolution of our product threefold to 70m. With this, we combine the advantages of high spatial and temporal resolution for better irrigation management and crop stress detection. Our super-resolution product is evaluated based on ECOSTRESS data which comes at 70m. First validation comparisons of our super-resolved data with Ecostress look promising and we aim to explore the applicability of our enhanced data for improved irrigation management and related soil & vegetation water content parameters together with the scientific community. 

[1] FAO, 2023. https://www.fao.org/faostories/article/en/c/1185405/#:~:text=Agriculture%20is%20both%20a%20major,water%20there%20is%20no%20exception.

[2] World Economic Forum, 2023. https://www.weforum.org/impact/sustainable-water-management/

How to cite: Kondmann, L., Molliére, C., Gottfriedsen, J., and Langer, M.: Super-resolved Land Surface Temperature for irrigation management , EGU General Assembly 2024, Vienna, Austria, 14–19 Apr 2024, EGU24-16218, https://doi.org/10.5194/egusphere-egu24-16218, 2024.

EGU24-17205 | Orals | HS6.9

On the potential of monitoring small water structures with SWOT 

Lionel Zawadzki, Nicolas Gasnier, Roger Fjortoft, Santiago Pena Luque, Damien Desroches, Nicolas Picot, and Thérèse Barroso
Launched in December 2022, the SWOT satellite is a joint mission between NASA, CNES, UKSA, and CSA. It marks a significant breakthrough in the fields of oceanography and hydrology. 
 
Historically, water quantity data derived from satellites relied on a combination of different types of imagery (such as SAR and optical) and nadir altimetry or bathymetry. However, these methods have several limitations, especially when it comes to accurately observing hydrology features without relying on data from Very-High Resolution commercial satellites. 
As an example, Sentinel-2 imagery can detect water in optical images down to 10x10 m2 pixels [Pena-Luque et al, 2021]. As a result, Sentinel-2-derived land-water masks over rivers that are less than 20-m-wide often contain significant gaps. On the other hand, SAR imagery from Sentinel-1 can detect water surfaces larger than its 22 m resolution, but it's challenging to differentiate water from wet areas and roads [Pena-Luque et al, 2021]. Neither of these sensors can retrieve the water elevation. In contrast, conventional  altimetry has limited spatial coverage and is generally considered difficult to use in obtaining accurate water surface elevations in rivers less than 100-m wide [Calmant et al, 2006, 2008, 2016]. However, recent algorithmic advances [Boy et al, 2021, Egido et al, 2016], on the latest generation of nadir sensors (Delay Doppler Altimeters or SAR-altimeters) onboard Sentinel-3 and Sentinel-6 satellites showed that one can retrieve accurate water levels over small freshwater reservoirs. 
 
SWOT observations offer a novel approach to retrieve water quantity data from space. It operates using a near-nadir Ka-band SAR Altimeter based on interferometry to measure the elevation of water pixels with a sampling of 10-60x22 m2. Although its revisit  time is limited to at least twice per 21-day nominal cycle up to 78° latitude and its spatial resolution restricts its applicability for operational water management in irrigation and freshwater storage systems, SWOT presents new opportunities for understanding water management at the basin level. It can be used in combination with high-resolution imagery and real-time in situ measurements, and integrated into hydrological models for more effective water management.
Although the official mission specification designed SWOT for the retrieval of water surface elevation of 100-m wide rivers with 10-cm accuracy over 10-km reaches, a study by Gasnier et al, 2021, showed the potential of SWOT to observe narrow rivers. The first actual observations provided by SWOT in 2023 are publicly available on hydroweb.next and PO.DAAC websites. These confirm its potential to observe small hydrological targets well beyond the mission requirements.
In this study, we will present early results on human-made irrigation and freshwater storage systems, and discuss the current possibilities and limitations of SWOT satellite.

How to cite: Zawadzki, L., Gasnier, N., Fjortoft, R., Pena Luque, S., Desroches, D., Picot, N., and Barroso, T.: On the potential of monitoring small water structures with SWOT, EGU General Assembly 2024, Vienna, Austria, 14–19 Apr 2024, EGU24-17205, https://doi.org/10.5194/egusphere-egu24-17205, 2024.

EGU24-17492 | Posters on site | HS6.9

WSN-Based Irrigation Scheduling Model for Sugarcane Crops 

Yogesh Kushwaha, Rajib Panigrahi, and Ashish Pandey

The critical demand for freshwater resources worldwide necessitates their efficient utilization.  The agricultural sector is one of the major consumers of fresh water. However, in traditional irrigation techniques, about 60% of the water is wasted, resulting in low water use irrigation efficiency. Practical sensor-based methods are desperately needed to determine the soil water status for adequate irrigation scheduling. Using cutting-edge solutions to improve irrigation management is essential to water resource conservation. Wireless sensor networks (WSN) are an innovative technology advancing agriculture toward greater efficacy and sustainability. This research focused on developing a WSN-based irrigation system to minimize water losses under actual field conditions. The designed system was integrated with Fr4 capacitive-based soil moisture and DS18B20 soil temperature sensors, specifically evaluated for managing irrigation in loamy soil for sugarcane cultivation. The sensors were strategically installed at depths of 15 cm, 30 cm, and 45 cm below the surface of the soil. Throughout the crop's growth season, these sensors continuously measure the soil parameters (soil moisture content, soil temperature) and wirelessly transfer them to a cloud server through the ZigBee protocol to facilitate remote accessibility. The data was easily accessible online via a web service. An analytical approach utilizing a weighted average method was employed to interpret the soil moisture data collected from the three depths. This technique accurately depicted the soil water condition in the crop's root zone.

Furthermore, by setting a threshold according to the sensor's soil water content, the system may precisely initiate irrigation operations when needed. Overall, the WSN-based irrigation management system aims to improve productivity, reduce water waste, and increase the overall sustainability of agricultural operations. The efficacy of the developed system was field validated in terms of cost, efficiency, and ease of replicating before being delivered for societal use. With cloud-based data analysis and monitoring, users/farmers can access the irrigation system from anywhere and monitor it online. The experimental findings indicate that this irrigation management system utilize less water along with high water use efficiency.


Keywords: Wireless Sensor Network (WSN); Soil Moisture Sensors; Irrigation Scheduling.

How to cite: Kushwaha, Y., Panigrahi, R., and Pandey, A.: WSN-Based Irrigation Scheduling Model for Sugarcane Crops, EGU General Assembly 2024, Vienna, Austria, 14–19 Apr 2024, EGU24-17492, https://doi.org/10.5194/egusphere-egu24-17492, 2024.

In water-scarce regions, effective water resource management is crucial for sustainable agriculture. Scientists and decision-makers are working to address issues of resource conservation and agricultural productivity, with a growing interest in coupling hydrological and crop models. The current trend of interest seems to be limited to the improvement of crop system performance and environmental impact assessment, but attention also needs to be paid to sustainable crop production and water management concerns. Driven by these needs, in the framework of I4DP-SCIENCE program, the Italian Space Agency (ASI) supports the ambitious collaborative project THETIS (Earth Observation for the Early forecasT of Irrigation needS; Agreement n. 2023-52-HH.0), involving the National Research Council – Institute for Electromagnetic Sensing of the Environment (CNR-IREA), the Council for Agricultural Research and Economics (CREA), the Polytechnic of Bari, the University of Bari, and the Reclamation Consortium of the Capitanata, Foggia, Italy. The project focuses on the early assessment and forecasting of irrigation needs in the “Fortore” irrigation district in the Apulian Tavoliere (Southern Italy).

THETIS aims to develop a Spatial Decision Support System (SDSS) integrating hydrologic and crop growth models with advanced Earth Observation (EO) products, Artificial Intelligence (AI) and a WEBGIS interface to provide basin-scale information for the efficient planning of irrigation resources for three different use cases (i.e., early forecasting, irrigation start and mid-season estimation) for different target crops.

The project architecture significantly relies on the use of EO derived products obtained through the integrated use of Synthetic Aperture Radar (SAR), multispectral and hyperspectral data. They serve the purpose of describing land surface processes and represent crucial parameters for hydrological and crop growth model constraints.

Specifically, the calibration of the hydrological model spans from summer 2021 to autumn 2022. The subsequent phase will include a validation phase (year 2023) and an operational phase to estimate water use for the upcoming irrigation season. The validation of the model outputs includes the comparison of the estimated water demand with the actual irrigation volumes applied by the Consortium.

A primary focus of the proposed architecture lies in generating time-series estimates of root zone soil moisture, essential for defining the initial conditions in the crop growth model AquaCrop which plays a pivotal role in managing the water balance at the field scale in the areas relevant to irrigation needs assessment. To achieve this goal, the project aims to integrate, for the first time, a revised version of the well-known daily basin-scale hydrological model DREAM with the physically based Soil Moisture Accounting and Routing (SMAR) model.

This work concerns data selection and assessment for calibration and validation phases of the basin-scale hydrological model and the SMAR model. They include sparse daily field measurements and satellite data retrievals. Although field monitoring remains essential, preliminary results regarding the use of satellite-derived and downscaled products for a proper model calibration are encouraging. The proposed approach shows promise for providing insights into soil dynamics for operational implementation, supporting advances in sustainable agricultural techniques and rational water resource management in semi-arid environments.

How to cite: Iacobellis, V. and the THETIS: Advancing Water Management in Water-Scarce Regions: A Collaborative Approach for Early Assessment of Irrigation Needs in the Capitanata Consortium (Apulia region). , EGU General Assembly 2024, Vienna, Austria, 14–19 Apr 2024, EGU24-18407, https://doi.org/10.5194/egusphere-egu24-18407, 2024.

EGU24-18745 | ECS | Orals | HS6.9

Irrigation Estimation from Soil Water Balance and the Water Cloud Model by leveraging Sentinel-1 and Sentinel-2 observations 

Martina Natali, Sara Modanesi, Domenico De Santis, Luca Brocca, Fabio Mantovani, Andrea Maino, Gabrielle De Lannoy, and Christian Massari

Irrigation plays a pivotal role in the hydrological cycle, representing about 70% of freshwater withdrawals. However, its representation in Earth System models is characterized by significant uncertainties in terms of amount, timing and spatial distribution. Earth Observation data offer a viable way to reduce this uncertainty thanks to their ability to sense the soil and vegetation in its real condition with few-days revisit timing and high spatial resolution (~ 10 m), e.g. with the new Sentinel missions. 

In this contribution, we use remote sensing observations from the Sentinel-1 and Sentinel-2 satellite missions to constrain a simple Soil Water Balance (SWB) model coupled with the semi-empirical Water Cloud Model (WCM) and obtain irrigation estimates via an inverse modelling solution. The WCM, which is a model simulating backscatter observations (σ0) from soil moisture and a vegetation descriptor, is forced by vegetation indexes from Sentinel-2 data and soil moisture simulated by the SWB that includes a sprinkler irrigation scheme. The model outputs are then matched with Sentinel-1 observations to obtain irrigation estimates.

The model is tested over an irrigated field of the Po River valley, one of the most intensively European irrigated areas. Results show that the model can capture the irrigation signal with relatively good accuracy. It also provides an estimate of soil moisture in the field.  Nonetheless the revisit time of the satellite platforms and the simplicity of backscatter model, especially in the representation of the vegetation component, constitute two main limitations of the model. This model is a viable tool that can be easily applied in the context of precision agriculture to optimize irrigation practices and conserve water resources even when in-situ soil moisture and irrigation measurements are not available.

How to cite: Natali, M., Modanesi, S., De Santis, D., Brocca, L., Mantovani, F., Maino, A., De Lannoy, G., and Massari, C.: Irrigation Estimation from Soil Water Balance and the Water Cloud Model by leveraging Sentinel-1 and Sentinel-2 observations, EGU General Assembly 2024, Vienna, Austria, 14–19 Apr 2024, EGU24-18745, https://doi.org/10.5194/egusphere-egu24-18745, 2024.

EGU24-19723 | ECS | Posters on site | HS6.9

Influence of irrigation on soil moisture and evaporation based on Sentinel 1 backscatter observations and an evaporation retrieval model 

Baris Oztas, Oscar Baez Villanueva, Irina Yu. Petrova, Olivier Bonte, Jacopo Dari, Bernhard Raml, Mariette Vreugdenhil, Wolfgang Wagner, and Diego Miralles

Irrigation stands out as a primary driver influencing water dynamics over agricultural regions. Its estimation in time and space is complex, and satellite observations are only indirectly related to irrigation. Conveniently, Sentinel 1 SAR observations are sensitive soil moisture dynamics and irrigation, and can be used to estimate these dynamics at high resolution. The influence of irrigation on transpiration is however even more complicated to unravel from space observations. Current evaporation retrieval models are not designed to represent the influence of irrigation. However, the current availability of Sentinel 1 observations represents an opportunity to fill this gap.
In this presentation, the Global Land Evaporation Amsterdam Model (GLEAM) will be adapted to assimilate Sentinel 1 backscatter, using the Ebro river basin in Spain as a study case. While GLEAM's coarse resolution has to date hindered its application in the context of agricultural management, recent efforts during the Digital Twin Earth ESA initiative have yielded a GLEAM version at 1km resolution over the Mediterranean region that will be used in the context of this study. Here, we aim to leverage the high-resolution (1-km) GLEAM and explore its coupling to the Water Cloud Model to enable the forward data assimilation of Sentinel 1 backscatter. Several data assimilation techniques, such as Ensemble Kalman Filter, will be applied, seeking to find a method to estimate evaporation and soil moisture in irrigated land that can be transferable to basins where irrigation volumes are not available.

How to cite: Oztas, B., Villanueva, O. B., Petrova, I. Yu., Bonte, O., Dari, J., Raml, B., Vreugdenhil, M., Wagner, W., and Miralles, D.: Influence of irrigation on soil moisture and evaporation based on Sentinel 1 backscatter observations and an evaporation retrieval model, EGU General Assembly 2024, Vienna, Austria, 14–19 Apr 2024, EGU24-19723, https://doi.org/10.5194/egusphere-egu24-19723, 2024.

EGU24-20015 | Posters on site | HS6.9

Evaluation of Crop Water Stress Using Drone Images and Numerical Weather Prediction Model Data 

Jae-Hyun Ryu, Hoyong Ahn, and Kyung-Do Lee

Water conditions in soil are measured with soil moisture sensors such as tensiometer and time-domain reflectometry.  However, installed soil moisture sensors may not fully represent the entire cultivation area due to factors such as topography, meteorological conditions, and irrigation systems.The purpose in this study is to identify spatial variations of crop growth and moisture conditions using drone images and weather data. The drone, equipped with multi-spectral, hyper-spectral, and infrared cameras, captured images, and precipitation information up to 3 days later was automatically collected from numerical weather prediction model. Thermal images of crops and soil responded immediately depending on the presence or absence of irrigation. In irrigated crops, leaf temperature decreased due to transpiration. The hyper-spectral images, including short-wave infrared wavelengths, proved sensitive to soil water conditions. However, reflectance-based water indices showed no immediate differences for crops unless soil moisture fell below the wilting point. There was a difference in crop growth depending on the level of irrigation, which was clearly revealed in the vegetation index. Crop growth was poor in areas where irrigation was low. When soil moisture sensor values decrease and no rainfall is expected in the near future, drone images can be utilized to identify specific areas experiencing crop moisture stress. This suggests the potential for drones to support irrigation decision-making.

Acknowledgments: This research was funded by the Rural Development Administration, grant number RS-2022-RD009999.

How to cite: Ryu, J.-H., Ahn, H., and Lee, K.-D.: Evaluation of Crop Water Stress Using Drone Images and Numerical Weather Prediction Model Data, EGU General Assembly 2024, Vienna, Austria, 14–19 Apr 2024, EGU24-20015, https://doi.org/10.5194/egusphere-egu24-20015, 2024.

EGU24-21860 | ECS | Posters on site | HS6.9

Satellite-based energy models to estimate crop yield. An automatic approach at the regional scale 

Davide Gabrieli, Chiara Corbari, Francesco Pirotti, Samuele Trestini, Pietro Teatini, and Francesco Morari

The recent climate dynamics characterized by unpredictability and a series of extreme events pose challenges to society at various levels, particularly threatening agricultural production. The development of increasingly sophisticated models and computers combined with remote sensing techniques can serve as a means to safeguard the agricultural domain.

The aim of this work is to develop a computational tool, named CROPORBIT, designed to operate at a regional scale for estimating crop yield. The capabilities of this tool have a significant positive impact on water management, crop health monitoring, and quantifying damage from extreme meteorological events, such as high temperatures.

CROPORBIT combined the radiative model METRIC with a Photosynthetically Active Radiation-based model. Essential inputs for the tool include Landsat 8 and 9 satellite imagery and daily meteorological data retrieved from the regional network stations.

The tool performs a multi-temporal analysis of crop growth, involving the interpolation of ET, stress coefficient, and dry biomass accumulation maps, which are then transformed into crop yield maps by applying a harvest index coefficient.

CROPORBIT underwent validation in a series of soybean and corn fields situated in the low-lying plain of the Veneto Region, where crop yield maps were recorded by combine harvesters.

The preliminary results have shown that CROPORBIT can predict the average crop yield with a good approximation while it was less performing in capturing the field yield variability. The main issues have proven to be the scarcity of clear-sky conditions imagery and the estimation of the harvest index variability.

This research establishes the foundation for future investigations, emphasizing the need for improvements in spatial and time resolution. Enhancements in these aspects may lead to improved outcomes in terms of both accuracy and spatial variability.

How to cite: Gabrieli, D., Corbari, C., Pirotti, F., Trestini, S., Teatini, P., and Morari, F.: Satellite-based energy models to estimate crop yield. An automatic approach at the regional scale, EGU General Assembly 2024, Vienna, Austria, 14–19 Apr 2024, EGU24-21860, https://doi.org/10.5194/egusphere-egu24-21860, 2024.

Cutting-edge techniques for analyzing archival aerial survey images are crucial in enhancing terrain analysis and landscape modeling. This research study is centered on examining the effects of different image parameters, namely contrast, brightness, and smoothing, on the terrain model creation process. The goal is to determine the ideal combination of these factors that will optimize the quality of the produced models and improve their precision for water management applications.

The methodology includes collecting and preparing the images (by cropping) and conducting experiments to adjust the image parameters before creating terrain models to identify the best combination of adjustments.

The study's results reveal a significant influence of modified parameters on the final terrain models. Boosting contrast or brightness in images can enhance model intricacy, but excessive tweaking of these parameters may decrease accuracy. Image smoothing has emerged as a crucial component in noise reduction and obtaining smoother terrain models.

How to cite: Brétt, D. and Pacina, J.: Landscape Modeling: Impact of Image Parameters in Processing Historical Aerial Surveys for Water Management, EGU General Assembly 2024, Vienna, Austria, 14–19 Apr 2024, EGU24-525, https://doi.org/10.5194/egusphere-egu24-525, 2024.

EGU24-3849 | ECS | PICO | HS6.10

Global reference water information for flood monitoring: Increasing accessibility with STAC 

Sandro Groth, Marc Wieland, Fabian Henkel, and Sandro Martinis
Remote sensing data has become an essential component of today's disaster management. Copernicus Sentinel-1/2 satellites are capable of providing high spatial and temporal resolution information that has proven to be effective in inundation mapping and other water management applications. In the recent years, DLR has developed a cloud-based, automated processing chain that uses convolutional neural networks (CNN) to extract surface water extent from SAR and multi-spectral images of Sentinel-1/2 satellites. Resulting water masks are aggregated to a reference water product that can be used to rapidly permanent water from temporary flooded and to analyze seasonal and long-term surface water dynamics. To unlock the full potential of the data and encourage community use, the technical barriers in access and usability have to be minimized. We approach this challenge by utilizing Spatio-temporal Asset Catalogs (STAC) to publish a global, open access collection of reference water products based on Sentinel-1/2 data. STAC enables users to easily search for matching datasets and load the data locally using open source tools. We further store data assets in the cloud-optimized GeoTiff (COG) format to improve processing efficiency and scalability. To give users a quick start, we publish a set of Jupyter Notebooks that demonstrate common use cases in the context of flood mapping such as the computation of flood duration, inundation time series analysis as well as the visualization of seasonal changes in water extent.

How to cite: Groth, S., Wieland, M., Henkel, F., and Martinis, S.: Global reference water information for flood monitoring: Increasing accessibility with STAC, EGU General Assembly 2024, Vienna, Austria, 14–19 Apr 2024, EGU24-3849, https://doi.org/10.5194/egusphere-egu24-3849, 2024.

EGU24-7285 | ECS | PICO | HS6.10

Investigating the Complexities of LS PIV in River Contaminations: A case study of Varuna River Basin 

Mayank Bajpai, Devyan Mishra, Shishir Gaur, and Ojas Srivastava

This study delves into the intricate challenges associated with employing Large Scale Particle Image Velocimetry (LS PIV) in river systems affected by anthropogenic contamination and algae, with a specific focus on the Varuna River Basin. The presence of pollutants and the proliferation of algae pose unique obstacles to the accurate assessment of flow dynamics and sediment transport using LS PIV technology.
In our investigation, we utilize a setup consisting of Jetson Nano with a camera. The setup is checked for feasibility for two cameras: i) GoPro Hero 7 camera  and ii) a Sony IMX219-200 Camera. The integration of these technologies allows for real-time observations with Real Time Messaging Protocol (RTMP), providing a dynamic perspective on the impact of contaminants and algae on the LS PIV measurements. Through this detailed case study, we scrutinize the complexities arising from the interplay of contaminants and algal growth, examining their effect on the data captured by our setup. Lastly, a holistic comparison of both the setups is done. The findings contribute valuable insights for researchers and practitioners working on water quality assessment and river management strategies in regions facing similar challenges.

How to cite: Bajpai, M., Mishra, D., Gaur, S., and Srivastava, O.: Investigating the Complexities of LS PIV in River Contaminations: A case study of Varuna River Basin, EGU General Assembly 2024, Vienna, Austria, 14–19 Apr 2024, EGU24-7285, https://doi.org/10.5194/egusphere-egu24-7285, 2024.

Numerous datasets revealing locations and alterations of water bodies have been produced from field investigations and remote sensing imagery. However, measuring surface water changes with high resolution remains a challenge. Here, a high-precision random forest (RF) model constrained by the annual maximum remote sensing indices was developed. Validation result from visual inspection shows that the accuracy of the model has reached 99.46%. Based on the improved RF model, monthly surface water variations in the Yellow River Basin over the past 10 years were quantified at 30-meter resolution using Landsat 8 and Sentinel 2 satellite images. The variations of water bodies including when water was presented, where occurrence changed and what form changes took in terms of seasonality and persistence were obtained. It is found that between 2014 and 2023, there are evident variations of permanent water bodies including formation and disappearance of surface permanent water bodies in the Yellow River Basin. Further research can be conducted on the intricate impact of climate and human activity on water bodies using the high-resolution surface water dataset provided.

How to cite: Wang, X. and Zhang, Y.: High-resolution mapping of surface water dynamics using restricted random forest: A case study in the Yellow River Basin, EGU General Assembly 2024, Vienna, Austria, 14–19 Apr 2024, EGU24-7324, https://doi.org/10.5194/egusphere-egu24-7324, 2024.

EGU24-7795 | PICO | HS6.10

Remote Sensing Utility for Water Quality and Riparian Vegetation Monitoring in Mediterranean Reservoirs: Impact of Ecological Flow Regimes Management 

Ana Andreu, Rafael Pimentel, Eva Contreras, Raquel Gómez-Beas, Cristina Aguilar, Javier Aparicio, Francisco Herrera, Noe Rodriguez-Fernandez, and María José Polo

Significant progress has been achieved since the 2013 implementation of ecological flow rates due to the Water Framework Directive in Spain (WFD). Nevertheless, certain shortcomings exist, such as adequately monitoring compliance and analyzing the ecological response post-implementation. This is especially evident in areas characterized by complex meteorology, with extended periods of drought, as observed in regions affected by the Mediterranean climate. Moreover, it is crucial to combine minimum flows with pollution issues, whether anthropogenic or natural, to attain the good ecological status of water bodies.

Our study aims to address three distinct questions: 1) How does implementing various environmental flow regimes impact the levels of hydrological alteration in terms of water quality and riparian vegetation downstream of the reservoirs? 2) How can we use remotely sensed information to complement existing water monitoring networks to assess changes in water quality and riparian vegetation? 3) What is the required spatiotemporal resolution needed to monitor these alterations?  

The pilot reservoir to conduct this study is within the Guadalquivir River Basin (southern Spain). This basin has relevant problems of reservoir silting and water pollution arising from high erosion and human intervention rates. To assess the evolution of water quality, quantity, and vegetation state, we evaluate different indexes derived from high, medium, and low spatial resolution VIS/NIR satellite images, with temporal resolution ranging from daily to biweekly. The analysis spans the period from 2018 to 2023, and we correlate remotely sensed information with ground data series of reservoir inlet and outlet flows, volume, and water level, provided by the regional government's Automatic Hydrological Information System (SAIH), but also with water quality data provided by the regional government’s DMA network (WFD approach). This also allowed for evaluating the relationship between flow regimes and the estimated water and vegetation parameters.

Higher spatiotemporal scales proved crucial in studying changes in riparian vegetation, capturing the natural characteristics of Mediterranean riversides, which are not very wide and exhibit marked seasonal patterns. Due to the homogeneous land use of the basin, coarse-resolution indexes accurately reflect nearby vegetation patterns, serving as a proxy for the basin's ecological status. For water quality indexes, a spatial resolution of meters becomes necessary because, in this reservoir, invasive species proliferation and clogging levels are low. The lower resolution water index aligns with water level fluctuations, allowing us to use this information for longer-term analysis. Our ultimate goal is to provide effective metrics based on observations and simulations, accessible in quasi-real time, to support operational decision-making processes. We will apply the methodology to different reservoirs of the Guadalquivir River's upper, middle, and lower areas.

This work has been funded by the project TED2021-130937A-I00, ENFLOW-MED “Incorporating climate variability and water quality aspects in the implementation of environmental flows in Mediterranean catchments” with the economic collaboration of MCIN/AEI/10.13039/501100011033 and European Union “NextGenerationEU”/Plan de Recuperación

How to cite: Andreu, A., Pimentel, R., Contreras, E., Gómez-Beas, R., Aguilar, C., Aparicio, J., Herrera, F., Rodriguez-Fernandez, N., and Polo, M. J.: Remote Sensing Utility for Water Quality and Riparian Vegetation Monitoring in Mediterranean Reservoirs: Impact of Ecological Flow Regimes Management, EGU General Assembly 2024, Vienna, Austria, 14–19 Apr 2024, EGU24-7795, https://doi.org/10.5194/egusphere-egu24-7795, 2024.

EGU24-9069 | PICO | HS6.10

Improving Copernicus data access and usability for water management  

Ioana Popescu, Andreja Jonoski, Claudia Bertini, and Sajid Pareeth

European Union´s Earth Observation Programme Copernicus provides vast amounts of free and openly accessible global data from satellites and ground-based, airborne and seaborne measurement systems for six major thematic areas: land, marine, atmosphere, climate change, emergency, and security (the Copernicus services). Though water related issues are covered in each of the  Copernicus services, there is no explicit visibility for water related data and products.  The Horizon 2020 project Water-ForCE (Water scenarios for Copernicus Exploitation) developed a roadmap to better integrate data for the entire water cycle within the Copernicus services and available to address water-related issues. It addresses the data needs and requirements from the user community point of view; analyses the current disconnection between remote sensing and in-situ data; and looks on how remote sensing is used in the modelling of water problems.

One of the objectives of the project was to look at the current state of the art in modelling using Remote Sensing (RS) data for water quantity and quality for decision support and policy, with focus on Copernicus services. The analysis  focussed on three main pillars: EU institutions and their policies; the specific approaches by national policies in all EU countries and approaches at international level.

Moreover, the analysis looked at how the Copernicus data can be more effectively used in developing and delivering the upcoming versions of the directives.

The analysis pointed out that the reasons for slow uptake of RS data (including Copernicus) in water management are primarily due to the dynamic characteristics of the sector. Water is critical resource for different socio-economic activities and there are multiple aspects to the water management as in: water resources assessment, planning development and protection (both surface water and groundwater), public water supply, waste water treatment and disposal, management of water-related disasters such as floods and droughts, agricultural water use (irrigation and drainage), water for energy production, inland navigation, water-related ecosystem services, tourism and recreation (including bathing waters), etc.

The many and diverse water management aspects are also associated with many different water-related agencies, which are rather traditional in their approaches to using data (mainly in-situ), with little awareness of opportunities for RS and products that could be employed by EU institutions and agencies to systematically monitor the impacts and the implementation status of existing water related policies. A systematic approach is found in the area of climate change, where monthly reports produced by C3S are used as a monitoring tool. This approach can be implemented in the other Copernicus services as well.

This research work has been developed within the project WaterForCE, funded by European Union’s Horizon 2020 research and innovation programme under Grant Agreement Νο 101004186.

How to cite: Popescu, I., Jonoski, A., Bertini, C., and Pareeth, S.: Improving Copernicus data access and usability for water management , EGU General Assembly 2024, Vienna, Austria, 14–19 Apr 2024, EGU24-9069, https://doi.org/10.5194/egusphere-egu24-9069, 2024.

EGU24-12818 | ECS | PICO | HS6.10

Measuring river surface velocity using UAS-borne Doppler radar 

Zhen Zhou, Laura Riis-Klinkvort, Emilie Ahrnkiel Jørgensen, Monica Coppo Frías, Peter Bauer-Gottwein, Alexander Rietz Vesterhauge, Daniel Haugård Olesen, Alexey Dobrovolskiy, Alexey Kadek, Niksa Orlic, Tomislav Grubesa, Henrik Grosen, Sune Nielsen, Daniel Wennerberg, Viktor Fagerström, Jenny Axén, and David Gustafsson

Compared to traditional river surface velocity measurement techniques such as in-situ point measurements with electromagnetic current meters, remote sensing techniques are attractive because measurements are fast, low cost and contactless. Based on Unmanned Aerial Systems (UAS) equipped with optical equipment (e.g., HD camera) and Doppler radar, surface velocity can be efficiently measured with high spatial resolution. UAS-borne Doppler radar is particularly attractive, because it is suitable for real-time velocity determination and has fewer limitations (no seeding of the flow required, no daylight required, works for both narrow and wide rivers).

In this paper, videos from a UAS RGB video camera were analysed using both Particle Image Velocimetry (PIV) and Space-Time Image Velocimetry (STIV) techniques. Furthermore, we recorded full waveform signal data using a 24 GHz continuous wave Doppler radar (e.g., Geolux RSS-2-300) at multiple waypoints across the river. Different from previous processing methods, which only considered the processed velocity from Doppler radar itself, we propose an algorithm for picking the correct river surface velocity from the raw data. The algorithm fits two alternative models to the raw data average amplitude curve to derive the correct river surface velocity: a Gaussian one peak model, or a Gaussian two peaks model.

Results indicate that river flow velocity and drone-induced propwash velocity can be found in the river’s lower flow velocity portions (i.e., surface velocity between 30 cm/s and 80 cm/s), while the drone-induced velocity can be neglected in fast and highly turbulent flows (i.e., surface velocity > 80 cm/s). To verify the river flow velocity derived from Doppler radar, a mean PIV value within the footprint of the Doppler radar at each waypoint was calculated. Finally, quantitative comparisons of electromagnetic velocity sensor data (OTT MF Pro) with STIV, mean PIV and Doppler radar revealed that UAS-borne Doppler radar could reliably measure the river flow velocity.

How to cite: Zhou, Z., Riis-Klinkvort, L., Ahrnkiel Jørgensen, E., Coppo Frías, M., Bauer-Gottwein, P., Rietz Vesterhauge, A., Haugård Olesen, D., Dobrovolskiy, A., Kadek, A., Orlic, N., Grubesa, T., Grosen, H., Nielsen, S., Wennerberg, D., Fagerström, V., Axén, J., and Gustafsson, D.: Measuring river surface velocity using UAS-borne Doppler radar, EGU General Assembly 2024, Vienna, Austria, 14–19 Apr 2024, EGU24-12818, https://doi.org/10.5194/egusphere-egu24-12818, 2024.

EGU24-13584 | ECS | PICO | HS6.10

Comparing the performance of Chlorophyll-a retrieval models in coastal and transitional waters  

Mir Talas Mahammad Diganta, Md Galal Uddin, Tomasz Dabrowski, and Agnieszka I. Olbert

Among water quality (WQ) indicators, Chlorophyll-a (CHL) plays a pivotal role in assessing algal biomass production in aquatic ecosystems, serving as a crucial parameter for monitoring aquatic health and eutrophication events. Satellite remote sensing (RS) techniques offer an extended spatio-temporal coverage compared to conventional methods, making them valuable for CHL estimation, especially in optically complex waters like coastal and inland areas. However, the retrieval of CHL using RS in such environments poses challenges, and selecting the appropriate algorithm is one such challenge.

In this study, Sentinel-3 OLCI images were employed to estimate CHL levels in Cork Harbour, Ireland. Twenty widely used CHL retrieval algorithms, ranging from traditional blue-green band-based ocean color algorithms (e.g., OC4, OC5, OC6) to two-band and three-band NIR-red algorithms, were applied to water leaving reflectance data obtained from the Case 2 Regional CoastColour atmospheric correction algorithms. Additionally, in-situ CHL concentration data from 32 monitoring sites within Cork Harbour were used for validation.

The results revealed that three-band algorithms based on NIR-red bands (specifically B12/(B08-B11)) exhibited a higher sensitivity (R2 = 0.77) to in-situ CHL measurements, outperforming other CHL algorithms with superior performance (RMSE = 0.28 mg/m3, MAPE = 28.6%, MAE = 0.28 mg/m3, and MBE = - 0.00 mg/m3). Furthermore, the study demonstrated the potential of Sentinel-3 OLCI satellite images for CHL retrieval in Irish coastal waters. These findings offer valuable insights into optimizing CHL retrieval from remotely sensed data, potentially enhancing traditional monitoring programs by addressing existing limitations.

Keywords: Coastal and transitional water quality, chlorophyll-a, retrieval algorithms; remote sensing, atmospheric correction.

How to cite: Diganta, M. T. M., Uddin, M. G., Dabrowski, T., and Olbert, A. I.: Comparing the performance of Chlorophyll-a retrieval models in coastal and transitional waters , EGU General Assembly 2024, Vienna, Austria, 14–19 Apr 2024, EGU24-13584, https://doi.org/10.5194/egusphere-egu24-13584, 2024.

EGU24-16008 | PICO | HS6.10

Multiscale remote sensing assessment of water cycle modelling outputs   

Diana Pascual Sanchez, Amanda Batlle, Eva Flo, Kaori Otsu, Ester Prat, Xavier Garcia, and Lluís Pesquer

The selection of a suitable spatial resolution for the inputs and outputs of many types of modelling is crucial in most of requirements analysis.

The easy and quick solution, the highest possible spatial resolution, is not always feasible, or at least, is not the best in terms of cost – benefit.

This work aims to analyse and assess the outputs of the water quantity SWAT (model (https://swat.tamu.edu/) at different spatial detail and fragmentation of HRUs (hydrologic response units) and the corresponding validation with remote sensing products at different spatial resolutions.

This work is being developed within the framework of the AquaINFRA project (https://aquainfra.eu/) which creates an EOSC-based (https://eosc-portal.eu/) research infrastructure for an integrated vision of the hydrosphere (inland + marine). Thus, our goal is to validate selected model outputs from inland and marine components in one of the project use cases.

The study area of the use case is located in the northwest Mediterranean region, specifically in the central Catalonia coast:  the Tordera river basin (898 km2) and the connected coastal neighbouring of its mouth. The inland landscape is mainly a heterogeneous mosaic of forests (upper river basin) and shrublands, croplands, and urban + industrial zones (lower river basin). This area shows an 800 mm mean annual precipitation and 13 ºC mean annual air temperature.

This study starts with the multiscale analysis of the evapotranspiration (ET): monthly time series (2011-2022) intercomparison between SWAT modelling outputs at different numbers of HRUs (range 261 - 1958) and the remote sensing ET products: from MODIS (500m) to Landsat (30m) and other modelling products, such as C3S (Copernicus Climate Change Service; 10km). 

Some of the outputs from the inland model are selected as inputs for the regional coastal model (MitGCM + BFM), where again, the most suitable spatial resolution is a key property for the integrated models.

(This project has received funding from the European Commission’s Horizon Europe Research and Innovation programme under grant agreement No 101094434).

How to cite: Pascual Sanchez, D., Batlle, A., Flo, E., Otsu, K., Prat, E., Garcia, X., and Pesquer, L.: Multiscale remote sensing assessment of water cycle modelling outputs  , EGU General Assembly 2024, Vienna, Austria, 14–19 Apr 2024, EGU24-16008, https://doi.org/10.5194/egusphere-egu24-16008, 2024.

EGU24-16336 | ECS | PICO | HS6.10

A monitoring-forecasting tool for advancing surface water quality management in lakes, reservoirs and major rivers  

Riddick Kakati, Matteo Dall’Amico, Marco Toffolon, Federico Di Paolo, Stefano Tasin, and Sebastiano Piccolroaz

In water resources management, predictive services are essential to support sustainable planning and operations over a range of time scales, from the short term (days) to the medium term (seasons) to the long term (years to decades). Current forecasting tools mainly address water availability (i.e., quantity), with limited practical applications for water quality. Within the framework of the project called “Strumenti di monitoraggio e previsionali sullo stato di QUalità delle Acque Superficiali” (SQUAS; founded by CARITRO Foundation, Italy; website: https://sites.google.com/unitn.it/hydrosquas), we aim to fill this gap, which is particularly relevant in view of the ongoing transformation of water resources due to rapidly changing climatic conditions. More specifically, we aim to 1) increase the accessibility of tools for diagnosing and predicting surface water quality for use by local authorities and managers of surface water resources, such as agricultural consortia, hydroelectric plant operators, municipal companies, and public entities, and 2) improve the ability of these entities to plan and manage water resources efficiently and sustainably. Anchored in a multidisciplinary approach, the project integrates physical-based modelling used to forecast key water quality parameters with satellite remote sensing data for monitoring purposes. As for the modelling component, the project will be based on the widely used air2water and air2stream models for water temperature prediction in lakes and rivers. Central to the project is the revision, improvement and extension of these models by including water quality variables (e.g., turbidity, dissolved oxygen) and by integrating them into a state-of-the-art web-based Geographic Information System (GIS) platform. The web-GIS platform will not only allow to forecast future conditions based on the above models but also allow for real-time monitoring of water quality. Its Python fast-api based interface will provide a user-friendly GUI for the user interaction, using any web browser. The speed of computation of the forecasting models will be ensured by efficient Cython-based functions. The intuitive interface of the web-GIS platform will appeal to a wide range of users, from policy makers and water resource managers to academic researchers, facilitating informed decision-making and sustainable management practices. An interactive presentation of the web-GIS tool will be given during the session.

How to cite: Kakati, R., Dall’Amico, M., Toffolon, M., Di Paolo, F., Tasin, S., and Piccolroaz, S.: A monitoring-forecasting tool for advancing surface water quality management in lakes, reservoirs and major rivers , EGU General Assembly 2024, Vienna, Austria, 14–19 Apr 2024, EGU24-16336, https://doi.org/10.5194/egusphere-egu24-16336, 2024.

EGU24-17631 | PICO | HS6.10

An innovative Drinking Water Data Space in times of water scarcity and extreme events: the WQeMS platform 

Ivette Serral, Philipp Bauer, Afroditi Kita, Kostas Vlachos, Marco Matera, Matteo Basile, Joan Masó, and Ioannis Manakos

In the era of global challenges and big Earth data computation it’s becoming increasingly important to have proper interoperable solutions for describing, cataloguing, finding, accessing, and distributing highly valuable datasets. The usability and reproducibility of data under FAIR and GEO Data Sharing and Data Management Principles, with accurate description of datasets in terms of semantics and uncertainty, can make data more valuable. EC is pushing Data Spaces as a tool to manage data and generate and provide knowledge ready to use for managers and decision makers.

The contribution presents a standard-based Data Space for automatically monitoring Water Quality specifically designed for European Lakes, based on remote sensing derived datasets, in-situ monitoring stations and web services. A web map browser gives access to water quality time series products (turbidity, Chl-a, floods, hydroperiod, etc) based on EO in Cloud Optimized GeoTIFF and in-situ observation stations connected using OGC STAplus standard. The map browser integrates the overall set of capabilities: data and metadata visualization, data analytics, quality indicators linked to the QualityML dictionary; semantic tagging of the Essential Water Variables; and OGC Geospatial User Feedback (GUF). The system is accessible through the OpenID-connect authentication standard which extends the OAuth 2.0 authorization protocol that allows different rights for different users to guarantee the preservation of data.

This approach has been developed and tested under the Horizon 2020 WQeMS - Copernicus Assisted Lake Water Quality Emergency Monitoring Service (nº 101004157). Some parts of the solution have been developed under the HORIZON-CL6 AD4GD - An Integrated, FAIR Approach for the Common European Data Space (nº 101061001) co-funded by the European Union, Switzerland and the United Kingdom.

How to cite: Serral, I., Bauer, P., Kita, A., Vlachos, K., Matera, M., Basile, M., Masó, J., and Manakos, I.: An innovative Drinking Water Data Space in times of water scarcity and extreme events: the WQeMS platform, EGU General Assembly 2024, Vienna, Austria, 14–19 Apr 2024, EGU24-17631, https://doi.org/10.5194/egusphere-egu24-17631, 2024.

India is ranked 120th among 122 countries globally in WaterAid’s water quality index. Regular water quality monitoring is essential to determine which inland water bodies are experiencing depreciating water quality. Long-term trends have been obtained using satellite remote sensing, necessitating multiple image analysis. The computational burden of processing numerous satellite images can be reduced using Google Earth Engine’s (GEE) cloud computing capabilities. Thorough research was conducted to determine the global spatio-temporal and biochemical factors impacting surface water quality (WQ). The public availability of geospatial datasets and free access to cloud-based geo-computing platforms such as GEE are widely used for spatio-temporal mapping, global surface water monitoring, water quality parametric variation, and real-time forecasting. Many researchers have recently focused on improving data mining and machine learning algorithms to accurately deal with image classification and predictive problems for crop identification and monitoring. In the present study, we propose to define band spectral ratios, spectral band equations, and empirical models for water quality parameters. A few neural network models will be used to (i) query and pre-process satellite earth observations that coincide with the study area, (ii) extract the spectra, and (iii) use spectral band wavelength charts, time-series charts, spatial-distribution maps, and the development of an online dashboard application to visualize the results graphically upon using integrated Landsat (8,9), Sentinel-2A/B and PlanetScope satellite data for the pre-monsoon and post-monsoon seasons in 2023 in the pan-India region. MODIS-TERRA provides LST spatial-temporal monitoring. In this, we have assessed and compared the performance of CART, SVM, and RF ML algorithms. We found that RF outperforms CART and SVM algorithms in the GEE platform with PlanetScope data (80.71% overall accuracy (OA) with Kappa 0.89) and also with the integration of PlanetScope and Sentinel-2A/B data (OA = 85.53%, Kappa 0.91). But CART outperforms RF and SVM algorithms with Sentiel-2A/B data (OA = 81.59%, Kappa 0.85). The SAM technique, spectral feature fitting, continuum band removal, and other band-spectral ratio techniques are employed for quantitative hyperspectral data analysis. Specifically, the performance metrics of XGBoost and SGD for both Chl-a (R^2 = 0.818) and Turbidity (R^2 = 0.815) models exhibited robust accuracy. We have also developed a Google API-based JavaScript code that can be tested under complex coastal shores, challenging inundation and variable climatic conditions. Our method provides the end-to-end cloud computing workflow shown in this research, considering cost and computational efficiency for timely information delivery.

Keywords: Classification and Regression Trees (CART), Chlorophyll-a (conc), Color dissolved organic matter (CDOM), Composite water management index (CWMI), Environmental Mapping and Analysis Program (EnMAP), Land Surface Temperature (LST), Machine Learning (ML), Random Forest (RF), Spectral Angle Mapper (SAM), Stochastic Gradient Descent (SGD), Support Vector Machine (SVM), Total Suspended Solids (TSS), Water Quality (WQ), XGBoost (Extreme Gradient Boosting).

How to cite: Galodha, A., Anees, S., Lall, B., and Ahammad, S. Z.: Google’s cloud computing platform performance assessment of spatio-temporal and estimation for global water quality analysis and surface water mapping using integrated satellite data of MODIS (TERRA), Landsat- (8, 9), Sentinel‑2A/B and Planets, EGU General Assembly 2024, Vienna, Austria, 14–19 Apr 2024, EGU24-18504, https://doi.org/10.5194/egusphere-egu24-18504, 2024.

Coastal waters face growing challenges from population growth, urban expansion, and alterations in hydrologic flows caused by climate change, affecting their quantity and seasonal patterns. Long-term observations of chlorophyll-a in aquatic environments, can show seasonal variability. Remote sensing analysis of chlorophyll-a seasonal variability is a significant approach for understanding the interactive dynamics of climate change, providing information for mitigation methods and trophic state. This study examines long-time series of Surface Reflectance datasets in selected sampling stations at coastal waters, proposes logical corrections after statistical analysis, and evaluates chlorophyll-a seasonal variability. The derived chlorophyll-a bloom phase was consistent with the limited field measurements. In addition, the results indicated that sampling stations of higher depth present better accuracy in evaluating seasonal phytoplankton blooms

How to cite: Biliani, I. and Zacharias, I.: Monitoring coastal eutrophication with remote sensing analysis. Seasonal variability of chlorophyll-a , EGU General Assembly 2024, Vienna, Austria, 14–19 Apr 2024, EGU24-20369, https://doi.org/10.5194/egusphere-egu24-20369, 2024.

EGU24-1929 | ECS | Orals | HS6.12 | Highlight

Carbon dynamics shift in changing cryosphere and hydrosphere of the Third Pole 

Yulan Zhang and Tanguang Gao

The Third Pole (TP) represent the largest alpine mountains on Earth. Its cryosphere is shrinking and collapsing and the hydrosphere is subsequently expanding under a warming climate in recent decades, posing potential impacts on biogeochemical cycles. In particular, the carbon cycles there have experienced dramatic changes, primarily with the alterations of cryosphere and hydrosphere. Carbon emissions from the melting glaciers and thawing permafrost can further trigger feedback on climate change. However, their current status and future fate in this region still need clarification comprehensively. Here, we review the current state of carbon stocks in the changing TP cryosphere and hydrosphere, focusing on their variations in permafrost, glaciers, and related inland waters (upper river streams, thermokarst lakes, and glacial lakes). We also considered their release pathways and the amounts of carbon released into aquatic ecosystems and the atmosphere. Finally, we recommend research priorities to address dynamics in carbon cycling and possible future impacts on the TP. This review will highlight the important of dynamics of carbon cycle on the TP under climate change in future.

How to cite: Zhang, Y. and Gao, T.: Carbon dynamics shift in changing cryosphere and hydrosphere of the Third Pole, EGU General Assembly 2024, Vienna, Austria, 14–19 Apr 2024, EGU24-1929, https://doi.org/10.5194/egusphere-egu24-1929, 2024.

      Based on multiple long-term observational and reanalysis datasets, this study investigated the characteristics and physical mechanisms of the interdecadal variations in late spring (i.e., May) precipitation (LSP) over the southeastern extension of the Tibetan Plateau (SETP) since 1900. It was revealed that by and large, LSP over the SETP experienced interdecadal decrease during the period preceding 1927, 1962–1988, and 2004 onwards, but saw an increase during the periods of 1928–1961 and 1989–2003. The atmospheric circulations responsible for interdecadal variations in LSP over the SETP were also analysed. These analyses identified significant synergistic impacts of decreased mid-latitude upstream westerlies and increased low-latitude monsoonal southerlies over the Central North Bay of Bengal (CNBOB) on interdecadal variations in precipitation, suggesting striking interactions between extratropical eastward cold air and tropical northward warm/humid air. Further observational and modelling evidence suggested that Atlantic Multidecadal Oscillation (AMO) was likely to be a salient oceanic driver for the interdecadal synergy between upstream westerlies and CNBOB monsoonal southerlies. The elevated sea surface temperature anomalies associated with the warm phase of the AMO could spark favourable local atmospheric anomalies, forcing an upper-tropospheric, planetary-scale teleconnection emanating from the east of the North Atlantic sector, which may serve as an effective bridge linking the remote AMO signal and the synergy between westerlies and monsoonal southerlies around the SETP on interdecadal timescales. Our findings provided new insights into the understanding of the synergistic roles of westerlies and monsoons in the modulation of interdecadal LSP over the SETP, prior to the peak Asian summer monsoon season.
KEYWORDS
AMO, interdecadal precipitation variations, late spring, southeastern extension of Tibetan Plateau, westerly–monsoon interplay

How to cite: Liu, Y.: Synergistic impacts of westerlies and monsoon on interdecadal variations of late spring precipitation over the southeastern extension of the Tibetan Plateau, EGU General Assembly 2024, Vienna, Austria, 14–19 Apr 2024, EGU24-2272, https://doi.org/10.5194/egusphere-egu24-2272, 2024.

The Tibetan Plateau, known as the “Roof of the World,” hosts numerous lakes that play a pivotal role in triggering and modulating regional and even global weather patterns. This study focuses on the observational evidence of these lakes on the Tibetan Plateau acting as catalysts for weather phenomena. Lake observations are selected based on typical lakes with a hundred-kilometer scale under the synergistic effect of westerlies and monsoons. Such as Bamu Co, Laang Co and Longmu Co.

Extensive field measurements and remote sensing data have been analyzed to unravel the complex interactions between the lakes on the Tibetan Plateau and the surrounding atmosphere. The findings reveal that these lakes, through processes such as lake-effect precipitation, thermal regulation, and evaporation, significantly influence the formation and evolution of weather systems in the region.

The lake-effect precipitation, for instance, has been observed to generate localized heavy rainfall and snowfall events downwind of the lakes. The thermal regulation effect of the lakes mitigates extreme temperature variations, while the evaporation from the lakes contributes to the water vapor supply in the atmosphere, thereby affecting cloud formation and precipitation.

Furthermore, the study highlights the potential impact of changing lake dynamics, such as fluctuations in lake levels and temperatures, on the regional climate. These observations underscore the importance of incorporating the influences of Tibetan Plateau lakes into weather forecasting and climate modeling.

In conclusion, this research provides substantial observational evidence that the lakes on the Tibetan Plateau act as crucial triggers for weather patterns, offering valuable insights for understanding and predicting the complex and dynamic meteorological processes in the region and beyond.

How to cite: Ma, W., Ma, Y., and Ma, W.: The Tibetan Plateau Lakes: Early-stage research progress of observational evidence as catalysts for weather patterns, EGU General Assembly 2024, Vienna, Austria, 14–19 Apr 2024, EGU24-2285, https://doi.org/10.5194/egusphere-egu24-2285, 2024.

EGU24-2322 | ECS | Posters on site | HS6.12

Simulation of mass balance of glaciers in the Parlung Zangbo Basin in southeast Tibet from 1980 to 2019 

Kunpeng Wu, Letian Xiao, Shiyin Liu, and Wei Yang

The Parlung Zangbo Basin, located in the southeastern Tibetan Plateau, where the marine glaciers are most concentrated. However, due to global climate warming over recent years, these glaciers have experienced substantial losses. By applying the Open Global Glacier Model (OGGM), we simulated the mass balance of 1,554 glaciers within the basin from 1980 to 2019. The results show that the mass balance of the entire Parlung Zangbo Basin was in a continuous state of loss from 1980 to 2019, with a rate of -0.41m w.e. a-1. The loss was even more severe in 2000-2019, reaching -0.56m w.e. a-1. Spatially, the southeast and northwest parts of the basin suffer from the most severe glacier losses, while the central and western parts have relatively less. The main causes of glacier mass loss are the increase in temperature and a slight decrease in precipitation. Through sensitivity analysis of temperature and precipitation, it was found that when the temperature rises by 1°C, the mass balance of 71.75% of the glaciers in the basin changes at a rate of -1000 to -500 mm w.e. a-1. When precipitation decreases by 20%, the mass balance of 62.81% of the glaciers changes at a rate of -450 to -300 mm w.e. a-1. Compared to precipitation, glaciers are more sensitive to changes in temperature. Meteorological data analysis from the National Meteorological Station and reanalysis data showed that the temperature increased by more than 1.5°C from 1980 to 2019. Total precipitation at the Bomi Station from 2000 to 2019 was 10% lower than in the previous 20 years, and the overall precipitation in the basin showed a decreasing trend. The ongoing rise in temperature, coupled with a marginal decline in precipitation, has resulted in sustained glacier mass reduction in the Parlung Zangbo Basin.

How to cite: Wu, K., Xiao, L., Liu, S., and Yang, W.: Simulation of mass balance of glaciers in the Parlung Zangbo Basin in southeast Tibet from 1980 to 2019, EGU General Assembly 2024, Vienna, Austria, 14–19 Apr 2024, EGU24-2322, https://doi.org/10.5194/egusphere-egu24-2322, 2024.

As a solid reservoir, glaciers play a significant role in regulating the variation of runoff abundance and dieback in the form of “peak-cutting and valley-filling”. The hydrological regulation function of glaciers is very important in cold regions, especially in the arid regions of Northwest China. The runoff estimation data from 2014 to 2100 were simulated by the VIC-CAS model in the cold region of western China. With perspectives of combinations of trend and fluctuation characteristics, glacier hydrological regulation index (Glacier R) was constructed based on the runoff variation coefficient method to analyze the stability of glacier runoff in 9 cold region basins of western China. The changes of the hydrological regulation function of glaciers in these basins are analyzed in detail during the historical period (1971–2010) and in the future to the end of the 21st century. The results show that: In the historical period and under the RCP2. 6 and RCP4. 5 scenarios, except for the Yangtze River basin, the decrease time node of glacier runoff in other basins of the Tibetan Plateau is 2020s, and that in the northwest inland basins is 2010s. In historical period and under the global emission scenarios of RCP2. 6 and RCP4. 5 to the end of the 21st century, although the glacier runoff in most of cold region basins in western China showed a decreasing trend, the fluctuation range decreased or had no obvious change, and the stability of glacier runoff increased or had no change. Overall, hydrological regulation function of glaciers is high in the northwest inland river basins, while function is low in the basins of the Qinghai-Tibet Plateau. Under the global emission scenarios of RCP2. 6 and RCP4. 5, to the end of the 21st century, the hydrological regulation function of glaciers showed a weakening trend in all cold region basins of western China, and the weakening was more significant in the inland river basins of Northwest China. Under the global emission scenario of RCP4. 5,the hydrological regulation function of glaciers in the Muzati River decreased by 25. 4%, and all the basins of the Qinghai-Tibet Plateau remained at a low level. With the perspective of decadal variation, the hydrological regulation function of glaciers in the cold region basins of western China was strong during the period of 1970s–2010s, especially in the 1980s and 2000s. Under the global emission scenarios of RCP2. 6 and RCP4. 5, the hydrological function of glaciers showed a weakening trend obviously in the future to the end of 21st century. The earliest time node in the cold region basins is 1970s, and the latest is 2020s.

How to cite: Yang, J. and He, Q.: Future change of hydrological regulation function of glaciers in the cold region basins of western China , EGU General Assembly 2024, Vienna, Austria, 14–19 Apr 2024, EGU24-2441, https://doi.org/10.5194/egusphere-egu24-2441, 2024.

EGU24-2548 | ECS | Orals | HS6.12 | Highlight

Shifts in the peak vegetation growth over Tibetan Plateau 

Dan Liu, Fandong Meng, Chaoyi Xu, Tao Wang, and Shilong Piao

Understanding the seasonality of vegetation growth is important for maintaining sustainable development of grassland livestock systems over the Tibetan Plateau (TP). In this study, we investigate the shifts of the date of peak vegetation growth and its climatic controls for the alpine grasslands over the TP during 2001–2020. The date of peak vegetation growth over the TP advanced by 0.81 days decade-1 during 2001–2020. This spring-ward shift mainly occurs in the semi-humid eastern TP, where the peak growth date tracks the advancing peak precipitation, and shifts towards the timing of peak temperature. Through analyzing the synchrony of peak vegetation growth and climatic peaks, we showed that 26% of the semi-humid eastern plateau is shifting from thermal-constrained ecosystem towards water-constrained ecosystem. The advancing peak growth over the eastern TP could significantly stimulate GPP, but this positive effect is weakened from 3.02 gCm-2 year-1 day-1 during 2000s to 1.25 gCm-2 year-1 day-1 during 2010s. Our results highlighted the importance of water availability in vegetation growth over the TP, and indicated that the TP grassland is moving towards a tipping point of transition from thermal-constrained to water-constrained ecosystem under a rapid warming climate.

How to cite: Liu, D., Meng, F., Xu, C., Wang, T., and Piao, S.: Shifts in the peak vegetation growth over Tibetan Plateau, EGU General Assembly 2024, Vienna, Austria, 14–19 Apr 2024, EGU24-2548, https://doi.org/10.5194/egusphere-egu24-2548, 2024.

EGU24-3167 | ECS | Orals | HS6.12

Impacts of the Tibetan Plateau on aridity change over the Northern Hemisphere 

Zhaokui Gao, Xiaodan Guan, Bian He, Long Zhao, Yongkun Xie, Yongli He, and Fei Ji

Aridity change in the Northern Hemisphere (NH) is a vital topic in exploring climate change. The Tibetan Plateau (TP) is essential for its role in climate variability over the NH. We applied the ensemble empirical mode decomposition (EEMD) to the aridity index (AI) from 20°-60°N in this study. The EEMD method extracts a set of intrinsic mode functions (IMFs) with various timescales. Results from our analysis reveal that the multi-decadal oscillation of AI makes 35% contribution to the variability of the AI. And the multi-decadal oscillation of the TP thermal forcing makes 18.15% contribution to the multi-decadal variability of the AI, which is often ignored in previous studies. The dynamic and thermal effects of the TP also affect the AI change, which illustrates a mode of meridional difference around 40°N, with wetting in the north and drying in the south. Meanwhile, the dynamic effects of the TP lead to latitudinal difference north of 40°N in Asia, with drying Northeast Asia. Such meridional and latitudinal differences over South Asia, Southeast Asia and southern China are controlled by a high-pressure system from 850 hPa up to 500 hPa, which results in an increase of sinking motion from 20°-40°N with obvious continuous drying effect.

How to cite: Gao, Z., Guan, X., He, B., Zhao, L., Xie, Y., He, Y., and Ji, F.: Impacts of the Tibetan Plateau on aridity change over the Northern Hemisphere, EGU General Assembly 2024, Vienna, Austria, 14–19 Apr 2024, EGU24-3167, https://doi.org/10.5194/egusphere-egu24-3167, 2024.

EGU24-3282 | Posters on site | HS6.12 | Highlight

Hillslope and river runoff generation in permafrost areas: a case study in the Qilian Mountains 

Fan Zhang, Chen Zeng, and Shenqi Xie

Permafrost is widely distributed across the Tibetan Plateau and plays a significant role in regional hydrological processes. This study focuses on a permafrost catchment located at Dadongshushan Yakou, Qilian County, Qinghai Province, China. Water samples, including rainfall, soil water (encompassing mobile soil water, bulk soil water, and supra-permafrost groundwater), ground ice, and runoff from hillslope plot, were collected during various thawing stages from May to September in 2021 and 2022. Stable isotope and hydrochemical analyses were utilized to trace the sources of hillslope runoff. Additionally, a standard runoff plot on a typical hillslope and a gauging weir at the catchment outlet were established to monitor hillslope and river runoff from July to August in both 2021 and 2022. Analysis of the data yielded several key findings: (1) Ground ice meltwater and rainfall were identified as the primary sources of hillslope runoff in spring (approximately 70%) and summer (60-80%), respectively. (2) The thickness of the saturated layer emerged as the pivotal factor influencing lateral subsurface flow on permafrost hillslopes during the summer months. (3) Slow runoff in forms of subsurface flow and quick runoff originating from river channel rainfall accounted for more than 90% and less than 10% of the total river runoff during the summer period, respectively. These results indicate that the combined effects of rainfall and groundwater thawing contributed to the formation of a super-permafrost saturated soil layer, which subsequently initiates a chain process where the saturated soil layer interacts with rainfall to supply streamflow in the river channel. This study enhances our understanding of the hydrological significance of the active layer thawing process and supra-permafrost groundwater, providing a theoretical foundation for the future development of hydrological models in permafrost regions.

How to cite: Zhang, F., Zeng, C., and Xie, S.: Hillslope and river runoff generation in permafrost areas: a case study in the Qilian Mountains, EGU General Assembly 2024, Vienna, Austria, 14–19 Apr 2024, EGU24-3282, https://doi.org/10.5194/egusphere-egu24-3282, 2024.

EGU24-3329 | ECS | Orals | HS6.12

Evaluation of MODIS LST products over the Tibetan Plateau and plain areas with in situ measurements 

Yuting Qi, Lei Zhong, Yaoming Ma, Yunfei Fu, Zixin Wang, and Peizhen Li

Land surface temperature (LST) is a crucial physical parameter for hydrological, meteorological, climatological, and climate change studies. To encourage the use of satellite-derived LST products in a wide range of applications, providing feedback on product performance over regional and global scales is an urgent task. However, considering that the uncertainty of newly released LST products is still unclear, it is urgently necessary to perform a comprehensive validation and error analysis, especially in areas with special geographical and weather conditions such as the Tibetan Plateau (TP). In particular, fewer studies have been concerned with the degraded LST retrieval accuracy over the TP because of the sparse ground measurements. In this study, MODIS LST products (C6) were comprehensively evaluated based on independent ground observation systems with different atmospheric and LST conditions. The in situ measurements collected from the TORP and SURFRAD systems are located on the North American Plain and the TP, respectively, incorporating various land cover types, including barren land, grassland, cropland, shrubland and sparse and dense vegetation, among others. Prior to the validation, LST products with different spatial resolutions were compared to ensure the spatial representativeness of ground-based measurements at satellite pixel scale. The evaluation results indicated that relatively high-quality in situ LST can be obtained during nighttime with relatively homogeneous spatial distribution. Compared with the North American Plain (with a mean RMSE of 1.56 K), MODIS LST retrieval has larger discrepancies (mean RMSE of 2.34 K) over the TP with complex terrain and variable weather. Various factors affecting LST retrieval accuracy were analyzed, which were categorized into 1) the simulated atmospheric and surface temperature condition settings, 2) the input data uncertainty, and 3) others. Among them, the emissivity determination is the primary source of the uncertainty in the generalized split-window algorithm, where the overestimated emissivity causes an underestimation of LST. It is expected to develop new LST retrieval algorithm to meet the quality specifications of users over the TP. Overall, this study identifies critical further research needs and improve the understanding of LST product performance under complex circumstance.

How to cite: Qi, Y., Zhong, L., Ma, Y., Fu, Y., Wang, Z., and Li, P.: Evaluation of MODIS LST products over the Tibetan Plateau and plain areas with in situ measurements, EGU General Assembly 2024, Vienna, Austria, 14–19 Apr 2024, EGU24-3329, https://doi.org/10.5194/egusphere-egu24-3329, 2024.

EGU24-3341 | ECS | Orals | HS6.12

Accurate calculation of Land Surface Heat Flux Based on Soil Observations over the Tibetan Plateau 

Jianan He, Weiqiang Ma, Longtengfei Ma, Weiyao Ma, and Lele Shi

The land surface heat flux is a crucial parameter that plays a significant role in the transformation and cycling of energy and matter between the atmospheric and land surface layers. This parameter serves as an essential input for various numerical models. Most land surface schemes deduce soil heat flux by amalgamating the heat conduction equation and residual method of energy balance. However, substantial discrepancies could be observed in soil heat flux simulations. These occurred among different Numerical Weather Prediction and offline Land Surface models, even though they were driven by the same atmospheric processes. The presence of discrepancies in models necessitated the accurate calculation of soil heat flux in order to reduce uncertainty in the allocation of sensible and latent heat flux at the surface. By reducing this uncertainty, we could decrease uncertainties in surface energy partitioning, achieved through diminishing the bias in simulated precipitation. However, in the Tibet plateau, soil heat flux observations were sparsely distributed, and the coverage period was different and limited, primarily used for model and remote sensing validation. There was a notable gap in research on the precise variations in soil heat flux in the Tibet plateau, particularly in studies employing sampled soil observations to accurately calculate soil heat flux. This study addressed these aforementioned deficiencies by focusing on soil attributes in the Tibet plateau to accurately calculate soil heat flux. In calculating soil heat flux precisely, factors like topography, land use, and vegetation type were considered. To ensure stability, representative soil cores were carefully observed and selected, obtaining samples through a layer-by-layer sampling approach. All sampling work had currently been completed.

Utilizing comprehensive, synchronous, and continuous soil heat flux observations at the BJ site, in conjunction with long-term observational data and soil samples, we employed sampled soil attributes and soil heat flux plate observations to ascertain the requisite parameters for accurate soil heat flux calculation. These parameters, including the physical properties and porosity of soil profiles, enabled us to precisely determine the surface soil heat flux fluctuations at the BJ site. As a result of global warming, the Nagqu region had experienced elevated temperature, augmented precipitation, and amplified soil heat flux. In summary, accurately calculating soil heat flux is vitally important for allocating sensible and latent heat flux at the surface, which in turn diminishes uncertainty in the surface energy balance within models. This reduction in uncertainty is crucial for establishing a foundation to mitigate biases in local precipitation simulations within existing models.

How to cite: He, J., Ma, W., Ma, L., Ma, W., and Shi, L.: Accurate calculation of Land Surface Heat Flux Based on Soil Observations over the Tibetan Plateau, EGU General Assembly 2024, Vienna, Austria, 14–19 Apr 2024, EGU24-3341, https://doi.org/10.5194/egusphere-egu24-3341, 2024.

 Short term heavy rainfall is often caused by small and medium-sized systems, and its occurrence and development are very rapid, with strong locality, drastic changes, and complex causes. Monitoring, forecasting, and early warning of it have always been a hot and difficult point in meteorological forecasting services. Using hourly precipitation observation data from 18 benchmark (basic) meteorological stations and 489 regional meteorological stations in Ganzi Prefecture from April to October 2012 to 2021, the spatial and temporal distribution characteristics of short-term heavy precipitation in Ganzi Prefecture on the western Sichuan Plateau were statistically analyzed. The results showed that: 1) The total frequency of short-duration heavy rainfall during the flood season in Ganzi Prefecture from 2012 to 2021 was 1906 times, with an average of 190.6 times per year, and the frequency decreased exponentially with increasing magnitude, with 15-25mm/h short-term heavy precipitation accounting for more than 84%. 2) The diurnal variation of short-duration heavy rainfall showed a bimodal pattern, with the peak occurring from 20:00 to 22:00 Beijing time, and the highest peak at 22:00, followed by 20:00. Short-duration heavy rainfall is more likely to occur from the afternoon to the first half of the night. The monthly variation showed a unimodal pattern, with the most occurrences in July (30.16%), followed by June and August. The interannual variation was uneven, with an average total frequency of 190 occurrences per year. The frequency of short-duration heavy rainfall in 2012 was the lowest, with only 38 occurrences, while in 2020, it was the highest, with 336 occurrences. 3) The frequency of short-duration heavy rainfall was higher in the southern and eastern regions compared to the northern and western regions, indicating an uneven spatial distribution.The highest frequency occurred in the southern part of Luding County, followed by the southern part of Jiulong County, which are the high-incidence areas of short-duration heavy rainfall in the entire prefecture. Short-duration heavy rainfall mainly occurred at an altitude of 1100-3900m, with the most occurrences at an altitude of 1100-1900m, and the maximum peak rainfall intensity of 63.3mm/h occurred in the altitude range of 1100-1300m. Short-duration heavy rainfall in Ganzi Prefecture is closely related to altitude, which is the result of the interaction between complex terrain and regional circulation.

How to cite: Maoshan, L. and Xu, Y.: Temporal and Spatial Distribution Characteristics of Short-Duration Heavy Rainfall in Ganzi Prefecture of Eastern Slope of Tibetan Plateau, EGU General Assembly 2024, Vienna, Austria, 14–19 Apr 2024, EGU24-3701, https://doi.org/10.5194/egusphere-egu24-3701, 2024.

The cryosphere has an important impact on regional water resources and ecosystems in the Chinese Altai
Mountains and its piedmont zone. Using the latest remote-sensing datasets of cryosphere changes and combining
with in-situ observation data from glacier monitoring stations and snow cover surveys, the main cryosphere
elements including glaciers, snow cover, and permafrost are investigated with emphasis on their changes since
2000 and the current situation. Their water resource effects are also discussed. The results indicate that although
the glaciers in the region have experienced continuous and intensive melting, mass loss has slowed because both
glacier area shrinkage and thickness reduction were larger during 2000–2010 than during 2010–2021. Snowcover
water equivalent (w.e.) has increased due to obvious increases in snow depth, although snow-cover
area has decreased slightly. Permafrost has been degrading. Overall, cryosphere contributions to the regional
water resource are approximately 40.9% since 2000, among which snow-cover melting is the largest, contributing
37.1% to water resources in the Irtysh River Basin and significantly more in the mountainous sub-basins
with increased snowfall. Glacier melting contributes 2.9%~3.4%, lower than earlier estimations of 3.4%
~3.6% for the late 20th century. Permafrost thaw caused by active layer thickening contributes approximately
0.59%. Meteorological data shows a warming and wetting trend, but summer temperature has a much lower
increase rate and a slowing increase trend after 2013. Moreover, snowfall frequency has increased. In the future,
glacier water resource contribution will continue to decrease, but the water resource effects of snow-cover
melting and permafrost degradation would increase.

How to cite: Wang, P.: Cryosphere changes and their impacts on regional water resources in the Chinese Altai Mountains from 2000 to 2021, EGU General Assembly 2024, Vienna, Austria, 14–19 Apr 2024, EGU24-3711, https://doi.org/10.5194/egusphere-egu24-3711, 2024.

A noticeable wet bias persists over the Tibetan Plateau (TP) during summer in both global and regional climate models, despite numerous advancements and ongoing efforts to lower it. This study investigates the performance of the Gaussian Probability Density Function (GPDF) cloud fraction scheme in the Weather Research and Forecasting (WRF) model over the TP during July and August 2018. The evaluation reveals that the GPDF scheme mitigates the wet bias over the TP in simulations at two resolutions (0.1° and 0.05°), with a significant reduction in the bias. This scheme also reduces the overestimation of downward surface shortwave radiation, indicating an improvement in cloud simulations. We propose that the GPDF scheme alleviates the wet bias through both local moisture process and dynamic process. Specifically, an increase in cloud water/ice content leads to a reduction in surface net radiation and subsequent decrease in surface sensible heat flux and evapotranspiration. This diminished surface heating lessens the thermal effect of the TP, causing a weakened monsoon circulation and decreased moisture flux convergence over the TP. Both the decreases in local evapotranspiration and remote moisture flux convergence contribute to the alleviation of the wet bias, and the latter plays a dominant role, contributing to approximately 70% of the precipitation decrease.

How to cite: Liu, J., Yang, K., Zhao, D., Wang, J., Zhou, X., and Lin, Y.: Implementing Gaussian Probability Density Function cloud fraction scheme in WRF much reduces the wet bias over the Tibetan Plateau in high-resolution simulations, EGU General Assembly 2024, Vienna, Austria, 14–19 Apr 2024, EGU24-3727, https://doi.org/10.5194/egusphere-egu24-3727, 2024.

This study evaluated the monthly characteristics of TLRs based on the results derived from 18 observation stations in Bhutan (1996–2009), 56 stations in Nepal (1985–2004), and 53 observation stations in Pakistan (1971–2000). The study covers an elevation range of 5–3920 m above sea level, with various topography, climatic regimes, and geographical coordinates. Various empirical analysis techniques, including thermodynamics and hydrostatic systems, have been used to obtain the results. The annual cycle of TLR, such as a bi-modal pattern (two minima in the winter and summer and two maxima in the pre- and post-monsoon seasons), is a typical pattern throughout the study area. However, the forcing strengths, mechanisms, and processes for the monthly variations in TLR magnitude and diurnal range differed. Monsoon, orographic controls, and mountain barrier effects on TLR are more robust in summer, especially during the day, while the influences of inversions and mountainous microclimates are higher during the non-monsoon period, particularly in the winter and at night. A shallower TLR occurs in summer throughout the study area because of the intense heat exchange process within the boundary layer, corresponding to warm and moist monsoonal atmospheric conditions. Steeper values of TLR in the non-monsoon period, especially in the pre- and post-monsoon seasons, result from strong dry convective cooling at higher elevations owing to high thermal forcing effects at lower elevations. The winter shallower TLR is associated with westerly-driven cold air flow towards the lower elevations and radiative cooling, especially at night, excluding Bhutan. There are systematic differences in TLRs monthly and diurnal variations in magnitudes, such as the lowest gradient value in Pakistan observed in August and the highest in May, one month later than observed in Nepal and Bhutan, due to the late arrival of monsoon moisture in summer and intense thermal forcing effects following the wet early pre-monsoon months. In addition to the variation in magnitudes, the variation in the diurnal range from one place to another is also due to distinct differences in topoclimate, in addition to the effects of the synoptic regime, moisture amounts, elevations, geographical coordinates, variations in net radiation, surface roughness, vegetation coverage, and distance from the sea coast. The results of this study are useful for determining the local or regional climatic behavior or interactions, climate reconstruction, and temperature field in various glacial-hydro-climatic, ecological, and agricultural modeling.

How to cite: Kattel, D. B., Yao, T., and Ullah, K.: Evaluations of Temperature Lapse Rate in and Around the East-West Himalayan Chain: An Implication for Climate Understanding and Modeling, EGU General Assembly 2024, Vienna, Austria, 14–19 Apr 2024, EGU24-3732, https://doi.org/10.5194/egusphere-egu24-3732, 2024.

The climate simulation over the Tibetan Plateau (TP) remains a challenge for climate models, limiting the reliability of future climate projections over there. This study focuses on the performance of regional climate models (RCMs) under the Coordinated Regional Climate Downscaling Experiment (CORDEX-II) in reproducing the climate over the TP, an overlapping regions that is encompassed by the CORDEX-EA, CORDEX-CA and CORDEX-WA, and assesses the uncertainty due to the choice of domain. The results show that all RCMs can capture the observed spatial distribution and annual cycle of temperature and precipitation over the TP, with overall cold and wet biases. Compared to the RCM itself, the choice of domain has little impact on the simulations, and such impact is larger in summer than in other seasons. Further analysis suggests that the downward shortwave radiation is the main contributor to the diverse temperature simulations among the RCMs for all seasons, and the underestimated number of wet days (R1mm) in the RCMs may be related to the lower frequency of 1-5mm rainfall. Furthermore, the effects of the choice of domain on precipitation simulation are mainly in the magnitude, while the effects on temperature simulation are mianly in the interannual variability.

How to cite: Niu, X. and Li, P.: Assessment of climate simulation over the Tibetan Plateau based on multidomain simulations within CORDEX-II, EGU General Assembly 2024, Vienna, Austria, 14–19 Apr 2024, EGU24-4259, https://doi.org/10.5194/egusphere-egu24-4259, 2024.

EGU24-4354 | ECS | Posters on site | HS6.12

Extreme precipitation detection ability of four high-resolution precipitation products dataset in Nepal 

Sunil Subba, Yaoming Ma, Weiqiang Ma, and Cunbo Han

Due to Nepal's propensity for extreme precipitation (EP), it is essential to thoroughly research and comprehend the pattern that these occurrences have followed in previous years. However, precise precipitation information for EP research from densely-gauged networks is still difficult to obtain in mountainous countries like Nepal. This will consequently impede the dissemination of knowledge pertaining to the variability of extreme precipitation events in Nepal. The lacking factors in the current research trend could be attributed to the following points: (1) Very few to none studies that utilized the recently released high-resolution precipitation products in Nepal to identify their EP detection ability, (2) Most of the studies focused on the characterization of EP events in Nepal rather than its spatial and temporal variability. In order to address these issues, four high-resolution precipitation product datasets (PPDs) were evaluated for their extreme precipitation detection ability across Nepal from 1985 to 2020, namely, ERA5 Land reanalysis data, satellite-based precipitation data (PERSIANN_CCS_CDR), and merged datasets (CHIRPS_V2.0 and TPHiPr). The Mann-Kendall test trend, Sen's slope estimator, and various statistical and categorical indices were used to assess how well these PPDs performed. TPHiPr merged dataset represented monthly precipitation estimates better than other PPDs. In addition to having the highest CSI and the highest ACC, TPHiPr also has a high POD and a low FAR. As a result, it can be said that TPHiPr is the best PPD for determining whether there is 0.1 mm of precipitation per day across Nepal or not. Since it had fewer representational errors for the majority of the EP indices, TPHiPr was also rated as the best in terms of their temporal representation. TPHiPr dataset and the observed dataset showed stronger correlations for some EP indices, including frequency EP indices (R10mm, R20mm, and R25mm) and intensity EP indices (RX1 day, RX5 day, PRCPTOT, and R99p). Hence, it performed better than other PPDs in accurately capturing the spatial distribution of EP occurrences in Nepal for the period of 1985 to 2020 based on the aforementioned facts. This dataset can be used to improve existing knowledge in Nepalese hydrometeorology and climate research.

How to cite: Subba, S., Ma, Y., Ma, W., and Han, C.: Extreme precipitation detection ability of four high-resolution precipitation products dataset in Nepal, EGU General Assembly 2024, Vienna, Austria, 14–19 Apr 2024, EGU24-4354, https://doi.org/10.5194/egusphere-egu24-4354, 2024.

Unstable hydrological cycles and water resource instability over and around the Tibetan Plateau (TP) are a topic of wide concern. The Indian Summer Monsoon (ISM) is one of the TP’s most important moisture sources; as such, its behavior is key to any changes in precipitation and water-related environments. However, there have been relatively few thorough investigations into ISM activities. Here we primarily explore ISM activities using outgoing longwave radiation (OLR) datasets in TP, and precipitation isotopes recorded at Lhasa, for the period 1975-2020. Our major findings are that: (1) the ISM onset (retreat date) is between ~May 31-July 19 (~August 8-September 27), with ISM duration of ~40-110 days; (2) significant spatial inhomogeneous patterns are evident in ISM activities, i.e., the western part of our study area experiences earlier ISM onset, delayed retreat, longer duration, and greater intensity and strength; the inverse is true in the eastern sector of the study area; (3) the ISM activities that dominate the 1975-1998 period determine their general patterns over the entire 1975-2020 period, taking into account evident discrepancies in subperiods; (4) the negative relations between precipitation δ18O and ISM intensity/strength at Lhasa confirm the ISM activities defined using OLR. These results will improve our understanding of hydrological cycles in TP, and provide insights into hydrological studies in the “Asian Water Tower” region.

How to cite: Guo, X.: Spatiotemporal variabilities of the recent Indian Summer Monsoon activities in the Tibetan Plateau: a reanalysis of outgoing longwave radiation datasets, EGU General Assembly 2024, Vienna, Austria, 14–19 Apr 2024, EGU24-4523, https://doi.org/10.5194/egusphere-egu24-4523, 2024.

The Southwest China vortex (SWCV) is that under the special terrain and circulation conditions of the Tibetan Plateau (TP), a meso-α-scale cyclonic low system with 300-500km horizontal scale at 700hPa or 850hPa in Southwest China. Being the important influencing system for the large area heavy precipitation in China summer half year, it is the second rainstorm weather system in China after typhoon in the intensity, frequency, and range of the caused rainstorms. So, SWCV and its weather influences are one of the main directions in Plateau Weather Science. And the research on the vortex source of SWCV has been always the key point of close attention.

The new related progresses in researches of the vortex source of SWCV system are reviewed for the last 10 years. In particular,it is recognized that because of the multi-scale effects between the topography and circulation,the vortex source of SWCV has the multi-scale characteristic of its distribution, and there are obviously differences between the structure、evolution、cause and influence of SWCV with the different vortex sources. The vortex sources of SWCV have closely connection each other. The upper-reach vortex sources such as Jiulong&Xiaojin have an important effect on the lower-reach vortex sources such as the Basin. The“effect of upper-reach vortex source”of SWCV, atmospheric gravity wave connecting with the complex topography,internal atmospheric process induced by precipitation, and the anomalous influences of East Asia monsoon are also the formation mechanisms for the vortex source of SWCV. And the formation of SWCV is mainly determined by the speed of incoming airflow in the direction of the main axis of the Hengduan Mountains. The formation vortex source of SWCV is mainly determined by the relative position of the incoming airflow in the windward area and the main axis of the Hengduan Mountains.

But, for research on the vortex source of SWCV, there are some problems such as being weaker in fine observation and basic data,being unknown for the multi-scale structures of the vortex source and its evolution, being not deep to understand the formation cause of different vortex sources and being incomplete in study of the SWCV evolutions and its effects of different vortex sources.

How to cite: li, Y.: The Related Researches of the Vortex Sourceof Southwest China Vortex Weather System, EGU General Assembly 2024, Vienna, Austria, 14–19 Apr 2024, EGU24-4952, https://doi.org/10.5194/egusphere-egu24-4952, 2024.

Using observational data of soil moisture from the third Tibetan Plateau Experiment for atmospheric science (TIPEX III), the seasonal and diurnal variations characteristics of soil moisture at different depths of 5–160 cm from seven stations were analyzed, with emphasis on the comparative analysis of the differences of soil moisture between different sites and the differences of the synergistic relationship between soil moisture and temperature. The soil moisture was wet in the southeast and dry in the northwest. The studied sites were Lhari, Biru, Nyainrong, Amdo, Nagqu, Baingoin and Seng-ge Kambab in descending order, according to the soil moisture. The seasonal variation of soil moisture at the different sites showed a significant three-peak structure, which was more obvious in the shallow layer than in the deep layer. The first peak occurred from March to May, which was mainly due to the soil thawing in spring. The other two peaks corresponded to the two rainy seasons in the plateau. Soil moisture was the greatest during this rainy period. The diurnal variations of soil moisture and temperature in Amdo, Nagqu, Nyainrong and Baingoin showed a significant positive correlation in the four seasons. The soil moisture and temperature in Lhari and Biru were significantly positively correlated in winter and spring but negatively correlated in summer and autumn. The profiles of the soil moisture with depth varied greatly at different stations in different seasons. The distribution of soil water content at each observational site did not increase or decrease with depth but showed a certain high aquifer, which might be related to the types of the underlying surface and physical properties of soil. During the summer monsoon period, soil moisture in the shallow layer of 5–10 cm was higher at all observational sites. The spatial distribution of soil moisture in the plateau was more heterogeneous than that in the plain area, and only in the central part of the Tibetan Plateau, the soil moisture varied greatly from site to site. This also indicated that it was unreasonable to only use the soil moisture of several stations to represent the overall soil moisture of the region. The results provided a multi-angle observational basis for the validation of satellite data and parameterization of the numerical model of soil moisture over the Tibetan Plateau.

How to cite: Wang, G.: The Seasonal and Diurnal Variation Characteristics of SoilMoisture at Different Depths from Observational Sites over the Tibetan Plateau, EGU General Assembly 2024, Vienna, Austria, 14–19 Apr 2024, EGU24-4981, https://doi.org/10.5194/egusphere-egu24-4981, 2024.

The study of the atmospheric boundary layer (ABL) on the Tibetan Plateau (TP) is important to understand surface heat and moisture balances, as well as weather and climate change on the TP and surrounding areas. However, studies focusing on the ABL during different monsoon periods across the TP are limited. Here, we investigated the convective boundary layer height (CBLH) during the pre-monsoon, monsoon, and post-monsoon periods using radio sounding data at six research stations on and near the TP. During the pre-monsoon period, the CBLH of TP stations gradually decreased from south to north, peaking at 3444 m. During the monsoon period, there was a gradual decrease in CBLH from north to south, with a peak of 3393 m. Notably, stations heavily influenced by the monsoon (Shiquanhe, BJ, and QOMS stations) experienced declining CBLH as the monsoon advanced, while others saw an increase. During the post-monsoon period, the CBLH at Shiquanhe station, located on the western TP, was consistently highest, reaching a maximum of 3679 m. CBLH increased at Shiquanhe, BJ, and QOMS stations as the monsoon retreated but decreased at the remaining stations. Surface flux observations revealed that stations heavily impacted by the monsoon exhibited a minimal contribution ratio (CR) of sensible heat flux to convective boundary layer (CBL) development during the monsoon period. Furthermore, these monsoon-impacted stations exhibited the highest stability of the mid-lower atmosphere during the monsoon period, hindering CBL development.

How to cite: Wang, C., Ma, Y., Han, C., and Zhang, Y.: Characteristics and Influencing Factors of Convective Boundary Layer Height on the Tibetan Plateau During Different Periods of the Summer Monsoon, EGU General Assembly 2024, Vienna, Austria, 14–19 Apr 2024, EGU24-5072, https://doi.org/10.5194/egusphere-egu24-5072, 2024.

A pronounced subsurface warming occurs in the southern Bay of Bengal (BOB) during the summer monsoon (from July to September), as revealed by the data from Array for Real-time Geostrophic Oceanography (Argo). This subsurface warming can be attributed to the deepened thermocline, which plays a crucial role in regulating the ocean subsurface temperature. The variations of thermocline in the southern BOB are primarily influenced by local and remote forcing, with local forcing dominating and remote forcing being a secondary contributor. To better understand the individual effects of each forcing mechanism, a 1.5-layer reduced gravity model is employed in this study. The model shows that the equatorial zonal wind stress reaches its first peak in May, inciting downwelling Rossby waves from the eastern boundary of BOB. These equatorial waveguides rapidly deepen the thermocline of the entire southern BOB in June. From July to September, the southwest monsoon intensifies and prevails, forcing the annual Rossby wave and local Ekman pumping that sustains the thermocline in the southwestern BOB. Simultaneously, the remote forcing causes negative effect by shoaling the thermocline in the eastern region, thus accentuating the observed warming trend in the west. This study discusses the complex air-sea interaction in the BOB, contributing to a deeper understanding of the upper thermal structure within BOB. In addition, the findings provide valuable insights to enhance weather forecasting capabilities in the surrounding countries.

How to cite: Chen, T.: A boreal summer warming in the subsurface of the Bay of Bengal and its dynamics, EGU General Assembly 2024, Vienna, Austria, 14–19 Apr 2024, EGU24-5534, https://doi.org/10.5194/egusphere-egu24-5534, 2024.

EGU24-5720 | Orals | HS6.12

Variations in sensible heat flux of High-Asia and their relationship with China's summer precipitation 

Nan Yao, Yaoming Ma, Xueying Li, and Jian Peng

The High-Asia (HA), which includes the Tibetan Plateau (TP), Iranian Plateau (IP) and Mongolian Plateau (MP), is experiencing a warming rate that is twice the global average. The increasing temperature is causing significant changes in thermal conditions across the HA and surrounding regions, which may further affect China's summer precipitation. This study used datasets from the ERA5-Land reanalysis and the high-resolution China Meteorological Forcing Data to investigate variations in SH over three plateaus of HA, and to explore the relationship between these variations and changes in China's summer precipitation. The results indicate that variations in summer SH of the HA are the largest, making them the primary contributor to the annual mean values. The summer SH over TP exhibited a decreasing trend from 1979 to 2021 (-0.47 W m-2 decadal-1, p<0.05), in contrast with the trends in IP and MP (0.59 and 1.46 W m-2 decadal-1, respectively, p<0.05). Additionally, based on the empirical orthogonal unfolding method, the dominant SH pattern over the HA revealed that the variation over the TP was opposite to that over IP and MP, and this pattern experienced a significant interdecadal shift in 1999. Moreover, The initial leading temporal expansion series of singular value decomposition showed a consistent trend in SH over the HA and summer precipitation in China (correlation coefficient=0.85, p<0.05), and an abrupt change was observed during 1998-1999. The dominant spatial pattern demonstrated that interdecadal drought in the northeast China and the Yangtze River valley exhibited a significantly positive correlation with the leading SH pattern over the HA. Conversely, increased precipitation in the northwest and south of China showed a negative correlation. Our study suggests a link between SH over HA and China's summer precipitation, providing new insights into understanding the mechanisms underlying changes in China's summer precipitation.

How to cite: Yao, N., Ma, Y., Li, X., and Peng, J.: Variations in sensible heat flux of High-Asia and their relationship with China's summer precipitation, EGU General Assembly 2024, Vienna, Austria, 14–19 Apr 2024, EGU24-5720, https://doi.org/10.5194/egusphere-egu24-5720, 2024.

EGU24-7167 | Orals | HS6.12 | Highlight

How lake breezes impact convection on the Tibetan Plateau: A large-eddy simulation study 

Cunbo Han, Yunshuai Zhang, and Yaoming Ma

Lake breezes are verified to play an important role in atmospheric boundary-layer development, convection triggering, and the transition from shallow to deep convection. The Tibetan Plateau (TP), known as the “Asian water tower”, contains more than 50% of China’s lakes in terms of area. In his study, we investigated the convection development in summer afternoons over lakeside land on the TP, the interaction between lake breezes and shallow convection triggering, the effect of lake diameter on the transition from shallow to deep convection, and the mechanism of soil moisture changes in lakeside land affecting the convection development. Using the WRF-LES model, which couples the lake model and land surface model in an idealized configuration, we performed two sets of idealized simulations with varying lake diameter and soil moisture content in the WRF-LES and found that: 1) larger lakes produce stronger lake breeze circulations and more moisture is advected from the lake to the lakeside land and lifted, creating wetter and boarder shallow convective clouds which accelerating the transition to deep convection; 2) The dryer soil induces stronger lake breeze circulations, which is beneficial for lifting the air parcels and generating moisture advection to maintain shallow convection over the lakeside land; 3) However, shallow convective clouds cannot be moistened and widened and develop into deep convection without sufficient evaporation from the ground surface in dry soil moisture conditions. Our simulation results highlight the importance of the horizontal and vertical transport of moisture by the lake breeze circulations in moistening and broadening shallow convective clouds and developing into deep convections.

How to cite: Han, C., Zhang, Y., and Ma, Y.: How lake breezes impact convection on the Tibetan Plateau: A large-eddy simulation study, EGU General Assembly 2024, Vienna, Austria, 14–19 Apr 2024, EGU24-7167, https://doi.org/10.5194/egusphere-egu24-7167, 2024.

EGU24-7292 | Orals | HS6.12

Nutrient accumulation by biologically active soil cover in a dry, high-altitude glacier foreland in the NE Pamir (Tajikistan) in the context of ongoing climate changes 

Monika Mętrak, Mateusz Wilk, Iwona Jasser, Łukasz Chachulski, Bartosz Korabiewski, and Małgorzata Suska-Malawska

The foreland of the Uisu Glacier, located in NE Pamir, is characterized by a combination of processes typical for periglacial and hyperarid areas. Therefore, the development of vegetation and soils is significantly hampered there, with soil organic carbon pools being among the lowest reported worldwide (1.4 kg m-2 in the layer 0-50 cm). Given the extreme environmental conditions in the investigated area, we expected that (1) biological soil crusts (BSCs) of different developmental stages comprise the dominant part of the biologically active soil cover; and hence (2) play an important role in the accumulation of C, N and P, with the microbial biomass and total nutrient retention patterns positively related to their developmental stage. To assess the potential importance of BSCs for nutrient accumulation processes in soils of the study area, we compared the C, N, and P enrichment in soils under the BSCs with the same parameters in soils under vascular plants. Subsequently, we studied C, N and P accumulation in the soils from six distinct plant communities recorded in the foreland.

Our study showed that BSCs dominated in five out of ten study plots with recorded biologically active soil cover. Among them prevailed poorly developed morphotypes (no lichens, no bryophytes) with a mean coverage of 14%. Compared to advanced crusts (mean coverage 1.1%), they accumulated less total C, N and available P in their biomass. Yet, they were still the main biological soil-forming factor next to the plants (mean coverage of 8.6%) in our study site, given that stones and non-crusted bare soils covered most of the area (joint mean coverage over 80%). Soil-forming properties of both poorly developed and advanced crusts were confirmed by the observed enrichment of their sub-crust soils in total C, N and available P in comparison to non-crusted bare soils (on average, there were ~1.5 times more nutrients in soils under poorly developed crusts and ~2.5 more nutrients in soils under advanced crusts than in non-crusted bare soils). Moreover, the average enrichment observed for soils under advanced crusts was similar to the results obtained for soils under individual vascular plants from the same study plot (~2.5 times more than in non-crusted bare soils).

The large-scale studies of soils from the identified plant communities showed that only in three of them C and N amounts were higher than in the respective bare soils. Phosphorus content was similar in all the studied communities, with values approximately two times higher than for bare soils. Statistical analyses showed that the amount of C, N and P was strongly positively correlated with the percentage coverage of plants and with species diversity of the community (expressed as Shannon Wiener index and as a number of species).

As further aridification is projected for the Pamir, leading to the limitation of ecological niches available for vascular plants, BSCs could potentially become the most important or even the sole player in the accumulation of soil nutrients in many areas.

This work was supported by the Polish National Science Centre Grant No 2017/25/B/ST10/00468.


How to cite: Mętrak, M., Wilk, M., Jasser, I., Chachulski, Ł., Korabiewski, B., and Suska-Malawska, M.: Nutrient accumulation by biologically active soil cover in a dry, high-altitude glacier foreland in the NE Pamir (Tajikistan) in the context of ongoing climate changes, EGU General Assembly 2024, Vienna, Austria, 14–19 Apr 2024, EGU24-7292, https://doi.org/10.5194/egusphere-egu24-7292, 2024.

EGU24-7344 | Posters on site | HS6.12

Vertical ozone transport over the Tibetan Plateau and its impact on downstream areas 

Rongxiang Tian, Zhan Jin, Yancheng Zhu, and Chenyu Xiao

    Ozone is a crucial component of the atmosphere, serving as both a filter for ultraviolet radiation and a significant constituent of greenhouse gases. Additionally, it plays a vital role in photochemical smog. The complex terrain of the Tibetan Plateau makes it a sensitive and vulnerable region to global environmental and climate changes. Using the fifth reanalysis data for ozone from the European Centre and employing statistical and diagnostic analyses, we investigated the vertical transport of ozone and its downstream impacts. The results show that during summer, the predominant factor contributing to the formation of an "ozone hole" over the plateau is the upward transport of ozone with low concentrations from the troposphere. Conversely, in winter, the transportation of ozone with elevated concentrations from the stratosphere to the troposphere through specific channels significantly influences the distribution of ozone across the plateau. The blocking effect of the plateau causes elevated concentrations of lower tropospheric ozone downstream in the westerlies, at the same latitude. The research holds significant practical value for a comprehensive understanding of the patterns of ozone variation over the plateau and its downstream impacts, contributing to disaster prevention and mitigation efforts.

How to cite: Tian, R., Jin, Z., Zhu, Y., and Xiao, C.: Vertical ozone transport over the Tibetan Plateau and its impact on downstream areas, EGU General Assembly 2024, Vienna, Austria, 14–19 Apr 2024, EGU24-7344, https://doi.org/10.5194/egusphere-egu24-7344, 2024.

EGU24-7545 | Orals | HS6.12

Global chemical weathering patterns set by glacial erosion 

Xiangying Li, Ninglian Wang, Yongjian Ding, Rongjun Wang, Robert Raiswell, Shiqiang Zhang, Qiao Liu, Xiaobo He, Haidong Han, Tianding Han, Zhengliang Yu, Andrew C. Mitchell, and Tong Yi

Chemical weathering plays a crucial role in the long-term evolution of Earth’s climate, yet the spatial heterogeneity of the weathering rate and intensity driven by glacial erosion owing to glacial shrinkage worldwide is poorly constrained. Here we develop a global data set of cation denudation rate (CDR) and intensity (CDI) from mountain ranges, glacial regions and glacial catchments worldwide. Contemporary weathering rate and intensity are ~ 2 times higher than two decades ago, 2 ~ 6 times higher than Greenland ice sheet basins and over 2 times higher than whole ice sheet means. Their spatial patterns are characterized by relatively high weathering rate and intensity in low latitudes in contrast to low weathering rate and intensity in high latitudes. This is closely related to glacial erosion involving with temperature, precipitation, discharge, altitude and slope, suggesting that the element mobilization and CO2 budgets caused by glacial chemical weathering are likely to enhance in a warming landscape. We contend that subglacial chemical weathering is far more important than previously thought and should be considered in elemental cycles and carbon cycling.

How to cite: Li, X., Wang, N., Ding, Y., Wang, R., Raiswell, R., Zhang, S., Liu, Q., He, X., Han, H., Han, T., Yu, Z., Mitchell, A. C., and Yi, T.: Global chemical weathering patterns set by glacial erosion, EGU General Assembly 2024, Vienna, Austria, 14–19 Apr 2024, EGU24-7545, https://doi.org/10.5194/egusphere-egu24-7545, 2024.

Spring precipitation over South Asia during 2001 to 2010 was concentrated in the foot and slope of the southeastern Tibetan Plateau with two significant precipitation centers. Rainy day accounted for 99.3% and the average daily precipitation can exceed 11 mm, which was distinct from its surrounding areas. Given the spatial variability of spring precipitation, self-organizing map method (SOM) was firstly applied to cluster the precipitation types, and then the reanalysis product from ERA5 was used to explore the synoptic characteristics of different precipitation types. The results show that the westerly wind-dominated precipitation type occurred 92.2% of the frequency, but the cumulative precipitation only contributed to 73% and the maximum average precipitation was lower than 9.5 mm/day. While other precipitation types were classified to heavy rainfall, which were characterized by the development of a low-level trough, abundant water vapor from the Bay of Bengal, and upward movement. However, the difference of synoptic conditions caused the spatial variability of heavy rainfall: the dynamic-dominated precipitation was distributed at the junction of the Himalayas and the Hengduan Mountains, and the deep boundary layer jet to the north caused strong local convergence and uplift motion, which induced strong precipitation reaching 111.32 mm/day. The moisture-dominated precipitation was close to the northern coastline of the Bay of Bengal far away from the topography, and was feathered by abundant water vapor provided by strong southerly, leading to widespread precipitation up to 79.06 mm/day. We further investigate the reasons for the different circulation conditions. The surface sensible heat provided the necessary conditions for the development of a large-scale low-pressure trough, and apparent heat source generated by heavy precipitation further enhanced the local positive vorticity. This work reveals the dominant synoptic effects leading to spring precipitation over the foot and slope of the southeastern Tibetan Plateau, and deepens the understanding of hydrological cycle in South Asia with the joint influence of complex terrains.

How to cite: Wei, P.: Revealing the dominant synoptic effects leading to spring precipitation over the foot and slope of the southeastern Tibetan Plateau, EGU General Assembly 2024, Vienna, Austria, 14–19 Apr 2024, EGU24-8766, https://doi.org/10.5194/egusphere-egu24-8766, 2024.

EGU24-9033 | ECS | Posters on site | HS6.12

Lake breeze characteristics and high-resolution cloud products retrieved by wind profile radar in Nam Co, TP 

Lijun Sun, Binbin Wang, Yaoming Ma, and Xingdong Shi

Lake breeze systems can contribute substantially to the local climatic and hydrological variability by altering atmospheric boundary layer processes, such as the advection and convection of air flow, exchanges of turbulent latent and sensible heat fluxes, and the spatial heterogeneity of clouds and precipitation formation. However, the limited in situ measurements and the low spatiotemporal resolution of satellite products and reanalysis data has hindered our comprehensive and complete assessment of local atmospheric recirculation flows (i.e. lake breeze) over lake basins of the Tibetan Plateau. Here, based on the high-resolution wind profile radar measurements at Nam Co Station for one year (2022.6-2023.5), we analyzed the characteristics of lake breeze and clouds, and evaluated four popular reanalysis wind products (ERA5, MERRA-2, CSFv2, JRA55). The results showed that (1) The lake breeze had annual occurrence frequency of 29%, annual mean speed of 3.6 m/s, average onset 2-5 h after sunrise, annual mean duration of 4.8 h, and average vertical development height ranging from 300 m to 600 m. The lake breeze developed vigorously when the background wind was less than 6 m/s. Increased frequency, earlier onset time, and longer duration during May-September indicated lake breeze evident seasonal variation. (2) The diurnal variation of cloud frequency fluctuated around 0.5 from May-September, and the cloud frequency at night was higher than that during the day from October to April. (3) The wind direction deviation of 550hPa reanalysis data was large (RMSE > 60°, MAE: 43-48°), the wind field of 500hPa and above were in good agreement with the radar, and ERA5 had superiority.

Keywords: Tibetan Plateau, Nam Co, lake breeze, cloud base height, reanalysis data evaluation.

How to cite: Sun, L., Wang, B., Ma, Y., and Shi, X.: Lake breeze characteristics and high-resolution cloud products retrieved by wind profile radar in Nam Co, TP, EGU General Assembly 2024, Vienna, Austria, 14–19 Apr 2024, EGU24-9033, https://doi.org/10.5194/egusphere-egu24-9033, 2024.

Subglacial drainage system plays a central role in regulating chemical weathering processes in glacier environments. However, the influence of glacial drainage systems’ seasonal evolution on chemical weathering processes and consequent carbon sink effect is still unclear. This study selected the Parlung No. 4 Glacier in the southeast Tibetan Plateau (TP) and Kuoqionggangri Glacier in the central TP as the study areas, representing the typical temperate glacier and polar glacier, respectively. Sampling campaigns were conducted during the initial ablation period of those two glaciers when glacial drainage systems may undergo significant transformation. River water samples were collected almost daily for glacial runoff and 5-day intervals for outlets of the catchments. Evidences from tracer tests and Ca2+*/SiO2* show that glacial drainage system of the Kuoqionggangri Glacier is quite constant and it is dominated by a supraglacial pattern (* represents ionic concentration after atmospheric inputs correction). Subglacial drainage system of the Parlung No.4 glacier, however, transferred from a supraglacial pattern during the early monsoon season to a channelized pattern after June 25th. Cationic budget and major anionic sources discrimination (HCO3-) show that chemical weathering processes in the polar glacial catchment (Kuoqiongqu) has been displaying minor temporal change even though water discharge experienced a 7 times increment. Nevertheless, carbonate dissolution in the temperate glacial catchment (Rinongqu) was 24% decreased but sulfide oxidation 23% increased with the elapse of monsoon season. Its DIC (equivalent to HCO3-) sources from biological CO2 are 10% higher in early (before May 21st) and late monitoring periods (June 26th to July 10th) while the input proportion of atmospheric CO2 shows an opposite temporal change with 12% higher proportion from May 22nd to June 25th. The seasonal change of net CO2 consumption rate caused by chemical weathering (ФCO2_net) in the Kuoqiongqu catchment is positive correlated with water discharge, indicating carbon sink effect in the polar glacial catchments of the central TP is mainly governed by water discharge. ФCO2_net in the early subglacial channels reopen period is even slightly lower than that from April 2nd to May 10th when water discharge is more than 2.4 times lower because of dramatic increases in CO2 release rate caused by sulfuric acid dissolve carbonate (ФCO2_sul). This study highlights the evolution of glacial drainage system exerted crucial effects on carbon cycle by regulating chemical weathering processes.

How to cite: Yu, Z.: Contrasting variations of chemical weathering processes during the initial ablation period in two different glacial drainage systems, Tibetan Plateau, EGU General Assembly 2024, Vienna, Austria, 14–19 Apr 2024, EGU24-9127, https://doi.org/10.5194/egusphere-egu24-9127, 2024.

EGU24-9265 | Orals | HS6.12 | Highlight

Historical trend and future projection of climate extremes over the southern slope of Himalayas 

Deepak Aryal and Binod Pokharel

Uncontrolled human activities during the past few decades, specifically the burning of fossil fuels that release greenhouse gases have resulted in global warming and climate change. Climate change affects everyone and every region around the globe,but mountainous areas are particularly vulnerable because of their fragile topography, unique climate-sensitive ecosystems and dependency of billions of population on mountain resources. Due to the unique setup of the environment, warming in the mountainous areas, specifically the Himalayan region is expected more rapidly than the global average. Situating at the central part of the world’s largest and most complex mountain ranges, the Nepal Himalayas is not an exception;instead,the region is considered a climate change hotspot. The consequences of climate change around this region mainly include rapidly melting glaciers, formation and rapid expansion of glacier lakes, erratic rainfall, increasedfrequency and magnitude of extreme weather events, change in monsoon pattern, etc.

The historical data shows increasing precipitation in the monsoon season while precipitation is declining in dry seasons including winter. The downscaled and bias-corrected CMIP6 also consistently projects a similar pattern of precipitation in Nepal. The increasing precipitation in summer monsoon, particularly high-intensity events will bring more floods and landslides while the decreasing precipitation in dry seasons will create drought and forest fires over the region. We will present the different climate extreme indices to evaluate the impact of future climate for the Himalayan region.

How to cite: Aryal, D. and Pokharel, B.: Historical trend and future projection of climate extremes over the southern slope of Himalayas, EGU General Assembly 2024, Vienna, Austria, 14–19 Apr 2024, EGU24-9265, https://doi.org/10.5194/egusphere-egu24-9265, 2024.

EGU24-9287 | ECS | Orals | HS6.12

Importance of orographic gravity waves over the Tibetan Plateau on the spring rainfall in East Asia 

Runqiu Li, Xin Xu, Xiangde Xu, Theodore G Shepherd, and Yuan Wang

The springtime persistent rainfall (SPR) is the major rainy period before the onset of summer monsoon in East Asia, which profoundly affects the regional and even global hydrological cycle. Despite the great importance of the mechanical and thermal effects of the Tibetan Plateau (TP) large-scale orography on the formation of SPR, the impact of small-scale orography over the TP remains poorly understood. Here we show that upward-propagating orographic gravity waves (OGWs), which occur as the subtropical westerlies interact with the TP’s small-scale orography, contribute importantly to the SPR. The breaking of OGWs induces a large zonal wave drag in the middle troposphere, which drives a meridional circulation across the TP. The rising branch of the meridional circulation acts to lower the pressure and increase the meridional pressure gradient to the south of the TP by dynamically pumping the lower-tropospheric air upwards. The southwesterly monsoonal flow on the southeastern flank of the TP thus intensifies and transports more water vapor to East Asia, resulting in an enhancement of the SPR. This finding helps more completely understand the impacts of TP’s multiscale orography on the SPR and provides a new perspective on the westerly-monsoon synergy in East Asia.

How to cite: Li, R., Xu, X., Xu, X., Shepherd, T. G., and Wang, Y.: Importance of orographic gravity waves over the Tibetan Plateau on the spring rainfall in East Asia, EGU General Assembly 2024, Vienna, Austria, 14–19 Apr 2024, EGU24-9287, https://doi.org/10.5194/egusphere-egu24-9287, 2024.

The Qilian Mountains, a series of marginal mountains in the northeastern part of the Tibetan Plateau (TP), are a vitally important ecological protection barrier in the northwestern arid areas. In order to improve understanding of the microstructure of precipitation, the characteristics of raindrop size distribution (DSD) were analyzed using the Second Tibetan Plateau Comprehensive Scientific Expedition of observations. The Qilian Mountains region has its own unique DSD characteristics with a smaller raindrop diameter and a higher number concentration (3.69 for log10Nw and 0.94 mm for Dm) comparing with eastern, southern, northern, and central China, but are similar to those of southeastern TP. For all rainfall events, the number concentrations of small and large raindrops in the interior and on the southern slopes were greater than on the northern slopes, but midsize raindrops were less. The DSD spectrum of the interior was more variable and differed significantly from that of the northern slopes. The differences in the normalized intercept parameters of the DSD for stratiform and convective rainfall were 8.3 % and 10.4 %, respectively, and those of the mass-weighted mean diameters were 10.0 % and 23.4 %, respectively, while the standard deviations of DSD parameters at interior sites were larger. The differences in the coefficient and exponent of the Z–R relationship were 2.5 % and 10.7 %, respectively, with an increasing value of the coefficient from the southern to the northern slopes for stratiform rainfall but the opposite for convective rainfall. In addition, the DSD characteristics and Z–R relationships were more similar at the ipsilateral sites and had smaller differences between the southern slopes and interior of the mountains

How to cite: Mao, W., Li, G., and Zhang, W.: Statistical characteristic differences of raindrop size distribution during rainy seasons in the Pan Third Pole region, EGU General Assembly 2024, Vienna, Austria, 14–19 Apr 2024, EGU24-9706, https://doi.org/10.5194/egusphere-egu24-9706, 2024.

The lakes’ frozen and melting process is largely determined by the ice thermodynamic characteristics, i.e. the momentum roughness length, the surface albedo etc, which can impact on the lake-atmosphere interaction process, and finally affect the local hydrological cycle and the water resources. However, because of the data scarcity during frozen period of the lakes, there are relatively few studies and less clarity on the lakes’ thermodynamic characteristics, especially over the harsh environment of the Tibetan Plateau. In this study, based on meteorological forcing, eddy covariance measurements and remote sensing products, we explored,the effects of ice surface momentum roughness length (z0m) and snowfall on ice-frozen processes in Nam Co by using WRF-Lake model. The simulation results show that the WRF-Lake model can reproduce the mixing and stratification pattern, but with an over-early ice break up date and an overestimated sublimation. Based on eddy covariance measurements, the typical z0m value of ice surface  Nam Co is approximately one magnitude lower than the default value in WRF-Lake (3.04×10⁻⁴ m vs 1×10⁻³ m), Numerical simulations indicate that the decrease of the ice surface will contribute to a warmer lake surface, an increase of the sensible heat flux, a decrease of the sublimation and a shorten ice-covered duration. Moreover, snowfall events can cool the lake significantly, then delay the lake ice break up date and reduce the sublimation significantly. After considering the two factors the WRF-Lake model can improve the simulated over-early ice break up date and the overestimated sublimation significantly. Therefore, this study provides valuable in situ measurements of the ice-atmosphere interaction process and shows significance for quantifying lake’ water resouces and climate effects.

Keywords: ice phenology, roughness length, lake-atmosphere interaction

How to cite: Shi, X., Wang, B., Ma, Y., and Sun, L.: The influence of ice thermodynamic characteristics on the lake-atmosphere interaction process over a large high-altitude dimictic lake, Nam Co, EGU General Assembly 2024, Vienna, Austria, 14–19 Apr 2024, EGU24-10143, https://doi.org/10.5194/egusphere-egu24-10143, 2024.

EGU24-10319 | Orals | HS6.12 | Highlight

Enhancing mountainous permafrost mapping by leveraging rock glacier inventory 

Min Feng, Dezhao Yan, Zhongyi Hu, and Jinhao Xu

Permafrost is a key component of the cryosphere, which plays significant roles in surface energy, hydrological, and biogeochemical processes. Moreover, permafrost, a sensitive indicator of climate change, has experienced widespread degradation in recent decades. The Tibetan Plateau, hosting the largest mid-low latitude permafrost area, is particularly susceptible to these changes, warranting a deeper understanding of permafrost distribution and environmental interactions. However, permafrost mapping traditionally relies on empirical and physical models, each with its set of advantages and drawbacks. Empirical models, while user-friendly, introduce uncertainties due to data quality and scale issues. On the other hand, physical models, offering precision, demand high-quality data and face challenges in extensive simulations over large areas. With the advancement of artificial intelligence technologies, machine learning has rapidly formed many implementation algorithms and been applied in different fields. Permafrost mapping has been investigated with a variety of machine learning algorithms (i.e., neural networks, support vector machines, random forest, and gradient boosting), and demonstrated superior accuracy over traditional methods when applied to large areas, especially when there are abundant training data available.

Despite these advancements, challenges persist, notably in mountainous areas characterized by scarce in situ data and complex topography. This study proposes a novel approach involving rock glaciers as valuable indicators for permafrost mapping. Intact and relict rock glaciers, representing the presence or absence of permafrost, offer crucial insights, particularly in mountainous regions where traditional methods fall short. The study focuses on the Qilian Mountains, a representative mountainous area on the Tibetan Plateau. Leveraging machine learning and rock glaciers, the research aims to simulate the Permafrost Zonation Index (PZI). Rigorous accuracy evaluations and comparisons with existing permafrost maps are conducted, promising a nuanced understanding of permafrost dynamics in this challenging terrain. The integration of technological advancements and innovative approaches holds the potential not only to advance permafrost research but also to inform conservation strategies and climate change assessments on a broader scale.

How to cite: Feng, M., Yan, D., Hu, Z., and Xu, J.: Enhancing mountainous permafrost mapping by leveraging rock glacier inventory, EGU General Assembly 2024, Vienna, Austria, 14–19 Apr 2024, EGU24-10319, https://doi.org/10.5194/egusphere-egu24-10319, 2024.

EGU24-11808 | Posters on site | HS6.12

A New Gewex Regional Hydroclimate Activity in Central Asia 

Peter van Oevelen, Sagynbek Orunbaev, Maksim Kulikov, and Michael Brody

In the early 1990s a newly formed GEWEX Program (Then called the Global Energy and Water cycle Experiment now: Global Energy and Water EXchanges project) launched a regional study to measure and model regional variations in the water and energy cycle. A continental scale experiment was needed to develop the ability to measure and model the components of the water and energy cycles over a macroscale land surfaces from smaller scale observations. These projects are now called Regional Hydroclimate Projects and are much broader than just the geophysical science and cover the entire earth system.In this presentation an overview of the evolution of these RHPs  is shown along with a vision on the current and future relevance and importance of such projects along with the necessary additional activities such as cross cutting activities to link regional science to global efforts. In particular the development of a new RHP in Central Asia will be highlighted and how it links to regional activities such as AsiaPEX and Third Pole Environment – Water Sustainability (TPE-WS) RHPs as well as other large scale activities in the region focused on  or related to high mountains, water sustainability and ecosystem health.

How to cite: van Oevelen, P., Orunbaev, S., Kulikov, M., and Brody, M.: A New Gewex Regional Hydroclimate Activity in Central Asia, EGU General Assembly 2024, Vienna, Austria, 14–19 Apr 2024, EGU24-11808, https://doi.org/10.5194/egusphere-egu24-11808, 2024.

EGU24-13725 | Orals | HS6.12

Concentrations variation trend and potential sources of PFASs in Lake Nam Co, Qinghai-Tibet Plateau 

Lin Peng, Jing Wu, Yifei Yu, Tong Wang, Yiru Zhuang, and Zehua Liu

Per- and polyfluoroalkyl substances (PFASs) are one of emerging pollutants of international concern. They are ubiquitous worldwide, even in remote polar and alpine regions. Benskin et al. (2011) proposed that direct long-range atmospheric transport (LRAT) of PFASs, atmospheric transport and degradation of their precursors are the main sources of PFASs in remote regions. Chen et al. (2019) found in their study of PFASs in the water and surrounding runoff of Lake Nam Co in the Tibetan Plateau that the release from glacier melting is the second largest source after LRAT. As the continuous production and use of PFASs, combined with the impact of glacier melting, the concentrations of PFASs in Lake Nam Co are likely to rise rapidly. In this study, a total of 38 lake water samples were collected from Lake Nam Co in August 2023, and a total of 30 runoff water samples from glacial and non-glacial runoff flowing into Lake Nam Co were collected and the concentrations of 9 PFASs were analyzed. By comparing with the results of 2020, the temporal trend of PFASs in Lake Nam Co was studied, and their potential sources were analyzed. The results show that the mean concentration of PFASs in the water samples collected from the shores of Lake Nam Co in 2023 is 7724 pg/L, which is a 120% increase from the level observed in 2020. Within the PFASs, the short-chain PFASs (4-6 carbon atoms) exhibit the fastest growth, increasing by 150% compared to 2020. This may be due to the widespread production and use of short-chain PFASs as substitutes for long-chain PFASs, which arrive in Lake Nam Co via LRAT, resulting in a more significant increase in the concentrations of short-chain PFASs in the lake water. It is also found that the concentrations of PFASs in glacial runoff are significantly higher than in non-glacial runoff, with the greatest concentration difference found for PFBA, which is approximately twice as high in the glacial runoff compared to non-glacial runoff. In addition, the concentrations of PFASs in the southern side of Lake Nam Co, which receives multiple glacial runoff inputs, are higher than those in the northern side, with PFBA showing the greatest difference between the two sides. Several studies have speculated that PFBA may be an indicator of ice and snow melting. The observed spatial heterogeneity of PFBA implies that the release of PFASs due to glacier melting could be one of the main sources contributing to the increasing concentrations of PFASs in the water of Lake Nam Co. Under the influence of global warming, the glaciers surrounding Lake Nam Co may experience further melting in the future, which implies that the melting of glaciers could release more PFASs into Lake Nam Co in the coming years. Given that the concentrations of PFASs in the water of Lake Nam Co have shown an increasing trend, it is necessary to conduct continuous tracking monitoring and environmental risk assessments for Lake Nam Co and other ecologically vulnerable environments such as alpine and polar regions.

How to cite: Peng, L., Wu, J., Yu, Y., Wang, T., Zhuang, Y., and Liu, Z.: Concentrations variation trend and potential sources of PFASs in Lake Nam Co, Qinghai-Tibet Plateau, EGU General Assembly 2024, Vienna, Austria, 14–19 Apr 2024, EGU24-13725, https://doi.org/10.5194/egusphere-egu24-13725, 2024.

EGU24-13817 | Orals | HS6.12

Unraveling the non-linear relationship between surface deformation and active layer thickness in the Qinghai-Tibetan permafrost region 

Tian Chang, Yonghong Yi, Huiru Jiang, Simon Zwieback, and Rongxing Li

Seasonal freezing and thawing of the active layer in permafrost regions generally induce surface deformation that interferometric synthetic aperture radar (InSAR) can monitor on regional scales. InSAR has been widely used for detecting changes in active-layer thickness (ALT), an indicator of permafrost thaw. Previous studies have shown that the depth of the active layer and its soil water content have a strong influence on the magnitude of the surface deformation, and a linear relationship between ALT and surface deformation is often assumed in poorly drained Arctic soils. However, in dry areas such as the Tibetan Plateau permafrost region, the relationship between ALT and deformation is more complex and challenging to elucidate.


To examine the relationship in the Qinghai-Tibetan permafrost region, this study synthesizes InSAR-derived surface deformation data, multispectral measurements from unmanned aerial vehicle (UAV) sensors, and in-situ soil temperature and moisture data along a ~930-km transect. Our analyses reveal that seasonal deformation generally increases with ALT (R=0.74, p=0.26) at sites with moderate to dense vegetation cover (summer NDVI>0.5), aligning with previous research. However, at sites with sparse vegetation (summer NDVI<0.5), a strong negative correlation was found between the seasonal deformation and ALT (R=-0.83, p=0.01). Those areas are generally associated with deep active layers and low surface soil moisture. Among all sites, seasonal deformation shows a stronger correlation with the soil moisture content of the lower portion of the active layer (R=0.77, p=0.006), but a weak correlation with either surface or profile soil water content (R<0.20,p>0.60). This study provides insights into the non-linear relationship between deformation and ALT in arid and semi-arid permafrost regions such as the Tibetan Plateau, allowing for accurate active-layer estimates and soil water dynamics in this region.

How to cite: Chang, T., Yi, Y., Jiang, H., Zwieback, S., and Li, R.: Unraveling the non-linear relationship between surface deformation and active layer thickness in the Qinghai-Tibetan permafrost region, EGU General Assembly 2024, Vienna, Austria, 14–19 Apr 2024, EGU24-13817, https://doi.org/10.5194/egusphere-egu24-13817, 2024.

EGU24-13975 | Posters on site | HS6.12 | Highlight

Fundamental shift of ice temperature in the Third Pole under global warming 

Wei Yang

The Tibetan Plateau and its surroundings, sometimes referred to as High Mountain Asia or the Third Pole, have the largest mid-latitude glaciers and act as Asia's water tower. Previous studies based on remote sensing and ground-based measurements have revealed the magnitude and the accelerated trend of surface ice loss in this region over the past two decades. However, little is known about the englacial temperature and its response to climate change. Here we present a compilation of ice temperature profiles from 21 deep cores drilled in the accumulation zone of different glaciers covering the Third Pole. By combining these ice-core records with other climate datasets and thermal modelling, we have found that the thermal statues in the extreme high-altitude regions have undergone fundamental changes against the background of climate warming, particularly in the surrounding of Third Pole. The spatial pattern of the ice temperature structure shows clear contrasting patterns. Due to the intense latent heat generated by the refreezing of surface meltwater, the englacial temperature of boreholes in the vicinity of the Third Pole is far from a steady state, reflecting an increasing atmospheric temperature over the past decades and non-stationary climatic conditions. The repeated measurements in the same boreholes on different glaciers also showed that the englacial temperature profile can either increase or decrease, mainly depending on the effects of meltwater production and firn thickness. Such a dramatic shift in ice temperature in the Antarctic region have profound implications for glacier response to climate change and glacier-related disasters in this high-altitude regime.

How to cite: Yang, W.: Fundamental shift of ice temperature in the Third Pole under global warming, EGU General Assembly 2024, Vienna, Austria, 14–19 Apr 2024, EGU24-13975, https://doi.org/10.5194/egusphere-egu24-13975, 2024.

EGU24-14430 | Posters on site | HS6.12

Tibetan warming amplification response to individual anthropogenic climate forcing 

Chaoyi Xu, Yutong Zhao, and Tao Wang

Over the past 40 years, the Tibetan Plateau has experienced rapid climate change, with its warming rate approximately 1.8 times higher than the global average, equivalent to half of the Arctic amplification during the same period. However, the contributions of anthropogenic aerosols and greenhouse gases to the warming of the Tibetan Plateau remain unclear, leading to substantial uncertainties in temperature change projections. Here, we present a diagnosis of the local energy budget over the Tibetan Plateau based on idealized perturbations in four climate forcing agents (CO2, CH4, SO4, and black carbon) Additionally, we assess the impact of radiative feedback processes such as albedo and water vapor to temperature change. The results indicate that the Tibetan warming amplification (defined as the ratio between the Tibetan Plateau and the global mean near-surface temperature change) is evident across all anthropogenic climate forcings. While the global near-surface temperature response normalized by effective radiative forcing is similar, there are substantial variations in Tibetan warming amplification among different climate forcing agents, ranging from 1.5 for CO2 perturbations to 2.9 for black carbon perturbations. For all perturbations, surface albedo feedback is identified as a crucial factor driving temperature changes over the Tibetan Plateau. Particularly for black carbon perturbations, the combined effect of surface albedo feedback and water vapor feedback contributes to the stronger Tibetan warming amplification than in the Arctic. This suggests that with the implementation of global emission reduction measures and the reduction of glacier and snow cover, the pace of exceptional warming might decelerate over the Tibetan Plateau.

How to cite: Xu, C., Zhao, Y., and Wang, T.: Tibetan warming amplification response to individual anthropogenic climate forcing, EGU General Assembly 2024, Vienna, Austria, 14–19 Apr 2024, EGU24-14430, https://doi.org/10.5194/egusphere-egu24-14430, 2024.

     
A series of simulation experiments on the local atmosphere-land coupling characteristics under the Tibetan Plateau vortex weather system using the WRF_LES model has been conducted. The chosen event occurred on July 7, 2017, starting at 02:00 on July 7th with the vortex center located at 33°N, 87°E, and ending at 20:00 on July 8th with the vortex center at 32°N, 103°E. We conducted a control experiment and sensitivity experiments with different initial soil moisture to explore how surface conditions affect the thermal state of the boundary layer and the free atmosphere under the vortex weather system. Based on the control experiment, we investigated the movement path and influence range of the vortex center under the Tibetan Plateau vortex weather system and investigated the local atmosphere-land coupling characteristics in terms of soil moisture distribution affecting surface flux, boundary layer height, wet static energy, lifting condensation level, and LFC in the distances relative to the vortex center. In conjunction with sensitivity experiments, we further explored the influence of soil moisture on the key variables mentioned above, including its possible effects on the intensity and path of the Tibetan Plateau vortex, as well as the corresponding changes in local atmospheric coupling variables. Based on this, we further discussion of the possible processes and mechanisms through which soil moisture influences these variables. This study is not only beneficial for understanding the vertical transport of energy and water vapor on the surface conditions of the Tibetan Plateau vortex weather system but also holds significant importance in comprehending the role of thermodynamics in the development and evolution of the Tibetan Plateau vortex.

How to cite: Sun, G.: Simulation Analysis of the Local Land-Atmospheric Coupling under a  Tibetan Plateau Vortex using the WRF_LES, EGU General Assembly 2024, Vienna, Austria, 14–19 Apr 2024, EGU24-14454, https://doi.org/10.5194/egusphere-egu24-14454, 2024.

EGU24-18647 | Orals | HS6.12

Spatio-temporal cryosphere variations in the headwater river basins of Central Asia 

Abror Gafurov, Friedrich Busch, Adkham Mamaraimov, Akmal Gafurov, and Alexander Georgi

Central Asia is facing a water shortage due to the negative impacts of climate change. Water resources in this region originate mainly in the mountains of Pamir and Tian-Shan due to snow-and glacier melt. Thus, it is important to understand variations in the cryosphere (snow and glaciers) in this region to foster climate change adaptation measures.This study focuses on the analysis of spatio-temporal changes of snow and glaciers in the Amu Darya, Syr Darya and Zerafshan river basins in Central Asia. Due to limited availability of observational network in the region, we used, besides available station data, also remote sensing-based snow cover area data for the period of 2000-2023. As for the glacier change analysis, we used a degree-day modelling approach to assess changes of glacier thickness in the period of 2000-2023. Eight glaciers were chosen for modelling purposes that are all located in the selected eight river basins for this study. Spatio-temporal analysis of snow cover area change show significantly decreasing number of snow cover days above a certain elevation in Upper Amu Darya and Upper Syr Darya river basins. In both river basins, there are regions with up to 40 days less snow coverage between 2000 and 2023. In the Upper Syr Darya river basins this change is observed in the Akshiirak Massif area, whereas in the Amu Darya River Basin, this change is observed in the Murghab area in the far western part of the river basin. Below a certain elevation zone, there are also areas with increased number of snow cover days of up to 10 days. The attribution of this change into meteorological parameters leads to various hypothesis. The modelling results of glacier thickness change was validated against glacier area evolution that was derived using the Landsat images.  In most of the river basins, a maximum of 60-70 meters of ice thickness loss was estimated with an increase of ice thickness of some glaciers in the accumulation area of about 10-15 meters. However, in two of the valley glaciers (Vanch and Zerafshan River Basins), higher amount of glacier thickness loss was estimated in the last 23 years.The study suggests quantified cryosphere changes in the last 23 years for Central Asian region and emphasizes the need for climate change adaptation as the water resources originating in the mountains of the region (water towers) are important for socio-economic stability.

How to cite: Gafurov, A., Busch, F., Mamaraimov, A., Gafurov, A., and Georgi, A.: Spatio-temporal cryosphere variations in the headwater river basins of Central Asia, EGU General Assembly 2024, Vienna, Austria, 14–19 Apr 2024, EGU24-18647, https://doi.org/10.5194/egusphere-egu24-18647, 2024.

Satellite observation revealed two extremely low surface chlorophyll concentration events in the southeast Arabian Sea (SEAS, 6oN-15oN, 72oE-77oE) during the summer monsoons (June to October) of 2015 and 2019. The results indicate that the physical processes leading to negative SEAS chlorophyll anomalies during the 2015 and 2019 summer monsoons were inconsistent. In the 2019 summer monsoon, the warm SSTA and low chlorophyll in the SEAS are mainly related to the weakened upwelling and deepened thermocline depth due to the combined effects of local wind anomaly and the arrival of westward-propagating downwelling coastal Kelvin wave driven by easterly anomalies near eastern Sri Lanka during extreme positive Indian ocean dipole (IOD) event. Deeper thermocline depth and stronger downward movement during the 2019 summer made it difficult to transport nutrients upward, which in turn led to reduced surface chlorophyll concentrations in the SEAS. Positive IOD-induced easterly anomaly in the southern Bay of Bengal during the 2015 summer drove downwelling coastal Kelvin wave to propagate westward deepening the thermocline in the SEAS. Due to local wind stress anomalies favored upwelling and counteracted the downward motion of the downwelling coastal Kelvin wave. The downward transport (thermocline depth anomaly) in the SEAS during the 2015 summer was only one-third of (half of) that in 2019. Meanwhile, the upper ocean layer in the SEAS experienced extreme warming (the SSTA exceeded +0.8oC) due to the development of super El Niño in 2015. This significant warming enhanced marine stratification and prevented the subsurface nutrients from reaching the surface, which is unfavorable for the chlorophyll bloom. Deeper thermocline and weaker mixing allowed chlorophyll concentrations to reach extreme negative anomalies despite weaker IOD strength in 2015 than in 2019.


How to cite: Huang, H.: Negative surface chlorophyll concentration anomalies in the Southeast Arabian Sea during 2015 and 2019 summers, EGU General Assembly 2024, Vienna, Austria, 14–19 Apr 2024, EGU24-20207, https://doi.org/10.5194/egusphere-egu24-20207, 2024.

The occurrence of cloud directly affects the spatial and temporal continuity of surface temperature inverted by satellite remote sensing. In this study, a framework for reconstructing surface temperature with high spatial and temporal resolution based on data assimilation is constructed on the basis of multiple subsurface validation. (1) The accuracy of MYD11A1 LST data varies with terrain and land cover characteristics. High-altitude alpine terrains (Kalasai and Arou) and undulating desert terrains (Tazhong A-E Sites) show high precision and less error, while agricultural fields (Daman) and desert transitional zones (Bajitan) exhibit more variability and larger errors. This suggests that the uniformity and stability of certain terrains, coupled with minimal atmospheric interference, enhance the accuracy of remote sensing observations. (2) A systematic bias, indicating a consistent underestimation of LST by the MYD11A1 product compared to ground-based observations, is observed across all sites. This bias is particularly pronounced in the presence of a sanding phenomenon, which results in a mixture of sand and air near the surface, leading to a lower station observation and a significant bias. (3) The Land Surface Temperature (LST) simulated by noah-MP exhibits a high degree of consistency with the LST observed through remote sensing. The significant correlation between the simulated LST and MODIS observations at the Kalsai and Arou stations indicates that noah-MP is highly applicable to mountain grassland surfaces. (4) A framework has been developed for reconstructing surface temperature with high temporal and spatial resolution, based on data assimilation. This method can generate all-weather, hourly surface temperature data.

How to cite: Li, Y., Qing, H., Wang, X., and Yan, Y.: Establishing a Framework for Assimilating Satellite Observations with Land Surface Process Models to Obtain Time-Continuous 1km High Spatial Resolution Surface Temperature: A Case Study of the Kunlun-Altunshan-Qilian Mountain Region , EGU General Assembly 2024, Vienna, Austria, 14–19 Apr 2024, EGU24-20234, https://doi.org/10.5194/egusphere-egu24-20234, 2024.

According to the mean seasonal and annual temperature and precipitation from Nielamu and Dingri meteorological stations in the periods of 1967–2019, the variability of temperature and precipitation and their trends are analyzed in the Mount Qomolangma region. The biggest fluctuation of precipitation occured in winter on the seasonal scale, the mean annual temperature showed a wavelike decrease change before 1997 and a wavelike increase change after 1997, the mean seasonal and annual temperature are increased with the increasing of age. There is an increasing trend in mean seasonal and annual temperatures during this period in the Mount Qomolangma region, and the increasing trends in winter seem more significant than those in the other three seasons. The research in this paper showed the seasonal and annual precipitation are no obvious variation in the Mount Qomolangma region. On the other hand, there is obvious local change characteristics for temperature and precipitation in the Mount Qomolangma region. The results of this study would be helpful for the understanding of the climatic characteristics on the Tibetan Plateau, and it could provide a reference for the Second Tibetan Plateau Scientific Expedition and Research (STEP).

How to cite: Wang, S.-J.: Study on the Climatic Characteristics in the Mount Qomolangma Region during the Last 53 Years, EGU General Assembly 2024, Vienna, Austria, 14–19 Apr 2024, EGU24-20376, https://doi.org/10.5194/egusphere-egu24-20376, 2024.

Permafrost, a crucial component of the cryosphere, is mainly distributed in the high latitude and high altitude regions of the northern hemisphere, and is extremely sensitive to climate change. With global warming, permafrost is undergoing significant degradation worldwide, leading to substantial impacts on regional hydrological cycles, carbon cycles, ecological environments, and engineering construction. In our study, the Stefan’s solution and downscaled Coupled Model Intercomparison Project Phase 6 (CMIP6) datasets are employed to simulate the soil freeze depth, and the frost number model is utilized to calculate the frost number (F) based on the air freezing/thawing index derived from the downscaled CMIP6 datasets. A novel method was introduced to determine the optimal frost number threshold (Ft) to simulate the distribution of permafrost. The simulated permafrost distribution maps are compared with the existing permafrost distribution map to identify the optimal Ft with the Kappa coefficient as a measure of classification accuracy. Taking the Tibetan Plateau (TP) as a case study, the depth and distribution of permafrost were simulated under different Shared Socio-economic Pathways (SSP) scenarios on the TP. The changes in permafrost depth and distribution on the TP under different climate change scenarios and their impacts on eco-hydrological processes were analyzed. It is projected that the depth and area of permafrost will significantly decrease. Especially under the SSP585 scenario, by the end of the 21st century, the permafrost of the TP will be almost completely degraded, and the regional mean SFD of the TP is projected to decrease by more than 50 cm compared to the current depth. The rapid decrease in the depth and area of permafrost on the TP may lead to a decrease in soil moisture and have adverse impacts on vegetation growth. This study provides valuable insights for understanding the changes in permafrost and their impacts on eco-hydrological processes.

How to cite: Pan, X., Li, H., and Nie, X.: Changes in Permafrost under Climate Change and Their Impacts on Eco-hydrological Processes: A Case Study of the Tibetan Plateau, EGU General Assembly 2024, Vienna, Austria, 14–19 Apr 2024, EGU24-21013, https://doi.org/10.5194/egusphere-egu24-21013, 2024.

EGU24-21015 | Orals | HS6.12 | Highlight

Promote scientific data sharing for the world’s Third Pole 

Xin Li, Xiaoduo Pan, and Min Feng

 The Tibetan Plateau, also known as the world’s Third Pole, holds immense significance in the global context, influencing climate patterns, water resources, and biodiversity across Asia and even the globe. Scientific data related to the Tibetan Plateau is crucial for understanding of the complex interactions among its lithosphere, hydrosphere, cryosphere, biosphere, atmosphere, and anthroposphere. Additionally, sharing scientific data facilitates collaborative research efforts, fostering a comprehensive approach to addressing challenges such as water resource management, natural disasters, and the sustainable development of the Tibetan Plateau. By promoting and sharing scientific data of the Third Pole, the international scientific community can contribute to the understand and preservation of this vital region and its far-reaching implications for the Earth system.

The National Tibetan Plateau/Third Pole Environment Data Center (TPDC, https://data.tpdc.ac.cn) is one of the first 20 national data centers endorsed by the Ministry of Science and Technology of China in 2019. The TPDC is dedicated to consolidating and integrating extensive data resources of the Tibetan Plateau. The data center is featured by the most complete scientific data for the Tibetan Plateau and its surrounding regions, and is hosting more than 6,300 datasets collected from diverse disciplines, covering terrestrial surface, human-nature relationship, atmosphere, solid Earth, cryosphere, remote sensing, paleoenvironment, and others. The TPDC provides a cloud-based platform with integrated online data acquisition, quality control, analysis, and visualization capability to maximize the efficiency of data sharing. These advancements will also promote modeling of the dynamics in environment, ecosystem, human society, and the Earth system cross the Third Pole region, providing key data and knowledge supports to decision-making related to the region’s sustainable development.

TPDC complies with the “findable, accessible, interoperable, and reusable (FAIR)” data sharing principles and strengthens its cooperation with international organizations, such as collaborating with WOM to promote the Global Cryosphere Watch project. It also collaborates with the ICIMOD on data exchanging, observation capability, capacity-building, and joint research. As a recommended data repository for international journals like Nature, AGU, ESSD, and Elsevier to encourage data authors to share their data along publications. Additionally, the TPDC provides data support for various international science programs, including TPE, GEWEX/GASS LS4P and WCRP-CORDEX CPTP.

How to cite: Li, X., Pan, X., and Feng, M.: Promote scientific data sharing for the world’s Third Pole, EGU General Assembly 2024, Vienna, Austria, 14–19 Apr 2024, EGU24-21015, https://doi.org/10.5194/egusphere-egu24-21015, 2024.

EGU24-21227 | Orals | HS6.12

Identification of the characteristics of non-stationary spatio-temporal variations of future temperature in the Tibetan Plateau based on a coupled EOF-EEMD method 

Xiaohua Dong, Xue Zhang, Yaoming Ma, Chengqi Gong, Xueer Hu, Ling Chen, and Zhongbo Su

The climate model provides simulation results in studying the climate change and its consequences. However, its application in a specific relatively small area (compared to global scale) is somehow confined for its lackness in high resolution and poverty in accuracy. Therefore, downscaling and bias correction are necessary to be undertaken to improve the output data from the climate model. Because a single EOF model is difficult to identify the time series change trend, this paper uses EOF and ensemble empirical mode decomposition (EEMD) coupling to accurately identify the statistical characteristics of time series to extract the temporal and spatial variation characteristics of meteorological data. In this study, the monthly mean temperature observation data set of ERA5 from 1970 to 2014 was used. First of all, six climate models and Multi-Model Ensemble (MME) average models of CMIP6 were evaluated and optimized by Taylor diagram, Taylor index, interannual variability assessment index and rank scoring method, and the best data set were chosen for the later treatment. Then, the Delta bias correction method and Normal distribution matching method were used to correct the chosen data. Finally, the temporal and spatial variation characteristics of temperature in the Tibet Plateau from 2015 to 2100 under SSP1-2.6, SSP2-4.5 and SSP5-8.5 scenarios were analyzed. The results show that: (1) Among the six CMIP6 models and MME average models selected in this paper, the EC-Earth3 model has the best performance in simulating temperature. (2) Comparing the results of the EC-Earth3 model after the Delta bias correction with the observation results, the regional averages of the deterministic coefficient (R2) and the Nash efficiency coefficient (NSE) are 0.992 and 0.983, respectively. After the Normal distribution matching method is used to correct, the regional averages of the deterministic coefficient (R2) and the Nash efficiency coefficient (NSE) are 0.990 and 0.978, respectively. Therefore, the Delta bias correction has a better correction effect on the monthly temperature of the model. (3) By coupling the EOF-EEMD method, it is found that the first typical field shows consistent changes in the whole region under the three scenarios, and there are common temperature change sensitive areas and non-sensitive areas under the SSP1-2.6 and SSP2-4.5 scenarios, namely, the northern Tibetan Plateau and the Pamir Plateau. The temperature of the second typical field shows a distribution that gradually decreases (SSP1-2.6, SSP2-4.5) or increases (SSP5-8.5) from the upper reaches of the Zhaqu River to the surrounding areas. Under the SSP1-2.6 scenario, the plateau as a whole is cooling down in the east and warming up in the west. Under the SSP2-4.5 and SSP5-8.5 scenarios, the plateau first warms up in the east and cools down in the west, and then cools down in the east and warms up in the west. This study can provide a reference bias correction method for a more accurate application of climate model data in the Tibet Plateau, and provide key basic information supporting in-depth assessment of the impact of temperature changes on water resources, ecosystems and environment in the Tibet Plateau.

How to cite: Dong, X., Zhang, X., Ma, Y., Gong, C., Hu, X., Chen, L., and Su, Z.: Identification of the characteristics of non-stationary spatio-temporal variations of future temperature in the Tibetan Plateau based on a coupled EOF-EEMD method, EGU General Assembly 2024, Vienna, Austria, 14–19 Apr 2024, EGU24-21227, https://doi.org/10.5194/egusphere-egu24-21227, 2024.

HS7 – Precipitation and climate

EGU24-651 | ECS | Posters on site | HS7.1

Multi-scale comparison of rainfall measurement in Paris area between two optical disdrometers of different working principles 

Marcio Matheus Santos de Souza, Auguste Gires, and Jerry Jose

A disdrometer is an instrument designed to assess both the size and velocity of descending hydrometeors. The applications of rainfall measurements retrieved with the help of disdrometers are diverse, spanning areas such as traffic control, scientific research, airport observation systems, and hydrology. Modern disdrometers leverage microwave or laser technologies that have increased the accuracy of the measurements with each iteration. Still, the quality of measurements fluctuates depending on factors such as raindrop size, wind velocity, and rain rate. A comprehension of these variations is needed to better understand the level of reliability of each device depending on the specific rain conditions.

In this study, we compare the performance of two optical disdrometers : 3D Stereo disdrometer (manufactured by Thies Clima) and Parsivel2 (manufactured by OTT). Both devices provide size resolved measurement of rainfall along with velocity of falling drops. Parsivel is set to record data every 30 seconds over a sampling area of 54 cm² and arranges the information in 32 x 32 classes of drop size and velocity. Unlike the Parsivel, 3D Stereo does not discretize measurements, and directly provides the diameter and velocity of each falling drop in a sampling area of 100 cm² with a measuring resolution of 0.08 mm and 0.2 m/s respectively, and a temporal resolution of 1 millisecond. This finer resolution data enables us to study rainfall variability at very small scales which are not usually available.

Here, we used continuously and simultaneously measured data since 21/08/2023, from TARANIS observatory of ENPC (https://hmco.enpc.fr/portfolio-archive/taranis-observatory/). The initial comparison of the data was done using a time series of rain-rate for rainfall events in between a dry period of at least 15 minutes and total depth >0.7 mm. This revealed an unexpected disparity in the water volume collected between the devices. Parsivel collected more than 3D Stereo on every instance, and the disparity got bigger as the rain rate increased. With the purpose of studying the source of this disparity, the sampling area of the 3D Stereo was divided into 8 sections and compared with each other. This showed that the estimate of rainfall parameters such mean diameter, mean velocity of the drops (which were expected to be uniform over long periods regardless of the section where drops are measured) were not the same for the sections studied, and exhibited clear trends. To understand this discrepancy in a scale invariant way, and to evaluate the performance of devices across scales and not only at a single scale, the widely used framework for studying variability of geophysical fields – Universal Multifractals (UM) was employed for assessing the scaling behavior of fields. Rainfall from both devices showed previously reported average scaling behavior from 30 s to 30 min. The difference between rain events and also the behavior at finer scales, which can be accessed from 3D stereo disdrometer were also studied using the UM framework and will be discussed.

Authors acknowledge the Ra2DW project (supported by the French National Research Agency - ANR-23-CE01-0019), for partial financial support.

Keywords: rainfall; disdrometer; multifractals;

How to cite: Santos de Souza, M. M., Gires, A., and Jose, J.: Multi-scale comparison of rainfall measurement in Paris area between two optical disdrometers of different working principles, EGU General Assembly 2024, Vienna, Austria, 14–19 Apr 2024, EGU24-651, https://doi.org/10.5194/egusphere-egu24-651, 2024.

EGU24-2655 | Posters on site | HS7.1

Designing the TUDS rainfall observatory in northern Ghana 

Nick van de Giesen, Frank Annor, Sylvester Ayambila, Richard Dogbey, Vincent Hoogelander, Gordana Kranjac-Berisavljevic, Kingsley Kwabena, Rob Mackenzie, Marc Schleiss, and Remko Uijlenhoet

Convective rainfall in West Africa is poorly monitored and understood. There are large gaps between remote sensing rainfall products and what is observed on the ground. There are several reasons for these gaps. First, satellites and rain gauges measure at very different scales so one would expect that remote sensing products contain more events at lower intensities than small gauges. Second, a lot happens between the clouds observed by satellites and the ground. Rainfall may evaporate and move with the wind, causing further disconnects between space and ground observations. There are also indications that clouds in West Africa contain many small drops due to the presence of many aerosols, thereby possibly “misleading” satellite products. Finally, it is likely that there are further factors that are not yet accounted for.

In order to tackle this disconnect between ground and space observations, we plan to build the TUD - UDS, or TUDS, rainfall observatory near Tamale and Nyankpala in northern Ghana. The following are initial ideas that we would like to discuss at the EGU. It will be a multi-scale observatory, starting at a grid of nine gauges on a 500m grid (1km x 1km total). This small grid should capture the inherent spatial variability of convective rainfall events with convective cells of 2km or less. The largest grid would also contain nine gauges and have an extent of 10km x 10km, or larger. This outer grid would capture the movement of convective cells, including those contained within so-called line squalls. An intermediate grid may complete this picture. The structure will look, more or less, like the one in the picture below.

Different instruments will be at our disposal, from simple totalling rain gauges to disdrometers. There will be five Thies disdrometers, one Ott Parsivel, and several TAHMO stations and/or tipping bucket rain gauges. Also experimental intervalometers will be placed in the grid to better understand rainfall structure over time and space. Several instruments will be co-located to examine strengths and weaknesses of the different methods.

We explicitly invite comments and contributions.  


TEMBO Africa: The work leading to these results has received funding from the European Horizon Europe Programme (2021-2027) under grant agreement n° 101086209. The opinions expressed in the document are of the authors only and no way reflect the European Commission’s opinions. The European Union is not liable for any use that may be made of the information.

How to cite: van de Giesen, N., Annor, F., Ayambila, S., Dogbey, R., Hoogelander, V., Kranjac-Berisavljevic, G., Kwabena, K., Mackenzie, R., Schleiss, M., and Uijlenhoet, R.: Designing the TUDS rainfall observatory in northern Ghana, EGU General Assembly 2024, Vienna, Austria, 14–19 Apr 2024, EGU24-2655, https://doi.org/10.5194/egusphere-egu24-2655, 2024.

Precipitation droplets are influenced by environmental fields and transform in time and space, following cloud microphysical processes. Accordingly, a raindrop size distribution (DSD) changes shape in a various form. However, DSDs cannot be calculated directly in radar or bulk models and are expressed using an approximate function. Exponential and gamma distribution are well-known as approximation functions, but there are DSDs of shapes that cannot be represented by these functions. One of them is a bimodal DSD with two peaks. Previous modeling studies have indicated that the bimodal DSD is formed when the collision-breakup process reaches equilibrium. On the other hand, recent observation-based studies have discussed the influence of convective activity within the precipitation system on forming the bimodal DSD. However, observations have not been able to quantitatively study the microphysical changes of individual particles and have yet to reveal the formation mechanisms within the precipitation system. In this study, we investigated quantitatively the process of the formation of the bimodal DSD by two-dimensional simulation of multicellular convection with the bin method. The simulation results showed that the bimodal DSD was formed during the updraft and downdraft in the mature stage of the multicell. Additionally, the bimodal DSD was formed at lower altitudes where there was inflow into the precipitation system. Particles that constituted the maximum of the bimodal DSD were found to have been advected by the inflow. Particles that constituted the local maximum dropped against the updraft. In contrast to these, particles that constituted the local minimum were less affected by the inflow and had difficulty dropping against the updraft. These results suggested that the bimodal DSD was formed by horizontal and vertical size sorting because of inflow and updrafts in the mature multicellular convection. In the future, it is necessary to simulate the reproduction of observed cases and compare them with observations.

How to cite: Okazaki, M., Yamaguchi, K., Yanase, T., and Nakakita, E.: Spatiotemporal structure of raindrop size distribution due to flow field in a convective precipitation system simulated by bin cloud microphysics model., EGU General Assembly 2024, Vienna, Austria, 14–19 Apr 2024, EGU24-6387, https://doi.org/10.5194/egusphere-egu24-6387, 2024.

EGU24-6767 | Posters on site | HS7.1

Microphysical properties of the stratiform precipitation in Kyiv city based on OTT Parsivel2 and pluviograph data  

Svitlana Krakovska, Liudmyla Palamarchuk, and Anastasiia Chyhareva

Precipitation detailed characteristics, namely spectrum of particles by their sizes, phase and precipitation intensity with high-resolution timestep, still need to be investigated due to the complexity of their direct instrumental measurements but necessity for improving forecast for different applications including hydrological and emergency service. Our study is focused on the stratiform precipitation associated with cloud system (Ns-As) of warm front during prolonged and intense precipitation event on the 25th October 2023 in Kyiv, Ukraine. This warm front cloud system was connected with an occluded low over Poland which developed on the East periphery of a huge depression (970 hPa) over the Northern Atlantic.

We analyzed the OTT Parsivel² - Laser Weather Sensor measurement data with 10sec time steps. Parsivel² was installed nearby regular meteorological station, which is a part of the WMO network, and its measurements were used for verification. Precipitation intensity and raindrop distributions had wavy character, where we can distinguish a few waves of precipitation enhancement. The average intensity of the minimum wave was 0.02mm/min that corresponds to 30 raindrops with size varying from 0.5 to 1.5mm and maximum falling speed 4m/s for the largest raindrops. The average intensity of maximum precipitation enhancement wave was 0.15mm/min with around 100 raindrops per 10sec with sizes mainly from 0.5 to 2.5mm (with some raindrop sizes up to 3.5mm) and average falling speed 5-6m/s. Total amount of 26-hour precipitation event was 24.2mm according to OTT Parsivel² measurements and 26mm according to SYNOP data from Kyiv WMO station (ID 33345). We should note that in modern climate condition in Kyiv such prolonged frontal precipitation even in autumn is rather rare event in respect to previous decades.  

Gained results were compared with previous studies based on 20-year measurement by pluviograph at the same Kyiv WMO station. For stratiform precipitation, average maximum precipitation intensity within precipitation enhancement waves was around 0.11mm/min. Duration of main precipitation enhancement waves was around 21 minutes. Characteristics of precipitation enhancements waves are key for assessment of surface runoff value. The significant fraction of water on the ground that forms surface runoff goes mainly from such precipitation enhancement waves, when around 60 up to 90% of the maximum surface runoff can be formed.

In conclusion, OTT Parsivel² Laser Weather Sensor was used in Ukraine for the first time and demonstrated good performance versus the city station accumulation measurements and historical pluviograph data at the station. At the moment this instrument is under way to the Ukrainian Antarctic station Akademik Vernadsky where further exploitation will allow to test and obtain measurement data for different phase of precipitation, mostly mixed and solid and compare with data from Micro Rain Radar Pro. Obtained and future results will extend our understanding of precipitation formation, their microphysics and dynamics, interconnections between precipitation intensity and size/fall speed of raindrops and solid particles. Future studies could help to evaluate the transformation of cloud and precipitation formation processes under the climate change for better parameterization in numerical models, to study the microphysical structure and composition of precipitation.

How to cite: Krakovska, S., Palamarchuk, L., and Chyhareva, A.: Microphysical properties of the stratiform precipitation in Kyiv city based on OTT Parsivel2 and pluviograph data , EGU General Assembly 2024, Vienna, Austria, 14–19 Apr 2024, EGU24-6767, https://doi.org/10.5194/egusphere-egu24-6767, 2024.

EGU24-7802 | Posters on site | HS7.1

Cloud based tool to enhance urban resilience with the Fresnel Platform using the Multi-Hydro Model 

Guillaume Drouen, Daniel Schertzer, Auguste Gires, and Ioulia Tchiguirinskaia

The aim of the Fresnel platform of École des Ponts ParisTech is to foster research and innovation in multiscale urban resilience. Studying the hydrological response of such complex urban areas accounting also for small scale spatio-temporal precipitation variability requires adapted tools. For these reasons, RadX provides a user-friendly graphical interface to run simulations using a fully distributed and physically based model: Multi-Hydro. RadX is designed as a Software as a Service (SaaS) platform, allowing users to work with data across a wide range of space-time scales and the appropriate tools for analyzing and simulating this data.

The hydrological model, developed at École des Ponts ParisTech, integrates four open-source software applications previously used and validated independently by the scientific community as well as practitionners. Its modular structure includes a surface flow module, sewer flow module, a ground flow module and a precipitation module. It is able to simulate the quantity of runoff and rainwater infiltrated into unsaturated soil layers from any space-time varying rainfall event at any location of the studied peri-urban watersheds, as well as depth and flow in all the pipes and nodes of the sewer network.

Users can launch hydrological simulations using the Multi-Hydro model directly from their web browser, while they are run on dedicated servers. They can adjust two key input parameters: the land use of the studied catchment and the rainfall data. Dedicated tools have been developed to enable users to modify the land use of the catchment with the same ease as using a raster graphic editor. Users can either choose real rainfall events captured by the X-band weather radar located at École des Ponts ParisTech or utilize user-defined synthetic rainfall as input. Data from other radar can also easily be integrated. 

For the simulation output, the interface provides users with different tools to study in detail the impact of the chosen input parameters. For instance, by simply selecting two sewer junctions on an interactive map, users can generate a sewer path between these two points and display an interactive representation of the water level heights in sewer conduits and junctions along the user-defined sewer network path.

Additional components can be integrated into RadX to meet specific requirements using visual tools and forecasting systems, including those from third parties. Developments are still in progress, with a constant loop of requests and feedback from the scientific and professional world.

How to cite: Drouen, G., Schertzer, D., Gires, A., and Tchiguirinskaia, I.: Cloud based tool to enhance urban resilience with the Fresnel Platform using the Multi-Hydro Model, EGU General Assembly 2024, Vienna, Austria, 14–19 Apr 2024, EGU24-7802, https://doi.org/10.5194/egusphere-egu24-7802, 2024.

EGU24-8714 | ECS | Orals | HS7.1

Improvements in rain gauge design and measurements to minimise under-catch errors 

Mark Dutton and Domenico Balsamo

Precipitation measurements provide historic and near real-time data for Met Services and ground truth references for modelling and forecasting.  Current methods suffer from well-known under-catch problems1.  These are caused by wind effect2 on the gauge, out-splash, evaporation, and internal tipping bucket (‘counting’) errors.  Thereby causing water-balance errors for Hydrology scientists.  Good gauge design and correct siting can minimise these errors but not eliminate them.

Over 10 years of research, into the best aerodynamic shape for a precipitation gauge, was carried out to minimize out-splash and maximize catch3.  Comparison field work1 and Computational Fluid Dynamic4 (CFD) research was undertaken between standard straight-sided, ‘chimney’ shaped, aerodynamic shaped and pit-installed (out of the wind) gauges.  This research demonstrated that it may be possible to quantify under-catch using gauge rim-based wind data, drop-size and drop-type information.  Field comparison between the “new instrument” and pit gauge will be needed.  Once quantified at source, it can then be used to accurately correct live data.

This new instrument uses ultrasonic wind sensors and Doppler-Shift measuring techniques to obtain wind versus rainfall catch data.  Also using optical and/or impact sensing techniques we can measure the individual drop size and count the drops involved in a rain event.  By adding weighing technology to the tipping bucket design and improving calibration methods, we can improve resolution and detect evaporation losses.  Also power efficient and controlled heating to allow the inclusion of solid precipitation measurements.  Then finally use machine learning (ML) techniques to correct the errors.

Therefore, the aim of this project is to design a simple to use intelligent instrument to minimise and possibly eliminate under-catch measurement errors balancing out the water budget.  Allow installation of the instruments at ground and raised levels without increase in errors caused predominately by the wind.  Create near real-time and historic field precipitation data, both corrected and non-corrected to be use by Met Services and Hydrology modelling scientists.

References

1. Sevruk, B. Methods of correction for systematic error in point precipitation measurement for operational use, World Meteorological Organization - Operational Hydrology, Report No. 21, 1982.

2. Pollock, M. D., et al. Quantifying and mitigating wind induced undercatch in rainfall measurements, Water Resources Research, 54, 2018.

3. Strangeways, Ian. Improving precipitation measurement. International Journal of Climatology. 24. 1443 - 1460. 10.1002/joc.1075, 2004.

4. Colli, M., et al.  A Computational Fluid-Dynamics Assessment of the Improved Performance of Aerodynamic Rain Gauges. Water Resources Research. 54. 10.1002/2017WR020549, 2018.

How to cite: Dutton, M. and Balsamo, D.: Improvements in rain gauge design and measurements to minimise under-catch errors, EGU General Assembly 2024, Vienna, Austria, 14–19 Apr 2024, EGU24-8714, https://doi.org/10.5194/egusphere-egu24-8714, 2024.

EGU24-8789 | ECS | Orals | HS7.1

Merging personal weather stations with real-time radar rainfall estimates at the catchment scale 

Nathalie Rombeek, Markus Hrachowitz, Davide Wüthrich, and Remko Uijlenhoet

Real-time flood forecasting and warning during extreme rainfall events remains challenging since accurate and real-time available data are critical. Nowcasting based on radar rainfall can be utilized for this, as it has a high spatial and temporal resolution (i.e. typically 1 km and 5 min). However, the quantitative precipitation estimates (QPE) from the radar, upon which radar rainfall nowcasting is based, often contains substantial uncertainty and bias. While the QPE are usually corrected with official rain-gauge networks, these networks are sparse, and not always available in (near) real-time.

Instead, personal weather stations (PWS) can be used, as they have a much higher density and are available in real time. While PWS are prone to several sources of error, quality control algorithms can be used to improve their accuracy. Previous research already showed that merging quality controlled PWS with radar rainfall estimates reduces the underestimation for 1-hour accumulated rainfall at the pan-European scale. However, this has not yet been investigated at the catchment scale. This research aims to investigate the potential of merging PWS data with radar rainfall estimates for different catchments in the Netherlands, by considering multiple rainfall events starting from 2018. The goal is to quantify the performance in relation to rainfall type, quality control algorithms and catchment properties, validated against the climatological gauge-adjusted radar dataset from the KNMI. The insights obtained from this research have the potential to be utilized for real-time radar rainfall nowcasting and consequently flood forecasting.

How to cite: Rombeek, N., Hrachowitz, M., Wüthrich, D., and Uijlenhoet, R.: Merging personal weather stations with real-time radar rainfall estimates at the catchment scale, EGU General Assembly 2024, Vienna, Austria, 14–19 Apr 2024, EGU24-8789, https://doi.org/10.5194/egusphere-egu24-8789, 2024.

EGU24-10819 | Orals | HS7.1

Spatial and temporal structure of normal and extreme rainfall 

András Bárdossy

The space time behaviour of precipitation is very complex. The knowledge of the dependence structures in space and time is very important for the assessment of flood risks. In this contribution the dependence structures of normal and extreme events are compared. Both rain gauges with high temporal resolution and radar images are investigated. Spatial and temporal copulas are used for this investigation. Due to the large number of zero observations, especially for short temporal aggregations an indicator approach is used to detect structural differences. The results show, that the temporal dependence structure of rainfall gradually changes with increasing intensity. Similar behaviour can be detected for the spatial structure with the addition of advection related differences in both ranges and angles of anisotropy. The findings indicate that metagaussian approaches which only consider spatial and temporal correlations are not appropriate for the description and the simulation of rainfall extremes. Finally a new structural simulation method using non-Gaussian dependence is presented.

How to cite: Bárdossy, A.: Spatial and temporal structure of normal and extreme rainfall, EGU General Assembly 2024, Vienna, Austria, 14–19 Apr 2024, EGU24-10819, https://doi.org/10.5194/egusphere-egu24-10819, 2024.

EGU24-12007 | Orals | HS7.1

Revisiting nonterminal hydrometeors: Refining instrument uncertainty 

Michael Larsen, Andrei Vakhtin, and Anthony Gomez

The fall velocities of rain and drizzle drops are often assumed to be a deterministic function of their size. These diameter-fall speed relationships are intrinsically assumed in the retrievals provided by some commercial rain measurement instruments (e.g. the Joss-Waldvogel Disdrometer (Distromet), Micro Rain Radar (METEK), and 1-Dimensional Video Disdrometer (Joanneum Research)).

Some disdrometers are capable of independently measuring droplet size and fall-speed and provide evidence that not all drops adhere to the assumed size/fall-speed relationship. The ubiquity and magnitude of these deviations are still an area of some debate; clear identification of drizzle and rain drops falling at speeds different than their expected terminal fall velocities is muddied by conservative estimates of disdrometer resolution and performance. For a long time the bulk of observed non-terminal drop fall speeds were assumed to be instrumental artifacts and, even now, most investigators conclude drops falling at non-terminal speeds do not have a large impact on rain measurement science.

To date, uncertainties in disdrometer-derived drop sizes and fall speeds have usually been derived from the manufacturer estimates. Here, we improve on these estimates by using a field calibration source (the new ``Large Drop Generator'' from Mesa Photonics) that permits user-selectable generation of droplets with known sizes and fall speeds. From these data, empirical estimates of disdrometer sizing and fall velocity bias and uncertainty can be determined. This, then, allows for a more reliable estimate of the fraction of non-terminal drops in natural rain and a more reliable assessment of the impact of non-terminal drizzle and rain drops in data derived from instruments that assume a specific drop size/fall-speed relationship.

How to cite: Larsen, M., Vakhtin, A., and Gomez, A.: Revisiting nonterminal hydrometeors: Refining instrument uncertainty, EGU General Assembly 2024, Vienna, Austria, 14–19 Apr 2024, EGU24-12007, https://doi.org/10.5194/egusphere-egu24-12007, 2024.

EGU24-12054 | Posters on site | HS7.1

Testing a new Radar QPE methodology for winter events with a low melting layer 

Raquel Evaristo, Ju-yu Chen, Alexander Ryzhkov, and Silke Trömel

The RY precipitation product of the German Weather Service (DWD) is severely affected by the presence of the low melting layer and frequently shows circular features of enhanced precipitation around the radar sites during the winter time. 
The radars tend to be installed at relatively high terrain and to scan at elevations at a minimum of 0.5° in order to avoid beam blockage and ground clutter. In doing so two problems arise:

1) the difference between the ground and the radar beams becomes a problem especially at large distances from the radar, and consequently precipitation processes in the lowest layers are not observed.
2) the radar beam often reaches the melting layer and may even cross it where it is sampling the snow above.As a result problems arise when deriving surface QPE from the radar: regions of enhanced QPE in ring shapes around the radar sites, and underestimation of the precipitation beyond the melting layer.

A new methodology (PVPR - Polarimetric Vertical Profile of Reflectivity) developed by Ryzhkov et al. 2022 is tested here for which the radar reflectivity (ZH) is reconstructed to correct for the effect of the melting layer and snow beyond. In this methodology the melting layer is detected independently for each azimuth based on the values of ZH and ρHV (cross-correlation coefficient between horizontal and vertically polarized radar waves). In particular the range bin at which the melting layer was reached is recorded (mlb_r). The strength of the melting layer (ML_S) is defined based on how much the value of ρHV  dropped within the melting layer. The values of ML_r and ML_S at a specific elevation are considered sufficient to characterize the melting layer, and are then compared with lookuptables which were generated by simulations of the melting layer effect on the radar beam. A correction factor is then applied based on the lookuptables to the ZH profile within and beyond the melting layer. Visually the result shows a smoother field of reflectivity without the obvious bright band and decreased values associated with snow at farther ranges.

In this study the PVPR methodology was used to correct ZH which in turn was used to calculate rain rates and rain accumulations in a few winter events in Germany.  The results show a strong improvement in the quality of the QPE when compared to rain gauges. The quality of the resulting QPE depends on the event and on the location of the radar. More specifically, the quality decreases when the melting layer is very low, at heights comparable to the radar height, and when the difference between the beam and the surface increases. These problems will be analyzed and potential solutions will be tested in order to improve the quality of the rainfall product.

Ryzhkov, Alexander, Pengfei Zhang, Petar Bukovčić, Jian Zhang, and Stephen Cocks. 2022. "Polarimetric Radar Quantitative Precipitation Estimation" Remote Sensing 14, no. 7: 1695. https://doi.org/10.3390/rs14071695 

How to cite: Evaristo, R., Chen, J., Ryzhkov, A., and Trömel, S.: Testing a new Radar QPE methodology for winter events with a low melting layer, EGU General Assembly 2024, Vienna, Austria, 14–19 Apr 2024, EGU24-12054, https://doi.org/10.5194/egusphere-egu24-12054, 2024.

EGU24-12374 | ECS | Posters on site | HS7.1

Implications of the rainfall spatial variability for the real-time modeling of runoff triggering stony debris flows 

Mauro Boreggio, Matteo Barbini, Martino Bernard, Matteo Berti, Massimiliano Schiavo, Alessandro Simoni, Sandivel Vesco Lopez, and Carlo Gregoretti

In a mountainous environment, high-intensity and short-duration precipitation can generate sudden and abundant runoff at the base of rocky cliffs. This runoff, upon impacting the debris deposits present there, can trigger debris-flow phenomena. In the province of Belluno, in the Boite River valley, a network of rain gauges has been set up to monitor precipitation in the Rovina di Cancia site, where 12 debris-flow events have occurred in the last 10 years. The rain gauges are strategically placed both upstream and downstream of the debris-flow initiation area. In most cases, the precipitation showed significant spatial variability in both planimetric and altimetric aspects. This variability is crucial when simulating the runoff that triggers stony debris flows. The simulation of the peak runoff that triggered the 12 occurred events using a single rain gauge presented a high scatter compared to the simulation performed with the spatially recorded rainfall, except when the chosen rain gauge was close to the rocky cliffs. Furthermore, modelling using radar estimates as rainfall input also displayed significant variability based on the rain gauge used to correct the radar data. Essentially, accurate real-time simulation of runoff triggering debris flows requires the presence of rain gauges upstream of the initiation area, particularly in close proximity to the rocky cliffs.

How to cite: Boreggio, M., Barbini, M., Bernard, M., Berti, M., Schiavo, M., Simoni, A., Vesco Lopez, S., and Gregoretti, C.: Implications of the rainfall spatial variability for the real-time modeling of runoff triggering stony debris flows, EGU General Assembly 2024, Vienna, Austria, 14–19 Apr 2024, EGU24-12374, https://doi.org/10.5194/egusphere-egu24-12374, 2024.

EGU24-13111 | ECS | Orals | HS7.1

Identification of wet and dry periods in commercial microwave link observations via information theory framework 

Anna Špačková, Martin Fencl, and Vojtěch Bareš

Commercial microwave links (CML) have already demonstrated their promising potential in rainfall observation and sensing. The CMLs enable indirect monitoring of path-averaged rainfall intensity as the transmitted signal is attenuated along the link path mainly by raindrops. However, the signal is also attenuated during dry weather periods and is affected by both atmospheric and hardware conditions. Faulty separation of wet and dry periods can easily lead to incorrect rainfall estimates and remains challenging to estimate due to irregular fluctuations of the attenuated signal.

This study aims to use information theory approach to estimate wet and dry periods in the CML signal attenuation observation, which is achieved by evaluating individual predictors and combinations of predictors. The method enables any data to be used as predictors without the need for parameters to describe relations between different variables, as the discrete probability distributions are applied. The model that provides the strongest information content to the wet and dry classification is binarized using an optimized threshold and validated. Thiesen et al. (2019) recently applied this approach to identify rainfall-runoff events in discharge timeseries.

Data of non-winter periods between 2014 and 2016 are used with a temporal resolution of 1 minute. For one CML in the Prague network, wet and dry periods were defined manually as reference (target). Predictors included raw CML data (signal attenuation), as well as derived timeseries such as signal attenuation shifted in time, relative magnitude of attenuation, gradient of the signal attenuation and signal deviation. In addition, external predictors such as temperature deviation, rain gauge precipitation observations or synoptic types are used as additional predictors.

By selecting different predictors, it is possible to compare effectiveness in estimating the reference wet and dry periods. Variation in the strength of the relations between the target and the predictors allows ranking the suitability of available predictors and their combinations for the task. Subsequently, having the best performing predictor, it is combined with others and their collective performance was iteratively evaluated to find the most accurate combination of three predictors described in a multidimensional discrete distribution model. The resulting predictor combination was then converted into binary form and validated. A method comparison is performed with separation of constant and moving average baseline attenuation for wet periods identification as well as wet/dry classification using a threshold for rolling standard deviation of the signal.

Having sufficient data amount for data-driven models enables utilizing the relationships within the dataset without being limited by parametric or operational assumptions, which are often embedded part of wet/dry in classification methods.

References
Thiesen, S., Darscheid, P., and Ehret, U.: Identifying rainfall-runoff events in discharge time series: a data-driven method based on information theory, Hydrol. Earth Syst. Sci., 23, 1015–1034, https://doi.org/10.5194/hess-23-1015-2019, 2019.

This work was supported by the Grant Agency of the Czech Technical University in Prague, grant no. SGS23/048/OHK1/1T/11.

How to cite: Špačková, A., Fencl, M., and Bareš, V.: Identification of wet and dry periods in commercial microwave link observations via information theory framework, EGU General Assembly 2024, Vienna, Austria, 14–19 Apr 2024, EGU24-13111, https://doi.org/10.5194/egusphere-egu24-13111, 2024.

EGU24-14062 | Posters on site | HS7.1

Upward transport in a canopy assisted by raindrop impacts on plant leaves 

Tristan Gilet and Loïc Tadrist

The interception of raindrops by plant leaves induces a redistribution of water, nutrients, and micro-organisms, from the surface of these leaves to their surroundings. It consequently shapes the plant ecosystem. For example, in wheat fields (as in most major crops), splashing raindrops are the main mechanism of spore dispersal for fungal diseases at the epidemic stage, with severe consequences on crop yield. Surprisingly, the observed dispersal is not only downward (wash off / dripping) or outward (splash), but also upward, which may considerably speed up the fungus propagation. Other nutrients and microorganisms might also benefit from such upward transport external to the plant.

In this work, we unravel an efficient and universal mechanism of upward transport: after a raindrop splashed on a plant leaf, the residual water on the leaf can be shot upward as the leaf springs back. We illustrate this phenomenon with several plant leaves. Then we present results obtained from systematic experiments with artificial leaves, thanks to which both the mechanics of rain-induced leaf motion and the fluid dynamics of leaf-induced droplet ejections are elucidated. We identify the range of mechanical properties of the leaf that makes upward shooting fully effective. Finally, we show that the efficiency of this upward transport increases more than proportionally with rain intensity. Its occurrence and role in shaping ecosystems will be largely amplified in the case of an increased frequency of extreme rain events.

How to cite: Gilet, T. and Tadrist, L.: Upward transport in a canopy assisted by raindrop impacts on plant leaves, EGU General Assembly 2024, Vienna, Austria, 14–19 Apr 2024, EGU24-14062, https://doi.org/10.5194/egusphere-egu24-14062, 2024.

EGU24-16024 | ECS | Orals | HS7.1

Quantifying precipitation intermittency for Bergen, Norway, from measurements and models across a wide range of time scales 

Ingrid O. Bækkelund, Mari B. Steinslid, and Harald Sodemann

Intermittency of rainfall is an important property, for example in the context of urban flooding. There is currently a lack of information about the ability of numerical weather prediction models to represent precipitation intermittency for different weather situations, in particular at high resolution in space and time. Here we present a new way to quantify rainfall intermittency based on a near-continuous, high-resolution precipitation dataset from Bergen, Norway, one of the rainiest cities in Europe. 

We quantify precipitation intermittency from a precipitation dataset acquired at the Geophysical Institute, Bergen, spanning the period 2019-2022 at a 1 min time resolution. Precipitation rates were obtained from a Total Precipitation Sensor TPS-3100 (Yankee Environmental Systems Inc., USA) and a Parsivel2 disdrometer (OTT Hydromet GmbH, Germany). In addition, we use precipitation output at 1 min resolution from the regional high-resolution weather forecasts model HARMONIE-AROME for selected events. Precipitation intermittency is then identified for a range of minimum inter-event times (MIT) from 1 min to 24 h, and precipitation event durations from 1 min to 33 days. Next, the precipitation events for different intermittencies are related to average meteorological characteristics during the events with respect to air temperature, pressure, wind speed, rain rate and amount, and corresponding weather regimes.  

We compile the intermittency information into a 2-dimensional heat map that can be considered as a characteristic fingerprint for precipitation in Bergen. Particular frequency maxima and minima appear to be related to different precipitation processes and weather regimes. A scale gap between 30 min and 2 h event duration for MIT larger than 12 h indicates that separate factors control precipitation processes at these time scales. Weather regimes show a clear influence on the precipitation characteristics, with a markedly higher probability for long-duration rain events in the zonal flow regime for longer event durations at high MITs compared to the Scandinavian trough regime. A comparison between precipitation intermittency simulated by HARMONIE-AROME shows reasonable agreement with observed event characteristics for events lasting more than 1h, while events with durations of 30 min and less are poorly represented. 

How to cite: Bækkelund, I. O., Steinslid, M. B., and Sodemann, H.: Quantifying precipitation intermittency for Bergen, Norway, from measurements and models across a wide range of time scales, EGU General Assembly 2024, Vienna, Austria, 14–19 Apr 2024, EGU24-16024, https://doi.org/10.5194/egusphere-egu24-16024, 2024.

EGU24-17471 | Orals | HS7.1

Wind-induced bias of catching-type precipitation gauges and their overall collection efficiency 

Luca G. Lanza, Arianna Cauteruccio, and Enrico Chinchella

In windy conditions, the measurement of liquid and solid atmospheric precipitation is still a challenge even using the most advanced automatic instrumentation (Cauteruccio et al., 2021). The measurement accuracy is affected by various environmental sources of bias, including siting issues and exposure. These add to the instrumental bias, which can be minimized in case of accurate instrument calibration. Wind is however recognised as the most impactful source of environmental bias, outperforming by 3 to 50 times the total impact of all other environmental factors.

Computational Fluid Dynamics simulation with embedded liquid (raindrops) and solid (snowflakes) particle tracking is here used to quantify the wind-induced bias of catching-type precipitation gauges. Starting from the numerically calculated catch ratios, six common commercial gauges having different outer geometry are compared in terms of their expected performance under various precipitation intensity and wind speed conditions. Preliminary wind tunnel experiments allowed full validation of the simulated aerodynamic behaviour and its effect on water drop trajectories.

The overall collection efficiency is shown to depend on the precipitation intensity and its functional dependence is quantitatively derived as a measure of the instrument performance under a wind climatology characterised by a uniform probability density function. A less pronounced diversion of hydrometeor trajectories is shown – at any given size – by instruments with aerodynamic design than in case of more traditional geometry.

Chimney-shaped instruments rank low in case of liquid precipitation measurements, while a high performance is shown by inverted conical and Nipher shielded instruments and the investigated quasi-cylindrical gauges have intermediate behaviour, which depends on their specific aerodynamic features. All instruments rank low at light to moderate precipitation intensity for the measurement of solid precipitation, except the Nipher shielded gauge.

This work provides the basic information needed to apply adjustments to the measured data and supports manufacturers in upgrading instruments with an existing design by introducing on-board adjustments of the measured precipitation. These would only require contemporary measurement of the wind velocity (often included in typical meteorological stations). The full work and the numerically derived adjustments for the six investigated commercial gauges are published in Cauteruccio et al. (2024).

References

Cauteruccio, A., Colli, M., Stagnaro, M., Lanza, L.G. & Vuerich, E. (2021). In situ precipitation measurements. In T. Foken (Ed.), Handbook of Atmospheric Measurements (359-400). Switzerland, Springer Nature. ISBN 978-3-030-52170-7, https://doi.org/10.1007/978-3-030-52171-4_12.

Cauteruccio, A., Chinchella, E. and L.G. Lanza (2024). The overall collection efficiency of catching-type precipitation gauges in windy conditions. Water Resour. Res., in press. https://doi.org/10.1029/2023WR035098.

How to cite: Lanza, L. G., Cauteruccio, A., and Chinchella, E.: Wind-induced bias of catching-type precipitation gauges and their overall collection efficiency, EGU General Assembly 2024, Vienna, Austria, 14–19 Apr 2024, EGU24-17471, https://doi.org/10.5194/egusphere-egu24-17471, 2024.

EGU24-18921 | Orals | HS7.1

Unveiling the Geodetic Distribution of Temporal Characteristics in Rainstorm Events across Republic of Korea 

Hoyoung Cha, Jongjin Baik, Hyeon-Joon Kim, Jinwook Lee, Jongyun Byun, and Changhyun Jun

Abstract

This study analyzed geodetic distribution about temporal characteristics in rainstorm (> 1 hour) observed at approximately 600 rainfall stations across Republic of Korea. Utilizing minute-scale precipitation data observed by rainfall stations from 2000 to 2022, independent rainstorm events separated from rainfall data per unit time (i.e., 10, 20, 30, and 60 minutes) and Inter-Event Time Definition (IETD) (i.e., 2, 3, 4, and 6 hours). The significant variations in rainfall characteristics are defined as the number of independent rainstorm events, rainfall duration (hour), amount (mm), and intensity (mm/hour) for quantifying the temporal characteristics across rainfall stations. We quantified temporal characteristics among rainfall characteristics observed by rainfall stations based on latitude and longitude. The number of independent rainstorm events varies significantly depending on unit time and IETD, and the occurrence of events was frequently observed in areas characterized by island features. The rainfall amount for independent rainstorm events obscured significant characteristics, excluding Halla Mountain on Jeju Island. The geodetic distribution for the duration and intensity per rainstorm event varied depending on the characteristics of the region (i.e., island, mountain, etc.). Based on these results, it was confirmed that certain temporal characteristics vary according to regional features. In future research, we intend to utilize this information to cluster rainfall stations based on temporal characteristics.

Keywords: Independent Rainstorm Events, Temporal Characteristics, Geodetic Distribution, Regional Features, Republic of Korea

Acknowledgment

This research was supported by Korea Environment Industry & Technology Institute (KEITI) funded by Korea Ministry of Environment (RS-2022-KE002032 and 2022003640001) and was also supported by the National Research Foundation of Korea (NRF) grant funded by the Korea government (MSIT) (No. NRF-2022R1A4A3032838 and No. RS-2023-00250239).

How to cite: Cha, H., Baik, J., Kim, H.-J., Lee, J., Byun, J., and Jun, C.: Unveiling the Geodetic Distribution of Temporal Characteristics in Rainstorm Events across Republic of Korea, EGU General Assembly 2024, Vienna, Austria, 14–19 Apr 2024, EGU24-18921, https://doi.org/10.5194/egusphere-egu24-18921, 2024.

EGU24-20231 | Posters on site | HS7.1

A new method for disaggregating path-averaged rain rates from commercial microwave links 

Martin Fencl and Marc Schleiss

Commercial microwave links (CMLs) serve as point-to-point radio connections in cellular backhaul and offer a promising way to measure rainfall opportunistically. Raindrops along the CML path attenuate electromagnetic waves, allowing the conversion of this attenuation into path-averaged rain rates. Wide coverage of CML networks, high density in urban areas, and cost-effective operation present clear advantages over traditional rain gauges and radar networks. However, the integrated nature of CML data poses a challenge. When transforming this data into spatially representative rainfall estimates, such as 2D maps, path-integrated rain rates need to be converted into point data and interpolated to a regular two-dimensional Cartesian grid. The most direct method involves reducing each CML observation to a single-point measurement at the path's center, followed by interpolation using techniques like kriging or inverse distance weighted (IDW) interpolation. Yet, past studies indicate that for longer CMLs (several kilometers) and intense localized rain showers, this approach can introduce significant biases and unrealistic rainfall distributions due to the substantial spatial and temporal variability of rainfall.

In this contribution, we introduce a new disaggregation method employing random cascades. The method redistributes rainfall amounts along CML paths across progressively smaller scales using a discrete, conservative multiplicative random cascade. Inspired by the EVA (Equal-volume area) cascade developed by Schleiss (2020) for disaggregating spatially intermittent rainfall fields, our approach involves splitting each CML segment into two new segments with different path-lengths but identical path-integrated rainfall. We call this new method CLEAR (CML segments with equal amounts of rain). CLEAR is tested for CML network of 77 CMLs located in Prague, CZ. First, the disaggregation is evaluated using simulated CML observations and, second, CML rain rates derived from real attenuation data.

Our findings demonstrate that CLEAR surpasses reconstruction algorithms that reduce CML observations into a single point. It accurately replicates the highly diverse rainfall distributions observed along CMLs, including their intermittency. Moreover, the stochastic nature of the cascade enables the quantification of uncertainty associated with the spatial redistribution of rainfall rates along CMLs.

References

Schleiss, Marc. “A New Discrete Multiplicative Random Cascade Model for Downscaling Intermittent Rainfall Fields.” Hydrology and Earth System Sciences 24, no. 7 (July 23, 2020): 3699–3723. https://doi.org/10.5194/hess-24-3699-2020.

How to cite: Fencl, M. and Schleiss, M.: A new method for disaggregating path-averaged rain rates from commercial microwave links, EGU General Assembly 2024, Vienna, Austria, 14–19 Apr 2024, EGU24-20231, https://doi.org/10.5194/egusphere-egu24-20231, 2024.

EGU24-20898 | Posters on site | HS7.1

Comparative analysis of rainfall characteristics for two distinct research plots 

Jürgen Komma, Borbala Szeles, Katarina Zabret, Mojca Šraj, and Juraj Parajka

In natural environments, rainfall causes soil erosion, which has a significant impact on the agricultural production and the ecological conditions of the streams. Due to different types of vegetation, their unique characteristics and seasonality, there are still a lot of open scientific questions about how rainfall interception process influences the rainfall erosivity and soil erosion. With the aim of improving knowledge about rainfall interception by different vegetation and its impact on the rainfall erosivity, an interdisciplinary and international research team (Faculty of Civil and Geodetic Engineering at the University of Ljubljana, Slovenian Forestry Institute and Technical University of Vienna) work together in the research project entitled “Evaluation of the impact of rainfall interception on soil erosion”. In the scope of the project, drop size distribution measurements above and below selected plants will be conducted in combination with classical measurements of rainfall partitioning. The measurements are ongoing in the small urban park in Ljubljana, Slovenia and in the experimental catchment with mainly agricultural land use in Lower Austria (The Hydrological Open Air Laboratory HOAL in Petzenkirchen). To evaluate the differences in rainfall characteristics for the two research plots, a comparative analysis on rainfall event properties such as rainfall amount, duration and intensity, size and velocity distribution of raindrops is performed. The aim of the presentation is to introduce the project and presents the first comparison of the rainfall characteristics at research plots in Austria and Slovenia.

Acknowledgments: This contribution is part of the ongoing research project entitled “Evaluation of the impact of rainfall interception on soil erosion” supported by the Slovenian Research and Innovation Agency (project J2-4489) and the Austrian Science Fund (FWF) I 6254-N.

How to cite: Komma, J., Szeles, B., Zabret, K., Šraj, M., and Parajka, J.: Comparative analysis of rainfall characteristics for two distinct research plots, EGU General Assembly 2024, Vienna, Austria, 14–19 Apr 2024, EGU24-20898, https://doi.org/10.5194/egusphere-egu24-20898, 2024.

EGU24-409 | ECS | Orals | HS7.2

Developing a relative quality index scheme for improving radar composite products and bias adjustment in mountainous regions, Thailand 

Monton Methaprayun, Thom Adrianus Bogaard, and Punpim Puttaraksa Mapiam

Radar composite products are essential for tracking and forecasting heavy storms over mountainous catchments where rain gauge information is scarce. The impact of radar beam blockage from an individual radar, resulting in low reflectivity data, can significantly contribute to the underestimation of radar rainfall estimates in such areas. The quality of rain radar composites is critical as these products will be used for near real-time forecasting of hydrometeorological hazards. This study aimed to develop a relative quality index scheme based on the radar reflectivity fraction of the compositing radars to improve the accuracy of heavy rainfall estimates in (partly) blocked areas. Three additional surrounding environmental quality indices, i.e., the distance to the radar station, the height of the beam above the ground, and the radar beam blockage fraction were integrated in the overall quality indices (QI) computation. Furthermore, we expanded the use of the QI to enhance the mean field bias adjustment in tracking high-intensity rainfall. To comprehensively assess the merits and drawbacks of the compositing methods with multiple quality indices, we compared our results with conventional and well-known maximum composite techniques. We have tested this scheme in the Khao Yai National Park, Lamtakong basin, and the surrounding areas. Two rain radar stations were selected: Sattahip, 220 kilometer southwest and Phimai, 140 kilometer North of the Lamtakong basin. Automatic rain gauges in the overlapping area were used to evaluate the radar composite product during storm events in 2020 and 2022. The results indicate that radar composite approach with multiple QIs can effectively identify areas with unreliable radar measurement. The radar reflectivity fraction was the most important quality index in the composite region, especially in the beam blockage area where the reflectivity from Phimai consistently registers lower values compared to that from the Sattahip radar. Combining this novel relative QI scheme with traditional quality indices (distance, height, and beam blockage fraction) increased the overall accuracy and reliability of heavy radar rainfall estimates. While the combined QIs and the maximum composite method resulted in composite products with similar overall accuracy, the proposed new QI method provides more coherent storm structure. Furthermore, a noteworthy finding is that heavy rainstorms in obstructed areas become visibly apparent with higher accuracy when applying thresholds to the quality index values for bias adjustment computation of the composite products. These final products of radar rainfall estimates represent a critical advancement of rain radar based Early Warning Systems for hydrometeorological hazard mitigation in mountainous regions.

How to cite: Methaprayun, M., Bogaard, T. A., and Mapiam, P. P.: Developing a relative quality index scheme for improving radar composite products and bias adjustment in mountainous regions, Thailand, EGU General Assembly 2024, Vienna, Austria, 14–19 Apr 2024, EGU24-409, https://doi.org/10.5194/egusphere-egu24-409, 2024.

Analyzing the complex behavior of extreme precipitation events is essential for a better understanding of the effects of climate change on water resources and for forecasting extreme hydrologic events. In this study, complex network concepts are applied to investigate the synchronization patterns of extreme daily precipitation events across India, with an evaluation of how these patterns may vary in the future. Daily rainfall data provided by the India Meteorological Department (IMD) for the period 1961-2020 at a spatial resolution of 0.25ᵒ×0.25ᵒ are used to investigate the synchronization patterns of extreme rainfall during the historical period. To assess synchronization patterns in the future, rainfall projections from selected General Circulation Models under different Shared Socio-Economic Pathway Scenarios are employed. A day with precipitation greater than 1 mm is considered a wet day, and a wet day is then classified as an extreme precipitation event only if its precipitation exceeds the 95th percentile of all wet days. For the construction of the network, each grid is considered as a node, and the connections between them are identified using the event synchronization method. Both historical and future precipitation networks are analyzed for two different seasons: (i) Summer (June, July, August, and September); and (ii) Winter (December, January, and February). Two network measures, namely degree centrality and clustering coefficient, are determined for these networks. Changes in network measures, relative to the baseline period of 1961–2020, are analyzed across three different timeframes: the 2020s, 2040s, and 2070s. The findings from the network measures can reveal crucial geographic locations in terms of their connection patterns to other areas for both seasons.


How to cite: Bhadran, D. and Sivakumar, B.: Analysis of Extreme Precipitation Events in India under Shared Socioeconomic Pathway Scenarios: Application of Complex Networks, EGU General Assembly 2024, Vienna, Austria, 14–19 Apr 2024, EGU24-542, https://doi.org/10.5194/egusphere-egu24-542, 2024.

Southern South America (SSA) covers the extratropical part of South America (20–60°S) and presents a wide variety of climates. To the west of the Andes mountain range, annual precipitation increases southward from very dry conditions along the Atacama Desert in northern Chile to more than 3000 mm in the south. Conversely, east of the Andes, it increases from the Argentinian Patagonia in the south towards southeastern South America (southern Brazil, northeastern Argentina and Uruguay) where severe thunderstorm environments are typical. Global climate models project that the observed negative (positive) trends in precipitation over the subtropical central Andes (Southeastern South America) are expected to be more intense causing concern about water availability, ecosystems and socio-economic activities. However, the regional-to-local information that can be obtained by downscaling over GCMs outputs and needed for adaptation and mitigation policies, is still scarce over SSA. Unlike other parts of the world, limited studies analyzing the statistical downscaling (ESD) potential to simulate daily precipitation are available over the region and deep learning-based models have not been tested for downscaling daily precipitation over the region up to now.

In this context, this work presents a comprehensive assessment of Convolutional Neural Networks (CNNs) to downscale daily precipitation at a continental-scale, building on the validation framework of the European project VALUE. To this end, we conduct a sensitivity analysis to the domain size as well as to the selection of the loss function on the modeling of precipitation in both present and future climates. Overall, the CNNs show skilful performance in modeling daily precipitation characteristics, including the extremes, over the different climatic regions of SSA. Nevertheless, we find the selection of the loss function to be a source of uncertainty over the arid regions of northern Chile and northwestern Argentina for both present and future climates by projecting different climate change signals. Regarding the domain size, the CNNs show to be effective in selecting informative predictors and their area of influence demonstrating their self-learning skill and their efficiency to be applied on a continental scale. These results encourage the construction of ensembles of deep learning models based on different loss functions in SSA to account for this type of uncertainty in the modeling of precipitation, especially in future climates.

How to cite: Bettolli, M. L., Baño-Medina, J., Olmo, M., and Balmaceda-Huarte, R.: Modeling local precipitation in Southern South America using Deep Learning: A sensitivity analysis on the choice of input features and loss function in the climate change signal, EGU General Assembly 2024, Vienna, Austria, 14–19 Apr 2024, EGU24-786, https://doi.org/10.5194/egusphere-egu24-786, 2024.

The availability of precipitation data from in-situ stations faces various challenges including varying quality and resolutions, improper distribution, and scarcity in many regions. This is particularly true for the West Bank. Hence, identifying the best available alternatives is a priority since high quality precipitation estimates are essential for most hydrological applications. This study focuses on examining the suitability of four satellite precipitation products (IMERG Final Run, PDIR-Now, CCS-CDR, CMORPH) in the Levant region taking Historical Palestine (West Bank, Israel) a case study. These precipitation products were compared to 502 in-situ rainfall stations (132 Palestinian and 370 Israeli) across the region at a daily time-step and had fine spatial resolutions varying 4-10 Km. Results show that IMERG estimates outperform all other products, with a mean R2 = 0.33 and Probability of Detection (POD) =0.7 with no adjustments applied. This R2 value is significantly higher than those found in other studies with similar climates. CMORPH was found to be the next best with a mean R2 =0.2 and POD = 0.4. The impact of elevations was also investigated and while IMERG was again the best overall, CCS-CDR performed better at lower elevations. Additionally, the satellite products were used to compare nearby Israeli and Palestinian stations and all satellites achieved higher results when compared to the Israeli stations. This potentially indicates the need for further investigation into the quality of Palestinian stations. Overall, this study found that IMERG provided the best performing satellite-based precipitation estimate for the Levant Region across a range of elevations, climatic regions, and rainfall thresholds. In addition to identifying the best performing date sets and examining newly released satellite products, this study’s finding will open the way to the application of these data sets for many hydrological purposes using available, easy-access remotely-sensed products.

How to cite: Jayousi, F. and O'Loughlin, F.: Assessment of The Applicability of Remotely Sensed Rainfall Products for Hydrological Analysis in The Levant Region (Case Study: Historical Palestine), EGU General Assembly 2024, Vienna, Austria, 14–19 Apr 2024, EGU24-1434, https://doi.org/10.5194/egusphere-egu24-1434, 2024.

EGU24-1507 | Orals | HS7.2

Radar cluttering incidence in the estimation of rainfall fields in the Colombian Andes 

Jorge Iván Ramírez Tamayo, Adriana Patricia Piña Fulano, and Alfonso Ladino Rincon

The spatial variability of rainfall is difficult to measure due to the lack of ground weather rain gauges. As a result, meteorological radars have become crucial sources of information for estimating precipitation fields. However, radar cluttering, which refers to external factors of nature that affect radar data quality, poses a significant challenge, and contributes to errors and uncertainties in the estimation process. In this study, we focused on analyzing the impact of cluttering on the Barrancabermeja C-band weather radar, situated between the Eastern and Central Ranges in the Colombian Andes. The analysis was conducted using radar information collected between 2019 and 2020. A frequency analysis of reflectivity of rainless day records showed the topographic interferences caused by the surrounding radar Ranges. Afterwards, the radar quality index (RQI) for both rainy and dry conditions was estimated considering factors such as clutter frequency map, partial beam blockage, effects of range distance quality, radar noise, and attenuation. The evaluation revealed an approximate clutter area of 50% in a beam elevation of 0.5°, primarily associated with the topographical interferences, indicating a direct impact of the Andean region on radar data quality.

Finally, we focused on intense rainfall events (greater than 10mm per event) to determine the parameters of three Quantitative Precipitation Estimation (QPE) relationships (Marshall & Palmer (1948), Seliga & Bringi (1976), and Sachidananda & Zrinc (1987) methodologies). Records from 91 available rain gauges were used to obtain relationships for individual gauges and, for four individual rings spaced 50 km from the radar. By employing these relationships, we calculated uncertainty maps of the quantitative precipitation estimation, obtaining an uncertainty of 60% from cluttering in the QPE of the meteorological radar. Overall, our findings emphasize the significant role of cluttering in the estimation of precipitation fields from the Barrancabermeja radar. The study underscores the importance of addressing cluttering effects and accounting for the topographical interferences in radar data interpretation to enhance the accuracy of quantitative precipitation estimates in the Andean region.

How to cite: Ramírez Tamayo, J. I., Piña Fulano, A. P., and Ladino Rincon, A.: Radar cluttering incidence in the estimation of rainfall fields in the Colombian Andes, EGU General Assembly 2024, Vienna, Austria, 14–19 Apr 2024, EGU24-1507, https://doi.org/10.5194/egusphere-egu24-1507, 2024.

EGU24-2047 | ECS | Orals | HS7.2

On the improvement of runoff and glacier mass balance modelling by performing an undercatch correction on gridded precipitation data sets based on independent station data 

Philipp Maier, Caroline Ehrendorfer, Sophie Lücking, Fabian Lehner, Franziska Koch, Mathew Herrnegger, and Herbert Formayer

Models like the conceptual hydrological model COSERO and the physically-based mountain surface process model Alpine3D are highly sensitive to meteorological inputs, especially precipitation. Gridded precipitation data sets usually originate from spatially interpolated weather station data, which are not corrected for precipitation undercatch. The term precipitation undercatch describes the deviation of measured precipitation in rain gauges to the actual amount in a given area due to several factors like instrument design or effects of splash, evaporation and especially wind. Specifically solid precipitation is prone to wind drag. Because of these effects, models or model chains fail to simulate observations for discharge, reservoir inflow, snow and ice melt as well as glacier mass balance due to the lack of realistic precipitation input into the system in high-alpine regions. However, correcting the undercatch directly within the gridded data set leads to an overestimation of precipitation, which has two main reasons: First, undercatch correction functions are not derived for alpine temperatures and wind speeds. Second, stations at lower elevations, where the undercatch is comparatively small, are usually over-represented in gridded data sets.

Therefore, we composed a method to perform a precipitation undercatch correction in high-alpine areas by using a gridded precipitation data set and quality-controlled, representative station data in the vicinity of snow-dominated and glacierized catchments as well as their altitude and exposure to generate spatial undercatch correction fields for three selected catchments in Austria (Maltatal, Zillertal and Vernagtferner) on a monthly basis. These correction factors are a function of elevation and the month and result from a stepwise linear interpolation with elevation, whereas the highest factors are obtained in the winter months due to low temperatures. Using the topography and averaging over whole catchments, the highest (lowest) correction factors are obtained in February (August), ranging from 2.16 to 1.04, depending on the catchment and season.

The meteorological data (with and without the undercatch corrected precipitation) was used as an input for a coupled snow-glacier-discharge simulation with the models COSERO and Alpine3D on the selected catchments. The output was validated against reservoir inflow, observed glacier mass balances and satellite derived snow depth maps. With the undercatch corrected precipitation, the models perform substantially better in simulating observations for glacier mass balance as well as reservoir inflow.

Acknowledgements: We thank VERBUND AG for fruitful discussions and providing us with data.

How to cite: Maier, P., Ehrendorfer, C., Lücking, S., Lehner, F., Koch, F., Herrnegger, M., and Formayer, H.: On the improvement of runoff and glacier mass balance modelling by performing an undercatch correction on gridded precipitation data sets based on independent station data, EGU General Assembly 2024, Vienna, Austria, 14–19 Apr 2024, EGU24-2047, https://doi.org/10.5194/egusphere-egu24-2047, 2024.

EGU24-2561 | ECS | Posters on site | HS7.2

A weather reconstruction approach for daily precipitation since 1960s in South America  

Adrian Huerta, Roberto Serrano-Notivoli, Benjamin Stocker, and Stefan Brönnimann

Long-term weather observations are required to understand past climate and extreme weather events. However, there are a host of factors that affect the measurements and make the data unsuitable for direct use and analysis. In this regard, the proposed research attempts to create a serially complete observed and gridded dataset of daily precipitation in South America, a region with sparse station networks, complex orography (Andes Mountain range) and a diversity of climates (tropical to sub-polar climates). To accomplish this challenging purpose, we will create in a first step a station-based database with high-quality standards using reproducible quality control, gap-filling and homogenisation procedures. In a second step, we will construct a gridded-based dataset by employing weather reconstruction approaches such as analogues plus machine learning together with multiple satellite precipitation products and other remote-sensing- and reanalysis-based variables. Further, we will account for uncertainty in the station- and gridded- based dataset, which is critical for adequately understanding uncertainty in any application modelling chain, especially in complex-sparse terrain regions. Once the gridded data is available, we will evaluate it by analysing extreme events indices in conjunction with other established gridded precipitation products. This analysis will not only evidence the added value of the gridded data but also will enhance the knowledge of high-impact extreme events in South America, particularly over the Andes chain as a whole. Finally, we expect that the data products from the research will be useful for climate science and other geoscientific and operational applications in Earth-system fields in South America. The proposed study will continue previous projects in the tropical Andes (DECADE and CLIMANDES) by the University of Bern as it will expand to the entire continent, providing a wide variety of applications. 

How to cite: Huerta, A., Serrano-Notivoli, R., Stocker, B., and Brönnimann, S.: A weather reconstruction approach for daily precipitation since 1960s in South America , EGU General Assembly 2024, Vienna, Austria, 14–19 Apr 2024, EGU24-2561, https://doi.org/10.5194/egusphere-egu24-2561, 2024.

EGU24-2799 | ECS | Posters on site | HS7.2

Enhancing Radar-Based Ensemble Nowcasting with CSGD: A UK Study 

Hung-Ming Lin and Li-Pen Wang

Probabilistic radar-based precipitation nowcasting is increasingly vital for real-time hydrological applications because not only it produces timely rainfall input but also the informative ensemble nowcasts may facilitate decision making. There are two primary sources uncertainty while using radar-based nowcasts for hydrological applications. The first one lies in nowcasting algorithm itself; for example, inaccurately predicted rainfall magnitudes and rainfield advection displacement errors, both exacerbated as the lead time increases. The second one is the ‘measurement’ error. There is a notable discrepancy between radar-derived precipitation estimates and measurements from rain gauges, underscoring the inherent uncertainties, including systematic and random errors, in radar data. This discrepancy necessitates aligning indirect radar measurements with actual ground-level precipitation for practical hydrological applications and analyses.

In this study, we focus on tackling the ‘measurement’ uncertainty, such that the applicability of ensemble nowcasts to hydrological practices can be improved. In the proposed method, rain gauge observations are treated as the ground truth. The Censored and Shifted Gamma Distribution (CSGD) model is then constructed using these gauge data and the co-located radar rainfall estimates. The use of CSGD model lies in its ability to not only condition actual rainfall estimates on radar data values but also account for precipitation climatology at gauge locations. Based on the CSGD parameters at know locations, we can further interpolate parameters for any locations within our study domain. We then employed the STEPS (Short-Term Ensemble Prediction System) to generate radar-based ensemble nowcasts, which are then adjusted at each radar pixel locations using CSGD model with the corresponding parameters. This leads to CSGD-enhanced ensemble nowcasts.

The United Kingdom, with its comprehensive weather data, served as the experimental area for this study. The 1-km UK C-band radar composite from the Met Office Nimrod System and the Met Office Integrated Data Archive System (MIDAS) gauge data were utilised. By aggregating these datasets into hourly scales, climatological and conditional CSGD parameters from 2015 to 2020 were estimated. The evaluation involved two stage. Initially, about 10% of rain gauges were excluded from the CSGD model fitting, with parameters estimated via Kriging interpolation. This is to ensure the quality of interpolated CSGD parameters. Then, a total of 30 storm events from 2021 to 2023 were selected to test the proposed method. Preliminary results show that the CSGD-enhanced ensemble nowcasts show a higher agreement with rain gauge observations as compared to the original nowcasts.

The proposed method is of great practical potential to provide not only timely but also enhanced precipitation nowcasts to critical hydrological applications, such as landslide or flooding warnings.

How to cite: Lin, H.-M. and Wang, L.-P.: Enhancing Radar-Based Ensemble Nowcasting with CSGD: A UK Study, EGU General Assembly 2024, Vienna, Austria, 14–19 Apr 2024, EGU24-2799, https://doi.org/10.5194/egusphere-egu24-2799, 2024.

This research assesses the deterministic and probabilistic skill of an Artificial Neural Networks ensemble (EANN) for a 1-month-lead precipitation forecast. The EANN employs low-frequency climate oscillation indices to predict precipitation in the Brazilian state of Ceará, a key region for climate forecasting studies due to its high seasonal predictability. Additionally, a combination of the EANN and dynamical models into a hybrid multi-model ensemble (MME) is proposed. The EANN's forecasting ability is compared to a Multiple Linear Regression, a Multinomial Logistic Regression and North American Multi-Model Ensemble (NMME) models through leave-one-out cross-validation based on 40 years of data. A spatial comparison showed that the EANN was among the models with the highest deterministic and probabilistic accuracy, except in the southern region of the state. Moreover, an analysis of the area-aggregated reliability and sharpness diagrams showed that the EANN is better calibrated than the individual dynamical models and has better resolution than traditional statistical models for above-normal (AN) and below-normal (BN) categories. Both statistical and dynamical models depict a bad-calibrated NN category. It is also shown that combining the EANN and dynamical models improves forecast system reliability compared to an MME based only on NMME models.

How to cite: Pinheiro, E. and B.M.J. Ouarda, T.: Seasonal Precipitation Forecast Using an Ensemble of Artificial Neural Networks and Climate Oscillation Indices. A Case Study of Ceará, northeastern Brazil., EGU General Assembly 2024, Vienna, Austria, 14–19 Apr 2024, EGU24-2896, https://doi.org/10.5194/egusphere-egu24-2896, 2024.

Design storms are often used to assess flood risks in urban and rural catchments. These synthetic storms are not replicas of real extreme rainfall events but rather simplified simulations of them. Using rainfall intensity-duration-frequency curves, these storms are parameterized to follow extreme rainfall conditions. To construct design storms for the future, these curves must first be recalculated to reflect future climate conditions. We propose a framework for adjusting short-duration intensity-duration curves and storm designs to future climate conditions that only requires projected temperature changes during rainy days. To do this, we first utilize the TENAX (TEmperature-dependent Non-Asymptotic statistical model for eXtreme return levels) model, a novel physically-based statistical model that can estimate future rainfall short-duration return levels. It is then possible to simulate future rainfall intensities (i.e., a design storm) using the duration-intensity curves for the future climate. In most cases, the information from climate models at a daily scale can be used to construct design storms at a sub-hourly scale without any downscaling or data bias corrections. We illustrate our approach by re-parameterizing the Chicago Design Storm (CDS) in light of climate change. Using the city of Zurich (Switzerland) as a case study, we demonstrate how we can calculate changes in the intensity-duration curve for durations ranging from 10 minutes to 3 hours by applying the TENAX model to the 100-year return level. We will then show how we can construct a synthetic 100-year return period design storm using CDS based on the present and future climates, as well as produce flood inundation maps to assess the changes in flood risk in the city.

How to cite: Peleg, N. and Marra, F.: A physics-based approach for simulating future extreme design storms to assess flood risks, EGU General Assembly 2024, Vienna, Austria, 14–19 Apr 2024, EGU24-3239, https://doi.org/10.5194/egusphere-egu24-3239, 2024.

EGU24-3245 | Orals | HS7.2

Sensitivity of simulated rain intensity and kineticenergy to aerosols and warm-rain microphysicsduring the extreme event of July 2021 in Belgium 

Kwinten Van Weverberg, Nicolas Ghilain, Edouard Goudenhoofdt, Matthias Barbier, Ester Kostinen, Sébastien Doutreloup, Bert Van Schaeybroeck, Amaury Frankl, and Paul Field

This paper presents an evaluation and sensitivity analysis of km-scale simulations of the unprecedented extreme rainfall event of July 2021 over Belgium and Germany, with a specific focus on sub-hourly extremes, size distributions and kinetic energy (KE) of rain. These variables are critical for hydrological applications, such as flood forecasting or soil loss monitoring, but are rarely directly obtained from Numerical Weather Prediction (NWP) or climate models. We present an extensive set of simulations exploring sensitivities to realistic variations in a newly implemented double-moment microphysics parameterization in the UK Met Office Unified Model. Most simulations reproduce the overall characteristics of the event, but overestimate the extreme rain rates. The rain rate - KE relation is captured well, despite too large volume-mean drop diameters. Amongst the sensitivities investigated, the representation of the raindrop self-collection - breakup equilibrium and the raindrop size-distribution shape have the most profound impact on the rainfall characteristics. While extreme rain rates vary within 30 %, the rain KE varies by a factor of four between the realistic perturbations to the microphysical assumptions. Changes to the aerosol concentration and the rain terminal velocity have a relatively smaller impact on the extreme rainfall characteristics. However, larger aerosol loading produces slightly smaller domain total rainfall, for which we propose a mechanism involving dynamical impacts of warm-rain suppression. Given the large uncertainties, a continued effort to improve the model physics will be indispensable to reliably estimate sub-hourly rain intensities and KE for direct hydrological applications.

How to cite: Van Weverberg, K., Ghilain, N., Goudenhoofdt, E., Barbier, M., Kostinen, E., Doutreloup, S., Van Schaeybroeck, B., Frankl, A., and Field, P.: Sensitivity of simulated rain intensity and kineticenergy to aerosols and warm-rain microphysicsduring the extreme event of July 2021 in Belgium, EGU General Assembly 2024, Vienna, Austria, 14–19 Apr 2024, EGU24-3245, https://doi.org/10.5194/egusphere-egu24-3245, 2024.

EGU24-4906 | ECS | Posters on site | HS7.2

Modelling convective cell lifecycle with a copula-based approach 

Chien-Yu Tseng and Li-Pen Wang

The utilisation of spatial-temporal rainfall generators for urban drainage design or operational planning has largely increased for better reflecting the hydrological response of the catchment. However, a significant challenge that persists within these models is their inadequate representation convective storms. More specifically, the overall variation in spatial and temporal rainfall modelling comprises those resulting from advection and evolution. Most of the generators however neglect the modelling of cell evolution. This deficiency poses difficulties to precise convective storm simulations, consequently leading to potential underestimations of flood risk.

In addressing the challenge of modelling convective storms, this study proposes a statistical-based algorithm that enables the generation of convective cell lifecycles accounting for the evolution of cell properties. To develop the algorithm, we first chose an area of approximately 431 km2, centred at Birmingham city, as our study area. A total of 176 effective convective storm events, spanning from 2005-2017, were then identified using ground rain gauge records within the study area. We then utilised the enhanced TITAN storm tracking algorithm, proposed by Munoz et al (2018), to extract convective cell lifecycles for the selected events. Finally, a total of 116,287 lifecycles, comprising 354,855 individual cells, were retrieved, with an average of 660 per storm event.

We then investigated these cell lifecycles in three stages. The initial stage was to statistically characterise individual properties of convective cells, including rainfall intensity, spatial extent, and movement velocity. Following this, an investigation of the inter-correlations among these cell properties was conducted. Similar to the findings outlined in the literature, strong correlations could be found between cells’ intensity and their lifespans and between cells’ intensity and their spatial extents. The final stage focused on examining the evolution of these cell properties during their lifetimes. An interesting finding here is that the growth and decay rates of these cell properties are in fact correlated with cell properties themselves. This observation points to the need to incorporate this correlation structure into the process of sampling convective cells.

To resolve the complex correlation structure within convective cell evolution, we employed the Copula method, which is innovatively applied to statistically model the complex multi-variate interrelations among the characteristics of convective cells. The vine-copula approach, in particular, can well-reproduce the interrelations present in the dataset. The development of a novel copula-based algorithm for modeling convective cell lifecycles marks a key advancement, offering the potential for enhanced precision in spatial-temporal rainfall generators (McRobie et al., 2013), in depicting regional convective rainfall patterns.

How to cite: Tseng, C.-Y. and Wang, L.-P.: Modelling convective cell lifecycle with a copula-based approach, EGU General Assembly 2024, Vienna, Austria, 14–19 Apr 2024, EGU24-4906, https://doi.org/10.5194/egusphere-egu24-4906, 2024.

EGU24-6118 | ECS | Orals | HS7.2

Which bias correction methods are suited to represent hydrologic extremes in the Alps? 

Paul C. Astagneau, Raul Wood, and Manuela I. Brunner

Projections from regional climate models are traditionally bias-corrected with ground observations before being used for hydrological modelling in order to improve the representation of local climate features. The choice of correction method affects hydrological projections, especially in mountain regions where the relationship between precipitation and temperature is a key property of the hydrological cycle as it controls the partitioning between solid and liquid precipitation. While several studies have investigated the sensitivity of hydrological projections (i.e., projections generated by feeding a hydrological model with climate projections) to the choice of bias correction technique, none have focused on single-model initial-condition large ensembles (SMILEs), which are a suitable tool for disentangling the response of hydrological extremes to climate change from their natural variability. In addition, the interaction between hydrological model choice and bias-correction method needs to be investigated in order to obtain more reliable hydrological projections.

The objective of this work is to identify the most appropriate statistical techniques to adjust climate SMILEs for studying changes in hydrological extremes in mountainous terrain. For this purpose, we bias-corrected the climate projections of two high-resolution SMILEs (0.11°) under the Representative Concentration Pathway 8.5 for the domain of Switzerland. Specifically, we used a 2 km gridded reanalysis derived from ground observations and three techniques to correct the precipitation and temperature time series: (1) univariate quantile mapping, (2) trend-preserving univariate quantile mapping, and (3) trend-preserving multivariate quantile mapping. Then, we used the bias-corrected time series as inputs to an ensemble of 11 hydrological models to simulate streamflow at the outlet of 93 near-natural Swiss catchments for the period 1955 - 2099. We compared the performance of the three bias-correction techniques with respect to their ability to simulate historical floods and droughts. In addition, we determined the most fit-for-purpose method by examining both the robustness of the corrections (e.g. towards model choice, transferability in time) and the sensitivity of future hydrological projections to the choice of bias correction technique.

How to cite: Astagneau, P. C., Wood, R., and Brunner, M. I.: Which bias correction methods are suited to represent hydrologic extremes in the Alps?, EGU General Assembly 2024, Vienna, Austria, 14–19 Apr 2024, EGU24-6118, https://doi.org/10.5194/egusphere-egu24-6118, 2024.

EGU24-6450 | Orals | HS7.2

Rainfall downscaling using stochastic generators and machine learning 

Manuel del Jesus, Javier Diez-Sierra, and Salvador Navas

Daily rainfall records are the most common form of rainfall information. These records are the ones normally used to characterize the extremes of rainfall. However, in many situations, sub-daily information is required, normally to characterize the extreme response of small watersheds. Different methods exist to extrapolate the daily information to smaller time scales -normally, hourly time scales-, which tend to be based on a limited number of finer than daily observations.

In this work, we will deal with two common downscaling problems that the hydrologist faces: transforming daily rainfall observations into estimates of sub-daily rainfall statistics and incorporating climate change information into these estimates. Although generally, these two procedures are different, both conceptually and mechanically, we will combine stochastic generators and machine learning to create a unified framework where both problems are connected and solved in a similar manner.

We will use NEOPRENE (Diez-Sierra et al., 2023), a Python-based open source library that implement the Nyeman-Scott, or Cox and Isham, stochastic model of rainfall (Cox & Isham, 1988) to characterize the rainfall process, and random forests to relate daily and hourly rainfall statistics (del Jesus & Diez-Sierra, 2023). The model assumes a geometric description of the rainfall process, that allows to decompose observed time series and reproduce several statistics at different levels of aggregation.

We will also demonstrate how downscaling can be carried out to generate plausible hourly rainfall distributions from daily ones, and how this process serves to characterize the uncertainties of the estimates.

Cox, D. R. & Isham, V., 1988. A Simple Spatial-Temporal Model of Rainfall. Proceedings of the royal society a: Mathematical, physical and engineering sciences, 415 ​(1849), 317–328.

Diez-Sierra, J., Navas, S. & Jesus, M. del., 2023. NEOPRENE v1.0.1: A Python library for generating spatial rainfall based on the NeymanScott process. Geoscientific model development, 16 (17), 5035–5048.

Jesus, M. del & Diez-Sierra, J., 2023. Climate change effects on sub-daily precipitation in Spain. Hydrological sciences journal, 68 (8), 1065–1077.

How to cite: del Jesus, M., Diez-Sierra, J., and Navas, S.: Rainfall downscaling using stochastic generators and machine learning, EGU General Assembly 2024, Vienna, Austria, 14–19 Apr 2024, EGU24-6450, https://doi.org/10.5194/egusphere-egu24-6450, 2024.

How can climate model simulations for the future generate high-resolution sub-daily precipitation that could be trusted for a range of hydrologic design applications? This is a question that often provokes contradicting responses from climate scientists and hydrologists. Our study attempts to unify the knowledge gained from these two disciplines to present the first ever alternative for generating multi-scale (low-to-high frequency temporal persistence), high resolution (down to 1km if needed), sub-daily precipitation for future climates that is dynamically consistent with concurrent climate forcings (including atmospheric moisture, circulation patterns) and local topography. This dynamical precipitation generator contains three components. The first component is the raw temporal resolution climate field simulated using global climate models on the lower and the lateral boundaries of the spatial domain precipitation simulations are needed for. The second component is SDMBC, an innovative alternative for correcting systematic biases at Sub-Daily (SD) time steps, using the Multivariate Bias Correction (MBC) approach which corrects multivariate dependence, persistence and distributional attributes across variables that form the lateral and lower boundaries of the domain of interest. The third and final component is a Regional Climate Model (RCM), chosen to be the Weather Research and Forecasting (WRF) model for the present study, which uses the corrected lateral and lower boundary forcings generated from the second component of our framework, and generates dynamically consistent sub-daily precipitation along with other physically consistent atmospheric variables at high-resolution. It is shown here that use of this framework simulates precipitation fields that exhibit features consistent with observations including observed extremes, and storm events that are consistent with our expectations of how precipitation extremes will evolve in future (warmer) climates. A Python software (named SDMBC) that simplifies the implementation of the bias correction process is presented, and results are shown for simulations across the Australian domain. This software is now available from (https://pypi.org/project/sdmbc/) and can be used for applications over any domain worldwide in conjunction with WRF models that have been formulated independently.

How to cite: Sharma, A., Kim, Y., and Evans, J.: A dynamical alternative for simulating multi-scale high-resolution sub-daily space-time precipitation for future climates, EGU General Assembly 2024, Vienna, Austria, 14–19 Apr 2024, EGU24-7076, https://doi.org/10.5194/egusphere-egu24-7076, 2024.

EGU24-7125 | ECS | Posters on site | HS7.2

Simulation of Record-Breaking Precipitation Events Using an Advanced Stochastic Weather Generator 

Mengzhu Chen, Xiaogang He, and Simone Fatichi

Over the past few decades, increased record-breaking precipitation events have occurred in many places worldwide, leading to devastating flood disasters. Conventional design criteria for hydraulic infrastructure and flood mitigation projects are generally dependent on the analysis of historically observed data to inform projections of future conditions through fitting a probability distribution. Beyond the conventional stationarity assumption, it is also assumed that the past observed extreme data can approximate well the entire statistical distribution of future events of extreme precipitation. However, conventional methods solely relying on an extreme value analysis have been shown to fail to capture record-breaking precipitation extremes, potentially underestimating the risk of failure of hydraulic structures and flood prevention measures. This study leverages on the capability of a stochastic weather generator (AWE-GEN) to simulate record-breaking precipitation events at a point-scale by reproducing an ensemble of hourly synthetic precipitation time series that accounts for the intrinsic variability of the rainfall process. Compared with conventional extreme value analysis methodologies, the approach is capable of reproducing internal climate variability well and often reproduces extreme values of precipitation, which have not been recorded in the data yet. This study showcases the relevance of stochastic rainfall generators for estimating precipitation extremes for hydrological design under an uncertain climate. 

How to cite: Chen, M., He, X., and Fatichi, S.: Simulation of Record-Breaking Precipitation Events Using an Advanced Stochastic Weather Generator, EGU General Assembly 2024, Vienna, Austria, 14–19 Apr 2024, EGU24-7125, https://doi.org/10.5194/egusphere-egu24-7125, 2024.

EGU24-7137 | ECS | Orals | HS7.2

Non-stationary geostatistical modeling of daily rainfall over complex topography 

Lionel Benoit, Matthew Lucas, Denis Allard, and Thomas Giambelluca

In mountains, topography-atmosphere interactions generate orographic effects which make windward slopes usually wetter than leeward ones, and highlands wetter than lowlands. The transitions between wet and dry areas can occur within few kilometers, which creates strong horizontal gradients of rainfall statistics such as frequency of occurrence, daily mean accumulation, or extreme intensities. This spatial variability of rainfall statistics breaks the hypothesis of stationarity on which rely most geostatistical models that are used for the spatial analysis of rainfall data. Using stationary models to process non-stationary data can lead to a degraded performance in spatial prediction (e.g., mapping rainfall by interpolation of sparse rain gauge observations) and to unrealistic rainfall features in simulations (e.g., emulation of synthetic rain fields using a stochastic rainfall generator). 
 
To overcome these limitations, we present in this work a fully non-stationary trans-Gaussian geostatistical model dedicated to the spatial analysis of daily rainfall over complex topography. This model allows not only for a non-stationary marginal distribution of daily rainfall accounting for rainfall intermittency and non-Gaussian intensity, but also for a non-stationary covariance structure of Matérn type that models the spatial dependencies.

The model is tested for the Island of Hawai‘i (State of Hawaii, USA) where rainfall gradients are amongst the strongest on Earth and can reach 1000 mm.year-1/km. To make our model operable in practice, we designed a procedure to infer model parameters from rain gauge observations that are freely available in near-real-time on the Hawai‘i Climate Data Portal. Model assessment demonstrates good skills at reproducing the spatial variability of daily rainfall occurrence, intensity distribution and spatial dependencies.

How to cite: Benoit, L., Lucas, M., Allard, D., and Giambelluca, T.: Non-stationary geostatistical modeling of daily rainfall over complex topography, EGU General Assembly 2024, Vienna, Austria, 14–19 Apr 2024, EGU24-7137, https://doi.org/10.5194/egusphere-egu24-7137, 2024.

EGU24-10004 | ECS | Orals | HS7.2

Non-stationary frequency analysis of extreme precipitation over Italy using projections from a Convection Permitting Model 

Marco Lompi, Francesco Marra, Elenora Dallan, Roberto Deidda, Enrica Caporali, and Marco Borga

Climate change is changing the intensity and frequency of extreme precipitation. Understanding the impact of climate change on extreme precipitation quantiles is fundamental for managing flood risk and taking adaptation measures. Convection-Permitting Models (CPM), run at spatial resolutions for which deep convection is resolved (≤ 4 km), have been demonstrated to be more accurate than Regional Climate Models (RCM, ~10 km resolution) in describing the intensity of extremely short-duration events.

This study uses the projections of a CPM to evaluate quantiles of precipitation extremes at the national scale (Italy) with a high spatiotemporal resolution. Indeed, VHR-PRO_IT, a recent downscale product of the CMCC model at a convection-permitting scale of 2.2 km, with 1h temporal resolution, is used as a dataset. So far, this is the only CPM projection that covers the entire Italy in both emission scenarios (RCP 4.5 and RCP 8.5) and for a temporal coverage of 90 years (1981-2070).

A non-stationary implementation of the Simplified Metastatistical Extreme Value (SMEV) non-asymptotic approach is used to evaluate continuous changes in precipitation quantiles for different durations (1h, 3h, 6h, 12h and 24h) over the period 1981-2070 (1981-2005 historical + 2006-2070 emission scenarios). We adopt a two-parameter Weibull distribution to model the marginal distribution of the ordinary precipitation events. Three different models are compared: i) a stationary SMEV, with the two parameters constant over the entire time series; ii) a non-stationary model in which the higher-order parameter is kept constant; iii) a fully non-stationary model in which both parameters are allowed to change linearly in time.

The results show a clear geographical organization of the projected changes, with both increases and decreases in precipitation quantiles depending on the zone, the emission scenario, the precipitation duration and the return period of interest. The non-asymptotic approach allows us to discuss the results in terms of dynamic and thermodynamic drivers.


The research is carried out within the RETURN – multi-Risk sciEnce for resilienT comUnities undeR a changiNg climate Extended Partnership and received funding from the  European Union Next-GenerationEU (National Recovery and Resilience Plan – NRRP, Mission 4, Component 2, Investment 1.3 – D.D. 1243 2/8/2022, PE0000005).

How to cite: Lompi, M., Marra, F., Dallan, E., Deidda, R., Caporali, E., and Borga, M.: Non-stationary frequency analysis of extreme precipitation over Italy using projections from a Convection Permitting Model, EGU General Assembly 2024, Vienna, Austria, 14–19 Apr 2024, EGU24-10004, https://doi.org/10.5194/egusphere-egu24-10004, 2024.

EGU24-10291 | ECS | Orals | HS7.2

Hourly Precipitation Prediction: Integrating Long Short-Term Memory (LSTM) Neural Networks with Granger Causality 

Rahul Sreedhar, Akshay Sunil, and Raghu L Murthy

Precipitation events are one of the most crucial processes governing the water cycle and therefore acts as a major input in majority of water resource studies. Furthermore, the modern era is witnessing an unprecedented increase in the frequency of extreme events highlighting the importance of understanding and predicting the precipitation events. Current precipitation prediction methods utilise complex physics-based models that require large number of input parameters as well as powerful computational facilities, making precipitation prediction a complex task. This scenario has not improved much over the years as advancements are often limited to either improving the model’s physics or input data quality. Hourly precipitation prediction is even more challenging due to increasing complexity and non-linearity with decreasing scale and therefore studies on understanding hourly precipitation is limited. Recent trends have shown a shift towards utilizing deep learning models in weather prediction owing to the ability of neural networks to capture complex patterns leading to high accuracy predictions. The current research introduces a Long Short Term Memory (LSTM) neural network adept at forecasting fine-scale hourly precipitation patterns up to two hours ahead, a critical development for real-time rain predictions. The Bi-LSTM's architecture, with its forward and backward processing capabilities, is particularly suited to capture the dynamic temporal relationships among the limited meteorological variables helping in effective precipitation prediction. Granger Causality analysis is done to capture relevant information for improving model performance. The model's performance is evaluated on its ability to accurately forecast weather conditions by learning from the historical inter-variable influences that were clearly detailed in the causality diagram. The findings from this study and the interlinks observed is expected to enhance our understanding of variable impact and improve the predictive power of precipitation models for future weather forecasting

How to cite: Sreedhar, R., Sunil, A., and L Murthy, R.: Hourly Precipitation Prediction: Integrating Long Short-Term Memory (LSTM) Neural Networks with Granger Causality, EGU General Assembly 2024, Vienna, Austria, 14–19 Apr 2024, EGU24-10291, https://doi.org/10.5194/egusphere-egu24-10291, 2024.

The accurate estimation of precipitation (P) at a high spatio-temporal resolution is vital in various applications such as climatic modelling, water resources management, drought and flood assessment, and climate change adaptation, among others. However, an adequate representation of P products in space and time remains challenging, particularly over regions with sparse or non-existent gauge-reference observations. Jordan, ranked among the top four driest countries in the world, urgently requires reliable P in good spatio-temporal resolutions to enable decision-makers and researchers to manage water resources effectively. In this study, seven state-of-the-art P products (MSWEPv2.8, ERA5, CHIRPSv2, CMORPHv1, PERSIANN-CDR, IMERG-FR, and ERA5 LAND) were evaluated against 124 gauge stations over the region using point-to-pixel evaluation at daily, monthly, annual, and seasonal temporal scales. Kling-Gupta efficiency as a continuous index with its three components (temporal dynamic r, bias ratio β, and variability ratio) was used to identify the systematic errors and uncertainties of the P products. Additionally, four categorical indices (probability of detection (POD), frequency bias (fbias), false alarm ratio (FAR) and the Critical success index (CSI) were used to assess the ability of the P products to capture different P intensities. The best performing daily scale P products were then resampled to a finer resolution of 0.05° (5 km) and merged with the gauge station observations to improve the representation of P over the region using two distinct approaches: i) machine learning approach, the Random Forest based MErging Procedure (RF-MEP), and ii) geostatistical approach, Kriging with External Drift (KED). We applied RF-MEP and KED over Jordan for the period 2001 - 2017 with a focus on its arid and climatic conditions; thus, we also applied the models to each climatic zone using daily observations of 80% of the gauge stations as a training dataset, and 20% were used for the verification of the merged P products. The results revealed that MSWEPv2.8 emerged as the top-performing P product. For this reason, and already being a merged dataset, MSWEPv2.8 was used as a benchmark in evaluating the merged products. For RF-MEP, The remaining datasets, excluding ERA5-LAMD and IMERGE-FR due to their poor performance, were merged with gauge observations, while KED was merged with the second-top performance product, ERA5. Both merged products demonstrated significant improvements in P patterns, linear correlation, bias, and variability at different temporal scales and in capturing different precipitation intensities. RF-MEP showed superior performance across Jordan compared to KED. However, KED outperformed RF-MEP in elevated terrains. Subsequently, a practical application of the newly merged P products was tested through simple drought assessment, using the Standardized Precipitation Index (SPI) specifically, SPI-12. The outcomes demonstrated that RF-MEP showed promising results in the detection of extreme long-term dry spells, highlighting its ability for practical application in drought assessment.

Keywords: Precipitation; Gridded Precipitation products; Point to pixel evaluation; KGE; Categorical indices; Merging; RF-MEP; KED; SPI; Jordan

How to cite: Al-Saeedi, B. A., M. Baez-Villanueva, O., and Ribbe, L.: An optimized representation of precipitation in Jordan: Merging gridded precipitation products and ground-based measurements using machine learning and geostatistical approaches, EGU General Assembly 2024, Vienna, Austria, 14–19 Apr 2024, EGU24-11510, https://doi.org/10.5194/egusphere-egu24-11510, 2024.

EGU24-12710 | Posters on site | HS7.2

Challenges and Opportunities in the Detection of Trends in Subdaily Heavy Precipitation in the United States 

Giuseppe Mascaro, Stefano Farris, and Roberto Deidda

Increasing empirical evidence has been showing that, over the last decades, the frequency of daily heavy precipitation has risen in some regions of the United States (U.S.); less evidence has instead been presented at subdaily resolutions. In this study, we describe the challenges and opportunities associated with the detection of trends in subdaily heavy P in the U.S. using Version 2 of the Hourly Precipitation Data (HPD) from the National Climatic Data Center (NCDC). This dataset comprises records from 1897 gages which we found to be affected by several issues preventing their use in trend studies, including long periods with missing observations, changes of instruments, and different signal resolutions (largely, 0.254 and 2.54 mm). Despite this, after proper checks, we were able to identify 370 gages with ≥40 years of statistically homogenous data in 1950-2010 that cover the U.S. with a good density. To improve the ability to detect trends, we designed a framework that quantifies the degree to which the observed over-threshold series above a given empirical q-quantile are consistent with stationary count time series with the same marginal distribution and serial correlation structure as the observations. We also applied the false discovery rate test to account for spatial dependence and multiplicity of the local tests. Analyses were performed for the signals aggregated at Δt = 1, 2, 3, 6, 12, and 24 h and for q = 0.95, 0.97, and 0.99, finding that most gages exhibit increasing trends across all Δt’s and that their statistical significance increases with Δt and decreases with q, but only for Δt ≥ 2 h. This might indicate that the physical generating mechanisms of precipitation have changed in a way that leads to larger accumulations over durations >1 h but similar intensities within 1 h. An alternative possible explanation for these outcomes is instead that the coarse signal resolution (2.54 mm) reduces the power of the test for trend detection as Δt decreases. Investigating these issues will be the subject of our immediate future work.

How to cite: Mascaro, G., Farris, S., and Deidda, R.: Challenges and Opportunities in the Detection of Trends in Subdaily Heavy Precipitation in the United States, EGU General Assembly 2024, Vienna, Austria, 14–19 Apr 2024, EGU24-12710, https://doi.org/10.5194/egusphere-egu24-12710, 2024.

EGU24-14385 | Orals | HS7.2

A Qualitative and Quantitative Evaluation of the WRF Model Simulations for High Resolution Urban Rainfall Forecasting  

Karthika Kusuman, Likhitha Pentakota, Nruthya Kishore, Nagaraju Gaddam, Ananthula Rishika, Pradeep P. Mujumdar, and Rajarshi Das Bhowmik

In the past decade, there has been an increment in the magnitude and frequency of severe flood events across Bangalore city due to rise in rainfall intensities, increase in urban population, and drastic changes in urban landscape. The effect of urban development in a rapidly growing city has a substantial impact on the urban environment, leading to frequent flooding during monsoon and post-monsoon. Hence, a reliable forecasting system for rainfall at an urban scale is of priority to enhance the preparedness for disaster management. In this regard, a framework is developed for Bangalore City to dynamically downscale the daily rainfall prediction from National Centers for Environmental Prediction-Global Forecast System (NCEP-GFS) to high-resolution rainfall predictions, 3 km and 1 km spatial resolutions at 15-minute interval, employing the Weather Research and Forecasting (WRF) model. The model utilizes the initial and the boundary conditions forced at 06 UTC, resulting in a 24-hour lead-time forecast. The primary objective of this study is to test the performance of high-resolution WRF forecast with respect to the observed rainfall, using qualitative and quantitative statistical skill scores for the monsoon of 2023. Rank probability score at the municipal administrative level and performance indices such as critical success index, bias score, heidke skill score, false alarm ratio, and probability of detection at grid level are used for qualitative analysis. Whereas, quantitative measures are coefficient of determination, correlation, root mean square error, mean bias, and mean absolute error at grid as well as station levels. These metrics are estimated for various rainfall events and for different lead times. The study found that, the grid level correlation coefficient values for heavy rainfall events in 2023 fall in the range of 0.6 – 0.8 for the northern part of Bangalore city for both the spatial resolutions. Overall, our findings suggest that the forecasting framework can efficiently issue rainfall prediction with a lead time of 24 hours. This forecast can be further coupled with 1D and 2D hydrological models to predict flood inundation.

How to cite: Kusuman, K., Pentakota, L., Kishore, N., Gaddam, N., Rishika, A., Mujumdar, P. P., and Bhowmik, R. D.: A Qualitative and Quantitative Evaluation of the WRF Model Simulations for High Resolution Urban Rainfall Forecasting , EGU General Assembly 2024, Vienna, Austria, 14–19 Apr 2024, EGU24-14385, https://doi.org/10.5194/egusphere-egu24-14385, 2024.

EGU24-14562 | ECS | Posters on site | HS7.2

Assessing the Evolution of Intensity – Duration – Frequency Curves over Greece: A Comparative Study between 2016 and 2023 

Athanasios V. Serafeim, Stergios Emmanouil, Anastasios Perdios, and Andreas Langousis

The development and regular revision of the Greek National Flood Risk Management Plans (FRMPs) serve as direct response to the guidelines introduced by the Floods Directive (Directive 2007/60/EC) of the European Parliament and of the Council, in order to effectively mitigate and manage potential risks related to extreme precipitation events. The current study presents a comparison between: a) the Intensity-Duration-Frequency (IDF) curves obtained in 2016 over Greece using the Koutsoyiannis et. al (1998) methodology, and b) their 2023 revised version using a more recent approach (Koutsoyiannis, 2022; Iliopoulou et al., 2022).

Through a comparative analysis of the two distinct IDF sets, we assess the inherent statistical variability of rainfall fields and its probable influence on extreme rainfall estimation. Focus is on determining both the nature and extent of potential spatiotemporal alternations, while identifying emerging trends and possible abnormalities that indicate substantial shifts in precipitation patterns, thus enhancing understanding of the evolution of flood risk over Greece.

As the IDF curves form the cornerstone of Flood Risk Management Plans, it is crucial to identify significant variations in their profiles over short periods of time. Consequently, the current work highlights the necessity for regular updates of the national Flood Risk Management Plans, in accordance with the Floods Directive guidelines, while identifying areas that exhibit substantial statistical variability. Ultimately, the obtained results will allow for the development of robust decision-making frameworks, enabling stakeholders and policymakers to develop flexible and compliant mitigation strategies against potential hydrological hazards to protect the community and infrastructural assets.

 References

Iliopoulou, T., Malamos, N. and Koutsoyiannis, D. (2022) Regional ombrian curves: design rainfall estimation for a spatially diverse rainfall regime, Hydrology, 9(5), 67, https://doi.org/10.3390/hydrology9050067.

Koutsoyiannis, D., Kozonis, D. and Manetas, A. (1998) A mathematical framework for studying rainfall intensity-duration-frequency relationships, Journal of Hydrology, 206 (1-2), pp 118-135, https://doi.org/10.1016/S0022-1694(98)00097-3.

Koutsoyiannis, D. (2022) Stochastics of Hydroclimatic Extremes - A Cool Look at Risk, 2nd Edition, ISBN: 978-618-85370-0-2, 346 pages, Kallipos Open Academic Editions, Athens, 2022, https://doi.org/10.57713/kallipos-1.

How to cite: Serafeim, A. V., Emmanouil, S., Perdios, A., and Langousis, A.: Assessing the Evolution of Intensity – Duration – Frequency Curves over Greece: A Comparative Study between 2016 and 2023, EGU General Assembly 2024, Vienna, Austria, 14–19 Apr 2024, EGU24-14562, https://doi.org/10.5194/egusphere-egu24-14562, 2024.

In the 21st century, the Mekong River Delta (MRD), in Viet Nam, is projected to experience intensified extreme precipitation events due to global warming. General Circulation Models (GCMs) offer possible future climate estimations globally that adeptly capture large-scale features of precipitation extremes under different scenario settings. However, challenges persist in replicating detailed regional flood patterns within the MRD. This study focuses on the application of CMIP6 models, including European Centre for Medium-Range Weather Forecasts Reanalysis v5—ERA5, Situ-Based Data Set of Temperature and Precipitation Extremes—HadEX3, and Rainfall Estimates on a Gridded Network—REGEN. Before it can be applied for the future flood assessment for the study area, this study compared annual maximum daily precipitation, derived from CMIP6, Climate Hazards Group InfraRed Precipitation with Station data (CHIRPS), and ground-based precipitation records, from 1978 to 2012, and identified the relationships between annual maximum daily precipitation and flooded area. Accordingly, this study projects precipitation and flooded areas for the near future (2026–2050), mid-future (2050–2075), and far future (2075-2100). The preliminary results will be presented in this meeting. In light of the persistent global warming trend, the expected rise in flooding within the MRD and variations in heavy precipitation patterns emphasize the importance of the findings in this study. These results play a crucial role in mitigating adverse effects and fortifying resilience to global warming and climate change in the MRD.

KEY WORDS: CMIP6, CHIRPS, flood, extreme precipitation, global warming.

How to cite: Ton Binh, M. and Chiang, S.-H.: Examining the application of CMIP6 General Circulation Models in regional flood projections for the Mekong River Delta, Viet Nam, EGU General Assembly 2024, Vienna, Austria, 14–19 Apr 2024, EGU24-14714, https://doi.org/10.5194/egusphere-egu24-14714, 2024.

EGU24-14970 | ECS | Orals | HS7.2

Bias-corrected high-resolution temperature and precipitation projections for Canada  

Chandra Rupa Rajulapati, Hebatallah Mohamed Abdelmoaty, Sofia Nerantzaki, and Simon Michael Papalexiou

High-resolution precipitation and temperature projections are indispensable for informed decision-making, risk assessment, and planning. Here, we have developed an extensive database of high-resolution (0.1°) precipitation, maximum, and minimum temperature projections extending till 2100 at a daily scale for Canada. We employed a novel Semi-Parametric Quantile Mapping (SPQM) methodology to bias-correct the Coupled Model Intercomparison Project, Phase-6 (CMIP6) projections for four distinct Shared Socio-economic Pathways. SPQM is simple, yet robust, in reproducing the observed marginal properties, trends, and variability according to future scenarios, and maintaining a smooth transition from observations to projected simulations. The database encompasses a substantial collection of 759 simulations derived from 37 diverse climate models for precipitation. Similarly, for maximum and minimum temperature projections, our database comprises 652 simulations from 30 climate models. These meticulously curated projections carry immense value for hydrological, environmental, and ecological studies, offering a comprehensive resource for analyses within these domains. Furthermore, these projections serve as a valuable asset for the quantification of uncertainties arising from variant labels, climate models, and future scenarios.

How to cite: Rajulapati, C. R., Abdelmoaty, H. M., Nerantzaki, S., and Papalexiou, S. M.: Bias-corrected high-resolution temperature and precipitation projections for Canada , EGU General Assembly 2024, Vienna, Austria, 14–19 Apr 2024, EGU24-14970, https://doi.org/10.5194/egusphere-egu24-14970, 2024.

EGU24-15180 | Posters on site | HS7.2

Multiple-threshold informational predictability applied to rainfall intensities 

Alin Andrei Carsteanu, César Aguilar Flores, and Félix Fernández Méndez

Predictability, in its informational sense, has been defined as the expected value of the logarithm of conditional probability of the predicted variable, conditioned on its predictors (Fernández Méndez et al., SERRA 37, pp.2651–2656, 2023). While the formulation in the cited work allows for assigning a normalized predictability value between 0 and 1 for any conditional probability distribution whose essential range has finite cardinality, the application therein only deals with Bernoulli-type distributions (i.e., 2 feasible states, in the case of rainfall, rain / no rain). The present study extends the scope of the application of informational predictability to multiply-thresholded rainfall intensity time series, and analyses the resulting conclusions.

How to cite: Carsteanu, A. A., Aguilar Flores, C., and Fernández Méndez, F.: Multiple-threshold informational predictability applied to rainfall intensities, EGU General Assembly 2024, Vienna, Austria, 14–19 Apr 2024, EGU24-15180, https://doi.org/10.5194/egusphere-egu24-15180, 2024.

EGU24-15507 | ECS | Posters on site | HS7.2

Stochastic temporal downscaling in Northeast Italy using convection-permitting climate models: from hourly to sub-hourly timescales 

Maria Francesca Caruso, Eleonora Dallan, Giorgia Fosser, Marco Borga, and Marco Marani

The statistical properties of rainfall at short durations are pivotal for many hydrological applications. Commonly available rainfall records nor km-scale model, i.e. Convection-Permitting Models (CPMs), do not provide rainfall data at the sub-hourly scales needed for many applications, such as hydrological modelling in small or urban catchments or landslide or debris-flow models. Motivated by the above considerations, in this application a statistical downscaling technique is proposed for inferring the rainfall correlation structure at sub-hourly scale by using hourly statistics from CPM simulations. The proposed approach is based on the theory of stochastic processes, which establishes statistical relationships between coarse-scale predictors and fine-scale predictands. To validate the temporally downscaled results against observations, here we use, as a benchmark, high-resolution rainfall records from a dense network of rain gauges in northeastern Italy considering aggregation timescales ranging from 5 minutes to 24 hours. We then explore how the downscaling method developed here, coupled with the Complete Stochastic Modelling Solution (CoSMoS; Papalexiou, 2018) framework, may be used to generate sub-hourly rainfall sequences that reproduce the observed short- and long-timescale variability. Applied to statistics for each month in a year, to reproduce seasonality, the proposed downscaling method appropriately reproduces the observed correlation structure at desired fine-scale resolution. Consequently, the rainfall generator used here, by exploiting the downscaled information from CPM runs, allows to generate rainfall records at the desired scale that may be used for evaluating risk and risk change scenarios, for example associated with debris flows.

How to cite: Caruso, M. F., Dallan, E., Fosser, G., Borga, M., and Marani, M.: Stochastic temporal downscaling in Northeast Italy using convection-permitting climate models: from hourly to sub-hourly timescales, EGU General Assembly 2024, Vienna, Austria, 14–19 Apr 2024, EGU24-15507, https://doi.org/10.5194/egusphere-egu24-15507, 2024.

EGU24-15880 | Orals | HS7.2

High-resolution design rainfall estimation from climate model data 

Hannes Müller-Thomy, Niklas Ebers, and Kai Schröter

For urban hydrology, rainfall time series and especially design values with high temporal resolution are crucial. Since most climate scenarios offer daily resolution only, statistical downscaling in time seems a promising and computational effective solution. In the presented method, rainfall is first disaggregated to continuous 5min time series, and subsequently design values are derived from these time series.

The micro-canonical cascade model (MRC) is chosen as downscaling method since it conserves the daily rainfall amounts exactly, so the resulting 5 min time series are coherent with the daily time series used as starting point. Rainfall extreme values are often linked to temperature (especially convective events, which are crucial for e.g. urban hydrology or insurance companies). Therefore, a temperature-dependent MRC is introduced in this study. Temperature-dependency is tested for minimum temperature, mean temperature and maximum temperature, which all allow a physical interpretation of rainfall extreme values and provide deeper insights into their future changes.

For this study 45 locations across Germany are selected. To ensure spatial coherence with the climate model data (~∆l=5 km*5 km), the YW dataset (radar-gauge-merged data) from the German Weather Service (DWD) with originally ∆l=1km*1 km and ∆t=5 min was aggregated in space and used for the estimation of the MRC parameters. The DWD core ensemble with six combinations of global and regional climate models is applied for the climate change analysis, for both, RCP4.5 and RCP8.5 scenario.

For the temperature-dependency, class widths of 5 K are chosen to include a representative number of time steps in each class. No significant influence on continuous rainfall characteristics as wet spell amount, average intensity, wet and dry spell duration can be identified. To analyze the impact on rainfall extreme values peak-over-threshold series and 99.9 %-quantile q99.9 are studied. While the reference model without temperature-dependency leads to higher overestimations for ∆t=5 min for ϑ<13 °C and underestimations for ϑ>18 °C, the temperature-dependency reduces the deviations over the whole range to a median overestimation of 1 mm/5 min (range of observations: 4 mm/5 min<q99.9<6 mm/5 min). For peak-over-threshold, the overestimation of rainfall extreme values is reduced significantly by the introduction of the temperature-dependency.

Climate model data are disaggregated using both, MRC without and with temperature-dependent parameters. The rainfall extreme values are analyzed regarding their relative changes from the control period (1971-2000) to near-term (2021-2050) and long-term future (2071-2100). While extreme values from disaggregated time series without temperature-dependency indicate an increase of ‘only’ 12 % for the long-term future, the consideration of temperature shows an increase of 21 % (for duration D=1 h and return period T=2 yrs). Thus, neglecting the temperature impact leads to an underestimation of future rainfall extreme values.

How to cite: Müller-Thomy, H., Ebers, N., and Schröter, K.: High-resolution design rainfall estimation from climate model data, EGU General Assembly 2024, Vienna, Austria, 14–19 Apr 2024, EGU24-15880, https://doi.org/10.5194/egusphere-egu24-15880, 2024.

EGU24-16545 | Posters on site | HS7.2

A comparison of classification methods to perform a typology of precipitation events for soil erosion modelling 

Nur Banu Özcelik, Johannes Laimighofer, Stefan Strohmeier, Cristina Vásquez, Andreas Klik, Peter Strauss, Georg Pistotnik, Shuiqing Yin, Tomas Dostal, and Gregor Laaha

Soil erosion is a major threat to soil resources. Our ACRP-supported project EROS-A aims to improve erosion modelling by investigating the role of extreme precipitation and associated erosivity on soil erosion in the Main Agricultural Production Zones (MAPZ) of Austria. For this purpose, it is important to separate precipitation events into different process types (e.g. convective and stratiform events), as these are expected to follow different distributions and can be modelled more accurately using a mixture model approach.

In this contribution, we assess the performance of different clustering methods to establish a process typology of precipitation events. The study uses high-resolution rainfall data with a time resolution of 5 minutes from 27 stations in the agricultural area of Austria. Hourly lightning data (ALDIS) is used as a conditional variable, as thunderstorms are a good indicator of convective events. In our approach, a precipitation event is defined as time spell when precipitation exceeds 0.1 mm per 5 minutes. Similar to a drought analysis, this can result in short, interdependent events. These are pooled using a minimum precipitation of 1.27 mm in 6 hours as an interevent time and volume criterium. The temporal characteristics of rainfall events are characterized by five indices: the amount (aggregated event precipitation), duration (the time between the start and end of the event), intensity (amount divided by duration), peak intensity (the maximum 5-min intensity), and the time-to-peak (relative to the duration of the event). These characteristics are typically dominated by small (positive) values and are thus assumed to follow a Gamma distribution. In addition, the binary lightning index was considered as this is expected to have discriminative power as well.

Based on the rainfall events so obtained, cluster analysis is performed using partitioning around medoids (PAM) with Gower metric transformed lightning index. For comparison, model-based cluster analysis for mixtures of multivariate Gamma distributions is conducted. The results are compared using the discriminative power of principal component analysis (PCA) and measures of cluster homogeneity and discriminability.  In a final evaluation, the discriminative power of the event classification is assessed in terms of event type distributions. Initial results indicate that the event indices contain a wealth of information that can be profitably used to establish a typology of precipitation events. The results will feed into future studies to perform rainfall simulations that can serve as an input for erosion scenario modeling for agricultural decision support.

How to cite: Özcelik, N. B., Laimighofer, J., Strohmeier, S., Vásquez, C., Klik, A., Strauss, P., Pistotnik, G., Yin, S., Dostal, T., and Laaha, G.: A comparison of classification methods to perform a typology of precipitation events for soil erosion modelling, EGU General Assembly 2024, Vienna, Austria, 14–19 Apr 2024, EGU24-16545, https://doi.org/10.5194/egusphere-egu24-16545, 2024.

EGU24-17189 | ECS | Posters on site | HS7.2

A Matter of Scale: Thermodynamic and Large-Scale Constraints in Extreme Rainfall Under a Changing Climate 

Santa Andria, Marco Borga, and Marco Marani

Changes in the hydrological cycle and, in particular, in rainfall extreme events induced by global warming are expected to pose significantly increased hazards in the coming decades. However, changes in the probability of occurrence of intense precipitation remain poorly understood even in observations. Here we investigate the thermodynamic and large-scale constraints to the generation of extreme rainfall at both hourly and daily scales. To this aim, we address some of the ambiguities intrinsic to the traditional definition of the dependence of extreme rainfall on temperature as mediated by the Clausius-Clapeyron (CC) relation. For this purpose, we use a non-asymptotic extreme value distribution (Marani and Ignaccolo, 2015) as a basis for our analysis. In this framework, the distribution of extremes emerges from the distribution of the ordinary events, here allowed to vary under climate change. The distribution of annual maxima is expressed as a function of the probability distribution of all events (that may be inferred using most of the available data, rather than just on yearly maxima) and of the number of event occurrences per year. The rationale here is that a warming of the atmosphere will affect the distribution of all rainfall events, i.e. the shape of the ordinary event distribution, rather than just rainfall extremes as in traditional CC arguments. Based on this approach, we then analyze the relation between the parameters of the probability distribution of ordinary precipitation events and temperature at the daily and hourly scales, using observational data in Padova, Italy (where almost 300 years of observations are available) and multiple stations in the continental US.

While local temperature is widely considered to be a major driver of change in rainfall regimes, changes in large-scale circulation are also expected to play a significant role in shaping future rainfall regimes. In order to represent the effects of large-scale circulation, and analyze changes that remain unexplained by local temperature, we compute here the Vertically Integrated Moisture Convergence, derived from the ECMWF Reanalysis v5 (ERA5) dataset.

Our results indicate that hourly precipitation is mainly controlled by thermodynamics, with the scale parameter of the probability distribution of hourly precipitation intensity showing a CC dependence. Conversely, at the daily scale, we show that precipitation variability is not explained by temperature changes but is rather driven by other factors such as large-scale circulation. These results support the need for an integrated approach, which quantitatively accounts for both local thermodynamics and large-scale circulation to estimate future changes in daily precipitation extremes under a climate change.

How to cite: Andria, S., Borga, M., and Marani, M.: A Matter of Scale: Thermodynamic and Large-Scale Constraints in Extreme Rainfall Under a Changing Climate, EGU General Assembly 2024, Vienna, Austria, 14–19 Apr 2024, EGU24-17189, https://doi.org/10.5194/egusphere-egu24-17189, 2024.

EGU24-17329 | ECS | Orals | HS7.2

A regionalized framework for the Metastatistical Extreme Value Distribution applied to daily and sub-daily rainfall 

Pietro Devò, Maria Francesca Caruso, Marco Borga, and Marco Marani

The estimation of extreme rainfall based on short records is of considerable interest, above all in the context of rapidly changing rainfall regimes. Regionalization techniques, by trading space for time, allow us to partially overcome the lack of long observational records. The recently introduced Metastatistical Extreme Value Distribution (MEVD), a non-asymptotic extreme-value model, accounting for all observed rainfall events to infer the probability distribution of annual maxima, also contributed towards improving our ability to determine large quantiles based on short observational time series. Here we combine established regionalization techniques, aggregating data from multiple adjacent stations complying with set homogeneity criteria, with MEVD-based methodologies to explore how their joint use may further reduce the predictive uncertainty associated with the estimates of the probability of large events. In this work, we use precipitation data sets from a selection of worldwide regional station networks (Europe, USA, Middle East, and Asia) deployed in a wide range of elevations and different rainfall regimes. The temporal data resolution varies according to country ranging from sub-daily to daily scales. We analyze different event durations, between 5 minutes and 24 hours for the sub-daily scale, 1 day and 2 days for the daily one, and we implement a cross-validation procedure to evaluate predictive uncertainty. To evaluate possible improvements with respect to regionalization techniques based on traditional extreme value theory, such as the Generalized Extreme Value (GEV) distribution, we comparatively apply them and the proposed MEVD-based regionalization approach. The results show the benefits arising from the regionalization technique, which enhances the robustness of the models by increasing the consistency of the observed data population within the stations of the same cluster, particularly in the lowlands, where homogeneous regions can be more trivially identified. The proposed regionalization approach based on the metastatistic distribution brings a significant reduction of the estimation uncertainty for very high ratios between the forecasting return period value and the length of the calibration sample when compared to traditional methods.


How to cite: Devò, P., Caruso, M. F., Borga, M., and Marani, M.: A regionalized framework for the Metastatistical Extreme Value Distribution applied to daily and sub-daily rainfall, EGU General Assembly 2024, Vienna, Austria, 14–19 Apr 2024, EGU24-17329, https://doi.org/10.5194/egusphere-egu24-17329, 2024.

EGU24-17831 | Posters on site | HS7.2

Exploring changes in rainfall seasonality over the last 100 years across three regions of southern Italy: Campania, Sardinia, and Sicily 

Matteo Ippolito, Marcella Cannarozzo, Nunzio Romano, Paolo Nasta, Roberto Deidda, and Dario Pumo

Global warming may induce significant alterations to the rainfall regimes, especially in the Mediterranean basin, which can be considered as a hot-spot for climate change. Several previous studies focused on the variations in annual rainfall and extreme values, while rainfall seasonal variations were less explored. Rainfall seasonality is a critical climate factor affecting the evolution of natural vegetation, water resource availability, and water security. Rainfall seasonality anomalies may have a high impact, especially in areas of the Mediterranean basin where water supplied during the wet season is used to offset rainfall shortages in the dry season. In southern Italy, the occurrence of long water deficit periods and extremely concentrated rainy seasons could limit water uses and cause serious effects on crop yield and, consequently, on food production.

This study aims at exploring potential variations in rainfall seasonality over the last 100 years across three regions of southern Italy (Campania, Sardinia, and Sicily) through a dynamic approach proposed by Feng et al. (2013). The study area is characterized by a Mediterranean climate, where the hydrological year consists of a net alternation of two seasons: a cold-rainy period (wet season), usually including fall-winter months, and a hot-dry period (dry season), typically including spring-summer months. The analysis proposed involves the determination of time-variant values of rainfall magnitude and frequency of the two seasons (wet and dry).

Daily rainfall values, recorded between 1916 and 2023, are gathered from hundreds of rain gauge stations distributed over the three regions. A pre-processing procedure was applied for data quality check, data reconstruction in years with less than 80% of missing data, and rain gauge selection; then, only rain gauge datasets with adequate data availability (i.e., more than 70 complete years, with at least 15 years in the last two decades, 15 years in the pre-World War II period, and without significant data interruptions) were retained and used for data analyses. Rainfall depth over each season is idealized as an exponentially distributed independent random variable with mean values h (mm), whereas the seasonal rainfall occurrence is modelled as a Poisson process with rate l (d-1). Rainfall seasonality at each rain gauge was defined annually, considering different indices: the Dimensionless Seasonality Index (DSI); the seasonal rainfall depth and the seasonal values of h and l; the wet season timing (i.e., centroid of the season) and duration. The reference period was divided into different equal-size and non-overlapping subperiods.

Differences in the various rainfall seasonality indices and their distributions among the various gauges, regions, and subperiods were analyzed, also investigating the influence of some climatic and topographic factors (i.e., temperature, gauge distance from the sea and elevation). A trend analysis based on Mann-Kendall's and Sen's Slope Method with statistical significance at 95% level of confidence, was also carried out considering a limited subset of gauges with the largest data availability for each region.

How to cite: Ippolito, M., Cannarozzo, M., Romano, N., Nasta, P., Deidda, R., and Pumo, D.: Exploring changes in rainfall seasonality over the last 100 years across three regions of southern Italy: Campania, Sardinia, and Sicily, EGU General Assembly 2024, Vienna, Austria, 14–19 Apr 2024, EGU24-17831, https://doi.org/10.5194/egusphere-egu24-17831, 2024.

EGU24-17859 | ECS | Posters on site | HS7.2

Improving estimation of spatial precipitation in mountain regions 

Keith Shotton, Liz Lewis, David Pritchard, Nick Rutter, and Stephen Blenkinsop

Around 22% of the global population depend on mountain runoff for their water supply. Due to its importance for future water resources, as well as flood and drought planning, an improved understanding of spatial precipitation patterns in mountain regions is needed. Precipitation gauge networks are sparse and traditional methods of interpolation yield inadequate precipitation fields for poorly gauged mountain catchments.

This research project builds on a new method, Random Mixing, to generate multiple random spatial daily precipitation fields, conditioned on gauge observations. The Random Mixing algorithm has so far been tested on larger, densely gauged catchments. This project adapts the approach for a sparsely gauged, small 9.1 km2 mountain catchment, Marmot Creek Research Basin in Alberta, Canada, where elevations range between 1600 m and 2825 m above sea level (a.s.l.). Quality-controlled total precipitation (i.e., rainfall and snowfall) gauge observations, for an 11-year period, from three weather stations around the catchment have been used to condition the random spatial fields.

Three modifications have been made to the Random Mixing method: improving spatial covariance, introducing elevation dependence and evaluating seasonal effects. Leave-one-out cross-validation is used, comparing spatial fields from the new method with other spatial interpolation techniques, including Inverse Distance Weighting and Kriging with External Drift. Results are promising: even with very few gauges, improving the way that spatial covariance relationships between gauge locations are represented in the model has enhanced the quality of the spatial fields.

To optimise selection of the most plausible fields, ensemble hydrological simulations are run, using a modified version of the HBV spatially-distributed conceptual model, and the physically-based Cold Regions Hydrological Model (CRHM), with spatial precipitation fields generated on a 50 m2 regular model grid. Optimisation involves the use of metrics, primarily Nash-Sutcliffe Efficiency (NSE) and bias, to identify the fields that result in the best match between observed and simulated streamflows. Outputs from HBV and CRHM ensemble simulations are compared to evaluate the impact of model structure on catchment response and spatial precipitation field optimisation.

How to cite: Shotton, K., Lewis, L., Pritchard, D., Rutter, N., and Blenkinsop, S.: Improving estimation of spatial precipitation in mountain regions, EGU General Assembly 2024, Vienna, Austria, 14–19 Apr 2024, EGU24-17859, https://doi.org/10.5194/egusphere-egu24-17859, 2024.

EGU24-18456 | Posters on site | HS7.2

Evaluation of Various Machine Learning Algorithms for Bias Correction of Satellite-based Precipitation Estimates over Complex Topography 

Koray K. Yilmaz, Gökhan Sevinç, Çağdaş Sağır, Orhan Karaman, M. Tugrul Yilmaz, and Ismail Yucel

Reliable precipitation estimates are crucial for any hydrologic study. Representation of high spatio-temporal variability in precipitation using rain gauges is challenging over complex terrain. Geographical variability of Türkiye, such as orography, land–sea distribution and the high Anatolian peninsula strongly controls the climate and results in highly variable climate regimes. The objective of this study is the evaluation of tree-based machine learning algorithms (Random Forest & XGBoost) for bias correction of IMERGLate precipitation estimates over complex topography and climatic regimes. We utilized SHAP values to improve the transparency and the interpretability of machine learning models, thus to better understand the factors controlling the bias correction models. 301 quality-controlled rain gauges (244 for training and 57 for testing) were used, covering a 600 km wide North-South region from the Black Sea coast to the Mediterranean coast. The selected explanatory variables consist of daily IMERG precipitation estimates and probability of liquid precipitation, climate zones, aspect, elevation, distance to coast, effective terrain height, longitude and latitude. The results showed that both Random Forest and XGBoost algorithms significantly improved precipitation estimates. While the Random Forest Model provided better correlations, the XGBoost Model performed better in correcting the precipitation distribution. Both models show high performance in error correction and have similar Kling-Gupta performance. Analysis of SHAPLEY values showed that the IMERG product, effective terrain height, distance to coast and elevation are the most important variables in the precipitation bias correction process.

How to cite: Yilmaz, K. K., Sevinç, G., Sağır, Ç., Karaman, O., Yilmaz, M. T., and Yucel, I.: Evaluation of Various Machine Learning Algorithms for Bias Correction of Satellite-based Precipitation Estimates over Complex Topography, EGU General Assembly 2024, Vienna, Austria, 14–19 Apr 2024, EGU24-18456, https://doi.org/10.5194/egusphere-egu24-18456, 2024.

EGU24-18814 | Posters on site | HS7.2

Projecting the current Depth-Duration-Frequency curves in the future climate for Sicily (Italy) 

Leonardo Valerio Noto, Dario Treppiedi, and Antonio Francipane

Rainfall depth-duration-frequency (DDF) curves serve as an essential tool for the design of hydraulic infrastructures, helping engineers and planners make informed decisions about system resilience and water management strategies. Over the past decades, several works have shown how climate change is altering the characteristics of extreme rainfall events, compromising the reliability of current DDFs for the future. Indeed, as climate evolve, the historical observation on which these curves are based may become less representative of current and future precipitation scenarios.

This is the case of Sicily, which is the largest island of the Mediterranean Sea and lies in its center. The island has been always screened for changes in the characteristics of rainfall extremes and, recently, it has been found that that especially shorter duration rainfall (i.e., hourly and sub-hourly) has intensified in the past years (Arnone et al., 2013; Treppiedi et al., 2021). This has resulted in a significant underestimation of rainfall quantiles calculated by most up-to-date regional frequency analysis, which is based on observations from 1928-2010, especially at shorter durations and low return periods (Treppiedi et al., 2023).

Starting from these results, we project the current DDFs in the future climate following what has been proposed by Martel et al. (2021). This framework is based on correcting the curves by including the expected rainfall scaling of the 24-h duration and 2-year return period rainfall with temperature and by integrating some factors that consider how the rainfall extremes are projected to change with frequency and with duration. To compute the future DDFs, we use the daily rainfall and temperature data from an ensemble of regional climate models (RCMs) in the EURO-CORDEX project. After validating the historical experiment of the RCM ensemble with observations from rain gauges, we use the future projections under the Representative Concentration Pathway 8.5. In this context, the use of daily rainfall and temperature data helps to reduce the uncertainty that models generally have in simulating short-lived phenomena, providing more accurate estimates.


Arnone, E., Pumo, D., Viola, F., Noto, L. V., and La Loggia, G. (2013). Rainfall statistics changes in Sicily, Hydrol. Earth Syst. Sci., 17, 2449–2458, https://doi.org/10.5194/hess-17-2449-2013, 2013

Martel, J. L., Brissette, F. P., Lucas-Picher, P., Troin, M., & Arsenault, R. (2021). Climate change and rainfall intensity–duration–frequency curves: Overview of science and guidelines for adaptation. Journal of Hydrologic Engineering, 26(10), 03121001.

Treppiedi, D., Cipolla, G., Francipane, A., & Noto, L. V. (2021). Detecting precipitation trend using a multiscale approach based on quantile regression over a Mediterranean area. International Journal of Climatology, 41(13), 5938–5955. https://doi.org/10.1002/joc.7161

Treppiedi D., Cipolla G., Francipane A., Cannarozzo M., Noto L.V. (2023). Investigating the Reliability of Stationary Design Rainfall in a Mediterranean Region under a Changing Climate. Water. 2023; 15(12):2245. https://doi.org/10.3390/w15122245

How to cite: Noto, L. V., Treppiedi, D., and Francipane, A.: Projecting the current Depth-Duration-Frequency curves in the future climate for Sicily (Italy), EGU General Assembly 2024, Vienna, Austria, 14–19 Apr 2024, EGU24-18814, https://doi.org/10.5194/egusphere-egu24-18814, 2024.

We introduce a new version of the gridded near real-time Multi-Source Weighted-Ensemble Precipitation (MSWEP) product, developed to address the urgent need for accurate precipitation (P) data in the face of escalating climate change challenges. The product has an hourly 0.1° resolution spanning 1979 to the present, and is continuously updated, with a latency of approximately one hour. The development process involves two stages. Firstly, baseline P fields are generated from multiple satellite and (re)analysis P products, along with several static P-related variables, using random forest models trained on 3-hourly and daily P observations from gauges across the globe (n=17,322). Subsequently, these baseline P fields are locally corrected using available daily P observations, employing a procedure that accounts for the reporting times of gauges. To assess the accuracy of the product, we conducted the most comprehensive global evaluation of P products to date, using daily observations from independent P gauges as a reference (n=15,184). The new P product (prior to gauge corrections) outperformed all 18 other evaluated products, attaining a mean daily Kling-Gupta Efficiency (KGE) value of 0.65. In contrast, widely used products such as CHIRP, ERA5, GSMaP, and IMERG achieved mean KGE values of 0.31, 0.57, 0.37, and 0.40, respectively. Furthermore, our P product consistently ranked first or second across various metrics, including correlation, overall bias, peak bias, wet days bias, and critical success index. Notably, the new product also outperformed several gauge-based products like CHIRPS and CPC Unified, which had mean KGE values of 0.37 and 0.54, respectively. Set for release in late 2024, we anticipate that the new product will be useful for climate research, water resource assessment, and flood management, among numerous other potential applications.

How to cite: Beck, H., Wang, X., and Alharbi, R.: Hourly 0.1° Gridded Near Real-Time Precipitation (1979–Present) via Machine Learning Fusion of Satellite, Model, and Gauge Data, EGU General Assembly 2024, Vienna, Austria, 14–19 Apr 2024, EGU24-19191, https://doi.org/10.5194/egusphere-egu24-19191, 2024.

EGU24-19280 | ECS | Posters on site | HS7.2

Statistical downscaling and bias correction for daily precipitation in the South Korea using the PRIDE model 

Jeong Sang, Maeng-Ki Kim, and Youngseok Lee

In this study, we produced grid climate data set of 1km×1km horizontal resolution in South Korea using 5 types of RCM (HadGEM3-RA, CCLM, RegCM4, WRF, GRIMs) results based on Socioeconomic Pathways (SSP) four scenarios (tier1: SSP1-2.6, SSP2-4.5, SSP3-7.0, SSP5-8.5) of the IPCC 6th report. The high-resolution future scenario data of South Korea were calculated using the PRIDE (PRism based Dynamic downscaling Error correction) model based on MK (Modified Korean)-PRISM (Parameter-elevation Regressions on Independent Slopes Model), a statistical downscaling method that can estimate grid data of horizontal high-resolution using observational station data in South Korea. And then, the QDM (Quantile Delta Mapping) method was used to correct bias due to climate change trend in high-resolution data of future period. The PRIDE model results were evaluated as realistically reflecting seasonal changes and topographical characteristics in South Korea. Furthermore, we assessed uncertainty for future climate data using the results of 5-ensemble models. As a result, in temperature, uncertainties due to internal variability and model were larger than due to scenario in the near future, and the influence of the scenario became greater as it progressed towards the end of 21st century. On the other hand, in the case of precipitation, the uncertainty according to the model over the entire future period was the largest, exceeding 60%.

How to cite: Sang, J., Kim, M.-K., and Lee, Y.: Statistical downscaling and bias correction for daily precipitation in the South Korea using the PRIDE model, EGU General Assembly 2024, Vienna, Austria, 14–19 Apr 2024, EGU24-19280, https://doi.org/10.5194/egusphere-egu24-19280, 2024.

EGU24-22418 | Posters on site | HS7.2

Spatial Variability of precipitation lapse rates incomplex topographical regions - application in France 

Valentin Dura, Anne-Catherine Favre, David Penot, and Guillaume Evin

The estimation of annual precipitation in ungauged mountainous areas where stations

are primarily situated in valleys is a crucial task in hydrology. Water Resources are very un-

certain at high altitudes due to difficult estimations of ice cover, water content in snowpacks,

and the weak instrumentation of these remote lands. Precipitation lapse rates (PLRs) are

defined as the increasing or decreasing rate of precipitation amounts with the elevation, and

play a pivotal role in this regard. However, the documentation of PLR in mountainous re-

gions remains weak even though their utilization in hydrological applications is5 important.

PLRs are often computed from rain gauge amounts, which are dependent on spatial sampling

and are not representative of high-altitude areas. The emergence and accessibility of gridded

precipitation products offer a remarkable opportunity to investigate the spatial variability

and the spatial-scale dependence of PLR in a varied and complex topography region. At the

regional scale (10,000 km2), six different rainfall products (rainfall reanalysis, satellite, radar)

are compared in their ability to reproduce the altitude dependence of the annual precipita-

tion of 1836 stations located in France. The Convection-Permitting Regional Climate Model

(CP-RCM) AROME is found to be more appropriate than radar and satellite-based products

commonly used in hydrology. The fine resolution of AROME (2.5 km) allows for a precise

assessment of the influence of the altitude on annual precipitation on 23 massifs ( 1000

km2) and 2748 small catchments ( 100 km2) through linear regressions. With AROME,

PLRs are in the majority positive (95 % in the range 0.55–13.10 %/100 m). The variabil-

ity of PLR is higher in high-altitude regions such as the French Alps, reflecting sheltering

effects. This study emphasizes the interest of conducting PLR investigation at a fine scale

to effectively assess their spatial variability and therefore reliable precipitation estimates in

mountainous areas, respecting the hydrological balance in high-altitude catchments.

How to cite: Dura, V., Favre, A.-C., Penot, D., and Evin, G.: Spatial Variability of precipitation lapse rates incomplex topographical regions - application in France, EGU General Assembly 2024, Vienna, Austria, 14–19 Apr 2024, EGU24-22418, https://doi.org/10.5194/egusphere-egu24-22418, 2024.

EGU24-391 | ECS | PICO | HS7.3

Explaining agricultural land use changes in Spain (2004 – 2021): Markets, climate and water resources. 

Gabriel Arbonès Domingo, Lucia De Stefano, and Alberto Garrido

In Spain, from 2004 to 2021, irrigation has increased by 500,000 hectares, the percentage of cultivated land with irrigation has increased from 18% in 2004 to 23% in 2021. The literature points to intensive irrigated agriculture as one of the main causes of the destruction of biodiversity, the worsening of the quality of water bodies, changes in the rural economy, among others. The study analysis the dynamics of land use changes in Spain particularly in irrigated crops, from 2004 to 2021 at provincial level. It aims to understand and promote sustainable land use transitions by identifying factors influencing farmers' decisions in altering land use and crop surfaces. To this end, several public open-access databases were used to analyse, on one hand, the land use changes at a detailed level, and on the other hand, guided by the literature to examine the factors behind the observed land use change. Findings reveal agricultural intensification trends in Spain, marked by the abandonment of less productive croplands and the intensification of highly productive lands, through the implementation of irrigation. The intensification, driven by the introduction of irrigated woody crops, mostly olives, vineyards, and almonds, predominantly occurred in the water-constrained southern region of the country. This was achieved by overcoming water limitations through increased exploitation of groundwater, and the widespread adoption of drip irrigation technology. Additionally, market trends driving increased demand for these commodities and changes in the Common Agricultural Policy (CAP) have further contributed to their expansion. We explain why some provinces intensify, via more irrigated and intensive crops, and reduce cultivated land, whereas others intensify and expand the total cultivated land. The study suggests that agricultural land change is a complex dynamic process, resulting from a combination of policy impact, market incentives, mature technologies, available resources and changing climate.

How to cite: Arbonès Domingo, G., De Stefano, L., and Garrido, A.: Explaining agricultural land use changes in Spain (2004 – 2021): Markets, climate and water resources., EGU General Assembly 2024, Vienna, Austria, 14–19 Apr 2024, EGU24-391, https://doi.org/10.5194/egusphere-egu24-391, 2024.

EGU24-697 | ECS | PICO | HS7.3 | Highlight

Rainfall accumulation as a driver of higher Leptospirosis risk in northern South America 

Alejandro Builes-Jaramillo, Clara Susana Arias-Monsalve, Juliana Valencia, Carolina Florian, and Hernán D. Salas

Rainfall accumulation during wet seasons in Northern South America can be enhanced during La Niña ENSO phases.  Leptospirosis is a zoonotic waterborne disease that affects humans, domestic animals, and wildlife associated with occupational and recreational water activities, natural disasters, and socioeconomic conditions for which rainfall plays a key role in its transmission. We analyzed the incidence of leptospirosis, and relative risk of changes on the incidence of the disease due to rainfall accumulation in Northern Colombia during the period 2007-2021. The rainfall accumulation analysis was done for 7, 14 and 21 days based on the periods of incubation of the disease, biology of transmission, and thresholds of rainfall accumulation above the mean values. We found a statistically significant association between excess rainfall and leptospirosis at different lags for cities in Northern Colombia (Barranquilla, Santa Marta, Cartagena) and the levels of accumulated rainfall exceedance associated with leptospirosis were specific for each city. Our findings give insight into the association between leptospirosis and excess accumulated rainfall and provide climate services and local health authorities with tools to act on and prevent this important zoonotic disease.

How to cite: Builes-Jaramillo, A., Arias-Monsalve, C. S., Valencia, J., Florian, C., and Salas, H. D.: Rainfall accumulation as a driver of higher Leptospirosis risk in northern South America, EGU General Assembly 2024, Vienna, Austria, 14–19 Apr 2024, EGU24-697, https://doi.org/10.5194/egusphere-egu24-697, 2024.

Environmental protection is of global interest to earth’s inhabitants with increasing concerns related to climate change. Solid wastes constitute an undeniable source of environmental degradation and a possible disaster to human health. In Jos Metropolis, a number of arable lands double as waste dumpsites and are at risk of heavy metal pollution. Shallow groundwater used for domestic purposes and plants cultivated near these dumpsites are prone to contamination and the prolonged consumption of unsafe concentrations of heavy metals through edibles and/or water may trigger numerous biochemical alterations in the human body. Subsurface geophysical investigation using 2D electrical survey and the assessment of soil and water quality has been carried out in the arable land and at close geological proximity to a solid waste dumpsite located at Utan, Jos, Plateau State, Nigeria. This study focus on delineating the lateral extent and depth of leachate migration into the subsurface from the waste dumpsite. 2D resistivity survey was carried out along three traverse (A, B and C) using Wenner–Schlumberger configuration. Qualitative interpretation of the inverse resistivity models revealed low resistivity zones of < 44 Ωm to be regions of leachate accumulation. The extent of downward migration through the vertical stratigraphic interval exceeds 15.6 m trending laterally in the eastern direction of traverse A. The analysis of heavy metal determination for water samples was aided by the use of Atomic Absorption Spectrophotometer while the soil samples were analyzed using X-ray fluorescence (XRF) analytical method. The concentrations of Pb and Ni in the analyzed water samples were above the permissible limit for drinking water and concentration of heavy metals in soil samples varies significantly. This study revealed the concentration of heavy metals in soil and water samples in close geographical proximity to the waste dumpsite and the uncontrolled disposal of waste over time poses great threat to the environment and its inhabitants. Waste management practices have to be improved upon to mitigate pollution.

How to cite: Obasuyi, F. O., Oladimeji, A. M., and Yusuf, T. A.: Investigation of the lateral extent and depth of contamination using 2D electrical resistivity and the assessment of soil and water quality in the vicinity of a Waste Dumpsite in Utan Jos, Plateau State. Nigeria., EGU General Assembly 2024, Vienna, Austria, 14–19 Apr 2024, EGU24-1287, https://doi.org/10.5194/egusphere-egu24-1287, 2024.

EGU24-2496 | PICO | HS7.3

Effect of intermittent drainage on the emission of two greenhouse gases (CO2 and CH4) from three paddies in South Korea 

Seunghun Hyun, Wonjae Hwang, Minseok Park, Youn-Joo An, Sunhee Hong, and Seung-Woo Jeong

In this field pot study, effect of irrigation practice (continuous flooding (CF) and intermittent drainage (ID) treatment) on greenhouse gas (GHGs, CO2 and CH4) emission was determined from three Korean paddies (BG, MG, and JS series), varying soil properties such as soil texture, labile carbon, and mineral types.  Emission of GHGs was evidently influenced by irrigation practices, to a different extent, depending on paddy’s redox response to flooding events.  The Eh decline upon flooding was slower in JS pot, where pore-water concentration of ferric and sulfate ions is the highest (~ up to 3-fold) among three paddies.  MG pot was 2- to 3-fold percolative than others and the Eh drop during flooding period was the smallest (remaining above -50 mV) among three pots.  By adopting ID, CH4 emission (t CO2-eq ha-1 yr-1) was reduced in a wide range by 5.6 for JS pot, 2.08 for BG pot, and 0.29 for MG pot relative to CF, whereas CO2 emissions (t CO2-eq ha-1 yr-1) was increased by 1.25 for JS pot, 1.07 for BG pot, and 0.48 for MG pot due to the enhanced carbon oxidation upon drainage.  Grain yield and aboveground biomass production from ID were no less than those from CF (p < 0.05).  Consequently, benefit of global warming potential (S GWP) by ID varied as in order of JS (37%) > BG (14%) > MG (~0 %) pots, and negligible effect observed for MG pot was due to the equivalent trade-off between CO2 and CH4. Our findings imply that that the efficacy of drainage on GHG mitigation depends on the redox response of paddies.

Keyword

Climate Change, Greenhouse gas, Paddy, Intermittent drainage


Acknowledgement

This research was in part supported by the Korea Environment Industry & Technology Institute (KEITI), funded by Korea Ministry of Environment (MOE) (No. 2022002450002 (RS-2022-KE002074)) and in part supported by Korea University Grant.

How to cite: Hyun, S., Hwang, W., Park, M., An, Y.-J., Hong, S., and Jeong, S.-W.: Effect of intermittent drainage on the emission of two greenhouse gases (CO2 and CH4) from three paddies in South Korea, EGU General Assembly 2024, Vienna, Austria, 14–19 Apr 2024, EGU24-2496, https://doi.org/10.5194/egusphere-egu24-2496, 2024.

Agricultural development in Kinmen region has long suffered from the absence of a corresponding management unit responsible for irrigation planning and infrastructure maintenance, resulting in the majority of local farmlands relying on natural rainfall for cultivation. Unfortunately, this method is highly susceptible to the impacts of climate change. To address this pressing issue, the government plans to utilize reclaimed water from domestic sources as a supplementary irrigation resource. Within this context, this study aims to devise an irrigation water allocation model to optimally harness the limited water resources.

In this study, we simulate the crop rotation of local sorghum and wheat, considering soil, crop, and historical meteorological data. We calculate the variations in crop yield under different irrigation schemes. Additionally, we use historical meteorological data from Kinmen to calculate various simulated climates, testing the benefits of this irrigation plan under more extreme weather conditions. In conclusion, guided by the simulation outcomes and considerations of factors like cost and government procurement prices, we undertake a comparative analysis of the economic benefits under various scenarios and irrigation plans. This analysis aims to pinpoint the optimal irrigation water allocation plan that can be feasibly implemented by local farmers.

For this study, we have chosen a 100-hectare demonstration area located in Jinsha Town, Kinmen, as our study area. We will utilize 750 tons of reclaimed water provided daily by the Ronghu Water Resources Recycling Center as the irrigation water source, and the government has already established six agricultural ponds in the area to store water. Following this, our study will proceed with the implementation of the irrigation water allocation plan in the designated demonstration area. Our ultimate aim is for this initiative to serve as a starting point, enabling the systematic expansion of the irrigation water allocation plan to other regions in Kinmen, thereby enhancing the overall irrigation quality.

Keywords: Irrigation Water Allocation Model; Reclaimed Water; Rotation Irrigation; Kinmen; Sorghum

How to cite: Su, Y., Yu, H.-L., and Chang, T.-J.: Agricultural Irrigation Water Allocation Planning and Economic Benefit Assessment – A Case Study of Kinmen County, EGU General Assembly 2024, Vienna, Austria, 14–19 Apr 2024, EGU24-2737, https://doi.org/10.5194/egusphere-egu24-2737, 2024.

EGU24-3235 | ECS | PICO | HS7.3

Estimating the risk of crop yield loss due to changing regional air temperatures 

Poornima Unnikrishnan, Kumaraswamy Ponnambalam, and Keith Hipel

Agricultural produce’s yield can be heavily impacted by changes in the weather patterns. With the current global warming scenario, the extremes temperature anomalies are expected to occur more frequently, posing a significant threat to the crop yields. To better plan the agricultural practices and crop rotation, it would be highly beneficial to understand the impact of temperature anomalies on crop yields. Here in this study, we investigated the impact of changing air temperature extremes on the yields of strawberries in farms in California's Central Valley. By using a copula modeling framework, the study has identified the risks of crop yield loss associated with temperature extremes. Based on this analysis, various scenarios of crop yield loss have been identified, and the likelihood of encountering those scenarios based on changes in temperature extremes has been estimated. The results of this study can be immensely helpful in planning agricultural practices and implementing appropriate measures to mitigate the risks. With air temperature forecasts readily available from various sources, nature-based solutions can be effectively implemented to combat the negative effects of temperature extremes on crop yields.

How to cite: Unnikrishnan, P., Ponnambalam, K., and Hipel, K.: Estimating the risk of crop yield loss due to changing regional air temperatures, EGU General Assembly 2024, Vienna, Austria, 14–19 Apr 2024, EGU24-3235, https://doi.org/10.5194/egusphere-egu24-3235, 2024.

Vegetation restoration such as human-induced and natural growth has seen a significant increase over the past two decades. However, this surge has raised concerns regarding its potential impact on water resources and its consequential hindrance to local social and economic development. Policymakers are particularly focused on mitigating the negative hydrological effects of vegetation restoration. Nevertheless, the implications for water yields in the context of forest management types, such as planted and natural forests, remain unclear. In this study, we explored hydrological responses to forest expansion in both planted and natural forest watersheds, utilizing evapotranspiration data synthesized from 12 data products, forest management maps, and climate datasets. Our analysis, based on the Budyko framework, revealed that water yield reduction in arid watersheds with planted forests (PFs) exceeded that in watersheds with expanding natural forests (NFs). Interestingly, vegetation restoration, whether in PFs or NFs watersheds, could even lead to an increase in water yield. Attribution analysis highlighted ecological restoration, rather than climate conditions, as the primary contributor to the observed water yield decrease. In NFs watersheds, the decrease was primarily linked to underlying characteristics, while in PFs watersheds, changes in water yield sensitivity to the land surface played a crucial role. It is noteworthy that vegetation restoration in humid zones exhibited a negligible impact on water yield. Even in NFs watersheds where water yield decreased due to tree cover expansion in drylands, natural growth emerged as a viable option to mitigate local hydrological effects in arid zones.

How to cite: Yan, Y., Liu, Z., and Jaramillo, F.: The distinct hydrological responses to vegetation restoration between planted and natural forests watersheds, EGU General Assembly 2024, Vienna, Austria, 14–19 Apr 2024, EGU24-3708, https://doi.org/10.5194/egusphere-egu24-3708, 2024.

The study focuses on assessing the impact of climate change on water balance components in the Upper Ghatprabha River Basin in India. The Soil Water Assessment Tool (SWAT) is utilized to simulate streamflow in the basin. Calibration and validation of SWAT are performed across multiple sites using the Sequential Uncertainty Fitting Algorithm (SUFI 2). Performance assessment relied on metrics such as the Nash-Sutcliffe efficiency (NSE) and coefficient of determination (R2). Future climate projections are based on an ensemble mean of 13 bias-corrected GCM models for the Shared Socioeconomic Pathways (SSP) scenarios SSP245 and SSP585. The simulation of future basin water balance components involves segmenting the entire timeframe into S1 (2015-2040), S2 (2041-2070), and S3 (2071-2100). Projections indicate an increase in maximum and minimum temperatures, with precipitation potentially rising by up to 47% in the basin under the SSP245 scenario by the end of the century. Hydrological simulations reveal increased surface runoff and evapotranspiration under the SSP245 scenario compared to historical data. The percentage change in blue water components under both SSP scenarios shows an increase of more than 50% compared to the historical data. In comparison, that of green water components only increases to a maximum of 8% in all the timeframes (S1, S2 and S3). Notably, the impact of climate change is more pronounced under the SSP585 scenario compared to SSP245. These changes significantly impact the water resources of the Upper Ghatprabha River Basin; necessitating focused attention on future planning and management strategies for water resources.

How to cite: Jain, S. and Jain, M. K.: Assessment of Blue and Green Water Availability in the Upper Ghatprabha River Basin under Climate Change Impacts, EGU General Assembly 2024, Vienna, Austria, 14–19 Apr 2024, EGU24-4988, https://doi.org/10.5194/egusphere-egu24-4988, 2024.

EGU24-5462 | ECS | PICO | HS7.3

Influencing factors of durum wheat productivity under current and future climatic conditions 

Malin Grosse-Heilmann, Elena Cristiano, Francesco Viola, and Roberto Deidda

Durum wheat is a critical staple crop in arid and semi-arid regions worldwide, that plays a significant role in local food security. Providing essential nutrients and a high protein content, it is widely used for the production of pasta and couscous. Various constraints and drivers affect durum wheat productivity, including biotic and abiotic stressors, agronomic practices, and CO2 concentrations. Their influence varies based on duration and intensity of the stressor, as well as the durum wheat growth phase in which they occur. Drought and heat were shown to act as primary yield limiting factors. Furthermore, the water footprint, a comprehensive measure for the volume of water associated with crop production, helps to analyse durum wheat cultivation from a water-food nexus perspective. Given that climate change is affecting the main influencing factors of durum wheat’s productivity and of its water footprint, such as precipitation, temperature, and atmospheric CO2 levels, its cultivation is expected to undergo alterations as well. In this context, we explore the present state of durum wheat productivity and the potential influence of changing climatic conditions on its future cultivation worldwide. The current state of research on future durum wheat production is characterised by contradictory results, compromising projections of significant declines due to heat and drought stress as well as strong increases in productivity as a consequence of the CO2-fertilisation effect, for the same or nearby locations. Understanding the complex interactions between climate change, durum wheat productivity and the associated water footprint is of great importance to derive sustainable adaptation strategies and move one step closer into ensuring future food and water security.

How to cite: Grosse-Heilmann, M., Cristiano, E., Viola, F., and Deidda, R.: Influencing factors of durum wheat productivity under current and future climatic conditions, EGU General Assembly 2024, Vienna, Austria, 14–19 Apr 2024, EGU24-5462, https://doi.org/10.5194/egusphere-egu24-5462, 2024.

Mobile phones, televisions, computers and other liquid crystal devices have become the electronic products widely used by humans in modern society. Liquid crystal monomers (LCMs) are the key material of liquid crystal display and considered as potential persistent, bioaccumulative, and toxic (PBT) substances in recent years, but there is a limited of information regarding their occurrence in human body. We used EPI suite software from USEPA to evaluate its physical and chemical properties, analyzed its concentration in serum and urine by GC-MS, and finally assessed its health risk to humans through the calculation of daily intake. In this paper, 15 LCMs were detected in serum and urine samples of the general population, with median concentrations ranging from 9.7 to 124.8 and 2.68 to 36.98 µg/L, respectively. The correlation of LCM in serum and urine suggests that they have potential common applications and similar sources. The results showed that the CLrenal of LCMs in the Northwest China population was 0.61, 7.79, 6.04, 4.81, 9.37, 4.85, 19.94, 10.64, 3.80, 7.44, 8.26, 15.39, 7.52, 10.17, 13.54 mL/kg/day for EBCN, BCBP, PBIPHCN, DFPrB, FPrCB, BEEB, BMBC, DFPCB, DFEEB, EPrCPB, EEPrTP, EDFPB, DFPrPrCB, EFPeT, TeFPrT, respectively. The daily intake for ∑LCMs in the adult of northwest China was 22.35 ng/kg bw/day, indicating a potential exposure risk to the general population. This study provides the first evidence for the presence of LCM in serum and urine in the daily population and finds a correlation between LCMs, but the differences in B/U ratio and renal clearance indicate the need for further investigation of its metabolism and clearance in the human body.

How to cite: Yang, K., Cheng, H., Quan, W., Gong, Y., and Ai, Y.: Human health risks estimations from Liquid crystal monomers(LCMs)in Northwest China : partitioning, clearance and exposure in paired human serum and urine, EGU General Assembly 2024, Vienna, Austria, 14–19 Apr 2024, EGU24-7771, https://doi.org/10.5194/egusphere-egu24-7771, 2024.

EGU24-8378 | ECS | PICO | HS7.3

Optimizing irrigation practices for sustainable olive production in semi-arid areas: A comparative analysis of the efficiency of Subsurface and Surface drip irrigation systems  

Sara Ourrai, Bouchra Aithssaine, Abdelhakim Amazirh, Salah Er-raki, Lhoussaine Bouchaou, Frederic Jacob, Mohamed Hakim Kharrou, and Abdelghani Chehbouni

Abstract : Irrigated olive trees constitute the main arboricultural component of orchards in semi-arid regions, and the optimization of irrigation practices is crucial to sustain the production, increase agricultural water productivity and reallocate water savings to other higher-value uses. Numerous technical strategies have been implemented in the last two decades, to promote water conservation in irrigated agriculture, namely the adoption of subsurface drip irrigation system. This study delves into a comprehensive comparative analysis between subsurface (SDI) and surface (DI) drip irrigation systems over an olive orchard, with an emphasis on the evolution of evaporative fraction (EF) and the ratio of transpiration (T) to evapotranspiration (ET), soil moisture distribution patterns, as well as water use efficiency and water productivity. The experiment was carried out over two irrigated olive plots located in the Tensift basin (Morocco), from May to October 2022. Each plot is subjected to a specific irrigation pattern, and equipped with an Eddy-Covariance system to quantify the energy balance components, along with Time-Domain-Reflectometry (TDR) sensors installed at various depths, to monitor the soil water content. Besides, the partitioning of ET into T and evaporation (E) over the two irrigation systems was performed using the Conditional Eddy-Covariance (CEC) scheme and validated using sap flow measurements collected over SDI plot during April 2023. The ET of the DI system was higher than that of the SDI one, with diurnal ET values ranging between 0.58-3.02 (mm/day) and 0.48-2.74 (mm/day) for DI and SDI systems, respectively. Our findings suggest that although a smaller irrigation water amount was applied in SDI (194 mm) compared to DI (320 mm), crop yield revealed no significant differences. This thorough assessment intends to add substantial knowledge to the lasting debate about sustainable irrigation practices over olive orchards and assist policymakers in making informed decisions to enhance water use efficiency while sustaining overall agricultural production.

Keywords: subsurface and surface drip irrigation; evapotranspiration; water productivity; water use efficiency; olive trees; semi-arid areas.

How to cite: Ourrai, S., Aithssaine, B., Amazirh, A., Er-raki, S., Bouchaou, L., Jacob, F., Kharrou, M. H., and Chehbouni, A.: Optimizing irrigation practices for sustainable olive production in semi-arid areas: A comparative analysis of the efficiency of Subsurface and Surface drip irrigation systems , EGU General Assembly 2024, Vienna, Austria, 14–19 Apr 2024, EGU24-8378, https://doi.org/10.5194/egusphere-egu24-8378, 2024.

EGU24-8539 | ECS | PICO | HS7.3

Design of a low-cost autonomous seawater measurement buoy to scale and optimize a green-powered desalination plant 

Zachary Williams, Manuel Soto Calvo, and Han Soo Lee

Climate change and water scarcity has pushed more countries with direct ocean access to seek desalination solutions to face part of their need for domestic water networks or industrial usage, while conserving coastal ecosystems. Seawater monitoring is crucial in implementing a desalination plant as it ensures the efficiency and sustainability of the desalination process, especially in the case of a plant powered by renewable energy sources. Seawater is the main input of desalination processes and coastal areas are the locations of the release of the salty waste. An autonomous buoy can be used to monitor the seawater parameters which are essential to sizing a desalination plant.

There have been recent developments of autonomous buoy systems for monitoring different water parameters, however lacking in certain aspects. Some of the elements of these buoys include limited range of data transmission, high-cost designs, immobility and limited number and types of sensors. Also, there has been lacking implementation of autonomous buoys used in development of desalination plants. 

The proposed low-cost autonomous buoy is designed and constructed using cost effective materials. It increases the possibility of multiplying the sensor count to have a more accurate data mapping system. The low cost provides the opportunity of having more devices where there is a higher probability of equipment loss due to possible theft or remoteness of travel. The power supply is an oversized solar array with a backup battery and solar charger. An Arduino microcontroller is connected to two probes and a GPS sensor. The data is logged on a SD memory card with data transmitted via the Iridium satellite constellation, consisting of 75 satellites. There are two parts of construction involved in the project: the construction of the outer shell of the buoy and the design of the inner circuitry and components. The project involves multiple steps of experimentation: first in a laboratory/controlled area then deployed in the Seto Inland Sea, Japan. The various steps ensure the data collected by the sensors is reliable, valid, and suitable for scientific research. After this successful implementation, the buoy will be adapted and deployed in the Caribbean Sea surrounding Jamaica.

Initial results show a promising possibility of measuring seawater parameters such as GPS location, salinity, and sea surface temperature for any body of water. Utilizing the span of the Iridium satellite communication system, this ensures that virtually all regions of the Earth can be measured. The sizing of the solar powering components allows for at least 1 year of monitoring in the worst-case scenario and 4-5 years in the best-case scenario. The integration of autonomous buoys in the desalination process enhances efficiency in the plant design stages and reduces potential costs which contributes to the optimization of the desalination system. The environmental integration and the operation of the plant will be improved as a result of the enhanced assessment of the input and waste release conditions.


Keywords: Seawater Monitoring, Remote Sensing, Desalination, Autonomous buoy, Autonomous measurements


How to cite: Williams, Z., Soto Calvo, M., and Lee, H. S.: Design of a low-cost autonomous seawater measurement buoy to scale and optimize a green-powered desalination plant, EGU General Assembly 2024, Vienna, Austria, 14–19 Apr 2024, EGU24-8539, https://doi.org/10.5194/egusphere-egu24-8539, 2024.

Reduced rainfall has been identified as a highly probable consequence of climate change in certain regions of Zambia. This is particularly concerning for small-holder farmers, who heavily rely on rainfall and are the primary producers of the country’s staple food, such as maize. The resulting decrease in production significantly impacts national food security. Recognizing the potential of irrigated agriculture to improve food security and sustain production levels, the Zambian Agricultural Research Institute (ZARI) has been actively engaged in research since 2021. Their focus is on enhancing irrigation and soil fertility management under conditions of reduced water availability.

To address these challenges, a research trial was initiated at the ZARI research station in 2021. This trial aims to identify the optimal and sustainable water and nitrogen application for achieving maximum maize production in irrigated crop systems. Access tubes were installed in each subplot to monitor soil moisture to a depth of 1 m before and after irrigation on a weekly basis.

This paper assesses the stored water in the root zone (up to 1 m) with interplay between amount of nitrogen fertilizer  applied and water application level.

In the 2021 season, the results indicate that significantly more water was retained averagely throughout the growing season  in treatments with higher nitrogen levels, especially under reduced irrigation water applications (50% and 75% ETc). A similar trend was observed in the 2022 season, albeit only for 50% ETc. The increased stover yield may have contributed to reduced evaporation, minimizing losses. As nitrogen application levels rise, the ability to store soil water in the profile appears to increase. However, further analyses of soil moisture depth and root systems are needed to determine whether excess water in deficit-irrigated treatments is obtained from lower depths or if (and how much) water is lost in optimally irrigated treatments.

How to cite: Mwape, M., Said Ahmed, H., Phiri, E., and Dercon, G.: Enhancing Maize Production in Irrigated Crop Systems: Optimizing Water and Nitrogen Application for Sustainable Agriculture in Zambia, EGU General Assembly 2024, Vienna, Austria, 14–19 Apr 2024, EGU24-8734, https://doi.org/10.5194/egusphere-egu24-8734, 2024.

EGU24-9386 | ECS | PICO | HS7.3

Food security in a changing climate - how can Earth observation and machine learning help?  

Emanuel Bueechi, Milan Fischer, Laura Crocetti, Miroslav Trnka, Ales Grlj, Luca Zappa, and Wouter Dorigo

Climate change is threatening food security. To ensure food security, we do not only have to safeguard agricultural production - crop yields also need to be optimally distributed. For that, decision-makers need reliable crop forecasts so that they can plan which regions are likely to experience crop yield losses and which regions will produce a surplus. Earth observation and machine learning are key tools to calculate such forecasts. However, extreme crop yield losses, for example caused by severe droughts, are often underestimated. To test this, we developed a machine learning-based crop yield anomaly forecasting system for the Pannonian Basin and examined its performance, with a focus on drought years. We trained the model (XGBoost) with crop yield data from 43 regions in southeastern Europe and predictors describing soil moisture, vegetation, and meteorological conditions. Maize and winter wheat yield anomalies were forecasted with different lead times (zero to three months) before the harvesting season. Our results show that the crop yield forecasts are significantly more reliable from 2 months before the harvest than before in both, drought and non-drought years. The models have their clear strength in forecasting interannual variabilities but struggle to forecast differences between regions within individual years. This is related to spatial autocorrelations and a lower spatial than temporal variability of crop yields. In years of severe droughts, the wheat yield losses remain underestimated, but the maize forecasts are fairly accurate. The feature importance analysis shows that in general wheat yield anomalies are controlled by temperature and maize by water availability during the last two months before harvest. In severe drought years, soil moisture is the most important predictor for the maize model and the seasonal temperature forecast becomes key for wheat forecasts two months before harvest. 

How to cite: Bueechi, E., Fischer, M., Crocetti, L., Trnka, M., Grlj, A., Zappa, L., and Dorigo, W.: Food security in a changing climate - how can Earth observation and machine learning help? , EGU General Assembly 2024, Vienna, Austria, 14–19 Apr 2024, EGU24-9386, https://doi.org/10.5194/egusphere-egu24-9386, 2024.

EGU24-13506 | ECS | PICO | HS7.3

The impact of drought on the water-food nexus at the global scale 

Tobia Rinaldo, Elena Ridolfi, Benedetta Moccia, Flavia Marconi, Paolo D'Odorico, Fabio Russo, and Francesco Napolitano

The demand for farmland products is increasing worldwide, causing unprecedented stress on the global agricultural system and, consequently, on water resources. Here we analyse the impact of drought events on rainfed agriculture, a topical issue given the prolonged and severe drought events currently occurring around the world and thus including highly productive areas. We investigate the agricultural yields of key crops that represent 61% of the world’s production of proteins for human consumption (i.e. corn, wheat, rice, and soybeans). Our analysis spans from the early 1900s to 2022, allowing us to assess the total agricultural area under drought stress per year and the most vulnerable types of crops. We identify significant trends in the extent of agricultural land under stress, considering both historical and recent periods. This comprehensive analysis enables us to estimate the frequency of occurrences of crop-specific cultivated areas under stress over time, unravelling the pattern of drought impact on global agriculture.

How to cite: Rinaldo, T., Ridolfi, E., Moccia, B., Marconi, F., D'Odorico, P., Russo, F., and Napolitano, F.: The impact of drought on the water-food nexus at the global scale, EGU General Assembly 2024, Vienna, Austria, 14–19 Apr 2024, EGU24-13506, https://doi.org/10.5194/egusphere-egu24-13506, 2024.

Continued population growth, changing climate and increased pressure on water resources will dramatically increase the pressure on Chinese agriculture in the coming decades. Although there have been some reports of yield stagnation in the world’s major cereal crops, including maize, rice and wheat, the reasons for stagnation have not been quantified thoroughly. Here, we use statistical data to examine the trends in crop yields for two key Chinese crops: maize and wheat and their drivers in China’s drylands. Results showed that although yields continue to increase in many areas, we found that across 70.2% of maize- and 51.9% of wheat- growing prefectures or provinces, yields either never improved, stagnated or collapsed. The reasons for the decline and stagnation of crop yield were mainly caused by the change of growing season precipitation and irrigation fraction. New investments such as increased irrigation fraction in underperforming regions, as well as strategies to continue increasing yields in the high-performing areas, are required.

How to cite: Zi, S.: Recent patterns of crop yield growth, stagnation and their drivers in China’s dryland, EGU General Assembly 2024, Vienna, Austria, 14–19 Apr 2024, EGU24-13868, https://doi.org/10.5194/egusphere-egu24-13868, 2024.

EGU24-18617 | ECS | PICO | HS7.3

Climate change impact on wheat yield in India: Study using CERES-wheat model 

Achanya Lakshmanan, Yogendra Shastri, and Riddhi Singh

Agriculture is highly dependent on climate because rainfall, temperature and sunlight are the primary determinants of crop development. Climate change driven effects such as variation in precipitation and changes in temperatures are likely to affect agricultural yields. Systematic planning of agricultural activities considering these effects is essential. As a first step towards this longer term objective, this work quantifies the effect of climate change on crop in short and long term in India. Wheat is chosen as the crop of interest. Madhya Pradesh, one of the leading wheat producing states in India, is the region under focus, and Betul district is selected for a initial studies. The CERES-wheat model in the Decision Support System for Agrotechnology Transfer (DSSAT) tool is used to estimate the impact of climate change on wheat yield. The CERES-wheat model has been calibrated and validated, and the calibrated parameters have been used to simulate wheat yield in the future. The base period for calculating base wheat yield is 2009-2019. Future wheat yields are calculated for two periods (2025-2055 and 2056-2085). The projected changes in precipitation, maximum temperature (Tmax) and minimum temperature (Tmin) in future compared to the base period are calculated using four different General Circulation Models (GCMs) and four Shared Socioeconomic Pathways (SSPs). To increase the study's robustness, 1000 samples are systematically generated using Latin Hypercube Sampling (LHS). A stochastic weather generator (WG), WeaGETS, is used to create a synthetic time series of climate variables. Using the 1000 different combinations of changes in climate variables, 1000 climate scenarios are generated using WeaGETS. The climate variables used to determine the relationship between climate and wheat yield were mean rainfall, rainfall variance, Tmax, and Tmin. Wheat yield ranged from 2065 to 3207 kg/ha during the baseline period, and it is expected to vary from 1629 to 3638 kg/ha between 2025 and 2055. Looking ahead to 2056-2085, wheat yields are estimated to range from 1363 to 3555 kg/ha. The sensitivity analysis results between climate variables and wheat yield for both periods suggest that wheat yield is positively correlated with mean rainfall and rainfall variance and negatively correlated with Tmax and Tmin. Maximum temperature has a significant negative correlation with wheat yield in both periods after excluding the effect of other climate variables. However, in the last stage of wheat yield development, the grain filling stage, Tmin is more critical than Tmax. These results highlight the need for systematic planning to manage negative impacts of climate change on wheat cultivation in India. These results will used as a basis for suggesting adaptation strategies to manage the impact of climate change on wheat yield.

How to cite: Lakshmanan, A., Shastri, Y., and Singh, R.: Climate change impact on wheat yield in India: Study using CERES-wheat model, EGU General Assembly 2024, Vienna, Austria, 14–19 Apr 2024, EGU24-18617, https://doi.org/10.5194/egusphere-egu24-18617, 2024.

EGU24-19902 | PICO | HS7.3

Estimating and Suggesting measures to reduce carbon emissions and water footprint linked to water collection, agriculture, and tourism in the Canary Islands (Spain) 

Juan C. Santamarta, Noelia Cruz-Pérez, Joselín R. Rodríguez-Alcántara, Jesica Rodríguez-Martín, Alejandro García-Gil, Samanta Gasco-Cavero, and MIguel Á. Marazuela

The Canary Islands constitute an archipelago of Spain, also being a European outermost region composed of eight islands. Overall, these islands face a high risk of experiencing the impacts of climate change, particularly rising sea levels, floods, temperature increases, and a decrease in water resources, factors that significantly affect the daily life of the population in the islands. As the effects of climate change are linked to greenhouse gas emissions, it is crucial to measure the emissions from the main sectors of the Canary Islands to implement effective mitigation and reduction measures, as well as to increase energy production through renewable sources. For this reason, the Government of the Canary Islands has commissioned the project to determine the carbon footprint and water footprint of the main sectors of the region, including the production of drinking water and wastewater management, agriculture, and tourism. The results indicate that seawater desalination for drinking water, being a significant energy consumer with low penetration of renewable energy in the Canary Islands' electricity mix, is the facility contributing the most to greenhouse gas generation in the water cycle in the region. It is followed by wastewater treatment plants and extraction wells from the aquifer. In the case of agriculture, focusing on the consumption of tropical crops such as avocados and bananas, key export crops, it is noteworthy that avocados are major water consumers, slightly exceeding the water consumption of bananas. This poses challenges in the face of an uncertain future due to reduced natural precipitation resulting from climate change. Lastly, the analysis of tourism emissions highlights that hotel activities and rental vehicles are significant contributors to greenhouse gas emissions. Although these emissions are indirect for the archipelago, other studies have emphasized the high emissions associated with the arrival of tourists by air to the islands. This study stands as the first to analyze the emissions of the main sectors in the Canary Islands, providing an opportunity for governmental actions to reduce these emissions and mitigate climate change in the islands.

Keywords: Climate change; outermost region; vulnerability; sustainable development

Acknowledgements

This research was supported by the European Union's Horizon 2020 Research and Innovation Programme under grant agreement 101037424 and Project ARSINOE (Climate Resilient Regions Through Systems Solutions and Innovations).

How to cite: Santamarta, J. C., Cruz-Pérez, N., Rodríguez-Alcántara, J. R., Rodríguez-Martín, J., García-Gil, A., Gasco-Cavero, S., and Marazuela, M. Á.: Estimating and Suggesting measures to reduce carbon emissions and water footprint linked to water collection, agriculture, and tourism in the Canary Islands (Spain), EGU General Assembly 2024, Vienna, Austria, 14–19 Apr 2024, EGU24-19902, https://doi.org/10.5194/egusphere-egu24-19902, 2024.

EGU24-20643 | PICO | HS7.3

The use of crop models to assess crop production and food security 

Yohanne Gavasso Rita, Simon Papalexiou, Yanping Li, Amin Elshorbagy, Zhenhua Li, and Corinne Schuster-Wallace

The global food supply and food security are altered by field, soil, and weather conditions during crop production. Researching food productivity became crucial as the global population increased. In particular, crop losses bring low food supply and price instabilities at the regional and global levels. With that in mind, we reviewed ten crop models and the most simulated impacts from soil-crop-atmosphere interactions in maize, rice, and wheat production. Since 2012, modellers have mainly used APSIM to predict water availability, temperature changes and Greenhouse Gas  (GHG) concentration to predict crop phenology, growth and development, grain filling and nutrient content, and yield. Since 2013, AquaCrop has been used to simulate scenarios focused on water balance in crop production systems, water stress and irrigation planning. Interestingly, Biome-BGCMuso was developed as a biogeochemical model and was not considered good by crop modellers. However, After updates, version v6.2 can simulate different management and field conditions for fifteen crops, considering heat, nitrogen and drought stress. Since 2008, crop modellers used CropSyst to evaluate water availability, nitrogen use efficiency (UE), temperature shifts and GHG concentration in rainfed and irrigated crop systems. Since 2002,  crop modellers have used DAISY to predict crop growth, nitrogen and water UE, grain content, yield gap, and losses. Since 2011, researchers have used DSSAT-CERES for mitigation strategy planning by predicting crop growth, soil characteristics, changes in land use, and nitrogen and water UE. Since 2015, JULES has been used to determine land-atmosphere interactions, changes in land use and GHG impacts on agriculture. Since 2008, ORYZA modellers have mainly predicted nitrogen and water UE, salinity impacts, and toxicity to rice. STICS was developed in 1996, and since 2008, it has been primarily used to simulate fertilization and irrigation systems, nitrogen leaching, and water availability. Since 2000, researchers have used WOFOST to analyze water availability, crop growth, and productivity under temperature changes. Crop models are fast and reliable resources when simulating crop production and food availability.

How to cite: Gavasso Rita, Y., Papalexiou, S., Li, Y., Elshorbagy, A., Li, Z., and Schuster-Wallace, C.: The use of crop models to assess crop production and food security, EGU General Assembly 2024, Vienna, Austria, 14–19 Apr 2024, EGU24-20643, https://doi.org/10.5194/egusphere-egu24-20643, 2024.

EGU24-20876 | ECS | PICO | HS7.3

Application of Machine Learning Approaches for Cotton Seasonal Yield Estimation  

Lisa Umutoni, Vidya Samadi, Jose Payero, Bulent Koc, and Charles Privette

Estimating crop yield can help farmers plan for equipment, labor, and other crop production input requirements. Forecasting crop yield is also useful for analyzing weather-related variability to guide decisions such as irrigation water and fertilizer management. This work discusses the application of Gated Recurrent Unit (GRU) and Long Short-Term Memory (LSTM) machine learning algorithms for seasonal cotton yield prediction. Simulation results from the crop model AquaCrop, consisting of irrigation depth, soil moisture content, and crop growth stage data from 2003 to 2021 were used to train the algorithms. The two developed yield-prediction models were tested against data collected from an irrigated cotton field located at Clemson University Edisto Research and Education Centre (EREC), near Blackville, South Carolina, USA during the 2023 growing season. The values of hidden layers, hidden units, dropout, learning rate and batch size hyperparameters were set to respectively, 3, 64, 0.2, 10E-3 and 64 for the GRU model and 3, 128, 0.4, 10E-3 and 64 for the LSTM model. Analysis suggested that the tested algorithms resulted in very good to excellent performance. We concluded that machine learning algorithms are useful tools that can provide insights into how much yield to expect in an upcoming season and help farmers optimize energy, water, and fertilizers applications.

How to cite: Umutoni, L., Samadi, V., Payero, J., Koc, B., and Privette, C.: Application of Machine Learning Approaches for Cotton Seasonal Yield Estimation , EGU General Assembly 2024, Vienna, Austria, 14–19 Apr 2024, EGU24-20876, https://doi.org/10.5194/egusphere-egu24-20876, 2024.

EGU24-21145 | ECS | PICO | HS7.3

Climate Risk and Vulnerability Assessment (CRVA) for the Port of Heraklion in Greece  

Anastasios Perdios, Antonios Boutatis, Andreas Langousis, Panagiotis Biniskos, Eva Kypraiou, Konstantina Korda, and Alexandros Zacharof

Climate change is expected to impact the maritime sector, including the port industry. Ports are on the frontline when it comes to experiencing operational challenges from the increased sea levels and extreme weather conditions, associated with increased infrastructure investments. For instance, rising sea water levels are expected to change the accessibility of channels and increase the need for higher quay walls, while the increased intensity or/and frequency of events, such as fog, high winds, and waves, may increase the frequency of port operation disruptions; but changes are uncertain, and with regional variation.

The present study focuses on the Port of Heraklion, one of the main ports of national importance in the Greek Maritime Network, located in the North side of the island of Crete, and aims at assessing the impacts of climate change on port operations associated with: 

  • Changes in mean sea level, storm surges and wave characteristics (i.e. wave height, period, frequency of occurrence).
  • Reduced visibility caused by intense precipitation and/or fog.
  • Disruption of port operations due to high wind speeds, drainage system induced flooding, as well as river discharges and sediment transfer in the harbor basin.

To assess the effects of climate change on winds we use climate change factors (CCFs) obtained using climate model data at 3-hourly temporal resolution over the Island of Crete (i.e. sub-country level) from EURO-CORDEX ensemble, and more in particular from HIRHAM5 RCM (Regional Climate Model) nested in (downscaled from) EC-EARTH GCM (Global Climate model), for two Representative Concentration Pathways of future emissions: RCP 4.5 for the period 2071-2100 and RCP 8.5 for the period 2041-2070. These are also the RCM-GCM combination and time periods used to assess the effects of climate change on the sea state and wave characteristics.

For rainfall, we make direct use of the climate change factors reported in the context of SWICCA program (Service for Water Indicators in Climate Change Adaption, 2015 - 2018), which was financed by the European Centre for Medium-Range Weather Forecasts (ECMWF) on behalf of the European Copernicus Agency within the framework of the Copernicus climate change service (C3S). Over the island of Crete, the corresponding factors are available for 9 GCM - RCM combinations (i.e. 5 for the RCP 4.5 scenario and 4 for the RCP 8.5 scenario).

We find that the increase of the mean sea level, as well as the increase in the frequency of intense storms significantly affect the frequency of port operation disruptions, particularly due to breakwater overtopping, storm induced flooding, as well sediment deposition in the harbor basin.

Acknowledgements

The presented work has been conducted under the project Climate Risk and Vulnerability Assessment (CRVA) for the Heraklion Port Authority" (project code: AA 011391-002/CC15302), which has been financed by the EIB under the InvestEU Advisory Hub. 

How to cite: Perdios, A., Boutatis, A., Langousis, A., Biniskos, P., Kypraiou, E., Korda, K., and Zacharof, A.: Climate Risk and Vulnerability Assessment (CRVA) for the Port of Heraklion in Greece , EGU General Assembly 2024, Vienna, Austria, 14–19 Apr 2024, EGU24-21145, https://doi.org/10.5194/egusphere-egu24-21145, 2024.

EGU24-553 | ECS | PICO | HS7.4

Investigation of changes in precipitation extremes and implications for hydrological design: the Italian case study 

Paola Mazzoglio, Alberto Viglione, Daniele Ganora, and Pierluigi Claps

According to the Sixth Assessment Report (AR6) of the Intergovernmental Panel on Climate Change (IPCC), there is a low agreement on the type of change in heavy precipitation for the Mediterranean area. The challenge lies in comparing studies that employ different time scales. While most of the research works are conducted on a daily scale due to the abundance of data at this resolution, only a limited number of studies delve into shorter (sub-daily) durations because of the scarcity of historical data in digital format at high temporal resolution.

A breakthrough in this challenge comes from the Improved Italian-Rainfall Extreme Dataset (I2-RED), a systematic collection of short-duration (1 to 24 hours) annual maximum rainfall depths recorded by more than 5000 rain gauges located all over Italy from 1916 up to the present.

This dataset has enabled a comprehensive analysis of temporal trends in extreme precipitation using spatial scales that range from the national to the regional to the local ones. The Mann-Kendall test and the Sen’s slope estimator were first applied to each individual station to investigate at-site statistically significant trends. Regional- and national-scale variations were instead investigated with the record-breaking analysis and the Regional Kendall test.

The results confirm that rainfall extremes of different durations are not increasing uniformly over Italy and that separate tendencies emerge in different sectors, even at close distances.

The tendencies obtained in this work are used, within the framework of the Italian National Recovery and Resilience Plan RETURN (multi-Risk sciEnce for resilienT commUnities undeR a changiNg climate) project, to identify critical infrastructures that will be likely affected by more severe rainfall extremes in the near future. These results have the potential to be used in revising hydrological design approaches to enable adaptation of the infrastructures to future precipitation conditions.

How to cite: Mazzoglio, P., Viglione, A., Ganora, D., and Claps, P.: Investigation of changes in precipitation extremes and implications for hydrological design: the Italian case study, EGU General Assembly 2024, Vienna, Austria, 14–19 Apr 2024, EGU24-553, https://doi.org/10.5194/egusphere-egu24-553, 2024.

EGU24-851 | ECS | PICO | HS7.4

CMIP6 climate scenarios for climate adaptation studies in Zambia 

Sahana Venkataswamy, Shweta Panjwani, and Giriraj Amarnath

This study investigates provincial-level extreme weather conditions over Zambia using the Coupled Model Intercomparison Project (CMIP6) climate projections for various emission scenarios from 25 Global Climate Models (GCMs). Taylor diagram analysis is performed to identify the best-performing GCMs by evaluating precipitation and temperature variables with the observed datasets for the baseline period (1950-2014). Earlier studies have investigated the changes in precipitation and temperature variables alone. This study investigates the trends in Annual Precipitation, Annual temperature (mean, maximum and minimum) as well as Standardized Precipitaion Evapotranspiration Index (SPEI) for the near future (2021-2060) and far future (2061-2100) using Sen’s Slope Estimator. While all the projected climate scenarios depict an increasing trend in the mean temperatures for both near and far future periods, upto 4˚C increase is expected at the end the 21st century under the worst-case scenario-SSP5-8.5. An overall decrease (upto -65 mm) in precipitation is expected in the near future and far future periods across the country, expect the North-eastern provinces. Corroborating with such a spike in climate conditions, the SPEI decreases by -1.16, -0.95, -0.86, -0.83 (near future, 2021-2060) and -1.36, -1.75, -1.98 and -1.99 (far future, 2061-2100) for SSP1-2.6, SSP2-4.5, SSP3-7.0, SSP5-8.5 respectively. Larger changes in SPEI is observed in Western, Southern, Northwestern and Lusaka provinces in both near and far future indicating worst drought conditions. The outcome from the present study provides a basis for undertaking provincial-level adaptation and mitigation measures under the evolving climate and framing policy interventions to combat climate change.

How to cite: Venkataswamy, S., Panjwani, S., and Amarnath, G.: CMIP6 climate scenarios for climate adaptation studies in Zambia, EGU General Assembly 2024, Vienna, Austria, 14–19 Apr 2024, EGU24-851, https://doi.org/10.5194/egusphere-egu24-851, 2024.

EGU24-1050 | ECS | PICO | HS7.4

Past and future changes of streamflow in the European Alps 

Rui Guo, Hung Nguyen, Stefano Galelli, Serena Ceola, and Alberto Montanari

Short instrumental streamflow records in the European Alps limit our understanding of the full range and long-term variability in river discharge, which could greatly impact the management of freshwater resources for the densely populated area downstream. Enhancing the understanding of past climatological and hydrological information is also essential to improve the accuracy of future scenarios for rare extreme events, such as multi-year droughts and unprecedented floods, which recently impacted severely important water resource systems and communities at the global level. Tree-ring data have proven to be a viable opportunity for reconstructing various climatic parameters, including streamflow. By using a novel climate-informed framework, the station-based streamflow records of several rivers originating from the European Alps are reconstructed dating back to the year 1100 AD. To further investigate the characteristics of streamflow and extreme events in both the past and future, this study also relies on state-of-the-art paleo simulations from the Paleoclimate Modeling Intercomparison Project phase 4 (PMIP4) and future projections from Coupled Model Intercomparison Project phase 6 (CMIP6). By integrating proxy-based reconstructions, climate model simulations and projections, and observation, the changes in streamflow and rare extreme events in the European Alps are put into a longer perspective covering both the past nine centuries and one century into the future, thus providing a unique opportunity to assess the risk of extreme events and to inform more effective water management strategies for climate change adaptation.

How to cite: Guo, R., Nguyen, H., Galelli, S., Ceola, S., and Montanari, A.: Past and future changes of streamflow in the European Alps, EGU General Assembly 2024, Vienna, Austria, 14–19 Apr 2024, EGU24-1050, https://doi.org/10.5194/egusphere-egu24-1050, 2024.

Floods and their subsequent socioeconomic exposures are increasing in most parts of the world due to global warming. However, less attention is given in the arid Central Asia (CA), in which floods usually occur in data-scarce high-mountainous regions with complex cryospheric hydrological processes (CHP). In this study, an improved hydrologic-hydrodynamic model coupled with a glacier mass balance module was developed to enhance flood simulations in CA. The effects of the CHP on future flood inundation and the subsequent socioeconomic exposures were also investigated. We found that the simulations of daily streamflow and flood magnitudes improved significantly over the selected hydrological stations after considering the glacier mass balance. Our estimations indicated that the flood inundation and its dynamic evolution generally agreed with satellite observations. Moreover, CHP-induced (rainfall-induced) flood inundation plays a significant role in China’s Xinjiang and Tajikistan (other regions of CA). The CHP would amplify the effects of future flood on socioeconomics in CA, with population (Gross Domestic Productivity, GDP) exposure up to 2.25 million persons/year (150 billion $ PPP/year) for 2071 – 2100. These findings could provide scientific evidence to improve the understanding of CHP effects on future floods and the subsequent exposures, informing the prioritization and design of flood mitigation strategies in CA.

How to cite: Wang, N., Sun, F., Wang, H., and Liu, W.: Effects of cryospheric hydrological processes on future flood inundation and the subsequent socioeconomic exposures in Central Asia, EGU General Assembly 2024, Vienna, Austria, 14–19 Apr 2024, EGU24-2840, https://doi.org/10.5194/egusphere-egu24-2840, 2024.

EGU24-6222 | ECS | PICO | HS7.4

Warming climate will alter the characteristics and generation processes of European floods 

Larisa Tarasova, Bodo Ahrens, Günter Blöschl, Rohini Kumar, Mostafa Hamouda, Oldrich Rakovec, and Ralf Merz

Under ongoing climate change, the projected increase in the magnitude of extreme precipitation is expected to intensify the magnitudes of future river floods. However, the disparate past changes in the latter, suggest that changing flood generation processes modulate the sensitivity of streamflow response to changing precipitation.

Here we examine how flood generation processes will change in Europe until the end of the 21st century under high emission scenario (SSP585) using the climatic forcing (i.e., precipitation, temperature) from CMIP6 EC-EARTH3-Veg simulation (Döscher et al., 2022) dynamically downscaled using the atmosphere-ocean coupled regional climate system model COSMO-NEMO-TRIP (Primo et al., 2019) within the extended EURO-CORDEX domain at the spatial resolution of 0.11° and corresponding hydrological simulations (i.e., streamflow, soil moisture, snow water equivalent) using mesoscale Hydrological Model (mHM). Using this information, we classify the annual maximum floods into rainfall events that occurred on dry or wet soils, a mixture of rainfall and snowmelt, and pure snowmelt events. We evaluate the reliability of our modeling system by comparing the frequency of these flood generation processes and characteristics of annual floods for the historical period 1960-2010 using classified flood observations in 1353 European catchments (Tarasova et al., 2023).

We find that under exacerbating climate change the frequency of occurrence of flood generation processes in Europe will change considerably by the end of the century. Interestingly, the pace of change in the magnitude, runoff coefficients and time scales of floods differs considerably for floods generated by different processes, emphasizing an important role that these processes play in modulating climate change signal and shedding a light on the variable hazard that flood events generated by different processes pose in a warming climate.


Döscher et al. The EC-Earth3 Earth system model for the Coupled Model Intercomparison Project 6. Geoscientific Model Development 15, 7 (2022). https://doi.org/10.5194/gmd-15-2973-2022

Primo et al. A regional atmosphere–ocean climate system model (CCLMv5.0clm7-NEMOv3.3-NEMOv3.6) over Europe including three marginal seas: on its stability and performance. Geoscientific Model Development 12, 12 (2019). https://doi.org/10.5194/gmd-12-5077-2019

Tarasova et al. Shifts in flood generation processes exacerbate regional flood anomalies in Europe. Commun Earth Environ 4, 49 (2023). https://doi.org/10.1038/s43247-023-00714-8

How to cite: Tarasova, L., Ahrens, B., Blöschl, G., Kumar, R., Hamouda, M., Rakovec, O., and Merz, R.: Warming climate will alter the characteristics and generation processes of European floods, EGU General Assembly 2024, Vienna, Austria, 14–19 Apr 2024, EGU24-6222, https://doi.org/10.5194/egusphere-egu24-6222, 2024.

EGU24-6459 | ECS | PICO | HS7.4

Modern vs traditional mapping methods for flood risk estimation: A case study for the river Pikrodafni, Athens, Greece 

Matina Kougia, Stavroula Sigourou, Panayiotis Dimitriadis, Romanos Ioannidis, Alexia Tsouni, G.-Fivos Sargentis, Dimitra Dimitrakopoulou, Efthymios Chardavellas, Nikos Mamassis, Demetris Koutsoyiannis, and Charalampos (Haris) Kontoes

The assessment of human progress often relies on factors such as the availability of energy and resources, the improvement of life expectancy, education, equality, democracy, justice, civilization, and other crucial elements. A significant concern within this evaluation revolves around the inclusivity and accessibility of technological advancements. However, human progress is more than that, since it can also manifest itself in the scientific and technical advances in treating natural hazards presenting a diachronic issue to societies’ resilience. In this study, the progress of engineering in analyzing and managing flood risk between the 1970s and present times is evaluated. To this aim, we utilize the experience of engineers who completed surveying, hydrological, and hydraulic studies for flood risk assessment in the 1970s, to carry out comparisons with recent methodologies applied in the framework of the Programming Agreement between the Prefecture of Attica and the Operational Unit BEYOND Centre of EO Research and Satellite Remote Sensing of the Institute of Astronomy, Astrophysics, Space Applications & Remote Sensing (IAASARS) of the National Observatory of Athens (NOA), in cooperation with the Research Group ITIA of the Department of Water Resources and Environmental Engineering of the School of Civil Engineering of the National Technical University of Athens (NTUA) to the Pikrodafni stream, in Attica, Greece. Specifically, we quantify the progress made and differences between the two periods, in terms of human resources, computational cost, and accuracy of practices and methodologies.

How to cite: Kougia, M., Sigourou, S., Dimitriadis, P., Ioannidis, R., Tsouni, A., Sargentis, G.-F., Dimitrakopoulou, D., Chardavellas, E., Mamassis, N., Koutsoyiannis, D., and Kontoes, C. (.: Modern vs traditional mapping methods for flood risk estimation: A case study for the river Pikrodafni, Athens, Greece, EGU General Assembly 2024, Vienna, Austria, 14–19 Apr 2024, EGU24-6459, https://doi.org/10.5194/egusphere-egu24-6459, 2024.

EGU24-8968 | PICO | HS7.4 | Highlight

Why the 2022 Po River drought is the worst ever observed 

Alberto Montanari, Hung Nguyen, Sara Rubinetti, Serena Ceola, Stefano Galelli, Angelo Rubino, and Davide Zanchettin

The causes of recent hydrological droughts and their future evolution under a changing climate are still poorly understood. By analysing a a 216-year river flow time series of the Po River at the closure section, we show that the 2022 hydrological drought is the worst event (30% lower than the second worst, with a six-century return period) ever observed. We prove that the 2022 drought is part of an increasing trend in severe drought occurrence. The decline in summer river flows (−4.14 cubic meters per second per year), which is more relevant than the precipitation decline, is attributed to a combination of changes in the precipitation regime, resulting in a decline of snow fraction (−0.6% per year) and snowmelt (−0.18 millimeters per day per year), and to increasing evaporation rate (+0.013 cubic kilometers per year) and irrigated areas (100% increment from 1900). Our study presents a compelling case where the hydrological impact of climate change is exacerbated by local changes in hydrologic seasonality and water use.

How to cite: Montanari, A., Nguyen, H., Rubinetti, S., Ceola, S., Galelli, S., Rubino, A., and Zanchettin, D.: Why the 2022 Po River drought is the worst ever observed, EGU General Assembly 2024, Vienna, Austria, 14–19 Apr 2024, EGU24-8968, https://doi.org/10.5194/egusphere-egu24-8968, 2024.

EGU24-9302 | ECS | PICO | HS7.4

Projected shifts and dynamics in blue and green water resources availability  

Simon P. Heselschwerdt and Peter Greve

A deep understanding of the dynamics of green and blue water resources is crucial for accurately estimating future water availability. Although projections of precipitation trends are robust in many regions, changes in precipitation partitioning into green and blue water fluxes present a significant source of uncertainty for water management. To quantify water partitioning dynamics, we introduce the Blue-Green Water Share (BGWS) metric. This metric utilizes monthly precipitation data, while monthly runoff and transpiration data are used as proxies of blue and green water fluxes. We investigate the output of fourteen CMIP6 models for the historical period and three Shared Socioeconomic Pathways to assess the scenario dependency of the BGWS changes. Most importantly, we examine how and why the BGWS varies across different regions. Additionally, primary drivers of the BGWS changes are identified by applying a multivariable regression analysis and computing the permutation importance of selected ecohydrological variables.

The results illustrate a strong regional dependency and interplay of the driving variables. However, clustering the variable importance demonstrates that BGWS changes in higher latitudes tend to be more dependent on temperature, while precipitation patterns dominate partitioning changes in the tropics. Several regions, including the Mediterranean, Northern South America, and Eastern Australia, show a substantial influence of vegetation alterations on the BGWS change, shifting the partitioning imbalance towards more green water flux. We discuss the varying variable importance based on the counteracting mechanisms of increased CO2 concentrations, altered growing seasons, and changed precipitation patterns. Our results highlight the importance of comprehensively understanding green and blue water dynamics in the context of water resources availability under a changing climate.

How to cite: Heselschwerdt, S. P. and Greve, P.: Projected shifts and dynamics in blue and green water resources availability , EGU General Assembly 2024, Vienna, Austria, 14–19 Apr 2024, EGU24-9302, https://doi.org/10.5194/egusphere-egu24-9302, 2024.

EGU24-11912 | ECS | PICO | HS7.4

Abstracting past studies and synthesizing their spatial data in GIS for utilization in a study of flood risk in Attica region, Greece  

Romanos Ioannidis, Dimitra Dimitrakopoulou, Stavroula Sigourou, Vasiliki Pagana, Marcos Julien Alexopoulos, Panayiotis Dimitriadis, G.-Fivos Sargentis, Michail-Christos Tsoutsos, Efthimis Chardavellas, Alexia Tsouni, Nikos Mamassis, Demetris Koutsoyiannis, and Charalampos Kontoes

From the perspective of a team of engineers that studies an area in order to estimate flood risk, a highly studied area presents both benefits and challenges. On the one hand, stands the benefit of accessibility to data and existing knowledge, while on the other the challenge of optimal analysis and utilization of such material.

The region of Attica, Greece, fits exactly the description of a highly studied area. It hosts the capital of the country, Athens, and close to half of the national population. For this reason, flood risk has been studied throughout the 20th and 21st century in various spatial scales, and using different methods and tools. In a contemporary study of flood risk with modern digital computational tools, we undertook the tasks of compiling, analyzing and mapping important information from those past studies.

In this work, we present the relevant challenges faced during the project “Earthquake, fire and flood risk assessment in the Region of Attica” as well as inferences for future studies of similar type. Following the previous step of our comprehensive methodology for the estimation and mapping of flood risk in Attica Region, we received as an input a set of existing studies for our study area. In the process of abstracting the spatial data from those studies, we grouped such data in three categories: spatial information in text, in CAD files and in GIS files. Each type of information presented its own type of challenges. Information in text was time-consuming to process, both because it necessitated reading the whole studies to be pinpointed, but also due to the requirement for manual extraction and conversion to GIS format. Spatial information found in CAD and GIS files presented mostly software-related challenges in managing to achieve a common representation scale and geospatial reference of the plans. Lastly, a challenge that was common for all types of data was the identification of whether the hydraulic works or terrain conditions that were presented in each study were actually present as such today. This required cross-methodological communication including both with the previous methodological steps of contact with the institutions that provided the studies, and with the next methodological steps of site visits for the confirmation of the recorded information.

Overall, we identify the following as crucial priorities for efficient abstracting and synthesizing the spatial data on flood risk in a highly studied area. Firstly, clarity in defining the types of data being searched for, secondly, the utilization of CAD and GIS software with interoperability functions and easy scaling and georeference functionalities, thirdly, the direct communication with the institutions that created or utilize the studies, and lastly, the realization of site visits to verify the recorded information.

How to cite: Ioannidis, R., Dimitrakopoulou, D., Sigourou, S., Pagana, V., Alexopoulos, M. J., Dimitriadis, P., Sargentis, G.-F., Tsoutsos, M.-C., Chardavellas, E., Tsouni, A., Mamassis, N., Koutsoyiannis, D., and Kontoes, C.: Abstracting past studies and synthesizing their spatial data in GIS for utilization in a study of flood risk in Attica region, Greece , EGU General Assembly 2024, Vienna, Austria, 14–19 Apr 2024, EGU24-11912, https://doi.org/10.5194/egusphere-egu24-11912, 2024.

EGU24-12363 | ECS | PICO | HS7.4

Exploring Hurst-Kolmogorov Dynamics: Unraveling the (temporal) link between Flood Insurance Claims and Streamflow Extremes in the contiguous USA 

Georgios T. Manolis, Konstantinos Papoulakos, Theano Iliopoulou, Panayiotis Dimitriadis, Dimosthenis Tsaknias, and Demetris Koutsoyiannis

This research investigates the intricate relationship between flood insurance claims and streamflow extremes in the contiguous USA, challenging the conventional belief of independence and non-catastrophic nature of insurable flood losses. Focusing on the Hurst-Kolmogorov dynamics, which emphasizes the temporal dependence of extreme flood events, we explore the implications of these dynamics on flood insurance practices and streamflow extremes. By analyzing the US-CAMELS dataset, we investigate the clustering mechanisms' impact on return intervals, event duration, and severity of the over-threshold events, which are treated as proxies for collective risk. Furthermore, stochastic approaches are developed to explore the correlation between properties of extreme events and recently published FEMA National Flood Insurance Program claims records in an exploratory analysis. This study aims to contribute valuable insights into the temporal aspects of streamflow extremes, considering the dependencies identified by the Hurst-Kolmogorov dynamics and providing essential information for enhancing the accuracy of flood insurance and reinsurance practices.

How to cite: Manolis, G. T., Papoulakos, K., Iliopoulou, T., Dimitriadis, P., Tsaknias, D., and Koutsoyiannis, D.: Exploring Hurst-Kolmogorov Dynamics: Unraveling the (temporal) link between Flood Insurance Claims and Streamflow Extremes in the contiguous USA, EGU General Assembly 2024, Vienna, Austria, 14–19 Apr 2024, EGU24-12363, https://doi.org/10.5194/egusphere-egu24-12363, 2024.

EGU24-12405 | ECS | PICO | HS7.4

Historical and Future Climate Impacts on Hydrological Regimes: A case Study in the Upper Aral Sea Basin 

Yukun Li, Rui Guo, Fuqiang Tian, and Alberto Montanari

Originating in the high mountains of the western Tien Shan and Pamir, the two transboundary rivers (the Syr Darya and the Amu Darya) are the only sources of streamflow into the Aral Sea Basin, and constitute a crucial freshwater source for central Asia. Climate change is one of the giant global issues which adversely affects the water resources. Although the current water crisis in the Aral Sea Basin is largely due to human activity, the region is also strongly impacted by climate change. Upstream streamflow has important influence on downstream ecological security, environmental stability, and sustainable development. Therefore, conducting a comprehensive, long-term analysis of the impact of climate change on the hydroclimate of the Upper Aral Sea Basin is crucial in confronting freshwater challenges and solutions. However, this task still poses a significant challenge. To fill this research gap, the present study employs tree-ring based streamflow reconstruction and hydrological modeling forced by past and future hydroclimate variables to comprehensively analyze the shifts in the hydrological regime within the Upper Aral Sea Basin. We utilize data from CMIP6 and PMIP4, integrating them into hydrological models to generate detailed monthly and yearly runoff time series for the Upper Amu Darya and Upper Syr Darya, spanning from 850 to 2100. By comparing the performance of hydrological simulation and reconstruction, we aim to identify the unique strengths and weaknesses inherent in each method or dataset. This approach will significantly contribute to advancing our understanding of the hydrological dynamics in the region.

How to cite: Li, Y., Guo, R., Tian, F., and Montanari, A.: Historical and Future Climate Impacts on Hydrological Regimes: A case Study in the Upper Aral Sea Basin, EGU General Assembly 2024, Vienna, Austria, 14–19 Apr 2024, EGU24-12405, https://doi.org/10.5194/egusphere-egu24-12405, 2024.

EGU24-12686 | PICO | HS7.4

The importance of citizens’ engagement in the implementation of civil works for the mitigation of natural disasters with focus on flood risk in Attica Region (Greece). 

Dimitra Dimitrakopoulou, Romanos Ioannidis, Panayiotis Dimitriadis, G.-Fivos Sargentis, Efthymios Chardavellas, Marcos Julien Alexopoulos, Vasiliki Pagana, Alexia Tsouni, Stavroula Sigourou, Charalampos (Haris) Kontoes, Nikos Mamassis, and Demetris Koutsoyiannis

Ιn the framework of the Programming Agreement between the Prefecture of Attica and the Operational Unit BEYOND Centre of EO Research and Satellite Remote Sensing of the Institute of Astronomy, Astrophysics, Space Applications Remote Sensing (IAASARS) of the National Observatory of Athens (NOA), in cooperation with the Research Group ITIA of the Department of Water Resources and Environmental Engineering of the School of Civil Engineering of the National Technical University of Athens (NTUA), a rather innovative approach is applied for the purpose of flood risk assessment, regarding the contribution of citizens to the identification of the areas which are vulnerable to flood. It is highlighted how the experience of residents can lead to the identification of areas prone to flood, which could not be easily located otherwise, especially through large-scale flood risk maps. Moreover, it is demonstrated how the knowledge of residents can be used as a validation tool for the flood risk assessment results. Consequently, it is argued that the residents must play an active role in the conception, design and implementation of flood protection works in any infrastructure project within their area of interest. Such implementations of any mitigation measures should have as a prerequisite their acceptance by the residents. Their understanding is also important, on the one hand, to deal with possible reactions, appeals, and conflicts throughout the execution of the project, and, on the other hand, to ensure that residents are properly informed about the utility of such works and projects.

How to cite: Dimitrakopoulou, D., Ioannidis, R., Dimitriadis, P., Sargentis, G.-F., Chardavellas, E., Alexopoulos, M. J., Pagana, V., Tsouni, A., Sigourou, S., Kontoes, C. (., Mamassis, N., and Koutsoyiannis, D.: The importance of citizens’ engagement in the implementation of civil works for the mitigation of natural disasters with focus on flood risk in Attica Region (Greece)., EGU General Assembly 2024, Vienna, Austria, 14–19 Apr 2024, EGU24-12686, https://doi.org/10.5194/egusphere-egu24-12686, 2024.

EGU24-13202 | ECS | PICO | HS7.4

Flood risk assessment in the most heavily urbanized area of Greece, the case study of Kifissos river basin in Athens. 

Stavroula Sigourou, Alexia Tsouni, Vasiliki Pagana, Panayiotis Dimitriadis, G-Fivos Sargentis, Romanos Ioannidis, Efthymios Chardavellas, Dimitra Dimitrakopoulou, Nikos Mamasis, Demetris Koutsoyiannis, and Charalampos (Haris) Kontoes

Urban areas characterized by high density of population and infrastructure can be extremely prone to floods. The flood modeling and management of these areas present high complexity due to their distinctive features. Therefore, advanced methodologies for an accurate assessment of urban flood processes need to be developed. This study presents the methodology and the results for flood risk assessment at high spatial resolution of the Kifissos river basin in Greece. This is the largest one of the five flood-stricken river basins in the region of Attica that are studied in the framework of the Programming Agreement between the Prefecture of Attica and the Operational Unit BEYOND Centre of EO Research and Satellite Remote Sensing of the Institute of Astronomy, Astrophysics, Space Applications & Remote Sensing (IAASARS) of the National Observatory of Athens (NOA), in cooperation with the Research Group ITIA of the Department of Water Resources and Environmental Engineering of the School of Civil Engineering of the National Technical University of Athens (NTUA). Kifissos basin is highly urbanized (80% of the river basin), has been affected by forest fires over the last years, and contains a complex hydraulic network (60% of the total river network is artificial). Thus, the modelling of a river basin with many hydraulic works is a significant challenge, which needs to be addressed to simulate the current situation of the river flow and support the expanding constructions. HEC-RAS 6.4.1 hydraulic model is used for the flood hazard assessment for 50, 100 and 1000 years return period using earth observation, as well as spatial and field data. The vulnerability is estimated by combining different disaster resilience parameters, such as population density, population age and building type, applying different weights. Flood risk is assessed on the impact of hazard, total vulnerability, and economic exposure. Alongside the model’s results including the inundated areas, the flow depths and consequently the flood risk, critical points identified from the field visits are also presented and classified in risk priority. Thus, the presented results are cross-checked with the high-risk areas pointed out from the authorities as well as the civilians’ calls to the Fire Brigade for water pumping over the last 15 years.

How to cite: Sigourou, S., Tsouni, A., Pagana, V., Dimitriadis, P., Sargentis, G.-F., Ioannidis, R., Chardavellas, E., Dimitrakopoulou, D., Mamasis, N., Koutsoyiannis, D., and Kontoes, C. (.: Flood risk assessment in the most heavily urbanized area of Greece, the case study of Kifissos river basin in Athens., EGU General Assembly 2024, Vienna, Austria, 14–19 Apr 2024, EGU24-13202, https://doi.org/10.5194/egusphere-egu24-13202, 2024.

EGU24-14442 | ECS | PICO | HS7.4

Estimating the sensitivity of continental aridity to global warming using Budyko’s framework 

Tejasvi Ashish Chauhan and Axel Kleidon

Understanding the sensitivity of continental atmospheric aridity, the ratio of potential evaporation to precipitation in Budyko’s framework, to changes in temperature can help in quantifying the changes in the hydrological cycle and its extremes like droughts and floods in response to global warming. With rising temperature, land warms up faster than the ocean due to its different response of surface energy balance to diurnal changes in solar radiation. Thus, the potential evaporation, which represents atmospheric moisture demand, increases more over the land than the ocean. At the same time, global warming induced changes in the temperatures over land and ocean regions can alter the moisture supply to the atmosphere affecting the precipitation over land. Therefore, the sensitivity of continental atmospheric aridity to global warming is a superposition of relative changes in continental potential evaporation and precipitation in response to rising temperatures in both land and ocean regions. This work introduces an analytical framework based on Budyko’s aridity index to quantify the historical changes in continental aridity, and its sensitivity to global warming. We evaluate the proposed framework using observation-based datasets and our preliminary findings suggest that while changes in both potential evaporation and precipitation contribute to increase in the continental aridity with global warming, the relative changes in potential evaporation contribute more than relative changes in precipitation. These results point to the importance of considering both facets of aridity and highlight the utility of the Budyko’s framework in evaluating changes in hydrological cycle amid global warming.

How to cite: Chauhan, T. A. and Kleidon, A.: Estimating the sensitivity of continental aridity to global warming using Budyko’s framework, EGU General Assembly 2024, Vienna, Austria, 14–19 Apr 2024, EGU24-14442, https://doi.org/10.5194/egusphere-egu24-14442, 2024.

EGU24-15926 | ECS | PICO | HS7.4

Uncertainty Quantification of Theoretical Consistent Intensity Duration Frequency (IDF) Curves of Rainfall Intensity 

Bushra Amin, András Bárdossy, and Uwe Haberlandt

Many water-related systems and defensive structures require the design of rainfall amounts at various durations and frequencies, commonly referred to as Intensity Duration-Frequency (IDF) curves. Usually, these curves are derived from observed data, but there is a chance that the risk has been underestimated because of various uncertainty sources. As a result, measuring the uncertainty ranges of these curves becomes essential. To do this, the regionalization of the IDF curves for BW is inspected for the propagation of possible sources of uncertainty. For each site, annual extremes are obtained for varying durations (from 5 min to 16 days), and local extreme value analysis is performed in compliance with Koutsoyiannis et al. (2021).  Following this investigation, Kriging with External Drift (KED) is used to interpolate all seven parameters of theoretically consistent IDF models for each station; this implies that no parameter remains constant across the region.  Quantiles are then retrieved for every station, duration, and given recurrence interval. The uncertainty is estimated for each of the three components of the regionalization—local parameter estimation, variogram estimation, and spatial parameter estimation—in terms of accuracy (expected error) and precision (95% confidence interval width) using bootstrapping (non-parametric) and geostatistical spatial simulations. The reason for selecting Conditional Sequential Gaussian (CSG) simulations was their capability to produce a large number of equiprobable spatial simulations. Many recent studies also demonstrated its accuracy, which is why CSG was chosen to evaluate the uncertainty from spatial simulations. Subsequently, one hundred realizations were carried out at every regionalization component to examine their ultimate impact on the regionalization of parameters and IDF curves. Afterward, combined simulations were executed for the propagation of the uncertainty from the key components to the final IDF curves.

It turned out that the primary source of uncertainty in the selected regionalization process is spatial estimation, which is followed by local estimation of rainfall extremes. More specifically, the total estimation of IDF curves was mostly insensitive to variogram uncertainty. The integration of spatial simulations with local resampling yielded accurate estimates of the overall uncertainty at sampled sites, whereas at unsampled sites, the accuracy decreased based on the density and proximity of the surrounding observations. This combination was used to simulate the total uncertainty in BW via 100 runs. The results showed that, depending on the site and duration interval, tolerance ranges should be expected to be between ± 0.9-4.2 mm/h for low-recurrence intervals (less than 5 years) and ± 2.2-5.5 mm/h for high-recurrence intervals (more than 50 years), but very short durations (5 min) are relatively more uncertain than longer durations.

How to cite: Amin, B., Bárdossy, A., and Haberlandt, U.: Uncertainty Quantification of Theoretical Consistent Intensity Duration Frequency (IDF) Curves of Rainfall Intensity, EGU General Assembly 2024, Vienna, Austria, 14–19 Apr 2024, EGU24-15926, https://doi.org/10.5194/egusphere-egu24-15926, 2024.

EGU24-18860 | ECS | PICO | HS7.4

Precipitation changes in Greece over the past century; what type of stochastic description should we use?  

Panayiotis Dimitriadis, Demetris Koutsoyiannis, Theano Iliopoulou, and G.-Foivos Sargentis

In the presence of long-range dependence, several difficulties emerge in stochastic methods, especially in intermittent and highly-skewed processes, such as precipitation, which cannot be fully supported by the established models in the literature. Here, we analyze a large set of rainfall data in Greece comprising ground records as well as non-conventional data from reanalyses and satellite, and we identify cluster periods of droughts and wet-years in both extreme tails, raising the challenge for their stochastic description. In this light, and after statistical analysis of the whole dataset, we apply the latest version of a genuine stochastic method (i.e., direct use of the process of interest without any transformation, and with a focus on the long-range dependence under various stochastic behaviours; Koutsoyiannis and Dimitriadis, 2021), and we discuss on the implications of the results for future hydrological design scenarios.

Koutsoyiannis, D., and P. Dimitriadis, Towards generic simulation for demanding stochastic processes, Sci, 3, 34, doi:10.3390/sci3030034, 2021.

How to cite: Dimitriadis, P., Koutsoyiannis, D., Iliopoulou, T., and Sargentis, G.-F.: Precipitation changes in Greece over the past century; what type of stochastic description should we use? , EGU General Assembly 2024, Vienna, Austria, 14–19 Apr 2024, EGU24-18860, https://doi.org/10.5194/egusphere-egu24-18860, 2024.

EGU24-19687 | PICO | HS7.4

Investigating the Impact of Time Series Structure in Performance of Transformer-Based Model for River Streamflow Forecasting 

Nikolaos Tepetidis, Theano Iliopoulou, Panayiotis Dimitriadis, and Demetris Koutsoyiannis

River discharge forecasting plays a pivotal role in water resource management and environmental planning. Understanding the long-term dependence or changes in these processes is crucial for accurate predictions. Deep-learning methodologies have garnered significant scientific interest and are progressively becoming more prevalent across water-resources-related endeavors. Transformer models, a novel architecture that aims to track relationships in sequential data through attention mechanism, have increasing popularity last years. Through comprehensive experiments and analysis on real-world river discharge datasets, we aim to elucidate the impact of long-term dependence detection, as facilitated by the climacogram and Hurst coefficient, on the predictive capabilities of a transformer-based model. Insights from this investigation are anticipated to contribute to the advancement of river discharge forecasting methodologies, enhancing our understanding of long-term dependencies in these environmental processes.

How to cite: Tepetidis, N., Iliopoulou, T., Dimitriadis, P., and Koutsoyiannis, D.: Investigating the Impact of Time Series Structure in Performance of Transformer-Based Model for River Streamflow Forecasting, EGU General Assembly 2024, Vienna, Austria, 14–19 Apr 2024, EGU24-19687, https://doi.org/10.5194/egusphere-egu24-19687, 2024.

EGU24-82 | ECS | Orals | HS7.5

Proposal for a new meteotsunami intensity index. 

Clare Lewis

Atmospherically generated coastal waves labelled as meteotsunami are known to cause destruction, injury and fatality due to their rapid onset and unexpected nature. These progressive shallow water waves with a period of 2 to 120 minutes tend to be initiated by sudden pressure changes (±1 mb over a few tens of minutes) and wind stress from moving atmospheric systems out on the open water. As these waves arrive at the shoreline they are amplified by localised resonances. Unlike other related coastal hazards such as tsunami, there exists no standardised means of quantifying this phenomenon which is crucial for understanding its impacts and to establish a shared language and framework for meteotsunami analysis and comparison.

In this study, we present a new 5-level Lewis Meteotsunami Intensity Index (LMTI) primarily trialled in the United Kingdom (UK) but designed for global applicability. A comprehensive dataset of meteotsunami events recorded in the UK were verified and applied to the index which yielded results that identified a predominant occurrence of Level 2 or moderate intensity meteotsunamis (69%), with distinct hotspots identified in Southwest England and Scotland. Further trial implementation and calibration of the LMTI in a global capacity revealed its adaptability to other meteotsunami prone regions facilitating the potential for further research into preparedness and hazard mitigation strategies.

How to cite: Lewis, C.: Proposal for a new meteotsunami intensity index., EGU General Assembly 2024, Vienna, Austria, 14–19 Apr 2024, EGU24-82, https://doi.org/10.5194/egusphere-egu24-82, 2024.

EGU24-611 | ECS | Posters virtual | HS7.5

Hydrological Analysis of Monsoon Rain Spells in the Indian Ganga Basin over the Last Century 

Amit Kumar Maurya, Somil Swarnkar, and Shivendra Prakash

The Indian Ganga Basin (IGB) is a highly prominent socioeconomic region in the Indian subcontinent. The IGB supports about 500 million individuals by providing sufficient freshwater for agro-industrial activities, mainly through the contribution of Indian Summer Monsoon (ISM) rainfall, which accounts for around 85% of the total rainfall received throughout the IGB. Any modifications in ISM patterns would substantially impact the availability of freshwater, and consequently, the socio-economic activities of the IGB region will be affected. This study aims to evaluate the historical changes in the monsoon rainfall characteristics from 1901 to 2019. Here, we conducted a detailed rainfall analysis in different sub-basins of the IGB where changes in monsoon rain spells are most noticeable and examined the hydrological extremes. We found that monsoon rain spell peaks have significantly increased across the major sub-basins of the IGB after 1960, implying the increased probability of flash flood hazards. At the same time, the monsoon rain spell has been depleted across the IGB after 1960, especially in the lower Indo-Gangetic plains. These results imply a rise in the occurrence of droughts. In addition, our interpretations also indicate a growing potential for combined hydrological extremes in the IGB. Further, the continuous rise in temperature and human-induced perturbations might exacerbate the existing extreme hydrological conditions. Thus, the findings of this study will be beneficial in implementing river basin management methods to assess the complex patterns of major hydrological catastrophes in the IGB.

How to cite: Maurya, A. K., Swarnkar, S., and Prakash, S.: Hydrological Analysis of Monsoon Rain Spells in the Indian Ganga Basin over the Last Century, EGU General Assembly 2024, Vienna, Austria, 14–19 Apr 2024, EGU24-611, https://doi.org/10.5194/egusphere-egu24-611, 2024.

EGU24-669 | ECS | Orals | HS7.5

Assessing Local Community Vulnerability to Landslides and Floods: A Household Survey Approach in North-Western Rwanda  

Clemence Idukunda, Caroline Michellier, Emmanuel Twarabamenye, Florence De Longueville, and Sabine Henry

North-Western Rwanda's hilly and mountainous topography, high elevation, frequent torrential rainfall, and high population density render it highly susceptible to landslides and floods. A comprehensive understanding of community vulnerability to these hazards is crucial for effective risk assessment and mitigation strategies. To address data scarcity in the region, this study is based on a household survey approach that incorporates hazard-specific variables to compare vulnerability across three hazard categories: landslides, floods, and a combination of both. The survey encompasses 904 households across 50 cells (local administrative units), purposively selected according to hazard susceptibility distribution. Principal Component Analysis (PCA) was applied to derive a contextualized Social Vulnerability Index (SoVI). Five principal components accounting for 73.2% of the variance were identified. The first component, contributing 23.4%, highlights the vulnerability associated with unplanned settlements and low income. The second component, representing 19.5% of the variance, emphasizes demographic and social factors. The third component (12.6% of the variance) points to the vulnerability of households solely reliant on agriculture for their income. The fourth component (9% variance) is associated with land ownership, with households lacking land assets experiencing lower vulnerability. The fifth component (8.7% variance) underlines the relevance of household structure variables, indicating the high vulnerability of single-person households. SoVI scores classified 19 cells in the very high or high vulnerability category, predominantly those prone to landslides. These highly vulnerable cells are concentrated in the Northern Province, emphasizing the need to prioritize interventions in this region, such as effective land use planning and livelihood improvement strategies. This study provides a comprehensive vulnerability assessment and valuable insights for prioritizing interventions. The inclusion of hazard-specific variables and a comparative vulnerability approach across areas susceptible to landslides, floods, and both hazard types enhances the specificity and applicability of the findings. These insights are invaluable for local policymakers and disaster prevention and management authorities, enabling them to develop context-specific strategies to improve community resilience and reduce vulnerability to natural hazards.

Keywords: Community Vulnerability, Landslides, Floods, Noth-Western Rwanda, Social Vulnerability Index

How to cite: Idukunda, C., Michellier, C., Twarabamenye, E., De Longueville, F., and Henry, S.: Assessing Local Community Vulnerability to Landslides and Floods: A Household Survey Approach in North-Western Rwanda , EGU General Assembly 2024, Vienna, Austria, 14–19 Apr 2024, EGU24-669, https://doi.org/10.5194/egusphere-egu24-669, 2024.

EGU24-677 | ECS | Orals | HS7.5 | Highlight

A new climate impact database using generative AI 

Ni Li, Wim Thiery, Jakob Zscheischler, Gabriele Messori, Liane Guillou, Joakim Nivre, Olof Görnerup, Seppe Lampe, Clare Flynn, Mariana Madruga de Brito, and Aglae Jezequel

Storms, heat waves, wildfires, floods, and other extreme weather climate-related disasters pose a significant threat to society and ecosystems, which in many cases is being aggravated by climate change. Understanding and quantifying the impacts of extreme weather climate events is thus a crucial scientific and societal challenge. Disaster databases are extremely useful for establishing the link between climate events and socio-economic impacts. However, publicly available data on impacts is generally scarce. Apart from existing open disaster databases such as EM-DAT, robust data on the impacts of climate extremes can also be found in textual documents, such as newspapers, reports and Wikipedia articles. Here we present a new climate impact database that has been built based on multiple public textual entries using a pipeline of data cleaning, key information extraction and validation. In particular, we constructed the database by using the state-of-the-art generative artificial intelligence language models GPT4, Llama2 and other advanced natural language processing techniques. We note that our dataset contains more records in the early time period of 1900-1960 and in specific areas such as than the benchmark database EM-DAT. Our research highlights the opportunities of natural language processing to collect data on climate impacts, which can complement existing open impact datasets to provide a more robust information on the impacts of weather and climate events.

How to cite: Li, N., Thiery, W., Zscheischler, J., Messori, G., Guillou, L., Nivre, J., Görnerup, O., Lampe, S., Flynn, C., Madruga de Brito, M., and Jezequel, A.: A new climate impact database using generative AI, EGU General Assembly 2024, Vienna, Austria, 14–19 Apr 2024, EGU24-677, https://doi.org/10.5194/egusphere-egu24-677, 2024.

Climate change, an increasing urban population, and poor urban planning have increased flood-risk and the accompanying solid waste challenge in many coastal urban areas in developing countries. These challenges are more pronounced in informal settlements because: (a) they are often built on environmentally fragile locations such as river banks and coastal shores with high exposure to floods, (b) high poverty levels among residents resulting in low adaptive capacity, and (c) marginalisation of these localities emanating from their non-recognition in the larger city framework. Against this background, flood-risk assessments and response initiatives in these areas have primarily been informed by scientific approaches such as geographical information systems, without adequate incorporation of other forms of knowledge. Using the case of the coastal city of Durban, South Africa, our project explores the benefits of combining perspectives from different knowledge systems in understanding flood-risk and the accompanying solid waste challenge in urban informal settlements, towards developing solutions that are based on contextual and experiential aspects. Methodological techniques used include interviews and workshops with key experts and with informal settlement residents, and extensive reviews of literature.  Emerging findings show that holders of scientific, practitioner, and local knowledge vis-à-vis flood risk and waste management are active in the selected case study informal settlement. They have, in isolated cases, collaborated particularly around a) generation and distribution of flood early warnings, b) river clean-up initiatives, and c) catchment rehabilitation projects, with clear benefits for flood resilience and solid waste management. We find that there is need for a clear framework for integrating knowledge systems towards flood resilience and solid waste management in these contexts and the project has developed a draft framework. Integrating knowledge systems will: i) ensure the participation of different actors in mapping flood risk thereby creating a sense of ownership and ensuring uptake of and support for solutions crafted to deal with flood risk and the solid waste challenge; and ii) open up opportunities for coordinated support from various actors for a range of decisions around flood risk response preparation, flood and waste infrastructural design and mitigation of waste-induced flood destruction of infrastructure.

How to cite: Johnson, K. and Nyamwanza, A.: Integrated knowledge systems towards flood resilience and sustainable solid waste management in South African urban informal settlements, EGU General Assembly 2024, Vienna, Austria, 14–19 Apr 2024, EGU24-867, https://doi.org/10.5194/egusphere-egu24-867, 2024.

EGU24-2163 | ECS | Posters on site | HS7.5

Climate risk-reduction potential of gridded precipitation data for agricultural index-based insurance development 

Sarvarbek Eltazarov, Ihtiyor Bobojonov, and Lena Kuhn

Index insurance has been introduced as an innovative and potential solution to mitigate several challenges caused by climate change in the agricultural sector. Despite the promising potential of index insurance, dissemination in developing countries is slow due to a lack of reliable weather data, which is essential for the design and operation of index insurance products. The increasing availability of model- and satellite-based data could ease the constraints of data access. However, their accuracy and suitability have to undergo a thorough assessment. Therefore, this study statistically and financially analyzes and compares the risk reduction potential of index insurance products designed employing various in-situ-, model- and satellite-based precipitation products (e.g., CMOPH, CPC, IMERG, GSMaP, MERRA, GLDAS, ERA5, PERSIANN, MSWEP, and MERRA2). This study employed county-level spring wheat yield data between 1982 and 2018 from 56 counties overall in Kazakhstan and Mongolia. The results showed that in the majority of cases in both countries, the hedging effectiveness of index insurance products designed based on IMERG is the highest. Moreover, among other data sources, the index insurance products designed using the PERSIANN, GLDAS and FLDAS showed higher risk reduction potential. Overall, this study highlights that satellite- and model-based precipitation products have higher accuracy and potential for index insurance design and operation than in-situ-based precipitation data.

How to cite: Eltazarov, S., Bobojonov, I., and Kuhn, L.: Climate risk-reduction potential of gridded precipitation data for agricultural index-based insurance development, EGU General Assembly 2024, Vienna, Austria, 14–19 Apr 2024, EGU24-2163, https://doi.org/10.5194/egusphere-egu24-2163, 2024.

A severe and complex, polygenetic flood event occurred in Muktinath area of Mustang, Nepal on the evening of August 13, 2023 causing significant damage to property and infra-structures worth approximately of USD 7.4 million at Kagbeni Village, which is nestled along both banks of Kagkhola, a major left bank tributary of the Kali Gandaki River. About 29 houses, 1 motorable bridge, 1 steel truss bridge and 3 temporary bridges were destroyed, while more than 25 cows and other livestock were killed. Fortunately, human lives were spared because the community was warned to move to safety before the mud and sludge hit the village. A study was conducted in order to know what had caused this unusual flash-flood in Mustang. Kagbeni (2810 m) lies in the north Himalayan, rain-shadow area and normally receives few rainfall (<300 mm/yr). However, for several years, the trend (confirmed by local residents) has been towards increased rainfall, leading to more landslides and floods. Although rainfall data from the nearest monitoring station, Jomsom (2720 m), shows that rainfall was high, there is not detailed information about the rainfall amount at Jhong (3600 m), and Muktinath  (3760 m), source area of Kagbeni flood. From the video taken there (Jhong, Muktinath) during this flash-flood event (hyper-concentrated flow), it can be concluded that it was a landslide lake outburst flood. However due to the difficult terrain and inaccessible path, it has not yet been possible to visit the source area of the landslide in detail. Heavy rainfall over a short period and flash-flood-like disasters are becoming a trend in the mountain regions in Nepal. Furthermore, this part of Mustang is fragile (Spiti shales), and heavy rainfalls have an immediate impact, since there is little soil to absorb the excess water. Former studies have also shown that temperature in Mustang is rising which is causing the monsoon air to move northward and upward. As a result, more rainfall is taking place in Trans-Himalayan areas like Mustang and Manang (North of Annapurna Himal, 8091 m). Therefore, it is believed that climate change and the rise in temperature could be the significant reasons for heavy rainfall that caused such a flash-flood in Kagbeni, Mustang. On the other hand, people are inviting disaster in Kagbeni by settling on the very low terraces or in flood-plains and encroaching on the bed of the local Kagkhola. Given the fragile geology of upstream area of Kagkhola, ongoing anthropogenic activities (agriculture and tourism) and the effect of climate change, the possibility of flash floods reoccurring in the future at Kagbeni remains high. Sadly, locals at Kagbeni have already started rebuilding houses damaged by the recent Kagbeni flood and continue to live in potentially threatened flood plains.   

How to cite: Fort, M., Gurung, N., Arnaud-Fassetta, G., and Bell, R.: Retrospect of the polygenetic Kagbeni flood event (August 13, 2023) in Mustang, Nepal. Are rapid hydromorphological processes relays and sediment cascades in the catchment well taken into account in the risk equation?, EGU General Assembly 2024, Vienna, Austria, 14–19 Apr 2024, EGU24-2563, https://doi.org/10.5194/egusphere-egu24-2563, 2024.

EGU24-3076 | ECS | Orals | HS7.5

Assessing Surface Drainage Efficiency in Urban Pluvial Flood Hazard and Risk Mitigation: A Case Study of Braunschweig City 

Shahin Khosh Bin Ghomash, Heiko Apel, Kai Schroeter, and Max Steinhausen

Due to rapid urbanization and the increase of extreme precipitation events driven by climate change, urban areas have experienced more frequent and severe pluvial floods in recent years. This trend is anticipated to continue in the future. One of the causes of flooding in these urban zones is the limited effectiveness or temporary reduction in surface drainage capacity, even when storm sewers adhere to technical standards. A notable instance was the June 2023 flooding in Braunschweig, situated in Lower Saxony, Germany, where the city received 60 liters per square meter of rainfall within a short time span, largely excessing sewer system capacity and leading to widespread inundation.

This research investigates the impact of implementing diverse strategies aimed at expanding urban drainage capacity to mitigate pluvial flood risk in Braunschweig. To accomplish this, a moderately detailed hydrodynamic model for the city was set up using the RIM2D hydrodynamic model, allowing for quick computational processing times which enabled the exploration of various measures through sensitivity analysis. The setup involved employing a high-resolution digital elevation model and various remote sensing data for land classification. The model incorporated high-resolution precipitation radar data from the 2023 event and additional precipitation scenarios of varying occurrence probabilities. Validation of the model against available event data and existing flood hazard maps specific to Braunschweig was conducted.

The validated model was then utilized to assess the effectiveness of different surface de-sealing scenarios within the city. These scenarios aim to enhance drainage capacity by means of increased infiltration to complement the existing sewer drainage system. The evaluation of these de-sealing scenarios focused on reducing surface inundation and anticipated damage, serving as a foundational aspect for conducting a cost-benefit analysis and detailed planning. This analysis can contribute to future-oriented urban pluvial flood risk management plans for the city.

How to cite: Khosh Bin Ghomash, S., Apel, H., Schroeter, K., and Steinhausen, M.: Assessing Surface Drainage Efficiency in Urban Pluvial Flood Hazard and Risk Mitigation: A Case Study of Braunschweig City, EGU General Assembly 2024, Vienna, Austria, 14–19 Apr 2024, EGU24-3076, https://doi.org/10.5194/egusphere-egu24-3076, 2024.

EGU24-3170 | ECS | Orals | HS7.5

Influences of moisture transport on changes in extreme precipitation in Central Plains Urban Agglomeration, China  

Yufan Chen, Shuyu Zhang, Deliang Chen, and Junguo Liu

In recent decades, the Central Plains Urban Agglomeration of China (CPUA) has faced recurring extreme precipitation events (EPEs), causing severe flood disasters, endangering residents, and inducing significant property losses. This study examines the spatiotemporal patterns of summer EPEs in the CPUA from 1961 to 2022. The Hybrid Single-Particle Lagrangian Integrated Trajectory model was used to trace the water vapor trajectories associated with these events and the atmospheric circulations linked to diverse moisture transports were identified. The findings reveal an overall increase in both the intensity and frequency of summer EPEs, particularly intensifying over urban areas while displaying more frequent yet weaker precipitation in mountainous regions. Moisture contributing to these events originates from sources including Eurasia, the northern and southern Western North Pacific, as well as the Bay of Bengal and South China Sea. Notably, contributions from Eurasia and the Northern Western North Pacific have increased, whereas those from the Bay of Bengal and the South China Sea have decreased. Events fueled by Western North Pacific moisture show intensified impacts on urban areas, driven by anomalous anticyclonic patterns and the formation of the Huang-Huai cyclone, inducing vigorous convective activity over the CPUA. The proliferation of the Western North Pacific Subtropical High facilitates warm air transport, converging with colder air from inland areas, resulting in extreme precipitation.

How to cite: Chen, Y., Zhang, S., Chen, D., and Liu, J.: Influences of moisture transport on changes in extreme precipitation in Central Plains Urban Agglomeration, China , EGU General Assembly 2024, Vienna, Austria, 14–19 Apr 2024, EGU24-3170, https://doi.org/10.5194/egusphere-egu24-3170, 2024.

EGU24-3602 | ECS | Posters on site | HS7.5

FLOODGAMA: the new INUNGAMA. Beyond a flood events database for Catalonia 

Montserrat Llasat-Botija, Maria Carmen Llasat, Dimitri Marinelli, Raül Marcos, Carlo Guzzon, and Albert Díaz

Floods represent a complex natural hazard, influenced not only by meteorological factors but also by geophysical aspects such as terrain topography, social factors such as the value of exposed assets, and cultural factors like risk awareness. For this reason, the study of these phenomena requires a holistic approach. This requires the correct organization of the information. In addition, given that the information comes from different sources, the traceability of the data must also be contrasted and preserved in order to guarantee its quality and robustness. Databases make it possible to conserve and document historical information, to analyze it and to support smart flood risk management.

With this objective in mind, in 2000 the GAMA team developed the INUNGAMA flood database, following the example of other natural hazards databases. This communication will present the new version of this database, FLOODGAMA, and the main results of its analysis. FLOODGAMA contains information on 456 flood events that affected Catalonia (NE of Spain), between 1900 and 2020, which have caused 1,253 casualties. The events are classified according to the impacts. It includes linked tables with information on event dates, descriptions, fatalities, economic damages, affected municipalities, recorded rainfall and recorded flow. Other tables contain historical marks, codifications and the geographical information of municipalities, counties, basins and rivers, as well as meteorological stations. Its structure has been simplified and standardized with Python and migrated to PostgreSQL (PostGIS) from an ACCESS format. The new database allows for more general and straightforward analysis, introduces GIS tool compatibility, and simplifies the addition of new data and new data sources. This last point has been one of the key points in this transformation as it will provide the database with the flexibility to respond to the challenges posed by the digital transformation that is currently taking place and as a tool for the improvement of adaptation.

The contribution shows the structure of this flood database and the results obtained after its analysis that allows the characterization of flood events in Catalonia.

This research has been done in the framework of the C3Riskmed project, Grant PID2020-113638RB-C22 funded by MCIN/AEI/10.13039/501100011033 and Flood2Now project, Grant PLEC2022-009403 funded by MCIN/AEI/10.13039/501100011033 and by the European Union Next Generation EU/PRTR.

How to cite: Llasat-Botija, M., Llasat, M. C., Marinelli, D., Marcos, R., Guzzon, C., and Díaz, A.: FLOODGAMA: the new INUNGAMA. Beyond a flood events database for Catalonia, EGU General Assembly 2024, Vienna, Austria, 14–19 Apr 2024, EGU24-3602, https://doi.org/10.5194/egusphere-egu24-3602, 2024.

EGU24-3951 | ECS | Orals | HS7.5

Multi-day precipitation extremes ranking and their association with atmospheric moisture fluxes over India 

Tomás Gaspar, Ricardo M. Trigo, Alexandre M. Ramos, Akash Singh Raghuvanshi, Ana Russo, Pedro M.M. Soares, Tiago Ferreira, and Ankit Agarwal

The Indian subcontinent is characterized by a pronounced summer monsoon season with substantial rainfall from June to September and a less intense autumn monsoon, albeit both posing major challenges to the densely populated regions through flash floods and landslides. During monsoons, different regions of India are affected by extreme precipitation events with distinct durations and triggered by several mechanisms. Here, considering 10 different regions of India characterized by different climatic regimes, we apply an objective ranking of extreme precipitation events, across various time scales, ranging from 1 to 10 days, making use of a high-resolution daily precipitation dataset covering the entire Indian territory from 1951 to 2022. The results confirm that the method accurately detects and ranks the most extreme precipitation events in each region, providing information on the daily evolution of the magnitude (and spatial extent affected) of high precipitation values in each region. Moreover, results show that top rank events can be associated with different types of storms affecting the four main coastal regions of India. In particular, some top rank events can be critically linked to long duration events (e.g., 10 days), which can be missed in ranks for shorter duration (e.g., 1-3 days) periods, thus stressing the need to employ multi-day precipitation extremes ranking. Finally, an in-depth analysis of the large-scale atmospheric circulation and moisture transport is presented for the top 10-day events affecting four coastal regions of India. Overall, we are confident that our findings are valuable in advancing disaster risk reduction strategies, optimizing water resource management practices, and formulating climate change adaptation strategies specifically tailored for the Indian subcontinent.


R.M.T., A.R., S.P. and A.T.M. thank Fundação para a Ciência e a Tecnologia (FCT) I.P./MCTES through national funds (PIDDAC) – UIDB/50019/2020 (https://doi.org/10.54499/UIDP/50019/2020) and LA/P/0068/2020 (https://doi.org/10.54499/LA/P/0068/2020). A.R. and R.M.T. thank also FCT (https://doi.org/10.54499/2022.09185.PTDC, http://doi.org/10.54499/JPIOCEANS/0001/2019, https://doi.org/10.54499/DRI/India/0098/2020). A.R. was supported by FCT through https://doi.org/10.54499/2022.01167.CEECIND/CP1722/CT0006.


How to cite: Gaspar, T., M. Trigo, R., M. Ramos, A., Singh Raghuvanshi, A., Russo, A., M.M. Soares, P., Ferreira, T., and Agarwal, A.: Multi-day precipitation extremes ranking and their association with atmospheric moisture fluxes over India, EGU General Assembly 2024, Vienna, Austria, 14–19 Apr 2024, EGU24-3951, https://doi.org/10.5194/egusphere-egu24-3951, 2024.

EGU24-5587 | ECS | Orals | HS7.5

Socio-Economic Vulnerability assessment and validation in Seoul, South Korea  

Chi Vuong Tai, Dongkyun Kim, Soohyun Kim, Yongchan Kim, Hyojeong Choi, and Jeonghun Lee

Vulnerability is regarded as a crucial element in disaster risk reduction, garnering increasing attention from researchers. However, these assessments typically conclude with the spatial representation and analysis of vulnerability index values, with very few attempts made on vulnerability validation. This study has employed Principal Component Analysis (PCA) algorithm for the entire 38 selected socio-economic features, resulting in 9 principal components (or factors) to estimate Socio-Economic Vulnerability Index (SEVI). The results reveal consistent vulnerability levels in over half of the dongs (administrative units), compared with SEVI estimated from a subjective weighting scheme based on expert experience. Meanwhile, the remaining dongs exhibit a change in only one level of vulnerability. SEVI values and ranks from PCA were subsequently internally validated through global uncertainty and sensitivity analyses using Monte Carlo method. The vulnerability scores of all input features were randomly generated based on their fitted probability distribution functions, serving as input parameters for 39,936 Monte Carlo simulations. The median statistic was employed to evaluate the vulnerability uncertainty based on both bias of estimated SEVI values and ranks in comparison with simulated data. The findings from this analysis revealed that medium-low and medium vulnerability levels tend to be underestimated, while medium-high and high levels primarily witness an overestimation tendency. The bias in SEVI ranks was further employed to assess the vulnerability uncertainty. In the sensitivity test, a tornado diagram was created to illustrate the explanation of each feature to the overall SEVI variability. The results indicate that the feature with highest explanation of SEVI variability is the number of families with only children and a mother, accounting for more than 5%. The methodology employed in this study is applicable to areas with limited social and economic data sources. Based on our findings, we suggest that the areas with low bias on SEVI values or ranks are reliable for developing disaster risk mitigation strategies, while other areas require further consideration. Additionally, the results from the sensitivity test provide valuable support for future research when selecting input features for socio-economic vulnerability assessment.

Acknowledgement:

This study was supported by: (1) The National Research Foundation of Korea (NRF) grant funded by the Korea government (MSIT) (No. NRF-2022R1A4A3032838) (50 % grant); (2) Korea Environment Industry & Technology Institute (KEITI) through R&D Program for Innovative Flood Protection Technologies against Climate Crisis Project, funded by Korea Ministry of Environment (MOE) (RS-2023-00218873) (50 % grant).

How to cite: Vuong Tai, C., Kim, D., Kim, S., Kim, Y., Choi, H., and Lee, J.: Socio-Economic Vulnerability assessment and validation in Seoul, South Korea , EGU General Assembly 2024, Vienna, Austria, 14–19 Apr 2024, EGU24-5587, https://doi.org/10.5194/egusphere-egu24-5587, 2024.

EGU24-5774 | Orals | HS7.5

myDewetra-VOLTALARM: a transboundary impact-based early warning system increasing resilience of Volta basin communities against hydrometeorological hazards 

Anna Mapelli, Andrea Libertino, Giulia Ercolani, Mirko D'Andrea, Nicola Testa, Matteo Darienzo, Simone Gabellani, Marco Massabò, Rafatou Fofana, Salifou Dene, Boukary Niampa, Maxime Teblekou, and Ramesh Tripathi and the Voltalarm member states national agencies

The Volta Basin, spanning six countries in West Africa, faces significant challenges from both floods and extreme precipitation. To address these challenges, the myDewetra-VOLTALARM system was developed as a collaborative transboundary early warning system (EWS) through the joint efforts of an international Consortium, composed by the Volta Basin Authority (VBA), the Global Water Partnership for West Africa (GWP-WA) and the World Meteorological Organization (WMO), and national institutions of the six riparian countries.  

myDewetra-VOLTALARM embraces an impact-based forecasting approach, focusing on the potential consequences of severe hydrological events on vulnerable communities. This is achieved through state-of-the-art hydro-meteorological modelling chain generating precipitation and discharge forecast with lead times of up to five days, coupled with impact assessment tools that translate these forecasts into actionable warnings based on real-time risk information for sectors like civil protection, agriculture and livelihoods, protected areas. By focusing on potential impacts,  myDewetra-VOLTALARM empowers stakeholders to make risk-informed decisions and implement timely mitigation actions, thereby reducing vulnerabilities and enhancing community resilience. The strength of myDewetra-VOLTALARM hinges on the collaboration, built-up through the implementation process, among the riparian countries, fostering data exchange and enabling a comprehensive understanding of hydrological dynamics across the entire basin. Harmonized risk assessments lead to consistent warning products and mitigation strategies, while the publication of the results on the open-source  myDewetra-VOLTALARM platform ensures transparency and accessibility for all stakeholders. 

A cornerstone of myDewetra-VOLTALARM's impact is the co-produced flood and heavy rainfall impact bulletin, issued jointly by national and regional authorities twice per week. This bulletin provides critical information, enriching and validating the model results with the expertise and local information/measurements of the national institutions, on which the Volta Basin Authority bases its advisories, tailored to specific locations and sectors. The Flood and Heavy Rainfall Impact Bulletin ensures a consistent flow of information at the basin scale and it integrates in the existing national procedures for early warning and civil protection, allowing all the stakeholders to stay informed and adapt their preparedness measures as the hydrometeorological situation evolves. 

myDewetra-VOLTALARM serves as a model for effective early warning systems in shared river basins. Its impact-based forecasting, transboundary cooperation, and co-produced Flood and Heavy Rainfall Impact Bulletin hold the potential to significantly reduce the impacts of floods and extreme precipitation, contributing to a more resilient and sustainable future for the Volta Basin communities.

How to cite: Mapelli, A., Libertino, A., Ercolani, G., D'Andrea, M., Testa, N., Darienzo, M., Gabellani, S., Massabò, M., Fofana, R., Dene, S., Niampa, B., Teblekou, M., and Tripathi, R. and the Voltalarm member states national agencies: myDewetra-VOLTALARM: a transboundary impact-based early warning system increasing resilience of Volta basin communities against hydrometeorological hazards, EGU General Assembly 2024, Vienna, Austria, 14–19 Apr 2024, EGU24-5774, https://doi.org/10.5194/egusphere-egu24-5774, 2024.

EGU24-6088 | ECS | Posters on site | HS7.5

Modelling and Prediction of Unprecedented Heavy Rainfall Event Over North India  

Rohtash Saini and Raju Attada

Widespread and multi-day heavy rainfall events, recorded during 08-09 July 2023 in northwest India, significantly impacted Himachal Pradesh, Punjab, and the Chandigarh region. These events resulted in devastating floods and extensive landslides, causing a substantial loss of lives and properties. Understanding such extreme weather phenomena is imperative for enhancing predictive capabilities and mitigating associated impacts. However, due to the complex topography of the Himalayas and limited observational data, poses challenges for investigating precipitation extremes. Against the background, in this study, we employ the Weather Research and Forecasting (WRF) model to investigate the atmospheric processes that led to unprecedented extreme precipitation. The innermost domain is configured with a horizontal grid spacing of 3 km, successfully reproduces the observed extreme rainfall. To assess the performance of different microphysics schemes in capturing key characteristics associated with heavy rainfall events, sensitivity experiments were conducted with five distinct schemes. Preliminary findings reveal that the Goddard microphysics scheme demonstrates good agreement with observations, closely followed by the Thompson scheme. Statistical analyses, including skill scores, further suggest that the Goddard microphysics scheme skillfully simulates the observed rainfall, displaying robust reflectivity values exceeding 35 dBZ in the core regions. The strong reflectivity indicates substantial hydrometeor concentrations, suggesting potential locations of deep convective activity associated with heavy rainfall. Detailed results of simulating the rainfall extremes over northwest India, along with feasible mechanisms influencing atmospheric conditions during extreme will be comprehensively discussed.

How to cite: Saini, R. and Attada, R.: Modelling and Prediction of Unprecedented Heavy Rainfall Event Over North India , EGU General Assembly 2024, Vienna, Austria, 14–19 Apr 2024, EGU24-6088, https://doi.org/10.5194/egusphere-egu24-6088, 2024.

EGU24-6148 | ECS | Posters on site | HS7.5

Functionality assessment of road network combining flood roadworthiness and graph topology 

Ke He, Maria Pregnolato, Neil Carhart, Jeffrey Neal, and Raffaele De Risi

In the realm of critical infrastructure, the road network plays an indispensable role in facilitating daily activities, communication, and economic interactions. However, it remains susceptible to the persistent challenge of flood hazards, leading to both structural and non-structural damages (e.g., physical collapse and service interruption). In normal flood disasters, physical collapse may not occur, but service interruptions often occur. Such disruptions manifest in the form of increased travel distances, prolong the travel times, and, in severe cases, complete travel impossibility. This has resulted in a reduction in transportation efficiency, leading to an increase in the social cost of transportation.

This study presents a novel approach that integrated flood hazard, transportation network topology, and vehicle vulnerability to evaluate the functionality of road network. A severity factor is defined to assess the accessibility of expected links (roads and bridges), considering different vehicle types such as cars and SUVs. Then, this study analyses the overall road network functionality loss under varying flood return periods by evaluating the severity of each network link based on the different types of vehicles. Identification of links with the lowest functionality allows for the assessment of the entire network’s performance using topology-based measures, including the average node degree, average clustering, average shortest path, and reachable areas (isochrones). This research employs the transportation network of Bristol, UK, as a case study to investigate the dynamic relationship between the network status and vehicle typology in the context of flooding events. Findings reveal a discernible correlation, wherein the resilience of the network in influenced by the specific characteristics of different vehicle types. Notably, SUVs emerge as inherently more resistant to flood-related disruptions compared to conventional cars.

The insights presented in this paper hold significant implications for the development of robust mitigation strategies geared towards bolstering the resilience of road networks and optimizing the rerouting of emergency response vehicles in flood-prone areas. By elucidating the interplay between vehicle characteristics, network functionality, and flood impacts, the research provides a foundation for informed decision-making in the formulation and implementation of effective preparedness measures. The outcomes of this study offer a strategic roadmap for authorities and policymakers, enabling them to proactively address the challenges posed by future flood events and enhance the overall adaptability and responsiveness of road networks in emergency situations.

How to cite: He, K., Pregnolato, M., Carhart, N., Neal, J., and De Risi, R.: Functionality assessment of road network combining flood roadworthiness and graph topology, EGU General Assembly 2024, Vienna, Austria, 14–19 Apr 2024, EGU24-6148, https://doi.org/10.5194/egusphere-egu24-6148, 2024.

EGU24-7026 | ECS | Orals | HS7.5

Characteristics of Disaster-causing Heavy Rainfall in Taipei City and Its Application 

Chi-June Jung, Radiant Rong-Guang Hsiu, Yu-Cheng Kao, Mon-Liang Chiang, Wen-Bin Hung, Jing-Ting Wang, and Ben Jong-Dao Jou

The most challenging weather phenomenon for disaster response in Taipei City is localized short-duration heavy rainfall. The capacity of each administrative district to withstand rainfall intensity varies, leading to incidents of flooding even when the rainfall falls short of the designed protection standard of 78.8 mm/h for drainage systems. To enhance disaster response, the Taipei City Fire Department conducts investigations and reports based on rainfall conditions. By integrating the intelligence and reporting system and raising the dispatching standard from 20 to 40 mm/h, the "Heavy Rainfall Response Process Improvement" project has successfully reduced response operation time and alleviated service burdens, advocating for adopting higher standards.

This study explores the correlation between intense rainfall and disaster occurrences, examining thunderstorm events that caused significant flooding in over three administrative districts. The study compares the earliest reported flooding time in each district with the corresponding rainfall, revealing that several districts experienced flooding with less than 60 mm/h of rainfall at the onset, indicating heightened vulnerability. Additionally, the study delves into the relationship between rainfall patterns and disaster potentials. When it accumulates 40 mm of rainfall within 30 minutes, there is a 63% chance of reaching 60 mm accumulation in the following 10 to 20 minutes. This analysis underscores the potential application of cumulative rainfall within the first 30 minutes for predicting subsequent rainfall trends and issuing disaster warnings.

How to cite: Jung, C.-J., Hsiu, R. R.-G., Kao, Y.-C., Chiang, M.-L., Hung, W.-B., Wang, J.-T., and Jou, B. J.-D.: Characteristics of Disaster-causing Heavy Rainfall in Taipei City and Its Application, EGU General Assembly 2024, Vienna, Austria, 14–19 Apr 2024, EGU24-7026, https://doi.org/10.5194/egusphere-egu24-7026, 2024.

EGU24-7347 | Posters on site | HS7.5

Impacts comparison by using different hydraulic models on the 2011 flood in Thailand 

Morgane Terrier and Mathis Joffrain

The 2011 flood event in Thailand was devastating both in terms of lives and economic losses. Following this event, the (re)insurance industry have deeply transformed its underwriting practices and used new modeling tools, both external and internal.

A loss is linked both to hazard and sites characteristics. As an insurer's exposure changes, losses for the same event can differ greatly from past observations. Therefore, hazard maps representing a past event can be used to estimate losses as of today.

Building an internal flood risk model requires to create a large set of spatial grids of flood depth. The water depth spatialisation, based on the water level of identified rivers, is a crucial part of the modeling and called the hydraulic modeling.

This poster will :

(i) the use of two hydraulic models to obtain a flood footprint: The software Super-Fast Inundation of CoastS (SFINCS) (Leijnse et al., 2021), a 2D open-source fast numerical model, and LISFLOOD-FP (Bates, 2004).

(ii) calculate insured losses on a fictive portfolio in Thailand using these two models with the same inputs.

(iii) describe and explain the discrepancies steming from (ii).

How to cite: Terrier, M. and Joffrain, M.: Impacts comparison by using different hydraulic models on the 2011 flood in Thailand, EGU General Assembly 2024, Vienna, Austria, 14–19 Apr 2024, EGU24-7347, https://doi.org/10.5194/egusphere-egu24-7347, 2024.

EGU24-7770 | Posters on site | HS7.5

Historical database for multi-hazard zonation and damage trend analysis in a Mediterranean study area (southern Italy) 

Olga Petrucci, Massimo Conforti, Giovanni Cosentini, and Graziella Emanuela Scarcella

The occurrence of extreme hydro-meteorological events is globally on the rise, due to the combined effects of climate change and increasing urban development in vulnerable areas. Each year, landslides, floods, urban flooding, storm surges, snow and thunderstorm events cause casualties, huge damage to urban areas, farmland, and communication infrastructures. This work presents the preliminary results of an historical research aiming to identify the series of geo-hydrological events which affected the municipality of Catanzaro (Calabria, South Italy), having an area of 112.7 km2 and a population density of 746.84 ab./km², throughout the latest two Centuries. The purpose is to implement a GIS-platform using the historical series of past events to realize density maps resulting is a zonation of municipal area which depict the vulnerability of municipal sectors per type of damaging phenomena and type of damaged elements, and their trends throughout the decades. We firstly extracted those events contained in the database named ASICal (Italian acronym of historically flooded areas), a catalogue collecting damaging geo-hydrological events occurred in Calabria in the latest centuries and maintained by CNR-IRPI researchers. Then, to improve and enrich our series, we performed an historical research throughout the documents of the State Archive of Catanzaro. As a total, we gathered data about around 270 events which occurred in the study area between 1830 to 2023, highlighting the strong territorial vulnerability of the selected area. Considering the average number of events per year as a proxy of events impact, we can observe as this value increases during the study period, moving from one event per year (in the period 1900 – 1950) to 3 events per year (in the period 1950 – 2023). To be uploaded in the GIS platform and mapped, the 270 events were split in around 1500 records, according to the kind of damaging phenomena (flood, landslide, urban flooding, storm surges, snow, thunderstorm) and the affected place. 44% of cases were widespread events, while the remaining 56% affected single sites. Urban flooding seems the most frequent damaging phenomena (68% of records), followed by landslides (21%), while the other phenomena show lower frequencies. As far as damaged elements, the most frequently affected were public and private buildings (64%) and road and railway network (26%), while people were affected in a few cases (5%). Data elaboration as multi-hazard maps, also crosschecked to either physical or anthropogenic data can be used to identify hazard-prone areas and to support the multi risk management in terms of monitoring, planning of remedial works, and realization/updating of civil protection plans, as far as in the realization of educational campaigns aiming to raise people awareness.

This work was funded by the Next Generation EU—Italian NRRP, Mission 4, Component 2, Investment 1.5, call for the creation and strengthening of ‘Innovation Ecosystems’, building ‘Territorial R&D Leaders’ (Directorial Decree n. 2021/3277)—project Tech4You—Technologies for climate change adaptation and quality of life improvement, n. ECS0000009. This work reflects only the authors' views and opinions, neither the Ministry for University and Research nor the European Commission can be considered responsible for them.

How to cite: Petrucci, O., Conforti, M., Cosentini, G., and Scarcella, G. E.: Historical database for multi-hazard zonation and damage trend analysis in a Mediterranean study area (southern Italy), EGU General Assembly 2024, Vienna, Austria, 14–19 Apr 2024, EGU24-7770, https://doi.org/10.5194/egusphere-egu24-7770, 2024.

EGU24-8205 | ECS | Posters on site | HS7.5

A Multi-Criteria Analysis procedure for the evaluation and classification of flood risk mitigation strategies 

Alice Gallazzi, Daniela Molinari, Francesco Ballio, Marina Credali, Immacolata Tolone, Simona Muratori, and Panagiotis Asaridis

The study aims to provide the Lombardy Region, the primary stakeholder in the project, with a procedure for evaluating and classifying structural flood risk mitigation measures. The primary objective is to assist the regional authority in identifying priority interventions for public funding. A step-by-step procedure has been developed to assess and rank all projects submitted to the Region, selecting priority projects based on technical considerations—evaluating feasibility, effectiveness, and sustainability of the proposed measures—and the preferences of policymakers. The assessment procedure's conceptual structure was tested using case studies, including both feasibility studies and executive projects, to determine the level of technical insights required at each planning phase of public works. The methodology relies on Multiple Criteria Analysis (MCA) techniques, enabling the simultaneous consideration of various, non-directly comparable criteria in a complex decision-making context. These criteria encompass technical features of proposed works, potential territorial constraints, and interferences in the intervention area (feasibility); the effectiveness of measures in reducing flood risk and associated costs; and the environmental and social co-benefits and disbenefits of each intervention (sustainability). Specific indicators, either ad hoc defined for the study or referenced from current regulations and guidelines at national and regional levels, are employed to evaluate the criteria. Stakeholder participation, particularly from the Region, River District Authorities, and Municipalities, is crucial throughout the process, especially in the final phase of aggregating (weighting) all criteria. This aggregation produces an overall performance score for each option, enabling the derivation of a regional ranking of flood risk mitigation strategies. The collaboration between academia and public institutions is highlighted as essential for enhancing the efficiency of disaster risk reduction policies.

How to cite: Gallazzi, A., Molinari, D., Ballio, F., Credali, M., Tolone, I., Muratori, S., and Asaridis, P.: A Multi-Criteria Analysis procedure for the evaluation and classification of flood risk mitigation strategies, EGU General Assembly 2024, Vienna, Austria, 14–19 Apr 2024, EGU24-8205, https://doi.org/10.5194/egusphere-egu24-8205, 2024.

Since the 1950s, global irrigated area has expanded dramatically, with complex effects on regional climate worldwide. The North China Plain (NCP) is among the most intensively irrigated regions in the world, but the effects of historical irrigation expansion on climate extremes over multi-decadal timescale are largely uncertain. Combining statistical methods with model simulations, we found that NCP experienced a decreasing trend of 0.2–0.25 ℃ decade−1 (p < 0.1) in daily maximum temperature (Tmax) during May-June of 1961–2000 along with irrigation expansion, which is distinct from other regions experiencing strong warming such as most of western China. The cooling effect on Tmax is 0.092 ℃ decade−1 (p < 0.01), relatively lower than that in California’s Central Valley but comparable to the trend in Northwest China and larger than the trend in Tibetan Plateau. The correlation coefficients between irrigation expansion and temperature change from 1960 to 2000 for Tmax and mean air temperature (Tmean) are –0.58 and –0.33 (p < 0.01), respectively, suggesting the ability of irrigation to alleviate regional warming and temperature extremes. Such effect varies over time, continuously strengthening from 1961 to 1980 because of intensive irrigation expansion, but then remaining relatively unchanged or weakening during 1980–2005 with moderate expansion. After 2005, the cooling effect is not detectable, which implies that it is completely canceled out by other forcings such as greenhouse gas warming, compensation of urban area expansion, small irrigation expansion rate and decline in irrigation water use. Despite that, irrigation is still able to reduce the number of extreme heat days after 1980. Compared with other factors, we found that irrigation expansion is the second most important contributor (27%) to the decrease in Tmax during the study period, after aerosol pollution (54%). This work emphasizes the ability of irrigation expansion to adapt agriculture to climate change over the past decades, and highlights the need for sustainable irrigation expansion in the future.

How to cite: Yuan, T., Tai, A. P. K., and Wu, J.: Irrigation expansion in North China Plain has historically decelerated regional warming and mitigated temperature extremes, EGU General Assembly 2024, Vienna, Austria, 14–19 Apr 2024, EGU24-8291, https://doi.org/10.5194/egusphere-egu24-8291, 2024.

The occurrence probability of rare floods is linked to the right-tail behavior of flood frequency distributions. Specifically, heavy-tailed behavior of flood distributions often signals significant hazards due to the unexpected extremeness of event magnitudes. However, conducting reliable analyses of flood tail heaviness across regions remains challenging due to the varying record lengths of available data.

In this study, instead of relying solely on statistical methods to evaluate flood tail behavior, we adopt a physical-based approach—hydrograph recession analysis—to quantify the nonlinearity of catchment hydrological responses. This method has shown its efficacy in identifying heavy-tailed flood behavior across analyses with different data lengths. Our analysis covers 575 river gauges, spanning drainage areas from 4 to 40,504 km2, across Atlantic-influenced European areas, Northwestern European areas, and the Continental United States. We categorize these regions based on the Köppen climate classification to explore the relationship between physiographic/climatic conditions and heavy-tailed flood behavior, and distinguish regional characteristics using the aridity index and potential evapotranspiration.

Our findings reveal a prevalence of heavy-tailed flood propensity in Atlantic-influenced European areas, prevalent nonheavy-tailed flood propensity in Northwestern European areas, and a mixed distribution with a balanced propensity in the Continental United States. Generally, drier catchments exhibit higher nonlinearity in hydrological responses, facilitating heavy-tailed floods, while catchments in which snow dynamics dominate the flood generation process tend to present linear responses. Excessively dry catchments, however, are less likely to exhibit heavy-tail floods due to insufficient moisture. Moreover, around one-third of catchments display varying tail behavior across seasons, underscoring the potential underestimation of flood tail heaviness in annual analyses. The seasonality of flood tail behavior—where instances of heavy-tailed flood behavior increase from spring to autumn but decrease in winter—is influenced by the seasonal variation of potential evapotranspiration.

Our study contributes to advancing the understanding of the impact of inherent physiographic and climatic features on regional and seasonal patterns of heavy-tailed flood behavior, providing valuable insights into the emergence of a considerable occurrence probability associated with very large magnitudes of rare floods.

How to cite: Wang, H.-J., Merz, R., and Basso, S.: Physiographic and Climatic Controls on Heavy-Tailed Flood Behavior: Insights from Catchment Nonlinear Responses, EGU General Assembly 2024, Vienna, Austria, 14–19 Apr 2024, EGU24-8389, https://doi.org/10.5194/egusphere-egu24-8389, 2024.

EGU24-8531 | Orals | HS7.5

Appraising and reducing riverine flood risk: a case study from Central Italy 

Francesco Dottori, Matteo Darienzo, Giacomo Fagugli, Simone Gabellani, Tatiana Ghizzoni, Daria Ottonelli, Flavio Pignone, and Eva Trasforini

On 15 September 2022 a catastrophic flood event hit the Misa river basin in Central Italy. The magnitude of the event (intensity of precipitation, water discharge, debris and sediment transport) and the subsequent impacts were far more severe and extended than previous flood events in the same area, thus calling for a radical change in current practices of flood risk management. In this framework, the present study aims at 1) providing a comprehensive assessment of flood risk for the Misa river basin, and 2) designing appropriate risk reduction measures at river basin scale. We reconstructed the September 2022 event by integrating in-field surveys, hydrological data, hydraulic models, observations of the event (e.g. flood extent maps) and historical data of past flood events, taking into account the incompleteness and uncertainty of both models and observations. Moreover, we modelled exposure and vulnerability of population and economic activities in the area, using detailed surveys of observed impacts to inform the model set-up. The outcomes of these activities allowed to review the risk analysis tools currently available in the Misa river basin, and to design updated risk scenarios for present and future climate conditions. Finally, the risk scenarios have been used to explore different alternatives for flood risk reduction, in agreement with local authorities and stakeholders. We evaluated a range of structural measures (strengthening of dike systems, detention areas, river diversions) and non-structural measures (land-use planning, relocation, flood-proofing measures), considering existing risk management plans and new analyses carried out in this study (e.g. cost effectiveness of measures).

How to cite: Dottori, F., Darienzo, M., Fagugli, G., Gabellani, S., Ghizzoni, T., Ottonelli, D., Pignone, F., and Trasforini, E.: Appraising and reducing riverine flood risk: a case study from Central Italy, EGU General Assembly 2024, Vienna, Austria, 14–19 Apr 2024, EGU24-8531, https://doi.org/10.5194/egusphere-egu24-8531, 2024.

EGU24-8564 | Orals | HS7.5

High-Resolution Dynamic Flood Susceptibility Mapping Across the Mediterranean Region 

Hamidreza Mosaffa and Luca Brocca

Effective disaster prevention necessitates the production of high-resolution flood susceptibility maps (FSM) that accurately identify potential flood-prone areas. Conventional FSMs, however, provide static representations that overlook the inherent dynamicity of flood susceptibility, which is influenced by temporal variations, precipitation intensities, and other factors. Additionally, traditional FSMs often lack the high-resolution climate data required for precise risk assessment. To address these limitations, we propose a novel dynamic FSM approach that incorporates temporal variations and high-resolution climate data.

Our approach employs the Random Forest machine learning algorithm, trained on a comprehensive dataset of flooded and non-flooded areas (Global Flood Database v1). The algorithm considers seven critical factors influencing flooding events: elevation, slope, land cover, proximity to rivers, drainage density, soil moisture, and precipitation. This approach enables the generation of high-resolution (1 km) dynamic FSMs for the Mediterranean region, under varying seasonal conditions, precipitation intensities, and post-drought scenarios.

To assess and compare the model's performance, we employed both training and testing datasets, conducting evaluations using various metrics. The study results demonstrate the superior performance of the Random Forest model, establishing its efficacy as a robust tool for mapping dynamic flood susceptibility. The accuracy and reliability of the results obtained through this approach offer crucial insights for mitigating flood-related risks and enhancing disaster management strategies. This study is an integral part of the Open-Earth-Monitor Cyberinfrastructure (OEMC) project. As our next step, we aim to expand the application of our dynamic flood susceptibility mapping methodology to cover the European region.

How to cite: Mosaffa, H. and Brocca, L.: High-Resolution Dynamic Flood Susceptibility Mapping Across the Mediterranean Region, EGU General Assembly 2024, Vienna, Austria, 14–19 Apr 2024, EGU24-8564, https://doi.org/10.5194/egusphere-egu24-8564, 2024.

Floods impact natural and human systems from multiple dimensions. The vulnerability to flood consequences is intricately linked to the hydrogeomorphic and socio-economic properties of the region. In a long run flood control infrastructure such as embankments evolve with the hydrogeomorphic and socio-economic properties and co produce the new set of vulnerabilities. Assessment of maladaptive contribution of flood control infrastructure is crucial in adaptive decision making and building resilience.The study analyzed flood vulnerability of the population residing inside the embankment area of the Kosi River basin from multidisciplinary parameters. The Kosi River embankment area covers around 890 Sq Km area and is home to nearly 0.8 million people who are facing a trifecta of issues, including regular flooding, scarcity of basic amenities, and loss of livelihood. The basin went through numerous flood-related research based on geomorphology, hydrology, and other physical factors; however, the flood impact assessment of embankments and its role within the socioeconomic dimension still needs to be explored. The present study unpacks flood vulnerability in 283 villages located within the Kosi embankment. Drawing upon thirteen attributes—comprising eight socio-economic and five hydro-geomorphic parameters—the analysis incorporates data from Sentinel-2, IMD, FMIS, the 2011 census report, and other pertinent survey reports. The study utilized analytical hierarchical process (AHP) to obtain relative priority order of parameters. Through the application of GIS analysis, we systematically formulated exhaustive vulnerability maps encapsulating socio-economic, hydrogeomorphic, and composite dimensions based on the weightage assigned to the selected parameters. The analysis highlights that nearly the entire population in the embankment region is susceptible to the effects of flooding, with ∼66% of the region having high and very high flood risk and ∼26% in areas with moderate risk. Furthermore, the outcomes reveal the maladaptive consequences of infrastructure solutions, manifesting as socio-economic disparities and exclusionary effects. The population living inside the embankment region exhibit notably impoverished socio-economic characteristics,including 32 % female literacy, approximately 90 houses constructed by  around 90 percent of houses are Kachha ( mud house), and highly rely on farm labor activities, which is highly lower than the region outside the embankment. Additionally, the outcomes bring to light the maladaptive consequences of infrastructure solutions, manifesting as socio-economic disparities and exclusionary effects. Residents within the embankment area exhibit notably impoverished socio-economic indicators, including a 32% female literacy rate, approximately 90% of houses are Katchha ( made from mud and straw), and economic dependency on agriculture labor activities, which is significantly lower than outside of the embankment. Moreover, the annual flood and longer periods of waterlogging cut off the population from other parts of the state. Lastly, the study discussed the source of vulnerability and adaptation options, which could be useful in developing comprehensive flood adaptation programs, including socioeconomic considerations.

How to cite: Devda, A. and Verma, V.: Assessing Flood Vulnerability and Maladaptive Effects Associated with Embankment-Based Flood Control Infrastructure : Hydrogeomorphic and Socioeconomic Analysis Kosi River Embankment Region, Bihar, India., EGU General Assembly 2024, Vienna, Austria, 14–19 Apr 2024, EGU24-8741, https://doi.org/10.5194/egusphere-egu24-8741, 2024.

EGU24-9209 | ECS | Posters on site | HS7.5

Spatial analysis of catastrophic flooding in the metropolitan area of Murcia over the last 100 years 

Ester García Fernández, Juan Francisco Albaladejo-Gómez, Andrina Gincheva, Salvador Gil-Guirado, and Alfredo Pérez-Morales

Floods represent the most diverse, destructive and frequent natural hazard worldwide and are one of the most significant causes of loss of economic and social assets. In recent years, an increase in the quantity and intensity of this phenomenon can be observed. The factors are manifold, but two stand out: increased hazards as a consequence of anthropogenic climate change and increased exposure and vulnerability of the population and its economic assets. One of the most conflictive areas of the planet are the Mediterranean regions, due to the combination of both factors. Among the hot spots, the Southeast of Spain stands out, with a situation aggravated by a semi-arid climate, but with a highly irregular and torrential rainfall distribution.

These factors are particularly problematic in urban areas, making it necessary to precisely locate the areas at risk in order to establish effective adaptation measures. For this reason, this paper compiles historical information on the main flood events from 1900 to the present in the metropolitan area of Murcia, the main urban area in southeast Spain. The information collected comes from newspaper sources. Subsequently, this information has been geolocated and analyzed with Geographic Information Systems. The results reveal that, in general terms, the damage is concentrated mainly in the areas near the Segura River. Additionally, and to a lesser extent, there is a significant concentration in its main tributary, the Guadalentín River. However, it should be noted that during recent flooding episodes, the areas affected are being modified, involving new urbanized areas, far from the main riverbeds and located in flood zones due to the passage of secondary watercourses such as wadis. Finally, it is worth noting that there has been an increase in the number of low-intensity damage points. However, on a positive note, it has been observed that higher intensity damage is decreasing.

How to cite: García Fernández, E., Albaladejo-Gómez, J. F., Gincheva, A., Gil-Guirado, S., and Pérez-Morales, A.: Spatial analysis of catastrophic flooding in the metropolitan area of Murcia over the last 100 years, EGU General Assembly 2024, Vienna, Austria, 14–19 Apr 2024, EGU24-9209, https://doi.org/10.5194/egusphere-egu24-9209, 2024.

EGU24-9257 | ECS | Orals | HS7.5

Multi-hazard assessment of long- and short-term extreme hydrometeorological events in southeastern South America 

M. Josefina Pierrestegui, Miguel A. Lovino, Gabriela V. Müller, and Omar V. Müller

Extreme hydrometeorological events (EHE) negatively affect ecosystems, human settlements, food production, water resources, and public health worldwide. In southeastern South America (SESA), the frequency and intensity of temperature and precipitation extremes have increased over recent decades. SESA is particularly vulnerable to EHE due to its high population rates and an economy heavily reliant on agricultural activities; therefore, advancing towards a climate-resilient development is a key goal for the region. This study presents a multi-hazard analysis of EHE and their changes over SESA.

Our study assesses the frequency, duration, and intensity of short- and long-term EHE for the 1961-1990 and 1991-2020 periods. ERA5 precipitation, soil moisture, and temperature data at multiple time scales (from daily to monthly) are used, with a spatial resolution of 0.25°×0.25° latitude-longitude grid. Long-term EHE are studied using nonparametric standardized indices—specifically, the Standardized Precipitation Index (SPI) and Standardized Soil Moisture Index (SSI)—at 3- and 18-month timescales to analyze agricultural and hydrological impacts. Short-term EHE are characterized by heavy precipitation, flash droughts, and heat waves events to analyze immediate impacts in urban areas and in agriculture. Individual hazard components are derived by multiplying the frequency, duration, and intensity of the identified events, followed by a rescaling to a 0-1 range using range normalization (with minimum and maximum values). The long-term and short-term EHE hazard indices are formulated by aggregating the rescaled individual hazard components and dividing by the total number of components. Changes in observed EHE hazard components are determined by comparing the EHE hazard indices for the 1991-2020 and 1961-1990 periods.

Our findings underscore significant precipitation excess hazard, mainly concentrated in agriculture-prone areas spanning central-eastern Argentina, Uruguay, and southern Brazil across both 3- and 18-month timescales. In contrast, precipitation deficit hazard predominantly manifests in the western regions of SESA. Regarding short-term EHE, the highest hazard magnitudes are observed in northeastern Argentina, southern Brazil, and southeastern Paraguay. Heat waves occur frequently in the region, with hazardous intensities over the northern part of SESA. Additionally, heavy precipitation events constitute a significant hazard component for urban and rural infrastructure primarily in northeastern Argentina. Flash droughts also affect agriculture-prone areas, particularly with high intensity in southern Brazil, northeastern Argentina, and Uruguay.

Our results reveal that the most significant changes are observed in short-term hazard indices in northeastern SESA. This region, which includes eastern Paraguay, northeastern Argentina, southern Brazil, and Uruguay, has experienced an increase in heat wave hazard, primarily due to a significant rise in the frequency of heat waves. Hazards associated with heavy precipitation and flash drought events have also increased, with a rise in their frequency and duration observed mainly over northeastern Argentina and southern Brazil. In contrast, long-term hazard indices exhibit non-uniform patterns of change. Our findings suggest that weather-related hazards have undergone changes over the last decades. We expect that these findings provide valuable insights to enhance SESA's hydroclimatic risk management systems by identifying areas susceptible to both short- and long-term hazards.

How to cite: Pierrestegui, M. J., Lovino, M. A., Müller, G. V., and Müller, O. V.: Multi-hazard assessment of long- and short-term extreme hydrometeorological events in southeastern South America, EGU General Assembly 2024, Vienna, Austria, 14–19 Apr 2024, EGU24-9257, https://doi.org/10.5194/egusphere-egu24-9257, 2024.

EGU24-9313 | ECS | Orals | HS7.5

The Effects of Geographic Risk Complementarity on Reducing Flood Insurance Costs 

Shibo Cui and Jianshi Zhao

Flood insurance is an important non-structural measure for flood risk management. However, a significant protection gap in flood insurance exists in many countries and the high cost of flood insurance is a primary reason. Reducing the flood insurance costs for both policyholders and insurance companies is crucial for the effective implementation of flood insurance. Here, we use portfolio theory to derive fundamental principles of reducing overall insurance cost including premiums and risk reserves through geographic risk complementarity. Furthermore, we propose a reasonable premiums distribution approach among different risk agents to analyze the effect of geographic risk complementarity on individual cost, based on the cooperative game theory. We applied our method in China, which has a large territory but lacks a national flood insurance program. We show there is a low correlation of flood losses across most provinces in China. Compared to the separate insurance in each province, national flood insurance can reduce total premiums by 14.5% and total risk reserves by 61.0%. The regions with highest proportion of premium reduction are the middle and lower Yellow River reaches, which have a lower flood risk correlation with the portfolios of other regions. In conclusion, the geographic complementarity in flood risk has a significant effect on reducing flood insurance cost and the degree of cost reduction depends on the flood risk correlation among different entities. We recommend that China should utilize the geographic risk complementarity to implement a national-level flood insurance program. The method proposed can also provide references for catastrophe insurances around the world.

How to cite: Cui, S. and Zhao, J.: The Effects of Geographic Risk Complementarity on Reducing Flood Insurance Costs, EGU General Assembly 2024, Vienna, Austria, 14–19 Apr 2024, EGU24-9313, https://doi.org/10.5194/egusphere-egu24-9313, 2024.

EGU24-10245 | ECS | Orals | HS7.5

A time-dependent non-asymptotic statistical analysis of extreme precipitation events 

Matteo Pesce, Eleonora Dallan, Francesco Marra, and Marco Borga

Time-dependent precipitation frequency analyses were often hampered by the availability of relatively short data records, which result in large uncertainty in the estimation of extremes. The recently developed non-asymptotic statistical methods, based on fitting ordinary events rather than extreme events only, represent a potential solution to the problem of data scarcity and are finding wide application in literature under assumptions of stationarity. Recent studies investigated the use of non-asymptotic methods under non-stationary conditions (e.g., Vidrio-Sahagún and He, 2022) and advocated their use over other methods for non-stationary frequency analysis of extreme precipitation. In this study we formalize a non-stationary time-dependent approach for the statistical analysis of multi-duration precipitation extremes using simplified metastatistical extreme value (SMEV) approach. The study focuses on a catchment in the Eastern Italian Alps, where trends in extreme precipitation where reported (Dallan et al., 2022) and which was impacted by the exceptional Vaia event in 2018. We provide an estimation of extreme return levels of precipitation in six stations in the neighborhood of the catchment and compare them with precipitation maxima observed during Vaia storm. The results show that using a non-stationary left-censored Weibull distribution, with both scale and shape parameters linearly dependent on time, allows to properly describe the observed trends of intense precipitation for different durations. Our results suggest that the probability of observing events like Vaia increased over the past decades, leading to the need for updating local adaptation measures.


References:

Dallan, E., Borga, M., Zaramella, M., & Marra, F. (2022). Enhanced summer convection explains observed trends in extreme subdaily precipitation in the eastern Italian Alps. Geophysical Research Letters49(5), e2021GL096727.

Vidrio-Sahagún, C. T., & He, J. (2022). Hydrological frequency analysis under nonstationarity using the Metastatistical approach and its simplified version. Advances in Water Resources166, 104244.

How to cite: Pesce, M., Dallan, E., Marra, F., and Borga, M.: A time-dependent non-asymptotic statistical analysis of extreme precipitation events, EGU General Assembly 2024, Vienna, Austria, 14–19 Apr 2024, EGU24-10245, https://doi.org/10.5194/egusphere-egu24-10245, 2024.

EGU24-10297 | ECS | Orals | HS7.5

Projected amplification of rainfall extremes due to warming-induced reduction of snow fraction: an assessment based on convection-permitting simulations 

Petr Vohnicky, Eleonora Dallan, Francesco Marra, Giorgia Fosser, Matteo Pesce, and Marco Borga

In mountainous regions, temperature determines the state of precipitation (liquid or solid) and in turn significantly affects runoff formation and flood generation. Projected temperature increase due to global warming may therefore affect the rainfall/precipitation ratio during heavy storms, hence intensifying the flood regime. This study aims to assess the projected variations in liquid/solid fraction of precipitation during heavy precipitation events in the upper Adige River, Italy (Eastern Italian Alps). The study utilizes simulations from an ensemble of convection-permitting climate models (CPM), which are suitable to the task given their ability to explicitly represent deep convection and to resolve the mountainous topography. The CPM data provided by the CORDEX-FPS Convection project at 1-hour temporal and remapped to 3 km spatial resolution, cover historical and far-future (2090-2099) time periods under the extreme climate change scenario (RCP8.5). Observational data from the densely instrumented river system are utilized for bias evaluation. Lastly, the Simplified Metastatistical Extreme Value (SMEV) approach, known for the reduced uncertainty compared to conventional approaches, is incorporated for frequency analysis. This method proves particularly useful for analyzing extremes from short time periods, such as those in CPM simulations. The projected changes in both sub-daily mean areal precipitation and liquid rainfall return levels are examined at various spatial scales based on the sub-basins total area. Our preliminary results underscore the significance of leveraging advanced statistical techniques and high-resolution climate models to address emerging challenges in hydrology and climate science. The climate-induced shifts in return period of liquid precipitation identified in this study are expected to have implications for both water resources management and adaptation measures.

How to cite: Vohnicky, P., Dallan, E., Marra, F., Fosser, G., Pesce, M., and Borga, M.: Projected amplification of rainfall extremes due to warming-induced reduction of snow fraction: an assessment based on convection-permitting simulations, EGU General Assembly 2024, Vienna, Austria, 14–19 Apr 2024, EGU24-10297, https://doi.org/10.5194/egusphere-egu24-10297, 2024.

EGU24-10877 | ECS | Posters on site | HS7.5

Exploring Diverse Perceptions of Multiple Risks among the Public in Rome 

Mara Lucantonio, Elena Ridolfi, Patrizia Cicini, Fabio Russo, and Francesco Napolitano

Risk is given by the combination of exposure, hazard, and vulnerability, and it is perceived by individuals in different ways. Some people may be unaware of the potential occurrence of a given hazard, while others may misjudge their level of exposure, vulnerability, or both. The knowledge of the population’s risk perception is a fundamental aspect for the analysis of potentially catastrophic phenomena and for the development of prevention policies to intervene and mitigate the expected damage. Questionnaires are widely used in social science research to acquire information about the attitudes, social characteristics, beliefs, and behaviors of participants. This information when combined through a mixed method can provide robust, comprehensive, and quantifiable results, adding a valuable perspective for the development of appropriate hazard mitigation and adaptation strategies. Here we present a case study that involves the analysis of a data set based on a questionnaire submitted to around 300 citizens of the city of Rome (Italy) in spring 2023. The proposed questionnaire investigates specific areas, which are: experience and knowledge of the phenomena, probability of occurrence perceived by the respondent, potential impact, and preparedness to deal with the phenomena.The use of questionnaires to study citizens’ perception of both natural and man-made hazards enables the acquisition of valuable information for authorities dealing with emergency management. The resulting dataset has the potential to improve the communication efficiency between authorities and citizens in risk situations, and provide relevant information for future studies relying on the knowledge of citizens’ risk perception.

How to cite: Lucantonio, M., Ridolfi, E., Cicini, P., Russo, F., and Napolitano, F.: Exploring Diverse Perceptions of Multiple Risks among the Public in Rome, EGU General Assembly 2024, Vienna, Austria, 14–19 Apr 2024, EGU24-10877, https://doi.org/10.5194/egusphere-egu24-10877, 2024.

EGU24-10950 | ECS | Posters on site | HS7.5

Temporal and spatial analysis of mortality associated with landslides on São Miguel Island (Portugal) from 1900 to 2020 

Rui Fagundes Silva, Rui Marques, and José Luís Zêzere

The São Miguel Island covers an area of 744.6 km² and has a total population of 133,390, distributed across six municipalities: Ponta Delgada, Ribeira Grande, Vila Franca do Campo, Povoação, Lagoa, and Nordeste. The island features two extinct volcanic systems and three active central volcanoes with calderas connected by two fissure volcanic systems. Two distinct seasons can be identified based on rainfall patterns: from October to March (wet season) and from April to September (dry season). Since the settlement of the island in the mid-15th century, there have been records of landslides, some with significant socio-economic impact. The analysis of the spatial distribution and temporal patterns of mortality associated to landslides was carried out using the NATHA (Natural Hazards in Azores) database for the period 1900–2020. Data collection involved the analysis of more than 55,500 newspaper specimens. A total of 236 landslides events were catalogued on São Miguel Island, which caused 82 fatalities. The municipality of Povoação accounted for 48 fatalities, approximately 59% of the total. Ponta Delgada reported 14 fatalities, Ribeira Grande eight, Vila Franca do Campo seven, Nordeste three, and Lagoa two. On São Miguel Island, an average of 0.7 fatalities per year were recorded, resulting in a landslide mortality rate of 0.35 (calculated as the ratio between deaths and total events). The events with the highest number of fatalities occurred on October 31, 1997 (29 fatalities) and on October 14, 1942 (7 fatalities). The annual mortality rate per decade reveals two distinct periods with higher values: 1930-1949 and 1990-1999. No fatalities were recorded from 1900 to 1929. The landslide mortality rate has a first increase in the 1930s and 1940s (≈0.1 fatalities/10,000 inhabitants). From 1950 to 1989, there was a decrease (≈0.02 fatalities/10,000 inhabitants), with a slight increase in the 1960s. The period from 1990 to 1999 has the highest mortality rate (≈0.26 fatalities/10,000 inhabitants). However, excluding the extreme event of October 31, 1997 from the analysis reveals that the 1990s had a mortality rate in line with the previous four decades (0.02 fatalities/10,000 inhabitants). Along the two first decades of the 21st century, the mortality rate increased again, maintaining a stable trend (≈0.05 fatalities/10,000 inhabitants). The data also indicates that males had a higher frequency of fatalities. The circumstances surrounding the incidents varied, with most fatalities occurring outdoors when individuals were on foot in rural areas. However, it is noteworthy that there were also fatalities inside houses in urban areas, emphasizing the diverse contexts in which these tragic events took place. This information provides valuable insights to temporal patterns and spatial distribution of landslide-induced fatalities on São Miguel Island.

How to cite: Silva, R. F., Marques, R., and Zêzere, J. L.: Temporal and spatial analysis of mortality associated with landslides on São Miguel Island (Portugal) from 1900 to 2020, EGU General Assembly 2024, Vienna, Austria, 14–19 Apr 2024, EGU24-10950, https://doi.org/10.5194/egusphere-egu24-10950, 2024.

EGU24-11090 | ECS | Orals | HS7.5

From indices to impacts: Understanding the dynamics of drought impacts through socio-economic clustering 

Rhoda Odongo, Hans De Moel, Marthe Wens, Natalia Limones, Dim Coumou, and Anne Van Loon

Over the past decade, the Horn of Africa (HoA) has been plagued by recurrent drought events that have had devastating impacts on the population. The frequency, duration and severity of these droughts are expected to increase in the wake of global warming, leading to higher losses and damages if the vulnerability of the population is not reduced. Monitoring and early warning systems for droughts are based on various drought hazard indicators. However, assessments of how these indicators are linked to impacts are rare. For adequate drought management, it is essential to understand and characterise the drivers of drought impacts, especially in the HoA, where most studies focus either on meteorological droughts, agricultural droughts or the propagation of droughts through the hydrological cycle, without considering the relationship between hazard and impact. Drought hazard indices alone cannot capture the vulnerability of the system. In this study, we identify meaningful indices for the occurrence of region- and sector-specific impacts. We assess the effectiveness of socio-economic clustering in categorising counties based on common characteristics and their correlation with historical drought impacts (malnutrition, milk production and trekking distances to water sources). Using Random Forest (RF) and Spearman correlation analyses, we examine the link between drought indices (Standardised Precipitation Index, Standardised Precipitation Evapotranspiration Index, Standardised Soil Moisture Index, Standardised Streamflow Index and Vegetation Condition Index) with different accumulation periods and the impact data. We find that clustering regions based on vulnerability proxies significantly improves the hazard-impact relationship, emphasising the importance of considering vulnerability factors in drought risk assessment. Our results indicate an impact-specific relationship that is strongly influenced by the vulnerability of the region. In particular, household and livestock distance to water is most strongly associated with medium- to long-term precipitation-based indices (2-10 months), while milk production can be associated with a variety of indices with different accumulation periods (5-24 months), and malnutrition is correlated with precipitation- and streamflow-based indices (5-24 months). Household and livestock distance to water is well modelled by clusters reflecting low access to improved sanitation and safe water sources, high poverty, aridity and gender disparities. Malnutrition was well modelled by clusters related to aridity, average precipitation, food consumption score, access to water sources, improved sanitation and poverty levels. The type of clustering used in modelling the impact of drought on milk production does not have a major impact on the performance of the models. We then apply this relationship to hindcast drought indices to obtain impact data on individual counties for periods when no impact monitoring was done yet. With that information we estimate the associated risk under specific climatic conditions. By recognising the drivers and vulnerability factors that influence the sensitivity of counties to drought, communities can better prepare and mitigate the impacts of drought.

How to cite: Odongo, R., De Moel, H., Wens, M., Limones, N., Coumou, D., and Van Loon, A.: From indices to impacts: Understanding the dynamics of drought impacts through socio-economic clustering, EGU General Assembly 2024, Vienna, Austria, 14–19 Apr 2024, EGU24-11090, https://doi.org/10.5194/egusphere-egu24-11090, 2024.

EGU24-11493 | ECS | Posters on site | HS7.5

Dry spell frequency and duration analysis using different spell definitions 

Pedro Henrique Lima Alencar and Eva Nora Paton

Dry spells, characterized by consecutive days with little to no precipitation, pose significant challenges, particularly in agriculture, and can impact various sectors including health when compounded by high temperatures, increased evaporation rates, or pollution. However, defining the thresholds for what constitutes a significant lack of precipitation or the number of consecutive days to define a notable dry spell remains ambiguous. In this study, we investigate the occurrence of different types of dry spells across Germany using twelve diverse definitions. These definitions encompass not only the conventional criteria of low/no precipitation but also consider associations with other extreme weather conditions occurring simultaneously (such as high temperatures, and potential evapotranspiration) or following the dry spell (like intense precipitation events). Leveraging continuous weather station data spanning the last 50 years, we employ the Mann-Kendall test to analyse seasonal and regional trends in the duration and frequency of these various dry spell events across Germany. Our findings reveal positive trends in both the frequency and duration of dry spells in Germany, notably prominent in the southern regions. These trends are observed in conventional low-precipitation dry spells and compound heat-dry events. Additionally, to facilitate event identification, we have consolidated these diverse dry spell definitions into an R-package called DryER (Dry spell Events in R).


How to cite: Lima Alencar, P. H. and Paton, E. N.: Dry spell frequency and duration analysis using different spell definitions, EGU General Assembly 2024, Vienna, Austria, 14–19 Apr 2024, EGU24-11493, https://doi.org/10.5194/egusphere-egu24-11493, 2024.

EGU24-11733 | ECS | Orals | HS7.5

Exploring vulnerability to flash floods in a water-scarce MENA city: Challenges and possible solutions  

Clara Hohmann, Christina Maus, Ahmad Awad, Dörte Ziegler, Hanna Leberke, Maram Al Naimat, Wafaa Abuhammour, and Katja Brinkmann

Jordan is one of the water scarcest regions worldwide, but regularly hit by severe flash floods caused by heavy rainfall events. Such events will likely intensify in future and increase flash flood damages, especially in rapidly developing urban areas. Therefore, flood vulnerability analysis and assessment are urgently needed to improve urban risk management and to protect the local population. To date, however, such analyses in Jordan, as in many other MENA regions, have been hampered by the lack of spatial and temporal high-resolution climate, economic and social data. Furthermore, conducted hydrological analyses have only considered physical parameters in assessing flash flood risk.

Our aim is to investigate the vulnerability in a data scarce urban region and find solutions to overcome the challenges by combining different disciplinary perspectives with local knowledge. Jordan’s capital, Amman was selected as study region, which is a prime example of a rapidly growing city in the MENA region.

To analyze and assess the vulnerability of people, infrastructure and ecosystem to flash flood events in a watershed of Amman, a mixed-method approach was applied within a transdisciplinary research project called CapTain Rain (Capture and retain heavy rainfall in Jordan). To gain insights into flash flood risks, we explore the vulnerability dimensions exposure and sensitivity from the hydrological, hydraulic and social perspectives, and the adaptive capacity of the local population. For the assessment of each vulnerability dimension, different physical, social and ecological indicators were used. Several indicators, such as damage potential, were adapted to local conditions based on focus group discussions with Jordanian stakeholders.

The vulnerability dimensions exposure, sensitivity and adaptive capacity were assessed for the current situation and several possible scenarios with changing future conditions in climate (intensity of rainfall) and land cover (urbanization trends). As one sensitivity indicator the damage potential was analyzed. The resulting damage potential map shows e.g. the locations of critical infrastructure, and also includes the word heritage sites, which were identified as vulnerable infrastructure of high importance by the Jordanian stakeholders. Regarding future scenarios our first hydrological and hydraulic modelling results show that a moderate climate change of 20% more intense rainfall has a stronger influence compared to land cover changes. Land cover changes with more sealed surfaces have little influence on the runoff caused by the low infiltration capacity of soils in the area according to the available data.

Through interdisciplinary collaboration and local stakeholder engagement, this work demonstrates a noteworthy strategy to addressing flash flood risks in situations where data is limited. The results of the integrated scenario analysis and vulnerability assessment serve as a decision-support tool for urban planning.

How to cite: Hohmann, C., Maus, C., Awad, A., Ziegler, D., Leberke, H., Al Naimat, M., Abuhammour, W., and Brinkmann, K.: Exploring vulnerability to flash floods in a water-scarce MENA city: Challenges and possible solutions , EGU General Assembly 2024, Vienna, Austria, 14–19 Apr 2024, EGU24-11733, https://doi.org/10.5194/egusphere-egu24-11733, 2024.

EGU24-14198 | ECS | Orals | HS7.5

Assessing the Influenced Zone of Debris Flow Using Numerical Simulation 

Kai-Lun Wei, Kuo-Wei Liao, Guan-Yu Lin, Poshuan Lin, and Tsungyu Hsieh

Taiwan is located at the boundary between the Philippine Sea Plate and the Eurasian Plate, characterized by steep terrain and high river gradients. Combined with frequent events such as typhoons leading to substantial rainfall, this has resulted in disasters like debris flows. Several available tools such as HEC-RAS two-dimensional hydraulic, SRH-2D, FLO-2D and FLOW-3D are used to analyze the area of flooding and the impact of debris flow in the watershed. The simulation results are compared with historical disaster data to validate the feasibility of model. Furthermore, the results are used to evaluate the suitability of current government-designated evacuation locations and routes.

Among several analysis tools, the debris flow modeling in HEC-RAS two-dimensional hydraulic is considered as the best platform to analyze debris risk. The results show the sections of evacuation routes on the left bank of the downstream area near the estuary pass through the debris flow impact area. However, there is no suitable evacuation facility in the vicinity. Therefore, during warning issuance, residents need to be cautious and evacuate promptly. On the other hand, collaboration with government authorities can be pursued to establish new shelters or activity centers nearby, serving as alternative evacuation sites.

How to cite: Wei, K.-L., Liao, K.-W., Lin, G.-Y., Lin, P., and Hsieh, T.: Assessing the Influenced Zone of Debris Flow Using Numerical Simulation, EGU General Assembly 2024, Vienna, Austria, 14–19 Apr 2024, EGU24-14198, https://doi.org/10.5194/egusphere-egu24-14198, 2024.

EGU24-14698 | Posters on site | HS7.5

Monthly flood frequency regionalization for comprehensive flood damage assessment to crops 

Anna Rita Scorzini, Charlie Dayane Paz Idarraga, and Daniela Molinari

Quantitative flood risk assessments rely on damage models, which relate information on flood hazard and vulnerability of exposed assets to estimate expected losses. Differently from other sectors, crop damage depends not only on typical hazards variables (including water depth, flow velocity, inundation duration, water salinity, yield of sediments and/or contaminants) but also on the month of flood occurrence. Indeed, plant vulnerability changes over the different phenological phases that are strictly related to the seasonality of crop production. Considering the time of occurrence of the flood would imply a shift from the traditional representation of inundation scenarios based on annual probability to monthly-based hazard estimations. When risk assessment is carried out at large spatial scale, a detailed understanding of seasonal flood patterns is then required for the different sub-catchments of the basins, including un-gauged ones. In this study we present a clustering approach to flood frequency regionalization applied to the Po River District in Northern Italy, within the risk assessment process required by the European Floods Directive. The  area is characterized by complex climatic and topographic conditions, highlighting the representativeness of the case study for the implementation of the proposed approach in other geographical contexts. Utilizing observed monthly flow data from over 100 gauging stations, the approach combines both physical and statistical criteria to identify homogeneous regions in terms of flood generation mechanisms and seasonality. The process enables the assignment of distinct monthly flood probabilities to all catchments within the district, thereby supporting a comprehensive flood risk assessment for the agricultural sector.

How to cite: Scorzini, A. R., Paz Idarraga, C. D., and Molinari, D.: Monthly flood frequency regionalization for comprehensive flood damage assessment to crops, EGU General Assembly 2024, Vienna, Austria, 14–19 Apr 2024, EGU24-14698, https://doi.org/10.5194/egusphere-egu24-14698, 2024.

The insurance sector plays a critical role in promoting disaster resilience and recovery by providing financial protection, speeding up rebuilding and recovery, and managing the financial impact of natural disasters. To fulfill this role, insurance companies must meet the capital requirements imposed by regulators. For example, the European Solvency II regulatory framework requires insurers to hold enough capital to withstand a natural catastrophe loss with a return period of 1 in 200 years. As the historical loss data are scarce and incomplete, the insurance sector uses stochastic catastrophe models (cat models) to assess the potential cost of rare but devastating events like floods.

A stochastic event set is a crucial element of cat models. It is a collection of possible disasters with their likelihood and severity. One method to generate stochastic flood events is to use numerical models of the atmosphere to generate realistic precipitation fields, and then apply rainfall-runoff models to estimate how much water will flow into rivers and streams from precipitation and snowmelt. By running many simulations with different inputs and parameters, stochastic flood models can provide a range of possible outcomes, including floods with spatial patterns and magnitude missing in historical data.

Output of such simulations are spatio-temporal hazard grids: precipitation grids for pluvial risk and river discharge grids for fluvial risk. These grids are large as the models typically run over large geographies (countries or continents) and simulate 10,000 years or more. This contribution will (i) provide overview of existing methods how to identify flood events in such huge discharge and precipitation datasets (i.e. peak-over threshold method), (ii) show their limitations for identifying flood events, and finally (iii) propose a new methodology designed to address specific needs of reinsurance industry such as the hours-clause condition, which specifies the time period within which losses from a single event must occur in order to be covered.

As many severe floods are composed from several sub-waves (for example 2002 floods in Czech Republic), proper event identification and separation is highly relevant topic as it influences the amount of reinsurance payouts after some types of flood events and thus capital available for rebuilding and recovery. 

How to cite: Kadlec, M.: Identification of flood events in large discharge datasets - reinsurance industry perspective, EGU General Assembly 2024, Vienna, Austria, 14–19 Apr 2024, EGU24-14743, https://doi.org/10.5194/egusphere-egu24-14743, 2024.

EGU24-14898 | Posters on site | HS7.5

The diverse impacts of extreme storms in the European South. The case of Storm Daniel (2023) in Greece. 

Michalis Diakakis, Spyridon Mavroulis, Christos Filis, Yiannis Bantekas, Marilia Gogou, Katerina-Nafsika Katsetsiadou, Maria Mavrouli, Vasilis Giannopoulos, Andromachi Sarantopoulou, Panagiotis Nastos, Emmanuel Vassilakis, Aliki Konsolaki, Evelina Kotsi, Sotiris Moraitis, Eleftheria Stamati, Athanasia Bakopoulou, Emmanuel Skourtsos, Panayotis Carydis, and Efthymios Lekkas

On September 4, 2023, Storm Daniel moved inland from the Ionian Sea, intensifying due to the warmth of the post-summer Mediterranean Sea, resulting in intense rainfall and thunderstorms over the Balkans. Central Greece was particularly affected, experiencing the highest daily rainfall totals recorded in the region.

The storm caused widespread devastation, especially in the Thessaly region, with significant impacts including intense erosion, mass movement phenomena triggered by rainfall, damages from strong winds, inundation, agricultural land damage, loss of life and injuries, impacts on residences and businesses, as well as a substantial toll on the environment and cultural sites.

This study focuses on Storm Daniel and its effects in Thessaly, Greece, by creating a database of distinct impact elements based on field surveys and public records. Through this archive, the study explores the range of its impacts, developing a systematic categorization to provide an in-depth understanding of the types and mechanisms of these impacts.

Examining extreme storms through post-flood surveys and emphasizing their impacts can enhance our comprehension of associated risks. This knowledge will facilitate more accurate predictions and strategic planning for such events, contributing to improved emergency management and recovery efforts. Anticipating the impacts becomes crucial, particularly in the context of the projected increase in the frequency of such events due to climate change, thereby strengthening our preparedness.

How to cite: Diakakis, M., Mavroulis, S., Filis, C., Bantekas, Y., Gogou, M., Katsetsiadou, K.-N., Mavrouli, M., Giannopoulos, V., Sarantopoulou, A., Nastos, P., Vassilakis, E., Konsolaki, A., Kotsi, E., Moraitis, S., Stamati, E., Bakopoulou, A., Skourtsos, E., Carydis, P., and Lekkas, E.: The diverse impacts of extreme storms in the European South. The case of Storm Daniel (2023) in Greece., EGU General Assembly 2024, Vienna, Austria, 14–19 Apr 2024, EGU24-14898, https://doi.org/10.5194/egusphere-egu24-14898, 2024.

EGU24-15286 | ECS | Posters on site | HS7.5

A 10-Year climatology of hail in France: towards an estimate of the hail hazard 

Maxime Trevisani

According to France Assureur (French insurance unions), 2022 hail damage in France is estimated at more than €6.5 billion, i.e. more than half of all climate-related damage in 2022, or 60% of all hail damage accumulated between 2013 and 2021. This record-breaking year is in line with the growing concern about hail in France among public and private stakeholders. Despite its increasing impact on society the hail hazard in France remains largely unknown or under investigated at the national level, with a single 20x20 km hail risk map produced up in 1998 by F. Vinet using economic data (insurance) and measurements (hailpad). Hail hazard is poorly studied in France due to the great difficulty of observing or modelling hailfall, which are highly localised in time and space. The emergence of social networks since the late 2000s has led to a proliferation of potential hail observers across France. These new data, combined with insurance data, make it possible to study hail at a level of resolution never seen before in France.

The main objectives of our study are therefore to update the geographical assessment of the hail hazard in France, while improving the granularity of the existing geographical hail assessment. To this end we studied the hail hazard in terms of frequency and maximum diameter at the municipal level (average 16 km²), using hail reports (Keraunos, European Sever Weather Database) and insurance data (Generali France, around 5% market share) over the period 2013-2022.

Our study thus provides a resolution 25 times finer than that of Vinet and reveals a southwest - northeast axis dividing France into two parts: the southern part is heavily affected by hail while the northern part is less affected. It also highlights 3 main geographical areas with the highest hail hazard. The Massif Central stands out as the main hail-prone area in France, with a notable maximum in its northern part. The Bordeaux-Paris axis comes second, with a local maximum in the southwest Atlantic coast. In third place comes the Provence-Alpes-Côte d'Azur region, particularly in the Pre-Alps and Pre-Atlantic massifs. There also seems to be a correlation between orography and areas of high hail hazard, particularly noticeable in the Massif Central and Pre-Alps regions, but this assumption needs to be further investigated.

How to cite: Trevisani, M.: A 10-Year climatology of hail in France: towards an estimate of the hail hazard, EGU General Assembly 2024, Vienna, Austria, 14–19 Apr 2024, EGU24-15286, https://doi.org/10.5194/egusphere-egu24-15286, 2024.

EGU24-15556 | Orals | HS7.5

Climate Stress Testing for Enhanced Understanding of the Flood Hazard and its Socioeconomic Impacts in Italy 

Francesca Perosa, Alastair Clarke, Punit Bhola, Caroline McMullan, Emma Lewington, and Bernhard Reinhardt

To contribute to a more resilient flood risk management in Italy, we employ the recently published Verisk Inland Flood Model for Italy to conduct climate stress testing. We focus on the sensitivity of modeled losses to precipitation and leverage the meteorological dataset obtained from the Climate Model Intercomparison Project Phase 6 (CMIP6) for identifying projected precipitation trends and analyzing the potential effects of climate change on inland flood losses in the future, exploring different Shared Socioeconomic Pathways (SSPs) and Representative Concentration Pathways (RCPs). The methodology involves analyzing correlations between annual or seasonal precipitation and the corresponding annual loss cost, which is defined as annual loss divided by the total insured value. By exploring these relationships, we seek to enhance our understanding of how precipitation patterns influence the financial implications of flood events in various Italian regions. Additionally, we use the 10,000-year stochastic catalog embedded in the Verisk Inland Flood Model to explore the impact of expected climate change-related changes in annual precipitation for each Italian region, addressing the climate change-based precipitation targets. This enables us to run the fully probabilistic Verisk Inland Flood model and to assess whether anticipated alterations in precipitation levels correspond to expected changes in Annual Average Loss (AAL). This approach allows us to dynamically adapt our flood risk model to varying climate scenarios, providing valuable insights for the (re)insurance industry, as well as academia and government agencies that are seeking to navigate the evolving landscape of flood-related risks.

How to cite: Perosa, F., Clarke, A., Bhola, P., McMullan, C., Lewington, E., and Reinhardt, B.: Climate Stress Testing for Enhanced Understanding of the Flood Hazard and its Socioeconomic Impacts in Italy, EGU General Assembly 2024, Vienna, Austria, 14–19 Apr 2024, EGU24-15556, https://doi.org/10.5194/egusphere-egu24-15556, 2024.

EGU24-15848 | Posters on site | HS7.5

The use of radar information for improving the knowledge about landslides and floods events: an application to Calabria region (Italy) 

Vincenzo Totaro, Simona de Sario, Francesco Chiaravalloti, and Olga Petrucci

Floods and landslides are common natural phenomena that threaten society and ecosystems causing significant losses in term of human lives and financial damages. An in-depth investigation about the past occurrences of these events is of paramount importance for providing advances in the knowledge of natural and anthropogenic factors responsible for their generation. Considering rainfall as one of the key drivers for triggering physical mechanisms responsible for the occurrences of floods and landslides, a proper description of its characteristics needs to contemplate the intrinsic spatial and temporal variability. Despite the importance of such elements, rainfall monitoring often relies on sparse rain gauges, which lead to uncertainty in the identification of real rainfall patterns, making difficult to link precipitation records with observed damages. Meteorological radar represents a relevant tool for detecting rainfall spatiotemporal variability and providing ancillary information about the evolution of the events.

Goal of the work is to develop a methodology that aims in reconcile records of landslides and floods events with the rainfall structures obtained by the joint use of data recorded by rain gauge network and radar data. The research has been carried out by moving from a consolidated catalogue of damaging events occurred in correspondence of floods and landslides in Calabria region (Italy) in 2019 and 2020. Rainfall was investigated integrating rain gauge data and maps of Surface Rainfall Intensity with resolution of 1x1 km2.

Exploiting the availability of an accurate spatiotemporal reconstruction of precipitation structures, our investigation allowed to improve the specific knowledge about dynamics responsible of selected floods and landslides events. Preliminary results are supportive of the use of the proposed approach for integrating different sources of information in the assessment of the real dynamics of damaging events and for enhancing the use of their joint scientific content in the framework of risk assessment and mitigation.

How to cite: Totaro, V., de Sario, S., Chiaravalloti, F., and Petrucci, O.: The use of radar information for improving the knowledge about landslides and floods events: an application to Calabria region (Italy), EGU General Assembly 2024, Vienna, Austria, 14–19 Apr 2024, EGU24-15848, https://doi.org/10.5194/egusphere-egu24-15848, 2024.

EGU24-17412 | Orals | HS7.5 | Highlight

It could have come worse –  an analysis of spatial counterfactual scenarios for the July 2021 flood in the Ahr Valley, Germany 

Sergiy Vorogushyn, Li Han, Heiko Apel, Viet Dung Nguyen, Björn Guse, Xiaoxiang Guan, Oldrich Rakovec, Husain Najafi, Luis Samaniego, and Bruno Merz

After a flood disaster, the question often arises: “What if the event had gone differently?” For example, what would be the effects of a flood if the path of a pressure system and thus the precipitation field had occurred taken a different trajectory? The analysis of such alternative scenarios of precipitation footprints (“counterfactuals”) is a valuable approach for flood risk management in addition to classical extreme value statistical analyses. It helps to think about and prepare for extremes that have not occurred in this way, but which appear quite plausible.

Here, we analyze the spatial alternative scenarios of the deadly July 2021 flood in the Ahr Valley, Germany. The hydrological model mHM is driven with precipitation fields systematically shifted in space. The resulting runoff is transformed into inundation and flood impact indicators using the high-resolution hydrodynamic model RIM2D.

The results show that even a slight shift of the precipitation field by 15-20 km, which does not seem implausible due to orographic conditions, causes an increase in peak flows at the Altenahr gauge of over 30% and at individual tributaries of up to 160%. Also, significantly larger flood volumes can be expected due to precipitation shifts. This results in markable differences in inundation depths in a number of areas along the Ahr river valley. The presented results should encourage critical thinking about precautionary measures and risk management plans for extreme and unprecedented events.

How to cite: Vorogushyn, S., Han, L., Apel, H., Nguyen, V. D., Guse, B., Guan, X., Rakovec, O., Najafi, H., Samaniego, L., and Merz, B.: It could have come worse –  an analysis of spatial counterfactual scenarios for the July 2021 flood in the Ahr Valley, Germany, EGU General Assembly 2024, Vienna, Austria, 14–19 Apr 2024, EGU24-17412, https://doi.org/10.5194/egusphere-egu24-17412, 2024.

EGU24-17516 | Posters on site | HS7.5

Spatial patterns and determinants of severe geomorphological changes due to the extreme flood event in the Ahr valley, western Germany in July 2021 

Fabian Weidt, Rainer Bell, Lothar Schrott, Alexander Brenning, Michael Dietze, Lisa Burghardt, and Joshua Groeßer

The extreme flood event of July 14/15, 2021 caused massive geomorphological changes along the Ahr river in western Germany. The processes include mass movement and bank erosion, channel displacement and widening and deposition of material at the floodplains, all of which contributed to extreme damage. With the aim of gaining a more comprehensive understanding of the factors controlling these processes, spatial patterns of geomorphological changes on a regional scale are analyzed. A differential terrain model (DoD), calculated from digital terrain models (DTM) collected before and after the event using airborne laser scanning (ALS), serves as the data basis. The course of the river is divided into 120 m wide and 100 m long segments. Analyzing the cumulated volumetric loss per segment, which represents the explained variable proxying spatial variability in flood power, is conducted by using a multiple linear regression model. The independent variables considered in this investigation include peak discharge, valley floor width and river curvature. Additionally, a time series model, incorporating ARIMA and GARCH components, is applied to unravel patterns and anomalies along the course of the river while accounting for the autocorrelative and heteroscedastic structure of data. Both the native data and the residuals of all model types are used to examine effects of bridge failure and subsequent outburst waves on volumetric loss. The analysis shows that the strongest geomorphological changes are associated with high peak discharge and a small valley floor width. River segments containing destroyed arch bridges show significantly higher volumetric loss values than segments with destroyed slab bridges, intact bridges or no bridge at all. Spatially limited amplification of volumetric loss to 200 m downstream of destroyed slab bridges suggests a more rapid decrease in outburst wave power for those type of bridges in contrast to arch bridges. These findings provide evidence that there are construction types more appropriate than traditional arch bridges to prevent local augmentation of flood power caused by outburst waves resulting from bridge clogging and failure.

How to cite: Weidt, F., Bell, R., Schrott, L., Brenning, A., Dietze, M., Burghardt, L., and Groeßer, J.: Spatial patterns and determinants of severe geomorphological changes due to the extreme flood event in the Ahr valley, western Germany in July 2021, EGU General Assembly 2024, Vienna, Austria, 14–19 Apr 2024, EGU24-17516, https://doi.org/10.5194/egusphere-egu24-17516, 2024.

EGU24-18244 | ECS | Orals | HS7.5

The effects of extreme rainfall trends on compound flood risk: A case study over Greater Boston 

Stergios Emmanouil, Andreas Langousis, Elizabeth Perry, Luke Madaus, Joshua Hacker, and Emmanouil N. Anagnostou

Climate adaptation strategies and vulnerability assessments over coastal areas require proper modeling of the interplay and nonstationary nature of the physical processes involved in compound flooding. As a result of the reported upward trajectories of rainfall intensity over the Contiguous United States, flood risk estimates are also expected to vary. However, given the systematic and random inconsistencies of traditional extreme rainfall estimation approaches and the increased uncertainty surrounding climate model projections, the effects of climate change on the estimation of flood risk from compound hazards remains an open question. In this effort we aim to: (a) combine the observed rainfall intensity trends from the past 40 years (i.e., from 1979 to 2020; see also Emmanouil et al., 2022) across various scales of temporal averaging, with storm surge and antecedent streamflow conditions, to estimate how flood inundation levels evolve, and (b) assess the effects of those trends on flood risk estimation within areas affected by compound hydrological events. In doing so, we use hydrodynamic simulations of reported flood occurrences over the Greater Boston area (MA, United States) for a period of 20 years (i.e., from 2000 to 2019), along with the parametric modeling scheme proposed by Emmanouil et al. (2023). The latter has been shown to properly weight and link the exceedance probabilities of the main flood-driving mechanisms to the return periods of the maximum inundation levels, thus providing a sufficient depiction of the conditions over the studied domain and allowing for estimation beyond the range covered by the available simulations. Assuming that the dependence structure of the driving mechanisms remains time-invariant, our findings aim to enhance the understanding of how flood risk from compound hazards has been affected by extreme rainfall trends induced by the changing climatic conditions and, therefore, support decision-making on the design and protection of critical infrastructure.

References

Emmanouil, S., Langousis, A., Nikolopoulos, E. I., & Anagnostou, E. N. (2022). The Spatiotemporal Evolution of Rainfall Extremes in a Changing Climate: A CONUS‐Wide Assessment Based on Multifractal Scaling Arguments. Earth’s Future, 10(3). https://doi.org/10.1029/2021ef002539

Emmanouil, S., Langousis, A., Perry, E., Madaus, L., Hacker, J., and Emmanouil, E.N. (2023) Decomposing the effects of compound mechanisms on flood risk estimation for urban environments: A case study over Greater Boston, UrbanRain23, 12th International Workshop on Precipitation in Urban Areas, Pontresina, Switzerland, 29 November – 2 December 2023.

How to cite: Emmanouil, S., Langousis, A., Perry, E., Madaus, L., Hacker, J., and Anagnostou, E. N.: The effects of extreme rainfall trends on compound flood risk: A case study over Greater Boston, EGU General Assembly 2024, Vienna, Austria, 14–19 Apr 2024, EGU24-18244, https://doi.org/10.5194/egusphere-egu24-18244, 2024.

EGU24-18357 | ECS | Posters on site | HS7.5

Unveiling the complexity of social vulnerability: An analysis of the Social Vulnerability Index in Sweden (SVIS) 

Konstantinos Karagiorgos, Lars Nyberg, Nikos Kavallaris, Jenni Koivisto, Tonje Grahn, Ruth Björkholm, Johanna Gustavsson, and Sven Fuchs

In recent decades, social vulnerability assessments have become a valuable tool for gaining a deeper understanding of the effects of natural hazards on societies. These assessments aim to quantify and map human characteristics that contribute to potential loss, enabling the development of capacities and capabilities to respond to the emerging threats. Assessment methods range from qualitative approaches to semi-quantitative, often spatially explicit, place-based approaches, many of them with empirical background in respective case studies around the world. Despite these efforts, it is still important to carefully examine the potential benefits and limitations of these assessments, particularly those that focus on mapping and place-based approaches, in order to fully understand their value.

The purpose of this study (Karagiorgos et al., 2023) was to systematically evaluate the Social Vulnerability Index in Sweden (SVIS) developed by Haas et al. (2022) using a sensitivity analysis approach. This evaluation focuses on the sensitivity around the impact of changing aggregation scale levels, the influence of different options in constructing the index, the weight/contribution of each factor to social vulnerability and the indicators set. The aim was to determine the influence of input factor variation on model response.

Concerning the influence of scale variations on assessment outcomes, the SVIS algorithm demonstrated robustness when employed across various scales. In contrast, the factor retention method utilized yielded considerable differences in the results. Likewise, the weights' effect exerted a noteworthy influence on the index formation. The consideration of different subsets of variables revealed a high impact in certain scenarios.

The sensitivity analysis conducted in the index construction outlined in this study, recommends that the development of indexes proceed cautiously, accompanied by expert guidance. This approach ensures that the portrayal of social vulnerability remains both reasonable and consistent. Furthermore, the existence of other dimensions of vulnerability, such as physical, economic, and institutional, suggests that the SVIS be integrated with these dimensions. This integration can offer a comprehensive perspective on vulnerability, helping to identify and comprehend the primary pillars for use in Disaster Risk Reduction (DRR). It also contributes to a deeper understanding of the connections between social vulnerability models and the outcomes of disasters.

Haas, J.; Karagiorgos, K.; Pettersson, A.; de Goër de Herve, M.; Gustavsson, J.; Koivisto, J.; Turesson, K. & L. Nyberg (2022): Social sårbarhet för klimatrelaterade hot. Delstudie 2: Generella och hotspecifika index för social sårbarhet i Sverige. Myndigheten för samhällsskydd och beredskap, (MSB) rapport nr 1978, Karlstad.

Karagiorgos, K.; Kavallaris, N.; Björnholm, R.; Koivisto, J. & S. Fuchs (2023): Evaluation of the Social Vulnerability Index (SVIS) in Sweden. Swedish Civil Contingencies Agency (MSB), MSB report nr 2185, Karlstad. 

How to cite: Karagiorgos, K., Nyberg, L., Kavallaris, N., Koivisto, J., Grahn, T., Björkholm, R., Gustavsson, J., and Fuchs, S.: Unveiling the complexity of social vulnerability: An analysis of the Social Vulnerability Index in Sweden (SVIS), EGU General Assembly 2024, Vienna, Austria, 14–19 Apr 2024, EGU24-18357, https://doi.org/10.5194/egusphere-egu24-18357, 2024.

EGU24-19140 | ECS | Posters virtual | HS7.5

Sensitivity analysis of agricultural and hydrological droughts to rainfall deficits across India 

Syed Bakhtawar Bilal and Vivek Gupta

Drought is a natural phenomenon characterized by an extended period of insufficient rainfall for a particular area. These deficit in rainfall leads to shortage of water reserves across surface and sub-surface storages. Variations in these shortages arise from diverse factors such as regional climatic variations, geographical features, and land-use patterns. The primary objective of this study is to assess the sensitivity of agricultural and hydrological systems to rainfall deficits across different climatic zones. We aim to quantify the degree of responsiveness of agricultural and hydrological droughts to varying precipitation deficiencies using various statistical and modeling techniques. By examining the diverse responses in different regions, this research seeks to enhance our understanding of precipitation shortages on drought dynamics.

How to cite: Bilal, S. B. and Gupta, V.: Sensitivity analysis of agricultural and hydrological droughts to rainfall deficits across India, EGU General Assembly 2024, Vienna, Austria, 14–19 Apr 2024, EGU24-19140, https://doi.org/10.5194/egusphere-egu24-19140, 2024.

EGU24-19393 | ECS | Orals | HS7.5

Impact of long-lasting flood water on agricultural productivity: a case study of the May 2023 Emilia Romagna floods 

Margherita Sarcinella, Jeremy S. Pal, and Jaroslav Mysiak

Heavy rainfall events occurred in the Emilia-Romagna region in Northern Italy as a result of two major storms on May 2nd and 17th that led to the overflow of 22 rivers and triggered over 250 landslides. This event claimed 15 lives, forced 10 thousand people to evacuate and caused over 400 road closures. Due to a prior long-lasting winter drought and poor land use management that hampered effective water drainage, floodwaters stagnated for over a month in some areas, exacerbating the crisis. Over 40% of regional agricultural land was flooded leading to irreversible crop damage, in some instances, entire harvest loss. The objective of this study is to build a consistent and replicable methodology to quantify the agricultural damages and economic loss resulting from stagnated floodwater over cropland using the Emilia Romagna floods as a case study. The study emphasises the use of remote sensing data as a tool to achieve accurate impact estimates. Sentinel-1 SAR imagery is used to derive 10-meter resolution flood extent and duration maps at a revisit time of 3 to 6 days. The maps are matched with crop data available for the region from the iColt database and damages are computed as a function of ponded water duration and crop type as well as resistance to oxygen deprivation. The data, comprised of crop type, growing season and sowing date, allow for the characterization of the growth state of each crop at the time of flooding, implicitly providing insights on the probability of plant survival. The use of satellite-derived vegetation indices as markers for post-disaster crop recovery, with a focus on identifying crop-specific recovery rates and patterns is highlighted. This study highlights the need for collaborative efforts with key regional entities and can provide factual-hazard-based agricultural loss estimates to local institutions. These findings can guide targeted adaptation strategies, improve the spatial accuracy of loss assessment, and improve our comprehension of the aftermath of prolonged floods on agricultural output.

How to cite: Sarcinella, M., Pal, J. S., and Mysiak, J.: Impact of long-lasting flood water on agricultural productivity: a case study of the May 2023 Emilia Romagna floods, EGU General Assembly 2024, Vienna, Austria, 14–19 Apr 2024, EGU24-19393, https://doi.org/10.5194/egusphere-egu24-19393, 2024.

EGU24-19552 | Posters on site | HS7.5 | Highlight

Unveiling global sub-daily precipitation extremes: Insights and development of the INTENSE Project  

Hayley Fowler, Amy Green, Elizabeth Lewis, David Pritchard, Stephen Blenkinsop, Luis Patino Velasquez, and Anna Whitford

Precipitation extremes result in flooding and droughts, causing substantial damages and loss of life. Understanding the variability of precipitation extremes with climate change is challenging, as we do no fully understand processes causing extreme precipitation under current climate variability. The INTENSE project focuses on understanding of the nature and drivers of global sub-daily precipitation extremes and change on societally relevant timescales. As part of this a Global sub-daily precipitation dataset has been collected, containing hourly rainfall data from approximately 25,000 rain gauges across over 200 territories, from a wide range of sources. This has been quality controlled using a rule-based open-source methodology, combining a number of checks against neighbouring gauges, known biases and errors, and thresholds based on the Expert Team on Climate Change Detection and Indices (ETCCDI) Climate Change Indices.  

A set of global hydroclimatic indices have been produced, characterising key aspects of shorter duration precipitation variability, including intensity, duration and frequency properties. An analysis of the indices, trends and corresponding climatology is carried out, providing information on various sub-daily precipitation characteristics (including extremes) across large parts of the world. These indices are publicly available for as many gauges as possible, alongside a gridded dataset that also incorporates indices calculated for additional restricted-access gauge records. To progress further with this work, updates to the dataset are required, with work ongoing to update resources for 2016 onwards, and attempts to automate the process where open-source datasets are available. Any collaborations, information, suggested contacts and relevant resources for developing the dataset are welcomed. 

How to cite: Fowler, H., Green, A., Lewis, E., Pritchard, D., Blenkinsop, S., Patino Velasquez, L., and Whitford, A.: Unveiling global sub-daily precipitation extremes: Insights and development of the INTENSE Project , EGU General Assembly 2024, Vienna, Austria, 14–19 Apr 2024, EGU24-19552, https://doi.org/10.5194/egusphere-egu24-19552, 2024.

Draught is one of the major climate related disaster that Italy has been fighting in the recent years .It is a complex multidimensional phenomenon that is dependent upon on a wide variety of parameters ranging from climatic to socioeconomic ones. In this study we are considering watershed area of lake Bolsena, which is one of the most important water resources in central Italy, to asses in drought vulnerability using Geographical Information System (GIS)  in combination with the Analytic Hierarchy Process (AHP). GIS is used for the spatial analysis of drought for Lake Bolsena watershed area for the year 2022 which was one of the worst draught affected year in the history for the country. Parameters such as Monthly rainfall, Land use/Landcover (LULC), elevation , soil type, Normalized difference vegetation index (NDVI), Normalized Difference turbidity Index (NDTI),Normalized differentiate chlorophyl index(NDCI), Normalized Difference Water Index (NDWI),Storm power index (SPI)  were chosen and considered for the study. AHP is used to calculate weightage factors of each criterion based on the pairwise comparison matrices. The thematic maps of all the parameters were analyzed and Drought Vulnerability Assessment (DVA) map was generated using GIS. The output DVA map will provide valuable information on drought severity in the area and vulnerability related to water availability.

How to cite: Mazumdar, T., Di Francesco, S., Giannone, F., and Santini, M.: Drought vulnerability assessment and mapping using Multi-Criteria decision making (MCDM) and application of Analytic Hierarchy process (AHP) for watershed area of Lake Bolsena of Central Italy, EGU General Assembly 2024, Vienna, Austria, 14–19 Apr 2024, EGU24-19949, https://doi.org/10.5194/egusphere-egu24-19949, 2024.

Rich in biodiversity, Tumaco is a focal point for REDD+ projects that aim to combat deforestation and promote sustainable land use. Cacao farming, vital to the local economy, offers an opportunity to reconcile livelihoods and conservation. However, challenges remain in reconciling cacao and forest conservation. This study explores the benefits of sustainable cacao practices, such as agroforestry, for economic development and environmental conservation. It also looks at the challenges farmers face and the implications for the success of REDD+. Perceptions of climate change profoundly influence farmers' perspectives and behaviours in the context of REDD+ initiatives, shaping the sustainability and effectiveness of such efforts. Therefore, fostering a robust understanding of climate change among local farmers is critical to improving the integration of sustainable cacao production into REDD+ frameworks. This research aims to provide insights for policy makers and project implementers to advance both conservation and development goals in the Tumaco region, by addressing potential synergies and trade-offs between cacao production and REDD+ initiatives. The farmers' lack of knowledge is particularly worrying, not only for the fight against climate change, but also because if the cacao farmers of Tumaco do not see the incentives of carbon credits as a sustainable source of income, they will be forced to return to illegal crops, and the socio-environmental development of these communities will be compromised.

How to cite: Quiroga, S., Hernanz, V., Suarez, C., and Aguiño, J. E.: Evaluating the merit of Carbon Credits: Is there a lack of effectiveness in transitioning from direct Payments for Ecosystem Services to REDD+ community-based incentives?, EGU General Assembly 2024, Vienna, Austria, 14–19 Apr 2024, EGU24-20767, https://doi.org/10.5194/egusphere-egu24-20767, 2024.

EGU24-20944 | ECS | Posters on site | HS7.5

Towards optimizing the operation of controlled flood detention basins 

Mara Ruf and Daniel Straub

Floods are one of the most hazardous natural phenomena worldwide and they are predicted to increase both in intensity and frequency due to climate change. This necessitates comprehensive flood risk mitigation measures that are planned and controlled from a regional as well as a strategic trans-regional perspective.

Controlled flood detention basins can be effective measures for dealing with extreme flood events [1]. By temporally storing water in the detention basin, the discharge in a river is reduced. If the water is removed from the river at the optimal time, this should reduce the peak water level at downstream locations and hence the flood risk.

However, the identification of the optimal operation of flood detention basins is a non-trivial as well as non-deterministic problem. Flood forecast uncertainty, dilatation of the wave along the river channel and the uncertainty in the breaching process turns the polder operation into a stochastic optimization problem with multiple possible optimization targets. Hence, this optimization belongs to the class of sequential decision problems under uncertainty. In this contribution, we utilize a developed dynamic-probabilistic flood risk model [2] to analyze and optimize different control strategies as well as the effect of uncertainties on the optimality of the detention basin operation. We consider the case of a single detention basin as well as that of multiple detention basins that are arranged in series.


[1] De Kork, J.-L.; Grossmann, M. (2009): Large-scale assessment of flood risk and the effects of mitigation measures along the Elbe River. Natural Hazards (2010) 52:143-166.

[2] Ruf, M., Hoffmann, A., Straub, D. (2023): Application of a decision sensitivity measure for the cost-benefit analysis of a flood polder at the Bavarian Danube. 14th International Conference on Applications of Statistics and Probability in Civil Engineering (ICASP 14). Dublin, Ireland.

How to cite: Ruf, M. and Straub, D.: Towards optimizing the operation of controlled flood detention basins, EGU General Assembly 2024, Vienna, Austria, 14–19 Apr 2024, EGU24-20944, https://doi.org/10.5194/egusphere-egu24-20944, 2024.

EGU24-20988 | ECS | Posters on site | HS7.5

Assessment of future climate risk and vulnerability of local communities in High Mountain Asia 

Anju Vijayan Nair, Rahim Dobariya, Deo Raj Gurung, and Efthymios Nikolopoulos

Higher altitude regions like High Mountain Asia (HMA) are particularly affected by future climate change where the increasing temperature coupled with inconsistent precipitation results in rapid glacier melting during summers and less regeneration of glaciers in winters affecting the livelihoods of billions of people. Access to information on future climate change and related hazards is essential to significantly reduce the impacts on socio-economic systems in HMA. In this study, we focus on identifying the areas in northwest HMA where climate extremes are projected to increase in magnitude and/or frequency. For this, statistically downscaled climate projections (at 5km resolution) derived from a 30-member ensemble of GFDL SPEAR CMIP6 are used to evaluate the projected trends in precipitation and temperature (for years 2015 to 2100) over Afghanistan, Tajikistan, and northern Pakistan under SSP2-4.5 and SSP5-8.5 scenarios. Analysis of changes in precipitation and temperature with respect to the historic climate (1990 to 2014) is done to evaluate the vulnerability to climate hazards including droughts and heatwaves. Analysis of the changes in future climate revealed a rapid increase in the occurrence of droughts and heatwaves towards the end of the century, affecting several communities in the region. Following the methodology developed by the Implementation Platform of the EU Mission on Adaptation to Climate Change (MIP4Adapt), the climate risk and vulnerability of local communities in the region is quantified. The results of this study provide critical information to stakeholders and the local communities to proactively prepare for the anticipated climate risks in the future and to adopt appropriate mitigation measures.

How to cite: Vijayan Nair, A., Dobariya, R., Gurung, D. R., and Nikolopoulos, E.: Assessment of future climate risk and vulnerability of local communities in High Mountain Asia, EGU General Assembly 2024, Vienna, Austria, 14–19 Apr 2024, EGU24-20988, https://doi.org/10.5194/egusphere-egu24-20988, 2024.

EGU24-21687 | Orals | HS7.5 | Highlight

Understanding the dynamics of multi-sector impacts of hydro-meteorological extremes: a methods overview 

Mariana Madruga de Brito, Jan Sodoge, Alexander Fekete, Michael Hagenlocher, Elco Koks, Christian Kuhlicke, Gabriele Messori, Marleen de Ruiter, Pia-Johanna Schweizer, and Philip J. Ward

Hydro-meteorological extremes, such as droughts and floods, often trigger a series of compound and cascading impacts due to interdependencies between coupled natural and social systems. However, studies typically only consider one impact and disaster event at a time, ignoring causal chains, feedback loops, and conditional dependencies between impacts. Analyses capturing these complex patterns across space and time are thus needed to inform effective adaptation planning. Here, we present a collection of methods that can be used for assessing the dynamics of the multi-sector compound and cascading impacts (CCI) of hydro-meteorological extremes. We discuss existing challenges, good practices, and potential ways forward. Rather than pursuing a single methodological approach, we advocate for methodological pluralism. We see complementary or even convergent roles for analyses based on quantitative (e.g. data-mining, systems modeling) and qualitative methods (e.g. mental models, qualitative storylines). The data-driven and knowledge-driven methods provided here can serve as a useful starting point for understanding the dynamics of both high-frequency CCI and low-likelihood but high-impact CCI.

How to cite: Madruga de Brito, M., Sodoge, J., Fekete, A., Hagenlocher, M., Koks, E., Kuhlicke, C., Messori, G., de Ruiter, M., Schweizer, P.-J., and Ward, P. J.: Understanding the dynamics of multi-sector impacts of hydro-meteorological extremes: a methods overview, EGU General Assembly 2024, Vienna, Austria, 14–19 Apr 2024, EGU24-21687, https://doi.org/10.5194/egusphere-egu24-21687, 2024.

EGU24-3073 | Posters on site | HS7.6

Estimation of runoff coefficient and curve number based on observed rainfall-runoff events from contrasting catchments in the urban environment  

Mark Bryan Alivio, Matej Radinja, Nejc Bezak, and Zoltán Gribovszki

In most hydrological analyses, it is common practice to select values for the runoff coefficient (RC) and curve number (CN) from standard lookup tables available in literature-based handbooks or engineering manuals. However, these generic values may not adequately account for the distinct characteristics of a given catchment, particularly in urban environments where the heterogeneity of land use/land cover creates a diverse range of hydrological responses. This study focuses on estimating and analyzing the RC and CN based on observed rainfall-runoff events in two contrasting catchments in the city of Ljubljana, Slovenia, namely the urban mixed forest and highly impervious urban area. The analysis of 86 rainfall events that occurred between August 2021 and August 2023 revealed that the two studied catchments demonstrated contrasting runoff responses to rainfall, which could be attributed to their distinct land use/land cover patterns. The urban mixed forest generated an order of magnitude less runoff per unit of rainfall than the urban area. A mean RC of 0.1 was observed in the urban mixed forest, approximately 5 times less than those in the urban area (0.6). These computed mean RC values are lower compared to the tabulated RC values from the American Society of Civil Engineers (ASCE) manual for the given soil type and slope of the specific land use being compared. Similarly, the mean and median CN values in the urban mixed forest are 82.7 and 83.9, respectively, which are lower than the values recorded in the urban area (mean = 95.5, median = 96.8). Additionally, a standard behavior response with asymptotic CN of 71.7 and 90.7 was observed in the urban mixed forest and urban area, respectively. Thus, the CN values based on the central tendency method appear to be higher than the CN estimated from the standard asymptotic fit and the tabulated CN values of the Natural Resources Conservation Service National Engineering Handbook (NRCS-NEH). Furthermore, we observed an absence of statistically significant seasonal differences in RC and CN between the growing and dormant seasons in both catchments. However, a bi-monthly analysis revealed a temporal variation in both parameters, with RC peaking in autumn and CN being highest in winter. High-intensity storms in summer and long-duration heavy rainfall events in autumn may have potentially overwhelmed the dry antecedent soil conditions. Hence, examining specific rainfall-runoff events in the urban mixed forest revealed that the initial soil moisture and antecedent rainfall have a contributing role in the observed variations in RC and CN.


Acknowledgments: Results are part of the ongoing research entitled “Microscale influence on runoff” supported by the Slovenian Research and Innovation Agency (N2-0313) and National Research, Development, and Innovation Office (OTKA project grant number SNN143972). The study was also carried out within the scope of the CELSA project entitled “Interception experimentation and modeling for enhanced impact analysis of nature-based solutions”.

How to cite: Alivio, M. B., Radinja, M., Bezak, N., and Gribovszki, Z.: Estimation of runoff coefficient and curve number based on observed rainfall-runoff events from contrasting catchments in the urban environment , EGU General Assembly 2024, Vienna, Austria, 14–19 Apr 2024, EGU24-3073, https://doi.org/10.5194/egusphere-egu24-3073, 2024.

According to the United Nations projections, the global population is expected to continuously grow in the next years, reaching 9.7 billion by 2050, and more than 70% of it will live in cities, with a consequent intensification of urbanization. In this context, the increase of short but intense rainfall events, as foreseen by the Intergovernmental Panel on Climate Change for many geographical regions, will lead to an increment of pluvial floods in urban areas, due to a higher and faster runoff generation. Besides a more traditional approach, where the sewer system is simply updated with larger pipes, multiple nature-based solutions, also called blue-green solutions, have been proposed and implemented to mitigate the runoff generation from impervious surfaces. These innovative solutions aim to reintroduce natural elements in the urbanized areas, and benefit from the soil retention capacity to store water during intense rainfall events and release it in the environment via evaporation, evapotranspiration, and infiltration processes. With the installation of these solutions, the volume of water collected by the drainage system is limited and, consequently, the pluvial flood risk is reduced. Among the most common nature-based solutions, it is worth recalling green roofs, green walls, rain gardens and retention and detention basins, which guarantee multiple benefits for the urban environment. Besides the runoff reduction, these structures can, in fact, help lowering the average temperatures, limiting the generation of the urban heat island, they improve the air quality, facilitating the CO2 sequestration, they increase the biodiversity, and they add aesthetic value to the cities, supporting the citizens’ physical and mental health. In this framework, this work presents a review of the most common and efficient nature-based solutions, installed in cities to mitigate pluvial floods and to ensure a sustainable development of the urban environment. Several nature-based solutions have proposed to mitigate pluvial floods and have shown high potential at local scale, while a large scale, involving the entire city, needs to be further investigated. Moreover, the integration of different blue-green solutions in the urban environment should receive further attentions to enhance the creation of smart and resilient cities.

How to cite: Cristiano, E.: Implementing Nature-Based Solutions in the urban environment: benefits, limitations, and future challenges , EGU General Assembly 2024, Vienna, Austria, 14–19 Apr 2024, EGU24-3794, https://doi.org/10.5194/egusphere-egu24-3794, 2024.

EGU24-4612 | ECS | Posters on site | HS7.6

Urbanization and climate change impacts on future heavy summer rainfall in Milan, Italy 

Marika Koukoula, Herminia Torelló-Sentelles, and Nadav Peleg

Over the past fifty years, urbanization has undergone a swift surge, with over 50% of the global population now residing in cities. A further rise in urban population in the forthcoming decades is expected based on future projections. This surge in urbanization, along with associated alterations in land use/land cover, has the potential to modify the temporal and spatial characteristics of precipitation. Additionally, the anticipated escalation in global warming is likely to amplify both the magnitude and frequency of short-duration (convective) heavy rainfall. These two factors separately have the potential to lead to an increased risk of urban flooding. Consequently, it is imperative to comprehend how urbanization and climate change together may impact short-duration heavy rainfall events - a crucial aspect for effective flood risk assessments and planning sustainable urban drainage systems. To this end, we explore the influence of climate change and urbanization on the spatiotemporal properties of rainfall. Our investigation involves the simulation of current and future scenarios of urban development and warming over Milan, utilizing the convection-permitting Weather Research and Forecasting (WRF) physically-based atmospheric model. The findings of this study underscore that future urbanization will influence the distribution of rainfall in terms of both time and space. Furthermore, the combined effects of urbanization and climate change can significantly reshape the structure of short-duration heavy precipitation events.

How to cite: Koukoula, M., Torelló-Sentelles, H., and Peleg, N.: Urbanization and climate change impacts on future heavy summer rainfall in Milan, Italy, EGU General Assembly 2024, Vienna, Austria, 14–19 Apr 2024, EGU24-4612, https://doi.org/10.5194/egusphere-egu24-4612, 2024.

Statistically-based rainfall simulation has been a useful tool to generate long rainfall time series while preserving observed rainfall properties, commonly employed for hydrological applications such as drainage design. However, these models, typically constructed using historical gauge records, may overlook climate dynamics, failing to capture variations in underlying climate or weather conditions. Recent research works have aimed to address this limitation (Willems and Vrac, 2010; Kaczmarska et al., 2015; Cross et al., 2020; Ebers et al., 2023). For example, Cross et al. (2020) introduced a regression method linking monthly temperature to the parameters of a rainfall generator, while Ebers et al. (2023) proposed a temperature-dependent micro-canonical cascade model to enhance rainfall disaggregation for future climates. Many of these approaches adopt a temperature-dependent strategy due to the temperature dependence of the atmospheric precipitable water saturation value. Additionally, many of these methods involve using temperature in an 'aggregated' manner, associating the temperature averaged over a specific time duration (e.g., monthly or daily) with model parameters over the same duration. In this study, we aim to examine the soundness of this common approach, addressing two key research questions:


  • Given the complex atmospheric processes governing precipitation, is relying solely on temperature as a covariate for statistical rainfall simulation adequate?
  • Is the current 'aggregated' approach the most optimal method for incorporating temperature as a covariate?


To address these two questions, we employed the deep-learning model AtmoDist, proposed by Hoffmann and Lessig (2022). This model effectively captures underlying climate dynamics by extracting relevant features from successive input atmospheric variables and deriving the time difference between them based on the extracted features. We trained the model using input atmospheric variables with two different temporal arrangements: aggregation and concatenation. Aggregation, similar to many existing temperature-dependent approaches, involves averaging (or summing) temperature over a given duration with no overlap. Concatenation, on the other hand, involves simply concatenating temperature into a sequence over a given duration, preserving the entire temperature profile.


After successful training, we examined derived features and traced model weights to quantify the importance of each input atmospheric variable and to assess the impact of different temporal arrangements. For this experiment, we utilised four atmospheric variables (temperature, geopotential, u and v components of wind) from ERA5 hourly data spanning from 1940 to 2008. Results indicate that in an 'aggregated' arrangement, the model assigns similar weights to temperature and u and v components of wind. In a 'concatenation' arrangement, temperature plays a dominant role in capturing climate dynamics. These findings suggest that the common approach of solely using temperature as a covariate and in an 'aggregation' manner may not be the most optimal. Instead, Including additional variables or using temperature as a covariate in a 'concatenation' manner is recommended.

How to cite: Chen, P.-C. and Wang, L.-P.: Unlocking deep insights into temperature-dependent rainfall simulation: are we approaching it optimally?, EGU General Assembly 2024, Vienna, Austria, 14–19 Apr 2024, EGU24-4909, https://doi.org/10.5194/egusphere-egu24-4909, 2024.

The rapid development of urbanization has significant impacts on regional climate, and thereby affects the hydrological characteristics of urban areas. Urban hydrological models have been mainly focused on the changes in hydrological response caused by complex urban underlying surfaces and urban pipe network construction in previous studies, while there is a need to strengthen research on the climate change patterns caused by urbanization. Vapor pressure deficit (VPD) is a key indicator for studying water cycle in climate system, and it has a close relationship with hydrological processes such as precipitation, evapotranspiration, and surface water transport. However, as a meteorological indicator affected by multiple factors, a deep understanding of the quantitative analysis method for the contribution of different factors to VPD changes is still lacking. This study uses a urban-rural station pairing method to analyze the impact of urbanization and proposes a method based on partial differential equations to quantitatively explore the contribution of different factors to urban-rural VPD difference. Taking daily-scale data of urban-rural paired stations in mainland China as an example, the study finds that urbanization significantly increases VPD in the core urban areas, and the urban-rural VPD difference gradually expands over time, showing significant seasonal and geographical variations. The method based on partial differential equations can effectively capture the trend of the urban-rural VPD difference, thereby confirming the validity of the derived method for evaluating the contributions. Relative humidity is the main factor contributing to the urban-rural differences in VPD in most regions, but shows a different pattern in some plateau continental climate regions. This study establishes a framework for analyzing the impact of urbanization on specific meteorological indicators, especially providing a way to quantify the contribution of factors causing urban climate change, which is of reference value for further considering the uniqueness of urban climate in the construction of urban hydrological models.

How to cite: Gong, S., Xia, J., and She, D.: Quantifying the impact of urbanization on regional climate based on a partial differential method: a case study of vapor pressure deficit, EGU General Assembly 2024, Vienna, Austria, 14–19 Apr 2024, EGU24-4921, https://doi.org/10.5194/egusphere-egu24-4921, 2024.

EGU24-5081 | ECS | Posters on site | HS7.6

pyBL: an open source Python package for fine-scale rainfall modelling with short records based upon a Bartlett Lewis model 

Li-Pen Wang, Chi-Ling Wei, Pei-Chun Chen, Chien-Yu Tseng, Ting-Yu Dai, Yun-Ting Ho, Ching-Chun Chou, and Christian Onof

Bartlett-Lewis (BL) model is a stochastic model that represents rainfall based upon the theory of Poisson cluster point process. It had been used for daily and hourly stochastic rainfall time series modelling for over 30 years. It was however known to underestimate sub-hourly rainfall extremes until some recent advances, where this shortcoming has been overcome. It could therefore serve as an alternative to the existing rainfall frequency analysis methods based upon, for example, annual maxima time series.

The implementation of the BL model is however a non-trivial task. The formulation of the BL model is of high complexity, and the calibration of the model parameters constitutes a nonlinear optimisation process with high numerical instability. This hinders the widespread use of the BL model. Another computational challenge of BL modelling lies in sampling. In particular, when using this type of rainfall generators, it often requires sampling a large number of long-term realisations.

In this work, with the purpose of promoting BL model and of demonstrating its capacity in modelling sub-hourly rainfall (both standard and extreme statistics), we have initiated an open source Python library for the BL model: pyBL, where a set of data structures and algorithms are designed specifically for the BL model, making the fitting and sampling processes more efficient and lightweight in terms of memory. In particular, one of our designs is a lossless time series compression method that perfectly suits BL model and a set of algorithms and can calculate statistical properties without any decompression. Additionally, we have implemented user interfaces and packaging at various levels, making experimental adjustments and optimisation methods more flexible and concise.

Finally, two scientific experiments resembling real-world scenarios were conducted here to demonstrate pyBL's capacity of modelling sub-hourly rainfall extremes with short records, as well as flexibility of utilising records at various resolutions and with various data lengths. We show that, with the help from the BL model, we can well model hourly and sub-hourly rainfall extremes with merely half data length required by the widely-used Annual Maxima method.

How to cite: Wang, L.-P., Wei, C.-L., Chen, P.-C., Tseng, C.-Y., Dai, T.-Y., Ho, Y.-T., Chou, C.-C., and Onof, C.: pyBL: an open source Python package for fine-scale rainfall modelling with short records based upon a Bartlett Lewis model, EGU General Assembly 2024, Vienna, Austria, 14–19 Apr 2024, EGU24-5081, https://doi.org/10.5194/egusphere-egu24-5081, 2024.

EGU24-5437 | Posters on site | HS7.6

Using personal weather station data for improving precipitation estimates and gauge adjustment of radar data 

Jochen Seidel, Thomas Einfalt, Markus Jessen, András Bárdossy, Abbas El Hachem, and Adrian Treis

Personal Weather Stations (PWS) are simple, low cost meteorological instruments that can be set up by private persons or companies. In Central Europe, the number of PWS has increased significantly over the last years, in the meantime clearly outnumbering the number of rain gauges operated by national weather services and other authorities. However, the data from PWS suffer from many drawbacks since these stations are not set up and maintained according to professional standards. Apart from this, there are additional sources of errors and uncertainty originating from data transmission errors and incorrect information about the location of a PWS. Hence, the precipitation data from PWS has to be filtered and corrected before this information can be used e.g. for improving precipitation interpolation. Such algorithms have been developed e.g. by de Vos et al. (2019) and Bárdossy et al. (2021).

In the area of the water boards Emschergenossenschaft and Lippeverband (EGLV), investigations were carried out to determine whether data from private weather stations (PWS) can improve the interpolation of rainfall fields and if PWS can be used for the gauge-based adjustment of radar data. The area of the EGLV is located in a densely populated area in the federal state of North Rhine-Westphalia, where there is also a large number of PWS available. Furthermore, the EGLV operates a dense rain gauge network which is required for the quality control (QC) algorithm by Bárdossy et al. (2021) which was used in this study.

The results show that the additional information from PWS can capture the spatial structures of precipitation better than a standard measurement network alone. However, the spatial resolution and the maxima of the radar data are not achieved, especially in areas with low PWS density. Another aspect that was investigated is the question whether individual PWS can be used for the gauge adjustment of radar data. In principal, individual quality controlled PWS can be used for this purpose, there are however issues due to data gaps and the underestimation of hourly precipitation maxima, which currently limits the use of PWS for commonly used gauge-adjustment procedures.

References

Bárdossy, A., Seidel, J., and El Hachem, A. (2021), The use of personal weather station observations to improve precipitation estimation and interpolation. Hydrol. Earth Syst. Sci., 25, 583–601.

de Vos, L., Leijnse, H.,Overeem, A., and Uijlenhoet, R. (2019), Quality control for crowdsourced personal weather stations to enable operational rainfall monitoring. Geophysical Research Letters,46,8820–8829.


How to cite: Seidel, J., Einfalt, T., Jessen, M., Bárdossy, A., El Hachem, A., and Treis, A.: Using personal weather station data for improving precipitation estimates and gauge adjustment of radar data, EGU General Assembly 2024, Vienna, Austria, 14–19 Apr 2024, EGU24-5437, https://doi.org/10.5194/egusphere-egu24-5437, 2024.

EGU24-7318 | ECS | Posters on site | HS7.6

Incorporating cell evolution into object-based convective storm nowcasting 

Yun-Man Hsu and Li-Pen Wang

Radar-based nowcasting plays a crucial role in meeting the urgent demand for short-term, high-intensity convective rainfall predictions. Given the dynamic and clustering nature of convective storms, object-based nowcasting has emerged as an effective approach, characterised by its ability to identify, track, and extrapolate their motion. These models excel in identifying rainfall objects in radar images and constructing their temporal associations. However, a critical limitation in many of existing methods lies in their lack of mechanism to incorporate the evolution of rain cell intensity into the nowcasting process.

A recent study by Cheng et al. (2023) demonstrated the effectiveness of utilising convective core altitude – a property retrieved from three-dimensional radar data– to improve the prediction of the evolution of single-core convective cell lifecycle. Their results suggest that, compared to persistence nowcasts, the prediction errors in rainfall intensity can be reduced by 50% at 15-min forecast lead time. However, this model focused on predicting ‘mean’ cell properties, while promising, still falls short for operational forecasting.

This research aims to enhance object-based nowcasting by developing methods to integrate the cell evolution model proposed by Cheng et al. (2023) with an operational positional forecasting model. A recent development of a Kalman filter based object-based convective storm nowcasting model, co-developed by researchers from several international sectors and the UK Met Office (Wang et al., 2022), is employed here for positional prediction of convective cells. The key challenge of the integration lies in producing spatial-distributed convective cell nowcasts and the associated evolution prediction uncertainty that can be incorporated with the positional prediction uncertainty under a Kalman filter framework. 

To tackle this challenge, we test on two approaches. Inspired by Shehu and Haberlandt (2022), the first approach employs a cell analog method to identify historical cells with similar mean properties predicted by the cell evolution model. Those cell analogs with high similarity are then used to empirically constitute prediction uncertainty. For the second approach, we generate spatially-distributed cells via fitting bivariate Gaussian or Exponential shape (Willems, 2001; Féral et al., 2003) models using predicted mean properties, which can further cell samples with similar mean properties. Two approaches will then be integrated with the positional nowcasting model, respectively. Probabilistic nowcasting will be undertaken to generate ensemble nowcasts that account for both positional and evolution variations. Ensemble members from each approach at each forecasting time step can constitute a convective storm ‘hazard’ map. We will indirectly evaluate the performance of two proposed approaches via assessing these hazard maps with radar observations. 

How to cite: Hsu, Y.-M. and Wang, L.-P.: Incorporating cell evolution into object-based convective storm nowcasting, EGU General Assembly 2024, Vienna, Austria, 14–19 Apr 2024, EGU24-7318, https://doi.org/10.5194/egusphere-egu24-7318, 2024.

EGU24-8681 | ECS | Orals | HS7.6

Modeling the effects of urbanization expansion on convective precipitation: Insights from Shanghai 

Qi Zhuang, Marika Koukoula, Shuguang Liu, Zhengzheng Zhou, and Nadav Peleg

With the expansion of large metropolitans and the increasing global population, there is a pressing need to have a better understanding of how cities affect extreme weather, especially heavy rainfall events that can potentially trigger urban floods. With the complex interplay and feedback between land, sea, and atmosphere, our understanding of how urbanization expansion impacts precipitation in coastal areas is limited. Here we use a high-resolution Weather Research and Forecasting (WRF) convection-permitting model to simulate 24 summer convective storms over Shanghai, China. We simulated the storms for the present urban setting and considered additional 3 urban expansion scenarios. Our results show that diverse urban-induced precipitation anomalies occur over the Shanghai metropolis due to different urban-surroundings gradients of low-level temperature and water vapor. 37.5% of storms show a constant increase in precipitation accumulation in response to urban expansion, whereas 29% have the reverse trend. The findings provide the potential mechanisms of urban rainfall modification in areas where land and water interact, offering useful insights for urban planning and flood control strategies in Shanghai, as well as other rapidly urbanizing cities.

How to cite: Zhuang, Q., Koukoula, M., Liu, S., Zhou, Z., and Peleg, N.: Modeling the effects of urbanization expansion on convective precipitation: Insights from Shanghai, EGU General Assembly 2024, Vienna, Austria, 14–19 Apr 2024, EGU24-8681, https://doi.org/10.5194/egusphere-egu24-8681, 2024.

EGU24-10466 | ECS | Posters on site | HS7.6

Kinematic Hierarchical Filling-&-Spilling vs. fully 2D schemes for pluvial inundation 

Kay Khaing Kyaw, Valerio Luzzi, Stefano Bagli, and Attilio Castellarin

Urban areas are especially vulnerable to the effects of pluvial flooding due to the high population density and concentration of valuable resources as well as the fact that heavy precipitation events are becoming more common and more intense because of climate change. The use of high-resolution hydrologic-hydraulic numerical models for pluvial flood risk assessments in large metropolitan areas is still very resource-intensive. Several studies have pointed out the potential of fast-processing DEM-based methods, like Hierarchical Filling-&-Spilling Algorithms (HFSAs), considering the increasing availability of LiDAR (Light Detection and Ranging) high-resolution DEMs (Digital Elevation Models). We have developed a fast-processing HFSA, as part of a web-based digital twin solution for flood risk intelligence (see https://saferplaces.co/), that enables building-by-building pluvial flooding hazard and risk modelling in large urban areas by accounting for spatially distributed rainfall input and infiltration processes through a pixel-based Green-Ampt model. In this study, we upgrade SaferPlaces’ HFSA based on kinematic wave approximation to depression points and analysing the impact of flow contributions from one cell to another on the formulation of travel time, as well as the backwater effect in depression-related watershed areas. We present the first applications of the kinematic HFSA, comparing it with two state-of-the-art fully 2D rain-on-grid inundation models (i.e. HEC-RAS and UnTRIM). We discuss the potential and limitations of Saferplaces' upgraded HFSA and identify future research possibilities.

Keywords: Hierarchical Filling-&-Spilling Algorithms, kinematic wave, pluvial flooding, rain on grid.

How to cite: Kyaw, K. K., Luzzi, V., Bagli, S., and Castellarin, A.: Kinematic Hierarchical Filling-&-Spilling vs. fully 2D schemes for pluvial inundation, EGU General Assembly 2024, Vienna, Austria, 14–19 Apr 2024, EGU24-10466, https://doi.org/10.5194/egusphere-egu24-10466, 2024.

EGU24-10727 | Orals | HS7.6

A flood prediction framework: integrating seamless predictions into urban hydrological modeling  

Ricardo Reinoso-Rondinel, Daan Buekenhout, Michiel van Ginderachter, Ruben Imhoff, Lesley De Cruz, and Patrick Willems

In recent times, the escalating occurrences of intense precipitation and flooding have exposed substantial socio-economic repercussions, with projections indicating a further rise in their impact due to climate change. Addressing this issue necessitates timely warnings for actions like neighborhood evacuations. However, issuing such warnings poses a dual challenge. On the one hand, it demands accurate forecasts, a difficult task given the heterogeneous nature of rainfall. On the other hand, modeling hydrological processes tied to flood prediction in urban and valley settings proves arduous due to their nonlinear characteristics. Additionally, the accuracy and lead time of forecasted precipitation significantly influence hydrological models, making it challenging for a warning system to generate reliable predictions of flooding events.

This study introduces a comprehensive flood prediction framework that combines: 1) a probabilistic seamless prediction model spanning up to 12 hours, achieved by blending 48 ensemble members from radar-based nowcasting and numerical weather prediction (NWP) ALARO/AROME models, and 2) a distributed hydrodynamic model tailored for urban flood prediction. The primary objective is to evaluate the framework's efficacy in predicting catchment responses, accounting for inherent uncertainties within the models.

For illustrative purposes, rainfall rate estimates are derived from the rain-gauge adjusted radar product managed by the Royal Meteorological Institute of Belgium (RMI). The blended forecast product is sourced from the open-source pysteps community, customized by the RMI for operational use. The hydrodynamic model for flood prediction is implemented through the InfoWorks ICM software, configured to simulate flooding at street level in the city of Antwerp, Belgium. Case studies involve impactful events that led to flooding in major cities within the Flanders area.

Initial findings indicate that, for a rapidly evolving convective storm, precipitation forecasts remained reliable up to 180 minutes in advance, while the flood forecast model predicted flooding levels 2 hours in advance. This analysis is anticipated to underscore the advantages and limitations of an integrated probabilistic approach to flood prediction at urban scales, emphasizing the necessary compatibilities among rainfall products and their representation of uncertainties. The insights gained from this study will contribute to the development of data-driven urban flood prediction models in Belgium for real-time hydrological forecasting. 

How to cite: Reinoso-Rondinel, R., Buekenhout, D., van Ginderachter, M., Imhoff, R., De Cruz, L., and Willems, P.: A flood prediction framework: integrating seamless predictions into urban hydrological modeling , EGU General Assembly 2024, Vienna, Austria, 14–19 Apr 2024, EGU24-10727, https://doi.org/10.5194/egusphere-egu24-10727, 2024.

EGU24-10830 | ECS | Posters on site | HS7.6

Morphing 2-D rainfall fields based on temperature shifts as a basis for future urban flood assessment 

Wenyue Zou, Daniel B. Wright, and Nadav Peleg

2-D rainfall fields play a critical role in assessing urban flood impacts and planning drainage systems. High-resolution rainfall fields, obtained from remote sensing devices such as weather radar and satellites, are not largely available and are even more limited for rainfall and flood frequency applications. One method that can be used to estimate extreme rainfall frequency—even with limited data—is Stochastic Storm Transposition (SST), which transposes observed rainfall fields within a region. In the context of climate change, there is a need to alter the observed rainfall fields to account for nonstationary changes in storm intensity and structure. Here, we suggest using Spatial Quantile Mapping (SQM) to modify the intensities and structures of rainfall fields with temperature as a covariate to generate an archive of plausible rainfall fields, which can then be used within SST as an input to assess changes in rainfall and floods. We take Beijing city as a case study, employing 22 years of 1 km hourly downscaled rainfall from CMORPH and near-surface air temperature data from ERA5, to demonstrate the effectiveness of this approach. Initially, SST is run under the current climate and validated for the 2- to 100-year rainfall return levels compared with those of 21 stations within Beijing city. Subsequently, according to the observed relationships between hourly rainfall and temperature, the rainfall fields are modified by the SQM method to fit future temperature conditions. Ultimately, the future extreme rainfall intensities, ranging from 2- to 100-year return levels, are obtained through the integration of the SST and SQM methods. The results indicate that the combined SST-SQM approach can be efficiently used to estimate future rainfall extremes in a changing climate.

How to cite: Zou, W., B. Wright, D., and Peleg, N.: Morphing 2-D rainfall fields based on temperature shifts as a basis for future urban flood assessment, EGU General Assembly 2024, Vienna, Austria, 14–19 Apr 2024, EGU24-10830, https://doi.org/10.5194/egusphere-egu24-10830, 2024.

The need for precipitation data for calibrating hydrodynamic sewer network models is often compromised by using the nearest available rain gauges to study area. Due to the scarcity and irregular locations of the rain gauges, this way of satisfying the need for precipitation data can lead to incorrect conclusions with respect to the temporal and spatial patterns of precipitation, depending on the location of the rain gauges in the study area. Recent developments in the field of precipitation measurement by means of weather radar data open up new possibilities for the use of such data sources in hydrodynamic sewer network models. Even though weather radar provides precipitation information with a high temporal and spatial resolution, the raw radar data contains several sources of error and is inaccurate. The radar data are therefore often corrected and merged with ground measurements. The main objective of this study is to investigate the resolution of precipitation data required to obtain robust results in a hydrodynamic channel network model. The study area is a small catchment close to Munich in Bavaria, Germany. Data from the Isen weather radar station of the German Weather Service (DWD), which is located around 33 km from the study area, was used. Following the objectives of this study, various weather radar data products were processed in order to be used as input for a hydrodynamic sewer network model. The data with a temporal resolution of 5 minutes to 1h and a spatial resolution of 250 m x 250 m up to 1.000 m x 1.000 m form the basis for creation of datasets to be investigated. It has been observed that the use of high-resolution precipitation data leads to better model results, especially when the data is merged with rain gauges. However, it should be noted that the quality of the model results does not decrease linearly when the resolution of the precipitation data is reduced.

How to cite: Rabiei, E., Hoppe, H., and Lebrenz, H.: Analysis of the resolution of precipitation data required to obtain robust results from a hydrodynamic sewer network model, EGU General Assembly 2024, Vienna, Austria, 14–19 Apr 2024, EGU24-12090, https://doi.org/10.5194/egusphere-egu24-12090, 2024.

EGU24-13420 | Orals | HS7.6

Attributing the Variability of Hershfield Rainfall Sampling Adjustment Factors at Sub-Hourly Durations 

Claudio Meier, Patricio Muñoz-Proboste, Apeksha Marasini, Nischal Kafle, and Francesco Dell'Aira

Engineers and scientists need to describe extreme precipitation at a location. For any duration of interest, IDFs (or DDFs) represent the rainfall that can be expected to be equalled or exceeded with a certain frequency. In urban drainage, for durations ranging from a few minutes to a few hours, DDFs must be derived analyzing maxima obtained from “continuously measuring” raingauges. However, most rainfall records are not truly continuous, but are instead totalized. As we cannot know the actual maxima in continuous time for those shorter rainfall durations similar to gauge resolution, we introduce a negative bias. Only recently, within the last 10 to 15 years at most, meteorological agencies in developed countries have widely installed raingauges with 1-min resolution, which are basically continuous. This means that the DDFs that we presently use all came from totalized data. How were these biased, “fixed maxima” converted into values that are closer to the actual, unconstrained maxima?


The traditional solution has been to use so-called rainfall sampling adjustment factors (SAFs), also referred to as Hershfield factors. These multiplicative correction factors can be derived at raingauges with higher temporal resolution, so that maxima can be extracted using sliding time windows which are closer to continuous, allowing for comparison with maxima extracted from the same data, but totalized. Typically, such SAFs are assumed to be applicable at other locations, or even universally. The constrained maxima extracted from totalized data are simply multiplied by a SAF in order to obtain their corresponding unconstrained equivalents, which are considered to be the actual, continuous maxima, that are then used to determine DDFs.


We found several important issues and research gaps with the way we determine and apply SAFs in current practice: (i) different authors have used varied procedures to compute them, without comparing or discussing, (ii) no one has looked at the variability of SAFs at a given location, and (iii) SAFs are determined as a mean or central tendency value, across multiple locations, without considering their variability and how it affects the resulting predictions of extreme rainfall.


We use 862 German stations and 147 ASOS US stations, with 1-min rainfall data, to perform a detailed analysis of rainfall SAFs. Our aims are to compare the different procedures that have been proposed, study SAF variability both at a station and in space, and propose a unified engineering methodology for dealing with totalization effects on extreme rainfall estimation. As the 1-min records are short (10 to 15 years), we use partial duration series to compute the rainfall quantiles, restricting our work to low and intermediate ARIs, avoiding estimation issues.


Our results suggest that: (i) there is a preferred procedure for computing SAFs that should be adhered to, (ii) at-a-station variability of SAFs is large enough to be relevant for engineering design considerations, (iii) SAFs display spatial structure, and (iv) all of these findings should be studied in different regions, and consistently incorporated into engineering practice.

How to cite: Meier, C., Muñoz-Proboste, P., Marasini, A., Kafle, N., and Dell'Aira, F.: Attributing the Variability of Hershfield Rainfall Sampling Adjustment Factors at Sub-Hourly Durations, EGU General Assembly 2024, Vienna, Austria, 14–19 Apr 2024, EGU24-13420, https://doi.org/10.5194/egusphere-egu24-13420, 2024.

EGU24-13555 | ECS | Orals | HS7.6

Comparative Urban Pluvial Flood Risk Assessment: A Globally Applicable Workflow for Data-Scarce Environments 

Jovan Blagojevic, Athanasios Paschalis, Joao Leitao, Nadav Peleg, and Peter Molnar

In this study we propose a new methodology for pluvial flood risk estimation, combining stochastic rainfall modelling, climate projection based adaptations of the rainfall frequency-intensity relations and DEM data sets, along with hydrodynamic modelling.

New global precipitation datasets, such as CMORPH, GSMaP or MERRA2 offer an affordable and accessible solution for water resource and water-hazard risk management in data-scarce regions and enable comprehensive global comparative studies. However, these datasets, often derived from satellite observations and coarse-scale climate modelling, consistently underestimate short-duration, high-intensity rainfall events, particularly those lasting one hour or less, that belong to the tails of the distributions (i.e., return levels higher than 30-year). This underestimation goes beyond spatial scale considerations, commonly addressed by areal reduction factors. Consequently, utilizing these global datasets for pluvial flood risk analysis results in conservative flood risk estimates.

The availability of global terrain models and mapped man-made structures like buildings, channels, and roads enables the generation of wide-coverage digital surface models. These can be used for flood inundation modelling in combination with corrected extremes of the global precipitation data sets, allowing near-global rough flood risk estimates.

In this study, we introduce a methodology for estimating pluvial flood risk using openly available global datasets. To achieve this, we derive hourly-scale Intensity-Duration-Frequency (IDF) curves suitable for pluvial flood inundation modeling in ungauged areas using global precipitation datasets. The first step uses high temporal resolution satellite remote sensing rainfall data (GSMaP) to train a stochastic rainfall generator model - the point process Bartlet-Lewis model. Subsequently, the weather generator is used to disaggregate daily global precipitation data (GPCC) through stochastic ensemble simulation. The resulting disaggregated ensemble data is then utilized to generate more accurate IDF curves including uncertainty, forming the basis for pluvial flooding risk assessments.

Our approach integrates the openly available FabDEM terrain model with OpenStreetMap to generate digital surface models for flood risk modeling analysis. Discrepancies in flood inundation risk estimates in urban environments, attributable to underestimated rainfall intensity, are demonstrated using CADDIES, a 2-dimensional hydrodynamic model. The workflow allows the IDF curves for the current climate to be adapted based on climate model projections of temperatures using the Clausius–Clapeyron relation, and to study their impact on future flood risk. A comparative risk analysis is presented for several tropical coastal cities, including future pluvial risk projections. All analytical steps adhere to FAIR principles, utilizing publicly available datasets. The proposed workflow provides globally applicable first order estimates of pluvial flood risk, especially in data-poor areas, with better quality than existing global IDF studies or IDF curves derived directly from global precipitation datasets.

How to cite: Blagojevic, J., Paschalis, A., Leitao, J., Peleg, N., and Molnar, P.: Comparative Urban Pluvial Flood Risk Assessment: A Globally Applicable Workflow for Data-Scarce Environments, EGU General Assembly 2024, Vienna, Austria, 14–19 Apr 2024, EGU24-13555, https://doi.org/10.5194/egusphere-egu24-13555, 2024.

EGU24-14536 | Orals | HS7.6

A new Dataset for Belowground Urban Stormwater Networks over the U.S. 

Hongyi Li, Seife Eriget, Taher Chegini, Gautam Bisht, Darren Engwirda, Dongyu Feng, Chang Liao, Zeli Tan, Donghui Xu, Tian Zhou, and Ruby Leugn

Belowground urban stormwater network (BUSN) data are usually not available to the public at the regional or national scales, hindering predictive understanding of BUSN’s impacts on urban flooding under extreme climates. We derived a national BUSN dataset over the contiguous United States by leveraging a newly developed algorithm based on graph theory and extensively available information such as street networks, landuse, topography, etc. For the convenience of hydrologic modeling, the generated BUSN national dataset is available in a vector format and organized to the 12-digit Hydrologic Unit (HUC12) watersheds, the smallest hydrologic unit defined by the U.S. Geologic Survey. There are two categories of data included in this dataset: 1) network-level information, such as the spatial typology and connectivity between the stormwater pipes; 2) pipe-level information, such as pipe diameter, length, slope, and roughness. Data quality control is also performed to ensure the completeness of BUSN within each HUC12 watershed. We will also discuss the possible causes for the biases in the estimated BUSN, and briefly demonstrate using this dataset in an integrated urban-hydrologic modeling framework over the U.S. We suggest this dataset can be valuable for understanding and modeling urban flooding processes at regional and larger scales.

How to cite: Li, H., Eriget, S., Chegini, T., Bisht, G., Engwirda, D., Feng, D., Liao, C., Tan, Z., Xu, D., Zhou, T., and Leugn, R.: A new Dataset for Belowground Urban Stormwater Networks over the U.S., EGU General Assembly 2024, Vienna, Austria, 14–19 Apr 2024, EGU24-14536, https://doi.org/10.5194/egusphere-egu24-14536, 2024.

EGU24-15683 | ECS | Posters on site | HS7.6

Urban surface runoff under simulated heavy rainfalls 

Aleksandra Czuchaj, Mikołaj Majewski, and Marek Marciniak

In the face of ongoing climate change, changes in precipitation patterns are observed. More and more often, rainfall is characterized by high intensity and short duration. Such rainfall poses a threat to urban areas as it may generate urban flash floods. As a result of intense rainfall on impermeable surfaces, surface runoff accumulates and the capacity of the storm sewer system is exceeded. The aim of the presented research was to identify the dynamics of surface runoff depending on the rainfall intensity, type of land cover and soil moisture conditions. It was carried out as a series of field experiments with a rainfall simulator.

The experiment was conducted at the research station located in the Różany Strumień catchment (Poznań, Poland). The station consists of 4 plots (20 x 1 m each), with different land cover: black fallow, grass, concrete paver blocks and an impermeable testing plot. The program of experiments included seven types of precipitation, corresponding to the classification of Chomicz from A0 (strong rain, intensity 4 mm∙h-1, duration 360 min) to B2 (torrential rain, intensity 60 mm∙h-1, duration 70 min). Each rainfall was simulated twice in dry and wet ground conditions. The experiment was carried out in July 2022.

The result of field research is 56 surface runoff dynamics curves depending on: type of land cover, precipitation category according to Chomicz and soil moisture conditions. On the basis of curves obtained from the experiments, four new descriptors were determined, characterizing the variability of surface runoff in urbanized areas: volume of surface runoff, runoff coefficient, the moment of runoff initiation and runoff dynamics coefficient.

How to cite: Czuchaj, A., Majewski, M., and Marciniak, M.: Urban surface runoff under simulated heavy rainfalls, EGU General Assembly 2024, Vienna, Austria, 14–19 Apr 2024, EGU24-15683, https://doi.org/10.5194/egusphere-egu24-15683, 2024.

EGU24-16934 | ECS | Posters on site | HS7.6

Simulated response of urban drainage networks to heterogeneous precipitations 

Elisa Costamagna, Fulvio Boano, and Luca Ridolfi

In urban areas, drainage networks are usually formed by small subnetworks, hence resulting in small-sized basins with fast times of response. For this reason, the prediction of pluvial flood hydrographs in urban basins is hampered by considerable uncertainty due to the spatial and temporal variability of rainfall intensity, which is difficult to characterize with the sparse observations from the limited amount of rain gauges that are typically available. To better understand and quantify this uncertainty, the drainage network of Turin is considered as a case study. The city of Turin has >800.000 residents and is located in Northwestern Italy on a relatively flat area bordering a hill on the East. The area is mostly urbanized, and it receives an average precipitation of around 800 mm per year. The drainage network was developed since the end of the 19th century as a separate network that receives only stormwater from a catchment area of around 100 km2, for a total network length of around 1200 km. At present, the network experiences some criticalities due to infrastructure ageing and urban development, and occasional flooding episodes are observed at some points.

The sensitivity of flood hydrographs at the basin outlet to spatial and temporal patterns of rainfall intensity is analyzed using a SWMM hydraulic model of different parts of the drainage networks. Spatial and temporal variability of rainfall intensity over the area is quantified using the observations of a set of 20 rain gauges. Then, the analysis of the sensitivity of the flood hydrograph in a monitored subnetwork is performed based on two rain gauges (2 km apart) and one flow meter at the basin outlet. The results provide valuable insight into the response of urban drainage networks to heterogeneous spatial fields of precipitation.

How to cite: Costamagna, E., Boano, F., and Ridolfi, L.: Simulated response of urban drainage networks to heterogeneous precipitations, EGU General Assembly 2024, Vienna, Austria, 14–19 Apr 2024, EGU24-16934, https://doi.org/10.5194/egusphere-egu24-16934, 2024.

EGU24-17392 | ECS | Orals | HS7.6

Hydraulic modelling of permeable pavements to mitigate pluvial flooding in the city of Genoa, Italy 

Arianna Cauteruccio, Enrico Chinchella, Giorgio Boni, and Luca G. Lanza

Rapidly evolving pluvial floodings are typically experienced in cities due to the inefficiency of the urban drainage system in terms of the hydraulic failure of the storm water pipes and/or the insufficient capacity of the storm drain inlets. This is mainly due to the limited extension of the urban catchment areas, with a high building density and largely impervious surfaces. In addition, the rainfall regime in the Mediterranean region is characterized by short-duration and high-intensity events, which typically have a rather limited spatial extension and a very rapid evolution. The case study investigated in the present work is located within the metropolitan area of Genoa (Italy), which has recently experienced pluvial flooding, although associated with a rainfall event characterised by a low return period (between 1.5 and 3 years). The studied urban catchment is characterised by a flat area of about 1 km2, bordered to the north by hills and to the south by the seaport.

With the aim of partially restoring the natural retention and detention capacity of the catchment area, the conversion of selected impervious pavements around buildings into permeable pavements is tested by means of hydraulic simulation. The hydrological behaviour of the applied solution has been experimentally derived in the “E. Marchi” hydraulic laboratory of the Department of Civil, Chemical and Environmental Engineering (DICCA) of the University of Genoa (Italy). A special in situ survey was preliminarily carried out to determine the number, type and degree of clogging of the rainwater inlets located in the study area.

Hydraulic modelling is carried out using the HEC-RAS 2D software code (v. 6.3.1). The stormwater drainage inlets are simulated as pumping stations with a customised stage-discharge relationship based on the available literature studies, while the hydrological response of the permeable pavements is set in terms of flow hydrographs along linear boundary layers enclosing the converted areas. Results are presented in the form of flood hazard maps and flooded water volumes within the study area for different return periods of the forcing rainfall event. Various extensions of the permeable pavement are tested to quantify the mitigation effect associated with the investigated sustainable urban drainage solution.

This study was carried out within the RETURN Extended Partnership and received funding from the European Union Next-GenerationEU (National Recovery and Resilience Plan – NRRP, Mission 4, Component 2, Investment 1.3 – D.D. 1243 2/8/2022, PE0000005).

How to cite: Cauteruccio, A., Chinchella, E., Boni, G., and Lanza, L. G.: Hydraulic modelling of permeable pavements to mitigate pluvial flooding in the city of Genoa, Italy, EGU General Assembly 2024, Vienna, Austria, 14–19 Apr 2024, EGU24-17392, https://doi.org/10.5194/egusphere-egu24-17392, 2024.

EGU24-18097 | ECS | Posters on site | HS7.6

Model Tree and Regularization Approaches for Estimation of Missing precipitation Records 

Thu Nguyen, Anika Azad, and Ramesh Teegavarapu

Missing precipitation records occur for several reasons, and their estimation is a significant challenge due to the spatial-temporal variability of precipitation. In this study, model tree (MT), regression tree (RT) approaches, and different variations of optimization formulations combined with three regularization schemes (i.e., ridge regression and Elastic net) are proposed and used to estimate missing precipitation data. Concepts of objective selection of sites for estimating missing data using correlations and distributional similarity are also used. The MT and RT models based on optimization and regularization approaches were developed and tested to estimate missing daily precipitation data from 1971 to 2016 at twenty-two rain gauges in Kentucky, U.S.A. The models were analyzed and evaluated using multiple performance and error measures. Results indicate that MT-based and regularization models provided the best estimates considering the performance measures. Regularization models provided better estimates of missing data than the optimization models while reducing the complexity of the model and improving performance. Objective selection of the sites for estimation also improved missing data estimation.

How to cite: Nguyen, T., Azad, A., and Teegavarapu, R.: Model Tree and Regularization Approaches for Estimation of Missing precipitation Records, EGU General Assembly 2024, Vienna, Austria, 14–19 Apr 2024, EGU24-18097, https://doi.org/10.5194/egusphere-egu24-18097, 2024.

EGU24-244 | ECS | Posters on site | HS7.7

Estimating reliable Probable Maximum Precipitation at data-sparse locations  

Jaya Bhatt and Vemavarapu Venkata Srinivas

Flood estimates corresponding to probable maximum precipitation (PMP) are desirable for planning, designing and risk assessment of large hydraulic structures, such as spillways of large dams, whose failure may have catastrophic consequences on ecology, economy, and the environment. In practice, PMP estimates are obtained using hydrometeorological or/and statistical methods as per the recommendations of the World Meteorological Organization. In regions where data of hydrometeorological variables (e.g., precipitation, temperature, relative humidity) are limited or unavailable, practitioners often resort to various statistical methods which require only precipitation records to estimate PMP. Among statistical methods, the Hershfield method is widely used when records from several sites in a region are available whereas conventional probabilistic approach is preferred for at-site analysis. However, arriving at reliable PMP estimates at data-sparse locations is still a challenge. Thus, there is a growing need to improve the existing statistical methods and develop/explore alternate methods. Against this backdrop, this study proposes a new variant of Bethlahmy method, which is a non-parametric method, to facilitate the estimation of PMP at locations with sparse records of extreme precipitation.

The proposed Bethlahmy variant involves (i) mapping of datapoints and corresponding ranks of target site’s annual maximum precipitation series to a non-dimensional space (NDS), (ii) using the mapped information to arrive at a surrogate estimate for PMP in the NDS, and (iii) mapping the surrogate estimate to PMP in the original space. The efficacy of the proposed Bethlahmy variant over various existing statistical techniques is demonstrated through Monte Carlo Simulation experiments and a case study on 37,872 stations from a global precipitation database. The existing techniques include the original Bethlahmy and Hershfield methods, conventional probabilistic approach, and relevant variant(s). Results revealed that the proposed Bethlahmy variant outperforms other methods/variants across samples varying in size and extreme precipitation characteristics, making it a promising statistical alternative for PMP estimation.

How to cite: Bhatt, J. and Srinivas, V. V.: Estimating reliable Probable Maximum Precipitation at data-sparse locations , EGU General Assembly 2024, Vienna, Austria, 14–19 Apr 2024, EGU24-244, https://doi.org/10.5194/egusphere-egu24-244, 2024.

EGU24-3337 | Posters on site | HS7.7

A physics-based statistical model to predict sub-hourly extreme precipitation intensification based on temperature shifts 

Francesco Marra, Marika Koukoula, Antonio Canale, and Nadav Peleg

We present a new statistical method for estimating extreme sub-hourly precipitation return levels that explicitly hinges on our physical understanding of the processes. The TENAX (TEmperature-dependent Non-Asymptotic statistical model for eXtreme return levels) model is based on two modules: (i) a magnitude module describes precipitation intensities using temperature as a covariate. It includes all the information about thermodynamics and local dynamics of the processes at a given temperature; (ii) a temperature module accounts for the distribution of daily temperature during rainfall events. Using the total probability theorem, the two modules are linked to provide a physics-based estimate of the marginal distribution of the precipitation intensities. Return levels are then estimated using a non-asymptotic method. Assuming that the physics of convection remains unchanged in the future (i.e., no change in the magnitude module) and that convection remains the dominant process, the TENAX model enables to project future sub-hourly precipitation return levels only based on the projected changes in daily temperature during rainy days. We will discuss the theory behind TENAX and show it can reproduce return levels with the same accuracy as more parsimonious non-asymptotic methods. We will additionally show that the model reproduces known properties of the extreme precipitation-temperature scaling relation for which it was not explicitly designed. Last, in hindcast, we will demonstrate that TENAX trained on observations of precipitation and temperature can well reproduce “future” unseen return levels only based on projections of daily temperatures. As projections of daily temperature from climate models are more readily available and accurate than those of sub-hourly extreme precipitation, TENAX could allow one to derive future sub-hourly return levels in any location globally where observations of past sub-hourly precipitation and daily near-surface air temperature are available.

How to cite: Marra, F., Koukoula, M., Canale, A., and Peleg, N.: A physics-based statistical model to predict sub-hourly extreme precipitation intensification based on temperature shifts, EGU General Assembly 2024, Vienna, Austria, 14–19 Apr 2024, EGU24-3337, https://doi.org/10.5194/egusphere-egu24-3337, 2024.

EGU24-4277 | ECS | Posters on site | HS7.7

Chinese Wisdom: Investigating Future Patterns of Extreme Precipitation Based on the Twenty-Four Solar Terms 

Yichao Xu, Zhiqiang Jiang, Yanpeng Dai, and Zhijin Li

The Twenty-Four Solar Terms are an ancient and unique Chinese contribution, developed by agrarian laborers for the convenience of agricultural scheduling. Historically, each Solar Term has exhibited a significant correlation with climate change. Our study revisits and validates the Solar Terms’ sensitivity to regular precipitation metrics over the past half-century. We assessed the reliability of this temporal framework by comparing 30-day cumulative precipitation and the number of effective rainfall days around typical Solar Terms, along with the correlation of China’s Standardized Precipitation Index (SPI) with the Heihe-Tengchong Line, known as the Hu Line, during various Solar Terms. The research further investigates the correspondence between multiple scenarios of future extreme precipitation events, including Event-based Extreme Precipitation (EEP), and the Solar Terms. This study focuses on identifying which Solar Terms have historically been, and are likely to continue being, prone to extreme precipitation, as well as their spatial distribution patterns across China. The result indicates that under four different socio-economic pathways in future scenarios, over 55.2% of the regions in China will witness a concentration of extreme precipitation events during the Minor Heat and Major Heat Solar Terms. These events are predominantly expected to occur in the Qinghai-Tibet region, averaging over 10 instances every five years that exceed the 95th percentile for extreme rainfall, showing an increasing risk trend over time. This study not only enhances the cultural depth of our research but also fosters a profounder understanding of the cyclical patterns of extreme precipitation and the related flood risks it entails, offering a novel perspective for guiding flood prevention efforts and the study of extreme precipitation patterns.

How to cite: Xu, Y., Jiang, Z., Dai, Y., and Li, Z.: Chinese Wisdom: Investigating Future Patterns of Extreme Precipitation Based on the Twenty-Four Solar Terms, EGU General Assembly 2024, Vienna, Austria, 14–19 Apr 2024, EGU24-4277, https://doi.org/10.5194/egusphere-egu24-4277, 2024.

EGU24-5682 | ECS | Posters on site | HS7.7

A bottom-up regionalization approach for extreme rainfall events 

Jannis Hoch, Izzy Probyn, Francesco Marra, Chris Lucas, James Savage, Oliver Wing, Chris Sampson, and Nans Addor

Intensity–duration–frequency (IDF) curves are representations of the probability that a given rainfall intensity over a given duration [GU1] will be exceeded [GU2] within a given period. To construct IDF curves, rainfall observations are required, ideally at the sub-daily temporal resolution. Unfortunately, such measurements are available only for a few locations world-wide. This poses a major challenge for simulations of global pluvial flood hazard and risk which require information of intensity, duration, and probability as boundary conditions.

As an alternative to global IDF curves created from remotely sensed rainfall, we here propose a bottom-up approach which departs at the gauge level and employs machine-learning for regionalizing information on IDF curves from gauged to ungauged areas.

To that end, we use available quality-controlled sub-daily precipitation data from the GSDR data set to derive Simplified Metastatistical Extreme Value (SMEV) parameters at around 10,000 locations world-wide. After combining these parameters with globally available data of precipitation drivers, a random forest regression model is applied. Results indicate that some SMEV parameters can be better regionalized than others. With globally available SMEV parameters, it is possible to obtain rainfall intensity for any combination of duration and frequency.

We then evaluated these IDF maps against analytical intensities derived at the GSDR stations directly. Results show overall good agreement, yet the tails of the distributions are not entirely represented in our simulated intensities.  Additionally, we benchmarked our intensity maps against similar datasets such as PPDIST and GPEX. Last, we assessed practical implications by comparing flood maps created with the various datasets used as pluvial boundary condition. While there are fundamental differences in how each of the datasets is derived, our analysis indicates overall similar spatial patterns and distributions of rainfall intensities.

While such data-driven approaches clearly depend on the quality and quantity of available sub-daily rainfall observations, our proposed bottom-up approach seems to be able to scale local data to global data applicable in both flood risk research and practice.

How to cite: Hoch, J., Probyn, I., Marra, F., Lucas, C., Savage, J., Wing, O., Sampson, C., and Addor, N.: A bottom-up regionalization approach for extreme rainfall events, EGU General Assembly 2024, Vienna, Austria, 14–19 Apr 2024, EGU24-5682, https://doi.org/10.5194/egusphere-egu24-5682, 2024.

EGU24-6064 | Posters on site | HS7.7

How appropriate is the alternating block method to represent flooding from extreme precipitation events? 

Sonja Jankowfsky, Mohammad Sharifian, Edom Moges, Ludovico Nicotina, Shuangcai Li, and Arno Hilberts

Running inundation on a stochastic event set with thousands of events can be quite time consuming, especially if physically based methods such as the shallow water equations are used. In order to optimize runtime and to keep a high spatial resolution, event footprints are often reconstructed using return period maps. However, this means that design storm events need to be constructed for each return period which should ideally be representative for different event durations.

Here, we compare the alternating block method, a popular design storm model, to actual event hyetographs from a selection of storm events in Florida. The hyetographs are input to a 10m grid-based Green-and-Ampt infiltration model which is coupled to a two-dimensional shallow-water inundation model. The difference between the alternating block method and the actual event hyetograph is measured based on the flood extent and depth.

How to cite: Jankowfsky, S., Sharifian, M., Moges, E., Nicotina, L., Li, S., and Hilberts, A.: How appropriate is the alternating block method to represent flooding from extreme precipitation events?, EGU General Assembly 2024, Vienna, Austria, 14–19 Apr 2024, EGU24-6064, https://doi.org/10.5194/egusphere-egu24-6064, 2024.

EGU24-12133 | ECS | Posters on site | HS7.7

Non-stationary extended generalized Pareto distribution  for joint assessment of trends in the bulk and extreme precipitation 

Abubakar Haruna, Juliette Blanchet, and Anne-Catherine Favre

Accurately quantifying the impact of climate change on past and future precipitation, especially in terms of extreme precipitation events, remains a significant challenge. Furthermore, the scarcity and high variability of extreme events make this task particularly daunting. Current approaches based on extreme value theory (EVT),  relying on annual maxima series or exceedances above large thresholds, are limited in their efficiency as they only consider a small fraction of the available data. Additionally, these methods do not model the bulk of the distribution, which has applications in areas such as water resources management, urban water supplies, and hydropower. To address these limitations, Naveau et al. (2016) proposed the Extended Generalized Pareto distribution (EGPD), which models the entire non-zero precipitation range while remaining consistent with EVT in both lower and upper tails. While the EGPD has seen wide applications in modeling precipitation in various regions, its application has predominantly been within a stationary framework (e.g. Haruna et al.,2022, 2023). This study explores the potential of a non-stationary version of the EGPD to jointly model trends in both the bulk of the precipitation distribution and in the extremes. The non-stationarity is accommodated by allowing the EGPD parameters to be parametric functions of relevant explanatory variables. The proposed model is then applied to precipitation datasets in Switzerland, a region where long term warming of twice the global average has already been experienced.

  • Haruna, A., Blanchet, J., and Favre, A.-C. (2023). Modeling Intensity-Duration-Frequency Curves for the Whole Range of Non-Zero Precipitation: A Comparison of Models. Water Resources Research, 59(6):e2022WR033362.
  • Naveau, P., Huser, R., Ribereau, P., and Hannart, A. (2016). Modeling jointly low, moderate, and heavy rainfall intensities without a threshold selection. Water Resources Research, 52(4):2753–2769
  • Haruna, A., Blanchet, J., and Favre, A.-C. (2022). Performance-based comparison of regionalization methods to improve the at-site estimates of daily precipitation. Hydrology and Earth System Sciences, 26(10):2797–2811

How to cite: Haruna, A., Blanchet, J., and Favre, A.-C.: Non-stationary extended generalized Pareto distribution  for joint assessment of trends in the bulk and extreme precipitation, EGU General Assembly 2024, Vienna, Austria, 14–19 Apr 2024, EGU24-12133, https://doi.org/10.5194/egusphere-egu24-12133, 2024.

EGU24-15037 | ECS | Posters on site | HS7.7

Large scale influence on extreme precipitation 

Felix Fauer and Henning Rust

Extreme precipitation and flooding events in middle Europe lead to high death tolls and huge existential and financial losses. Evaluating how the probability of such events changes with respect to climate change can help in preventing casualties and reducing impact consequences. We create Intensity-Duration-Frequency (IDF) curves which describe the major statistical characteristics of extreme precipitation events (return level, return period, time scale). They provide information on the probability of exceedance of certain precipitation intensities for a range of durations and can help to visualize how extreme the event for different durations is. We modeled the underlying distribution of block maxima with the Generalized Extreme Value (GEV) distribution. Maxima from different durations are used and enable a model that can evaluate different time scales. All durations are modeled in one single model in order to prevent quantile-crossing and to assure that estimated quantiles are consistent.

Large-scale information is included by letting the GEV parameters depend on variables like NAO, temperature and blocking. We found an increase in probability of extreme precipitation with year as proxy for climate change and temperature, while the effect of the other variables depends on the season. Since it is easier to project average values than extremes, we use the relations between average large-scale covariates and extreme precipitation to create future IDF-relations based on climate projections. Furthermore, we plan to add a spatial component to the model that enables the usage of data from several neighboring stations in one model and interpolate to ungauged sites. This will be the basis for investigating how gridded data sets can be used to complement the station-based approach. One focus will lie on the challenge of dependence between neighboring grid points.

How to cite: Fauer, F. and Rust, H.: Large scale influence on extreme precipitation, EGU General Assembly 2024, Vienna, Austria, 14–19 Apr 2024, EGU24-15037, https://doi.org/10.5194/egusphere-egu24-15037, 2024.

EGU24-21043 | Posters on site | HS7.7

Spatially-distributed Intensity-Duration-Frequency (IDF) curves for Chile using sub-daily gridded datasets 

Mauricio Zambrano-Bigiarini, Cristóbal Soto, and Violeta Tolorza

In this work, we computed IDF curves for the climatically and topographically diverse Chilean territory (17-56ºS) using both stationary and non-stationary approaches based on three state-of-the-art gridded datasets: i) the Integrated Multi-Satellite Retrievals for GPM (IMERGv06B), ii) the fifth generation ECMWF ERA5 reanalysis, and iii) ERA5-Land, the high-resolution reanalysis from ECMWF. The three gridded datasets were used to compute the annual maximum intensities for 12 durations (1, 2, 4, 6, 8, 10, 12, 18, 24, 48, and 72 h) and six return periods (T=2, 5, 10, 25, 50, and 100 years), for the period 2001-2021, using a common spatial resolution of 0.10° and hourly temporal resolution. Data from 161 quality-checked hourly rain gauges are used to calculate IDF curves that serve as a benchmark for the curves derived from the gridded datasets.

First, we calculated a bias correction factor for the annual maximum intensities for each duration, based on the comparison of the gridded value with the point one. Second, the previous correction factors were applied to the annual maximum intensities derived from each gridded dataset, using splines over the entire spatial domain. Third, the bias-corrected annual maximum intensities were calculated for each duration and return period using the Gumbel probability distribution, assuming stationary conditions. Then, the same annual maximum intensities were calculated for each duration and return period using a non-stationary Gumbel probability distribution with a varying mean. Fifth, we used the non-parametric Mann-Kendall test to assess the existence of trends in annual maximum intensities. Finally, 41 (1981-2021) and 21 (2001-2021) years of hourly precipitation data from ERA5 and ERA5-Land were used to test the effects of data length on the resulting stationary and non-stationary IDF curves.

Our results reveal how the bias of annual maximum intensities changes in space, with generally smaller biases for longer periods. In addition, minor differences were found between the maximum annual intensities calculated using the stationary and non-stationary approaches for 2001-2021. Unexpectedly, we found some significant decreasing trends (p-value < 0.05) in Central-Southern Chile (32-43ºS) for the annual maximum intensities derived from ERA5 and ERA5-Land, while these trends were more localised and divergent (increasing and decreasing) for IMERG. Finally, there were only minor differences between the annual maximum intensities derived from ERA5 and ERA5-Land when using 21 years compared to 41 years of hourly records, for both the stationary and non-stationary approaches.

We gratefully acknowledge the financial support of ANID-Fondecyt Regular 1212071,  ANID-PCI NSFC 190018, and ANID-Fondecyt Iniciación 111908064.

How to cite: Zambrano-Bigiarini, M., Soto, C., and Tolorza, V.: Spatially-distributed Intensity-Duration-Frequency (IDF) curves for Chile using sub-daily gridded datasets, EGU General Assembly 2024, Vienna, Austria, 14–19 Apr 2024, EGU24-21043, https://doi.org/10.5194/egusphere-egu24-21043, 2024.

Extreme rainfall events have distinct spatio-temporal characteristics that are usually determined by climatic conditions and dominant weather types at the site of interest. When trying to simulate synthetic rainfall events, this spatio-temporal structure needs to be reproduced in order to achieve suitable design attributes (e.g. design of a drainage network, or flood protection at different spatial scales).

The study are of this analysis is the state of Florida, in the USA. Tropical Cyclone induced rainfall extremes tend to be more catastrophic in this region, therefore we focused only on historical TC events from the last 20 years. We analysed the rainfall Return Period composition at different temporal and spatial scales for observed gridded precipitation, and explored the consequences that these spatio-temporal characteristics have for design rainfall applications.

How to cite: Salinas, J., Sojitra, R., and Jankowfsky, S.: Analysis of the Return Periods of Tropical Cyclone Rainfall events across temporal and spatial scales in the state of Florida (USA), EGU General Assembly 2024, Vienna, Austria, 14–19 Apr 2024, EGU24-22043, https://doi.org/10.5194/egusphere-egu24-22043, 2024.

EGU24-22052 | Posters on site | HS7.7 | Highlight

Windstorm and Flood correlation in UK  

Artemis Venardos and Carlotta Scudeler

Insurers use catastrophe models to assess the risk related to catastrophic events such as floods and windstorms and, in turn, to inform their pricing, manage their risk accumulation, and allocate their capital for regulatory purposes. One of the major challenges when it comes to catastrophe modelling is to ensure that any likelihood of adverse scenarios correlating across different perils is appropriately captured. When this correlation of risk is underestimated, it can lead to weaker financial protection. Insurers’ European catastrophe models generally assume windstorms and inland floods to be independent perils, while recent storm case studies such as Storm Kyrill in 2007 and Storm Desmond in 2015 have suggested that these two hazards occur simultaneously in the same weather systems, increasing joined risk.  The purpose of this study is to quantify the correlation in the UK, by analysing historical wind speed and precipitation extremes. It employed an event-based approach that utilises the Copernicus C3S Footprint dataset, as well as E-OBS daily gridded precipitation data, to investigate whether the windstorms between 1979 to 2021 correlate with precipitation extremes. The Storm Severity Index (SSI), accompanied by a newly developed Precipitation Severity Index (PSI), were used to assess the severity of each windstorm, and inform the subsequent correlation analysis. Among the major findings, it is shown that 1) wind and precipitation extremes exhibit a probability of simultaneous occurrence; 2) the highest SSI (category 1 and 2) windstorms are the most correlated to precipitation extremes; 3) rainfall events with the highest PSI most likely follow a clustering series of storms, leading to prolonged and heavy rainfall (e.g. storm Ciara, 2020 and storm Desmond, 2015); and 4) the SSI severity category of each storm might play a role in whether wind and precipitation extremes occur in the same location or not. The key takeaway of this study suggests the importance of incorporating the correlation between these two hazards (wind and precipitation that leads to floods) into insurers' catastrophe models. Further analysis will look at river flow data and wind and flood losses.  

How to cite: Venardos, A. and Scudeler, C.: Windstorm and Flood correlation in UK , EGU General Assembly 2024, Vienna, Austria, 14–19 Apr 2024, EGU24-22052, https://doi.org/10.5194/egusphere-egu24-22052, 2024.

EGU24-772 | ECS | Orals | HS7.8

Exploring Precipitation Intensity-Duration-Area-Frequency Patterns using Weather Radar Data  

Talia Rosin, Efrat Morin, and Francesco Marra

Extreme precipitation is the main trigger of hazardous phenomena such as floods and flash-floods, that pose a serious threat to human beings and livelihood worldwide. Extreme precipitation is highly variable in both space and time, thus understanding and managing the related risks necessitates improved knowledge of their probability at different spatial-temporal scales.

We employ the simplified metastatistical extreme value (SMEV) framework, a novel non-asymptotic framework, to estimate extreme return levels (up to 100 years) at multiple temporal (10 min–24 h) and, for the first time, spatial (0.25 km2–500 km2) scales using weather radar precipitation estimates. The SMEV framework reduces uncertainties and enables the use of relatively short archives typical of weather radar data (12 years in this case).

Focusing on the eastern Mediterranean - a region characterised by sharp climatic gradients and susceptibility to flash floods - we derive at-site intensity-duration-area-frequency relations at various scales. Comparison with extreme return levels derived from daily rain gauge data over areas with dense gauge networks yields comparable results, demonstrating that radar precipitation data can provide important information for the understanding of extreme precipitation climatology.

We then examine the climatological differences in extreme precipitation emerging from coastal, mountainous, and desert regions at different spatial and temporal scales. Three key findings emerge:

  • At the pixel scale, precipitation and duration exhibit simple scaling, but this relationship breaks down with increasing area - this has significance for temporal downscaling.
  • Precipitation intensity is dissimilar for different area sizes at short durations but becomes increasingly similar at long durations - thus areal reduction factors may be unnecessary when computing precipitation for long durations.
  • The reverse orographic effect causes increased precipitation for multihour events and decreased precipitation for hourly and sub-hourly durations; however, this phenomenon decreases over larger areas.

How to cite: Rosin, T., Morin, E., and Marra, F.: Exploring Precipitation Intensity-Duration-Area-Frequency Patterns using Weather Radar Data , EGU General Assembly 2024, Vienna, Austria, 14–19 Apr 2024, EGU24-772, https://doi.org/10.5194/egusphere-egu24-772, 2024.

EGU24-1126 | ECS | Posters on site | HS7.8

Intercomparison of Different Automatic Threshold Selection Methods in Modelling Precipitation Extremes via Peak Over Threshold Model 

Sree Anusha Ganapathiraju and Maheswaran Rathinasamy

The peak-over-threshold (POT) model is the most extensively used for regional precipitation frequency analysis (RPFA) for estimating extreme precipitation events (EPEs). Yet, choosing proper threshold values is critical and challenging while estimating rainfall quantiles for the Indian subcontinent due to the diverse climatic conditions and physical barriers. This study investigates and compares various threshold methodologies, including graphical, analytical, and multiple threshold methods (MTM) for identifying EPEs. These extracted extreme events with high thresholds followed the Generalized Pareto distribution (GPD), whose shape and scale parameters remain constant and increase linearly with increased threshold values. Therefore, the POT-GPD model was employed in the current work, and the parameters were estimated using L-moments to explore and quantify the heavy tail behavior. In addition, the uncertainty associated with the quantiles was also evaluated using nonparametric bootstrapping techniques and later understanding the spatial variability of the GPD parameters from various methods. The effectiveness of the models is assessed on daily gridded precipitation datasets for the Indian region and validated using synthetic datasets generated through Monte Carlo simulations. Results reveal the importance of combining the MTM and analytical threshold methods for identifying a range of critical thresholds to overcome the subjectivity of graphical methods and quantify the uncertainty. These findings contribute to developing region-specific thresholds, highlighting the importance of modifying thresholds to the regional characteristics rather than relying on a fixed percentile for characterizing the EPEs. The proposed approach is essential for assessing the increasing intensity and frequency of precipitation extremes associated with climate change while allowing for more focused mitigation actions and disaster risk reduction.

How to cite: Ganapathiraju, S. A. and Rathinasamy, M.: Intercomparison of Different Automatic Threshold Selection Methods in Modelling Precipitation Extremes via Peak Over Threshold Model, EGU General Assembly 2024, Vienna, Austria, 14–19 Apr 2024, EGU24-1126, https://doi.org/10.5194/egusphere-egu24-1126, 2024.

EGU24-1997 | ECS | Orals | HS7.8 | Highlight

Spatial coherences of flood-generating processes in Europe and their impact on flood statistics 

Svenja Fischer and Andreas Schumann

Flood events in Europe are caused by different generating mechanisms that lead to events with different peaks, volumes and hydrographs. Understanding such mechanisms is crucial not only for deterministic or stochastic modelling of floods, but also for practical purposes such as hydrological planning and design estimation. In this study, driving mechanisms of floods are analysed and the associated catchment and atmospheric attributes controlling these flood types are identified through a classification and regression tree approach. In addition, the role of flood types in flood statistics is analysed using type-based flood statistics. It is shown which flood types dominate the more frequent floods and which flood types are most frequently associated with extreme floods. Ordinary and extraordinary floods are identified by a Likelihood-Ratio test and tested for a significant difference in the frequency distribution of flood types. Our results show that the flood types vary regionally in Europe. In the Alpine region, heavy rainfall floods are responsible for the most extreme flood events, while in the northern parts of Europe flood events caused by snowmelt lead to the largest peaks. This is reflected in the flood statistics in the type-specific distributions, which have a different tail heaviness. These findings provide information to identify the most crucial circumstances in which floods become extreme and on the flood event itself.

How to cite: Fischer, S. and Schumann, A.: Spatial coherences of flood-generating processes in Europe and their impact on flood statistics, EGU General Assembly 2024, Vienna, Austria, 14–19 Apr 2024, EGU24-1997, https://doi.org/10.5194/egusphere-egu24-1997, 2024.

EGU24-2195 | ECS | Posters on site | HS7.8

Examining Daily Snow Depths at the Catchment Scale in Canada Using CMIP6 

Hebatallah Abdelmoaty, Simon Papalexiou, Abhishek Gaur, and Yannis Markonis

The lack of reliable data on daily snow depth (SD) is a significant challenge for studying water systems, ecology, and resources. Climate models present a potential solution for generating daily SD data, but the literature has not thoroughly explored how accurately they simulate this data. This study investigates the capabilities of CMIP6 climate models to replicate daily SD characteristics in eleven major Canadian catchments. The results depict that CMIP6 simulations overestimate the average SD values by a median of 57.7% (6.9 cm). In the Arctic and Pacific regions, this overestimation becomes particularly pronounced. However, the simulations align more closely with observations in smaller catchments with homogenous land characteristics. This finding suggests a shortcoming in how these models simulate different land types within the grid. Additionally, the models appear to overestimate the snow cover duration, with a median underestimation of 30.5 days. This overestimation could be due to the models failing to accurately account for the rates at which snow accumulates and melts away. However, the models perform relatively well when predicting extreme SD conditions. This study carries valuable implications for refining the outputs of climate models and effectively utilizing them in impact studies.

How to cite: Abdelmoaty, H., Papalexiou, S., Gaur, A., and Markonis, Y.: Examining Daily Snow Depths at the Catchment Scale in Canada Using CMIP6, EGU General Assembly 2024, Vienna, Austria, 14–19 Apr 2024, EGU24-2195, https://doi.org/10.5194/egusphere-egu24-2195, 2024.

EGU24-2908 | Posters on site | HS7.8

Modeling drought effects on rainfed crop yields using probabilistic and machine learning approaches 

Clement Sohoulande and Prakash Khedun

Drought is a major hazard with significant impacts on agriculture, water resource availability, and terrestrial ecosystems. Under climate change drought events are expected to increase in frequency, severity, duration, and propagation with consequent impacts on crop yields. Given these circumstances, a thorough understanding of drought is needed to increase societal preparedness to drought effects on food production particularly in regions where agriculture is dominantly rainfed. Unfortunately, drought events remain very unpredictable suggesting the need to enhance the understanding of drought effects on rainfed crops. Hence, this study aims to examine the relationships between drought characteristics and rainfed crop yields. Particularly, the study uses probabilistic and machine learning (i.e., random forest) approaches to investigate the influence of standardized precipitation and evapotranspiration index (SPEI) severity and duration on the yield of corn, cotton, peanuts, and soybeans in the southeast region of the United State (US). County wise analyses were conducted for three contiguous southeastern States including North Carolina, South Carolina, and Georgia. Preliminary results outlined different performances depending on the approach, the counties, and the crops. Highly performing approaches could be considered for modeling drought effect on crops at county, State, or regional levels.

How to cite: Sohoulande, C. and Khedun, P.: Modeling drought effects on rainfed crop yields using probabilistic and machine learning approaches, EGU General Assembly 2024, Vienna, Austria, 14–19 Apr 2024, EGU24-2908, https://doi.org/10.5194/egusphere-egu24-2908, 2024.

EGU24-2918 | Orals | HS7.8 | Highlight

Spatio-temporal clustering of storm surges along the global coastline 

Thomas Wahl, Alejandra Enriquez, and Ariadna Martin

When storm surges often affect the same coastline stretches simultaneously (i.e., they cluster in space, leading to spatial compounding) or if they occur in close succession (i.e., they cluster in time, leading to temporal compounding), the impacts are often greatly amplified. Hurricanes Irma and Maria in 2017 in the eastern Caribbean and Hurricanes Ian and Nicole in Florida were recent reminders how back-to-back storm surges affecting long coastline stretches can cripple economies and societies which are still in recovery mode. This can be a significant burden for the (re-)insurance industry and government budgets, as has been shown for the case of river floods (Jongman et al., 2014). Despite many examples where spatial or temporal compounding effects worsened coastal flooding impacts, developing appropriate tools to incorporate such events into present-day and future coastal flood impact assessments and hazard mitigation planning is still at its infancy. This presentation will showcase a novel algorithm to identify independent storm surge events and preliminary results from applying it to a global tide gauge data set to detect hotspots of temporal storm surge clusters at different time scales and different levels of extremeness. Results from identifying spatial storm surge footprints along the global coast and associated non-stationarity (for selected coastline stretches) will also be presented. The latter will be linked to large-scale weather patterns causing shifts in the spatial footprints at seasonal to decadal time scales. The results can inform the development of flexible statistical models capable of capturing both spatial and temporal dependences to overcome existing limitations in flood risk assessments where this is typically ignored.

How to cite: Wahl, T., Enriquez, A., and Martin, A.: Spatio-temporal clustering of storm surges along the global coastline, EGU General Assembly 2024, Vienna, Austria, 14–19 Apr 2024, EGU24-2918, https://doi.org/10.5194/egusphere-egu24-2918, 2024.

EGU24-5024 | ECS | Posters on site | HS7.8

Time Varying Copula based formulations for Flood Risk Assessment of two Tropical basins of Kerala, India 

Adarsh Sankaran, Meera G Mohan, Ananya Raj, and Anagha Shaji

Flood frequency analysis is a challenging but essential hydrologic problem for design of control structures and water resources management. The design flood estimates based on traditional stationary assumption may lead to inaccurate estimation of flood risk because of non-stationarity and the compounding impacts of several drivers in a dynamic environment. Copulas are a useful and adaptable technique for determining the multivariate joint dependency amongst flood variables. This study employed time-varying copula models to investigate the nonstationary dependence structures between two highly correlated flood variables, such as flood peak and flood volume, in order to determine the joint and conditional return periods of the flood events revealed by the 2018 Great Kerala floods. The proposed approach is executed for two potential locations of high flood risk namely, Periyar river basin and Greater Pamba river basin of Kerala, India. The Archimedean copula (Clayton, Frank and Gumbel) parameters were estimated using Maximum likelihood estimation and the optimal copula selection was made using Akaike Information Criterion. The non-stationary joint return time was found to be shorter than the stationary joint return period, suggesting that the extreme flood occurrences happened more frequently in the non-stationary bivariate study. Thus, it can be demonstrated that the extreme flood episodes are underestimated by stationary bivariate flood frequency analysis. The validation of results by comparing the flood magnitude of Neeleswaram station for 2018 flood quantile ascertained the necessity of non-stationary flood risk estimation. The study advocates the conduct of multivariate frequency analysis over the univariate analysis for the risk assessment of hydrological extremes. The results demonstrate that the long-term decision-making methods need to be updated to account for the oddities of the nonstationary climate. This study rendered flood risk assessment indicators as well as a risk-based design approach for hydraulic infrastructures in a non-stationary environment, which is crucial for climate change adaption and water security management.

How to cite: Sankaran, A., Mohan, M. G., Raj, A., and Shaji, A.: Time Varying Copula based formulations for Flood Risk Assessment of two Tropical basins of Kerala, India, EGU General Assembly 2024, Vienna, Austria, 14–19 Apr 2024, EGU24-5024, https://doi.org/10.5194/egusphere-egu24-5024, 2024.

EGU24-5234 | ECS | Posters on site | HS7.8

Metereological Drought in the western Po river basin: trends and characteristics from 1958 to 2023 

Emanuele Mombrini, Stefania Tamea, Alberto Viglione, and Roberto Revelli

Since the start of the 21st century, greater focus has been put on drought and its wide range of environmental and socioeconomic effects, particularly in the context of climate change. This is especially true for the North-western region of Italy, comprising the Piedmont and Aosta valley, which have been affected in recent years by droughts that have had acute effects on water resources and water security in all sectors, including agriculture, energy and domestic use. The region also belongs to the Mediterranean hot-spot, characterized by faster than global average warming rates and higher vulnerability to their effects. Therefore, characterizing the observed changes and trends in drought conditions is of particular significance. To this end, 60 years of precipitation and temperature data from the North West Italy Optimum Interpolation data set are used to calculate the drought indices SPI (Standardized Precipitation Index) and SPEI (Standardized Precipitation Evapotranspiration Index) at a shorter (3-month) and at a longer (12-month) time scale. First, trend analysis on precipitation and temperature is performed, finding limited areas with significant precipitation decrease and, conversely, a general temperature increase over the region, with higher values found in the higher elevation areas. Changes in meteorological drought are then evaluated, both in terms of drought indices trends and in terms of changes in the characteristics of drought periods, on both a local and regional scale. A relation between the altitude of the area and the observed changes is highlighted, with significant differences between the plain and mountainous portion of the region. The differences are mainly related to the observed trends, with the low-altitude part of the region displaying a tendency towards dryer conditions not in common with the mountainous area. Significantly, no trend is found at a region-wide level but is instead found when considering homogeneous areas defined by terrain ruggedness. Furthermore, changes in the number of drought episodes and in their severity, duration and intensity are found to be correlated with terrain ruggedness at all time scales.

How to cite: Mombrini, E., Tamea, S., Viglione, A., and Revelli, R.: Metereological Drought in the western Po river basin: trends and characteristics from 1958 to 2023, EGU General Assembly 2024, Vienna, Austria, 14–19 Apr 2024, EGU24-5234, https://doi.org/10.5194/egusphere-egu24-5234, 2024.

EGU24-5685 | ECS | Posters on site | HS7.8

Exploring Multivariate Return Periods: Enhancing Accuracy in Hydrological Analysis for Flood Prediction  

Diego Armando Urrea Méndez, Dina V. Gómez, and Manuel Del Jesus Peñil

The assessment of multivariate return periods determines how frequently different variables co-occur within a specific region. Recent studies have used two- and three-dimensional copulas for this assessment. G. Salvadori et al., (2011) introduced an approach based on Archimedean copulas and the Kendall measure. Gräler et al., (2013) calculated the trivariate return period using Vine copulas and Kendall distribution functions, incorporating annual maximum peak discharge, volume, and duration. Tosunoglu et al., (2020) applied three-dimensional Archimedean, Elliptical, and Vine copulas to study flood characteristics. These methodologies enhance the accuracy of extreme events risk measurement, emphasizing the importance of understanding tail dependence and the appropriate selection of copulas.

In multivariate analysis of compound extreme events, addressing the dependence structure in the tails of the variables of interest becomes essential. If the selected copula fails to accurately capture this extreme dependence, the estimation of extreme values may be significantly affected by uncertainty (Hangshing & Dabral, 2018). Therefore, conducting a comprehensive assessment of the copula model fit to the data is crucial, with a particular focus on tail dependence (Serinaldi, 2015). This process guides the choice of the most suitable copula family to model these compound extreme events.

We propose a two-part methodology: (I) In this phase, we focus on comparing various multivariate models that address the entirety of uncertainty. This involves analyzing different models and copula structures. The main objective is to evaluate how goodness of fit and tail dependence impact the calculation of design events, where, in some cases, underestimation may occur.

(II) In a subsequent stage, we formulate a more robust approach that encompasses the study, evaluation, and implementation of various statistical and machine learning techniques. The focus is on using the results obtained in the previous stage to develop flood models. These models enable us to compare multivariate approaches in terms of their performance in flood prediction and other associated impacts.

The study results highlight the importance of diversifying approaches in the hydrological analysis of precipitation-conditioned design events. It was found that the use of a multivariate approach provides more accurate estimations of precipitation compared to the univariate method. The careful choice of the multivariate model is crucial, as Gaussian models underestimate extreme events, while extreme vine copula models yield more tightly fitted results. This advancement benefits engineering by reducing uncertainty in design processes and providing a more precise approximation of climate impacts, with the potential to enhance territorial management.

References

Salvadori, C. De Michele, & F. Durante., 2011. On the return period and design in a multivariate framework. Hydrol. Earth Syst. Sci., 15(11), 3293–3305.

Gräler, B., Berg, M. J. van den, Vandenberghe, S., Petroselli, A., Grimaldi, S., De Baets, B. & Verhoest, N. E. C., 2013. Multivariate return periods in hydrology: a critical and practical review focusing on synthetic design hydrograph estimation. Hydrol. Earth Syst. Sci., 17(4), 1281–1296.

Hangshing, L. & Dabral, P. P., 2018. Multivariate Frequency Analysis of Meteorological Drought Using Copula. Water Resour Manage, 32(5), 1741–1758.

Serinaldi, F., 2015. Dismissing return periods! Stoch Environ Res Risk Assess, 29(4), 1179–1189.

How to cite: Urrea Méndez, D. A., V. Gómez, D., and Del Jesus Peñil, M.: Exploring Multivariate Return Periods: Enhancing Accuracy in Hydrological Analysis for Flood Prediction , EGU General Assembly 2024, Vienna, Austria, 14–19 Apr 2024, EGU24-5685, https://doi.org/10.5194/egusphere-egu24-5685, 2024.

EGU24-6170 | Posters on site | HS7.8

On the Vulnerability of NATO Installations to Climate Variability and Change: A System-Level Perspective 

Gabriele Villarini, Sandro Carniel, Taereem Kim, Hanbeen Kim, Aniello Russo, Wenchang Yang, Gabriel Vecchi, and Thomas Wahl

This task focuses on the understanding of the spatial connections among 91 NATO installations subject to hydroclimatological extremes, including precipitation, surface temperature, and wet bulb temperature, under both historical and future conditions. It allows a system-level view of the vulnerabilities of NATO installations to climate change and the associated extremes. We first perform statistical bias correction and evaluate how well global climate models (GCMs) part of the Sixth Phase of the Coupled Model Intercomparison Project (CMIP6) are able to reproduce the historical trends. Based on these analyses, we select a subset of well-performing models, which we use to examine how the spatial dependence in climate extremes is projected to change. In particular, we consider two future periods (Mid-of-Century: 2015-2048; End-of-Century: 2067-2100) with respect to the 1981-2014 period, under four shared socioeconomic pathway scenarios (SSP1-2.6, SSP2-4.5, SSP3-7.0, and SSP5-8.5).

We show that temperature-based extremes are correlated in space and have a large footprint, impacting more than one base at once. When we focus on precipitation extremes, we find that their spatial correlation is much weaker, with a much smaller chance of impacting more than one installation. Moreover, GCMs can reproduce these observed behaviors. In analyzing the future projections of these hydroclimatic extremes, we show that the spatial correlation in temperature-based extremes across NATO installations is projected to increase, especially toward the end of the 21st century and for higher emission scenarios. These results highlight the current and future susceptibility of the NATO installations to climate extremes in light of climate change when viewed through a system-level perspective.

How to cite: Villarini, G., Carniel, S., Kim, T., Kim, H., Russo, A., Yang, W., Vecchi, G., and Wahl, T.: On the Vulnerability of NATO Installations to Climate Variability and Change: A System-Level Perspective, EGU General Assembly 2024, Vienna, Austria, 14–19 Apr 2024, EGU24-6170, https://doi.org/10.5194/egusphere-egu24-6170, 2024.

EGU24-6265 | ECS | Orals | HS7.8

Understanding Compound Flooding hazard in Estuaries: Insights and Implications 

Dina Vanessa Gomez Rave, Diego Armando Urrea Mendez, and Manuel Del Jesus Peñil

Estuaries are highly prone to compound flooding. These areas often face flooding prompted by fluvial discharge, coastal water levels, wind and pluvial (rainfall) conditions (Moftakhari et al. 2017). Flooding drivers, even if they are not extreme individually, can combine and generate extreme local impacts. Nevertheless, their dependence and co-occurrence are often ignored, leading to misinterpretation of flooding risk. 

In this regard, assessing multivariate extremes requires understanding their stochastic structure and interconnections. Sensitivity relies on modeling properties like tail dependence strength and symmetry (Hua and Joe 2011). Copulas enable the study of tail dependency, providing insights into the relative strength between the extremes (De Luca et al, 2023). Once these primary dependencies and interconnected relationships are appropriately captured and modelled, the next step involves translating them into potential impacts (Zscheischler 2020). Therefore, defining hazard scenarios establishes the connection between the dependence structure of multiple drivers and the associated impacts. 

The critical level or return period used in risk analysis and infrastructure design inherently represents a hazard scenario. It can be seen as upper sets encompassing all occurrences deemed hazardous, potentially leading to impacts and damages based on certain criteria. This definition implies a connection with the upper tails of variables, which depicts specific dangerous conditions. In contrast to univariate analysis, where critical events are defined by surpassing a specific threshold, the multivariate hazard scenario lacks a singular definition (Bernardi et al. 2018). Moreover, in an n-dimensional framework, this set collects all 'dangerous' values based on suitable criteria and consequently defines the (n-1) iso-hyper-surface that generates the 'dangerous region', known as the 'critical layer' (Salvadori et al, 2011). In higher dimensions, this critical layer possesses more of a mathematical than a graphical definition, entailing theoretical and computational challenges.

This study aims to robustly characterize compound flooding in estuaries, employing high-dimensional analysis alongside multivariate statistical techniques and computational optimizations. Using a 100-year return level, critical events that compose the iso-hypersurface (critical layer) are identified. These design events capture variability, enabling the incorporation of uncertainty involved in predicting these dynamics.


References

Bernardi, M., Durante, F., Jaworski, P., Petrella, L., & Salvadori, G. (2018). Conditional risk based on multivariate hazard scenarios. Stochastic Environmental Research and Risk Assessment, 32, 203-211.
De Luca, G., Ruscone, M. N., & Amati, V. (2023). The use of conditional copula for studying the influence of economic sectors. Expert Systems with Applications, 120582.
Hua, L., & Joe, H. (2011). Tail order and intermediate tail dependence of multivariate copulas. Journal of Multivariate Analysis, 102(10), 1454-1471.
Moftakhari, H. R., Salvadori, G., AghaKouchak, A., Sanders, B. F., & Matthew, R. A. (2017). Compounding effects of sea level rise and fluvial flooding. Proceedings of the National Academy of Sciences, 114(37), 9785-9790.
Salvadori, G., De Michele, C., & Durante, F. (2011). On the return period and design in a multivariate framework. Hydrology and Earth System Sciences, 15(11), 3293-3305.
Zscheischler, J., Van Den Hurk, B., Ward, P. J., & Westra, S. (2020). Multivariate extremes and compound events. In Climate extremes and their implications for impact and risk assessment (pp. 59-76). Elsevier.


How to cite: Gomez Rave, D. V., Urrea Mendez, D. A., and Del Jesus Peñil, M.: Understanding Compound Flooding hazard in Estuaries: Insights and Implications, EGU General Assembly 2024, Vienna, Austria, 14–19 Apr 2024, EGU24-6265, https://doi.org/10.5194/egusphere-egu24-6265, 2024.

EGU24-6701 | ECS | Posters on site | HS7.8

Detecting the heaviness of daily rainfall probability distributions in Europe through an expeditious method, the Obesity Index 

Flavia Marconi, Benedetta Moccia, Elena Ridolfi, Fabio Russo, and Francesco Napolitano

Extreme precipitation events have a significant impact on hydraulic infrastructure design and risk management. The World Climate Research Programme (WCRP) Grand Challenges highlights the need for further investigation in analyzing and modeling weather and climate extremes due to their substantial effects. These rare meteorological occurrences represent the upper tail of the probability distribution, which can be effectively defined as heavy or light. The Obesity Index (OB) represents a user-friendly, non-parametric, empirical method capable of quantitatively assessing the heaviness of probability distribution tails directly from the original dataset, without the need to extract only extreme values. Our assessment of OB involves two distinct gridded datasets: one specific to Italy (SCIA) and another covering the entire Europe (E-OBS). The analysis shows a robust correlation between OB and L-moment ratios (L-variation, L-skewness, L-kurtosis), along with the Coefficient of Variation (CV). It is interesting to note that the tail heaviness in a specific region may vary depending on the dataset employed. For instance, OB indicates a prevalence of heavy tails across Italy or lighter tails in specific areas of the peninsula when employing SCIA or E-OBS dataset, respectively. This divergence could be attributed to an excessive smoothing of rainfall observations during the interpolation procedures used in generating E-OBS dataset. Thus, our findings reinforce the thesis of using light-tail probability distributions with caution when addressing rainfall extremes.

How to cite: Marconi, F., Moccia, B., Ridolfi, E., Russo, F., and Napolitano, F.: Detecting the heaviness of daily rainfall probability distributions in Europe through an expeditious method, the Obesity Index, EGU General Assembly 2024, Vienna, Austria, 14–19 Apr 2024, EGU24-6701, https://doi.org/10.5194/egusphere-egu24-6701, 2024.

EGU24-7433 | Orals | HS7.8

Flash Flood Hazard: A Counterfactual Analysis for Germany 

Paul Voit and Maik Heistermann

In response to heavy rainfall, flash floods can arise from rapid runoff concentration in the landscape, presenting significant damage potential due to high flow velocities and minimal lead times. Flash floods are among the most destructive natural hazards. Managing their risks usually necessitates the application of extreme value statistics. However, the small temporal and spatial scale of flash floods poses a challenge, as the requisite data for statistical methods is often unavailable or incomplete.  Furthermore, the effects of climate change may compromise the robustness of extreme value statistics.

To enhance our understanding of flash flood hazards in Germany, we present a novel "counterfactual" scenario analysis. This approach considers alternative ways of how events could have unfolded. To identify worst-case scenarios is particularly interesting for risk assessment. Accordingly, we assumed that historical rainfall events could have happened anywhere else in Germany: What would have happened if a particular rainfall event occurred in a different area? Would it result in a flash flood?

To address these questions, we created a catalog of extreme rainfall events for the years 2001-2022 from radar rainfall estimates. Because flash flood triggering rainfall is often embedded in precipitation fields of larger spatio-temporal extent, we used the cross-scale weather extremity index (xWEI) to identify and rate the events. We then shifted the ten most extreme events systematically across Germany and modeled the peak discharge for every shifted realization (counterfactual peaks), thus creating close to a billion runoff datasets. This approach preserves the spatio-temporal event structure that significantly influences the overlapping scales of runoff processes and hence the hazard. Results are provided to users via an interactive web interface.

Our results reveal that, on average, the worst case counterfactual peaks would exceed the maximum original peak by a factor 5.3. Furthermore, it shows that not every event is equally likely to trigger high runoff peaks, even when rated similarly extreme. Our study might help to expand the view on what could happen in case certain extreme events occurred elsewhere, help to identify flash flood prone areas, and thereby reduce the element of surprise in disaster risk management. The proposed method is transferable and could be a valuable asset, especially in data-scarce regions.

How to cite: Voit, P. and Heistermann, M.: Flash Flood Hazard: A Counterfactual Analysis for Germany, EGU General Assembly 2024, Vienna, Austria, 14–19 Apr 2024, EGU24-7433, https://doi.org/10.5194/egusphere-egu24-7433, 2024.

EGU24-10268 | ECS | Posters on site | HS7.8

Changing spatio-temporal characteristics of extreme rainfall events under climate change using high resolution climate projections  

Laura Devitt, Gemma Coxon, Jeffrey Neal, Leanne Archer, Paul Bates, and Elizabeth Kendon

Extreme precipitation is projected to intensify and occur more frequently under climate change. However, the effect of global warming on the spatial and temporal structure of extreme rainfall events at the local scale is uncertain. In the UK, the current method for estimating changes in flood hazard under climate change involves applying a simple multiplicative uplift to spatially uniform catchment rainfall. This approach neglects spatio-temporal characteristics of rainfall, which are known to be important for flood hazards. The UCKP Local Convection Permitting Model (CPM) has for the first time provided the capacity to assess these characteristics of rainfall at the local scale. Here, we use an ensemble of 2.2km hourly convection-permitting transient projections from UKCP Local to identify changes in the spatial and temporal characteristics of precipitation extremes over 100-years (1981-2080) across the UK. The analysis uses an ‘event-based’ approach, exploring seasonal changes in the peak intensity, total rainfall, and duration of events, but also changes in the spatial extent and temporal clustering of events through time. We identify ~13000 extreme rainfall events across the UK over the 100-year period. Event peaks are identified using a seasonal and time-varying threshold (99th percentile) on hourly rainfall rates, and event start and stop times are extracted using a lower threshold (20th percentile). We identify seasonal differences in how spatial extents of rainfall extremes will change, with winter and spring events growing, but summer and autumn events reducing in areal coverage. We also identify changes in the sub-seasonal timing of rainfall extremes, with events becoming more clustered, particularly during the winter months. Understanding changes in the spatial and temporal characteristics of rainfall events is critical as they may compound with increases in rainfall intensity, exacerbating the impacts of flooding.

How to cite: Devitt, L., Coxon, G., Neal, J., Archer, L., Bates, P., and Kendon, E.: Changing spatio-temporal characteristics of extreme rainfall events under climate change using high resolution climate projections , EGU General Assembly 2024, Vienna, Austria, 14–19 Apr 2024, EGU24-10268, https://doi.org/10.5194/egusphere-egu24-10268, 2024.

EGU24-11587 | ECS | Posters on site | HS7.8

Climatology and moisture sources of heavy rainfall in the Andes of southern Ecuador 

Diego Urdiales-Flores, Gregoire Mariethoz, Rolando Célleri, and Nadav Peleg

Mountains cover approximately one-quarter of the total land surface on the planet, and a significant fraction of the world’s population lives in their vicinity. Orography critically affects weather processes at all scales and, in connection with factors such as land-cover heterogeneity and mesoscale atmospheric process, is responsible for high spatial variability in mountain weather, such as the Tropical Andes. Due to this high complexity, monitoring the atmosphere in the Ecuadorian Andes has remained a challenge due to the lack of high spatio-temporal resolution operational observing systems. We studied heavy rainfall associated with floods to identify the main rain types and their sources of moisture based on non-stationary rainfall-similarity indices and Lagrangian approaches. We analyzed five years of data collected from a high space-time resolution (5 min and 500 m) X-band weather radar that was located at 4450 m a.s.l in the Tropical Andes of southern Ecuador. To identify the origin and trajectories of water vapor masses, we used the NOAA meteorological database (GDAS, global data assimilation system, at 0.5° resolution). Our analysis shows that the heavy rainfall in the region can be divided into five rainfall types: two spatially-clustered rain types (convective) and three spatially-homogenous rain types (stratiform). We found that air masses typing as convective reach the study area preferentially from the eastern flank of the Andes through the Amazon basin (~ 70% of all events). We also compared discharge data with rain types and discussed the type and source of rainfall potentially responsible for triggering flash floods in the Andes of southern Ecuador.

How to cite: Urdiales-Flores, D., Mariethoz, G., Célleri, R., and Peleg, N.: Climatology and moisture sources of heavy rainfall in the Andes of southern Ecuador, EGU General Assembly 2024, Vienna, Austria, 14–19 Apr 2024, EGU24-11587, https://doi.org/10.5194/egusphere-egu24-11587, 2024.

EGU24-13301 | ECS | Posters on site | HS7.8

A Global Analysis of Daily Streamflow Data to Unravel the Heaviness of Flood Distribution 

Masoud Zaerpour, Simon Michael Papalexiou, and Alain Pietroniro

Hydroclimatic extremes, such as floods, present complex challenges in risk assessment due to their spatial and temporal compounding nature. This research aims to improve our understanding and modelling capabilities by investigating the complex interactions among record length, flow regime, and upper tail of floods. Our study resolves conflicting results in prior studies by utilizing a quasi-global peak-over-threshold (POT) analysis of flood with the Generalized Pareto (GP) distribution. Based on an analysis of 4,482 streamflow series over six different regime types with record lengths ranging from 30 to 213 years, our results show a strong relationship between the GP shape parameter and record length. The results show that the variance of the shape parameter of GP distribution diminishes with record length, and it eventually converges to a single value depending on the flow regime. We show that the shape parameter of snow-dominated streams is the lowest, whereas intermittent streams have the highest. Our research reveals regime-specific patterns in the impact of hydroclimatic and catchment controls on flood tails, underscoring the necessity of regime-specific strategies for flood risk management. Identifying catchments that are more likely to experience extreme flooding provides useful information for determining which mitigation measures to prioritize.

How to cite: Zaerpour, M., Papalexiou, S. M., and Pietroniro, A.: A Global Analysis of Daily Streamflow Data to Unravel the Heaviness of Flood Distribution, EGU General Assembly 2024, Vienna, Austria, 14–19 Apr 2024, EGU24-13301, https://doi.org/10.5194/egusphere-egu24-13301, 2024.

EGU24-14054 | ECS | Posters on site | HS7.8 | Highlight

Climate Change both Increases and Decreases Winter Snowmelt across North America 

Shadi Hatami, Masoud Zaerpour, Jan Adamowski, and Simon Michael Papalexiou

Snowmelt is a vital source of freshwater for a large proportion of North America’s population. Sudden snowmelt can also lead to various extreme events and environmental hazards, such as floods in the cold season and droughts in the upcoming warmer months. However, this natural water resource is at risk due to climate change and variability. Temperature and precipitation are significant climatic controllers that regulate snowmelt dynamics. Warmer temperatures can affect snowmelt extremes, persistence, and distribution, while changing precipitation alters the available snow budget and, consequently, the snowmelt amount. Yet, the precise role of the compound changes in temperature and precipitation under changing climate on future snowmelt dynamics is unknown. To address this knowledge gap, we use observation-driven data and future projections to quantify the response of winter snowmelt to changes in temperature and precipitation across North America (United States and Canada). Our analysis of far-future (2091-2100) changes reveals a significant increase (> 60%) in winter (November-March) snowmelt in northern latitudes, while it declined (by up to< 38%) in southern latitudes. Higher temperatures proved to be the primary driver of the increased snowmelt, whereas decreased snowfall modulated the declines in snowmelt, with variability seen across the study domain. Our findings suggest that the probability of an increase in winter snowmelt is high under the warmer and wetter climatic conditions prevailing in northern regions. In contrast, winter snowmelt across southern latitudes is likely to decline. These findings have significant implications for freshwater availability in the future in the affected areas. 

How to cite: Hatami, S., Zaerpour, M., Adamowski, J., and Papalexiou, S. M.: Climate Change both Increases and Decreases Winter Snowmelt across North America, EGU General Assembly 2024, Vienna, Austria, 14–19 Apr 2024, EGU24-14054, https://doi.org/10.5194/egusphere-egu24-14054, 2024.

EGU24-14140 | ECS | Posters virtual | HS7.8

Unfolding Multivariate Drought Risk in Large River Basins accounting Onset Seasonality and Event Magnitude 

Aparna Raut and Poulomi Ganguli

The frequency and severity of droughts are expected to increase in the warming climate. Understanding mutually interacting drought properties, such as their severity (deficit volume) and time to onset, is crucial for managing reservoir operations and low flows. Previous studies have performed bivariate drought frequency analysis considering drought severity and duration across different climate regions. However, little is known about the role of drought seasonality in shaping drought severity. This study aims to investigate the dependence between onset time (i.e., directional occurrence date) and deficit volume and evaluate the impact of drought seasonality on the deficit volume distributions in disparate climate regions across the global tropics. Leveraging streamflow observations from representative catchments in the northern and southern hemispheres and considering the nonlinear dependence strengths between onset time and deficit volume, we implemented a multivariate drought frequency model that yields a conditional probability of drought severity given the timing of peak drought intensity. We consider multiple univariate probability functions for modelling drought deficit volume, whereas drought onset time is modelled using von Mises distribution. Further, the joint dependence between drought onset and deficit volume is modeled using a bivariate Archimedean class of copulas. First, we show temporal variations of exceedance probabilities of drought deficit volume and their seasonal clustering behavior during dry/wet phases and then explore any possible shift in the risk of peak drought intensity based on its seasonality. Finally, employing a flexible multivariate probabilistic tool, we demonstrate different scenarios of drought characteristics combinations and a seasonality-informed drought probability model, aiding understanding complex processes of drought propagations across disparate climate regimes and assessing possible climatic shifts to drought frequency.

How to cite: Raut, A. and Ganguli, P.: Unfolding Multivariate Drought Risk in Large River Basins accounting Onset Seasonality and Event Magnitude, EGU General Assembly 2024, Vienna, Austria, 14–19 Apr 2024, EGU24-14140, https://doi.org/10.5194/egusphere-egu24-14140, 2024.

EGU24-14570 | ECS | Posters on site | HS7.8

Regional Flood Risk Assessment Using Ensemble of GCMs 

Kiran Kezhkepurath Gangadhara, Sarath Muraleedharan, Raja Bharath, and Martin Kadlec

Flood risk assessment is generally carried out at a basin scale by developing hydrologic and hydraulic models with an objective to arrive at hazard/inundation maps for the river segments/reaches. A hydrologic model is used to derive a flood hydrograph corresponding to a specific return period and this is routed through the flood plain of the study area with the aid of a hydraulic model to obtain water surface elevations and inundation extents. This approach is best suited to represent a flood event at a river segment accurately, but the risks associated with floods need to be analyzed on a regional scale for effective flood risk management. As the size of the region increases beyond one basin, this approach fails to realistically represent the flood events across different river segments and basins. The simultaneous occurrences of different return periods on different river segments cannot be captured by this approach. The traditional approach to model these simultaneous occurrences is by using the streamflow records to arrive at spatially correlated stochastic simulations of streamflow. One issue that compounds this problem is the data scarcity in certain regions to accurately estimate the return periods of floods at distinct locations.

To address these issues, Impact Forecasting, Aon’s catastrophe model development team, has undertaken a study to simulate stochastic flood events in the Southeast Asian region by considering Malaysia as a case study. The approach involves (i) downscaling of precipitation and temperature data from an ensemble of Global Circulation Models (GCMs), (ii) calibration of a grid-based Rainfall-Runoff (RR) model using available historical data of meteorological variables and streamflow, (iii) providing the downscaled precipitation and temperature data as input to the calibrated RR model to simulate streamflow across the study area and (iv) identifying flood events from the simulated streamflow to extract an exhaustive set of realistic flood events in the region. The approach involves the use of meteorological data of 15,000 years from 7 different GCMs, downscaled to 10 km grids from 100 km resolution. This enables capturing a broader spectrum of potential climate conditions and therefore generating a wide range of possible flood events without relying significantly on in-situ data. The proposed methodology considers the uncertainty inherent in climate models, providing a robust framework for assessing flood risk and results in a more reliable and realistic representation of stochastic flood events over a region. The approach presents a physically based alternative to the commonly used statistical approaches based on extreme value theory and could be a valuable tool for policymakers, researchers, and practitioners in making informed decisions in the face of evolving climate conditions.

How to cite: Kezhkepurath Gangadhara, K., Muraleedharan, S., Bharath, R., and Kadlec, M.: Regional Flood Risk Assessment Using Ensemble of GCMs, EGU General Assembly 2024, Vienna, Austria, 14–19 Apr 2024, EGU24-14570, https://doi.org/10.5194/egusphere-egu24-14570, 2024.

EGU24-16999 | ECS | Orals | HS7.8

Spatio-Temporal Dynamics of Extreme Precipitation and Dry Spells in Alpine Catchments under Changing Climatic Conditions 

Tatjana Milojevic, Christian R. Steger, and Michael Lehning

Heavy and extreme precipitation and drought events are expected to increase in frequency and intensity as a result of climate change. Investigating the projected evolution of these events in terms of their spatio-temporal dynamics is important for understanding if certain regions are more susceptible to negative impacts of the changes in extremes. The spatio-temporal dynamics of extremes in complex terrain, such as in the Swiss Alps, is of particular interest as the same event might impact nearby catchments in different ways. Using climate model data at a horizontal resolution of 2.2km, dynamically downscaled with the regional climate model COSMO for the emission scenario RCP8.5, we explore projected extreme precipitation and dry spells for the end of the 21st century (2090-2099) relative to present conditions. We apply connected component labelling (CCL) to define precipitation clusters and identify the spatio-temporal changes in extreme precipitation events in alpine catchments of the southern Swiss Alps. In addition, we investigate changes between present and possible future drought conditions. The main aim is to determine if certain watersheds in the southern Alps are expected to experience different vulnerabilities to climate change-driven extreme precipitation and drought events and if the propensity to a certain type of extreme varies between different catchments. Preliminary results indicate that, relative to present-day conditions, the total amount of precipitation tends to decrease in the future scenario with increasing temperature across multiple sites. Initial assessment of the CCL results indicates that a higher overall number of extreme precipitation clusters may be found in the future summer season relative to present conditions, with weaker differences for the remaining seasons. We also expect to find shifts in the spatial range and duration of the precipitation clusters and dry spells between the present and end of century conditions.

How to cite: Milojevic, T., Steger, C. R., and Lehning, M.: Spatio-Temporal Dynamics of Extreme Precipitation and Dry Spells in Alpine Catchments under Changing Climatic Conditions, EGU General Assembly 2024, Vienna, Austria, 14–19 Apr 2024, EGU24-16999, https://doi.org/10.5194/egusphere-egu24-16999, 2024.

EGU24-17547 | Orals | HS7.8 | Highlight

The space-time representation of extraordinary rainfall events 

Salvatore Manfreda

Extraordinary events are rarely observable in a single rainfall gauge, and this make extremely challenging the correct prediction of their arrivals. However, it may be possible to develop a more robust approach by employing a space-time modelling scheme that is able to capture the spatial dynamics of such phenomena. Therefore, a space-time Poisson model of rainfall cells with circular shape and random depth has been exploited for the first time to interpret the behaviour of this family of extraordinary events. This category of events that may be connected to larger meteorological phenomena not necessarily connected with local heterogeneity of the landscape. Following the identification of the observed extraordinary event across southern Italy, six zones with significantly different dynamics in terms of the frequency of such extremes were identified. Subsequently, a simple mathematical representation was adopted to calibrate the model parameters, leading to an estimate of regional probability distributions defined on the space-time occurrences of extraordinary events over homogeneous zones. The approach allows to overcome the limitations posed by point observations allowed the definition of a probability distribution that pertains to an entire area rather than just a point. The obtained quantiles of rainfall estimated seems to align well with the upper bound of the probability distribution of the annual maxima observed over the areas of interests.

Keywords: Rainfall statistics, Space-time Poisson models; Extraordinary events.

How to cite: Manfreda, S.: The space-time representation of extraordinary rainfall events, EGU General Assembly 2024, Vienna, Austria, 14–19 Apr 2024, EGU24-17547, https://doi.org/10.5194/egusphere-egu24-17547, 2024.

EGU24-19682 | ECS | Orals | HS7.8

Informativeness of teleconnections in local and regional frequency analysis of rainfall extremes 

Andrea Magnini and Attilio Castellarin

Numerous studies have established strong long-range relationships (teleconnections) between global climatic indexes and precipitation across diverse geographical regions worldwide. Typically, these investigations focus on the number of wet days or cumulative rainfall over specific seasons or the entire year, while only a few explicitly explore the informative value of teleconnections in describing the frequency regime of sub-daily rainfall annual maxima. Furthermore, most studies analyze the correlation between rainfall characteristics and teleconnection index values at individual gauge stations within the same season and without considering any time lag. 

Our study provides a comprehensive assessment of the potential and informative content of teleconnections for representing and modeling the frequency regime of rainfall extremes, addressing the limitations mentioned above. Our dataset comprises annual maximum series (AMS) of sub-daily rainfall depth recorded between 1921 and 2022 at approximately 2300 rain gauges spanning a large and climatically diverse region in Northern Italy. Based on a comprehensive literature review, we selected six global climate indexes and evaluated their correlation with time series of gridded regional L-moments, statistical measures characterizing the distribution of sub-daily rainfall extremes. In analyzing the spatial patterns of gridded L-moments, we considered time aggregation intervals (durations) ranging from 1 to 24 hours, discretization of the study region with tile sizes (resolutions) up to 100 km, and time lags in teleconnections up to 30 years. Our results reveal significant spatial patterns in the teleconnections, with the Western Mediterranean Oscillation Index exhibiting stronger relationships. The robustness of these spatial patterns is confirmed by their limited sensitivity to the chosen grid resolution and time lag, likely arising from the utilization of time series of spatially smoothed statistics of AMSs (gridded L-moments) rather than raw annual sequences of rainfall maxima. Consequently, our research suggests promising pathways for climate-informed local and regional frequency analysis of rainfall extremes. 

How to cite: Magnini, A. and Castellarin, A.: Informativeness of teleconnections in local and regional frequency analysis of rainfall extremes, EGU General Assembly 2024, Vienna, Austria, 14–19 Apr 2024, EGU24-19682, https://doi.org/10.5194/egusphere-egu24-19682, 2024.

EGU24-20390 | ECS,ECS | Orals | HS7.8

Evaluating Compound Risks of Heatwaves and Droughts on Crop Yield and Food Security in Morocco 

Bouchra Zellou, El Houcine Bergou, and Nabil El Moçayd

In an era marked by climate change, heatwaves and droughts have increasingly begun to co-occur within a single growing season, significantly impacting crop yields in key agricultural regions globally. Against this backdrop, the current study is dedicated to quantitatively evaluating the effects of these combined hot-dry episodes on agricultural productivity in Morocco, a country where such climatic extremes pose a significant threat to food security and economic stability. Utilizing high-resolution gridded precipitation and temperature data that closely aligns with 29 ground station observations, we calculate the Standardized Precipitation Index (SPI) and the Standardized Temperature Index (STI) across Moroccan arable regions in the agricultural season (September-May) during 1981-2018. Employing a vine-copula conditional probability model, the study explores the complex interactions between drought and heatwaves and their joint impact on vegetation, as indicated by the Normalized Difference Vegetation Index (NDVI). The focus is on identifying the conditional probability of vegetation loss under multiple compound dry-hot episodes. The findings highlight that the combined effects of droughts and heatwaves can have catastrophic consequences for crop yields, especially during the growth season. This underscores the critical need to assess their compound impact on agricultural productivity, rather than examining each factor separately. This study provides a robust understanding of compound hot-dry events and their impacts on crop yields, highlighting the emerging need for comprehensive adaptation strategies that bolster agricultural resilience and support sustainable productivity in the face of evolving climatic challenges.

Keywords: Compound, drought, heat waves, NDVI, vine-copula, conditional probability.

How to cite: Zellou, B., Bergou, E. H., and El Moçayd, N.: Evaluating Compound Risks of Heatwaves and Droughts on Crop Yield and Food Security in Morocco, EGU General Assembly 2024, Vienna, Austria, 14–19 Apr 2024, EGU24-20390, https://doi.org/10.5194/egusphere-egu24-20390, 2024.

This study aims to identify key characteristics of rainfall events, such as critical duration, extent, and severity (i.e., return period), to unveil potential dependencies with the resulting impact scenarios. Severity diagrams, introduced by Ramos et al. (2005) serve here as a straightforward tool, providing a synthetic visualization of storm severity while accounting for the complexity associated with rainfall spatial variability and duration. The method emphasizes the coexistence of extreme and ordinary (non-extreme) rainfall intensities. In contrast, the conventional approach of assigning a single return period to an event obscures a significant portion of storm complexity by overlooking spatial variability. Maximum mean areal precipitations observed over different areas during the storm event are evaluated. Subsequently, maximum equivalent point rainfalls are derived using ARF (Areal Reduction Factor) estimation, and their return period values deduced from the IDF (Intensity Duration Frequency) curves. The return periods are eventually mapped as a function of area and duration of rainfall accumulation. Several damaging storm events observed in the Calabria region (south Italy) over the last 20 years have been selected as illustrative examples for the analysis.

How to cite: Biondi, D. and Bloise, S.: Characterization of Extreme Rainfall Events Severity in Calabria: Exploring Spatial-Temporal Variability through Severity Diagrams, EGU General Assembly 2024, Vienna, Austria, 14–19 Apr 2024, EGU24-20687, https://doi.org/10.5194/egusphere-egu24-20687, 2024.

Nature depends on the inherent unpredictability of randomness, a significant force influencing hydrometeorological processes. While physics provides sophisticated models, understanding the variability within randomness is crucial for evaluating environmental risks. Despite the availability of numerous stochastic models tailored to specific statistical properties, identifying essential features for accurate simulations across time, space, and scales remains a challenge. This presentation outlines the progress in CoSMoS, a user-friendly stochastic modeling framework that advances from basic scenarios to complex multisite and space-time simulations. The underlying philosophy of this framework is to faithfully replicate the probabilities describing the occurrences of magnitudes and correlations in space and time. CoSMoS excels in generating time series for various hydroclimatic variables and simulating intricate space-time phenomena, as demonstrated by its effectiveness in replicating storms, cyclones, and air mass collisions. This showcases its versatility in capturing complex behaviors across different scales.

References

  • Papalexiou, S. M., Serinaldi, F., & Clark, M. P. (2023). Large-Domain Multisite Precipitation Generation: Operational Blueprint and Demonstration for 1,000 Sites. Water Resources Research, 59(3), e2022WR034094. https://doi.org/10.1029/2022WR034094
  • Papalexiou, S. M. (2022). Rainfall Generation Revisited: Introducing CoSMoS-2s and Advancing Copula-Based Intermittent Time Series Modeling. Water Resources Research, 58(6), e2021WR031641. https://doi.org/10.1029/2021WR031641
  • Papalexiou, S. M., Serinaldi, F., & Porcu, E. (2021). Advancing Space-Time Simulation of Random Fields: From Storms to Cyclones and Beyond. Water Resources Research, 57(8), e2020WR029466. https://doi.org/10.1029/2020WR029466
  • Papalexiou, S. M., & Serinaldi, F. (2020). Random Fields Simplified: Preserving Marginal Distributions, Correlations, and Intermittency, With Applications From Rainfall to Humidity. Water Resources Research, 56(2), e2019WR026331. https://doi.org/10.1029/2019WR026331
  • Papalexiou, S. M. (2018). Unified theory for stochastic modelling of hydroclimatic processes: Preserving marginal distributions, correlation structures, and intermittency. Advances in Water Resources, 115, 234–252. https://doi.org/10.1016/j.advwatres.2018.02.013
  • Papalexiou, S. M., Markonis, Y., Lombardo, F., AghaKouchak, A., & Foufoula‐Georgiou, E. (2018). Precise Temporal Disaggregation Preserving Marginals and Correlations (DiPMaC) for Stationary and Nonstationary Processes. Water Resources Research, 54(10), 7435–7458. https://doi.org/10.1029/2018WR022726

How to cite: Papalexiou, S. M.: Simulating Nature’s randomness with CoSMoS - A Versatile Stochastic Modeling Framework for Hydrometeorological Phenomena, EGU General Assembly 2024, Vienna, Austria, 14–19 Apr 2024, EGU24-21666, https://doi.org/10.5194/egusphere-egu24-21666, 2024.

EGU24-544 | ECS | PICO | HS7.9

Land-Atmosphere Interactions over North West Himalaya 

Ashish Navale and Karthikeyan Lanka

Precipitation can originate from evaporated water over oceans and land in remote locations or from local terrestrial sources. The precipitation due to these local sources is called recycled precipitation. Recycled precipitation has been used extensively to study land-atmosphere interaction and has shown to be helpful when studying the relationship between atmospheric or terrestrial variables and precipitation. Mountainous areas such as the Himalaya, Tibetan Plateau, Alps, Andes, and the Rocky Mountains are a hotspot for high local recycling and land-atmosphere interaction. The North West Himalaya (NWH) has drawn attention recently to the issue of climate change due to the region's drastically reduced rainfall and rapidly rising temperature over the past century. Climate change also affects the large number of processes involved in land-atmosphere interaction. The complex topography and heterogeneous climate of NWH makes it challenging to understand the land-atmosphere interaction in this region. In this study, we use an Eulerian water tagging method implemented into the Weather Research and Forecasting (WRF) model to study land-atmosphere interaction in NWH. This method is considered one of the most accurate techniques to quantify recycled precipitation. We simulated summer (June, July, August, and September) and winter (December, January, February, and March) precipitation in the NWH for twenty years from 2001 to 2020.

Results show that, due to availability of more thermal energy the summer experienced more recycling than winter. The western disturbances in winter and southwest monsoon during summer contributes to the locally evapotranspirated moisture and affects the recycling ratio of NWH. However, the irregular western disturbances lead to high variability in the winter recycling ratio. Our analysis shows a strong diurnal cycle of recycling ratio in NWH which peaks in the afternoon. The trend analysis from twenty years although did not show any significant trend in recycled precipitation, other variables affecting land-atmosphere interaction such as soil moisture, latent heat and 2-meter air temperature showed significant trends in NWH. We also studied land-atmosphere interaction over two contrasting regions: the foothills of Himalaya and the high-elevation region. The recycled precipitation was high in the lower elevations during summer and at higher elevations during winter. We also found higher land-atmosphere interaction during summer at higher elevations and during both summer and winter at foothills. However, due to continuous precipitation along the foothills of NWH, a brief shift in soil moisture to a wet regime is expected during monsoon which reduces the influence of soil moisture on the atmosphere leading to low land-atmosphere interaction. However, good land-atmosphere interaction exists throughout the summer in the higher Himalaya, where this change in regime is not apparent.

How to cite: Navale, A. and Lanka, K.: Land-Atmosphere Interactions over North West Himalaya, EGU General Assembly 2024, Vienna, Austria, 14–19 Apr 2024, EGU24-544, https://doi.org/10.5194/egusphere-egu24-544, 2024.

EGU24-1391 | ECS | PICO | HS7.9 | Highlight

US Corn Belt enhances regional precipitation recycling 

Zhe Zhang, Cenlin He, Fei Chen, Gonzalo Miguez-Macho, Changhai Liu, and Roy Rasmussen

Precipitation recycling, characterized by the contribution of local evapotranspiration (ET) to local precipitation, is a critical component of the
regional water cycle. In the US Corn Belt, vast croplands and irrigation applications have markedly modified surface energy and water balance, which in
turn modulates precipitation recycling. However, previous studies often neglected the complex hydrological and crop physiological processes at land surface with an oversimplified assumption. In this study, we aim to understand the precipitation recycling in the US Corn Belt with explicit shallow groundwater dynamics, crop growth, and irrigation processes in the WRF model, with the water vapor tracer (WVT) capability to track ET directly from croplands. We found that the croplands exhibit a strong cooling effect on air temperatures and increasing summer precipitation. The increase in precipitation can be attributed to enhanced precipitation recycling, ranging from 11 to 22%, and much stronger seasonality during summer growing seasons. Such cooling effect and contribution to precipitation recycling is more significant in a drought year compared to normal and wet years, depending on both large-scale moisture advection and local moisture source. Our results have important implications to modeling ecohydrology and agricultural management in the Earth system, understanding precipitation recycling in the entire water cycle and designing sustainable water resource governance.

How to cite: Zhang, Z., He, C., Chen, F., Miguez-Macho, G., Liu, C., and Rasmussen, R.: US Corn Belt enhances regional precipitation recycling, EGU General Assembly 2024, Vienna, Austria, 14–19 Apr 2024, EGU24-1391, https://doi.org/10.5194/egusphere-egu24-1391, 2024.

EGU24-1607 | PICO | HS7.9

Impacts of irrigation on local, regional, and remote climate 

Min-Hui Lo and Hung-Chen Chen

Irrigation significantly impacts climate across local, regional, and remote scales. This critical agricultural practice transforms local land surface properties, leading to increased soil moisture and consequent changes in the surface energy balance. Such changes typically result in cooler local surface temperatures due to higher latent heat flux from enhanced evapotranspiration. Beyond its local effects, irrigation substantially influences regional climate and hydrology. The introduction of additional moisture into the atmosphere from irrigated areas can alter regional atmospheric dynamics, potentially affecting cloud formation and modifying precipitation patterns. While irrigation practices can be beneficial for agriculture, they may also have unintended consequences on regional climates, including altering rainfall distribution. Furthermore, the implications of irrigation can extend to remote climate systems. Irrigation-induced redistribution of heat and moisture can influence atmospheric circulation patterns and atmospheric wave dynamics, impacting hydroclimate far beyond the immediate area of irrigation. These remote effects underscore the interconnected nature of global climate systems and the extensive impact of localized human activities like irrigation.

In sum, irrigation exerts a cascading influence on climate systems at various scales. It reshapes local surface conditions, drives changes in regional atmospheric processes, and has potential implications for remote climates. Comprehending these complex interactions is crucial for formulating sustainable irrigation strategies and addressing the broader climatic impacts of such practices.

How to cite: Lo, M.-H. and Chen, H.-C.: Impacts of irrigation on local, regional, and remote climate, EGU General Assembly 2024, Vienna, Austria, 14–19 Apr 2024, EGU24-1607, https://doi.org/10.5194/egusphere-egu24-1607, 2024.

Land use and cover change (LULCC) is an important climatic forcing. However, it is challenging to quantify the responses of local precipitation to LULCC forcing due to the complex interaction between the land surface and atmosphere. The ecologically fragile Loess Plateau (LP) of China has experienced evident changes in precipitation patterns, but the underlying mechanism remains unclear. The biophysical effects of LULCC on precipitation and the water vapor balance in the LP region were quantified based on the LULCC forcing experiments from the sixth phase of the Coupled Model Intercomparison Project (CMIP6). We found that the selected 11 Earth system models (ESMs) reproduced the general spatial pattern of annual precipitation on the LP region, with slight overestimation in the southern LP. The multimodel ensemble (MME) average showed that global LULCC forcing exerted a negative effect on long-term mean precipitation in this region during the period of 1850-2014. In particular, it decreased evidently during the period from 1850 to 1960, with a reduction of approximately 14.1 mm. However, a positive effect was detected for the period of 1961-2014, with an increase of 6.4 mm in annual precipitation. This is largely related to the intensified water vapor transport in the southern boundary and westerly belt of the LP region resulting from global LULCC forcing. Furthermore, water vapor balance analysis showed that global LULCC forcing resulted in a divergence in water vapor transport within the LP region, leading to a net water vapor output to the surrounding regions. These findings highlight the importance of considering global LULCC, in addition to regional LULCC, in studying regional climate change and associated impacts on the water cycle.

How to cite: Qiu, L.: Importance of biophysical forcing of global land cover to local precipitation and water vapor budget on the Loess Plateau of China, EGU General Assembly 2024, Vienna, Austria, 14–19 Apr 2024, EGU24-5039, https://doi.org/10.5194/egusphere-egu24-5039, 2024.

EGU24-6236 | ECS | PICO | HS7.9

Regional impacts of simulated irrigation in the IPSL climate model. 

Pierre Tiengou, Agnès Ducharne, Frédérique Cheruy, Yann Meurdesoif, and Pedro Arboleda

The recent years have shown increasing interest and effort to include simulation of irrigation in Earth System Models to better account for the effects of this anthropogenic process on climate. We present here preliminary results about the impacts of simulated irrigation on surface-atmosphere interactions using LMDZ and ORCHIDEE, the atmosphere and land surface components of the IPSL Climate Model. The DYNAMICO-LMDZ configuration, coupling the physics of LMDZ to the recent icosahedral dynamical core DYNAMICO, is run as a Limited Area Model (LAM) to conduct a regional study over North-Eastern Spain. The simulation domain encompasses the Ebro valley where the LIAISE (Land-surface Interactions with the Atmosphere In Semi-Arid Environment) field campaign was conducted in 2021. This campaign was specifically designed to provide better understanding of the local and regional impacts of irrigation and the surface heterogeneities it creates. A new representation of irrigation, based on a soil moisture deficit approach, has recently been developed in ORCHIDEE and simulations are run with and without it to assess the impacts of simulated irrigation in the model. Direct effects at the land-surface interface (soil moisture, turbulent fluxes, temperature) are studied first, before focusing on the structure of the boundary layer and precipitations. Field observations from the campaign are used to evaluate the model, and the outputs will also be compared to higher-resolution simulations that have been conducted using the Meso-NH model in the context of the LIAISE project. The impacts of irrigation will be studied using various resolutions of the LAM from 10 to 50km, to better understand the scales at which land-surface coupling processes can be explicitly resolved by the dynamics of the model, and assess the importance of parametrizating these processes.

How to cite: Tiengou, P., Ducharne, A., Cheruy, F., Meurdesoif, Y., and Arboleda, P.: Regional impacts of simulated irrigation in the IPSL climate model., EGU General Assembly 2024, Vienna, Austria, 14–19 Apr 2024, EGU24-6236, https://doi.org/10.5194/egusphere-egu24-6236, 2024.

EGU24-8049 | ECS | PICO | HS7.9 | Highlight

Global terrestrial moisture recycling in Shared Socioeconomic Pathways 

Arie Staal, Pim Meijer, Maganizo Kruger Nyasulu, Obbe Tuinenburg, and Stefan Dekker

The global water cycle has undergone considerable changes since pre-industrial times due to global climate change and land-use changes. These drivers will almost certainly continue to change during the course of this century. However, where, how, and to which extent terrestrial moisture recycling will change as a result remains unclear.

Mutually consistent scenarios of climate change and land-use changes for the 21st century are provided by the Shared Socioeconomic Pathways (SSPs). The SSPs provide a framework of five different narratives involving varying degrees of challenges associated with mitigation or adaptation. From each narrative follow different implications for emissions, energy, and land use. The SSPs serve as the conceptual framework behind the sixth generation of the Coupled Model Intercomparison Project, CMIP6.

Terrestrial moisture recycling is often assessed using atmospheric moisture tracking models. An example is UTrack, a Lagrangian model to track moisture through three-dimensional space. Here we present a new forward-tracking version of UTrack that is forced by output of a CMIP6 model to study how terrestrial moisture recycling may change across the globe until the end of the  21st century in a range of SSPs, from mild to severe: SSP1-2.6, SSP2-4.5, SSP3-7.0, and SSP5-8.5. For this forcing, we chose the Norwegian Earth System Model version 2, or NorESM2. It has a temporal resolution of one day and a spatial resolution of 1.25° × 0.9375° at eight pressure levels.

We find that across the 21st century, the global terrestrial moisture recycling ratio decreases with the severity of the Shared Socioeconomic Pathways (SSPs). We calculate a decrease in global terrestrial precipitation recycling by 2.1% with every degree of global warming. Because the SSPs represent internally consistent scenarios of both global warming and global land cover changes, it is hard to distinguish the relative contributions of these two, but the evidence points at a major influence of global warming on moisture recycling.

We find spatial differences in trends in recycling ratios, but which are broadly consistent among SSPs. If a change in precipitation (either drying or wetting) coincides with an increase in terrestrial precipitation recycling ratio, we call it land-dominated. We call the change in precipitation ocean-dominated if it coincides with a decrease in terrestrial precipitation recycling ratio. Land dominance tends to occur in regions with already large terrestrial precipitation recycling ratios, mainly interior South America (land-dominated drying) and eastern Asia (land-dominated wetting). Land-dominated drying may also happen in eastern Europe, in central America and in subtropical sub-Saharan Africa. Ocean-dominance, mainly in the form of wetting, is found primarily in the high northern latitudes and in central Africa.

We also simulated the changes in basin recycling for the 27 major river basins of the world, confirming the overall tendency of decreasing recycling with severity of the SSP, as well as its spatial variations.

How to cite: Staal, A., Meijer, P., Nyasulu, M. K., Tuinenburg, O., and Dekker, S.: Global terrestrial moisture recycling in Shared Socioeconomic Pathways, EGU General Assembly 2024, Vienna, Austria, 14–19 Apr 2024, EGU24-8049, https://doi.org/10.5194/egusphere-egu24-8049, 2024.

The ecological restoration benefits in the Yellow River Basin (YRB) are significant, characterized by increased vegetation and reduced sediment. However, afforestation has resulted in elevated water consumption, posing a threat to the sustainability of ecological functions and socio-economic water use. Previous studies treating evapotranspiration (ET) as absolute water consumption and neglecting the precipitation increase from water recycling, have introduced considerable uncertainty and limited our understanding and prediction of the process. By combining GLEAM ET data and UTrack data, we depicted the contribution of ET in the YRB to local and surrounding basin precipitation .Our study reveals a substantial increase in ET in the YRB from 1980 to 2020. ET in this basin contributes to precipitation in both local and downstream areas through moisture recycling. On average, ET contributes 107 mm/yr of precipitation locally (21%), with the primary contribution from the Upper and Middle region. Additionally, ET contributes 63, 23, 20, and 20 mm/yr of precipitation to the Haihe River Basin, Yangtze Basin, Huaihe River Basin, and Songliao River Basin, respectively. Alongside the increase in ET, its contribution to precipitation is also rising, diminishing outward from the YRB. The increased ET brings about approximately 11 mm/yr of additional precipitation to YRB, offsetting about a quarter of the ET increase. We also provide a schematic diagram illustrating the water cycle in the YRB, elucidating the proportions of each component. This work contributes to a clearer understanding of the basin's hydrological processes, offering scientific support for water resource management and sustainable development in the changing conditions of the YRB.

How to cite: Zhang, H. and Wang, S.: Increased evapotranspiration in the Yellow River basin brings additional precipitation locally and downwindwards, EGU General Assembly 2024, Vienna, Austria, 14–19 Apr 2024, EGU24-8107, https://doi.org/10.5194/egusphere-egu24-8107, 2024.

EGU24-9778 | PICO | HS7.9

Estimating the impact of irrigation and groundwater pumping on regional hydroclimate using an Earth System Model 

Yusuke Satoh, Yadu Pokhrel, Hyungjun Kim, and Tokuta Yokohata

Irrigation is an anthropogenic forcing to the Earth-system that alters the water and heat budgets at the land surface, leading to changes in regional hydro-climate conditions over a range of spatiotemporal scales. These impacts of irrigation are anticipated to escalate in the future due to increased food demand and the pervasive effects of climate change. Thus, it is imperative to better understand the nature, extent, and mechanisms through which irrigation affects the Earth's system. However, despite its increasing importance, irrigation remains a relatively nascent component in the Earth-system modeling community, necessitating advancements in modeling and a deepened understanding.

Our research aims to improve the quantitative understanding of the impacts of irrigation and groundwater use as anthropogenic drivers on regional climate and environmental changes. To this end, we developed an improved Earth-system modeling framework that is based on MIROC-ES2L (Hajima et al 2020 GMD) coupled with hydrological human-activity modules (Yokohata et al. 2020 GMD). This model enables the simulation of a coupled natural-human interaction including hydrological dynamics associated with irrigation processes. Employing this Earth-system model, we carried out a numerical experiment in T85 spatial resolution, utilizing an AMIP style set-up. Here, our ensemble simulation allows for statistical quantification of the irrigation impact differentiating them from the uncertainties arising due to natural variability.

Through our investigation, we have identified specific regions and seasons where irrigation exerts a discernible influence on regional hydro-climate. Notably, our results show substantial disparities—larger than or comparable to inter-annual variability—between simulations incorporating and excluding the irrigation process, particularly in heavily irrigated regions such as Pakistan and India. Our model demonstrates that the introduction of moisture into the soil through irrigation alters the hydrological balance of the land surface, consequently influencing the overlying atmosphere. Conversely, we found significant uncertainty in the impact estimate for some regions, even those heavily irrigated, such as the central United States and eastern China, indicating the challenges of robustly estimating irrigation impacts with limited samples. This underscores the necessity for an appropriate statistical approach to evaluate the impact of irrigation, considering the inherent variability. Furthermore, our study delves into estimating regional variations in the contributions of groundwater and surface water use to these impacts. Emphasizing the importance of a more nuanced understanding of regional characteristics in irrigation impact assessments, our research underscores the significance of coupled earth system models in comprehending and predicting the intricate interplay between human activities and the Earth's climate system.

How to cite: Satoh, Y., Pokhrel, Y., Kim, H., and Yokohata, T.: Estimating the impact of irrigation and groundwater pumping on regional hydroclimate using an Earth System Model, EGU General Assembly 2024, Vienna, Austria, 14–19 Apr 2024, EGU24-9778, https://doi.org/10.5194/egusphere-egu24-9778, 2024.

EGU24-12725 | ECS | PICO | HS7.9 | Highlight

Hydrological implications of future tree cover change and climate change 

Imme Benedict, Freek Engel, Caspar T. J. Roebroek, and Anne J. Hoek van Dijke

The availability of fresh water over land may become increasingly scarce under climate change. Future large scale tree cover changes can either enhance or mitigate this water scarcity. Previous work focused mostly on the impact of tree cover change in our current climate. Instead, we investigate the impact of climate change and future global tree cover change on precipitation, evapotranspiration, and runoff (water availability) in a future climate. To do so, multiple datasets and methodologies are combined; data from five CMIP6 models, a future tree cover change dataset, six Budyko models and a moisture recycling dataset. With this interdisciplinary data-driven approach the separate and combined effects of future climate change and future large-scale tree cover change can be quantified. The changes in water availability are studied on grid cell level (1 by 1 degrees), averaged over the globe, and aggregated for selected river basins (Yukon, Mississippi, Amazon, Danube and Murray-Darling).

Globally averaged, future climate change results in an increase in runoff where future tree cover change decreases the runoff. Both effects are of similar magnitude and lead to a limited net effect in water availability compared to the present climate. However, locally, the effects of tree cover change and climate change can be substantial, resulting in changes in water availability of more than 100 mm/year, either positive or negative. For the five selected river basins different responses in direction and magnitude of water availability are found due to future tree cover change under climate change. In all catchments, except the Mississippi basin, the climate change signal dominates over the tree cover change signal. For the Mississippi basin we find a dominant impact of tree cover change, opposite to the climate change signal, resulting in reduced water availability.

How to cite: Benedict, I., Engel, F., Roebroek, C. T. J., and Hoek van Dijke, A. J.: Hydrological implications of future tree cover change and climate change, EGU General Assembly 2024, Vienna, Austria, 14–19 Apr 2024, EGU24-12725, https://doi.org/10.5194/egusphere-egu24-12725, 2024.

EGU24-13419 | ECS | PICO | HS7.9

Irrigation impact on thermodynamics in weather forecast modelling 

Kirsten Maria FLORENTINE Weber, Linus Magnusson, Gianpaolo Balsamo, Margarita Choulga, Souhail Boussetta, Xabier Pedruzo Bagazgoitia, and Gabriele Arduini

By 2030, over 300 million hectares worldwide will be irrigated, constituting the second most significant anthropogenic influence on land use following urbanisation. Our study focuses on an irrigated Terrestrial Environmental Observatories (TERENO)/Integrated Carbon Observation System (ICOS) site in Germany, unveiling irrigation's immediate effects on soil moisture, latent heat flux, skin and soil temperature. As we strive to seamlessly integrate irrigation processes into the ECMWF Integrated Forecasting System (IFS), our investigation extends to an offline model, ECLand, including dynamical vegetation. Introducing a perturbed precipitation field offers a refined perspective of mimicking irrigation. The feedback provides us with insights into the coupling of simple irrigation representation on thermodynamic variables, ensuring optimal benefits for the IFS. After verification with remote sensing data, the next step involves coupling water fluxes to stomatal conductance via photosynthesis, shedding light on the preliminary influence of irrigation on enhanced vegetation growth. This aims to untangle irrigation effects of increased soil moisture and greening. 

How to cite: Weber, K. M. F., Magnusson, L., Balsamo, G., Choulga, M., Boussetta, S., Pedruzo Bagazgoitia, X., and Arduini, G.: Irrigation impact on thermodynamics in weather forecast modelling, EGU General Assembly 2024, Vienna, Austria, 14–19 Apr 2024, EGU24-13419, https://doi.org/10.5194/egusphere-egu24-13419, 2024.

EGU24-15039 | ECS | PICO | HS7.9

Fate and changes in moisture evaporated from the Tibetan Plateau (2000–2020) 

Chi Zhang, Deliang Chen, Qiuhong Tang, Jinchuan Huang, and Mei Yan

The Tibetan Plateau (TP) has been termed the “Asian water tower” and it plays an important role in regulating the Asian water cycle, which affects billions of people. Although the areal mean evaporation of the TP is not high, the total evaporation integrated over the vast terrain of the TP is huge and may strongly influence downwind regions. However, the ultimate fate of this evaporation moisture remains unclear. This study tracked and quantified TP-originating moisture using an extended WAM2Layers model. The findings reveal that the involvement of moisture from the TP in the downwind precipitation is most pronounced near the eastern boundary of the TP and gradually diminishes eastward. Consequently, the TP moisture ratio in precipitation reaches the highest of over 30% over the central-eastern TP. 44.9–46.7% of TP annual evaporation is recycled over the TP, and 65.1–66.8% of the TP evaporation is reprecipitated over terrestrial China. Moisture recycling of TP origin shows strong seasonal variation, with seasonal patterns largely determined by precipitation, evaporation and wind fields. High levels of evaporation and precipitation over the TP in summer maximize local recycling intensity and recycling ratios. Annual precipitation of TP origin increased mainly around the northeastern TP during 2000–2020. This region consumed more than half of the increased TP evaporation. Further analyses showed that changes in reprecipitation of TP origin were consistent with precipitation trends in nearby downwind areas: when intensified TP evaporation meets intensified precipitation, more TP moisture is precipitated out. This study also analyzed the uncertainty due to different tracking modes in WAM2Layers, i.e., backward and forward moisture tracking. In forward moisture tracking, the annual precipitation recycling ratio (PRR) of the TP was estimated to be 26.9–30.8%. However, due to the non-closure issue of the atmospheric moisture balance equation, the annual PRR in backward tracking could be ~6% lower.

How to cite: Zhang, C., Chen, D., Tang, Q., Huang, J., and Yan, M.: Fate and changes in moisture evaporated from the Tibetan Plateau (2000–2020), EGU General Assembly 2024, Vienna, Austria, 14–19 Apr 2024, EGU24-15039, https://doi.org/10.5194/egusphere-egu24-15039, 2024.

EGU24-16857 | ECS | PICO | HS7.9

Reconciling bilateral connections of atmospheric moisture within the hydrological cycle 

Simon Felix Fahrländer, Elena De Petrillo, Marta Tuninetti, Lauren Seaby Andersen, Luca Monaco, Luca Ridolfi, and Francesco Laio

To improve our understanding of how we are connected globally through water flows, at scales relevant to policy and management, is imperative for global water stewardship. It is therefore crucial to describe the fate of moisture in the atmosphere by evaluating the global moisture inter-dependencies at the country level.  However, few studies have addressed global moisture inter-dependencies at the country level.

In this study, we present a novel dataset of country-to-country atmospheric moisture flows, including both terrestrial and oceanic sources, and propose an approach to assure the closure of the global and country-scale atmospheric water balance. By adopting an analogy with international trade analysis, we employ an iterative proportional fitting method to adjust the bilateral exchanges of water vapor from sources to sinks, ensuring that the total imported (exported) atmospheric moisture equals the total precipitation (evaporation) derived from ERA5 on an annual basis. 

Relevant analysis to understand water inter-dependencies between countries and regions can be performed from the bilateral matrix we present. We assess the terrestrial moisture recycling ratio (TMR) as the portion of countries’ or regions’ precipitation originating from terrestrial evaporation. Furthermore, we estimate a global TMR of 36%, while we find the highest TMRs are those of Eastern Asia (64%), Eastern Europe (68%), and Central Africa (79%). The bilateral structure of the dataset allows also to shed light on key links (and relative weights) dominating the exchange of atmospheric moisture between two countries or regions, thus supporting inter-countries water governance. For example, Central Africa receives 80% of its terrestrially sourced precipitation from Eastern Africa, while Eastern Europe evenly gets moisture from four distinct links, Eastern Asia, Central Asia, Southern Europe and Northern Europe, covering 70% of its import from terrestrial sources. 

Future studies can leverage the dataset to explore nations’ links in the global atmospheric moisture flow network and assess their role in the global hydrological cycle.

How to cite: Fahrländer, S. F., De Petrillo, E., Tuninetti, M., Andersen, L. S., Monaco, L., Ridolfi, L., and Laio, F.: Reconciling bilateral connections of atmospheric moisture within the hydrological cycle, EGU General Assembly 2024, Vienna, Austria, 14–19 Apr 2024, EGU24-16857, https://doi.org/10.5194/egusphere-egu24-16857, 2024.

EGU24-17252 | ECS | PICO | HS7.9 | Highlight

Impacts of the Three Gorges Dam on regional precipitation: based on high resolution simulation 

Peiyi Peng, Yiming Zhang, and Xu Di

The Three Gorges Dam (TGD), as the largest hydropower project, resulting in increasing water area from 408km2 to 1084km2 and extending waterway into 660 km. It is obvious that land use change would influence regional precipitation, but affected region owing to the TGD is on dispute. Moreover, the highest resolution of previous studies is 1.5 km, however the width of artificial lake formed by the TGD is about 1.1 km. To this end, we address the need of a higher resolution of numerical simulation by running weather research and forecast (WRF) model with 3 two-way nested domains. Two simulations under different land use (with or without TGD) are compared. Results showed that regional precipitation is suppressed owing to TGD to some extent. More precisely, increasing precipitation happens in downwind region, whereas decreasing precipitation occurs upwind region. Besides, water surface expansion leads to a reduction in surface temperature within 0~5 km of surrounding area. The TGD construction increase specific humidity and surface within 5 km buffer. That is because water surface expansion results in moisture surplus in nearby region.

How to cite: Peng, P., Zhang, Y., and Di, X.: Impacts of the Three Gorges Dam on regional precipitation: based on high resolution simulation, EGU General Assembly 2024, Vienna, Austria, 14–19 Apr 2024, EGU24-17252, https://doi.org/10.5194/egusphere-egu24-17252, 2024.

EGU24-19575 | ECS | PICO | HS7.9

Analysis of moisture recycling at unprecedented resolution in the western Mediterranean region  

Damián Insua Costa, Jessica Keune, Akash Koppa, Christian Massari, and Diego G. Miralles

The western Mediterranean region is a climate change hotspot, where the increase in temperature far exceeds the global average. This is causing its hydrological cycle to be highly impacted, with an increase in the frequency and intensity of droughts, extreme precipitation and floods. For this reason, a more holistic understanding of the atmospheric branch of water cycle and its connexion to meteorological changes is needed. Here we use satellite-based observational data recently generated within the 4DMED-Hydrology ESA project to analyse the atmospheric water transport in the region at an unprecedented resolution. Specifically, we combine a Lagrangian back-trajectory model for moisture tracking (FLEXPART–HAMSTER; Keune et al., 2022) with observed evaporation and precipitation data to quantify moisture recycling at 1 km spatial resolution. Our results show average local precipitation recycling rates close to 30% in summer months, in agreement with previous studies (Batibeniz et al., 2020), but this rate is highly variable over time, being much higher in periods of drought, when water supply is most needed. Likewise, the results reveal that evaporation recycling is highly spatially variable, meaning that moisture evaporated in some parts of the Mediterranean region is much more efficiently rained within the same region than others. For instance, in the Po Valley, the fraction of evaporation that returns to the region as rain is much higher than in its surroundings, which is why we consider it as a Mediterranean moisture source hotspot. Our findings demonstrate how meteorological anomalies can affect the transfer of water through the atmosphere in the region, and highlight the importance of investing in high-resolution Earth observation to advance our understanding of the different branches of the hydrological cycle. 

References: 

Keune, J., Schumacher, D. L., & Miralles, D. G. (2022). A unified framework to estimate the origins of atmospheric moisture and heat using Lagrangian models. Geoscientific Model Development, 15(5), 1875–1898. https://doi.org/10.5194/gmd-15-1875-2022 

Batibeniz, F., Ashfaq, M., Önol, B., Turuncoglu, U. U., Mehmood, S., & Evans, K. J. (2020). Identification of major moisture sources across the Mediterranean Basin. Climate Dynamics, 54, 4109-4127. https://doi.org/10.1007/s00382-020-05224-3 

How to cite: Insua Costa, D., Keune, J., Koppa, A., Massari, C., and G. Miralles, D.: Analysis of moisture recycling at unprecedented resolution in the western Mediterranean region , EGU General Assembly 2024, Vienna, Austria, 14–19 Apr 2024, EGU24-19575, https://doi.org/10.5194/egusphere-egu24-19575, 2024.

EGU24-20936 | ECS | PICO | HS7.9 | Highlight

Atmospheric moisture recycling and its influence in the Sudd Region in the Upper Nile Basin 

Yueyang Chen and Asaad Shamseldin

Moisture recycling, is defined as the precipitation in a region which is partially contributed
by evapotranspiration from the same region. It is the interaction between terrestrial hydrology
and atmospheric processes, and plays a crucial role in forming local water resources and
affecting local climate. Up to date, global moisture recycling at regional and continental
scales has been understood relatively well, the patterns of local moisture recycling and the
main variables impacting it remain unclear. For wetlands, the evaporation alters local climate
by re-precipitation in surrounding regions, which can also be analysed from the viewpoint of
moisture recycling. Yet, there is rare research has been done in this viewpoint to analyse and
manage water resources of wetlands. It is thus of importance to carry out such research to
unveil it. As the largest wetland in Africa, the Sudd region has relatively large precipitation
recycling contributed by the surrounding regions, as well as large swampy areas of upper
Nile Basin, which makes it an appropriate study case for the moisture recycling of wetlands.
In this research, it is the first time to carry out atmospheric moisture recycling of Sudd region,
considering anthropogenic activities such as engineering practices, hydro-politics and
complex system. In this article, we will present multi-year hydro-climatology patterns of
Sudd, and the calculation results from Water Accounting Model-Two Layers (WAM-
2layers), including water vapor sources of its precipitation, and the reprecipitation of its
evapotranspiration. We will also analyse their spatial distributions, origin and destination, and
find the multi-year average moisture recycling ratio of the basin. From our calculation, it is as
high as 24% in some regions. In summary, this work shows that Sudd region is of great
significance to the neighbouring regions in terms of moisture recycling, and this would be
also useful to provide a practical basis for planning by considering local land-atmosphere
interaction.

How to cite: Chen, Y. and Shamseldin, A.: Atmospheric moisture recycling and its influence in the Sudd Region in the Upper Nile Basin, EGU General Assembly 2024, Vienna, Austria, 14–19 Apr 2024, EGU24-20936, https://doi.org/10.5194/egusphere-egu24-20936, 2024.

EGU24-338 | ECS | Posters on site | HS7.10

Supplementing rainfall simulator studies with single drop measurements 

Michał Beczek, Magdalena Ryżak, Karolina Gibała, Rafał Mazur, Agata Sochan, Cezary Polakowski, Tomasz Beczek, and Andrzej Bieganowski

Rainfall simulators are essential tools for geoscientific and hydrological research, e.g. water erosion processes, throughfall phenomenon, interception etc. They allow the creation of suitable and reproducible experimental conditions providing a large amount of information. However, in certain situations, e.g. the soil splash phenomenon, other research methods are needed to study the basic processes and mechanisms on a smaller scale, i.e. concerning the interaction of single drops. In such a case, single drop measurements used with raindrop generators can be a good complementary tool for rainfall simulators. They provide complete understanding and description of the investigated phenomenon.

The aim of this study was to present selected measurement methods based on the single drop methodology which are used to investigate splash erosion and surface deformation, interaction of drops with leaves or conifers, and microorganism transportation. These include: a) a set of high-speed cameras with PTV (Particle Tracking Velocimetry) software used to identify, track, and characterize the splashed particles and water droplets; b) splash cup measurements for the determination of the mass ratio of splashed particles during the raindrop splash phenomenon; c) a 3D surface scanner and microtomography for the description of surface deformation after the drop impact; d) a laser diffraction method and light microscopy for the determination of the size of splashed particles; e) IRMS (Isotope-ratio mass spectrometry), i.e., deuterium-labelled water used to the define the origin of the splashed water.


This work was partly financed from the National Science Centre, Poland; project no. 2022/45/B/NZ9/00605.


References:

Beczek M., Ryżak M., Sochan A., Mazur R., Polakowski C., Hess D., Bieganowski A.: Methodological aspects of using high-speed cameras to quantify soil splash phenomenon. GEODERMA 378, 2020

Mazur R., Ryżak M., Sochan A., Beczek M., Polakowski C., Przysucha B., Bieganowski A.: Soil deformation after one water-drop impact – The effect of texture and soil moisture content. GEODERMA 417, 2022

Ryżak M., Beczek M., Mazur R., Sochan A., Gibała K., Polakowski C., Bieganowski A.: The splash of a single water drop on selected coniferous plants. Forest Ecology and Management 541, 121065, 2023

How to cite: Beczek, M., Ryżak, M., Gibała, K., Mazur, R., Sochan, A., Polakowski, C., Beczek, T., and Bieganowski, A.: Supplementing rainfall simulator studies with single drop measurements, EGU General Assembly 2024, Vienna, Austria, 14–19 Apr 2024, EGU24-338, https://doi.org/10.5194/egusphere-egu24-338, 2024.

EGU24-3431 | Posters virtual | HS7.10

Investigating effects of different vegetation layers on soil erosion with a portable rainfall simulator 

Steffen Seitz, Corinna Gall, Nicolás Riveras-Muñoz, Zhengshan Song, and Thomas Scholten

Small-scale field rainfall simulators provide scientists with a tool to investigate complex interconnections between landcover and soil erosion experimentally. In particular, specific effects of vegetation such as plant structure or traits on sediment translocation are of key interest in erosion studies. A main feature of portable rainfall simulators is the formation of repeatable precipitation patterns with a kinetic energy corresponding to natural rainfall events at different locations in the field. Despite not measuring the whole process chain of water erosion, they assist to shed light on individual influences on sediment transport with an enhanced number of replications and thus adding to field measurements under natural rainfall.

In this context, the Tübingen Rainfall Simulator (TRS, single-nozzle, <1-2 m2) has been used in the last two decades to investigate the effect of plant diversity, individual plant species as well as fauna on soil erosion in different forest and agricultural ecosystems. Results show among others, that higher forest vegetation does often not show an erosion-reducing effect and the kinetic energy of rainfall in young forest plantations can exceed freefall kinetic energy several fold. Impacts on sediment transport are strongly species-specific and depending on individual plant traits such as plant height, height of the first branch, branch angles or leaf sizes and shapes. Therefore, surface-near soil covering vegetation layers and contained mesofauna play a larger role than expected. Important reducing impacts can be initiated by biological soil crusts as a pioneer stage after vegetation disturbances, which also show severe impacts on water fluxes and infiltration in woodlands. Furthermore, these results from forestry are transferable to crop production and agriculture, where a positive impact of modern organic farming systems with short fallow periods and reduced soil-turning techniques on soil erosion control can be underlined.

In summary, portable simulator systems have proven reliable even under difficult operating conditions and could be successfully used to gather data sets with a high number of data points and to supplement large-scale erosion studies. They therefore help answering fundamental questions on the principal effects of vegetation on sediment translocation. For a better comparability of different studies and to further widen existing data sets, a harmonization of different field measurement approaches would be desirable.

How to cite: Seitz, S., Gall, C., Riveras-Muñoz, N., Song, Z., and Scholten, T.: Investigating effects of different vegetation layers on soil erosion with a portable rainfall simulator, EGU General Assembly 2024, Vienna, Austria, 14–19 Apr 2024, EGU24-3431, https://doi.org/10.5194/egusphere-egu24-3431, 2024.

EGU24-8198 | Posters on site | HS7.10

Rainfall Microphysics and Instrument Measurement Assessments via Rainfall Simulators 

Firat Y. Testik, Rupayan Saha, and Kalimur Rahman

This study presents investigations on rainfall microphysical processes and ground-based rainfall instrument measurements through laboratory rainfall simulations with careful considerations for in-situ observations and validations.  Controlled laboratory rainfall experimentation has a pivotal role in systematic investigations to deepen our understanding of rainfall microphysical processes and the development, calibration, and assessment of rainfall instruments.  In the rainfall and related investigations in the PI’s laboratory over the past nearly two decades, we have utilized a variety of laboratory rainfall simulation setups, each featuring customized drop generators for the application, that were designed to address the specific aspects and objectives of the targeted research.  Here we will present our select experimental investigations on raindrop morphodynamics (shape and fall speed) and collisions as well as assessments of the OTT Parsivel2 disdrometer and OTT Pluvio2 rain gauge measurements.  Raindrop morphodynamics and collisions are of importance for various applications, including radar rainfall retrievals and hydrological modeling.  Parsivel2 and Pluvio2 are widely used ground-based instruments to monitor various precipitation quantities (e.g. raindrop size distribution, fall speed, and rainfall intensity, amount, and kinetic energy) that are of importance for a variety of rainfall- and water resources-related applications, including ground validation and soil erosion studies.  This material is based upon work supported by the National Science Foundation under Grants No. AGS-1741250 to the first author (FYT).

How to cite: Testik, F. Y., Saha, R., and Rahman, K.: Rainfall Microphysics and Instrument Measurement Assessments via Rainfall Simulators, EGU General Assembly 2024, Vienna, Austria, 14–19 Apr 2024, EGU24-8198, https://doi.org/10.5194/egusphere-egu24-8198, 2024.

EGU24-8795 | ECS | Posters on site | HS7.10

An empirical approach to separate camera-based elevation change measurements due to sediment yield from other soil erosion masking processes   

Lea Epple, Oliver Grothum, Anne Bienert, and Anette Eltner

Over the past years studies (e.g., Hänsel et al. 2016 or Yang et al. 2021) have shown the feasibility of camera-based soil erosion assessment. This cost-efficient and non-invasive photogrammetric approach is a valuable tool to meassure soil surface changes (Balaguer-Puig et al., 2018). A challenging aspect nevertheless represents the masking of the sediment yield by surface lowering processes such as soil consolidation and compaction (Ehrhardt et al. 2022). Based on the camera elevation changes and measured field observations, we developed an approach to estimate these masking effects in the beginning of rainfall events and approximate a correction function.

We conducted ten rainfall simulations at plots with 3 m length and 1 m width on agricultural slopes. The runoff and sediment concentration were measured at the plots outlet, while a time-lapse camera system surrounding the plot took images every few seconds. We furthermore collected data on soil bulk density, soil moisture, grain size distribution, total organic carbon, slope steepness, surface cover and surface roughness. To describe the changes of the soil surface at the beginning of the rainfall events, dominated by the masking effects, S-shaped curves were fitted via non-linear regression for each rainfall experiment. We then used the variables of those functions as well as the field observations as input values for an adjustment to estimate masking effects at the beginning of rainfall simulations as functions of soil and plot characteristics.

The best results were achieved using four observations: grain size distribution, slope, bulk density and total carbon content. Our approach shows the potential to disentangle soil surface changes due to erosion and non-erosion processes at the onset of rainfall events. While the model worked well for most of the rainfall simulations, predictions were challenging for those events with strongly varying field observations. Especially difficult were those simulations conducted on freshly tilled soils. They showed high elevation changes at the beginning of the event that had great potential for soil consolidation and thus the mixed signals regarding the different processes were not separable by our approach. Nevertheless our study showed potential to increase the informative value of camera-based soil erosion measurements on agricultural fields.


References

Balaguer-Puig, M.; Marqués-Mateu, Á.; Lerma, J.L.; Ibáñez-Asensio, S. Quantifying small-magnitude soil erosion: Geomorphic change detection at plot scale. Land Degrad Dev 2018, 29, 825-834, doi:10.1002/ldr.2826.

Ehrhardt, A.; Deumlich, D.; Gerke, H.H. Soil Surface Micro-Topography by Structure-from-Motion Photogrammetry for Monitoring Density and Erosion Dynamics. Front. Environ. Sci. 2022, 9, doi:10.3389/fenvs.2021.737702.

Hänsel, P.; Schindewolf, M.; Eltner, A.; Kaiser, A.; Schmidt, J. Feasibility of High-Resolution Soil Erosion Measurements by Means of Rainfall Simulations and SfM Photogrammetry. Hydrol 2016, 3, 38, doi:10.3390/hydrology3040038.

Yang, Y.; Shi, Y.; Liang, X.; Huang, T.; Fu, S.; Liu, B. Evaluation of structure from motion (SfM) photogrammetry on the measurement of rill and interrill erosion in a typical loess. Geomorphology 2021, 385, 107734, doi:10.1016/j.geomorph.2021.107734.

How to cite: Epple, L., Grothum, O., Bienert, A., and Eltner, A.: An empirical approach to separate camera-based elevation change measurements due to sediment yield from other soil erosion masking processes  , EGU General Assembly 2024, Vienna, Austria, 14–19 Apr 2024, EGU24-8795, https://doi.org/10.5194/egusphere-egu24-8795, 2024.

EGU24-11487 | ECS | Posters on site | HS7.10

Laboratory calibration of non-catching rain gauges using a precision raindrop generator 

Enrico Chinchella, Arianna Cauteruccio, and Luca G. Lanza

Non-Catching Gauges (NCGs) are instruments used to measure precipitation without the need to collect the equivalent water volume in a reservoir. They sense each hydrometeor individually, often using a contactless approach, providing measurements of the relevant microphysical properties of precipitation. These gauges offer several advantages over traditional catching gauges, making them an invaluable source of data for numerous research applications. However, NCGs, like catching-type gauges, are susceptible to measurement biases from both instrumental and environmental sources. To assess instrumental biases, rigorous testing and calibration are required, which can be more challenging than for catching gauges. In fact, to provide reference precipitation, it is necessary to carefully reproduce hydrometeor characteristics such as particle size, shape, fall velocity, and density. Calibration is therefore typically delegated to manufacturers, who may use undisclosed procedures that cannot be traced to the international standards (see Lanza et al. 2021 for a review).

In this work, we use an existing precision raindrop generator, as detailed in the work of Baire et al. (2022), to verify the performance of optical NCGs that employ two different measuring principles. During laboratory tests, drops ranging from 0.6 to 5 mm in diameter were released from a height of 1.2 m over the instrument sensing area. At least 50 drops were generated for each combination of drop diameter and gauge tested. The generator independently measured the diameter and fall velocity of each released drop using a photogrammetric approach, providing a traceable reference for the calibration. The percentage errors for both the measured drop size and fall velocity were computed by comparing gauge measurements against the reference drop, either drop by drop (when the gauge provides the raw data) or in terms of Particle Size and Velocity Distribution (PSVD) matrix (for all gauges). Additionally, by assuming a literature Drop Size Distribution (DSD) and integrating measured and reference microphysical properties over the range of drop diameters tested, the percentage error for rainfall intensity measurements was also computed. The gauges tested show significant biases in both microphysical and integral properties, with the latter being larger than what is generally expected from traditional catching gauges.

The development of the precision raindrop generator was funded as part of the activities of the EURAMET project 18NRM03 “INCIPIT Calibration and Accuracy of Non-Catching Instruments to measure liquid/solid atmospheric precipitation”. The project INCIPIT has received funding from the EMPIR programme co-financed by the Participating States and from the European Union’s Horizon 2020 research and innovation programme. Laboratory testing of NCGs was carried out in the framework of the Italian national project PRIN2022MYTKP4 “Fostering innovation in precipitation measurements: from drop size to hydrological and climatic scales”.

References:

Lanza L.G. and co-authors, 2021: Calibration of non-catching precipitation measurement instruments: a review. J. Meteorological Applications, 28.3(2021):e2002.

Baire, Q and co-authors, 2022: Calibration uncertainty of non-catching precipitation gauges. Sensors, 22(17), 6413.

How to cite: Chinchella, E., Cauteruccio, A., and Lanza, L. G.: Laboratory calibration of non-catching rain gauges using a precision raindrop generator, EGU General Assembly 2024, Vienna, Austria, 14–19 Apr 2024, EGU24-11487, https://doi.org/10.5194/egusphere-egu24-11487, 2024.

The estimation of sheet flow velocities is crucial to understanding and modelling the dynamics of surface flow processes. When direct flow velocity measurements are not feasible, the use of velocity tracers can be a valuable tool. Recent studies have shown that fluorescent quinine-based tracer can be used to estimate sheet flow surface velocities over various soil and urban surfaces under low luminosity conditions, when exposed to ultraviolet light. In this study, a quinine solution was used to test the applicability of this tracer to estimating the velocity of sheet flow disturbed by rainfall with different intensities. For this purpose, a series of laboratory experiments using a soil flume and a rainfall simulator were conducted to study flows under simulated rainfall. Several hydraulic conditions were explored. The rainfall simulator included a downward-oriented full-cone nozzle from Spraying Systems Co. The nozzle was positioned at an average height of 2.5 m from the geometric centre of the flume’s soil surface, with a spray angle of 90°. The working pressure on the nozzles was kept approximately constant at 50 kPa, producing rainfall at a maximum intensity of 150 mm h-1 just below the nozzle, with average drop sizes of approximately 1.7 mm. Flow velocities were estimated by injecting a quinine solution into the sheet flow. By tracking the leading-edge of the tracer plume and calculating the travel distance of the tracer’s leading edge over a certain time lapse, the surface velocity of the flow was evaluated. The results show that for high rainfall intensities, the disturbance of the water surface by the rainfall drops affected the visibility of the tracer and, thus, the ability to accurately estimate flow velocities using this tracer technique.

How to cite: P. de Lima, I., Zehsaz, S., and L.M.P. de Lima, J.: Testing the use of a fluorescent quinine-based tracer for estimating velocities of sheet flow under simulated rainfall: laboratory experiments, EGU General Assembly 2024, Vienna, Austria, 14–19 Apr 2024, EGU24-13300, https://doi.org/10.5194/egusphere-egu24-13300, 2024.

EGU24-13931 | ECS | Posters on site | HS7.10

Water ponding timing, spatial distribution, and connectivity on soil surfaces measured by time-lapse imagery processed with deep learning 

Pedro Zamboni, Jonas Lenz, Thomas Wöhling, and Anette Eltner

Measuring runoff formation on soil surfaces by rainfall simulators predominantly provide lumped values without spatiotemporal information in regard to water dynamics (e.g., water ponding timing and connectivity).  Understating spatial and temporal variations of water storage on soil surface is key to assess hydrological connectivity and runoff generation. Furthermore, it is very relevant for erosion studies. Computer vision and deep learning has presented state-of-the-art results in environmental sciences, for instance to segment water using cameras as gauges or performing flood mapping with remote sensing images. However, automatic mapping of water forming on soil surfaces due to rainfall is very challenging because the water area is considerably smaller and water ponds present complex shapes and similar color characteristics to the soil itself, which is a challenge for deep learning models. The aim of this study is to assess the potential of computer vision and deep learning to estimate water ponding timing, connectivity and runoff formation behavior during rainfall simulations, with emphasis on data imbalance and label uncertainty.

We conducted rainfall simulations at three different soil erosion plots with different soil and tillage caracteristics. Runoff was measured at the plot outlet. We collected time lapse images from the plot surface. And ground control points for model scaling were measured with a total station. To train the deep learning models, we manually labeled a selected set of images from all the plot images to derive binary masks (i.e., water and background). We trained three different convolution neural networks (CNN) and further considered techniques that take class imbalance and label uncertainty into account. Eventually, we assess the performance of ensemble models. We applied the best model on the whole set of time lapse images and measured the water pixel area and pond connectivity in terms of connected components. 

Our findings suggest that considering class imbalance and label uncertainty is key to reach satisfactory segmentation performance, being more important than the model architecture. Furthermore, ensemble models result in better performance when compared to single models. By comparing the measured discharge and the water area derived from the best deep learning model, we can observe different characteristics of the runoff formation related to distinct ponding and intensity of ponding and connectivity. Our approach presents an innovative visual and automatic observation option to quantify the water pond formation and its spatial temporal development. It is a step towards a better understanding of the runoff generation.

How to cite: Zamboni, P., Lenz, J., Wöhling, T., and Eltner, A.: Water ponding timing, spatial distribution, and connectivity on soil surfaces measured by time-lapse imagery processed with deep learning, EGU General Assembly 2024, Vienna, Austria, 14–19 Apr 2024, EGU24-13931, https://doi.org/10.5194/egusphere-egu24-13931, 2024.

EGU24-16564 | ECS | Posters on site | HS7.10

Comparison of Kinetic Energies of Different Spraying Systems 

Martin Neumann, Steffen Seitz, Josef Krasa, Raquel Falcao, and Tomas Dostal

Rainfall simulators have been used for research of soil erosion by water for many years. Scientific teams around the world own a variety of different devices. In the case of comparing the results of several teams, the problem is the rainfall characteristics of different devices and therefore different input parameters. In this contribution, 3 devices were compared: a small rainfall simulator of the CTU, a small rainfall simulator of Tubingen University, and a laboratory rainfall simulator of the CTU. A laser diffractometer (Thies Clima Laser Precipitation Monitor 5.4110) was used to determine the kinetic energy (KE) and rainfall intensity and splash cups filled with sand (Tubingen Splash Cups, designed by Scholten et al., 2011) were used to compare the methods of the kinetic energy measurement. On each device, measurements were made on a plot with area 1 x 1 metre at nine positions with a rainfall intensity set at 60 mm h-1.

Significant differences among the devices were observed using the laser disdrometer. Small rainfall simulator of Tubingen University achieving a KE of approximately 2.5 J m-2 mm-1, small simulator of the CTU a KE of approximately 5.5 J m-2 mm-1, and the laboratory simulator of the CTU a KE of approximately 8 J m-2 mm-1. The kinetic energies obtained by the splash cups did not reach the values produced by the laser diffractometer. During the experiments, local irregularities in rainfall were observed associated with different types of nozzles and different simulator constructions. The splash cups (46 mm in size) allowed one to measure exact locations proving that locally KE can reach much higher values.

The experiments proved that the differences among different simulator constructions can greatly affect the results of the experiments performed, and the method of assessing the rainfall characteristics can help to understand the real functioning of each device.

This research was supported by the research projects QK22010261, Mobility 8J23DE006, and by the Grant Agency of the CTU in Prague SGS23/155/OHK1/3T/11.

How to cite: Neumann, M., Seitz, S., Krasa, J., Falcao, R., and Dostal, T.: Comparison of Kinetic Energies of Different Spraying Systems, EGU General Assembly 2024, Vienna, Austria, 14–19 Apr 2024, EGU24-16564, https://doi.org/10.5194/egusphere-egu24-16564, 2024.

EGU24-20712 | Posters on site | HS7.10

Using Rainfall Simulators to Assess New Soil Protection Technologies 

Josef Krasa, Tomas Dostal, Martin Neumann, and Martin Mistr

Our aim is to compile a methodology for verifying the soil protection effect of various crop cultivation technologies directly in operating conditions and to design and verify such methods of anti erosion protection together with farmers. The methods should be effective, environmentally friendly, and should not endanger the competitiveness of Czech agriculture. The CTU in Prague, together with the Research Institute for Soil and Water Conservation, has been using a rainfall simulator of 8m plot length (16 m2) for soil loss ratio and C-factor estimation since 2015, putting together a database of several hundreds of representative measurements (Stasek et al., 2023).

To be able to test different technologies directly at fields in different field conditions, the simulator construction was modified to portable construction of 1m2 plot size. During 2023 both simulators were compared in the field, especially in cultivated fallow conditions, but also for initial crop stages. Technically to be able to operate in field and use limited amount of water while reaching high enough kinetic energy and rainfall uniformity, the construction uses overflow box capturing and recycling water that would be sprayed outside of the measured plot (Kavka et al., 2018). One of the advantages of the 8m plot length was that several nozzles with overlapping spraying cones still reach higher kinetic energies than a single-nozzle construction. What we investigated is that rill evolution is visible in 8 m long plot in fallow conditions, while for 1 m plot length, mostly only interril erosion is prevailing.  For 1 mm.minute-1 rainfall intensity both constructions reach similar runoff rates after ca 10 minutes of the simulation when starting with fully saturated conditions (0.9 litre per minute for large simulator, 0.85 litre per minute for small simulator using the same nozzle type). On the other hand, the sediment transport values at smaller plot size reach only 63% on average (0.0110 versus 0.0175 kg.minute-1). As expected, the variability of sediment transport is higher in between replications on the smaller plot size, due to the greater influence of small surface irregularities, or due to the greater influence of preferential pathways in both surface runoff and infiltration. The contribution presents ways of standardising smaller rainfall simulator data using previous datasets obtained by larger-scale simulations.

Data were obtained from the NAZV QK22010261, Mobility 8J23DE006, H2020Tudi No 101000224, and by the CTU Grant Agency in Prague No. SGS23/155/OHK1/3T/11.


How to cite: Krasa, J., Dostal, T., Neumann, M., and Mistr, M.: Using Rainfall Simulators to Assess New Soil Protection Technologies, EGU General Assembly 2024, Vienna, Austria, 14–19 Apr 2024, EGU24-20712, https://doi.org/10.5194/egusphere-egu24-20712, 2024.

HS8.1 – Subsurface hydrology – Transport in the Subsurface

EGU24-2753 | Orals | HS8.1.1

Release and Transport Characteristics of Heavy Metal Pollutants in Tailings Pond 

Jiaxu Jin, Pengfei Wu, Hongzhi Cui, and Xinlei Zhang

The lead-zinc tailings pond contains a significant concentration of heavy metal pollutants, such as lead, zinc, copper, chromium, cadmium, mercury, and arsenic. These pollutants exist in the form of ions within the tailings. External environmental factors can facilitate the release and transportation of these heavy metal elements from the tailings, resulting in pollution. The factors influencing pollutant release and variations in heavy metal tailings transport across different media were investigated by employing statistical analysis, leaching tests, and heavy metal soil column experiments based on the results of a case study on the Qingshan lead-zinc mining area. The multi-component solute release transport model for tailings to examine the interplay between concentration and seepage fields was constructed by considering hydrodynamics, mass transfer, and chemical reactions. The COMSOL software was performed to develop a customized model for the transport of heavy metal pollutants, wherein specific boundary conditions were set to enable quantitative analysis and interpretation of the release and migration of heavy metal solutes in tailings. The present study establishes a foundation for comprehending the migration patterns, pollution pathways, and mechanisms of heavy metal pollutants in tailings ponds. Furthermore, it provides indispensable technical support for addressing heavy metal contamination in lead-zinc mining regions and developing impermeable systems for tailings ponds.

How to cite: Jin, J., Wu, P., Cui, H., and Zhang, X.: Release and Transport Characteristics of Heavy Metal Pollutants in Tailings Pond, EGU General Assembly 2024, Vienna, Austria, 14–19 Apr 2024, EGU24-2753, https://doi.org/10.5194/egusphere-egu24-2753, 2024.

Simulations of two-phase flow in heterogeneous porous media are crucial for several applications, such as CO2 sequestration, efficient oil and gas recovery, and groundwater pollution remediation. Modeling of two-phase flow systems becomes very challenging when capillary heterogeneity and hydraulic discontinuities are considered. Traditional models use numerical techniques such as finite difference, finite element, and finite volume for solving the partial differential equations of the system. Although numerical methods have been shown to produce reliable solutions for complex flow problems, they can become computationally expensive. This emphasizes the high computational demand for solving the inverse problem. The use of DNNs (deep neural networks) has become more common in predicting subsurface flow behavior. DNNs is a data-driven approach that enables the learning of a system by linking input and output parameters and provides fast predictions of dynamic, complex systems. Nevertheless, when data is extremely scarce, particularly in subsurface systems, standard DNNs are unable to yield robust results. Recent advancements enable the integration of physical constraints as partial differential equations (PDEs) into the DNNs scheme. Such a class of deep learning techniques is generally referred to as physics-informed neural networks (PINNs). PINNs are also capable to provide forward solutions for PDEs.  In this work, we examined PINNs' capabilities to provide forward solutions of a 1D steady-state two-phase flow with capillary heterogeneity at the sub-core scale. Here, we trained a PINNs system that incorporates high variability in the hydraulic properties and boundary conditions implemented as input parameters. We compared the PINNs results with numerical solutions to test the efficiency of the developed PINNs system. Results have shown that the trained PINNs system could reproduce both capillary pressure and phase saturation profiles for altering fractional flows, injection rates, hydraulic properties, and domain lengths with high accuracy and within a single training. Training the extended PINNs system was obtained in a few hours, and the post-trained system provided unlimited solutions for variable structures and boundary conditions within a few seconds. 

How to cite: Chakraborty, A. and Moreno, Z.: Simulating two-phase flow using Physics-informed neural networks with capillary heterogeneity and hydraulic discontinuities, EGU General Assembly 2024, Vienna, Austria, 14–19 Apr 2024, EGU24-3458, https://doi.org/10.5194/egusphere-egu24-3458, 2024.

The power mean is the generalization of the common averaging methods, such as harmonic, geometric and arithmetic mean, but also minimum and maximum. However, it also allows an infinite number of other means between these common means and can therefore be adapted very flexibly to the specific task of upscaling. This will be demonstrated in the contribution by calculating the effective thermal conductivity as the mean of the partial conductivities of soil components (typically of the solid, liquid, and gaseous phase). Soil thermal conductivity is a key factor for the soil heat balance and is widely used in many fields of science. However, it is elaborate to measure thermal conductivity of soils that have different porosities and degrees of saturation. Effective thermal conductivity of soil strongly depends on the arrangement of particles (soil structure) and on the interaction of added water to the solid phase (e.g., menisci).  To improve the prediction of soil thermal conductivity, specific information of soil structure needs to be taken into account. The relationship between the power mean exponents p and the degree of saturation is an indicator of the existing soil structure.

How to cite: Stange, C. F.: On the possibilities of the power mean as an upscaling method using the example of thermal conductivity in soil, EGU General Assembly 2024, Vienna, Austria, 14–19 Apr 2024, EGU24-3853, https://doi.org/10.5194/egusphere-egu24-3853, 2024.

EGU24-4162 | Orals | HS8.1.1

Impact of an immobile, mobile and permeable phase on mixing-driven reactions in porous media 

Joaquin Jimenez-Martinez, Xueyi Zhang, Ishaan Markale, Dorothee Kurz, Zhi Dou, Maxence Carrel, Veronica Morales, and Markus Holzner

Understanding chemicals mixing and reactions in porous media is critical for many environmental and industrial applications. In the presence of a non-wetting immiscible phase (e.g., gas) within the pore space, it can remain immobile, giving rise to the so-called unsaturated flow, or it can move, resulting in a multiphase flow. In other cases, the immiscible phase can be permeable, as it occurs with biofilms growing within the pore space. We combine experiments and numerical modeling to assess the impact of saturation (fraction of the pore volume occupied by the wetting phase), multiphase flow (stationary two-phase flow), and the presence of permeable biofilm within the pore space on mixing-driven reactions. The product formation is larger for a given flow rate as saturation decreases, while for a given Peclet, it is the opposite. In multiphase flow conditions, for a given flow rate of the wetting phase, the product formation depends on the flow rate of the non-wetting phase. In the presence of biofilms, the product formation is enhanced compared to their absence and is further enhanced with a heterogeneous permeability within the biofilm.

How to cite: Jimenez-Martinez, J., Zhang, X., Markale, I., Kurz, D., Dou, Z., Carrel, M., Morales, V., and Holzner, M.: Impact of an immobile, mobile and permeable phase on mixing-driven reactions in porous media, EGU General Assembly 2024, Vienna, Austria, 14–19 Apr 2024, EGU24-4162, https://doi.org/10.5194/egusphere-egu24-4162, 2024.

Plutonium (Pu) in the subsurface environment can transport in different oxidation states as an aqueous solute or as colloidal particles. The transport behavior of Pu is affected by the relative abundances of these species and can be difficult to predict when they simultaneously exist. This study investigates the concurrent transport of Pu intrinsic colloids, Pu(IV)(aq) and Pu(V-VI)(aq) through a combination of controlled experiments and semi-analytical dual-porosity transport modeling. Pu transport experiments were conducted in a fractured granite to elucidate sorption processes and their scaling behavior. In the experiments, Pu(IV)(aq) was the least mobile of the Pu species, Pu(V-VI)(aq) had intermediate mobility, and the colloidal Pu, which consisted mainly of precipitated and/or hydrolyzed Pu(IV), was the most mobile. The semi-analytical modeling revealed that the sorption of each Pu species was rate-limited, as the sorption could not be described by assuming local equilibrium in the experiments. The model was able to describe the sorption of the different Pu species that occurring either on fracture surfaces, in the pores of the rock matrix, or simultaneously in both locations. While equally good fits to the data could be achieved using any of these assumptions, a fracture-dominated process was considered to be the most plausible because it provided the most reasonable estimates of sorption rate constants. Importantly, a key result of this work is that the sorption rate constant of all Pu species tends to decrease with increasing time scales, which implies that Pu will tend to be more mobile at longer time scales than observations at shorter time scales suggest. 

How to cite: Zhang, X.: Plutonium reactive transport in fractured granite: Multi-species experiments and simulations, EGU General Assembly 2024, Vienna, Austria, 14–19 Apr 2024, EGU24-4230, https://doi.org/10.5194/egusphere-egu24-4230, 2024.

Contamination with mono-aromatic hydrocarbons, specifically benzene, toluene, and xylenes (BTX), is one of the major concern to groundwater aquifers. BTX have high environmental stability and are harmful to human health and aquifer ecosystem. Thorough assessment and monitoring of the risk posed by BTX in aquifers are essential for the sustainable use of groundwater resources. The biodegradation of BTX in aquifer rely primarily on anaerobic processes. Nitrate-sulfate-reducing assemblages is considered for BTX bioremediation in such anoxic condition. These assemblages act as a terminal electron acceptor for bacterial respiration. The degree of the interaction between combinations of nitrate-sulfate reduction and BTX elimination determines the efficacy of BTX biological degradation. The interactions, however, received limited attention in the existing literature. Hence, the current analysis focuses co-existence of nitrate-sulfate assemblages affecting BTX bioremediation. A multi-component numerical simulation is performed to investigate the potential of nitrate-sulfate-assemblages for bioremediation of BTX in anoxic conditions. A fully implicit finite-difference novel approach is adopted here to solve the proposed numerical model, which is capable of obtaining spatial variation in BTX concentrations. The results suggest that bioremediation is efficient in removing toxic BTX from aquifers under the coexistence of nitrate-sulfate assemblages. This approach, in addition, can be used in deciding the optimum rate of electron acceptor injection and the time required to bring BTX to standard limits. Furthermore, it can help us to plan sustainable bioremediation strategies for mono-aromatic hydrocarbon contaminated aquifers where such reduction assemblages co-exist. This hydrogeobiochemical modelling study also emphasizes the importance of multidisciplinary methods in dealing with challenging environmental issues in the contaminated aquifers.

Keywords: Hydrogeobiochemical modelling; Bioremediation; BTX; Nitrate-sulfate assemblages; Aquifers.

How to cite: Srivastava, A., Valsala, R., and Jagadevan, S.: Hydrogeobiochemical Modelling for Bioremediation of Mono-Aromatic Hydrocarbons Using Nitrate-Sulfate-Reducing Assemblages in Aquifers, EGU General Assembly 2024, Vienna, Austria, 14–19 Apr 2024, EGU24-4243, https://doi.org/10.5194/egusphere-egu24-4243, 2024.

EGU24-4880 | ECS | Orals | HS8.1.1

Experimental Investigation on Dispersion Within Porous Media Influenced by Particle sizes and Pore-Scale Heterogeneity 

Jiyoung Baek, Byeong-Hak Park, Gabriel Rau, and Kang-Kun Lee

As heat tracing gains versatility in hydrogeological applications, precise thermal dispersion modeling becomes essential. However, limited experimental data for thermal dispersion, influenced by several factors such as particle size or shape, poses a challenge to the understanding of the relationship between flow velocity and thermal dispersion coefficient. To fill these gaps, the solute and heat tracer experiments were conducted using two different sizes of sand. Thermal and solute dispersion were analyzed by applying analytical models. We also systematically collected and revisited literature data to comprehensively interpret the influences of particle size, shape, and pore-scale heterogeneity on dispersion. The results exhibited that the solute and thermal dispersivity were comparable when the dispersion linearly increased to the velocity. However, within the transition regime (Pe < 5), a departure from linearity was observed (R2 < 0.9). The deviation was more pronounced in smaller particle size due to pore-scale heterogeneity arising from the complexity of pore network. Consequently, our findings emphasize the potential necessity for caution when modeling thermal dispersion based on solute dispersion within natural porous materials.

Keywords: Particle size; Thermal dispersion; Pore-scale heterogeneity; Transition regime; Sandbox experiment


Acknowledgements

This work was supported by the National Research Foundation of Korea (NRF) grant funded by the Korea government (MSIP) (No. 2022R1A2C1006696). This work was also supported by the National Research Foundation of Korea (NRF) grant funded by the Korea government(MSIT) (No. 2022R1A5A1085103). This work was also supported by the Nuclear Research and Development Program of the National Research Foundation of Korea (NRF-2021M2E1A1085200).


How to cite: Baek, J., Park, B.-H., Rau, G., and Lee, K.-K.: Experimental Investigation on Dispersion Within Porous Media Influenced by Particle sizes and Pore-Scale Heterogeneity, EGU General Assembly 2024, Vienna, Austria, 14–19 Apr 2024, EGU24-4880, https://doi.org/10.5194/egusphere-egu24-4880, 2024.

This study experimentally demonstrates the impact of water and solute influx magnitude, and its resulting local distribution, on transport at timescales longer than the influx duration, through a disparate velocity field of a partially saturated domain. In a sand-filled cell, steady-state flow is maintained with a constant horizontal hydraulic head, while the upper part of the cell is partially saturated. The horizontal velocity varies by orders of magnitude from the surface to the saturated zone. An influx of water with a dissolved tracer is applied at the middle of the upper boundary surface, over several minutes, forming a plume that reaches a depth of a few centimeters. This influx disturbs the flow field locally, but after it is terminated, the return to steady-state flow is of the order of magnitude of the influx timescale. Eventually, the solute flows to the saturated zone and out of the cell through a path on the scale of decimeters, over a time scale of days. Employing ICP-MS as a sensitive measurement tool to detect highly diluted concentrations of solute enables tracking of a small influx volume that does not significantly perturb the flow field. This maintains a separation between the distinct spatial-temporal scales of the short-term local infiltration and the long-term system-scale transport. Applying varying influx magnitudes sets the solute plume across different velocity profiles and thus dictates the downstream plume distribution. A low influx relative to the hydraulic conductivity of the partially saturated sand allows solutes to infiltrate farther down compared to a higher influx, so that the plume reaches higher flow velocities but also spans a wider velocity variability. A higher influx relative to the hydraulic conductivity leads to a local increase in saturation, but a shallower depth of infiltration compared to the lower influx, and the system accordingly exhibits a more uniform plume located at a lower velocity region. In downstream solute concentration measurements, these influx variations result in a faster but more smeared breakthrough for the lower influx compared to a slower and more uniform breakthrough for the higher influx, corresponding to their initial distribution after infiltration.

How to cite: Kalisman, D., Dror, I., and Berkowitz, B.: From infiltration to steady-state flow in partially saturated media – bridging solute transport between millimeter-decimeter and minute-day scales, EGU General Assembly 2024, Vienna, Austria, 14–19 Apr 2024, EGU24-5615, https://doi.org/10.5194/egusphere-egu24-5615, 2024.

EGU24-5866 | ECS | Posters on site | HS8.1.1

The Effect of Time-Varying Soil Properties Caused by Ploughing and Consolidation on Pesticide Fate in Soil and Groundwater 

Pavan Cornelissen, Louise Wipfler, Maarten Braakhekke, and Marius Heinen

Soil properties such as the dry bulk density and soil hydraulic parameters can significantly affect the environmental fate of pesticides. These properties are often assumed to remain constant in time in numerical models. In reality, however, these properties change over time due ploughing and consolidation. In this study, we modeled the time-varying soil properties induced by ploughing and consolidation and assessed its effect on pesticide accumulation in the topsoil and leaching to the groundwater. For this purpose, time-dependent soil properties have been implemented in the hydrological model SWAP and the pesticide fate model PEARL. Ploughing instantaneously decreases the bulk density, after which it gradually increases again to its original value due to consolidation caused by rainfall. The time-dependent soil properties are modelled based on empirical relationships between the dry bulk density and the Mualem-Van Genuchten parameters found in the literature.

Ploughing leads to a short-term deviation of the soil water content and concentration compared to the reference case (i.e., the case with constant soil properties). We included mixing of pesticide over the ploughing layer due to ploughing in both cases. However, under Central European climate conditions, the effect of ploughing vanishes within several months in the entire soil profile. For assessing the impact on the leaching of pesticide to groundwater, we evaluated the pesticide concentration in pore water at 1 meter depth. The effect of time-varying soil properties due to ploughing and consolidation on the leaching concentration was found to be small for both a tracer and an adsorbing solute. Even for an extreme case with three ploughing events per year, the effect on the 90th-percentile of daily leaching concentration was smaller than 0.3%. For assessing the impact on the exposure of soil organisms to pesticides, we considered the pesticide concentration in pore water averaged over the upper 20 centimeters of the soil. For the tracer, ploughing resulted in a 1.2% decrease of the 90th-percentile of daily topsoil concentration data for the extreme case of three ploughing events per year. Interpretation of the results for adsorbing solutes in the topsoil is hampered by the fact that soil mass is not conserved in the current approach. More advanced models must be developed that allow for conservation of soil mass for assessing the impact of time-dependent soil properties on concentrations in the topsoil.

How to cite: Cornelissen, P., Wipfler, L., Braakhekke, M., and Heinen, M.: The Effect of Time-Varying Soil Properties Caused by Ploughing and Consolidation on Pesticide Fate in Soil and Groundwater, EGU General Assembly 2024, Vienna, Austria, 14–19 Apr 2024, EGU24-5866, https://doi.org/10.5194/egusphere-egu24-5866, 2024.

EGU24-7503 | Orals | HS8.1.1

Dynamics of aeration zone mobile inventory preshape groundwater quality evolution - results from multi-year sampling of regolith seepage  

Katharina Lehmann, Dinusha Eshvara Arachchige, Robert Lehmann, and Kai Uwe Totsche

The aeration zone (AZ) below the soils sensu stricto is still neglected compartment regarding its structure, diversity of life and habitats, and role for the provision of ecosystem services. Especially in thick AZ of topographic recharge areas, fluid flow dynamics and the exchange of the total mobile inventory (Lehmann et al. 2021) and their roles for the quality-evolution of groundwater are largely unknown. In the low-mountain topographic recharge area of the Hainich Critical Zone Exploratory (central Germany), we study spatiotemporal dynamics of the fluid fluxes and mobile inventory within the shallow (upper) AZ (regolith) and compare their signature with soil seepage and perched groundwater (deeper AZ). Percolates from 20 drainage collectors (DC) covering a diversity of Triassic mixed carbonate-siliciclastic (sedimentary) bedrock, soil types, and installation depths were sampled for more than 3 years on regular (monthly) and event-based basis and analyzed by various physico-/hydrochemical and spectro-microscopic techniques.

On average, the DC captured ~13% of the percolate from the forest topsoil seepage and 2.4% of precipitation. Seepage volume was mainly influenced by the factors soil thickness and sampling month, followed by scarp slope gradient and seasonal differences. In the upper AZ, the mobile inventory exhibited strong seasonality (e.g. EC, pH, nitrate, sulphate, K, Si, Mn, Al, Fe, particle concentration) and were more dependend on seasonal weather conditions and single (extreme) events (e.g., snow melt, rain events) than on lithology, followed by site-specific structural factors (location, slope), or pedological settings (e.g. overburden soil type, soil thickness). Generally, our results show fluid-rock interactions within the upper AZ with a more similar hydrochemical water signature to perched groundwater. Contrastingly, particulate mobile inventory showed a strong connection to soil seepage signature, comprising a diverse spectrum of mineral particles (mainly clay minerals) and mineral- and mineral-organic associations up to 160 µm, including aggregates and microorganisms. The different flow regimes that prevail during different seasons and weather conditions mainly influenced the amount and spectrum of percolate mobile inventory. During summer, dry periods in conjunction with extreme precipitation events favored translocation of small-sized particles. In winter, fast-flow regimes during normal precipitation as well as during snowmelts contributed strongly to the translocation of organic/inorganic carbon and mineral particle through the AZ and to groundwater. We conclude that the AZ is a complex biogeochemical reactor, that severely alters the percolate composition and properties, already preshaping the biogeochemical groundwater quality as well as due to its functions and services (e.g. water-purification and storage). As such, the aeration zone hast to be considered as a crucial compartment for groundwater quality evolution, especially in topographic recharge areas.


Lehmann, K., Lehmann, R., Totsche, K. U. (2021) Event-driven dynamics of the total mobile inventory in undisturbed soil account for significant fluxes of particulate organic carbon. Sci. Total Environ. 756, 143774, doi: https://doi.org/10.1016/j.scitotenv.2020.143774

How to cite: Lehmann, K., Eshvara Arachchige, D., Lehmann, R., and Totsche, K. U.: Dynamics of aeration zone mobile inventory preshape groundwater quality evolution - results from multi-year sampling of regolith seepage , EGU General Assembly 2024, Vienna, Austria, 14–19 Apr 2024, EGU24-7503, https://doi.org/10.5194/egusphere-egu24-7503, 2024.

Two-phase flow in geological fractures holds significant relevance in various applications, including subsurface fluid storage and oil and gas exploitation. The pore-scale modelling of such flows is a challenging task influenced by many factors, such as the complex interplay between the viscous, capillary, gravitational and inertial forces, intricate geometries, as well as molecular scale phenomena such as moving contact lines and thin wetting films. Although various modelling approaches have been used to tackle these challenges, the high computational demands required to accurately capture the three-dimensional fluid-fluid interfacial dynamics often render these models impractical for real-world applications. Consequently, from a practical point of view, the simplification of these 3D models may become imperative to facilitate efficient and reasonably accurate predictions of flow quantities.

Depth-integrated two-dimensional modelling is one such approach which enables saving computational time and effort at the expense of not resolving the third dimension. Here, the governing equations are solved in two dimensions, the influence of the third dimension being incorporated through appropriate additional terms. While such models have been used previously, they have so far been restricted to either permanent single-phase flow in rough fractures or two-phase flow in 2D porous media of homogeneous depth. In a rough fracture, the fluid-fluid interface possesses not only an in-plane curvature but also an out-of-plane curvature, which must be accommodated in the 2D depth-integrated model. Therefore, to address the immiscible flows in rough fractures it is essential to reformulate the 2-D depth-integrated approach from the first principles.

To perform the depth integration, we proceed from the traditional direct numerical simulation (DNS) approach, where the Navier-Stokes equations, coupled with an interface capturing technique, which in our case is the Volume of Fluid (VOF), are solved numerically. We integrate the governing flow equations in the vertical direction while expressing the flow fields in terms of 2D depth-averaged flow quantities. To account for the out-of-plane curvature and the wall shear stress arising from the no-slip conditions on the fracture walls, we assume locally a plane Poiseuille configuration (Hele-Shaw). 

The derived 2D depth-integrated model is implemented in the open-source CFD code OpenFOAM. We validate our model using the Saffman-Taylor instability case, comparing predictions with experiments and full 3D model results. We then extend our study to two numerically generated rough fractures with (a) smoothly and periodically varying aperture and (b) a more realistic aperture field with a larger roughness. We investigate drainage (i.e., the displacement of the wetting fluid by the non-wetting fluid) over a range of Capillary numbers spanning more than three orders of magnitude. We compare our 2D model predictions of both, pore-scale and macroscopic flow variables, with those obtained using 3D simulations. Our 2D model accurately estimates key statistical indicators with a tenfold reduction in computation time, offering an excellent compromise between solution accuracy and computational efficiency. We also discuss the limitations of the depth-averaged model depending on flow ranges.

How to cite: Krishna, R., Meheust, Y., and Neuweiler, I.: Depth-integrated Two-dimensional Model for Immiscible Two-phase Flow in Open Rough-walled Fractures with Smoothly Varying Aperture, EGU General Assembly 2024, Vienna, Austria, 14–19 Apr 2024, EGU24-7889, https://doi.org/10.5194/egusphere-egu24-7889, 2024.

Evaporation of soil water depends not only on climatic conditions, soil texture, and soil hydraulic properties but also on the soils’ macro-structure. Often, evaporation is characterised by water losses over time for a defined soil volume where soils are assumed to be homogeneous in texture and structure. In this study, we investigated the potential and limitations of 3D modelling of evaporation processes on soil cores with structural features ≥ 480 µm determined by X-ray computed tomography (X-ray µCT). The method was tested for two contrasting soil structures (ploughed vs. non-ploughed grassland) which experienced structural changes due 19 cycles of freezing and thawing. For all real soil samples, we simulated three different conditions of atmospheric demand with Hydrus 3D. It was hypothesised that the different distribution of air-filled macro-pores, the macro-connectivity of soil matrix and the surface area will affect bare soil evaporation and more specific the transition from stage 1 to stage 2 evaporation. To evaluate the effect of soil macro-structure on the column scale, we investigated the spatial distribution of water content and water fluxes. The combination of X-ray µCT and HYDRUS 3D was able to capture the effect of ploughing and freezing-thawing on soil macro-structure and to quantify the effect on the water dynamics inside the samples for various atmospheric demands and thus the feedback with evaporation.

How to cite: Leuther, F. and Diamantopoulos, E.: The effect of soil macro-structure on bare soil evaporation – using HYDRUS 3D simulation on X-ray µCT determined soil structures, EGU General Assembly 2024, Vienna, Austria, 14–19 Apr 2024, EGU24-8091, https://doi.org/10.5194/egusphere-egu24-8091, 2024.

EGU24-8793 | Posters on site | HS8.1.1

Advancing Irrigation Strategies: Synergistic Modeling of Soil Moisture Using Cosmic-Ray Neutron Sensing, Hydrus-1D, and Machine Learning 

Salvatore Straface, Guglielmo Federico Antonio Brunetti, and Andrea Scozzari

Innovative monitoring techniques today facilitate advanced and reliable measurements in the vadose zone. This, coupled with the predictive capabilities of machine learning, has an ever-growing impact on the management of agricultural and irrigation practices. The vadose zone, particularly the root zone, plays a pivotal role in hydrological processes by regulating water and energy fluxes across the soil surface. Additionally, it influences nutrient transport, groundwater recharge, groundwater pollution, microbial activity, and plant physiology, as it links the atmosphere, soil, and groundwater. Among various monitoring techniques, Cosmic-Ray Neutron Sensing (CRNS) stands out as a ground-based remote sensing technique capable of measuring soil moisture within the root zone at relevant scales (up to 240 m) with a high level of reliability. It is based on nuclear interactions between incoming cosmic rays and elements in the Earth’s atmosphere, such as hydrogen. By employing the Hydrus-1D Cosmic module, effective soil moisture values can be derived based on the neutron intensity detected by Cosmic-Ray Neutron Probes (CRNPs). On the other hand, machine learning methods and neural networks (NN) hold enormous potential despite inherent limitations, notably the requirement for extensive datasets and their lack of a physical foundation in reproducing soil processes. In this study, we propose a synergistic approach to overcome these limitations. The physically-based Hydrus-1D model was utilized to train a single-layer NN for the direct prediction of soil moisture and irrigation water demand, relying exclusively on atmospheric forcings (temperature and precipitation) as input. In a proof-of-concept aimed at assessing the validity and robustness of our approach, a time series of synthetic data replicating soil characteristics, atmospheric forcings, and field measurements conducted through CRNPs was generated. These data were employed in the Hydrus-1D Cosmic module to calibrate a physically-based model, facilitating the generation of a continuous and extensive spatiotemporal soil moisture output dataset for the simulated synthetic field. The single-layer NN, trained with this synthetic soil moisture and atmospheric forcing data, demonstrated the potential to accurately predict soil moisture and irrigation needs of the terrain straightforwardly, using only atmospheric variables as input. The proposed synergistic approach has exhibited significant potential, and future developments in this research will involve the incorporation of real data.

How to cite: Straface, S., Brunetti, G. F. A., and Scozzari, A.: Advancing Irrigation Strategies: Synergistic Modeling of Soil Moisture Using Cosmic-Ray Neutron Sensing, Hydrus-1D, and Machine Learning, EGU General Assembly 2024, Vienna, Austria, 14–19 Apr 2024, EGU24-8793, https://doi.org/10.5194/egusphere-egu24-8793, 2024.

EGU24-9159 | ECS | Orals | HS8.1.1

Assessing glyphosate movement through different agricultural systems with a shallow water table: insights from an inverse dual permeability model 

Giovanna Piazzon, Matteo Longo, Sebastiano Rocco, Francesco Morari, and Nicola Dal Ferro

The movement dynamics of glyphosate (GLY) in soil can be highly complex and challenging to predict, because its high water solubility and strong propensity to soil particle adsorption can interact with agricultural management practices, e.g. tillage operations and water table management. This can make GLY i) sensitive to nonuniform leaching via preferential flow paths into the groundwater before it can degrade, ii) difficult to model according to uniform flows. The aim of this study was to understand GLY dynamics in different agricultural systems of the low-lying Venetian plain, by calibrating a dual permeability model embedded in HYDRUS-1D using a series of GLY experimental data that were collected in the field, and compare it with a dual porosity mobile-immobile approach. Experimental data came from eight drainable lysimeters, where two shallow water table depths (60 cm and 120 cm deep) were compared in conventional (CV) and conservation agriculture (CA) systems as representative of the low-lying Venetian plain conditions (NE Italy). On May 2019, GLY and a tracer (KBr) were applied on bare soil (in CV) and rye that was used as a cover crop, in CA. After the distribution, soil (0-5, 5-15 cm deep) and soil-pore water (15, 30, 60 cm deep) samples were collected for 48 days to follow solutes dynamics. At the same depths, soil moisture and matric potential were monitored using TDR probes and electronic tensiometers. An automated system modulated the suction through matric potential readings combined with an electronic vacuum regulator. The HYDRUS 1-D software package was employed for inverse modelling of soil properties, first through parameterization and matric potential results, while solute movement parameters were calibrated based on GLY and KBr results from soil and water samples. Experimental results showed that GLY was found at different depths, especially soon after its distribution as dependent on intense rainfall events. The MIM model failed to predict any GLY movement, due to its high adsorption coefficient that hindered any GLY exchange between the immobile and mobile phases. In fact, experimental observations revealed that a preferential flow occurred down to the deepest layers (60 cm deep), even in the presence of poorly structured soil and irrespective of both the groundwater level and the cultivation system. In contrast, the dual permeability model provided a more accurate description of GLY dynamics in soil, successfully predicting the observed bypass flow timing experiment. Therefore, dual permeability model seems crucial for describing GLY dynamics in agroecosystems, enabling more accurate predictions of its potential pathways. 

How to cite: Piazzon, G., Longo, M., Rocco, S., Morari, F., and Dal Ferro, N.: Assessing glyphosate movement through different agricultural systems with a shallow water table: insights from an inverse dual permeability model, EGU General Assembly 2024, Vienna, Austria, 14–19 Apr 2024, EGU24-9159, https://doi.org/10.5194/egusphere-egu24-9159, 2024.

EGU24-9503 | ECS | Orals | HS8.1.1

Reservoir characterization by push-pull tests employing Kinetic Interface Sensitive tracers 

Huhao Gao, Alexandru Tatomir, Hiwa Abdullah, and Martin Sauter

The kinetic interface-sensitive (KIS) tracer test is a newly developed tracer approach to measure the fluid-fluid interfacial area (IFA) during dynamic two-phase flow in porous media. This new tracer approach can be applied for multiple geological applications, where dynamic two-phase flow is involved, e.g. monitoring the plume during geological storage of carbon dioxide. The obtained concentration breakthrough curves by measuring reacted tracer concentration in water samples are interpreted with a specialized Darcy-scale numerical model to determine the IFA. The previous design of the drainage experiments has one major limitation that the volume of the usable water sample after breakthrough for the measurement is often insufficient. An alternative is to employ KIS tracers in a “push-pull” experimental set-up, i.e. primary drainage is followed by a consequent main imbibition process, with the flow direction being reversed. This study applies both the pore-scale numerical simulation and the core-scale column experiments to study the KIS tracer reactive transport during push-pull processes. The pore-scale numerical simulation is done with a phase-field method-based continuous species transport model. The reactive transport of the tracer and the characteristics of the concentration breakthrough curves are analyzed. The Darcy-scale reactive transport model is validated by comparing it to the pore-scale results. Finally, the new method is applied in the column experiment, where the determined specific interfacial area is found to be close to the literature data.

How to cite: Gao, H., Tatomir, A., Abdullah, H., and Sauter, M.: Reservoir characterization by push-pull tests employing Kinetic Interface Sensitive tracers, EGU General Assembly 2024, Vienna, Austria, 14–19 Apr 2024, EGU24-9503, https://doi.org/10.5194/egusphere-egu24-9503, 2024.

Soils are complex systems where different physical, chemical and biological processes occurring simultaneously and interact in a non-linear way. This includes the diffusion process, which is known to be affected by the tortuosity, and therefore the water content. Additionally, the high degree of soil heterogeneity poses significant challenges in studying soil reactivity due to its high impact on mixing. In this study we evaluate the effect of a series of what we could be key controlling factors of effective reaction rates in soils at the plot scale: the degree of heterogeneity, the hydraulic structure, the reaction rate, the initial distribution of reactants, and the heterogeneity in the diffusion coefficient.

We tackle this by explicitly simulating hypothetical biomolecular soil reaction (A+B C) for different degrees of heterogeneity, different hydraulic structures, different reaction rates, different initial distribution of the reactants and different representation of diffusion. Results are evaluated in terms of effective reaction rates at the plot scale.

The simulation results reveal that mixing conditions control reactions in unsaturated soils. Non-ideal reactivity due to mixing-limited conditions is not only a consequence of the simple presence of heterogeneity or even of its intensity. Instead, it results from (at least): the characteristics of heterogeneity, the Pe number, the Da number, the spatial distribution of the reactants. Interestingly, the spatial variability of the (tortuosity-dependent) diffusion coefficient appears to also have a significant effect on mixing conditions.  

By these results, we illustrate the high complexity of reactive systems in unsaturated soils, which makes the use of average macroscopic reaction rates (as in most agriculture, environmental and geoengineering models) at least questionable.

How to cite: Henri, C. and Diamantopoulos, E.: What control reactions in unsaturated soils? On the dynamic effect of small-scale heterogeneity and (spatially variable) diffusion, EGU General Assembly 2024, Vienna, Austria, 14–19 Apr 2024, EGU24-9957, https://doi.org/10.5194/egusphere-egu24-9957, 2024.

EGU24-10423 | ECS | Posters on site | HS8.1.1

Disentangling nitrogen turnover in Nature Based Solutions: hydrodynamic properties and reactive behavior  

Ludovica Presta, Giuseppe Brunetti, Christine Stumpp, Michele Turco, and Patrizia Piro

Nature Based Solutions (NBS) are known to play a key role in urban water management by increasing the infiltration, retention, and evapotranspiration capacity of urban areas. However, their potential use for contaminant removal has only been partially investigated. To address this issue, this study presents an experimental analysis of the nitrogen turnover in selected typical NBS substrates. Soil column experiments were combined with laboratory methods to characterize the hydrodynamic properties of porous media and elucidate the nitrification process in NBSs. In a first experimental campaign, saturated soil columns were injected with a natural tracer (deuterium) to characterize non-reactive solute transport in different substrates. Breakthrough curves exhibit significant tailing, thus suggesting the existence of a complex interplay between a mobile and an immobile domain. A second experimental campaign was carried out in larger unsaturated soil columns periodically injected with wastewater. Nitrogen species were measured in the effluent to describe the nitrogen turnover in soils. Results are characterized by two distinct phases, in which nitrate is initially not detectable in the outflow but later becomes the dominant species. This behavior indicates the existence of an initial microbial adaptation phase, followed by an efficient nitrification process supported by the oxic conditions in the substrate. Altogether, observations highlight the complex hydraulic and reactive behavior of NBSs substrates, which should be properly combined with modeling to better understand and design NBS systems for pollutant treatment.

How to cite: Presta, L., Brunetti, G., Stumpp, C., Turco, M., and Piro, P.: Disentangling nitrogen turnover in Nature Based Solutions: hydrodynamic properties and reactive behavior , EGU General Assembly 2024, Vienna, Austria, 14–19 Apr 2024, EGU24-10423, https://doi.org/10.5194/egusphere-egu24-10423, 2024.

EGU24-12231 | ECS | Posters on site | HS8.1.1

An Experimental Technique for Measuring Spatiotemporal pH and Carbon Concentration During Density-Driven Convection of CO2 in Water 

Yao Xu, Marcel Moura, Hilmar Yngvi Birgisson, and Knut Jørgen Måløy

Density-driven convection of CO2 in water will trigger the spatiotemporal evolution of pH and carbon concentration, impacting the understanding of CO2 dissolution and implementations of geological carbon sequestration. Building upon the conventional methodology which applies a single pH indicator and Schlieren imaging analysis, the enhanced experimental technique, offering a holistic view of CO2 convection within water, resulted in an accurate and visual representation of the CO2 plume propagation and a wider range of pH alteration and carbon concentration during CO2-water interactions. In response to the broad pH variations with continuous CO2 dissolution, this study utilized three pH indicators combined with the novel image analysis method to correlate the solutions’ colors to their pH. Afterwards, the carbon concentration is derived from the pH values by employing the pseudo-equilibrium theories. Leveraging an experimental technique and analytical tools to measure the spatiotemporal pH and carbon concentration, the research aims to deepen the understanding of CO2 convection behaviors, paving the way for enhanced insights into carbon sequestration and related environmental processes.

Keywords: Carbon sequestration, CO2 convection, density-driven, pH, carbon concentration

How to cite: Xu, Y., Moura, M., Birgisson, H. Y., and Måløy, K. J.: An Experimental Technique for Measuring Spatiotemporal pH and Carbon Concentration During Density-Driven Convection of CO2 in Water, EGU General Assembly 2024, Vienna, Austria, 14–19 Apr 2024, EGU24-12231, https://doi.org/10.5194/egusphere-egu24-12231, 2024.

Water flow in the vadose zone is strongly non-linear due to the feedback of water flow, saturation, and the associated hydraulic conductivity. Therefore, the simulation of unsaturated flow at the continuum scale is notoriously complicated. Yet, not only the solution of the non-linear partial differential equation itself is difficult, also the appropriate parameterization of the unsaturated hydraulic conductivity function poses a challenge. Frequently, hydraulic conductivity is estimated from the water retention curve using capillary bundle models such as the well-established Mualem model or from pedotransfer functions that hardly include information on the actual pore space morphology. Here, a novel approach is presented to estimate the full unsaturated hydraulic conductivity function from a morphological analysis of Xray-CT images in the following way. First, the local pore space morphology is evaluated to obtain pore radius, Euclidean distances to the pore wall, and connectivity measures. Then, a local hydraulic conductivity and capillary forces are calculated for individual voxels of the images. This already permits to estimate the water retention curve and the water distribution inside the pore space at different levels of saturation. These configurations are then used to calculate an associated continuum scale hydraulic conductivity from dry to fully saturated conditions. This approach can be implemented in image analysis software, e.g. ImageJ, in a straight-forward way and may provide much better and specific estimates of the unsaturated hydraulic conductivity that sensitively affects the simulation of fluid flow in soils and the vadose zone provided satisfactory pore space acquisition with Xray-CT is possible.

How to cite: Ritschel, T.: Estimation of unsaturated hydraulic conductivity from morphological analysis of Xray-CT images, EGU General Assembly 2024, Vienna, Austria, 14–19 Apr 2024, EGU24-14615, https://doi.org/10.5194/egusphere-egu24-14615, 2024.

EGU24-14907 | ECS | Orals | HS8.1.1

Mixing-induced reactive transport experiments in heterogeneous and variably saturated porous media 

Oshri Borgman, Francesco Gomez, Tanguy Le Borgne, and Yves Méheust

Mixing-induced reactions are an essential feature of environmental flow and transport processes. They control many reactive transport processes, including mineral precipitation rates and contaminant remediation processes. Natural porous media are characterized by a strong structural heterogeneity, which impacts solute mixing and, therefore, the resulting chemical reaction rates. Establishing a quantitative link between pore-scale heterogeneity and mixing/reaction rates in saturated and unsaturated conditions remains an open question. Here, we study pore-scale solute mixing using high-resolution experimental measurements to quantify the overall reaction rates and product concentrations. Our goals are to study the impact of structural heterogeneity on 1) reaction rates and products during saturated flow and 2) the spatial arrangement of fluid phases during unsaturated flow and its impact on reaction rates and products.

We use two-dimensional porous media consisting of circular posts in a Hele-Shaw-type flow cell. We control heterogeneity by varying the posts’ diameters disorder and correlation length; increasing this length introduces more structure in the porous medium. We utilize an irreversible oxidation reaction to produce fluorescein from its non-fluorescent form. The Damköhler number is sufficiently larger than unity, so the reaction rate is mixing-controlled. We inject a non-fluorescent tracer pulse into the porous medium sample filled with the oxidating reactant under saturated and unsaturated flow conditions. We analyze periodic fluorescence intensity images to track the evolving solute concentration field. The reaction rates and the total reaction product mass are calculated directly from the concentration images.

Solute concentration images show that increasing the spatial correlation length under saturated flow conditions leads to enhanced reaction front stretching and elongation as the solute travels along preferential pathways. Due to this overall stretching, the reaction front is locally more compressed perpendicular to the elongation direction. In a non-correlated, randomly disordered porous medium, overall stretching is reduced, and the front is less compressed locally. Under unsaturated flow conditions, a main preferential flow path characterizes the correlated porous medium. In contrast, the non-correlated medium is characterized by a higher degree of branching and splitting in the velocity field. Solute pulse focusing in the correlated porous medium sample reduces reaction front stretching compared to the non-correlated porous medium, under unsaturated conditions. Under these conditions, the reaction rate increases more than the saturated case due to the unsaturated flow pattern's enhanced reaction front stretching. This effect is more pronounced for the non-correlated sample, where flow path splitting and reaction front stretching are more significant. This work shows that structural heterogeneity has a considerable effect on reactive solute transport and that this effect depends on the system’s saturation.

How to cite: Borgman, O., Gomez, F., Le Borgne, T., and Méheust, Y.: Mixing-induced reactive transport experiments in heterogeneous and variably saturated porous media, EGU General Assembly 2024, Vienna, Austria, 14–19 Apr 2024, EGU24-14907, https://doi.org/10.5194/egusphere-egu24-14907, 2024.

EGU24-15195 | ECS | Posters on site | HS8.1.1

Effect of water content on transport of water tracer and strontium in compacted clay-rich soil column 

Jean Maillet, Emilie Thory, Christelle Latrille, and Sébastien Savoye

Mechanisms involved in the radionuclide mobility in water-saturated environments have been extensively studied in order to predict their migration. However, in natural environments, a partially water-saturated zone occurs between the soil surface and the water table. It is well known that a decrease in water content reduces the porosity available for flow. Various studies have reported a increase or reduction of the contaminants residence time in porous media, explained by the flow paths complexity increase, a preferential path by the macroporosity and a reduced accessibility to reactive sites [1]. This study aims to understand the influence of water content on transport parameters such as dispersivity, porosity and chemical reactivity. This study investigates the effect of water content by comparing column transport experiments performed with inert (enriched-HDO water) and reactive (strontium) tracers on water-saturated and partially saturated soil.

Transport experiments were carried out on columns filled with the 300-400 µm fraction extracted by dry sieving from a sedimentary alluvium. This material was then compacted inside a glass column to reach the same density as that measured in the field (1.47 g.cm-3). Transport experiments were performed under water saturated and partially saturated conditions corresponding to 0.43 to 0.19 water content, with a CaCl2 solution equilibrated with calcite at pCO2 atm. At steady flow, tracers were introduced into the system by an injecting loop, passed through the material and was collected in sequenced fractions. Sensors placed at both inlet and outlet of the column [2] allowed pH and electrical conductivity to be continuously controlled. HDO and Sr were measured with a deuterium analyser and an ICP MS respectively. HDO and Sr breakthrough curves were interpreted with HYDRUS-1D coupled with PhreeqC softwares. A multi-site ion exchange model was implemented in PhreeqC [2]. Flowrate and porosity were experimentally measured while dispersivity was determined by inverse modelling. To compare the different experiments, results were expressed in dimensionless units: relative concentration (C/C0) and pore volume passed through the column normalized to the column pore volume (V/Vpore).

Based on experiments carried out in water-saturated media with HDO, the dispersivity in the material was estimated at 0.1 cm-1. The Sr residence time was tenfold more than HDO (from 2.5 to 30 V/Vpore), which confirms that chemical retention drives the cation migration into porous media. Three HDO experiments carried out at various water contents (0.24 to 0.19 cm.cm-1) revealed a regular dispersivity increase with decreasing water content from 0.1 to 0.2 cm-1. For Sr experiments, decreasing water content led to the increase of the breakthrough curve intensities and a tailing effect, meaning that Sr would be less retained and more spread with reduced water content.

These results show that reducing the water content in porous media leads to reduce the porosity accessibility to flow and to increase the dispersivity. This suggests that the water content decrease constrains the water flow path, this is intensified with the desaturation. The Sr transport behaviour change with desaturation may be explained by the reduction in the accessibility to the sorption sites.


How to cite: Maillet, J., Thory, E., Latrille, C., and Savoye, S.: Effect of water content on transport of water tracer and strontium in compacted clay-rich soil column, EGU General Assembly 2024, Vienna, Austria, 14–19 Apr 2024, EGU24-15195, https://doi.org/10.5194/egusphere-egu24-15195, 2024.

EGU24-18085 | ECS | Orals | HS8.1.1

Impact of helicity on mixing in heterogeneous porous media 

Konstantinos Feroukas, Marco Dentz, Juan Hidalgo, and Daniel Lester

Mixing is the process that homogenizes initially segregated miscible constituents, increases the volume occupied by a solute, and decreases concentration peaks. It is important for the assessment of contamination levels and biogeochemical reactions in groundwater and soils. Mixing processes are governed by the interplay of fluid advection, molecular diffusion and local-scale dispersion at Darcy scale. Here we study the mechanisms of mixing in three-dimensional Darcy scale porous media with different heterogeneity structure. We analyze the role of medium and flow topology on the mixing and dispersion behavior. To this end, we perform Darcy-scale numerical simulations of incompressible flow and transport in heterogeneous three-dimensional porous media. Hydraulic conductivity is represented as a multi-Gaussian random field with lognormal marginal distribution. We consider isotropic and anisotropic correlation structures and scalar and tensorial conductivity. Flow is solved using a finite volume two-point method and transport using a Lagrangian approach. The flow topology is quantified by the helicity of the velocity field. We consider a planar injection of particles. Dispersion is quantified by the longitudinal and transverse dispersion coefficient, which are determined by the evolution along time of the position’s variance in the respective direction divide by two. It is also quantified by the breakthrough curves, which measure the distribution of arrival times at a given position from the initial one. Mixing is quantified by the ability of the flow to stretch and elongate a fluid strip which enhances diffusion through the creation and sustaining of concentration gradients. Results show that for a helical flow, a finite transverse dispersion coefficient is observed at long times and that the elongation of elemental strips follow an exponential stretching  (for large logK variances). On the contrary, on non-helical flows, transverse dispersion tends asymptotically to zero and the stretching rate is algebraic. The longitudinal dispersion coefficient seems unaffected by the helicity of the flow. These results shed light on the relation between medium structure and flow topology on mixing, making an important step towards the control, upscaling and large scale representation of mixing in porous media

.


How to cite: Feroukas, K., Dentz, M., Hidalgo, J., and Lester, D.: Impact of helicity on mixing in heterogeneous porous media, EGU General Assembly 2024, Vienna, Austria, 14–19 Apr 2024, EGU24-18085, https://doi.org/10.5194/egusphere-egu24-18085, 2024.

EGU24-18902 | Posters on site | HS8.1.1

Development of a new computer tool for coupling HYDRUS-1D and MODFLOW 

Bartosz Balis, Mateusz Pawlowicz, Adam Szymkiewicz, Jirka Simunek, Anna Gumula-Kawecka, and Beata Jaworska-Szulc

Groundwater management relies increasingly on numerical models to assess past, present, and future conditions, optimize strategies, and protect resources from climate and land use changes. Groundwater systems encompass the unsaturated (vadose) and saturated (groundwater) zones, with vadose zone modeling presenting computational challenges due to nonlinear equations and complex parameters. One possible solution to include the vadose zone processes in groundwater models in a flexible manner is to couple computer programs modeling 3D flow in the saturated zone with programs modeling 1D flow in the vadose zone. 


In this study, we introduce the HYDRUS-MODFLOW Synergy Engine (HMSE), a novel coupling approach for HYDRUS-1D and MODFLOW-2005, aimed at enhancing groundwater modeling. HMSE employs external coupling via a versatile interface, offering three deployment options: a desktop application, a Docker container, and a Kubernetes cluster. Users interact through a web interface, enabling project setup, model uploads, configuration adjustments, simulations, and result retrieval.


The MODFLOW's area is divided into recharge zones, each assigned a HYDRUS-1D model representing soil profiles, land cover, groundwater depth, and weather conditions. HMSE offers two coupling modes. In the simple mode, groundwater table positions are assumed constant, HYDRUS-1D simulations are performed for the entire period, and average recharge rates are calculated for MODFLOW. In the second coupling mode, MODFLOW and HYDRUS-1D interact iteratively to update the water table position in HYDRUS-1D profiles after each stress period in the MODFLOW simulation. This involves splitting the MODFLOW model into segments corresponding to different stress periods, performing HYDRUS-1D simulations, passing recharge data to the RCH file, running a MODFLOW simulation for each stress period, and using MODFLOW results to calculate the average water table depth for each recharge zone, thus updating the corresponding HYDRUS profiles while avoiding oscillations in recharge flux. 


HMSE combines the strengths of mature and validated HYDRUS-1D and MODFLOW-2005 programs, offering a more comprehensive understanding of groundwater systems. Our study presents a preliminary validation of HMSE for a shallow aquifer in northern Poland. We also evaluated HMSE performance in the three deployments (desktop, Docker and Kubernetes). 

How to cite: Balis, B., Pawlowicz, M., Szymkiewicz, A., Simunek, J., Gumula-Kawecka, A., and Jaworska-Szulc, B.: Development of a new computer tool for coupling HYDRUS-1D and MODFLOW, EGU General Assembly 2024, Vienna, Austria, 14–19 Apr 2024, EGU24-18902, https://doi.org/10.5194/egusphere-egu24-18902, 2024.

EGU24-19360 | Posters virtual | HS8.1.1

Effect of supercritical CO2/water interactions on geomechanical behavior of quartz-rich sandstone for CO2 geological storage 

Takashi Fujii, Masashige Shiga, Yasuki Oikawa, and Xinglin Lei

In the course of CO2 injection into a storage reservoir, understanding of a volumetric change (e.g., swelling), induced by interacting among CO2, water and rock into pores of rocks should be a critical step for modeling of hydro-mechanical response relevant to CO2 capture and storage (CCS) technology. For the majority of ongoing and planning CCS sites in the globe, hard sedimentary rocks, which is main component of quartz and feldspars with less clay minerals (e.g., smectite, illite), is a representative reservoir rock. It is well-known that caprocks (i.e., mudstone and shale) occur the swelling behavior of a rock matrix in the presence of water and/or CO2 due to intercalation and exchange reactions between layers of clay minerals. However, such volumetric change effect for quartz-rich rocks is not yet being investigated enough. In this study, we investigate geomechanical behavior of quartz-rich sandstone (Berea sandstone) in supercritical CO2 (scCO2)-water system under effective pressure of 10 MPa for up to approximately 1 week, the condition of which assumes that CO2 is injected into a storage reservoir at 1 km depth. Our results demonstrated that quartz-rich sandstone had a significant potential for changes in geomechanical properties (i.e., axial stress, displacement, volumetric strain) in scCO2-water system, like that do clay-rich caprocks, although little the change being observed for only water-saturation under the same effective stresses, and its maximum value was approximately 0.3 % for scCO2/water system. Also, increasing axial stress induced by the change in volumetric strain of the rock sample tested were more than 1 MPa for all experimental runs. A comparison results suggested that the obtained volumetric strains for this system could not be explained fully by change in bulk modulus before and after introducing scCO2 into the rock sample. The findings of our study might provide a significant contribution for the coupled hydro-mechanical behavior in storing CO2 into hard sedimentary rocks.

How to cite: Fujii, T., Shiga, M., Oikawa, Y., and Lei, X.: Effect of supercritical CO2/water interactions on geomechanical behavior of quartz-rich sandstone for CO2 geological storage, EGU General Assembly 2024, Vienna, Austria, 14–19 Apr 2024, EGU24-19360, https://doi.org/10.5194/egusphere-egu24-19360, 2024.

EGU24-19678 | Orals | HS8.1.1

A Spatially Distributed Leaching Model to assess pesticide leaching for exposure assessment at the European level 

Maarten Braakhekke, Pavan Cornelissen, Louise Wipfler, Aaldrik Tiktak, Anton Poot, Bernhard Jene, Gerco Hoogeweg, Abdul Ghafoor, Judith Klein, Michael Stemmer, Amy Ritter, Robin Sur, Gregor Spickermann, Gerard Heuvelink, Gregory Hughes, Stephan Marahrens, Stefan Reichenberger, Nicoleta Suciu, and Michelle Morris

Assessment of the leaching potential of pesticides and their metabolites is an important part of the authorization procedure for pesticides in Europe. To protect groundwater quality, it must be demonstrated that concentrations of active substances in the upper groundwater do not exceed 0.1 μg/L before a pesticide can be approved for use. For the purpose of exposure assessment, this concentration limit is imposed on the water leaching downward at 1 m depth in the soil profile. For a given substance and application pattern, this leaching concentration can vary in space by several orders of magnitude, due to variation in site conditions, most importantly soil properties and climate. Spatially distributed leaching modelling (SDLM) is a methodology for exposure assessment over large spatial extents, dealing with this spatial variability in a comprehensive way. It involves performing simulations for many parametrizations representative for a spatial region and can be used to generate maps or calculate spatio-temporal percentiles of leaching concentrations. While such tools are already used in exposure assessment at national level in several EU member states, no generally accepted SDLM tool is available at the European level. In 2020, a working group of Society of Environmental Toxicology and Chemistry (SETAC) was formed with the purpose to develop a harmonized framework for SDLM across Europe (EU27 + UK).

A first version of an SDLM—referred to as GeoPEARL-EU—was built around the pesticide leaching model PEARL, a field-scale model of pesticide fate in the soil-plant system. PEARL mechanistically simulates pesticide behaviour in a 1D soil column based on explicit descriptions of transport in the liquid and gas phases, sorption to the solid phase, degradation, volatilisation, and plant-uptake. Soil moisture content and fluxes are provided by the SWAP hydrological model. PEARL is used in regulatory exposure assessment for groundwater and soil. Furthermore, a spatially distributed tool based on PEARL (GeoPEARL) is used for exposure assessment in the Netherlands.

To apply PEARL to Europe, pan-European gridded datasets were collected for several variables, including soil texture, pH, soil organic carbon, weather, irrigation patterns and crop area. These datasets were used to develop a set of parametrizations covering the variability of climate and soil conditions in Europe. To this end, all 1x1 km grid cells for the EU27 + UK were partitioned into approximately 10,000 clusters using k-means clustering, based on several soil- and climate-related variables relevant for leaching vulnerability. Subsequently, a representative grid cell was selected for each cluster, which was used to obtain the data required to parameterize PEARL from the spatial data sets. Pedotransfer functions were used to derive soil hydraulic parameters.

We will present results from GeoPEARL-EU for several test cases with specific attention to the effect of the spatial aggregation approach on the model predictions. Moreover, we discuss how the tool could be used in the tiered approach of the regulatory exposure assessment for groundwater in the EU.

How to cite: Braakhekke, M., Cornelissen, P., Wipfler, L., Tiktak, A., Poot, A., Jene, B., Hoogeweg, G., Ghafoor, A., Klein, J., Stemmer, M., Ritter, A., Sur, R., Spickermann, G., Heuvelink, G., Hughes, G., Marahrens, S., Reichenberger, S., Suciu, N., and Morris, M.: A Spatially Distributed Leaching Model to assess pesticide leaching for exposure assessment at the European level, EGU General Assembly 2024, Vienna, Austria, 14–19 Apr 2024, EGU24-19678, https://doi.org/10.5194/egusphere-egu24-19678, 2024.

EGU24-20806 | Orals | HS8.1.1

Pore-scale investigations of interactions between microorganisms and ionic strength: Implications for salt crystallization damage in porous media 

Jafar Qajar, Alejandra Reyes Amezaga, Selen Ezgi Celik Selen Ezgi Celik, Sebastiaan Godts, Laurenz Schröer, Amir Raoof Amir Raoof, and Veerle Cnudde

Drying of building materials filled with salt-containing moisture is a common example of salt weathering [1]. Fluid flow, such as capillary uptake of water, and local climate changes stand out as key factors in salt weathering, substantially impacting the Earth's landscape and building infrastructure [2]. While microbial organisms are known to alter rock surfaces, some exhibit physiological capabilities that beneficially impact rock properties by producing biofilms, biocement and biogas [3]. Environmental factors such as temperature, relative humidity, and ionic strength of the medium influence microbial-induced products [4]. The impact of salt type, concentration, and ionic strength on microbially mediated reactions inside porous media is a largely unexplored phenomenon at the pore scale. Effective addressing of the respective challenges requires understanding the synergistic and counter effects of bacterial interactions and salt crystallization within the internal pore structure of rocks, influencing related pore-scale processes. In this study, we explored the response to the drying process in a range of porous materials, from PDMS transparent micromodels to sedimentary porous rocks containing brine solutions of various compositions in the presence and without bacterial solutions. We used Paracoccus denitrificans bacteria in our experiments. We specifically consider the case where air with different levels of humidity and at a constant temperature is exposed to one side of the porous media, forming a drying front—a defined interface separating liquid-saturated and partially gas-filled domains. High-resolution optical and confocal microscopy, Raman spectroscopy, and X-ray micro-computed tomography (µ-CT) were used to visualize and characterize bacteria-salt aggregates interactions in the porous media. Systematic investigations were carried out to understand how the interactions between salt crystallization and bacterial reactions depend on pore space morphology, type, and ionic strength of salt solutions. The findings highlight the potential of advanced 2D and 3D imaging techniques for enhanced understanding of the transport-crystallization coupling with bacterial activity through in-situ experiments and, hence, for constructing more accurate prediction models and conservation strategies.

Keywords: Salt weathering; Bacteria; Ionic strength; Relative humidity; Evaporation; Imaging techniques.

Acknowledgement: This project has received funding from the Dutch Research Council (NWO) through the BugControl project (project number VI.C.202.074) of the NWO Talent program and from the EU INFRAIA project (H2020) the EXCITE Network.

References

[1]       Sghaier, N., S. Geoffroy, M. Prat, H. Eloukabi, and S. Ben Nasrallah, Evaporation-driven growth of large crystallized salt structures in a porous medium. Physical Review E, 2014. 90(4): p. 042402.

[2]       Grossi, C.M., P. Brimblecombe, B. Menéndez, D. Benavente, I. Harris, and M. Déqué, Climatology of salt transitions and implications for stone weathering. Science of The Total Environment, 2011. 409(13): p. 2577-2585.

[3]       Llop, E., I. Alvaro, A. Gómez-Bolea, M. Hernández Mariné, and S. Sammut, Biological crusts contribute to the protection of NeolithicHeritage in the Mediterranean region, in Science and Technology for the Conservation of Cultural Heritage. 2013. p. 33-36.

[4]       Ferrer, M.R., J. Quevedo-Sarmiento, M.A. Rivadeneyra, V. Bejar, R. Delgado, and A. Ramos-Cormenzana, Calcium carbonate precipitation by two groups of moderately halophilic microorganisms at different temperatures and salt concentrations. Current Microbiology, 1988. 17(4): p. 221-227.

How to cite: Qajar, J., Reyes Amezaga, A., Selen Ezgi Celik, S. E. C., Godts, S., Schröer, L., Amir Raoof, A. R., and Cnudde, V.: Pore-scale investigations of interactions between microorganisms and ionic strength: Implications for salt crystallization damage in porous media, EGU General Assembly 2024, Vienna, Austria, 14–19 Apr 2024, EGU24-20806, https://doi.org/10.5194/egusphere-egu24-20806, 2024.

EGU24-20962 | ECS | Posters on site | HS8.1.1

Preventing Salt Precipitation in Soils through Density-Driven Salt Instabilities 

Stefanie Kiemle, Theresa Schollenberger, Katharina Heck, Rainer Helmig, Carina Bringedal, and Hans van Duijn

Soil salinization causes severe problems in agriculture, especially in arid and semi-arid regions, as it leads to soil degradation and reduces plant growth. During evaporation from a saline-water-saturated soil, salt accumulates near the top of the soil. Depending on the conditions, the increasing salt concentration will either lead to precipitation once the solubility limit is reached or due to the increase in the liquid density a gravitationally unstable situation is given, where instabilities in the form of fingers will develop. Hence, salt can be transported downwards. The development of these instabilities and the potential salt precipitation have been analyzed using numerical simulations on the REV-scale. The simulations were performed by using the numerical simulator DuMuX.  

We analyzed the relevant processes to identify the influence of different parameters like soil-hydraulic properties, evaporation rate, or salt properties on precipitation. In Bringedal et. al., 2022, the appearance of instabilities during evaporation from a one-phase system was investigated using a linear stability analysis and numerical simulations on the REV-scale. The linear stability set criteria for the onset of instabilities for a large range of parameters, whereas the numerical simulations provide information about the development of the instabilities after onset. By combining both methods, we can predict the occurrence of instabilities and their effect on the salt concentration near the top boundary. This analysis has been extended to two-phase systems to analyze the impact of phase saturation on the development of salt instabilities. 

In future work,  we plan to improve the REV-scale models with the help of the pore-network model. This will be done by identifying relevant parameters for salinization processes on the pore scale and using suitable upscaling methods for the use on the REV-scale.

How to cite: Kiemle, S., Schollenberger, T., Heck, K., Helmig, R., Bringedal, C., and van Duijn, H.: Preventing Salt Precipitation in Soils through Density-Driven Salt Instabilities, EGU General Assembly 2024, Vienna, Austria, 14–19 Apr 2024, EGU24-20962, https://doi.org/10.5194/egusphere-egu24-20962, 2024.

EGU24-21133 | Posters on site | HS8.1.1

Implementation of the Brunswick model system into the Hydrus software suite 

Jiri Simunek, Efstathios Diamantopoulos, and Tobias K. D. Weber

The modular framework for modelling unsaturated soil hydraulic properties over the full moisture range of Weber et al. (2019) and Streck and Weber (2020) was implemented in the Hydrus Suite. Users can now additionally choose between four different variants of the Brunswick model: i) van Genuchten-Mualem (van Genuchten, 1980; Mualem, 1976), ii) Brooks-Corey (Brooks and Corey, 1964), iii) Kosugi (Kosugi, 1996), and iv) modified van Genuchten (Vogel and Cislerova, 1988). For demonstration purposes, simulation results of bare soil evaporation and root water uptake with Hydrus are presented, along with a comparison of the original van Genuchten-Mualem model and its Brunswick variant. Results show that the original van Genuchten-Mualem model underestimates the simulated cumulative evaporation and cumulative transpiration due to the inconsistent representation of the soil hydraulic properties in the dry moisture range. We also implemented a two-step hydro-ptf into the Hydrus Suite that converts the parameters of the original van Genuchten-Mualem model to the Brunswick variant (Weber et al., 2020). In that way, physically comprehensive simulations are ensured in case no data on soil hydraulic properties are directly available, but information on physical soil properties (e.q., texture, bulk density) exists.

How to cite: Simunek, J., Diamantopoulos, E., and K. D. Weber, T.: Implementation of the Brunswick model system into the Hydrus software suite, EGU General Assembly 2024, Vienna, Austria, 14–19 Apr 2024, EGU24-21133, https://doi.org/10.5194/egusphere-egu24-21133, 2024.

EGU24-21207 | Posters on site | HS8.1.1

 Dissecting the spatio-temporal variability of soil hydraulic properties in an agricultural eroded area 

Giuseppe Brunetti, Radka Kodešová, Miroslav Fér, Antonín Nikodem, Aleš Klement, and Jiří Šimůnek

The combined effect of anthropogenic and climatic stressors deeply influences the hydrological behavior of agricultural areas, especially on hillslopes. Tillage induces an abrupt change in the soil's hydraulic functioning, which can be dynamically recovered in time due to natural consolidation, alternation of wetting and drying cycles, and other biophysical factors. Heavy rainfall can accelerate the recovery process, but also induce erosion events in tilled soils, further exacerbating the spatial variability of the topsoil hydraulic properties. To better understand the mechanisms driving the spatio-temporal variability of soil hydraulic properties in agricultural areas, we combine the modified hydrological model HYDRUS with transient soil moisture observations from two hillslopes in the Czech Republic exposed to tillage and erosion. In particular, the Bayesian inference is used to calibrate two alternative HYDRUS implementations at five different locations along the hillslopes. The first model assumes static soil hydraulic properties, while the second simulates their dynamic change induced by tillage and natural consolidation (due to rainfall). The Watanabe-Akaike Information Criterion (WAIC) is used to compare the two models by considering not only the fitting accuracy, but also the predictive uncertainty. The results show that both models can reproduce soil moisture observations satisfactorily at different depths and locations. While the dynamic model exhibits slightly better fitting, this is compensated by larger predictive uncertainty compared to the static model. This is confirmed by the WAIC values, which are similar for the two models. An in-depth analysis indicates that the dynamic recovery of soil hydraulic properties happens during the first few rainfall events (confirming what was observed in other studies) and suggests that higher resolution measurements are needed to better estimate recovery factors. Finally, the spatial variability of the estimated soil hydraulic parameters hints at a possible role of overland flow fluxes along the hillslope as a heterogeneity-generating factor. 

How to cite: Brunetti, G., Kodešová, R., Fér, M., Nikodem, A., Klement, A., and Šimůnek, J.:  Dissecting the spatio-temporal variability of soil hydraulic properties in an agricultural eroded area, EGU General Assembly 2024, Vienna, Austria, 14–19 Apr 2024, EGU24-21207, https://doi.org/10.5194/egusphere-egu24-21207, 2024.

EGU24-2217 | ECS | Orals | HS8.1.2

What controls the development of heterogenous dissolution patterns in carbonate rocks? 

Atefeh Vafaie, Josep M. Soler, Jordi Cama, Iman R. Kivi, Samuel Krevor, and Victor Vilarrasa

Porosity and permeability changes are anticipated when carbonate rocks are percolated with and dissolved by acidic fluids. The ability to predict the location, extent, and impact of these changes could benefit acid-relevant operations in carbonate rocks, specifically CO2 storage by improving our estimates of CO2 flow and storage performance in the subsurface. In this work, we combine percolation experiments and numerical simulations to capture the chemical effects of CO2-saturated water (weak acid) and HCl solution (strong acid) on cm-scale limestone cores. Numerical simulations are parameterized and validated against experimental data, including effluent solution chemistry, porosity distribution, and observed dissolution features in CT images of the reacted specimens. CT imaging data of intact cores are employed to construct porosity and permeability distribution maps over the core domain serving as input for reactive transport models of the experiments. The results indicate that the pore space heterogeneity controls the mineral dissolution from the onset of the acidic fluid injections, while the acid type becomes progressively important as the dissolution front further penetrates the rock. The compact dissolution pattern formed in the HCl-treated cores due to the complete dissociation of the strong acid could be numerically simulated using a generalized power-law porosity-permeability relationship with a power value of 3, applied at the numerical grid scale. However, the formation of the lengthwise wormhole in CO2-treated cores due to partial dissociation of the weak acid and its buffering capacity could be only simulated using a large power value of 15 at the grid scale in the porosity-permeability relationship. This exponent increases to 27.6 for the bulk flow behavior of the limestone core containing the wormhole, illustrating large-scale dependence of acid-induced permeability evolutions in carbonate rocks. These findings highlight the need for developing robust upscaling approaches to account for the hydraulic behavior of reactive, intrinsically heterogeneous carbonate rocks in large-scale simulations.

How to cite: Vafaie, A., Soler, J. M., Cama, J., Kivi, I. R., Krevor, S., and Vilarrasa, V.: What controls the development of heterogenous dissolution patterns in carbonate rocks?, EGU General Assembly 2024, Vienna, Austria, 14–19 Apr 2024, EGU24-2217, https://doi.org/10.5194/egusphere-egu24-2217, 2024.

EGU24-2723 | ECS | Posters on site | HS8.1.2

Effect of Hydrophobicity on the Transport of Carbon Nanoparticles in Saturated and Unsaturated Porous Media 

Bahareh Hassanpour, Daniel May, Laura SinClair, Tammo Steenhuis, and Lawrence Cathles

Carbon-based nanoparticles (CNPs) are increasingly used for environmental and industrial applications such as in pharmaceuticals, energy production, and water and wastewater treatment. Thus, it is crucial to understand their interactions and transport in porous media. Here, we examine the impact of CNP hydrophobicity and porous medium surface area on their transport. We use CNPs that are synthesized from citric acid and ethanolamine and are fluorescent. They exhibit synthesis-temperature-dependent hydrophobicity and were synthesized at four temperatures: 190 °C, 210 °C, 230 °C, and 250 °C. The experiments were conducted by flowing these CNPs in sand-packed columns under saturated and unsaturated conditions. To examine the impact of the surface area of sand on CNP transport, the sands packed in the columns had three surface areas. In addition, a particle transport model in HYDRUS 1D was used to model the transport.

Together, our experimental and modeling noted four important observations. The first observation indicated the importance of hydrophobicity on CNP transport. There was a 55% difference between the recovery of CNPs synthesized at 190 °C compared to those synthesized at 250 °C. Second, a five-fold increase in surface area yielded a 17% decrease in the recovery of CNPs, suggesting the role of sand surface area on CNP recovery. Third, due to the small size of CNPs relative to the water film on the sand surface, there were no significant differences in the mass recovery of CNPs under unsaturated and saturated conditions. Fourth, the particle transport model with a Langmuirian site blocking term successfully simulated the transport of CNPs. There was approximately a 10-fold increase in the adsorption coefficients for hydrophobic CNPs compared to hydrophilic ones. In sum, our observations and modeling demonstrated that hydrophobicity was a major factor that impacted the transport of CNPs.


How to cite: Hassanpour, B., May, D., SinClair, L., Steenhuis, T., and Cathles, L.: Effect of Hydrophobicity on the Transport of Carbon Nanoparticles in Saturated and Unsaturated Porous Media, EGU General Assembly 2024, Vienna, Austria, 14–19 Apr 2024, EGU24-2723, https://doi.org/10.5194/egusphere-egu24-2723, 2024.

EGU24-3082 | ECS | Orals | HS8.1.2

Investigation of mineral dissolution kinetics through Atomic Force Microscopy 

Chiara Recalcati, Martina Siena, Monica Riva, Monica Bollani, and Alberto Guadagnini

We illustrate an experimental platform grounded on Atomic Force Microscopy (AFM) imaging enabling one to evaluate nanometer-scale absolute material fluxes across a mineral surface subject to precipitation/dissolution reaction under continuous flow. Reactive phenomena of this kind taking place at the solid-fluid interface have a pivotal role in driving alterations of the fundamental properties of natural geologic systems (including, e.g., porosity, permeability, and storage capacity). High resolution experimental observations document that several kinetic processes contribute to the overall reaction. These, in turn, yield a markedly heterogeneous distribution of reaction rates. The latter cannot be characterized through average rate values. Current challenges limiting our ability to characterize such heterogeneity include the establishment of a reliable integrated experimental platform that allows employing AFM imaging to evaluate real-time and in situ absolute material fluxes across the mineral surface. These can then be employed to enrich and expand typical analyses of the evolution of surface morphology. We overcome these barriers and provide spatial distributions of rates observed at the nanoscale across the surface of a calcite crystal subject to dissolution. We then interpret experimental observations through a stochastic approach. The latter is designed to embed the action of diverse kinetic modes corresponding to different mechanistic processes taking place across the surface and driving the spatial heterogeneity of the reaction.

How to cite: Recalcati, C., Siena, M., Riva, M., Bollani, M., and Guadagnini, A.: Investigation of mineral dissolution kinetics through Atomic Force Microscopy, EGU General Assembly 2024, Vienna, Austria, 14–19 Apr 2024, EGU24-3082, https://doi.org/10.5194/egusphere-egu24-3082, 2024.

EGU24-3554 | ECS | Orals | HS8.1.2

Experimental and numerical study of CO2 sequestration in a heterogeneous porous medium 

Rima Benhammadi, Patrice Meunier, Marco Dentz, and Juan J. Hidalgo

We investigate both experimentally and numerically the gravitational instability due to the dissolution of carbon dioxide into brine in heterogeneous porous media. To do so, we consider a two dimensional Hele-Shaw cell of 0.073 m x 0.49 m, in which a log-normally distributed permeability field has been engraved. Permeability fields with a mean gap of 370 µm and 500 µm, a correlation length  λx = 0.032 m, λz = 0.016 m and a variance of 0.137 are considered in order to see the effect of heterogeneity on the convective instability. Experiments in cells with a constant gap are also performed. The CO2 partial pressure is varied between 12% and 85%. The convective patterns are visualized using a pH sensitive dye (Bromocresol green).

Experimental results show that fingers tend to merge faster in the heterogeneous cases than in the homogeneous ones and tend to look more distorted. The number of fingers at late times is smaller in the heterogeneous cases than in the homogeneous ones. The gap thickness has little effect in the heterogenous cells but a small increase of fingers with the gap width is observed in the absence of heterogeneity. Moreover, the amplitude of the instability is higher in the case of the heterogeneous experiments whereas the growth rate at early times is a bit smaller compared to the homogeneous ones. The amplitude of the instability at late times is higher for the cases with bigger gap thickness for homogeneous and heterogeneous cases. Increasing the partial pressure of CO2 intensifies the amplitude of the instability as well as the number of fingers at a given time. As for the Numerical simulations, they reproduce well the evolution of the number of fingers and the amplitude of the instability. However, the numerical time for the onset of convection is longer.

Key words: CO2 sequestration, Rayleigh-Taylor instability, heterogeneity, fingering patterns, amplitude, growth rate.

How to cite: Benhammadi, R., Meunier, P., Dentz, M., and Hidalgo, J. J.: Experimental and numerical study of CO2 sequestration in a heterogeneous porous medium, EGU General Assembly 2024, Vienna, Austria, 14–19 Apr 2024, EGU24-3554, https://doi.org/10.5194/egusphere-egu24-3554, 2024.

EGU24-4016 | ECS | Orals | HS8.1.2

Experiment and simulation of quasistatic capillary rise in an ink-bottle setup resultingin pressure-saturation (p-s) hysteresis 

Animesh Nepal, Juan J. Hidalgo, Jordi Ortin, Ivan Lunati, and Marco Dentz

During imbibition, fluid-fluid interface at the inlet of a constriction experiences an increase in capillary force that results in rapid fluid invasion known as Haines jump. During drainage, the interface gets pinned at the end of the constriction, which causes pressure-saturation (p-s) trajectories to follow different paths during imbibition and drainage resulting in p-s hysteresis. In this work, we performed quasistatic two-phase flow experiments and simulations of cyclic imbibition and drainage in a capillary tube with a constriction (ink-bottle) to have a quantitative understanding of p-s hysteresis. In the setup, drainage and imbibition were driven by quasitatically changing the pressure gradient between the inlet and the outlet of the tube. The experimental results were compared with the results from a numerical model in OpenFOAM, which solves the Navier-Stokes equations employing Volume of Fluid method to calculate the position of the interface. We observed that multiphase flow through a single constriction revealed distinct p-s hysteresis, a common trait in porous media. The steeper the constriction, the more pronounced the p-s hysteresis and vice versa. We derived an analytical solution to obtain the p-s curve and compared the results obtained from experiments and simulations. This comparative study will allow us to quantitatively link the pore-scale capillary physics to large-scale p-s hysteresis.

How to cite: Nepal, A., Hidalgo, J. J., Ortin, J., Lunati, I., and Dentz, M.: Experiment and simulation of quasistatic capillary rise in an ink-bottle setup resultingin pressure-saturation (p-s) hysteresis, EGU General Assembly 2024, Vienna, Austria, 14–19 Apr 2024, EGU24-4016, https://doi.org/10.5194/egusphere-egu24-4016, 2024.

The deep geological disposal method is a prominent approach for the management of high-level radioactive waste, and understanding the behavior of uranium under various geochemical conditions is essential for this purpose. To predict the behavior of uranium in the field, it is necessary to evaluate not only the transport of uranium but also the reactions between host rock and groundwater at the field site. In this regard, we evaluated the behavior of uranium in the underground environment by analyzing the temporal and spatial changes in uranium geochemistry in response to water-rock reactions. This was achieved through column experiments using rocks containing uranium ore bodies and groundwater from a natural analogue study site in Korea. Two columns (NA-PJ1 and NA-PJ2) were prepared by collecting coaly slate materials containing uranium minerals sourced from the Okcheon Metamorphic Belt in Korea. NA-PJ1 was filled with coaly slate (0.025 ~ 2 mm grain size) collected from the study area, while NA-PJ2 included a mixture of coaly slate and limestone (10 wt%) to provide pH buffering. The input solutions to the columns were artificial groundwater manufactured with a chemistry similar to that of the groundwater at the study site. The artificial groundwater was purged with Ar gas before the experiment to minimize the ingress of dissolved oxygen (DO) from the atmosphere. To observe spatial and temporal changes in geochemistry resulting from the interactions between the artificial groundwater and the reactive materials inside the columns, water samplings were performed at 0, 5, 10, 15, 20, 25, 30, 35, and 40 cm from the column influent. The results consistently showed low and stable DO concentrations in both columns. The pH in NA-PJ1 initially exhibited the highest value at 0 cm but gradually decreased to below 4.5. This was attributed to the insufficient carbonate buffering capacity to neutralize hydrogen ions generated by the oxidation of iron sulfide in coaly slate. In NA-PJ2, in contrast, the pH remained around 8. Uranium concentration in NA-PJ1 increased gradually with distance. It was determined that uranium was released through the dissolution of uranium minerals (i.e., uraninite and ekanite). Subsequently, the released uranium formed uranium aqueous complexes with dissolved F or SO4 induced by iron sulfide oxidation. Furthermore, it was shown that uranium in NA-PJ1 formed UO2CO3(aq) complexes closer to the column influent, while it formed more UO2SO4(aq) complexes with increasing distance. This study contributes to understanding the transport and reaction characteristics of uranium in groundwater, ultimately aiding in the management of high-level radioactive waste in a deep geological disposal site.

How to cite: Lim, S., Cho, H., Noh, S., and Jeen, S.-W.: Evaluating the Behavior of Uranium Through Column Experiments Using Artificial Groundwater and Coaly Slate from a Natural Analogue Study Site in Korea, EGU General Assembly 2024, Vienna, Austria, 14–19 Apr 2024, EGU24-5012, https://doi.org/10.5194/egusphere-egu24-5012, 2024.

Random walk particle tracking (RWPT) methods employ a Lagrangian discretization of solute plumes into point particles to numerically solve the advection-dispersion equation. Their recognized advantages over more traditional grid-based Eulerian methods regarding numerical stability and numerical dispersion make them ideal candidates to simulate complex reactive fronts in heterogeneous media. However, handling nontrivial boundary conditions remains a challenge, restricting the range of interface processes that can be simulated. We derive and validate a new collision-based approach to implement a broad class of generalized Robin-type boundary conditions, representing the balance between diffusive fluxes and an arbitrary nonlinear function of the transported and surface reactant concentrations. This formulation allows for modeling arbitrary coupled sets of nonlinear surface reactions within the classical RWPT framework, thus opening new opportunities for simulating pore-scale reactive transport in the subsurface. The collision-based nature of the proposed technique allows for estimating surface reaction rates based on single-particle collisions with the reactive interface. Thus, it does not require concentration field reconstructions or multi-particle searches. We verify the method for a coupled set of nonlinear mass-action reactions under pure diffusion and for nonlinear kinetics representing calcite dissolution in a model porous medium.

How to cite: Aquino, T.: Simulating pore-scale nonlinear reactions at the fluid-solid interface using random walk particle tracking, EGU General Assembly 2024, Vienna, Austria, 14–19 Apr 2024, EGU24-5519, https://doi.org/10.5194/egusphere-egu24-5519, 2024.

The combined action of stretching and diffusion within solute plumes controls mixing in flows through soils and fractured rocks, ultimately affecting the rates of subsurface reactions. Stretching enhances mixing by increasing the area available for diffusion to act and steepening concentration gradients. Ultimately, the resulting solute filaments coalesce which drives the transition of concentration profiles toward uniformity. While the role of stretching is well described by current models, the effect of coalescence on mixing has been more challenging to understand, partly because the spatial extent and distribution of coalesced regions depends on the geometric structure of the medium. Here we present a new set of experiments designed to isolate the role of coalescence on mixing in porous media. Using stereolithography 3D printing, we have fabricated transparent porous models with different geometric structures. By imaging pulses of fluorescent dye as they mix in flows through these models, we have resolved the dependence of mixing rates on both Peclet number and the medium geometry. We observe that converging streamlines downstream of stagnation points establish local zones in the flow where coalescence is enhanced. From these observations, we describe the statistics of coalescence and its impact on mixing and reaction rates. These findings support the ongoing effort to improve our predictions of mixing and reactive transport in the subsurface.

How to cite: Pierce, K., Le Borgne, T., and Linga, G.: Experimental imaging of pore scale stretching and coalescence as drivers for solute mixing in porous media, EGU General Assembly 2024, Vienna, Austria, 14–19 Apr 2024, EGU24-5575, https://doi.org/10.5194/egusphere-egu24-5575, 2024.

EGU24-5680 | ECS | Orals | HS8.1.2

Vapor condensation in fractured porous media revealed by in-situ rapid neutron tomography and numerical modeling 

Arash Nemati, Bratislav Lukić, Alessandro Tengattini, Matthieu Briffaut, and Philippe Sechet

The study of phase change in processes involving two-phase flow in porous media remains relatively under-explored due to the intricate nature arising from the strong coupling between heat and mass transfer and the heterogeneity of the medium. However, condensation in porous media plays a crucial role in various applications, including steam-based gas recovery, underground contamination removal, the integrity of geothermal, CO2 storage reservoirs, durability of concrete structure, and porous fabric and insulation condensation. The objective of this study is to provide a deeper understanding of the subject by conducting rapid neutron tomographies during vapor injection experiments and introducing a novel numerical approach to model the process.

The identification and quantification of water is revealed using 3D rapid in-situ neutron imaging, acquired at 30-second intervals per tomography. Such temporal resolution is possible thanks to the high neutron flux of the Institute Laue Langevin Grenoble (ILL) using the imaging instrument NeXT (Neutron and X-ray Tomograph [1]). The experiments were preceded by a calibration and correction campaign where the quantification of water content was fitted to empirical correlation and the spurious deviations arising from the scattering of neutrons were accounted for using the black body (BB) grid method [2]. The in-situ experiment consists of the injection of a predefined mixture of air and water vapor at a constant flow rate into cylindrical samples of Fontainebleau sandstone with a splitting crack along their height. Successive rapid neutron tomographies are acquired during the injection of vapor to investigate the evolution of water content and condensation process inside the sample. Furthermore, X-ray tomography is performed prior to the vapor injection, and part of the sample is scanned by synchrotron microtomography with 6.5 micrometers pixel size. This allows for extracting the microstructure and morphology of the crack and porous matrix, and its impact on the spatio-temporal accumulation of liquid water, and understanding its migration within the crack and matrix. The results [3,4] show that water initially emerges near the inlet and spreads toward distant areas. Condensed water generally has the tendency to occupy tighter spaces within the sample. The condensed water diffuses into the porous matrix due to capillary effects and pressure buildup in the crack.

Preliminary results of a numerical model developed in OpenFoam are also discussed. The model solves heat transfer and two-phase flow equations with phase change mass transfer terms. It is capable of modeling water condensation and temperature fields within a domain of heterogeneous porous media contributing additional insights to the phenomena.

References:

1) Tengattini, A., et al., Nucl. Instrum. Methods Phys. Res., 968, 163939 (2020)

2) Boillat, P., et al., Optics Express, 26(12), 15769-15784 (2018)

3) Gupta, R. et al., Cem. Concr. Res., 162, p. 106987. (2022)

4) Nemati, A., et al., Transp. Porous Media, 150(2), 327-357 (2023)

How to cite: Nemati, A., Lukić, B., Tengattini, A., Briffaut, M., and Sechet, P.: Vapor condensation in fractured porous media revealed by in-situ rapid neutron tomography and numerical modeling, EGU General Assembly 2024, Vienna, Austria, 14–19 Apr 2024, EGU24-5680, https://doi.org/10.5194/egusphere-egu24-5680, 2024.

EGU24-5705 | ECS | Posters on site | HS8.1.2

Unraveling biogeochemical transformation of organic carbon and nitrogen compounds in groundwater along a hill slope transect 

Thanh Quynh Duong, Anke Hildebrandt, and Martin Thullner

The origin and the fate of organic carbon and nitrogen compounds in groundwater play an important role in the global biogeochemical cycling of carbon and nutrients and have implications for drinking water production. While the input of these compounds into the subsurface is strongly driven by land use, their fate in subsurface environments such as fractured aquifers is controlled by a complex interplay between hydrological and biogeochemical processes at different temporal and spatial scales and is poorly understood yet. Determining the fate of these organic compounds in fractured aquifers is additionally challenging due to spatial heterogeneities at various scales down to centimeter scales, leading to a multitude of flow paths of different lengths and residence times.  This causes an overlap of solute residence times for compounds moving from the surface through the subsurface to surface waters or groundwater observation wells, stretching from days to many years, thus affecting the dynamics of the biogeochemical processes and the quantitative assessment of compound fluxes. To address this issue, a travel time-based modeling approach is employed to simulate the fate of carbon and nitrogen compounds in groundwater along a hill slope transect of the Hainich Critical Zone Exploratory (CZE), located northwest of Thuringia (central Germany). This transect is set up under the Collaborative Research Center AQUADIVA. It is subject to an intensive surface and subsurface monitoring program providing groundwater quality and quantity data. Travel time distributions obtained from a numerical groundwater flow model of the transect and its vicinity are combined with a set of numerical 1D simulations describing the biogeochemical transformations of carbon and nitrogen. The simulated complex reaction network describes the transformation of carbon and nitrogen along individual groundwater flow paths, which considers varying microbial functional groups such as aerobes and anaerobes, as well as key microbial life processes under different redox conditions, including aerobic, nitrate-reducing, ammonia-oxidizing, and sulfate-reducing conditions.  The model-predicted concentrations of reactive species at various observation wells are compared to measured concentrations to validate the approach. The results show that processes on the surface strongly shape the dynamics of resulting recharge zones represented by different land use areas, which have an impact on observed concentrations at wells. Travel time distributions combined with simulations of the biogeochemical transformation along a flow path can provide a model-based interpretation of measured observations and the factors controlling them. This allows predicting fluxes of chemical species through the entire sub-catchment and their dependency on the dynamics of surface conditions.

How to cite: Duong, T. Q., Hildebrandt, A., and Thullner, M.: Unraveling biogeochemical transformation of organic carbon and nitrogen compounds in groundwater along a hill slope transect, EGU General Assembly 2024, Vienna, Austria, 14–19 Apr 2024, EGU24-5705, https://doi.org/10.5194/egusphere-egu24-5705, 2024.

EGU24-6219 | ECS | Orals | HS8.1.2

Biofilm Growth in Porous Media well approximated by Fractal Multirate Mass Transfer with Advective-Diffusive Solute Exchange 

Jingjing Wang, Jesús Carrera, Maarten W. Saaltink, Jordi Petchamé-Guerrero, Graciela S. Herrera, and Cristina Valhondo

Biofilm growth in porous media changes the hydrodynamic properties of the medium: porosity and permeability decrease, and dispersivity increases. However, the first arrival of breakthrough curves (BTCs) is more reduced than derived from the reduction in porosity, and the BTC tail becomes heavier. These observations suggest the need for multicontinuum models (Multi-Rate Mass Transfer, MRMT) which describe reactive transport in heterogeneous porous media and facilitate the simulation of localized reactions often observed within biofilms. Here, we present a conceptual model of biochemical reactive transport with dynamic biofilm growth based on MRMT formulations. The model incorporates microbial growth by updating the porosity, dispersivity, and local mass exchange between mobile water and the immobile biofilm according to the stoichiometry and kinetic rate laws of biochemical reactions. This model has been successfully tested using two sets of laboratory data. We found that (1) the basic model based on the growth of uniformly sized biofilm aggregates (memory function with 1/2 slope), fails to reproduce laboratory tracer tests and rate of biofilm growth, while the fractal growth model, which we obtain by integrating the memory functions of biofilm aggregates with a power law distribution, does; (2) The biofilm memory function evolves as the biofilm grows in response to the varying aggregate size distribution; and (3) the early time portion of eluted volume BTCs are independent of flow rate, whereas the tail becomes heavier when the flow rate is decreased, that both advection controlled and diffusion controlled mass exchange coexist in biofilms.

How to cite: Wang, J., Carrera, J., Saaltink, M. W., Petchamé-Guerrero, J., Herrera, G. S., and Valhondo, C.: Biofilm Growth in Porous Media well approximated by Fractal Multirate Mass Transfer with Advective-Diffusive Solute Exchange, EGU General Assembly 2024, Vienna, Austria, 14–19 Apr 2024, EGU24-6219, https://doi.org/10.5194/egusphere-egu24-6219, 2024.

EGU24-6871 | ECS | Posters on site | HS8.1.2

The advantages and considerations of applying dual tracers in SWPP tests  

Nam-Ryeong Lee, Ji-Young Baek, and Kang-Kun Lee

The Single-Well Push-Pull (SWPP) test is a cost-effective tracer test that has been widely used for aquifer characterization. There is an advantage in concurrently utilizing heat and solute tracers for a comprehensive understanding of the hydraulic and thermal characteristics of the aquifer. However, the application of both tracers in SWPP tests has yet to be commonly used due to their particularity in setting experimental conditions such as drift time and the use of chaser. In this research, dual-tracer SWPP tests were conducted in a laboratory scale using sand (d50 = 0.84 mm, U = 2.06) under six different seepage velocities (vs = 17.5 ― 59.7 m/d), with relative drift time as the variable. As tracers, a sodium chloride solution with a concentration of 1000 ppm and a temperature difference of approximately 6℃ from the background water temperature was employed. Obtained EC and temperature time series data were analyzed by several analytical models. The estimates from analytical models (seepage velocity, porosity, volumetric heat capacity) were compared to those from measurements to evaluate the applicability of a single analytical model on dual-tracer SWPP test. Preliminary experimental results showed that slower velocities and shorter drift times resulted in higher recovery rates but also led to larger error rates in estimates for the solute tracer. Building upon a solute tracer, more accurate analytical models suitable for the current experimental setup were identified, and subsequently extended to the heat tracer for further analysis. Based on the interpretation of both tracers, appropriate test conditions for dual-tracer SWPP tests will be proposed. We anticipate to offer a deeper understanding of the benefits and considerations associated with the combined use of heat and solute tracers for the thorough evaluation of aquifer characteristics during push-pull tests.

Keywords: Single-well push-pull test, Laboratory experiments, Heat tracer, Solute tracer

Acknowledgements : This work was supported by the National Research Foundation of Korea (NRF) grant funded by the Korea government (MSIP) (No. 2022R1A2C1006696). This work was also supported by the National Research Foundation of Korea (NRF) grant funded by the Korea government(MSIT) (No. 2022R1A5A1085103). This work was also supported by the Nuclear Research and Development Program of the National Research Foundation of Korea (NRF-2021M2E1A1085200).

How to cite: Lee, N.-R., Baek, J.-Y., and Lee, K.-K.: The advantages and considerations of applying dual tracers in SWPP tests , EGU General Assembly 2024, Vienna, Austria, 14–19 Apr 2024, EGU24-6871, https://doi.org/10.5194/egusphere-egu24-6871, 2024.

The effects of global warming have already been recorded in many decorated caves located in karst systems, and some prehistoric paintings are already deteriorating. Modeling the microclimate of caves under various climate change scenarios will enable to adapt the conservation strategy for rock art heritage.

The first step in this modeling approach is to simulate heat transfer from the surface to the cave through the soil/epikarst/karst system. The rock characteristics in the model are calibrated using sensor data taken at various depths in the soil and in the karst over a few years, and in the cave thanks to long-term monitoring. To provide long-term climate forcing, a transfer function is established between meteorological data measured at a height of 2 meters by Météo France and the temperature measured at the ground surface.

Then, this heat transfer model is fed with projections from regional climate downscaling models. This modeling approach, which integrates both current data and climate projections, will be a significant step towards the effective management and conservation of decorated caves, which are not only geological wonders but also hold critical historical and archaeological significance.

How to cite: Artigue, C. and Mugler, C.:  Heat transfer modeling in karst environments to study the impact of climate change on the future of decorated caves, EGU General Assembly 2024, Vienna, Austria, 14–19 Apr 2024, EGU24-9577, https://doi.org/10.5194/egusphere-egu24-9577, 2024.

Immiscible fluid displacement in rough geological fractures plays a crucial role in various subsurface processes, such as enhanced oil recovery and geological carbon sequestration. In horizontal settings, this displacement is governed by capillary and viscous forces, resulting in the emergence of various displacement patterns as a less viscous fluid displaces a more viscous one (drainage). The macroscopic variables quantifying the flow process differ substantially between the two limit unstable regimes, namely capillary and viscous fingering, for very low and very large capillary numbers, respectively. While there has been extensive investigation of such phenomena in the context of porous media, studies on rough fractures are relatively scarce. In this study, we perform Direct Numerical Simulation (DNS) to analyze the process of drainage by solving the Navier–Stokes equations within the fracture pore space, employing the Volume of Fluid (VOF) method to track the evolution of the fluid-fluid interface. We consider a wide range of Capillary numbers (10-5 – 10-2) encompassing both the viscous and capillary dominated regimes, as well as three distinct viscosity ratios (0.8, 0.05 and 0.01), and address realistic synthetic fracture geometries characterized by their Hurst exponent, the ratio of the roughness amplitude to the mean aperture (denoted as the fracture closure), and the correlation scale Lc (i.e., the scale above which the two fracture walls are identical) of the investigated fracture domain. The fracture closure is varied between 0.1 and 1, and Lc between L/32 (aperture field with spatial correlations only at small scales) and L (self-affine aperture field), where L denotes the length of the domain. Starting from the invasion morphologies of the fluid-fluid interface, we examine various pore-scale and macroscopic flow observables, allowing us to systematically characterize the displacement processes of the two-phase system at the hydrodynamic scale. Additionally, flow observables, such as the residual saturation of the displaced fluid and the interfacial area, can be utilized to define the parameter functions of a continuum scale two-phase flow model towards upscaling.

How to cite: Neuweiler, I., Krishna, R., Yang, Z., and Yves, M.: Direct Numerical Simulation of Immiscible Two-phase Flow in Rough Fractures from Viscous to Capillary Fingering – Impact of Flow regime and Structure of the Aperture Field , EGU General Assembly 2024, Vienna, Austria, 14–19 Apr 2024, EGU24-9743, https://doi.org/10.5194/egusphere-egu24-9743, 2024.

Coupled dissolution/precipitation reactive processes in transport in porous media are ubiquitous in a multitude of contexts within the field of Earth sciences, such as geological CO2 and H2 storage, contaminant remediation and acid injection in petroleum reservoirs. In particular, the dynamic interaction between the reaction and solute transport, capable of giving rise to the phenomenon of preferential flow paths, is of a critical importance, as these paths play a dominant role in determining the transport properties of the porous medium; still, the approaches to its characterization remain disputed. The emergence of preferential flow paths in porous media can be considered a manifestation of transport self-organization, as they introduce concentration gradients that distance the system from the state of perfect mixing.

To investigate the dynamic reactive-transport interaction and its influence on transport self-organization within the porous media, we consider a 2D Darcy-scale reactive transport simulation, where dissolution and precipitation of the calcite porous matrix are driven by the injection of a low-pH water. The reactive process alters the transport properties of the porous medium, thus creating the reaction-transport interaction. The coupled reactive-transport process is simulated in a series of computational analyses employing the Lagrangian particle tracking approach, capable of capturing the subtleties of the multiscale heterogeneity phenomena. We employ the thermodynamic framework to investigate the emergence of preferential flow paths as the manifestation of transport self-organization; in particular, we are interested in the relationship between the reaction enthalpy that leads to alteration of the medium's transport properties and the resulting change in the transport self-organization.

For initially homogeneous media, our findings show an increase in transport self-organization with time, along with the emergence of the medium heterogeneity due to interaction between the transport and reactive processes. By studying the influence of the Peclet number on the coupled reactive-transport process, we observe that self-organization is more pronounced in diffusion-dominated flows, characterized by low Peclet values. The hydraulic power, dissipated by the fluid, is shown to increase with the increasing medium heterogeneity, as well as with the mean hydraulic conductivity value. This increase in power, supplied to the fluid, results in an intensification of transport self-organization.

For heterogeneous media, we find again that transport self-organization increases with the evolution of the reactive process, along with an increase in the heterogeneity of the medium; their rates of change depend on the initial heterogeneity of the porous medium. These parameters correlate well with the "useful" reactive enthalpy invested in the reactive process, suggesting the existence of a relation between the energy spent and the transport self-organization gained. The self-organization of the breakthrough times exhibits the opposite tendencies, that can be explained by means of a thermodynamic analogy.

Employing thermodynamic framework to investigate the dynamic reaction-transport interaction in porous media may prove beneficial whenever the need exists to estimate the alteration of the overall transport properties of the medium due to emergence of preferential flow paths due to reactive-transport interaction.

How to cite: Shavelzon, E. and Edery, Y.: Applying Thermodynamic Framework to Analyze Transport Self-Organization Due to Dissolution/Precipitation Reaction in Porous Medium: Entropy, Enthalpy, Heterogeneity, EGU General Assembly 2024, Vienna, Austria, 14–19 Apr 2024, EGU24-10003, https://doi.org/10.5194/egusphere-egu24-10003, 2024.

EGU24-10397 | ECS | Posters on site | HS8.1.2

Impact of Sharp Interfaces on Biofilm Growth: Insights from Mixing Processes in a Flow-Through Column Experiment. 

Michela Trabucchi, Paula Rodriguez Escales, Xavier Sanchez Vila, Jesus Carrera, and Daniel Fernandez Garcia

Biofilms in porous media host microbial communities that play a central role in the degradation of nutrients and Contaminants of Emerging Concern. Their importance for promoting contaminants removal in the context of Natural Based Solutions is acknowledged, but we still lack a complete understanding and quantification of biofilm growth dynamics in porous media, and their impact on flow and transport behavior.

In this context, we aim to investigate the effects of sharp interfaces on the spatial and temporal distribution of biofilms growth and their subsequent role in the evolution of flow and transport properties. For this purpose, we conduct flow-through experiments in sand-packed columns characterized by two homogeneous porous media separated by a sharp interface. We inject electron acceptor and electron donor solutions sequentially and multiple times. This creates multiple reactive mixing zones that flow and evolve through the system, depending on the porous medium. The high-resolution monitoring system enables the quantification of biofilm activity, as well as changes in hydraulic conductivity over time and at different sections of the column. Additionally, image analysis allows for the evaluation of the spatial distribution of biofilm growth over time, while breakthrough curve concentrations derived from several tracer tests provide further insights into overall transport parameter changes.

How to cite: Trabucchi, M., Rodriguez Escales, P., Sanchez Vila, X., Carrera, J., and Fernandez Garcia, D.: Impact of Sharp Interfaces on Biofilm Growth: Insights from Mixing Processes in a Flow-Through Column Experiment., EGU General Assembly 2024, Vienna, Austria, 14–19 Apr 2024, EGU24-10397, https://doi.org/10.5194/egusphere-egu24-10397, 2024.

EGU24-10971 | Orals | HS8.1.2

Dispersion in heterogeneous networks under linear and non-linear flow conditions 

Marco Dentz, Jannes Kordilla, and Juan Hidalgo

The understanding and prediction of dispersion phenomena in natural and engineered media are key issues in different fields of science and engineering, with applications ranging from groundwater management to geological energy storage. Spatial variability in the physical medium properties and flow conditions leads to scale effects in the flow and dispersion processes. Here we study the mechanisms of dispersion in two- and three-dimensional heterogeneous networks under linear and non-linear flow conditions, that is, for flows in which the flow rate is a non-linear function of the pressure gradient. Such non-linear relationships have been found for the flow of non-Newtonian fluids, for multiphase flow and inertial flows in porous, fractured and karstic media. We study transport under steady flow using a Lagrangian approach. The flow fields are characterized statistically in terms of the distribution of Eulerian and Lagrangian flow velocities and their correlation properties. Longitudinal dispersion is measured in terms of particle breakthrough curves. We observe broad distributions of particle arrival times, which are manifestations of memory processes that occur due to broadly distributed flow velocities and mass transfer rates. These behaviors are analyzed in terms of the Eulerian and Lagrangian flow statistics, medium structure and flow conditions. Based on this analysis, we propose a stochastic time domain random walk approach to quantify the impact of the network heterogeneity and flow conditions on large-scale dispersion.     

How to cite: Dentz, M., Kordilla, J., and Hidalgo, J.: Dispersion in heterogeneous networks under linear and non-linear flow conditions, EGU General Assembly 2024, Vienna, Austria, 14–19 Apr 2024, EGU24-10971, https://doi.org/10.5194/egusphere-egu24-10971, 2024.

EGU24-12432 | Posters on site | HS8.1.2

Intrinsic permeability of porous systems: models and microfludiic experiments for heterogeneous structures 

Wenqiao Jiao, David Scheidweiler, Nolwenn Delouche, Alberto Guadagnini, and Pietro de Anna

Understanding the relationship between flow (Q) and pressure drop (ΔP) for porous media is a long-standing challenge affecting a wide variety of environmental, societal and industrial issues, from soil remediation to enhanced oil recovery. While for homogeneous media such dependence is well represented by the Kozeny-Carman formula,  the fundamental nature of such a relationship (Q vs ΔP) within heterogeneous systems, characterized by a broad range of pore sizes, is still not understood. We design a set of controlled and complex porous structures that we use to conduct microfluidics experiments to measure their intrinsic permeability. We synthesize the results upon deriving an analytical formulation relating the overall intrinsic permeability and key features of the porous structure. We propose to embed the spatial variability of pore sizes into the medium permeability by upscaling the flow through each pore, via the Hagen Poiseuille Law. Our prediction fits well the collected data, highlighting the role played by the micro-structure on the overall medium permeability. Furthermore, beside the theoretical understanding of this important relationship, we also extend our set-up to novel experiments focusing on the paradigmatic case study of biofilm growth that affects the system permeability by obstructing the pore spaces.

How to cite: Jiao, W., Scheidweiler, D., Delouche, N., Guadagnini, A., and de Anna, P.: Intrinsic permeability of porous systems: models and microfludiic experiments for heterogeneous structures, EGU General Assembly 2024, Vienna, Austria, 14–19 Apr 2024, EGU24-12432, https://doi.org/10.5194/egusphere-egu24-12432, 2024.

In this study, a study on groundwater flow analysis was conducted using hydrochemical and thermal data to find out the flow of groundwater and pollutant behavior in the karst area and to secure countermeasures for problems related to water quality and water resource stability. The flow characteristics were identified using the study area's overall topographic slope and groundwater map. It is more vulnerable to groundwater pollution because it belongs to the discharge stand where groundwater from the west is discharged into the sea. The vertical hydraulic gradient was measured to confirm the direction of recharge and discharge of groundwater and surface water, and it can be seen that the inflow and outflow of groundwater-surface water is active. In both Gyogokcheon (Gyogok-ri) and Sohancheon (Hamaengbang-ri), the recharge of groundwater tends to be more dominant, and in the case of Sohancheon located in Hamangbang-ri, the recharge of groundwater in summer and winter was more active than in spring and fall. In addition, the residence time of groundwater and the recharge and mixing of surface water according to the flow of groundwater and the behavior of pollutants were analyzed using hydrochemical data. There was a distinct difference in radon concentration values between Gyogokcheon (gneiss-based rock) and Sohancheon (limestone-based rock). In the case of Hamaengbang-ri, radon concentration values were not significantly divided according to surface water, groundwater-surface water mixing section (hyporheic zone), and cave water. In the case of Gyogok-ri, radon concentration was used as one of the indicators to estimate the mixing ratio of groundwater and surface water in the hyporheic zone. This work was supported by the Basic Science Research Program through the National Research Foundation of Korea (NRF) funded by the Ministry of Education (grant numbers 2019R1I1A2A01057002 and 2019R1A6A1A03033167). This subject is supported by Korea Ministry of Environment as "The SS(Surface Soil conservation and management) projects; 2019002820004.

How to cite: Ryu, H.-S. and Kim, H.: A Study on the analysis of groundwater flow using thermal and hydrochemical data of groundwater and surface water in the karst area of Samcheok, Korea, EGU General Assembly 2024, Vienna, Austria, 14–19 Apr 2024, EGU24-14397, https://doi.org/10.5194/egusphere-egu24-14397, 2024.

EGU24-14733 | ECS | Posters on site | HS8.1.2

Tracing colloidal co-transport in porous media with tailor-made polymers 

Nimo Kwarkye, Thomas Ritschel, and Kai Totsche

The soil aqueous phase contains a multitude of dissolved as well as colloidal substances, e.g., organic colloids and clay minerals. Due to their ability to facilitate co-transport, colloids significantly contribute to the fluxes of carbon, nutrients, and contaminants, which renders a thorough consideration of colloids and their mobility a prerequisite for an understanding of soil matter exchange. However, a comprehensive assessment of colloidal transport is often hampered by the heterogeneity of reactions at soil mineral interfaces and the compositional and functional diversity of organic matter in natural soil suspensions. We addressed this challenge by using tailored organic polymers based on poly(ethylene glycol) (PEG) with high reactivity towards clay minerals. Hence, the polymers may be immobilized when clays are exposed on pore walls or mobilized when clay minerals form a colloidal suspension that permits a co-transport of clays and polymers. To unravel the competition between these mechanisms, we investigated the separate and combined transport of PEG and bentonite in column experiments using natural limestone as substrate. Here, PEG was strongly retarded due to adsorption on clay mineral surfaces that were exposed following limestone weathering. In contrast, PEG was highly mobile when transported simultaneously with bentonite and the observed PEG breakthrough resembled that of bentonite, indicating PEG was co-transported. This demonstrates that the application of PEG is promising in the disentanglement of complex transport phenomena in natural porous media, particularly if competition between adsorption sites is decisive for the fate of organic matter.

How to cite: Kwarkye, N., Ritschel, T., and Totsche, K.: Tracing colloidal co-transport in porous media with tailor-made polymers, EGU General Assembly 2024, Vienna, Austria, 14–19 Apr 2024, EGU24-14733, https://doi.org/10.5194/egusphere-egu24-14733, 2024.

EGU24-14769 | ECS | Posters on site | HS8.1.2

Prediction of As behavior in a vadose zone using an empirical relationship between As retardation factor and the soil properties 

Sang Hyun Kim, Tho Huynh Huu Tran, Jaeshik Chung, and Seunghak Lee

Arsenic (As) pollution in soil from various anthropogenic sources potentially threatens groundwater by migrating downward through a vadose zone. As goes through complex biogeochemical reactions such as sorption, desorption, and/or redox transformation, which affects its retention in this zone. A retardation factor is a critical solute-transport parameter to quantitatively assess the retention of As in this zone, and eventually to predict the potential risk of groundwater contamination. Despite its importance, however, there is still limited information to quantify the retardation factor in a vadose zone, compared to in the saturated condition. This study aimed to assess the retardation factor of As using twenty-two unsaturated soil columns coupled with the non-equilibrium solute-transport modeling. We employed a multiple linear regression approach to develop a prediction model for the retardation factor based on the soil properties. Soil columns with 3-cm inner diameter and 45-cm height were packed with six different field soils at various bulk densities. Distilled water was infiltrated into each column at a constant flowrate, until a steady-state unsaturated condition was achieved. The distilled water was replaced with a solution containing As and a conservative tracer (chloride, Cl), to obtain their breakthrough curves. The retardation factor of As was determined by inversely fitting the breakthrough data of As and Cl with Mobile-Immobile model integrated in HYDRUS 1-D software. The derived retardation factors of As in the mobile and immobile zones ranged 1.58–6.93 and 1.44–25.48, respectively. These showed high degree of dependence on soil properties. In the mobile water zone, iron content and organic matter content emerged as the two most influential properties affecting As transport, impeding As mobility. Conversely, in the immobile water zone, coefficient of uniformity and bulk density were identified as the most influential factors, enhancing As retention. Based on the results, empirical equations were derived to predict the retardation factors of As in a vadose zone based on the aforementioned soil properties.

How to cite: Kim, S. H., Tran, T. H. H., Chung, J., and Lee, S.: Prediction of As behavior in a vadose zone using an empirical relationship between As retardation factor and the soil properties, EGU General Assembly 2024, Vienna, Austria, 14–19 Apr 2024, EGU24-14769, https://doi.org/10.5194/egusphere-egu24-14769, 2024.

EGU24-17262 | ECS | Posters on site | HS8.1.2

Effect of velocity fluctuations on pore scale stretching kinematics in 3D porous media 

Manuel Maeritz, Joris Heyman, Tanguy Le Borgne, and Marco Dentz

Fluid stretching plays an important role in controlling mixing dynamics in porous media. Recent advances have shown that stretching at pore scale in 3D porous media is chaotic, leading to exponential elongation of mixing interfaces [e.g. 1,2]. Yet, it is not known how the associated stretching rate depend on the pore scale velocity heterogeneity. In this study, we perform particle tracking simulations in a periodic flow fields to investigate how flow heterogeneity control the transient evolution of the stretching rate as well as the asymptotic stretching rate (Lyapunov exponent). Our results reveal that rare low velocity events have a significant impact on the Lyapunov exponent, while these regions are numerically more difficult to treat and thus sometimes excluded from statistics [1]. Moreover, we discuss conceptual difficulties associated to velocity pdf with heavy tails towards low velocities: Ensemble averages of the deformation gradient tensor do not converge under these conditions when taken them at equal advective distances, as opposed to at equal times. As a consequence, the meaning of the steady state stretching rate must be discussed in the context of long memories. Using Continuous Time Random Walks (CTRW) we derive analytical expressions for the averages and discuss low velocity cutoffs to guarantee convergence. We further discuss the nature of the pre-asymptotic stretching kinematics, which can have a dominant effect on mixing processes. We show that the strength of the transient is controlled by the typical shear rate while the duration is determined by the Lyapunov exponent. Weaker chaotic stretching are associated to a longer lasting transient regime.

[1]: Turuban et al. (2019) In: JFM 
[2]: Heyman et al. (2020) In: PNAS

How to cite: Maeritz, M., Heyman, J., Le Borgne, T., and Dentz, M.: Effect of velocity fluctuations on pore scale stretching kinematics in 3D porous media, EGU General Assembly 2024, Vienna, Austria, 14–19 Apr 2024, EGU24-17262, https://doi.org/10.5194/egusphere-egu24-17262, 2024.

EGU24-18015 | ECS | Orals | HS8.1.2

Linking biogeochemical potential to depositional processes 

Vitor Cantarella, Adrian Mellage, and Olaf Cirpka

Biogeochemical reactions are microbially mediated chemical reactions that occur naturally in the subsurface, involving naturally occurring and anthropogenically enriched reactants as well as microbes. These reactions play a crucial role in determining the fate of reactive solutes in groundwater. In Quaternary aquifers, the depositional (sedimentological) processes modulate the composition of the sedimentary matrix, leading to strong spatial variability in both hydraulic and reactive properties. For example, the presence or absence of reduced minerals or organic matter in the sediment matrix determines its “reactivity” with respect to oxidized reactants, auch as dissolved oxygen and nitrate. Additionally, the depositional processes determine properties relevant to groundwater flow, notably the hydraulic conductivity. In this work, we attempt to link depositional processes and the physico-chemical makeup of sediment matrices with the ability of an aquifer to naturally attenuate electron acceptors. We focus on nitrate and denitrification as dissolved electron acceptor and associated biodegradation pathway, respectively. Traditional numerical modeling approaches that account for physical heterogeneity in reactive transport rely on geostatistical methods using, e.g., multi-Gaussian random fields, and often fall short in capturing the link to the geological generating processes. We propose the use of object-based modeling to realistically represent the subsurface's physical characteristics and bridge the gap between geology and biogeochemical potential. Object-based models depict various sedimentary features as 3-D geometries (geo-bodies) within a hierarchical framework. On the largest spatial scale, the model represents strata, corresponding to the sedimentary deposition setting. Within each stratum, facies elements (with internal structure such as crossbedding or layering) representing architectural elements, such as channels or scour-pool fills, are assigned. We illustrate the construction of an object-based aquifer scale groundwater flow model informed via sedimentological descriptions (core logs), integrating field and lab-derived information. Furthermore, we apply a travel-time based reactive transport modelling approach to quantify the effect of the realistic distribution of reactive sedimentary faces on the extent of denitrification. We expect our ongoing analysis to shed light on the quantitative link between the sedimentological architecture of an aquifer and its denitrification potential.

How to cite: Cantarella, V., Mellage, A., and Cirpka, O.: Linking biogeochemical potential to depositional processes, EGU General Assembly 2024, Vienna, Austria, 14–19 Apr 2024, EGU24-18015, https://doi.org/10.5194/egusphere-egu24-18015, 2024.

EGU24-80 | ECS | Posters on site | HS8.1.3 | Highlight

Evaluating polydisperse particles transport and clogging in porous media during artificial groundwater recharge by pore-scale observation and column experiments 

Shuyao Niu, Longcang Shu, Zhike Zou, Lei Yu, Yalong Li, Yuan Chen, and Zhe Wang

Artificial groundwater recharge utilizing stormwater is an effective tool to reduce urban flooding and artificially increase groundwater resources. However, porous media clogging due to the solid polydisperse particles carried in stormwater severely restricts the application of recharge technology. In addition, solid particles play a crucial role in aquifer contamination. If particles are easily transport in groundwater flows, they can act as contaminant carriers to facilitate the movement of contaminants. Conversely, if particles cause porous media clogging, they can form barriers that prevent contaminant migration. While the transport and clogging mechanism of particles has been explored by many macroscopic physical experiments, the intrinsic connection between the deposition behavior of particles in pore scale and the macroscopic presentation of clogging phenomenon remains unclear. In this study, laboratory-scale sand column experiments were combined with scanning electron microscopy (SEM) observations to explore the effect of polydisperse particle size on the mechanism of particle transport and clogging. The median particle sizes (dp50) of the polydisperse particles used in the experiments were 0.66, 4.05, and 11.83 μm, respectively. The interaction energy between particles and porous media grains was calculated using XDLVO theory, indicating that the experiments were conducted under unfavorable condition. The sand column experiments revealed that the influence of large particles on the porous media permeability is limited to shallow layers, and small particles are more likely to transport to deeper layers. Particles with dp50=0.66 μm were tend to form aggregates, reducing particle recovery rate and promoting clogging. The pore-scale observations illustrated that the vast majority of the particles are preferentially deposited in concave regions of the media grain surface. The larger the particle size, the higher the proportion of deposition in concave regions. Due to the different transport mechanisms of particles in pore space, the ratio of dp50 to porous media grain size is not the only basis for identifying the type of clogging. The results proved that the particles with dp50=0.66 μm can form mixed clogging faster than particles with dp50=4.05 μm. The proposed results provide a reference for the theoretical study of the particle transport and deposition mechanism, the prevention and control of aquifer pollution, as well as the development of more effective artificial groundwater recharge scheme.

How to cite: Niu, S., Shu, L., Zou, Z., Yu, L., Li, Y., Chen, Y., and Wang, Z.: Evaluating polydisperse particles transport and clogging in porous media during artificial groundwater recharge by pore-scale observation and column experiments, EGU General Assembly 2024, Vienna, Austria, 14–19 Apr 2024, EGU24-80, https://doi.org/10.5194/egusphere-egu24-80, 2024.

Efficient and scalable nano-adsorbents have emerged as promising solutions for vast anthropogenic environmental contamination, demonstrating high capacities in removing heavy metal cations and oxy-anions. However, their widespread adoption raises critical questions about the safe disposal and long-term environmental impact. We delved into the fate of contaminant-sorbed nano-adsorbents in soil and landfill conditions, addressing concerns such as desorption, dissolution, and the release of toxic constituents. Our research explores various nanocomposites for their toxic ions sorption capacities, and redox-transformation/degradation capabilities along with distinct contaminant removal mechanisms. Furthermore, we have tried to investigate their soil fractionation and leaching behaviors through a sequential leaching approach in simulated landfill conditions to comment on long-term fate and process sustainability.

Results suggest that to assess the environmental applicability of nanocomposites, it's crucial to consider the long-term fate of adsorbent wastes post-contaminant removal. Understanding soil fractionation and leaching in landfills informs disposal strategies, minimizing environmental risks. Redox-active nanoparticles limit recyclability due to strong binding, favoring safe disposal. Conversely, weak binders like layered double hydroxides allow for contaminant recovery and potential reuse.

How to cite: Khandelwal, N.: Nanoadsorbents for Pollutants Cleanup: Balancing Efficiency and Environmental Sustainability, EGU General Assembly 2024, Vienna, Austria, 14–19 Apr 2024, EGU24-235, https://doi.org/10.5194/egusphere-egu24-235, 2024.

Microplastics are tiny plastic particles, less than 5 millimetres in size and their access to food chain have a significant hazard to ecosystems and environmental health. Their concern also extends to drinking water and our limited understanding of their occurrence in groundwater aquifers poses a potential research gap. Our preliminary investigation suggests the presence of microplastics in groundwater samples from near vicinity of Ganga Channel and subsequently, 60 groundwater samples were collected for the detailed study from Devprayag (Uttarakhand) to Gangasagar (West Bengal), India. This is the first study that investigates the distribution and quantification of microplastics from the groundwater aquifers influenced by Ganga River water, the largest fresh water source in Northern India. The water samples are filtered through 0.45-micron size nitrocellulose filter membrane and the residue is visually inspected under a stereo microscope. Further, the abundance, type, and size of MPs were determined by micro-Raman spectroscopy following a well-established and quality-controlled analytical route. The findings indicate the presence of microplastics (MPs) in all samples, with Polyethylene (PE), Polypropylene (PP), and Polyvinyl chloride (PVC) identified as common types in each sample. Various shapes of microplastics, such as fibres, fragments, films, and foam, were detected. MPs with size less than 150 µm are significantly abundant, likely owing to their mixing in ground water through the infiltration from surface waters. Contamination of groundwater with microplastics (MPs) poses a significant health risk, especially given its importance as a crucial source for drinking and irrigation. If this problem left untreated or if concentrations of MPs continue to rise, this has the potential to evolve into a man-made disaster.

How to cite: Chaudhary, N. and Maurya, A. S.: Microplastic Contamination in Groundwater Aquifers along the Ganga River Basin: A Comprehensive study from Devprayag to Gangasagar, India, EGU General Assembly 2024, Vienna, Austria, 14–19 Apr 2024, EGU24-1140, https://doi.org/10.5194/egusphere-egu24-1140, 2024.

Geographic Information System (GIS), a computer-based technique is used in groundwater management, especially for the estimation of groundwater vulnerability to contamination. The objective of the present study was to delineate the groundwater contamination zones around the Sewage Farm using Geographic Information System. The study area lies between North Latitude 8° 26ʹ 26ʺ to 8° 29' 29" and East Longitude 76° 54ʹ 51ʺ to 76° 57ʹ 33ʺ. Inverse Distance Weighted Method (IDW) interpolation technique was used for the delineation of groundwater pollution zones in the study area. The sampling locations were mapped with the help of Survey of India toposheet of the scale 1:25000 and a handheld Global Positioning System (GPS). Groundwater pollution (stress) zonation in the study area was done on the basis of the selected water quality parameters of 42 groundwater samples (29 dug wells and 13 tube wells) during pre-monsoon, monsoon and post-monsoon seasons. The highly significant water quality parameters selected for the present study included pH, total dissolved solids (TDS), total hardness (TH), total alkalinity (TA) and total coliforms (TC). TC was given more weightage among the selected parameters. Based on the analysis, the entire study area was classified into three distinct zones, viz., low, moderate and high pollution zones. The results of the present study suggested that the extent of groundwater pollution was relatively lower during monsoon, compared to pre-monsoon and post-monsoon seasons, which might be a reflection of enhanced dilution due to heavy monsoon rainfall occurring in the region. Further, during post-monsoon and pre-monsoon seasons, the areal extent of high pollution zone showed close similarity. From the GIS-based analysis for the delineation of groundwater pollution zones over the area, it was inferred that multiple sources such as Sewage Farm, leachates from soak pits/septic tanks and Parvathy Puthanar, a man-made canal, governed the deterioration of groundwater quality in the study area.

How to cite: Varghese, J. and Divakaran Sarasamma, J.: Delineation of Groundwater Pollution Zones around Sewage Farm in the coastal area of Kerala, South India using Geographic Information System Technique, EGU General Assembly 2024, Vienna, Austria, 14–19 Apr 2024, EGU24-2351, https://doi.org/10.5194/egusphere-egu24-2351, 2024.

EGU24-2372 | ECS | Posters virtual | HS8.1.3

Geochemical characteristic of springs of the East of Moscow region 

Daria Gusarova

The study determined the geochemical characteristics of the spring waters of the Bogorodsky and Losino-Petrovsky districts in the east of Moscow region. The territory located on the Meshchera Lowland, within the development of Devonian, Upper Carboniferous, Upper Jurassic and Lower Cretaceous terrigenous-carbonate rocks, overlain by thin Quaternary sandy deposits.[1]

Surface sediments are permeable to precipitation and unregulated technologically polluted surface runoff, which can lead to a decrease in the quality of groundwater, which is actively used by the population as drinking water.

This research is the results of evaluated of water parameters (COD, pH, electrical conductivity), the content of major ions (Ca2+, Mg2+, Na+, K+, NH4+, HCO3-, Cl-, SO42-, NO3-) and microelements (Co, Ni, Cu, Zn, Cd, Pb, Sr, Ba, Mn) for 12 springs. The waters are slightly acidic-near-neutral (pH 5.5-7.5) with the mineralization from 0.07 to 0.5 g/l, the total hardness is 0.63-5.7 mg-eq/l, the composition of the water is variable.

The spring waters are slightly mineralized (M=0.1-0.5 g/l), pH values vary from 5.5 to 7.5.  The obtained data on the content of main ions make it possible to divide the waters of the studied springs into several groups. Spring waters are divided into four groups: Cl-SO4-HCO3-(Mg)-Ca; (SO4)-HCO3-Cl-Na-Ca; (Cl)-HCO3-Ca; and mixed composition. Elevated concentrations of nitrate ions are consistently observed in water all of springs (averaging 7-9, up to 17% eq). The chemical oxygen demand (COD) averages 2.1 mgO/l, reaching a maximum of 12-18 mgO/l.

Based on the thermodynamic calculation using the Visual-MINTEQ, it was found that the predominant migration forms of Ba, Sr, Mn, Zn, Cd, Ni, Co in the waters in the waters of the surveyed springs are free ions. For Cu, Zn and Pb, the factors for the formation of migration forms are the predominant anions of water, as well as the presence of organic matter in water. For Cd an additional factor of formation of migration forms is chloride-anion.

COD values and nitrogen compound in the waters of individual springs are indicate that the formation of the composition of spring waters is associated with the infiltration of atmospheric precipitation through the modern sediments subject to anthropogenic press.

The values of other sanitary-chemical indicators (mineralization, pH, total hardness, chlorides, sulfates, magnesium, sodium, manganese), the content of standardized microelements are lower than their maximum permissible concentrations in drinking water.


1. Makeev V.M., Sukhanova T.V., Makarova N.V., Korobova I.V. Geological and geomorphological structure and geoecological conditions of Noginsky-Klyazminsky district of Moscow region // Geoecology. Engineering geology. Hydrogeology. Geocryology. - 2019. - N. 4. - P. 68-78. doi: 31857/S0869-78092019468-78

How to cite: Gusarova, D.: Geochemical characteristic of springs of the East of Moscow region, EGU General Assembly 2024, Vienna, Austria, 14–19 Apr 2024, EGU24-2372, https://doi.org/10.5194/egusphere-egu24-2372, 2024.

Micro-organic contaminants in groundwater harm the environment and human health. They result from current human activities and past pollution. A study in the Palancia River Basin examined the occurrence and concentrations of these contaminants in water. In this study, 10 groundwater and 10 surface water samples were collected, analyzing a total of 100 contaminants for this study. Carbamazepine and caffeine indicate urban pollution, while pesticides and their metabolites (terbuthylazine, desethylterbuthylazine, metolachlor, simazine, propazine) mainly signal crop production. All chosen MO were found in both the aquifer and Palancia River. In groundwater, the most common were terbutylazine (detected in 50 % with a max concentration of 101.0 ng L−1), carbamazepine (40%, 50.0 ng L−1), and desethylterbuthylazine (35%, 15.0 ng L−1). In addition to the selected contaminants identified as indicators of pollution, up to 18 different pesticides, 12 pharmaceuticals, and various industrial-origin products were found. Comparisons with global studies suggest concentrations reflect the specific land use in recharge areas.

Acknowledgements.- This work has been supported by Grant PID2022-138556OB-C22 funded by MCIN/AEI/10.13039/501100011033 and by “ERDF A way of making Europe”

How to cite: Picó, Y. and Andreu, V.: Spatial distribution characteristics and analysis of groundwater pollution in the Palancia River Basin, EGU General Assembly 2024, Vienna, Austria, 14–19 Apr 2024, EGU24-4742, https://doi.org/10.5194/egusphere-egu24-4742, 2024.

EGU24-5013 | ECS | Posters on site | HS8.1.3

Reaction Mechanisms of Simultaneous Removal for Nitrate and Phosphate in Groundwater Using Ca-citrate Complex 

Jiyoung Kang, Soyeon Lim, and Sung-Wook Jeen

Ca-citrate complex has been proposed as a substance capable of simultaneously removing both nutrients (i.e., nitrate and phosphate), which may lead to serious environmental issues such as eutrophication. Citrate serves as a carbon source for denitrification process, and calcium precipitates to form phosphate minerals. The purpose of this study was to comprehend the mechanisms involved in the removal of nitrate and phosphate. In this study, column experiments were conducted to simulate the simultaneous removal of nitrate and phosphate. Upon injecting the Ca-citrate complex into the column, both nutrients were eliminated. In the process, bacterial communities in the soil and effluent were investigated to identify removal mechanism for nitrate. The bacterial communities significantly differed between the soil and the effluent. The bacteria in the soil (Bacillus, Enterobacter, and Arthrobacter) were primarily involved in processes of NO3 or NO2 reduction, while those in the effluent (Pelosinus, Azospirillum, and Pseudomonas) carried out the complete denitrification process. These results suggested an active denitrification process in the column, resulting in the complete removal of nitrate to N2 gas. Meanwhile, in order to identify the removal mechanism of phosphate, phosphate minerals for the soil samples after the reactions with Ca-citrate complex were observed using electron probe micro analysis (EPMA). In the raw soil, silicate minerals were abundant, including quartz and plagioclase feldspar group such as anorthite, oligoclase, and orthoclase. Silicon (Si), oxygen (O), and aluminum (Al) were abundantly distributed throughout the scanned area, supporting that the presence of silicate minerals. On the other hand, for the soil after 24 hours of the reaction, phosphate minerals found included hydroxyapatite (Hap), calcium-deficient hydroxyapatite (CDHA), and amorphous calcium phosphate (ACP). The Ca/P molar ratio was a range of 1.61–1.66, supporting that the phosphate was removed by precipitation of Hap. Moreover, CDHA and ACP serve as intermediaries in Hap crystallization, indicating that the experimental environment was in Hap formation phase. After 120 hours, anapaite was observed in the soil, which is a type of Ca-Fe-P-mineral. In this study, the experimental condition was a highly reducing environment, as indicated by the changes of iron concentration. Ultimately, phosphate was precipitated with calcium and iron. The EPMA results indicate that Ca-citrate can remove the phosphate by precipitation of phosphate minerals (e.g., hydroxyapatite, amorphous calcium phosphate, and anapaite). This study concluded that the simultaneous removal mechanisms for nitrate and phosphate involved denitrification and precipitation by the Ca-citrate complex.

How to cite: Kang, J., Lim, S., and Jeen, S.-W.: Reaction Mechanisms of Simultaneous Removal for Nitrate and Phosphate in Groundwater Using Ca-citrate Complex, EGU General Assembly 2024, Vienna, Austria, 14–19 Apr 2024, EGU24-5013, https://doi.org/10.5194/egusphere-egu24-5013, 2024.

EGU24-9002 | Posters on site | HS8.1.3

Batch experimental results about the occurrence and fate of Gadolinium in aquifers   

Estanislao Pujades, Mert Çetin Ekiz, Laura Scheiber, Anna Jurado, Maria Izquierdo, Enric Vázquez-Suñé, and Jan Willem Foppen

The use of groundwater as a freshwater source must be increased to mitigate the increasing pressure over water resources, resulting from growing population and climate change. However, many aquifers are commonly polluted by a wide range of anthropogenic substances, especially those aquifer located in urban areas. Therefore, to use groundwater resources safely, it is needed to establish the presence and fate of pollutants that can endanger human health. This is the case of Gadolinium. Integrated in Gadolinium-based contrast agents it is harmless and used for medical purposes, but it can cause serious health issues when released in the environment.

This research arose during a water sampling campaign undertaken in Barcelona where Gadolinium anomalies (i.e., resulting from anthropogenic activities) were detected in surface and underground water bodies which were hydraulically connected. What was striking was that Gadolinium pollution in groundwater bodies was less frequent and at lower concentrations than in surface water bodies. These observations suggested that Gadolinium was attenuated during its transport through the subsurface. To establish the mechanisms controlling the attenuation of Gadolinium, laboratory based batch experiments were carried out and then modelled using PHREEQC. Experimental results suggested that main process affecting the concentration of Gadolinium was sorption which could reduce considerably its presence in groundwater. Our results contribute to understanding the fate of anthropic Gadolinium in aquifers which is of paramount importance to use groundwater safely.

How to cite: Pujades, E., Ekiz, M. Ç., Scheiber, L., Jurado, A., Izquierdo, M., Vázquez-Suñé, E., and Foppen, J. W.: Batch experimental results about the occurrence and fate of Gadolinium in aquifers  , EGU General Assembly 2024, Vienna, Austria, 14–19 Apr 2024, EGU24-9002, https://doi.org/10.5194/egusphere-egu24-9002, 2024.

EGU24-9139 | ECS | Posters on site | HS8.1.3

PASSIVE SAMPLING OF POLYCHLORINATED BIPHENYLS (PCB) IN POLLUTED KARST GROUNDWATER; Study case: Krupa, Slovenia  

Anja Koroša, Nina Mali, and Primož Auersperger

Polychlorinated biphenyls (PCBs) are synthetic organic compounds (209 possible isomers) of high physical, chemical and biological stability, and persist for long periods in a contaminated environment: they are undegradable (Hutzinger et al., 1974). They are biotoxically active compounds, and in animals and people cause acute and chronic damage to the skin, liver and lungs. In addition they cause metabolic disorders and disturbances to the action of the endocrine system, and are associated with loss of bodyweight and immuno-sensitivity. They are mutagenic and teratogenic, and are suspected to be carcinogenic (Safe, 1984). In Slovenia was an increase in use of PCBs after 1960. Between 1962 and 1983, a capacitor manufacturer disposed of PCB contaminated oil in the karstic region of Bela Krajina where it contaminated the spring of the Krupa River. The PCB pollution problems in karstic area of Krupa River are related to sinking surficial streams that mix with the regional groundwater supply, thus endangering the quality of the groundwater reservoirs.


The PCB pollution of the Krupa River drew the public’s attention to the chemical burden of Slovenians, and the demand for studies has been rising since. This study presents the application of the passive sampling technique for monitoring PCBs within the Krupa spring. Monitoring programmes for groundwater are largely based on the collection of grab (spot) samples. One of the methods used for such studies can also be passive sampling. Contrary to grab sampling, passive sampling is less sensitive to accidental extreme variations of the organic pollutant concentration in natural waters and it also allows for a large range of contaminants to be detected at once. A passive sampler can cover a long sampling period, integrating the pollutant concentration over time. Passive samples were analyzed by gas chromatography mass spectrometry (GC-MS). For the interpretation of chromatograms, the AMDIS deconvolution was used. The deconvolution was covered by the GC-MS library with retention times for 921 organic contaminants from Agilent USA, as well as by the NIST 2008 library of mass spectra.

The legacy of the PCB pollution of the Krupa River in Bela krajina is still measurable and passive sampling with active carbon fibres was proved to be an appropriate method for monitoring PCB pollutants in groundwater.

How to cite: Koroša, A., Mali, N., and Auersperger, P.: PASSIVE SAMPLING OF POLYCHLORINATED BIPHENYLS (PCB) IN POLLUTED KARST GROUNDWATER; Study case: Krupa, Slovenia , EGU General Assembly 2024, Vienna, Austria, 14–19 Apr 2024, EGU24-9139, https://doi.org/10.5194/egusphere-egu24-9139, 2024.

EGU24-9232 | ECS | Orals | HS8.1.3

Geochemical tracers reveal urban-derived contamination of groundwater and springs in Gulu city, Uganda 

George J. L. Wilson, Rajabu Hamisi, Timna Denwood, Derick Muloogi, Prosun Bhattacharya, Expedito Nuwategeka, Daren C. Gooddy, David A. Polya, Jonathan J. Huck, and Laura A. Richards

Groundwater is consumed by over 2 billion people worldwide, though it is susceptible to microbial and chemical contamination (Alley et al., 2002; Parker et al., 2010). In East Africa, as in many places, displacement from rural to urban areas increases stress on local infrastructure including water and sanitation (UNCDF, 2018). In this study, we utilise wastewater tracers to examine urban-derived inputs to groundwater under rapidly developing urban areas in Gulu District, Northern Uganda. Bulk and fluorescent dissolved organic matter (DOM), microorganisms (total coliforms and E.coli) and inorganic tracers of anthropogenic waste (NO3, SO42–, Cl/Br) were characterised from boreholes (from 3–76 m depth; n = 113), protected springs (n = 20) and surface water from handpump drainage pools (n = 2; Richards et al., 2023). Our results indicate that NO3 was elevated in water sources in the Gulu city urban area and the Cl/Br ratio was elevated in springs, compared to concentrations in the more rural Aswa County area (p < .05; both). Interestingly, human and animal waste indicators E.coli and Tryp:FA ratios (Baker, 2002) displayed no significant difference between the rural and urban settings (p > .05). Some construction and maintenance-related aspects of the boreholes, as spot assessed by sanitary risk observations, did not apparently correspond to the indicators of microbial contamination. Rather, results suggest that DOM prevalence is primarily depth controlled in Gulu District. We considered the distribution of organic, inorganic and microbial analytes with regards to the potential source and fate of contaminants. As the population of many urban areas increase, this study offers valuable insights useful for water management planning.

Acknowledgements

A Dame Kathleen Ollerenshaw Fellowship is acknowledged for LAR and for GJLW’s PhD studentship. A UKRI-GCRF-Newton-ODA 2022-2023 Award via UoM to LAR et al. supported this project. We thank field support from Nancy Aromo and Monica Adokorach (Gulu University). 

References

Alley, W.M., Healy, R.W., LaBaugh, J.W., Reilly, T.E., 2002. Flow and storage in groundwater systems. Science 296, 1985–1990.

Baker, A., 2002. Fluorescence properties of some farm wastes: Implications for water quality monitoring. Water Res. 36, 189–195. https://doi.org/10.1016/S0043-1354(01)00210-X

Parker, A.H., Youlten, R., Dillon, M., Nussbaumer, T., Carter, R.C., Tyrrel, S.F., Webster, J., 2010. An assessment of microbiological water quality of six water source categories in north-east Uganda. J. Water Health 8, 550–560. https://doi.org/10.2166/wh.2010.128

Richards, L.A., Wilson, G.J.L., Wu, R., Muloogi, D., Hamisi, R., Denwood, T., Nuwategeka, E., Bhattacharya, P., Huck, J., Polya, David A., 2023. Water Quality in East Africa: Bringing Together Traditional Monitoring, Community Science and Artificial Intelligence Approaches. Presented at the AGU Annual Meeting 2023, San Francisco.

UNCDF, 2018. Local Assessment for Equitable Growth in Gulu and Mbale Municipalities, Uganda. UN Capital Development Fund, New York.

How to cite: Wilson, G. J. L., Hamisi, R., Denwood, T., Muloogi, D., Bhattacharya, P., Nuwategeka, E., Gooddy, D. C., Polya, D. A., Huck, J. J., and Richards, L. A.: Geochemical tracers reveal urban-derived contamination of groundwater and springs in Gulu city, Uganda, EGU General Assembly 2024, Vienna, Austria, 14–19 Apr 2024, EGU24-9232, https://doi.org/10.5194/egusphere-egu24-9232, 2024.

EGU24-11014 | ECS | Posters virtual | HS8.1.3

Improvement of contaminant retention with the use of biochar in the groundwater infiltration basin of Korba (Tunisia) 

Claude Hammecker, Hadhemi Maalaoui, Asma Hmaied, and Fethi Lachaal

The overexploitation of the Korba aquifer (Cap Bon, North Tunisia) has led to the drawing down of its static water level and the degradation of its quality due to the intrusion of saline water from the sea. To address this situation, treated wastewater is used for the artificial recharge of the aquifer through three infiltration basins.
Treated wastewater is known to carry various emerging contaminants and pharmaceuticals as they are often not retained in traditional wastewater treatment plants. To tackle this problem the use of biochars is often recommended to conduct a second stage low-cost decontamination strategy. Indeed, biochar can be produced easily at a low cost, with different agricultural residues. In this study, the impact of biochar derived from Rosemary, Bamboo, St. John's Wort, Olive, Cypress, and Palm Trees on the mobility and retention of emerging contaminants was evaluated.

The first stage of this work was to evaluate the potential retention capacity of the different biochars produced in a low-cost metallic kiln with local biomass residues. Therefore we used Methylene Blue (MB) as a proxy for organic contaminants to establish adsorption isotherms to quantify their respective specific surface area and adsorption capacities.

The adsorption isotherms at 20°C were established to evaluate their respective specific surface areas and were fitted to different adsorption models.
The surface functional groups of biochars were characterized by FTIR spectroscopy.
The analysis of the results showed that the biochar obtained from Rosemary, Bamboo, and St. John's Wort exhibited remarkable elimination and better adsorption capacity with values of 1.6g/L for Rosemary, 0.4g/L for St. John's Wort, and 0.2g/L for Bamboo. An average adsorption capacity was observed with 0.09g/L for Cypress, 0.055g/L for Olive, and low adsorption with a value of 0.03g/L for traditional Olive and Palm Trees.

The second stage was to test the dynamic retention properties of biochar on soil monolith experiments, where the MB elution curves were analyzed with and without the addition of biochar. The presence of biochar in the soil monoliths drastically reduced the retention of MB, demonstrating its efficiency as an adsorbent filter. These results underscore the strong potential of biochar in water treatment to enhance quality by reducing pollution.

How to cite: Hammecker, C., Maalaoui, H., Hmaied, A., and Lachaal, F.: Improvement of contaminant retention with the use of biochar in the groundwater infiltration basin of Korba (Tunisia), EGU General Assembly 2024, Vienna, Austria, 14–19 Apr 2024, EGU24-11014, https://doi.org/10.5194/egusphere-egu24-11014, 2024.

EGU24-12147 | ECS | Orals | HS8.1.3

Biocides in urban groundwater – modeling entry pathways at a district level  

Felicia Linke, Dimitrios Skodras, Hannes Leistert, Felix Zimmermann, and Jens Lange

Biocides leached from facades can reach urban groundwater, where they can have adverse environmental impacts. They are used in film preservatives and enter groundwater via swale-trench systems or diffuse pathways. However, there is little information on occurring biocide loads along different pathways to urban groundwater. The aim of this study is to quantify the input, transport and degradation of biocides to groundwater via different pathways, namely infiltration (1) in swale-trench systems, (2) adjacent to facades via vegetated soils, and (3) through permeable pavements. The study area (38ha) is located in the city of Freiburg, south-west Germany. There are a number of groundwater monitoring wells due to a chlorinated hydrocarbon (CHC) contamination site. Three biocides (diuron, octylisothiazolinone, terbutryn) and various transformation products were detected in groundwater during nine events over a six-year sampling period. In addition, more than a decade of groundwater level data and biannual sampling data from the CHC plume are available. Biocide concentrations in groundwater are assessed through the combination of four models. First, biocide leaching from facades is quantified (COMLEAM). Second, a water balance model (RoGeR_WB_Urban) calculates water infiltration into the swale-trench system and in the remaining district. Third, the results are combined to calculate biocide leaching through the soil at a depth of 1m (FOCUS-PELMO). This leachate forms the input to a groundwater flow and transport model (MODFLOW with MT3D-USGS). Terbutryn, a commonly used biocide, is chosen as the model compound. Concentrations in groundwater are modeled in daily time steps covering a period of more than two years at a spatial resolution of 5x5m. CHC measurements are used to calibrate the groundwater model. Additional biocide measurements on the facades and in the swale water help to validate the model chain. A first scenario assumes that all biocides enter groundwater via the swale-trench systems but overestimates the measured biocide concentration in groundwater by a factor of 15. A second scenario also includes diffuse pathways via vegetated soils and permeable pavements and more realistically reproduces measured terbutryn concentrations in groundwater in the range of a few ng/l. These results suggest that the diffuse entry of biocides via vegetated soils and permeable pavements is important at the urban district scale.  Hence, end of pipe measures to prevent biocide leaching into groundwater have limited efficiency in swale infiltration systems, biocide use should rather be avoided at the source.

How to cite: Linke, F., Skodras, D., Leistert, H., Zimmermann, F., and Lange, J.: Biocides in urban groundwater – modeling entry pathways at a district level , EGU General Assembly 2024, Vienna, Austria, 14–19 Apr 2024, EGU24-12147, https://doi.org/10.5194/egusphere-egu24-12147, 2024.

In developing countries like India, a tremendous thrust is observed on installation of sewage and septage treatment, which is an essential requirement for environmental protection . However, many cities, urban and rural areas do not have proper sewerage network facilities and subsequent sewage treatment plants. Septic tank, twin-pit toilets, etc. are the onsite soltions of wastewater management. In this context, the major chalanges is associated with the safe disposal of treated/partially treated sludge of onsite treatment facilities to prevent environmental pollution from highly contaminated faecal sludge or septage.

Faecal sludge treatment plant with different technologies are adopted in different areas, although a pronounced challenge is associated with the efficacy, economy, land requirement and effluent quality meeting the desired effluent or discharge standard. In the present research, a novel “Enhanced Digestion and Multi-Stage Bioreactor (EDMSB)” is developed as an efficient and cost effective technolgy with less plant foot print  (Indian Patent No: 202331055337).

EDMSB is based on advanced hybrid system of anaerobic digestion for sludge and solid-liquid separation followed by moving bed bio-reactor based aerobic treatment associated with inclied plate-settler and denitrifyning unit for the treatment of supernatant water. Suitable pre- (screen, non-degradable fraction and scum removal unit) and post-treatment (multi-grade filtration, activated carbon filtration and ozonation) are provided to enhance the treatment facility and to meet the reuse/disposal standard. The novelty of the proposed invention lies in its unit design and appropriate process flow circumscribing compactness, modular arrangement, cost effectiveness, efficiency and space saving set up. The system is capable to handle the variation of faecal sludge characteristics, i.e., fresh faecal or partially/mineralized sludges from septic tanks with cleaning intervals of wide variation. EDBSM exhibited a significant efficiency (BOD >99%, COD >99%, TSS >99%, Faecal coliform >99%, TKN>98%) for the high pollunat load of fresh faecal or septage. In addition, the proposed system has also established a significant reduction of cost (Capital cost~60% and operation cost~70%) and land requirement (> 80%) compared to other popular technologies like phytorid based system. The units of proposed inventions are completely odorless as compared to other technologies adopted in field and free from flying nuisance which creates a better working environment for the plant operators and maintains an immaculate surrounding environment. The stabilized sludge volume is very low which creates a significant reduction in the sludge handling facility. The quality of digested sludge ensures its use as good manure. The present invention brings an significant advancement in faecal sludge and septage management, which can be adopted in various developing countries like India as an efficient, cost-effective and space saving opportunity in this field.     

Keywords: Faecal sludge and septage management, Anearobic digestor, Moving bed bio-reactor, Environmental pollution, Aerobic and anaerobic treatment 

How to cite: Sahu, S. and Ghosal, P. S.: Development of Enhanced Digestion and Multi-Stage Bioreactor (EDMSB) reactor for faecal sludge and septage treatment: A pragmatic low-cost and space saving robust technical solution for developing countries , EGU General Assembly 2024, Vienna, Austria, 14–19 Apr 2024, EGU24-16525, https://doi.org/10.5194/egusphere-egu24-16525, 2024.

EGU24-16966 | ECS | Orals | HS8.1.3 | Highlight

Urban context remediation: a targeted and sustainable hydrogeochemical technique to face chlorinated solvent plumes 

Giulia Felli, Paolo Ciampi, Carlo Esposito, Christian Nielsen, Laura Ledda, and Marco Petrangeli Papini

In urban contexts where contamination persists in areas with limited accessibility, the use of sustainable and non-invasive remediation technologies becomes crucial to effectively address and mitigate environmental risks. The presence of chlorinated solvents in the environment raises significant concerns due to their persistent nature and potential health risks. These solvents, characterized by high density and limited solubility, are classified as DNAPLs (dense non-aqueous phase liquids). During their downward migration, they tend to become trapped in the microporosities of saturated and unsaturated zones, persisting in an adsorbed form. This phenomenon results in a gradual and slow-release secondary source, which contributes to the formation of long lasting contamination plumes. This study focuses on a heavily anthropized area affected by chlorinated solvents. In particular, this paper outlines a meticulous approach to remediating a tetra-chloroethylene (PCE) plume within an urban district characterized by a complex hydrological context and limited accessibility. The process included fundamental steps. Initially, an integrated geodatabase was reconstructed, combining all hydrogeochemical characterization data such as geological borehole, membrane interface probe (MIP) investigations, and chemical analyses on water samples. This facilitated detailed geomodelling, merging geological and hydrochemical information to reveal the hydrogeological structure of the subsurface, providing valuable information on groundwater quality and the evolution of the contamination plume. In addition, the incorporation of high-resolution site characterization data obtained with the MIP technique improved and parameterized the multi-source model. The fusion of the hydrogeological and physico-chemical data culminated in the development of a comprehensive conceptual site model (CSM). The CSM functions as a robust, data-driven decision support system that enables the design and customisation of two innovative and non-invasive remediation technologies. These technologies include coaxial groundwater circulation (CGC) wells with air sparging (AS) for the removal of chlorinated solvents from environmental matrices into a gaseous stream that is treated at the surface, and the injection of micrometric zero-valent iron (S-MicroZVI®) and colloidal activated carbon (PlumeStop®) to enhance chemical reduction and adsorption in situ. Hydrochemical monitoring serves as a valuable tool to unveil the intricate dynamics involved in decontamination processes. As a result, the physical approach reveals the efficacy of contamination containment, while the chemical-biological approach demonstrates the potential to reduce contaminant concentrations in urban groundwater. These results underline the importance of remediation geology via a coupled hydrogeochemical methodology to address complex contamination scenarios. This approach is key to shaping an efficient remediation strategy and promoting innovative, adaptable, sustainable, and effective solutions specifically designed for remediation actions in urban industrialised areas.

How to cite: Felli, G., Ciampi, P., Esposito, C., Nielsen, C., Ledda, L., and Petrangeli Papini, M.: Urban context remediation: a targeted and sustainable hydrogeochemical technique to face chlorinated solvent plumes, EGU General Assembly 2024, Vienna, Austria, 14–19 Apr 2024, EGU24-16966, https://doi.org/10.5194/egusphere-egu24-16966, 2024.

The adsorptive removal of pollutant is a widely applicable process in environmental engineering. The major issue associated with many promising adsorbents is their low hydraulic conductivity, which renders their applicability in column based field level operation despite of their proved efficacy in batch mode in the laboratory. In this context, development of a novel sequential batch type reactor (SBTR) in the field of adsorption has shown its applicability in continuous operation using the benefits of the adsorbent characteristics in batch mode (Indian Patent No: 416891).

In the present study, SBTR was applied on fluoride removal from water by two adsorbents, viz. calcined Ca-Al-(NO3) layered double hydroxide and Alumina Olivine Composite. Those adsorbents could not be used for column study due to their fine particle size and low hydraulic conductivity, although their adsorption capacity was found high in batch study. In the continuous operation, the assessment of time for filling, batch scale adsorption reaction, separation of adsorbent by settling, collection of treated water and taking out of the adsorbent from reactor is computed from the batch scale preliminary studies. The cycle of fill (4 h), batch adsorption reaction (4 h) and separation, collection etc. (4 h) was considered. Three numbers of the tank are taken in parallel. The adsorption studies in the SBTR were conducted for various adsorbent dose, concentration, time, agitation rate, etc. The reactor can bring down the fluoride from 10 mg/L to below the standard at an agitation rate of 500 rpm and an adsorbent dose of 1.5 and 5 g/L for calcined Ca-Al-(NO3) LDH and AOC, respectively. SBTR exhibited its promising opportunity in continuous operation universally in field irrespective of the size and characteristics of the adsorbent. The present work brings this type of reactor for the first time in the field of adsorption with significant advancement in water treatment.

Keywords Continuous reactor, Batch Study, Sequencial operation, Water treatment, Adsorbent

How to cite: Ghosal, P. S. and Sahu, S.: Sequential type batch reactor (SBTR): A novel advancement in adsorption system for removal of pollutant from drinking water, EGU General Assembly 2024, Vienna, Austria, 14–19 Apr 2024, EGU24-17636, https://doi.org/10.5194/egusphere-egu24-17636, 2024.

EGU24-17725 | ECS | Posters on site | HS8.1.3

Persistent Mobile and Toxic Contaminants in Urban Stormwater: the case of Barcelona Municipality 

Filippo Chierchini, Sergio Santana Viera, Francesc Labad, Marc Teixido, and Sandra Perez

Challenges posed by rapid urbanization, climate change, and the increased frequency of extreme weather events are forcing cities to adapt a new urban water management. Stormwater harvesting represents a prospective local resource, particularly in densely populated arid regions marked by severe water scarcity. Among these, deployment of stormwater blue-green infrastructure (BGI) is a promising practice to mitigate flood risk, while recharging aquifer and reducing combined sewer overflows. However, it is acknowledged that stormwater, highly impacted by anthropogenic contaminants, is a significant carrier of contamination.

Despite legacy and (un)regulated contaminants (e.g., pesticides, drugs, anti-corrosion agents, plasticizers) have already been detected in various water sources, there is still a lack of scientific knowledge on the source, transport and fate of new chemicals of concern (i.e., absence of comprehensive monitoring) in the urban water cycle. For instance, blue-green infrastructure may not ineffectively remove persistent, mobile, and toxic (PMT) organic compounds, allowing them to potentially enter ground and surface waters.

Herein, “first flushes” of urban stormwater (including rainwater) from nearly 30 sites over 3 districts across the municipality of Barcelona, were collected during the period March to April 2022. Sampling design included conventional and pedestrian streets runoff, and BGI inlet/outlets. The results showed that conventional streets were the most polluted areas. More than 30 targeted urban contaminants were investigated using a LC-MS/MS method, 14 of them included in the UBA PMT list. In this preliminary analysis, we observed that all targets were detected in at least one sample, among them 5 chemicals as benzenesulfonamide, 1,3 diphenylalanine, Di-n-butyl phosphate, tolytriazole and TCPP, resulted to be the more ubiquitous (with frequencies >70%) and showed median concentrations higher than 100 ng L-1. Moreover, BGI effluents showed lower overall PMT concentrations compared to influent runoff waters, highlighting the removal capacity of these stormwater treatment schemes. Results will eventually undergo thorough analysis to identify PMT sources, occurrence, and fate in a spatiotemporal domain. PMTs substances impacting urban stormwaters must be monitored in order to prevent spread in surface and ground waters and enable safe use for water supply.

How to cite: Chierchini, F., Santana Viera, S., Labad, F., Teixido, M., and Perez, S.: Persistent Mobile and Toxic Contaminants in Urban Stormwater: the case of Barcelona Municipality, EGU General Assembly 2024, Vienna, Austria, 14–19 Apr 2024, EGU24-17725, https://doi.org/10.5194/egusphere-egu24-17725, 2024.

EGU24-17879 | Posters on site | HS8.1.3

Adsorption of fluoride from groundwater by Alumina Olivine Composite 

Pranjal Ghosal and Partha Sarathi Ghosal

The removal of fluoride from groundwater is a major challenge in environmental engineering especially while dealing with real-life groundwater from field. The presence of other ions in groundwater impacts significantly which renders the efficacy of many adsorbent which may show significant performance in synthetic water. The present study was conducted with groundwater of fluoride level 8.8 mg/L that mostly representative the moderate to high level fluoride concentration in the area of the western part of the state of West Bengal, India. The adsorbent chosen in the study as Alumina Olivine Composite (AOC) prepared by a wet impregnation method followed by calcination.

The adsorption system with real‒time groundwater was test with variation of dose, reaction time and agitation rate. The isotherm study, the variation of the adsorbent dose was chosen as 0.5 to 6 g/L. The best fitted model was found as Freundlich isotherm (R2=0.907 and Kf =0.527 (mg/g)(L/mg)1/n, 1/n = 0.641) along with the three parameter isotherm models, such as Hill, Redlich–Peterson, Toth with comparable R2. Thus, the adsorption model exhibited a favourable adsorption with significant capacity. The Kinetic study was conducted for 5‒480 min. The adsorption kinetic models are chosen as pseudo‒first-order (PFO), pseudo‒second‒order (PSO) and Elovich’s equation (EL) were used as the reaction‒based kinetic models, whereas, the liquid film diffusion model (LFD), intraparticle diffusion model (IDS and IDL) and double-exponential model (DEM). The Elovich’s equation was found to be the best‒fitted among the reaction based models with R2 value of 0.970. The applicability of double-exponential equation significantly described the adsorption diffusion model with a R2 value of 0.983, showed that the mechanism of adsorption govern by both intraparticle diffusion and film diffusion. This is further supported by the significant C value of 6.40 from intraparticle diffusion model. The present work established the wide applicability of the present adsorption system in field level water treatment units.

Keywords Isotherm, Kinetics, Batch Study, Water treatment, Fluoride


How to cite: Ghosal, P. and Ghosal, P. S.: Adsorption of fluoride from groundwater by Alumina Olivine Composite, EGU General Assembly 2024, Vienna, Austria, 14–19 Apr 2024, EGU24-17879, https://doi.org/10.5194/egusphere-egu24-17879, 2024.

EGU24-17996 | ECS | Posters on site | HS8.1.3

Use of organic trace substances for water management at a bank filtration site at the Rhine, Germany 

Alexandra Hellwig, Lydia Woschick, Clara Vogt, Björn Droste, Dirk Antunovic, Anette Albrecht, Hans-Peter Rohns, and Traugott Scheytt

The increasing demand for water in industry, agriculture, and private households as well as climate change are leading to more dynamic river and groundwater levels. This demands a new and improved monitoring approach to groundwater resources. The BMBF-funded research project iMolch (project number: 02WGW1667D) aims to develop sustainable water management concepts for Germany using innovative monitoring strategies. The general purpose of the investigations is to gain a complex understanding of hydrodynamic and hydrochemical processes in order to enable a more sustainable use of water resources on the basis of the indicator concept. This study investigates the spatial and temporal variation of different substances using as one example the urban bank filtration site in Düsseldorf, Germany. This site is used to draw conclusions on groundwater quality and dynamics as well as redox processes using the transport and retention of organic trace substances.

Hydraulic and hydrochemical measurements were carried out fortnightly over a period of 1,5 years (31/01/2018–08/05/2019) across a study transect on the Rhine riverbanks with 15 measuring points. The analyses focus on changes in the concentrations of organic trace substances over time and the relationship to flow distance, flow duration and climatic conditions. Based on land use and occurrence, various organic compounds, such as fertilisers and pesticides, but also pharmaceuticals and detergents are monitored. The dependence between substance concentrations and Rhine river level decreases with increasing distance to the Rhine. Following the extreme drought in the summer of 2018, during which only low concentrations of trace substances were detected in the entire study area, there was an abrupt increase in substances entering the Rhine. This coincides with a significant Rhine high stand in the winter of 2018/2019. It is noticeable here that an increased concentration of substances discharged from the Rhine can also be detected at measuring points beyond the well gallery, on the land side of the measuring point transect.

In dry periods, such as the summer of 2018, the proportion of bank filtrate in the raw water is significantly lower. In contrast, the Rhine floods the pumping well gallery during high water level periods, such as the winter of 2018/2019. During this time there is no landward flow to the pumping wells. The occurrence of organic trace substances even shows that the flood of the river Rhine pushes the water in the bank filtrate up to the well gallery and far beyond into the hinterland despite ongoing water pumping. These observations are crucial for the subsequent water management during different water levels of the river Rhine. Prediction models will be built up to help as water management tools to improve monitoring systems and for transfer of these results to other sites.

How to cite: Hellwig, A., Woschick, L., Vogt, C., Droste, B., Antunovic, D., Albrecht, A., Rohns, H.-P., and Scheytt, T.: Use of organic trace substances for water management at a bank filtration site at the Rhine, Germany, EGU General Assembly 2024, Vienna, Austria, 14–19 Apr 2024, EGU24-17996, https://doi.org/10.5194/egusphere-egu24-17996, 2024.

EGU24-18104 | ECS | Orals | HS8.1.3

Characterization of Sulfamethoxazole Direct Photodegradation through Multi-Element Compound-Specific Isotope Analysis 

xiao liu, Jimmy Köpke, caglar akay, Steffen Kümmel, Hans Hermann Richnow, and Gwenaël Imfeld

The direct photodegradation of sulfamethoxazole (SMX) represents a significant dissipation process in wetlands. However, distinguishing photodegradation from concurrent processes such as microbial and plant degradation in these environments presents a challenge. Therefore, our objective was to employ novel isotope concepts to characterize and differenciate the specific mechanisms involved in photodegradation processes. The GC-IRMS method developed for SMX includes carbon, hydrogen, and nitrogen isotope analysis, while the GC-MC-ICP-MS method specifically caters to sulfur isotope analysis. SMX exhibits varying protonation states at different pH levels, significantly affecting its degradation kinetics. We conducted direct photodegradation of SMX in simulated sunlight (>280nm) at pH 3 and pH 7. Degradation was faster at pH 3 than at pH 7. We observed normal carbon and sulfur isotope fractionation, yielding carbon isotope fractionation values (εC) of -1.9 ± 0.2 at pH 7 and -2.7 ± 0.4 at pH 3. The sulfur isotope fractionations (ε34S) were -3.7 ± 0.5 at pH 7 and -6.3 ± 0.5 at pH 3, while ε33S values were -6.4 ± 1.2 at pH 7 and -7.5 ± 1.1 at pH 3. In contrast, an inverse nitrogen isotope fractionation was observed, with εN = 3.0 ± 0.2 at pH 7 and 3.6 ± 0.1 at pH 3. These results support the idea of an involvement of carbon, nitrogen, and sulfur in the bond cleavage during the rate-limiting step. However, insignificant changes in the hydrogen isotopic compositions of SMX during degradation suggest that either hydrogen was not significantly involved in the bond cleavage or the transformation realted to the hydrogen bond cleavage played a minor role in the overall degradation process. Overall, the isotope data highlighted distinct transformation pathways during direct photodegradation at different pH levels. At pH 7, the dominant transformation products were sulfonilic acid, 3-amino-5-methylisoxazole (3A5MI) from N-S bond cleavage, 5-methylisoxazol-3-yl)sulfamate from C-S bond cleavage, and sulfanilamide from C-N bond cleavage, which aligned with the observed isotope fractionation data. Conversely, at pH 3, different dominant transformation products, including sulfonilic acid, 3A5MI, N4-hydroxylation of sulfanilamide and SMX isomerization, suggest that transformation pathways differed from those observed at pH 7. Altogether, the specific isotope fractionation signatures derived from multi-element CSIA for direct photodegradation of SMX represent a unique reference enabling future comparisons with other degradation pathways.

How to cite: liu, X., Köpke, J., akay, C., Kümmel, S., Richnow, H. H., and Imfeld, G.: Characterization of Sulfamethoxazole Direct Photodegradation through Multi-Element Compound-Specific Isotope Analysis, EGU General Assembly 2024, Vienna, Austria, 14–19 Apr 2024, EGU24-18104, https://doi.org/10.5194/egusphere-egu24-18104, 2024.

EGU24-20128 | Orals | HS8.1.3

Contaminants of emerging concern in urban aquifers: Do they limit the use of groundwater? 

Anna Jurado, Olha Nikolenko, Carmen Saéz, Marc Teixidó, and Estanislao Pujades

Water resources are affected by climate change, especially in the south of Europe, where droughts will be more frequent, intense and long. Hence, research into alternative sources of freshwater, such as urban groundwater (UGW) is essential.  Urban aquifers are a potential solution to obtain freshwater, but they are frequently polluted by contaminants of emerging concern (CECs). Therefore, there is a need to ascertain whether CECs are a water management challenge as they might limit the use of groundwater as safe drinking water.

To answer this question, it is required to assess the human health-risk effects of CECs in the groundwater and to understand their subsurface behaviour at a field-scale. This research compiles data about the presence of CECs in the aquifers of the Barcelona city and its metropolitan area, evaluates health risk effects of measured CECs in the groundwater and presents approaches implemented to identify and quantify the coupled hydro-thermo-chemical processes that govern the fate of these substances in the subsurface.

Based on detected concentration in urban groundwater, there are some CECs that might be harmful to humans such as 5-methyl-1H-benzotriazole and the pharmaceuticals azithromycin valsartan, valsartan acid, lamotrigine, venlafaxine and lidocaine, which show very high to intermediate health risk effects. The number of harmful CECs and the level of their hazard increase from the groups of adults and teens to those of 4 – 8 and 1 – 2 years old children. Thus, some CECs can limit the use of groundwater in Barcelona as potential drinking water source. Finally, knowledge gaps in understanding how to integrate these processes into urban water resources management plans are highlighted, which will help to define groundwater potential uses and to assure protection of the human health

How to cite: Jurado, A., Nikolenko, O., Saéz, C., Teixidó, M., and Pujades, E.: Contaminants of emerging concern in urban aquifers: Do they limit the use of groundwater?, EGU General Assembly 2024, Vienna, Austria, 14–19 Apr 2024, EGU24-20128, https://doi.org/10.5194/egusphere-egu24-20128, 2024.

EGU24-20203 | Posters on site | HS8.1.3

Comprehensive Study of Emerging Pollutants in El Hierro Island: A Showcase of Good Practices with Zero Pesticide Impact 

Samanta Gasco Cavero, Miguel Ángel Marazuela, Noelia Cruz-Pérez, Luis Fernando Martín Rodríguez, Chrysi Laspidou, Albert Contreras-Llin, Gerard Quintana, Silvia Díaz-Cruz, Juan C. Santamarta, and Alejandro García Gil

The present study focuses on emerging pollutants (EPs) in groundwater, an understudied category with unclear regulatory guidelines regarding their impact on water resources. Regions heavily reliant on groundwater, crucial for agriculture, drinking, and other purposes, face heightened risks of EP contamination. The case study focuses on El Hierro (Canary Islands), a UNESCO-designated biosphere reserve largely powered by renewable energies. Employing high-performance liquid chromatography-mass spectrometry, the concentrations of 70 EPs at 19 locations on El Hierro were assessed.

The findings revealed an absence of pesticides in groundwater, and diverse levels of ultraviolet (UV) filters, UV stabilizers/blockers, and pharmaceutically active compounds (PhACs), with La Frontera emerging as the most contaminated municipality. Piezometers and wells exhibited the highest EP concentrations among the different installation types. Notably, sampling depth demonstrated a positive correlation with EP concentration, revealing four distinct clusters dividing the island based on EP presence.

Further research is essential to understand the factors contributing to the elevated concentrations of certain EPs at different depths. The results underscore the necessity to, not only implement remediation measures post-EP infiltration into soil and aquifers, but also prevent their introduction into the water cycle through homes, animal husbandry, agriculture, industry, and wastewater treatment plants (WWTPs).


How to cite: Gasco Cavero, S., Marazuela, M. Á., Cruz-Pérez, N., Martín Rodríguez, L. F., Laspidou, C., Contreras-Llin, A., Quintana, G., Díaz-Cruz, S., Santamarta, J. C., and García Gil, A.: Comprehensive Study of Emerging Pollutants in El Hierro Island: A Showcase of Good Practices with Zero Pesticide Impact, EGU General Assembly 2024, Vienna, Austria, 14–19 Apr 2024, EGU24-20203, https://doi.org/10.5194/egusphere-egu24-20203, 2024.

EGU24-21862 | ECS | Orals | HS8.1.3

Dissolved organic matter pathways and transformation across the urban environment 

Diego Schmidlin, Stefan Platikanov, Marc Teixidó, Romà Tauler, and Enric Váquez-suñé

Today, traditional water sources are starting to struggle to meet current urban demands. Alternative sources such as rainwater, urban stormwater runoff, or aquifers must be considered. Stormwater could represent a very interesting option to augment local water supplies. However, it is widely recognized that stormwater is a large contributor to diffuse pollution. In this context, DOM can be used as a biogeochemical cycle tracer and a proxy for stormwater quality, enabling an effective and sustainable urban water management. However, few studies have addressed the quality at small-scale catchment. To address this, we conducted six sampling campaigns in the city of Barcelona including different water matrices: rainwater, urban runoff (pedestrian and vehicular streets), and influents/effluents from Sustainable Urban Drainage Systems (SUDS). SUDs are urban green infrastructures primarily designed to prevent city flooding by enhancing permeability and facilitating aquifer recharge. Dissolved organic matter (DOM) quality was evaluated by spectroscopic techniques, i.e., measuring specific ultraviolet absorbance (SUVA254), along with fluorescence excitation-emission matrices (FEEM). Results highlighted that concentration of dissolved organic carbon (DOC) followed: rain < SUDS < Pedestrian Street < Conventional Street, providing an initial estimation of contamination levels. The SUVA254 index followed the sequence: rain < Pedestrian Street < Conventional Street < SUDs, indicating the enrichment in aromaticity of Dissolved Organic Matter (DOM) after percolating through the SUDS. Furthermore, calculated fluorescence indices (HIX, BIX, FI, α/β) aided in identifying the origin and maturity of organic matter in the different matrices. Our findings suggest that rainwater was comprised mostly of fresh, microbially derived DOM, while SUDS contained more matured DOM, primarily from terrestrial origin. In contrast, streets contained a different DOM composition, predominantly freshly and microbially derived. Additionally, FEEM together with the MCR-ALS chemometric method allowed us to identify up to six components (i.e., soluble microbial-like, fulvic-like, protein-like tryptophan, protein-like tyrosine, terrestrial humic-anthropic-like, marine and terrestrial-like). Our observations showed that the quantity of DOM decreased through its passage in the SUDS (street to SUD), indicating that these systems can change the quality and quantity of urban organic matter, potentially impacting the water quality of aquifers.

How to cite: Schmidlin, D., Platikanov, S., Teixidó, M., Tauler, R., and Váquez-suñé, E.: Dissolved organic matter pathways and transformation across the urban environment, EGU General Assembly 2024, Vienna, Austria, 14–19 Apr 2024, EGU24-21862, https://doi.org/10.5194/egusphere-egu24-21862, 2024.

EGU24-247 | ECS | Posters on site | HS8.1.5

Exploring the deposition mechanism in saturated porous media for polydisperse composites of XG and nZVI@rGO 

Liming Ren, Bing Qin, and Fengyi Cao

Engineered nanomaterials (ENMs) have shown promise for remediation of groundwater contaminants and the potential application relies on the delivery of aqueous solutions of ENMs to a targeted subsurface location or region. Thus, the ability to accurately predict nanoparticle transport and retention in saturated porous media is one of the most technical challenges faced by the design and assessment of potential field-scale environmental applications. Here, a prior prediction model was presented by coupling the effect of Derjaguine-Landaue-Verweye-Overbeek (DLVO) interaction, Brownian diffusion, hydrodynamics and interception. Characteristics used in the model were medium size, porosity, injection velocity, size distribution of particles, attachment efficiency, single-collector contact efficiency. The direct comparison of parameterized prior model predictions to experimental measurements was proposed to thoroughly understand deposition mechanism of polydisperse ENM. The model predicted deposition rate coefficient quantitatively very close to measured rates. When the particle diameter (dp) of ENM excessed 1.2080 mm, it was retained in the porous medium by interception; When dp < 0.1737 mm, ENM would deposite in the porous medium if the kinetic energy (Ek) it possessed is less than the depth of the secondary energy minimum; When 0.1737 mm < dp < 1.2080 mm, deposition occurred where adhesive torques (TA) was in excess of hydrodynamic drag torgues (TH) particles subject to. Further, deposition rate was positive correlated with injection concentrations among the range of 0.34 g/L~1.70 g/L. Besides, low deposition rates were observed with injection velocities around 0.69 cm/min.

How to cite: Ren, L., Qin, B., and Cao, F.: Exploring the deposition mechanism in saturated porous media for polydisperse composites of XG and nZVI@rGO, EGU General Assembly 2024, Vienna, Austria, 14–19 Apr 2024, EGU24-247, https://doi.org/10.5194/egusphere-egu24-247, 2024.

EGU24-329 | ECS | Orals | HS8.1.5

Adsorption Kinetics and Contaminant Removal Efficiency of Nitrate and Phosphate Using Various Adsorbents. 

Roohmoney Roohmoney, Sumedha Chakma, and Ravinder Kaur

Nitrate and phosphate play critical functions in plant development, yet their extensive usage in agriculture and industry pollutes water. This not only leads to diseases like cancer but also promotes the environmentally harmful process of eutrophication. Despite significant studies on phosphate and nitrate ion removal from water, the problem is in developing highly selective adsorbents to improve removal efficiency. This study provides a thorough evaluation of the effectiveness of nitrate and phosphate removal from synthetic solutions using three different adsorbents: Powdered activated carbon (PAC), modified activated carbon (MAC), and Activated Alumina (AA). Batch adsorption experiments were carried out across a variety of time periods and doses to investigate the dynamic interactions between the adsorbents and pollutants. The results showed that MAC treated with FeCl3 had the best nitrate removal effectiveness of 97%, outperforming PAC and AA. Conversely, AA demonstrated superior phosphate removal efficiency, outperforming MAC and PAC. The pseudo-second-order kinetic model was shown to be the best fit for modeling the adsorption kinetics, offering useful insights into the time-dependent adsorption processes for both nitrate and phosphate. This study's findings not only help in the optimization of water treatment operations but also highlight the significance of selecting the suitable adsorbent for certain pollutants. The findings of this study benefit environmental science and water treatment technologies by offering practical insights into the comparative performance of commonly utilized adsorbents. The discovery of MAC as a powerful nitrate removal agent and AA as a phosphate removal agent has implications for the development of efficient, customized water treatment applications.

How to cite: Roohmoney, R., Chakma, S., and Kaur, R.: Adsorption Kinetics and Contaminant Removal Efficiency of Nitrate and Phosphate Using Various Adsorbents., EGU General Assembly 2024, Vienna, Austria, 14–19 Apr 2024, EGU24-329, https://doi.org/10.5194/egusphere-egu24-329, 2024.

EGU24-2369 | Posters on site | HS8.1.5

Recursive analytical solution for nonequilibrium multispecies transport of decaying contaminants simultaneously coupled in both the dissolved and sorbed phases 

Jui-Sheng Chen, Yu-Chieh Ho, Ching-Ping Liang, Heejun Suk, Thu-Uyen Nguyen, and Chen-Wuing Liu

Few analytical or semi-analytical models simulating the transport of sequentially decaying reaction products affected by nonequilibrium sorption in the groundwater have been presented considering decay or degradation reaction occurring exclusively in the dissolved phase in the literature. However, the process of decay in the sorbed phase, which is important for the transport of decaying contaminants, has been neglected in previously developed analytical models. This study is thus designed to develop a novel semi-analytical model for simulating the multispecies transport of decaying contaminants subject to a nonequilibrium sorption process simultaneously coupled in both the dissolved and sorbed phases. For this purpose, a set of first-order reversible kinetic sorption reaction equations that respectively represent the nonequilibrium sorption processes between the dissolved and sorbed phases, are coupled to a set of advection-dispersion equations, to illustrate the decay process which occurs in both the dissolved and the sorbed phases. By including the decay in the sorbed phase both the parent sorbed concentration and daughter sorbed concentration coexist in a set of first-order reversible kinetic sorption reaction equations, which absolutely complicate the theoretical derivation of the analytical solution.
 Recursive analytical solutions are derived to account for the concentration distribution of arbitrary transformation products with the aid of the Laplace transform and generalized integral transform. The correctness of the solutions is confirmed through a comparison of our newly derived recursive analytical solution with an existing model which considers an equilibrium sorption process. The newly developed recursive analytical solution is then applied to investigate how the decay in the sorbed phase affects the nonequilibrium transport of a four-member radionuclide decay chain. The result clearly predicts a lower radioactivity concentration of the first nuclide (238Pu), with decay in the sorbed phase, than the simulated results obtained using a model without decay in the sorbed phase. For other daughter elements (234 U, 230 Th, 226 Ra) of the radionuclide decay chain, neglect of decay in the sorbed phase leads to overestimation of the radioactivity concentrations. The result of large differences found in dissolved radioactivity concentration between the decay and no decay in sorbed phase may alter the decision of health risk assessment in the performance of radioactive waste disposal site. The implication is that the decay reactions of contaminants in the sorbed phase are important mechanisms that should be taken into accounts for accurately simulating and assessing the nonequilibrium multispecies transport of decaying contaminants.

How to cite: Chen, J.-S., Ho, Y.-C., Liang, C.-P., Suk, H., Nguyen, T.-U., and Liu, C.-W.: Recursive analytical solution for nonequilibrium multispecies transport of decaying contaminants simultaneously coupled in both the dissolved and sorbed phases, EGU General Assembly 2024, Vienna, Austria, 14–19 Apr 2024, EGU24-2369, https://doi.org/10.5194/egusphere-egu24-2369, 2024.

Chlorinated solvents can degrade to generate transformation products sequentially. The presence of such transformation products must be considered for the health risk assessment. Recently, we have developed a software package MUSt (MUltiSpecies transport Analytical Models) in which FORTRAN executable files based on our newly developed multispecies transport analytical solutions are equipped with an interactive graphical user interface (GUI). The multispecies transport analytical solutions embedded in MUSt have been further combined with health risk module for more reasonable health risk assessment. This study assesses the health risk for chlorinated solvent contaminated groundwater in northern Taiwan. The geographical distribution of non-carcinogenic and carcinogenic health risk is depicted for appropriate action for reducing groundwater concentration level of chlorinated solvent contaminants and protecting human health.

How to cite: Liang, C.-P., Chen, J.-S., and Laio, Z.-Y.: Assessing Non-Carcinogenic and Carcinogenic Health Risk for Chlorinated Solvent Contaminated Groundwater Using MUSt Software Palckage: Case Study  , EGU General Assembly 2024, Vienna, Austria, 14–19 Apr 2024, EGU24-2373, https://doi.org/10.5194/egusphere-egu24-2373, 2024.

EGU24-4252 | Orals | HS8.1.5

Measurement and analysis of anomalous diffusion in porous rock 

Brian Berkowitz, Ashish Rajyaguru, Ralf Metzler, Ishai Dror, and Daniel Grolimund

Molecular diffusion, or more specifically, diffusion-controlled transport, of tracers, contaminants, and chemical species --- in soil and rock formations, and in river, lake, and marine sediments --- plays a critical role in many dynamic processes that affect water chemistry and properties of the host domain. The spreading of dissolved ionic species via Brownian motion is generally described by a Gaussian law for the probability density function, with diffusion (embodying Fick’s second law) then being described by the classical diffusion equation. Solution of this equation shows that the spreading pattern of chemical species is characterized by a mean squared displacement that scales linearly with time. However, in other porous domains like biological tissues and cells, dense liquids, and gels, diffusion behavior often deviates from Fickian, instead exhibiting anomalous (or non-Fickian) diffusion. More specifically, tracer movements in these “crowded environments” exhibit a spreading pattern wherein the mean squared displacement scales as a power law. Somewhat surprisingly, in studies involving water-saturated porous rock, diffusion of chemical species is generally assumed to follow Fick’s second law, ignoring the possible occurrence of anomalous diffusion. To test this assumption, we measure molecular diffusion in five chalk and dolomite rock samples using a specially designed diffusion cell. The set-up enables high-resolution measurement of extended, long-time tailing at the measurement plane, which is required to distinguish between Fickian and anomalous diffusion behavior. In all of the rock samples, the diffusion behavior is demonstrated to be significantly different than Fickian, with extreme long-time tailing of tracer advance relative to conventional Fickian diffusion. The measured breakthrough curves are then analyzed using a continuous time random walk framework that describes anomalous diffusion in heterogeneous porous materials. The analysis (i) provides a framework to distinguish between Fickian and anomalous diffusion, and (ii) demonstrates that anomalous diffusion in geological formations is likely ubiquitous and implies that diffusion-controlled transport processes should be analyzed using tools that account for such behavior.

How to cite: Berkowitz, B., Rajyaguru, A., Metzler, R., Dror, I., and Grolimund, D.: Measurement and analysis of anomalous diffusion in porous rock, EGU General Assembly 2024, Vienna, Austria, 14–19 Apr 2024, EGU24-4252, https://doi.org/10.5194/egusphere-egu24-4252, 2024.

EGU24-4470 | ECS | Posters on site | HS8.1.5

Solute transport in heterogeneous compressible aquifers under transient forcing 

Satoshi Tajima and Marco Dentz

Transient forcing, such as tidal fluctuations, enhances mixing within aquifers [1, 2]. This study focuses on two pivotal characteristics of typical aquifers—heterogeneity in hydraulic conductivity (K) and compressible properties, represented by the log-hydraulic conductivity variance (σf2) and specific storage (Ss), respectively. Previous research has individually addressed the influence of these parameters on solute dynamics [3, 4, 5], yet their combined effects remain inadequately understood. Here, we explore how heterogeneity and compressibility (finite storage) in combination governs solute transport in aquifers under transient forcing. To this end, this study employs Monte Carlo particle tracking simulations, providing a comprehensive representation of K heterogeneity. The simulations yield temporal evolutions of the centre of mass and spatial concentration variance. These results are compared with those derived from analytical solutions applicable to homogeneous compressive porous media (σf2 = 0, Ss ≠ 0)  [5]. Our findings reveal that increasing values of σf2 and Ss result in a delayed temporal evolution of the centre of mass compared to the predictions of the homogeneous analytical solution. In addition, the homogeneous analytical solution with zero local dispersion predicts a consistently zero concentration variance, whereas our heterogeneous simulations demonstrate an increasing concentration variance over time. The simulations also show that the higher σf2 and Ss, the faster the temporal evolution of the concentration variance. These insights offer a deeper understanding of transport dynamics under transient forcing conditions, providing valuable information for accurate assessments of tidal impacts on salinity distributions in coastal aquifers.


References

[1] Oberdorfer, J. A., Hogan, P. J., and Buddemeier, R. W. (1990). Atoll island hydrogeology: flow and freshwater occurrence in a tidally dominated system. Journal of Hydrology 120, 327-340.

[2] Inouchi, K., Kishi, Y., and Kakinuma, T. (1990). The motion of coastal groundwater in response to the tide. Journal of Hydrology 115, 165-191.

[3] Dagan, G., Bellin, A., and Rubin, Y. (1996). Lagrangian analysis of transport in heterogeneous formations under transient flow conditions. Water Resources Research 32, 891-899.

[4] Dentz, M., and Carrera, J. (2003). Effective dispersion in temporally fluctuating flow through a heterogeneous medium. Physical Review E 68, 036310.

[5] Pool, M., Dentz, M., and Post, V. E. A. (2016). Transient forcing effects on mixing of two fluids for a stable stratification. Water Resources Research 52, 7178-7197.

How to cite: Tajima, S. and Dentz, M.: Solute transport in heterogeneous compressible aquifers under transient forcing, EGU General Assembly 2024, Vienna, Austria, 14–19 Apr 2024, EGU24-4470, https://doi.org/10.5194/egusphere-egu24-4470, 2024.

Chlorinated ethenes (CEs), such as perchloroethene (PCE) and trichloroethene (TCE), are pervasive groundwater contaminants. Owing to their toxic properties, there is a considerable effort for their remediation. In this context, in situ CE chemical reduction using zero-valent iron (ZVI) materials represents a promising strategy. However, the intrinsic low electron selectivity of pristine ZVI often results in its rapid surface corrosion and passivation in subsurface environments. In the last years, sulfidation has emerged as an effective means to enhance the reactive lifetime of ZVI. Despite the efficiency of sulfidated ZVI (S-ZVI) in dechlorinating TCE and trans-1,2-dichloroethene (trans-DCE), a notably lower reactivity has been typically observed for PCE and cis-1,2-dichloroethene (cis-DCE). The mechanisms governing the variable reactivity of S-ZVI with different CEs remain poorly understood.

To shed more light on the mechanisms controlling S-ZVI selectivity, we calculated the dechlorination barriers of various CEs at multiple S-ZVI surface models using density functional theory (DFT). Specifically, we focused on the electron transfer-controlled β-elimination reactions, identified as the predominant pathway for CE dechlorination with S-ZVI. Reactions of PCE, TCE, and both cis- and trans-DCE isomers were investigated at different S-ZVI surface sites, including surfaces with varying sulfur coverage. 

Our calculations revealed that CE dechlorination reactions are both kinetically and thermodynamically more favorable at Fe sites compared to S sites. This finding indicates that the overall promoting effect of ZVI sulfidation on CE degradation is indirect, primarily involving the protection of the ZVI surface from corrosion in water. Sulfur coverage was identified to significantly influence the S-ZVI selectivity for individual CEs. Under low S coverage, the reactivity of Fe sites followed the order trans-DCE ≈ TCE > cis-DCE > PCE, with PCE degradation hindered by steric effects from nearby S atoms. Conversely, at high S coverage, Fe sites were sterically hindered for all CEs, and reactivity was controlled by S sites. In this scenario, energy barriers correlated with the energy of the lowest unoccupied molecular orbital (ELUMO) of CEs in the order PCE < TCE < DCE isomers. These findings demonstrate that the experimentally observed trends in S-ZVI selectivity for individual CEs can be explained by the interplay between the affinity of CEs for electron transfer and steric effects of S atoms at the ZVI surface.


Acknowledgments

This work was funded by the Austrian Science Fund (FWF), project M 2892-N. The Vienna Scientific Cluster (project no. 70544) is gratefully acknowledged for providing computational resources.

How to cite: Brumovsky, M. and Tunega, D.: Mechanistic Insights into the Selectivity of Sulfidated Zero-Valent Iron Materials in Chlorinated Ethenes Removal: A DFT Study, EGU General Assembly 2024, Vienna, Austria, 14–19 Apr 2024, EGU24-5135, https://doi.org/10.5194/egusphere-egu24-5135, 2024.

EGU24-5154 | ECS | Posters on site | HS8.1.5

Impact of Chaotic Advection on Solute Transport in Porous Media 

Carla Feistner, Mónica Basilio Hazas, Barbara Wohlmuth, and Gabriele Chiogna

Chaotic advection can enhance mixing processes in porous media by increasing the solution-solvent interface available for diffusion. While the pore structure can generate chaotic advection at the pore scale, transient flow fields can lead to chaotic advection at the Darcy scale. This concept can be applied to groundwater remediation, as the flow field can be engineered using injection-extraction systems. This study investigates two injection-extraction systems known to exhibit chaotic structures: a source-sink dipole and a rotated potential mixing. Using Lagrangian particle tracking combined with random walk we solve the stochastic differential equation to simulate solute transport. The pulsed source-sink system is parametrized by the pumping rate, while for the rotated potential mixing system, we use the rotation angle and the rotation frequency to change the flow properties. Using a grid search over the parameter spaces of both systems, we test different configurations. We quantify the temporal increase in dilution and the mixing enhancement with the dilution index by using a novel approach of selecting the optimal grid size with minimal approximation error for each particle density estimation. Furthermore, we analyze the corresponding flow structure to identify Kolmogorov-Arnol'd-Moser (KAM) islands, non-mixing regions that arise around elliptic points of the flow. We find that the parameters of the system control the occurrence and size of KAM islands, which consequently affect the increase in dilution by limiting the chaotic area in the domain. Overall, our results show that not all chaotic systems lead to the same maximum mixing enhancement. Therefore, it is important to properly assess the uncertainty in the design parameters of injection-extraction systems to effectively engineer chaotic advection.

How to cite: Feistner, C., Basilio Hazas, M., Wohlmuth, B., and Chiogna, G.: Impact of Chaotic Advection on Solute Transport in Porous Media, EGU General Assembly 2024, Vienna, Austria, 14–19 Apr 2024, EGU24-5154, https://doi.org/10.5194/egusphere-egu24-5154, 2024.

EGU24-6127 | ECS | Orals | HS8.1.5

Effect of Local Dispersion on Mixing Enhancement when Applying an Engineered Injection and Extraction System: Laboratory and Model-based Evidence 

Francesca Ziliotto, Mónica Basilio Hazas, Markus Muhr, Massimo Rolle, and Gabriele Chiogna

Engineered Injection and Extraction (EIE) systems represent a promising groundwater remediation technique. This technology generates transient groundwater flow fields by periodically operating a system of pumping wells, with the goal of enhancing contaminant degradation through mixing with a treatment solution. The objective of this work is to provide experimental evidence of the effect of an EIE system on plume mixing and to investigate the effect of local dispersion on mixing enhancement. We perform laboratory experiments in a quasi-two-dimensional setup representing a vertical cross-section of an unconfined homogeneous aquifer. The setup is equipped with four wells, connected to a peristaltic pump, which are activated one at a time following an injection-extraction sequence. The wells operation establishes transient flows within the setup and introduces fluctuations in the groundwater table. A conservative tracer is injected in the middle of the area delimited by the wells, and a high-resolution image analysis technique is applied to track the evolution of the tracer concentration. We perform the experiments considering two different grain sizes and investigate the effect of the application of the EIE system on the plume mixing and spreading in contrast to two benchmark experiments where the wells are not operating and, therefore, only diffusion affects the tracer plume. Additionally, for one porous material, we permute the injection-extraction sequence to study the effect of different transient flow conditions and groundwater table fluctuations on plume deformation and mixing. We also provide a model-based interpretation of the experimental results using Richards equation and the conservative advection-dispersion equation to describe flow and transport processes, respectively. Plume spreading is quantified by computing the second central spatial moments, while the degree of mixing is estimated by calculating the plume area. We use the Okubo-Weiss metric computed over the plume area to link the mixing enhancement to the change in the flow topology. Our results show that EIE effectively enhances mixing and spreading at the laboratory scale, especially when the flow field leads to high values of the Okubo-Weiss metric. Moreover, local dispersion is shown to be a key factor for mixing enhancement in engineered injection and extraction systems.

How to cite: Ziliotto, F., Basilio Hazas, M., Muhr, M., Rolle, M., and Chiogna, G.: Effect of Local Dispersion on Mixing Enhancement when Applying an Engineered Injection and Extraction System: Laboratory and Model-based Evidence, EGU General Assembly 2024, Vienna, Austria, 14–19 Apr 2024, EGU24-6127, https://doi.org/10.5194/egusphere-egu24-6127, 2024.

EGU24-6503 | Posters on site | HS8.1.5

Laboratory tests and modeling of a reactive multibarrier for the remediation of a contaminated aquifer system 

Rajandrea Sethi, Leonardo Magherini, and Carlo Bianco

This study presents the treatability tests and modeling aimed at dimensioning of an in-situ reactive multibarrier, designed to purify an aquifer contaminated with a range of chlorinated organic compounds and arsenic, with 1,2-dichloroethane (1,2-DCA) presenting a significant resistance to conventional treatments.
The remediation strategy involves the implementation of a reactive multibarrier system comprising  two series-connected reactive filters: the first filled with millimetric zerovalent iron (ZVI) to remove arsenic and most of the chlorinated hydrocarbons through abiotic reductive dehalogenation, and the second with granular activated carbon (GAC) to adsorb 1,2-DCA and other residual organic contaminants.
To optimize the site-specific design and sizing of the reactive filters, groundwater treatability tests were conducted in the laboratory. Initial batch tests compared various ZVI and GAC types to select the most effective materials. Subsequent column tests assessed the treatment chain's efficacy under flow conditions and determined the longevity of the reactive materials. 
The results demonstrated the multibarrier's high effectiveness, with the ZVI filter removing 99.9% of several chlorinated solvents and all arsenic, and GAC achieving complete removal of the remaining contaminants to meet water quality standards. Mathematical models were employed to interpret the experimental findings and provide quantitative parameters essential for designing a large-scale multibarrier, such as kinetic constants for contaminant removal, reactive material longevity, and reagent volumes. A multicomponent adsorption model specifically aided in designing the GAC filtration step. he preliminary results of the pilot test, which is still ongoing, confirmed the potentiality of the reactive multibarrier to effectively remediate groundwater in site-specific conditions.

How to cite: Sethi, R., Magherini, L., and Bianco, C.: Laboratory tests and modeling of a reactive multibarrier for the remediation of a contaminated aquifer system, EGU General Assembly 2024, Vienna, Austria, 14–19 Apr 2024, EGU24-6503, https://doi.org/10.5194/egusphere-egu24-6503, 2024.

EGU24-6985 | Posters on site | HS8.1.5

Assessing source zone distribution and persistence at a trichloroethylene contaminated site 

Chiu-Shia Fen and Yu-Yang Zhuang

Chlorinated solvents are prevalent and persistent contaminants, classified as dense nonaqueous phase liquids (DNAPLs) in both soil and groundwater systems.  They have been identified at numerous sites globally, significantly impacting our environment.  The subsurface distribution of DNAPLs creates a source zone with complex geometry, strongly influenced by the specific characteristics of soil textures and stratification.  Accurately defining the location and extent of DNAPL source zones at contaminated sites poses a considerable challenge due to these complexities.

The aim of this study is to delineate the spatial distribution and persistence of trichloroethylene (TCE) in the subsurface for a long-term period of TCE leakage.  The studied area is situated at a factory in Taiwan.  Employing the T2VOC module within PetraSim 2019 software, we analyzed TCE movement and distribution in the subsurface over a 42-year timeframe which encompasses a 22-year period of TCE leakage and an additional 20-year period preceding remedial activities.  Field data from site investigation and remediation reports were incorporated into the analysis, encompassing information on groundwater table contours, soil layers, lithologies, permeabilities and the historical usage of TCE.  Relevant parameters, such as relative permeability, liquid residual saturation, capillary pressure and fluid saturation relationships, were determined based on literature sources.

Results show that TCE infiltrates to a depth of 13 m, reaching a low permeability zone below the ground surface.  However, the site investigation only extended to a depth of 10 m (the lower bound of a high-permeability zone).  Significant TCE residuals persist in both the upper and lower layers of the high-permeability zone after the 42-year simulation period.  The dissolved phase of TCE follows the groundwater flow, extending up to 80 m downstream with notable concentration levels.  However, if considering volatilization of TCE (resulting in an 80% reduction in leakage) and an 80% reduction in the leakage area, it becomes improbable for TCE to infiltrate to the lower low-permeability layer.  This suggests a potential underestimation of the current assessment of TCE usage.  Moreover, the study underscores the influence of groundwater velocity and TCE residual saturation on the retention and persistence of TCE in the soil layers.  This emphasizes the importance of investigating hydrogeological environment and assessing TCE residuals in various soil textures at such contaminated sites.

How to cite: Fen, C.-S. and Zhuang, Y.-Y.: Assessing source zone distribution and persistence at a trichloroethylene contaminated site, EGU General Assembly 2024, Vienna, Austria, 14–19 Apr 2024, EGU24-6985, https://doi.org/10.5194/egusphere-egu24-6985, 2024.

Pervasive salinity in soil, surface water and groundwater is a significant challenge in many coastal poldered areas of Bangladesh. These areas are characterized by their vulnerability to cyclone-induced surge inundation due to the low-lying flat topography and their concave coastal profile. The surge water leads to the areas being inundated, which may result in elevated salinity levels in surface water and groundwater. High salinity can affect the availability of potable water and have a serious impact on agriculture, ecosystems, and the health of coastal communities. To effectively address the issue of groundwater salinity in these coastal areas, a comprehensive understanding of the contributing causes is required. A 3D model, HydroGeoSphere, was developed to examine the effect of surge inundations on surface and groundwater salinities. This model coupled surface and subsurface domains, using surge levels data from Chittagong station and a digital elevation model from USGS Earth Explorer. Evaporation and monsoon data were collected at the pond of the DAB site (Dacope, Khulna, Southwest coastal Bangladesh). The results show that even one year after the storm surges, salinity levels in the surface and near-surface areas remained elevated. The high salinity levels near the surface area may be primarily due to the surge water being trapped in depressions, as well as the effects of evaporation reducing the water content of the soil, leaving concentrated salt behind. Also, low-permeable sediments in the area may contribute to the persistent high salinity levels. The modelled groundwater salinity distributions showed good agreement with the measured groundwater salinity distributions derived from electrical conductivities obtained in 14 tube wells at various depths and locations along a cross-section.

How to cite: Tsai, C. S., Mo, H., and Butler, A. P.: The effect of surge inundation on shallow groundwater salinity in the coastal low-lying poldered area of southwest Bangladesh-a 3D model investigation, EGU General Assembly 2024, Vienna, Austria, 14–19 Apr 2024, EGU24-7175, https://doi.org/10.5194/egusphere-egu24-7175, 2024.

Apart from the health risks associated with the consumption of contaminated water, the suitability of water, based on its visual appeal, taste, and odor, is a matter of paramount importance. Elevated levels of Iron (Fe) and Manganese (Mn) lead to the discoloration of sanitary wares and laundry, besides resulting in deposits within distribution systems and contributing to an undesirable taste in drinking water. The mobilization of Fe and Mn in groundwater is predominantly governed by redox processes. In this study, we conducted an analysis of shallow groundwater (n=145) in the Brahmaputra River Plains (BRP), India, which shows that 85 percent (n=123) and 80 percent (n=116) of the groundwater exceed the WHO acceptable limit of Fe (0.3 mg/L) and Mn (0.1 mg/L), respectively. The highest concentration of Iron (II) is 7 mg/L with a median value of 3 mg/L (n=35). However, they are heterogeneously distributed among the Piedmont deposits, Older Alluviums, and Younger Alluviums. Spearman’s correlation shows that total Fe has a strong correlation (0.89) with Fe (II), and a comparison between them reveals that Fe (II) is the dominant species. The reducing nature of the groundwater with low dissolved oxygen and a high dissolved organic carbon suggests reductive dissolution of Fe and Mn oxyhydroxides as a possible mechanism of Fe and Mn release in the groundwater. Therefore, there is a need to mitigate the high Fe and Mn levels in the groundwater-sourced drinking water to avoid health and suitability concerns. Treatment facilities, including the use of iron-removal sand filters and aeration, have been installed across the region to mitigate the problem. Investigation of Fe (II) concentrations in the treated household-supplied water shows a considerable decrease in the Fe (II). Implementing effective mitigation measures, such as the use of iron-removal filters, is crucial to ensure the provision of safe drinking water.

How to cite: Aind, D. A. and Mukherjee, A.: High Iron and Manganese in Groundwater of Brahmaputra River Plains: concerns for drinking water quality and remediation, EGU General Assembly 2024, Vienna, Austria, 14–19 Apr 2024, EGU24-7282, https://doi.org/10.5194/egusphere-egu24-7282, 2024.

EGU24-8335 | ECS | Orals | HS8.1.5

Graphene oxide as a component of a Permeable Reactive Barrier for aquifer pollution remediation 

Chuchao Liang, Paula Rodriguez Escales, and Xavier Sanchez Vila

Groundwater contamination sources are ubiquitous, with the heavy metal ion lead being released to the aquifer systems as a common anthropogenic contaminant. Lead can cause serious damage to both human and ecosystem health. In this sense, its remediation through sorption technologies, such as Permeable Reactive Barriers (PRBs), is basic to minimize its impact. Quartz as the most common and economically heavy metal adsorbent has been widely studied. However, the new generation of potential adsorbents, here including graphene oxide (GO), has not been fully researched. Particularly, there is little research on how to set surface adsorption models of GO, with most studies limited to batch and transport experiments.

This study aimed to investigate the performance of quartz and graphene oxide (GO) as adsorbents in PPRBs. We evaluated the adsorption capacity of quartz sand and GO under different conditions through batch experiments, examining factors including pollutant concentration, pH, and competing ions. The experimental results were validated using a coupled surface complexation and precipitation model developed with the Phreeqc code, and the findings from the batch experiments will also be used as calibration data for the Phreeqc model, and the code (PEST) was used for parameter estimation.

Keywords: Graphene oxide, Heavy metal, Permeable Reactive Barriers, Surface complexation, Phreeqc.

How to cite: Liang, C., Rodriguez Escales, P., and Sanchez Vila, X.: Graphene oxide as a component of a Permeable Reactive Barrier for aquifer pollution remediation, EGU General Assembly 2024, Vienna, Austria, 14–19 Apr 2024, EGU24-8335, https://doi.org/10.5194/egusphere-egu24-8335, 2024.

EGU24-9021 | Posters on site | HS8.1.5

Delineating Hydraulic Heterogeneity Using Fiber Bragg Grating Multi-Level Well and Hydraulic Tomography – A Case Study in Taiwan 

Jui-Pin Tsai, Tian-Chyi Yeh, Bo-Tsen Wang, Chia‐Hao Chang, and Che-Wei Liang

Hydraulic tomography (HT) is an innovative method for characterizing the heterogeneous properties of aquifers. This technique involves sequential pumping/injection tests using a network of wells, with simultaneous measurement of groundwater pressure variations. The resulting pressure data is then transformed into hydraulic heterogeneity using a geostatistical approach. Traditional HT tests utilize wells with screens at a single target depth, limiting pressure data collection to specific depth ranges. In contrast, a multilevel well-monitoring system (MLMS) employs multiple open screens at different depths, separated by packers, to prevent vertical flow connections. This configuration significantly increases the amount of pressure data compared to traditional wells. In this study, we implemented a novel multilevel well system based on fiber Bragg grating (FBG) technology for conducting HT at a contaminated site in Taiwan. A comparative analysis of hydraulic conductivity profiles obtained from HT with FBG MLMS and electrical resistivity was undertaken to validate the effectiveness of the FBG MLMS in HT applications. The results demonstrate the reliability and practicality of using an FBG multilevel well system for hydraulic tomography, highlighting its potential for enhanced data collection in heterogeneous aquifer characterization.

How to cite: Tsai, J.-P., Yeh, T.-C., Wang, B.-T., Chang, C., and Liang, C.-W.: Delineating Hydraulic Heterogeneity Using Fiber Bragg Grating Multi-Level Well and Hydraulic Tomography – A Case Study in Taiwan, EGU General Assembly 2024, Vienna, Austria, 14–19 Apr 2024, EGU24-9021, https://doi.org/10.5194/egusphere-egu24-9021, 2024.

EGU24-10433 | ECS | Orals | HS8.1.5

Applying multivariate statistics to analyse data variability in groundwater quality monitoring of contaminated sites 

Davide Sartirana, Alice Palazzi, Chiara Zanotti, Letizia Fumagalli, Andrea Franzetti, Ilaria Pietrini, Tullia Bonomi, and Marco Rotiroti

Groundwater quality monitoring of contaminated sites represents a fundamental step for implementing effective remediation strategies. Groundwater in hydrocarbon contaminated sites is often monitored using fully screened piezometers, obtaining concentration time-series that can be affected by a strong variability. This variability can complicate data interpretation and lead to prolonged site closures. One possible solution to compensate for this data variability is to increase the monitoring frequency to better detect contamination trends. Nonetheless, this solution can be less economically sustainable. Thus, understanding and quantifying variability of monitoring data is pivotal to support remediation strategies. According with McHugh et al. (2011), the variability of monitoring data could be due to: a) long-term trend in the contaminant source; b) time-independent factors related to both well (e.g., screen length and depth) and aquifer characteristics (e.g., hydraulic conductivity, unsaturated zone thickness); c) non-standardized sampling procedures (e.g., purging and sampling flow rates, vertical position of the sampling pump); d) frequent changes in the laboratory. 


This study presents the analysis and quantification of data variability of contaminant (total hydrocarbons and benzene) concentrations in a former oil refinery located in Northern Italy. Data variability was firstly quantified calculating the coefficient of variation (CV). Subsequently, different statistical analyses were conducted to identify and quantify the main factors affecting the data variability: Mann-Kendall test and Sen’s slope estimator, correlation analysis, factor analysis and multiple linear regression models. The working dataset refers to total hydrocarbons, benzene, redox-sensitive species (oxygen, nitrate, manganese, iron, sulfate and methane) and field parameters monitored in 41 fully screened piezometers from 2011 to 2021. Results pointed out that 11 years’ time-series of concentration do not show significant temporal trends, thus evidencing a relative stability of the contaminant plume. The CV of total hydrocarbons and benzene resulted lower in the plume core, characterized by methanogenesis and iron reduction, and higher in the plume fringe, characterized by sulfate, nitrate and/or oxygen reduction. The greater variability found in the fringe area is consistent with the vertical heterogeneity of biodegradation activities and redox states featuring the plume fringe (Meckenstock et al. 2015). Accordingly, factor analysis pointed out a positive correlation between CV and sulfate and a negative correlation between CV and methane. A multiple linear regression model of total hydrocarbons with sulfate and methane as independent variables (p-value of 0.031) obtained a r² value of 0.439. This result can indicate that vertical heterogeneity is able to explain the 43.9% of total variability in total hydrocarbons concentrations. The remaining percentage of data variability is due to unidentified factors, including the adoption of non-standardized sampling procedures, the change in analytical procedures and labs, etc. In conclusion, this works confirmed the ineffectiveness of monitoring groundwater quality through fully screened piezometers in hydrocarbon contaminated sites. The adoption of multi-depth monitoring system could reduce data variability in the studied site of, at least, the ~44%.

References:

McHugh et al. (2011) Gr Water Monit Remediat 31:92–101. https://doi.org/10.1111/j.1745-6592.2011.01337.x

Meckenstock et al. (2015) Environ Sci Technol 49:7073–7081. https://doi.org/10.1021/acs.est.5b00715

How to cite: Sartirana, D., Palazzi, A., Zanotti, C., Fumagalli, L., Franzetti, A., Pietrini, I., Bonomi, T., and Rotiroti, M.: Applying multivariate statistics to analyse data variability in groundwater quality monitoring of contaminated sites, EGU General Assembly 2024, Vienna, Austria, 14–19 Apr 2024, EGU24-10433, https://doi.org/10.5194/egusphere-egu24-10433, 2024.

EGU24-11221 | ECS | Posters on site | HS8.1.5

Empirical and computational study on conservative tracer migration through a single fracture 

Snigdha Pandey and Pramod Kumar Sharma

The escalation of industrialization and population growth in recent decades has increased the prominence of groundwater pollution in environmental concerns. However, accurate prediction of the contaminant migration through the fractured aquifer is still an arduous task. The current research is dedicated to evaluating the predictive accuracy of three models: the Advection Dispersion Equation (ADE), Advection Dispersion Equation with Retardation (ADE-R), and Single Rate Mobile-Immobile (MIM) model. Constant dispersivity is assumed for all the models. These models were employed to predict the migration of the solute, particularly NaCl, within a single fracture characterized by a 0.3 cm aperture and 1000 cm length and filled with fine sand. The study maintained non-Darcian flow conditions throughout the experimental runs. The simulated BTCs exhibited a non-Fickian trend and were subsequently subjected to fitting using the ADE, ADE-R, and MIM models. Notably, the MIM model proved the most adept at fitting the simulated BTCs, effectively capturing both early arrival and long tails. Conversely, the ADE-R model excelled in predicting the early arrival but fell short in fitting the long tails of the BTCs.

Keywords: ADE model; ADE-R model; Breakthrough curves; filled-single fracture; MIM model; non-Darcian flow

How to cite: Pandey, S. and Sharma, P. K.: Empirical and computational study on conservative tracer migration through a single fracture, EGU General Assembly 2024, Vienna, Austria, 14–19 Apr 2024, EGU24-11221, https://doi.org/10.5194/egusphere-egu24-11221, 2024.

EGU24-14458 | ECS | Posters on site | HS8.1.5

Model-based evaluation of efficiency of electrolysis-enhanced in-situ bioremediation for trichloroethylene using tandem circulation well 

Shuting Yang, Zhang wen, Qi Zhu, Songhu Yuan, and Yiming Li

Aerobic bioremediation combined with electrolytic enhancement, stimulating the indigenous subsurface microflora to degrade TCE, in the recirculating system of groundwater and solute induced by tandem circulation well (TCW) is a novel in-situ remediation method which has been gradually valued for its great application prospects due its  environmental and economic advantages. Previous investigations have been limited to few laboratory experiments, and neither the evaluation of remediation efficiency nor the improvement methods in application were fully understood. This study developed a reactive transport model for in-situ TCE bioremediation, simulating TCW-induced groundwater recirculating system, aerobic biodegradation process of TCE and electrolytic enhanced oxygen supply. A regionalized sensitivity analysis (RSA) was conducted based on the experimental data to quantify the influences of parameters, reduce the number of parameters inverted and provide the value of reactive kinetic parameters for this model. Different simulation cases were conducted to investigate influence of operating parameters and well spacing for remediation efficiency. The results show that increase in both current and pumping rate can improve the degradation efficiency but has a maximum degradation capacity due the limitation of saturated DO concentration in wellbore. Through a quantitative characterization of solute mixing, the model demonstrated an optimal operating parameters index (αoptimal), helping to find the optimal ratio of current and pumping rate. The results of the influence of well spacing indicate that too close an injection/extraction well distance is detrimental to degradation efficiency and the current and pumping rate need to increase in the same proportion with the increasing remediation area to remain the optimal efficiency.

How to cite: Yang, S., wen, Z., Zhu, Q., Yuan, S., and Li, Y.: Model-based evaluation of efficiency of electrolysis-enhanced in-situ bioremediation for trichloroethylene using tandem circulation well, EGU General Assembly 2024, Vienna, Austria, 14–19 Apr 2024, EGU24-14458, https://doi.org/10.5194/egusphere-egu24-14458, 2024.

EGU24-14943 | Orals | HS8.1.5

Use of Active-DTS (heat tracer experiment) and FVPDM (tracer experiment) for field quantification of groundwater fluxes 

Serge Brouyère, Laura Balzani, Pierre Jamin, Luca Varisano, and Nataline Simon

Understanding of transport processes is essential to identify the fate of contaminants in surface and subsurface water. Quantification of such transport processes requires a sound understanding and quantification of groundwater flow fields. Over the past decades, efforts have been made to develop and propose field methods that provide direct estimates of groundwater fluxes. The challenge is to propose field methods able to reflect the complexity of groundwater flow pathes in aquifer systems. In this context, we investigated the potential of two field methods to estimate groundwater fluxes in consolidated aquifers. Both FVPDM (Finite Volume Point Dilution Method) and Active-DTS (Distributed Temperature Sensing) measurements were conducted in a single piezometer in a fractured chalk aquifer. On the one hand, the FVPDM, a single-well tracer experiment, provided a measurement of the groundwater flow rate across the tested piezometer. On the other hand, the Active-DTS method was performed by deploying a Fiber-Optic (FO) cable outside the piezometer within the gravel filter. This method provided high-resolution and local groundwater flux estimates along the heated section. We relied on numerical simulations to assess the distortion of the groundwater flow field induced by the presence of the well. The groundwater flux is maximum within the well screen, where the FVPDM test was conducted. In the vicinity of the well, where the heated FO cable was installed, the groundwater flow is lower, and the flow pattern consists of converging and diverging flow lines. Thus, the position of the heated FO cable related to the flow direction is critical and can have a significant impact on the estimation of the groundwater flux. Regardless, we demonstrate that deploying the FO cable within the gravel pack is a novel and efficient approach, which opens up interesting perspectives for the use of Active-DTS measurements in consolidated aquifers to estimate vertical heterogeneities.

How to cite: Brouyère, S., Balzani, L., Jamin, P., Varisano, L., and Simon, N.: Use of Active-DTS (heat tracer experiment) and FVPDM (tracer experiment) for field quantification of groundwater fluxes, EGU General Assembly 2024, Vienna, Austria, 14–19 Apr 2024, EGU24-14943, https://doi.org/10.5194/egusphere-egu24-14943, 2024.

EGU24-15451 | ECS | Orals | HS8.1.5

Ten years of ground and surface water monitoring in the abandoned Hg-mine of Abbadia San Salvatore (central Italy): geochemical investigations before reclamation 

Federica Meloni, Barbara Nisi, Jacopo Cabasso, Giordano Montegrossi, Francesco Bianchi, Daniele Rappuoli, and Orlando Vaselli

Since February 2013, 21 periodical samples (mostly carried out seasonally) of ground and surface waters within and outside the former Hg-mine of Abbadia San Salvatore (Tuscany, central Italy) have been analyzed for the main composition, Hg, As, Sb, and, in most cases,  selected trace elements. The groundwater samples refer to a phreatic aquifer at depths between 5 and 10 m, characterized by low transmissivity and whose waters are interacting with terrains containing tailings derived from the production of liquid mercury by roasting cinnabar. The temperatures are thus strongly affected by seasonal variation, while the pH values are mostly circumneutral. The results evidenced the presence of relatively high concentrations of Hg and, to a minor extent, As and Sb, forcing the local authorities to intervene to test specific strategies to remove mercury. Strikingly high seasonal variations of the geochemical facies were observed and were apparently not related to meteoric precipitations. The variability of the main composition, i.e. Ca(Mg)-SO4, Ca(Mg)-HCO3 and, subordinately, Na-HCO3, is intimately associated with the large differences recorded in terms of Hg, and, to a lesser extent, As and Sb. This is likely related to the water-rock interaction processes governed by the dissolution of carbonates and gypsum/anhydride (typical minerals recognized in the waste materials used to fill a paleo-valley in the SW margin of the mining area). The highest recorded Hg concentration was 407 µg/L during the wet period, decreasing down to 81.4 µg/L in the dry period, when the groundwater level decreases in most boreholes by up to 2 m. This also results in an increasing electrical conductivity. The low transmissibility of this shallow aquifer is clearly evidenced when the piezometers are purged before sampling, as they tend to be rapidly emptied. The groundwaters upstream and downstream of the mine are found to have a concentration of Hg < 1 ppb. This suggests that there is no interference between the mining area aquifer and the volcanic one. Apparently, no significant correlations were found between Hg and other metals, probably suggesting that the presence of liquid Hg often recovered in the piezometer cores is perhaps the main source of mercury. The speciation of Hg, As, and Sb of selected ground and superficial waters was computed by PHREEQC modelling. In addition, to simulate how Hg is vehiculated through the aquifer, a chemical transport model was developed. Presently, the installation of a hydraulic barrier is the most suitable solution to minimize the water-rock interaction processes, responsible for the recorded Hg variability, possibly coupled with additional operations, e.g. extractant agents or filters, to remove mercury before discharging the pumped waters into a surface stream.

How to cite: Meloni, F., Nisi, B., Cabasso, J., Montegrossi, G., Bianchi, F., Rappuoli, D., and Vaselli, O.: Ten years of ground and surface water monitoring in the abandoned Hg-mine of Abbadia San Salvatore (central Italy): geochemical investigations before reclamation, EGU General Assembly 2024, Vienna, Austria, 14–19 Apr 2024, EGU24-15451, https://doi.org/10.5194/egusphere-egu24-15451, 2024.

EGU24-15489 | Posters on site | HS8.1.5

Design of system and method on field-scale solute migration experiment for evaluating radionuclide’s migration properties at a deep borehole 

Jiwon Park, Jun-Young Ahn, Jong-Hwa Yi, Jeong-Yong Cheon, Myeong-Jae Yi, and Seong-Chun Jun

Disposal methods for storing high-level radioactive waste deep underground are being researched and implemented worldwide. In constructing a high-level radioactive waste disposal facility, groundwater reaction front moves and geochemical buffering capacity may be changed, affecting the long-term storage stability. Although various studies have been conducted in this regard in Korea, field-scale studies are still in shortage, in cases compared to overseas cases. This study aims to establish a long-term solute migration experiment system and experimental method for deep depths, to identify the migration and retardation characteristics of released nuclides in the deep underground environment.

For field-scale tests, KURT(KAERI Underground Research Tunnel) was constructed in 2006 and in-situ solute migration tests were conducted. However, that was conducted in shallow depth, which has limitations in realizing an actual disposal environments. Therefore, the long-term solute migration experiment to be designed in this study targets underground depths, where reduced-state groundwater exists and disposal site construction is considered, to get empirical data in deep depth. The in-situ solute migration experiment system designed in this study is composed of an injection part and an extraction part. The injection unit was designed to be in charge of injecting simulated nuclides into the injection borehole. The extraction unit was designed to extract groundwater, including the injected tracer, to obtain a sample for analysis and to measure the properties of groundwater flowing through fractured rock in real-time. Both sorbing and non-sorbing tracers are used in long-term solute migration experiments. The non-sorbing tracers are suitable such as Eosin B, fluorescein sodium, and potassium bromide. The sorbent tracers which can simulate the behavior characteristics of radionuclides are suitable such as rubidium, nickel, zirconium, and samarium. Using the solute migration experiment system and experimental method designed in this study, a long-term solute migration experiment will be carred out in the deep depths around KURT, to obtain the results of the radionuclides’ migration and retardation characteristics for the deep depths.

Acknowledgements

This research was supported by the National Research Foundation of Korea(NRF) under the project 'Development of Core Technologies for the Safety of Used Nuclear Fuel Storage and Disposal; NRF-2022M2E1A1052570'.

How to cite: Park, J., Ahn, J.-Y., Yi, J.-H., Cheon, J.-Y., Yi, M.-J., and Jun, S.-C.: Design of system and method on field-scale solute migration experiment for evaluating radionuclide’s migration properties at a deep borehole, EGU General Assembly 2024, Vienna, Austria, 14–19 Apr 2024, EGU24-15489, https://doi.org/10.5194/egusphere-egu24-15489, 2024.

EGU24-16396 | ECS | Orals | HS8.1.5

Assessment of Fate and Transport of Heavy Metals (Cr, Cd) in Hardrock Aquifers 

Aishwarya Bhattacharya, Brijesh Kumar Yadav, and Nitin Khandelwal

This study delves into chromium (Cr) and cadmium (Cd) behavior in varied hard-rock aquifer lithologies, exploring their sorption capacities and transport characteristics. The research aims to understand how these heavy metals affect groundwater quality in lithologically diverse settings. Hard rocks, known for their low porosity and heterogeneity, significantly influence the movement of contaminants through fractures and surfaces. Cadmium, a toxic metal primarily from human activities like mining and industrial discharge, poses significant risks to ecosystems. Chromium, particularly its hexavalent form, Cr (VI), originating from industrial and agricultural sources, is also a concern due to its carcinogenicity. WHO guidelines recommend limits of 0.003 mg/L for Cd²⁺ and 0.05 mg/L for Cr (VI) in groundwater, often exceeded in many regions, indicating environmental hazards and health risks. The study involved characterizing hard rock materials and conducting batch-sorption and column transport experiments to gauge contaminant-rock interactions. Results indicated varying sorption capacities across lithologies showing minimum value by granite (499.15 ± 99.41 mg/kg) and maximum value by limestone (872.37 ± 2.37 mg/kg) for 7ppm concentration. In case of studied aquifer systems, basaltic aquifers are demonstrating superior chromium retention compared to granitic ones. Ionic competition minimally affected sorption, prompting the use of NaCl solutions in subsequent experiments. These findings offer insights into the complex interplay between lithological compositions and contaminant sorption, crucial for groundwater management and environmental protection strategies.

Key words: Rocks and minerals, contaminant interaction, batch sorption, column transport.

How to cite: Bhattacharya, A., Yadav, B. K., and Khandelwal, N.: Assessment of Fate and Transport of Heavy Metals (Cr, Cd) in Hardrock Aquifers, EGU General Assembly 2024, Vienna, Austria, 14–19 Apr 2024, EGU24-16396, https://doi.org/10.5194/egusphere-egu24-16396, 2024.

EGU24-16467 | Orals | HS8.1.5

Contaminant Source Identification via Transfer Learning on Multifidelity-Data. 

Alessia Chiofalo, Valentina Ciriello, and Daniel M. Tartakovsky

Reconstruction of contaminant release history is crucial for subsurface remediation actions. This task amounts to a high-dimensional inverse problem, whose solution requires multiple forward solves of contaminant transport equations. It also must cope with both sparse observations of solute concentration and subsurface heterogeneity. The computational burden of solving this inverse problem can be reduced by deploying a surrogate model, e.g., neural networks (NNs), which provides a low-cost approximation of its expensive physics-based counterpart. However, to construct such NNs, a large amount of high-fidelity forward runs may be required to provide training data, and these computations might be as cost-prohibitive as the solution of the inverse problem. To address this issue, we generate multi-fidelity data by running simulations of the forward transport model on fine and coarse meshes. The resulting high- and low-fidelity temporal snapshots of solute concentration are subsequently used, with a Transfer Learning technique, to train a Convolutional NN to identify the initial contaminant source location. The training is divided into three phases. In the initial phase, the training exclusively employs low-fidelity data. In the subsequent two steps, the learning phase for the network is finalized with only a relatively small number of high-fidelity data. The obtained results demonstrate that the transfer-learning-based surrogate model is a promising tool to reduce the computational cost as well as to obtain accurate solutions of high dimensional inverse problems.

How to cite: Chiofalo, A., Ciriello, V., and Tartakovsky, D. M.: Contaminant Source Identification via Transfer Learning on Multifidelity-Data., EGU General Assembly 2024, Vienna, Austria, 14–19 Apr 2024, EGU24-16467, https://doi.org/10.5194/egusphere-egu24-16467, 2024.

EGU24-20058 | ECS | Orals | HS8.1.5

Combining Markov-Chain Monte Carlo Sampling and Geostatistics to Quantify Contaminant Mass Discharge and Uncertainty 

Anton Bøllingtoft, Mads Troldborg, Poul L. Bjerg, and Nina Tuxen

Contaminated legacy sites pose a risk to the environment and human health worldwide. The accurate characterization and monitoring of subsurface contamination is crucial for effective risk assessment, management and prioritization of contaminated sites and ultimately ensures a more efficient and sustainable use of the allocated resources.

Contaminant mass discharge (CMD) integrates two important features of contaminant risk: concentration and mobility. CMD is increasingly being incorporated into risk assessments of contaminated sites as an alternative to point-value concentration-based risk assessment. The CMD is estimated by interpolating and integrating multilevel point measurements of concentration and flow across a control plane of interest. However, the geological settings at contaminated sites are typically subject to large heterogeneities resulting in complex hydrogeological conditions and significant spatial variability in the CMD, which combined with limited data availability renders it impossible to determine exact or error-free estimates.

We present a geostatistical method for quantification of CMD uncertainties in a multilevel control plane downstream a contaminated site aimed at practical implementation, with focus on the interpolation and associated uncertainty related to the concentration measurements.

The method uses geostatistical conditional simulation and applies an analytical solution of a macro-dispersive transport equation to simulate the spatially varying global mean. A Box-cox transformation is employed to ensure non-negative concentration values and account for skewness. The method is a development of that presented by Troldborg et al. (2012). We have refined the parameter identification by applying a Markov-Chain Monte Carlo (MCMC) algorithm for parameter sampling and furthermore constrained the prior sampling distributions to ensure the posterior is linked to conceptual site-specific knowledge. This links the CMD estimation to the conceptual site model and allows for source-zone data and geologic knowledge to be incorporated into the CMD estimate, which increases credibility, especially for low sampling density transects. The MCMC algorithm efficiently explores the high-dimensional parameter space, generating a statistically representative sample of geostatistical, transformation and transport-model parameters, thereby characterizing the uncertainty associated with model parameter identification in heterogeneous geologic settings. The result of the conditional simulations is an ensemble of concentration realizations that all honor the measured concentration data and capture the spatial variability of the contaminant plume.

The method has successfully been applied to determine the CMD uncertainty at multiple contaminated sites. It is firstly demonstrated at a site with substantial data and prior knowledge, and secondly at two sites to assess the challenges related to prior knowledge, sampling density and different hydrogeological conditions.

The proposed method represents a practical solution for quantifying CMD uncertainty at contaminated sites. By combining MCMC sampling and geostatistics, it overcomes the limitations of traditional deterministic methods and provides involved stakeholders with probabilistic estimates for better informed remediation and risk assessment practice when managing contaminated soil- and groundwater. 

References
Troldborg, M., Nowak, W., Lange, I. V., Pompeia Ramos dos Santos, M. C., Binning, P. J., and Bjerg, P.L. (2012). Application of bayesian geostatistics for evaluation of mass discharge uncertainty at contaminated sites. Water Resources Research, 48(9):W09535. DOI: 10.1029/2011WR011785

How to cite: Bøllingtoft, A., Troldborg, M., L. Bjerg, P., and Tuxen, N.: Combining Markov-Chain Monte Carlo Sampling and Geostatistics to Quantify Contaminant Mass Discharge and Uncertainty, EGU General Assembly 2024, Vienna, Austria, 14–19 Apr 2024, EGU24-20058, https://doi.org/10.5194/egusphere-egu24-20058, 2024.

EGU24-227 | ECS | Orals | HS8.1.7 | Highlight

Deuterium Labels to Study Biodegradation of Plastics with Raman Spectroscopy  

Kara Müller, Martin Elsner, and Natalia P. Ivleva

Biodegradable polymers are considered one of the solutions to the plastic accumulation problem in terrestrial and aquatic systems. It is important to ensure complete degradation since residual micro- and nanoplastics influence soil health and its biota. During biodegradation, microorganisms first colonize the plastic surface, where they then excrete enzymes responsible for the depolymerization. Finally, the mono- and oligomers are utilized by the microorganisms as energy sources (mineralization into CO2) or for biomass formation. Only by studying the last step the final fate of the anthropogenic pollutant is revealed. Conventionally CO2 concentrations are measured to monitor microbial activity in samples exposed to plastics in comparison to plastic-free controls. However, this is in no direct relation to the polymer and priming effects or unknown processes due to bacteria adaptation might blur the analysis. Stable isotope labels can be traced from the polymer into 13CO2, D2O and microbial biomass to overcome those obstacles. While many publications covered 13CO2 monitoring, only Zumstein et al. additionally traced the carbon label into fungal biomass with nanoscale secondary ion mass spectrometry.[1] In our approach, we use deuterium instead of carbon labels due to reduced costs and enhanced availability of labeled compounds. Although we lose the ability to contribute to a closed mass balance, we use non-destructive Raman microspectroscopy to gain additional chemical information on a single cell level. Heavier isotopes lead to a red shift of the according Raman band due to their larger mass. Deuteration of microbial lipids, proteins, DNA, and carbohydrates leads to an extensive shift of C-H vibrations into the Raman-silent region. C-D vibrations can therefore be quickly detected with a facilitated data analysis.

We incubated the environmental bacterium Sphingomonas koreensis with deuterated polylactic acid (dPLA) in an aqueous medium at room temperature under aerobic conditions. After 3 weeks, we observed an additional biomass spectrum for about 50 % of the measured cells besides undeuterated biomass and dPLA particles. After 13 weeks, this spectrum was already recorded for all cells. While the biomass and C‑H str. vibrations clearly indicate microbial biomass, the C-D vibrations of the additional spectra differ from reference deuterated biomass spectra obtained with glucose-d12 and D2O labeling. After comparing these untypical C-D vibrations to self-obtained and literature reference spectra, they were interpreted to originate from deuterated biomass with strongly deuterated lipids and inhibited labeling of proteins. Now that we can trace deuterium from labeled plastics into microbial biomass, we want to extend the approach to terrestrial environments. Therefore, cell isolation from the soil matrix was successfully adapted from the literature[2] to gain adequate Raman spectra. In ongoing experiments, environmental samples will first be exposed to unlabeled PLA for bacteria adaptation and then used for incubation with dPLA in soil microcosms. 

References:

  • Zumstein, M.T., et al., Science Advances, 2018. 4(7): p. eaas9024.
  • Eichorst, S.A., et al., FEMS Microbiology Ecology, 2015. 91(10).

Acknowledgments: Deutsche Forschungsgemeinschaft (DFG) Project IV 110/2-2 and International Atomic Energy Agency (IAEA) for funding different parts of the research. Dr. Jürgen Allgaier (FZ Jülich) for providing the deuterated PLA.

How to cite: Müller, K., Elsner, M., and Ivleva, N. P.: Deuterium Labels to Study Biodegradation of Plastics with Raman Spectroscopy , EGU General Assembly 2024, Vienna, Austria, 14–19 Apr 2024, EGU24-227, https://doi.org/10.5194/egusphere-egu24-227, 2024.

EGU24-1667 | ECS | Orals | HS8.1.7 | Highlight

Water flow and MP transport in sandy soils imaged with neutron radiography and X-ray CT 

Andreas Cramer, Anders Kaestner, Pascal Benard, Mohsen Zarebanadkouki, Peter Lehmann, and Andrea Carminati

Microplastic (MP, ⌀ < 5 mm) can be found worldwide. Besides aquatic environments, terrestrial ecosystems are reported to contain large amounts of MP of different origin, polymer type, shape, size, and state of degradation. Furthermore, soil is considered the largest sink of MP in terrestrial ecosystems. Though, little is known about the effects of MP on soil and its interaction with water flow. Since MP is inherently hydrophobic, the transport of MP and the flow of water interact with each other. However, the extent of MP transport in soils and the interactions with water flow remain largely unexplored.

To approach these questions, neutron and x-ray imaging methods were applied. Simultaneous neutron and x-ray CT at the beamline ICON (Paul-Scherrer-Institute) during wetting and drying cycles of a model porous media mixed with MP in different contents were used to monitor MP in different contents (size between 20-75 μm) and water distribution during repeated wetting and drying cycle of a sandy substrate (particle size between 700-1200 μm). Here, the initial MP configuration as well as the configuration after each wetting and drying cycle were captured in three dimensions. During the wetting process, time-series neutron radiographies imaged the water infiltration patterns.

MP reduced water infiltration in soils. High MP contents caused local water reppellency and were by-passed by perculating water. MP impacted the verticle distribution of water, reducing the local soil water content and driving water to deeper soil layers. Significant transport of MP were not visible during the wetting and drying cycles, plausibly because water by-passed the pore space containing MP. Rapid and preferential infiltration into deeper areas of the sample as well as low local volumetric water contents during the course of infiltration are evident. The extent seems to be MP content dependent.

In conclusion, MP-water interactions in soils have a strong impact on water flow and MP transport and fate in soils. Transport processes like advection, which are significant for wettable particles, play only a minor role in transporting low wettability particles like MP under unsaturated conditions. Though, MP seems to be spatially re-configured. This might be due to hydrophobic interactions between water and MP. Hydrophobic MP has an affinity towards adsorbing to the air-water interface rather than being dispersed in water when in contact.

How to cite: Cramer, A., Kaestner, A., Benard, P., Zarebanadkouki, M., Lehmann, P., and Carminati, A.: Water flow and MP transport in sandy soils imaged with neutron radiography and X-ray CT, EGU General Assembly 2024, Vienna, Austria, 14–19 Apr 2024, EGU24-1667, https://doi.org/10.5194/egusphere-egu24-1667, 2024.

EGU24-2002 | Orals | HS8.1.7

Tracing sources of diffuse PFAS pollution: PFAS contamination in soil near a Municipal Waste-to-Energy plant 

Joris Dijkstra, Noemi Brunschwiler, and Jasper Griffioen

Poly- and perfluoroalkyl substances (PFAS), among which are perfluorooctanoic acid (PFOA) and perfluorooctane sulfonate (PFOS), are common contaminants in Dutch soils, originating from fluorpolymer- factories (for PFOA), firefighting training grounds (for PFOS), or other often unknown sources. Previous research suggests that Municipal Waste-to-Energy (WtE) plants may be a source for diffuse PFAS contamination in the Netherlands, where 13 WtE plants are currently operational. Even though PFAS compounds should be eliminated at the temperatures at which WtE plants operate, the existence of “cold spots” in the oven is known and may imply that PFAS survive the combustion process. To investigate the potential contribution of WtE plants to diffuse PFAS contamination, a case study was set up in which topsoils surrounding a WtE plant in Alkmaar (Netherlands) were investigated. Ten locations were selected of which the soil profiles were undisturbed at least for 50 years and for which no other known PFAS sources are nearby. Eight locations were in the predominant wind direction (from SW to NE) and within a 5 km radius from the WtE plant. Two reference locations were located upwind. Each location was drilled to a depth of 80 cm and sampled with 10 cm intervals. Samples were analysed for 10 different PFAS and various bulk chemical and physical soil properties. In addition, PFAS was analysed in ashes from several modern WtE plants.

PFAS content is generally above national threshold values in the top layer of the soil (<30 cm) downwind of the WtE plant. In addition, considerable PFAS contents were detected in the ashes from WtE plants, indicating that PFAS are able to survive the combustion. The PFAS soil profiles follow a bell-shaped pattern with the highest content observed at 10-20 cm depth rather than directly at the surface. This indicates that most of the PFAS contamination originates from past emissions which have now decreased. A weak correlation between the distance from the waste incinerator and the measured PFAS content in the soil profile is found. Hydrus-1D, a reactive transport model code, was used to calculate content-depth profiles of PFOA and PFOS under three different emission/deposition scenarios to assess whether the emissions could account for the observed contamination depth patterns. The model calculations support the hypothesis that the observed PFAS content-depth profile can be explained by historical emissions and that the main source of contamination has decreased. This observation is consistent with the termination of a previous waste incineration plant, located on nearly the same spot, in 1996. The old incineration plant is likely to have had a less efficient combustion process. Based on the results of this study, a contribution of waste incineration to diffuse PFAS contamination is likely; additional research is needed to investigate the influence of other possible sources.

How to cite: Dijkstra, J., Brunschwiler, N., and Griffioen, J.: Tracing sources of diffuse PFAS pollution: PFAS contamination in soil near a Municipal Waste-to-Energy plant, EGU General Assembly 2024, Vienna, Austria, 14–19 Apr 2024, EGU24-2002, https://doi.org/10.5194/egusphere-egu24-2002, 2024.

The importance of nanoscale roughness factors on the fate and transport of colloidal particles has been well emphasized in recent literature; however, most of the works either only used modeling tools or had limitations on unravelling the effect experimentally due to the lack of well-defined systems to solely capture the role of the nanoscale roughness. Therefore, this study aimed to “experimentally” observe the adhesion characteristics of environmental colloidal particles on a surface with nanoscale roughness (NR) factors (i.e., height and fraction) under environmentally relevant solution chemistry conditions. Prior to analyzing the effect of the NR, the solid surface was first fabricated. AFM was employed to confirm the adhesion force between the target material and the uniformly fabricated rough surface, which can influence the contact area. To the best of our knowledge, our study is the first to experimentally quantify the sole effect of the NR with well-controlled NR-surfaces via the adhesion force measurement in aqueous system. The findings are important to verify the role of NR in the interaction of particles with different shapes (i.e., sphere and plateau) and sizes (i.e., 2 μm to 15 μm in length or diameter), which the authors believe will provide new insights to the society on better understanding the role of NR in the interaction of environmental colloidal particles.

This work was supported by the National Research Foundation of Korea (NRF) grant funded by the Korea government (MSIT) (No. RS-2022-00166099).

How to cite: Hwang, G. and Kim, H.: Adhesion forces measured between colloids and nanoscale surface roughness in aqueous solution, EGU General Assembly 2024, Vienna, Austria, 14–19 Apr 2024, EGU24-2071, https://doi.org/10.5194/egusphere-egu24-2071, 2024.

EGU24-2545 | ECS | Posters on site | HS8.1.7

Copper nanoparticles: Insecticidal action, resistance management  and effect on  endosymbiont abundance in olive fruit fly Bactrocera oleae  

Anastasios Malandrakis, Kyriaki Varikou, Νektarios Kavroulakis, Antonis Nikolakakis, Irene Dervisi, Chrysavgi Reppa, Stefanos Papadakis, Maria Holeva, and Constantinos Chrysikopoulos

The effectiveness of copper containing nanoparticles (Cu/CuO-NPs) against insecticide-resistant olive fruit flies (Bactrocera oleae) and their impact on the insect’s reproductive and endosymbiotic parameters were evaluated. The insecticidal activity of both nano and bulk copper [Cu(OH)2] was comparable or greater than that of the reference insecticide deltamethrin at recommended doses as revealed by feeding experiments. A significant synergistic effect between Cu-NPs or CuO-NPs and deltamethrin was observed in terms of adult mortality. Furthermore, the deltamethrin + Cu-NPs combination decreased the total number of offspring as compared with the untreated control. The above combination also significantly decreased the mean number of stings, pupae, female and total number offspring of the surviving female, compared to deltamethrin applied alone. The abundance of the Candidatus Erwinia dacicola- a B. oleae larvae bacterial gut endosymbiont- was adversely affected by bulk and nanosized copper. Concluding, Cu-NPs have a great potential to control insecticide-resistant B. oleae populations by reducing adult and larval survival and fecundity, and provide the means for reducing the environmental footprint of pesticides by minimizing their required doses.

This study was co-financed by the European Regional Development Fund of the European Union and Greek national funds through the Rural Development Program (RDP/ΠΑΑ) 2014 – 2020, under the call "Cooperation for environmental projects, environmental practices and actions for climate change“ (project code: Μ16SΥΝ2-00354).

How to cite: Malandrakis, A., Varikou, K., Kavroulakis, Ν., Nikolakakis, A., Dervisi, I., Reppa, C., Papadakis, S., Holeva, M., and Chrysikopoulos, C.: Copper nanoparticles: Insecticidal action, resistance management  and effect on  endosymbiont abundance in olive fruit fly Bactrocera oleae , EGU General Assembly 2024, Vienna, Austria, 14–19 Apr 2024, EGU24-2545, https://doi.org/10.5194/egusphere-egu24-2545, 2024.

The increasing threat from plastic pollution has promoted the widespread application of biodegradable plastic. In agriculture, biodegradable plastic, mainly in the form of biodegradable plastic mulch, has received a lot of attention due to its in-situ degradability and satisfying agronomical performances. However, biodegradable plastic mulches do not degrade instantaneously but rather fragment into micro- and nanoplastics, and these micro- and nanoplastics could reside in soil or even migrate along soil profiles. Here, we investigated the mobility of pristine and weathered polybutylene adipate co-terephthalate (PBAT) nanoplastics in sand columns under unsaturated flow conditions. We further studied the effect of proteins on the mobility of PBAT nanoplastics with both negatively charged bovine serum albumin and positively charged lysozyme. We found that (1) the pristine and the weathered PBAT nanoplastics were mobile with or without the presence of proteins; (2) the positively charged lysozyme inhibited the transport of PBAT nanoplastics; and (3) lower water saturation inhibited the transport of PBAT nanoplastics via physical straining. These results suggest that biodegradable nanoplastics generated from biodegradable plastic mulches are mobile and may transport readily along soil profiles.

How to cite: Yu, Y. and Flury, M.: Transport of Biodegradable Nanoplastics Affected by Weathering and Proteins in Unsaturated Porous Media, EGU General Assembly 2024, Vienna, Austria, 14–19 Apr 2024, EGU24-3604, https://doi.org/10.5194/egusphere-egu24-3604, 2024.

EGU24-4260 | ECS | Posters on site | HS8.1.7

Occurrence and Distribution of Per- and Polyfluoroalkyl Substances (PFAS) in the Coastal Groundwater of Eastern Saudi Arabia 

Mohammed Benaafi, Bassam Tawabini, Ahmed M. Al-Areeq, and Isam Aljundi

PFAS (per- and polyfluoroalkyl compounds) have emerged as prevalent pollutants in groundwater due to their vast past utilization in consumer products and industrial applications, coupled with their remarkable persistence. The current research investigated 17 PFAS chemicals in 10 groundwater samples from coastal multi-layered aquifer systems in Eastern Saudi Arabia, with seven samples from shallow aquifers (2-30 m) and three samples from deep aquifers (>70 m). The analysis utilized solid phase extraction and liquid chromatography-tandem mass spectrometry (LC-MS/MS) in accordance with EPA Method 537 and ISO 25101, with a detection limit of 10 ng/L. The results show that four PFAS substances were detected with values above the detection limits in shallow groundwater samples: perfluorobutane sulfonic acid (PFOS), perfluorooctanoic acid (PFOA), perfluorooctanoic acid (PFBA), and perfluorobutane sulfonic acid (PFBS). In contrast, no PFAS compound was found in the deep wells. PFOS was found in 29% of the samples (2 out of 7) with a maximum value of 23.6 ng/L. PFBA and PFBS were found in 14% of samples at 11 and 53 ng/L, respectively. PFOA was found to have a concentration of 10.9 ng/L and a detection frequency of 14%. The occurrence of PFAS, although currently at minimal levels, suggests potential pollution of the coastal aquifer that requires continuous monitoring and assessment to determine the source, the extent of the contamination, and its potential impact on human health and the environment. Additionally, while the highest PFOS concentration remained below the EPA's lifetime health advisory of 70 ng/L, it exceeded Vermont's PFOS drinking water standard of 20 ng/L. Recent research has linked PFOS exposure through drinking water to immune effects in infants at levels as low as ten ng/L. Further research is needed to investigate the potential spreading of PFAS plumes, identify potential sources of contamination, assess the extent of environmental and human health impacts, and develop effective remediation strategies. The findings add to the global contribution of PFAS contamination, underscoring the importance of having a proactive approach to monitoring and managing these persistent environmental pollutants.

How to cite: Benaafi, M., Tawabini, B., M. Al-Areeq, A., and Aljundi, I.: Occurrence and Distribution of Per- and Polyfluoroalkyl Substances (PFAS) in the Coastal Groundwater of Eastern Saudi Arabia, EGU General Assembly 2024, Vienna, Austria, 14–19 Apr 2024, EGU24-4260, https://doi.org/10.5194/egusphere-egu24-4260, 2024.

         In order to investigate the migration of nanoparticles in porous media, the model developed by Katzourakis and Chrysikopoulos (2021) is applied  to simulate the transport of aggregating nanoparticles under various initial conditions. In the aforementioned model, nanoparticles may collide with each other and form larger particle structures with different mobility and reactivity characteristics. Individual particles as well as aggregates can be found suspended in aqueous phase or attached, reversibly and/or irreversibly, on the solid matrix. The aggregation process modelled after the Smoluchowski population balanced equation (PBE), is coupled with the conventional advection-dispersion-attachment (ADA) equation to form a system of coupled equations that govern the transport of aggregating nanoparticles. Particle collisions are expected to increase exponentially with increasing initial number of injected particles (N0). Therefore, substantially pronounced aggregation is expected when N0 is increased. Similarly, the initial particle diameter distribution of the injected particles is expected to affect the average size of aggregates and in turn influence their mobility in a porous medium. Several model simulations were performed with different N0 and particle diameter distributions. The results indicated the strong importance of taking into account the initial particle concentration and realistic particle diameter population distribution into consideration.

How to cite: Katzourakis, V. and Chrysikopoulos, C.: Investigating the effects of initial concentration and population distribution on the transport of aggregating nanoparticles in porous media, EGU General Assembly 2024, Vienna, Austria, 14–19 Apr 2024, EGU24-4290, https://doi.org/10.5194/egusphere-egu24-4290, 2024.

EGU24-6160 | Orals | HS8.1.7 | Highlight

Why nanoplastics do not enhance the transport of contaminants in the critical zone 

Thilo Hofmann, Charlotte Henkel, Thorsten Hueffer, and Stephanie Castan

The impact of nanoplastics on the co-transport of emerging contaminants is a subject of ongoing debate. Agricultural soils face potential contamination from micro- and nanoplastics through diverse agricultural practices. Various authors argue that the substantial surface area of small particles and their high sorption potential may considerably augment the mobility of numerous contaminants within the critical zone. Concerns have been expressed regarding the role of micro- and nanoplastics as carriers for organic contaminants into deeper soil layers, posing a potential threat to groundwater resources, particularly in agricultural soils where sewage sludge and plant protection products are frequently applied.

In this study, we investigated the correlation between transport and desorption timescales by employing two diffusion models for micro- and nanoplastics ranging from 100 nm to 1 mm. To assess the transport of contaminants bound to these plastics, we examined the diffusion and partitioning coefficients of prominent agrochemicals and additives, along with commonly used polymers like polyethylene and tire material. Our modeling analysis reveals that the desorption rate of most organic contaminants is too rapid for micro- and nanoplastics to serve as effective transport facilitators in soil. Notably, the transport of contaminants facilitated by microplastics was observed to be significant only for highly hydrophobic contaminants under preferential fast-flow conditions.

While micro- and nanoplastics could potentially introduce harmful contaminants into agricultural soils, our study suggests they do not significantly enhance contaminant mobility. Importantly, we found that nanoplastics, in particular, do not promote contaminant relocation under conditions relevant to almost all contaminants of concern.

How to cite: Hofmann, T., Henkel, C., Hueffer, T., and Castan, S.: Why nanoplastics do not enhance the transport of contaminants in the critical zone, EGU General Assembly 2024, Vienna, Austria, 14–19 Apr 2024, EGU24-6160, https://doi.org/10.5194/egusphere-egu24-6160, 2024.

EGU24-7899 | Orals | HS8.1.7

Immobilization of Per- and Polyfluoroalkyl Substances (PFAS) – Experimental and Model-based Analysis of Leaching Behavior 

Claus Haslauer, Thomas Bierbaum, Simon Kleinknecht, and Tobias Junginger

Per- and polyfluoroalkyl substances (PFAS) are persistent organic chemicals. Within the diverse PFAS class with thousands of individual species, the perfluoroalkyl acids (PFAAs) are of environmental concern due to their pronounced stability, prevalent occurrence at contaminated sites globally, and their detrimental health impacts.

On contaminated sites, soil contamination often originates from sources like firefighting foams, industrial waste, or fertiliser from processed waste. This study is closely linked to the “Rastatt case”, where more than 1000 ha agricultural land are contaminated with PFAS due to the application of paper-fiber biosolids, and investigates PFAS immobilization as a strategy to mitigate the risk of groundwater contamination.

The current understanding of the fate and transport of PFAS within the subsurface is limited, largely due to the complex sorption processes and unidentified precursor compounds and transformation rates. The efficacy and long-term stability of PFAS immobilization are crucial parameters for field applications but have not been verified to date. Furthermore, a standardized experimental methodology for testing PFAS immobilization has not been established.

This presentation characterizes PFAS leaching behaviors, examines the efficacy and long-term stability of PFAS immobilization, and assesses the applicability of experimental methods in investigating PFAS immobilization. Mathematical models are employed to characterize various sorption processes.

We found that the complexity of PFAS leaching with rate-limited sorption and biotransformation contribute to long-term leaching. Sorption to air-water-interfaces (AWIs) was highlighted as a potentially dominant retention mechanism under variably-saturated conditions.

The influence of PFAS chain length on the immobilization efficacy was evident. Delayed breakthrough of short-chain PFAAs and prolonged leaching at low rates indicate that PFAS sorption to the immobilization agents is reversible. 

Long-term effects of PFAS immobilization were examined in column experiments with extended durations. The prediction of leaching based on this column data is compromised by indistinct precursor transformation and unaccounted AWI sorption. A thorough examination of PFAS leaching dynamics was achieved through lysimeter experiments, revealing the AWI sorption influence. However, moderate acceleration in PFAS leaching compared to field scenarios constrains long-term predictions.

This presentation sheds light on the benefits and constraints on the application of PFAS immobilization for a large non-point source.

How to cite: Haslauer, C., Bierbaum, T., Kleinknecht, S., and Junginger, T.: Immobilization of Per- and Polyfluoroalkyl Substances (PFAS) – Experimental and Model-based Analysis of Leaching Behavior, EGU General Assembly 2024, Vienna, Austria, 14–19 Apr 2024, EGU24-7899, https://doi.org/10.5194/egusphere-egu24-7899, 2024.

EGU24-8778 | Orals | HS8.1.7

Nanoparticle Heteroagglomeration with Natural and Synthetic Suspended Particulate Matter 

Frank von der Kammer, Helene Walch, Raisibe Florence Lehutso, and Thilo Hofmann

The assessment of nanoparticle NP transformation in the aquatic environment is essential for comprehending the fate of nanoparticles and conducting accurate risk assessments. Nanoparticles encompass a variety of materials, including manufactured nanomaterials, nanoplastics, and natural colloids. Environmental transformation comprises four main routes: dissolution/leaching, abiotic transformation/degradation, biotic transformation/degradation and (hetero-)agglomeration.

The kinetics of heteroagglomeration play a pivotal role in nanoparticle (NP) transport mechanisms in rivers. The parametrization of heteroagglomeration processes between NPs and suspended particulate matter (SPM) was hampered by the variability of SPM floc composition and conformation/size on spatial and temporal scales. Available analytical methods were either unsuitable or required unrealistic high NP concentrations. The SPM used in heteroagglomeration studies was either unrealistically simple (silica particles, clays) or exceptionally unique (specific natural SPM sample).

After a thorough analysis of mechanisms of floc formation and the relevant building blocks of natural, riverine SPM and the successful and reproducible laboratory synthesis of model SPM flocs, we designed a method to determine the heteroagglomeration attachment efficiency αhetero  under environmentally relevant conditions. This allows well controlled laboratory experiments as well as standardization for risk assessment purposes. The heteroagglomeration attachment efficiency () constitutes the most suitable parametrization of particle-particle interactions. The presented test matrix combines synthetic model SPM flocs with the model freshwater composition suggested in OECD TG 318, both designed to represent agglomeration-relevant characteristics of natural systems. The test matrix was employed in a newly developed stirred-batch method addressing the shortcomings of existing strategies to determine αhetero. Time-resolved inductively coupled plasma mass spectrometry allowed to work at realistic concentrations of NP (5 ppb) and SPM flocs (20 and 40 ppm).

The approach was evaluated by testing the heteroagglomeration of CeO2 nanoparticles in four different combinations of SPM and water chemistry.

  • Natural flocs in natural water
  • Natural flocs in synthetic (TG318) water
  • Synthetic flocs in natural water
  • Synthetic flocs in synthetic water

The results show the applicability and precision of the invented test system and the synthetic SPM but also reveal some differences between results from natural and synthetic water chemistry which can be explained by the type and quality of the NOM. Calculated transport distances for 50% unassociated NPs reached up to 370 km, what is unexpectedly high.

How to cite: von der Kammer, F., Walch, H., Lehutso, R. F., and Hofmann, T.: Nanoparticle Heteroagglomeration with Natural and Synthetic Suspended Particulate Matter, EGU General Assembly 2024, Vienna, Austria, 14–19 Apr 2024, EGU24-8778, https://doi.org/10.5194/egusphere-egu24-8778, 2024.

EGU24-9087 | Posters on site | HS8.1.7

Metallic Nanoparticles: Differential  impact on Fungal vs Bacterial Soil Communities  

Nektarios Kavroulakis, Myrto Tsiknia, Maria Kissandraki, Constantinos Chrysikopoulos, and Anastasios Malandrakis

This study investigated the impact of metallic nanoparticles (NPs) containing copper, silver, copper oxide, and zinc oxide, recognized as potential pollutants, on the structural and compositional aspects of soil microbial communities in comparison to their bulk counterparts. The influence of these nanoparticles was examined at two distinct accumulation levels within the soil ecosystem.

The potential effects of metallic nanoparticles in comparison to their bulk counterparts were evaluated in a pot experiment under controlled environmental conditions. High-throughput sequencing of PCR-amplified 16S rRNA and ITS2 marker genes was employed to analyze the impact of NPs and counterparts on bacterial and fungal rhizospheric communities using two dosage levels.

Bioinformatic analysis of the obtained sequencing results revealed a distinct metal-dependent differentiation in bacterial and fungal soil community structures. Silver-containing treatments exhibited an enhanced ability to induce changes in both bacterial and fungal communities compared to other metals. Furthermore, treatment dose had a profound differentiation effect on the two microbial communities. The low dose notably influenced bacterial communities to a greater extent compared to the high dose, whereas fungal communities exhibited significant alterations under high-dose conditions rather than under low-dose conditions.

This study was co-financed by the European Regional Development Fund of the European Union and Greek national funds through the Rural Development Program (RDP/ΠΑΑ) 2014 – 2020, under the call "Cooperation for environmental projects, environmental practices and actions for climate change” (project code: Μ16SΥΝ2-00354) and by the European Union- Next Generation EU, Greece 2.0 National Recovery and Resilience plan (project code: TAEDR-0535675)

How to cite: Kavroulakis, N., Tsiknia, M., Kissandraki, M., Chrysikopoulos, C., and Malandrakis, A.: Metallic Nanoparticles: Differential  impact on Fungal vs Bacterial Soil Communities , EGU General Assembly 2024, Vienna, Austria, 14–19 Apr 2024, EGU24-9087, https://doi.org/10.5194/egusphere-egu24-9087, 2024.

EGU24-10544 | ECS | Posters on site | HS8.1.7 | Highlight

Particle-Associated Contaminant Transport in Rivers during High Discharge Events 

Dominik Renner, Hermann Rügner, Martin Ebner, Joel Fabregat-Palau, and Peter Grathwohl

The pressure on natural water resources and aquatic ecosystems will increase in the future, particularly in urban areas, as a result of climate change and population and economic growth. Rapid rates of urbanization may lead to an increase in impervious surfaces, resulting in higher runoff volumes and pollutant loads. While wastewater treatment technology made significant progress over time, it is reported that a significant part of runoff is still discharged directly into rivers. Besides dissolved compounds, many toxic compounds are associated with natural and anthropogenic particles and some small particles themselves have to be considered pollutants such as microplastics (MP) and tire wear particles (TWP).

In the scope of this study, suspended river sediments are examined towards type and amount of transported anthropogenic particles as well as for the contaminant loading with organic pollutants such as per- and polyfluoroalkyl substances (PFAS) and polycyclic aromatic hydrocarbons (PAH). The overall aim of the study is to identify correlations between the different classes of contaminants (i.e., MP, TWP, PFAS, PAH) and physio-chemical parameters (e.g., total suspended solids (TSS), turbidity, total organic carbon (TOC)) or catchment-specific properties such as land use and geology, as well as event- and/or seasonal related features (e.g., rain intensity, 1st flush effects).

The samples are collected during high discharge events in rivers with contrasting catchments regarding land use and geology in southwest Germany. PFAS analysis includes the monitoring of 40 different PFAS and the direct total oxidizable precursor (dTOP) assay to investigate the levels of precursor compounds that are not included in the target analysis. Preliminary results suggest a predominant transport of long-chain PFAS precursors on suspended sediments in rivers compared to targeted PFAS. Microscopic analyses of the collected particles after standard filtration, chemical treatment, and separation steps imply amounts of MP and TWP in the range of 0.1‰ of the total suspended sediment mass.

How to cite: Renner, D., Rügner, H., Ebner, M., Fabregat-Palau, J., and Grathwohl, P.: Particle-Associated Contaminant Transport in Rivers during High Discharge Events, EGU General Assembly 2024, Vienna, Austria, 14–19 Apr 2024, EGU24-10544, https://doi.org/10.5194/egusphere-egu24-10544, 2024.

EGU24-10687 | Posters on site | HS8.1.7

Modelling approach to account for competitive sorption of PFAS in MODFLOW-based solute transport simulations 

Fritjof Fagerlund, Mason Johnson, and Robert Earon

Per- and polyfluoroalkyl substances (PFAS) are extremely persistent contaminants that constitute an increasing problem for drinking water resources worldwide. Modelling tools to predict the subsurface transport of PFAS are important both for risk assessment and for design and evaluation of in-situ PFAS stabilization using activated carbon (AC) or other sorbent amendments. At highly contaminated hotspots, such as fire-fighting training sites, a mixture of many PFAS are typically present in the contaminated groundwater. The different PFAS can interact in the sorption process and e.g. compete for sorption sites, which may affect both the risks associated with PFAS transport and the efficacy of remediation strategies such as sorbent amendments.

The aim of this study was to develop a user-friendly modelling approach to account for competitive sorption of PFAS in a solute transport package that can be applied in combination with groundwater flow modelling with MODFLOW, and to illustrate the effect of competition on the transport of different PFAS for a field site scenario. A competitive sorption model for PFAS was implemented in MODFLOW/MT3DMS and can be run in combination with a graphical user interface for MODFLOW such as GMS. The new model is aimed for practical applications of site modelling and PFAS risk assessment when competition effects may be important. Modelling of a field site scenario based on a fire-fighting training site at a Swedish airport illustrates that competitive sorption affects the transport of PFAS in the groundwater and can provide valuable site-specific insight for remediation efforts.

How to cite: Fagerlund, F., Johnson, M., and Earon, R.: Modelling approach to account for competitive sorption of PFAS in MODFLOW-based solute transport simulations, EGU General Assembly 2024, Vienna, Austria, 14–19 Apr 2024, EGU24-10687, https://doi.org/10.5194/egusphere-egu24-10687, 2024.

PFOS fate and transport in the subsurface are significantly impacted by the spatially and temporally variable hydrochemical conditions found in natural environments, which often exhibit strong ionic strength gradients and pH fluctuations [1,2]. Batch and flow-through column experiments are standard methods for characterizing PFOS adsorption and transport behaviors, and their outcomes are often quantitatively interpreted by defining empirically derived solid-water distribution coefficients (e.g., Langmuir and Freundlich equations) [3]. The limitation of these models is that they are strictly system-dependent and cannot precisely assess PFOS removal under varying water chemistry conditions. Thus, there is a need for mechanistic sorption prediction models able to account for varying electrostatic properties of the surface-solution interface in response to changes in pore water chemistry, and that could be implemented in reactive transport simulators for precisely assessing PFOS migration under dynamic hydrochemical conditions in multicomponent systems [4].

In this work, we initially conducted a comprehensive set of adsorption experiments and IR spectroscopy analyses with varying pH and ionic strength conditions to elucidate PFOS binding behavior on goethite surfaces as a function of solution chemistry. The experimental outcomes were quantitatively interpreted by developing a surface complexation model (CD-MUSIC) built on the results of the adsorption experiments and on the molecular-level understanding acquired through IR spectroscopy. Subsequently, a series of one-dimensional flow-through experiments were conducted in fully saturated goethite-coated silica sand columns by injecting a 2 mg/L PFOS pulse with varying NaCl background electrolyte concentrations and collecting PFOS and pH breakthrough curves at the outlet of the domain. PFOS uptake exhibited a complex behavior that was strongly dependent on solution pH and electrolyte concentration and that originated from the co-existence and speciation of two distinct PFOS-goethite surface complexation mechanisms: (i) a hydrogen-bonded complex (HB) and (ii) a weaker outer-sphere complex involving Na+ co-adsorption (OS-Na+). The non-trivial dependency of PFOS uptake on solution chemistry significantly impacted its transport behavior. Dynamic ionic strength gradients established during the flow-through experiments led to distinct retardation and transport behaviors which were not observed in the experiments performed with constant ionic strengths [5]. PFOS and pH breakthrough curves were quantitatively described by implementing the developed surface complexation model within the reactive transport simulator PHREEQC-3 coupled with MATLAB through the IPhreeqc module [6,7]. The simulations illuminated the key role of multicomponent transport effects on PFOS mobility and the importance of explicitly accounting for mineral surface charge adjustments in response to changes in water chemistry.

[1] Zhu et al. (2017) Chemosphere 168, 390-398. [2] Blowes et al. (2014) In Treatise on Geochemistry 2nd Edition Vol. 11, pp 131-190. [3] Johnson et al. (2007) J. Chem. Eng. Data 52, 1165-1170. [4] Cogorno and Rolle (2024) Env. Sci. Technol. https://doi.org/10.1021/acs.est.3c09501. [5] Cogorno and Rolle (2024) In prep. [6] Charlton and Parkhurst (2011) Comput. Geosci. 37, 1653-1663. [7] Muniruzzaman and Rolle (2016) Adv. Water Resour. 98, 1-15.

How to cite: Cogorno, J. and Rolle, M.: Impact of variable water chemistry on PFOS-goethite interactions under batch and flow-through conditions: experimental evidence and reactive transport modeling, EGU General Assembly 2024, Vienna, Austria, 14–19 Apr 2024, EGU24-10863, https://doi.org/10.5194/egusphere-egu24-10863, 2024.

EGU24-11156 | Orals | HS8.1.7 | Highlight

Recent Advancements in Mechanistic Understandings of PFAS Fate & Transport in the Vadose Zone 

Christopher Higgins, Tissa Illangasekare, John Stults, and Bo Guo

Background/Objectives: Per- and Polyfluoroalkyl substances (PFASs) are a group of highly recalcitrant, bioaccumulative, and toxic chemicals that are frequently introduced to groundwater through land surface exposure. As a result, the vadose zone has been identified as a significant long-term source zone for PFAS leaching into groundwater. This talk summarizes critical findings regarding PFAS transport in the vadose zone and introduces several emerging topics expected to develop over the next several years.

Approaches/Activities: Early efforts in understanding PFAS Fate & Transport processes focused on their multi-phase retention processes. Specifically, understanding the degree of equilibrium partitioning to the solid phase and the air-water interface have been intensely studied topics. Equilibrium partitioning to solid and air-water interfaces generally increases with increasing molecular volume, with exceptions for very long chain perfluoroalkyl acids (PFAAs), cationic and zwitterionic PFASs, perfluoroalkyl ethers, and PFASs with very large headgroups. Recent research and emerging field data suggest many sites are impacted by non‑ideal, non‑equilibrium processes. Evidence of PFAA generation from precursor transformation, physically driven non-ideal transport, and chemically driven non-idealities have emerged as environmentally relevant topics. A specific list of topics for discussion is presented below:

  • Precursor Transformation: Despite the name “forever chemicals”, there are many PFASs known as PFAA precursors. Precursors transform into PFAAs, which are more mobile and can serve as a centurial source of PFAS contamination to underlying aquifers.
  • Non-Ideal Transport Mechanisms Can Accelerate PFAS Leaching: Non-Ideal transport can be caused by physically driven non-equilibrium processes. Examples include flow path channelization, immobile water formation, sheet flow, and reduced accessibility of air-water interfaces. It is likely that these mechanisms drive rate-limited desorption from solid-phase materials. Non-Ideal transport appears to be more prevalent at lower saturations.
  • Additional Transport Processes: PFAS retention and retardation by the presence of other co-contaminants such as non-aqueous phase liquids (NAPLs) in media are starting to receive more research attention.
  • Evidence of Self-Assembly and Chemically Driven Rate-Limited Desorption: Molecular self-assembly refers to the potential of PFASs and other surfactants to form discrete microstructures at liquid interfaces. These thermodynamically stable microstructures may contribute to the consistently elevated PFAS concentrations observed in source zones.

Results/Conclusions: Many considerations are needed when assessing the fate & transport risks for PFASs at a given site. While there is early evidence that equilibrium models can predict long-term mass flux in some locations, these models may not predict large discharges from discrete storm events. Terminal PFAA discharge to groundwater from precursor transformation is of critical importance to understanding the long-term behavior of PFASs in the subsurface. The potential for Non-Ideal transport to accelerate PFAS transport may explain the conundrum of why some long chain PFAAs are found in groundwater systems despite their strong equilibrium retention properties. Another explanation for accelerated transport is the potential for competitive adsorption of mixtures to reduce the equilibrium partitioning potential of substances in mixtures. Additional retention (i.e., adsorption to NAPLs) requires additional study to determine appropriate partitioning parameters. Finally, PFASs may have unique transport and retention mechanisms which may be enhanced by their surfactant properties.

How to cite: Higgins, C., Illangasekare, T., Stults, J., and Guo, B.: Recent Advancements in Mechanistic Understandings of PFAS Fate & Transport in the Vadose Zone, EGU General Assembly 2024, Vienna, Austria, 14–19 Apr 2024, EGU24-11156, https://doi.org/10.5194/egusphere-egu24-11156, 2024.

EGU24-11500 | Orals | HS8.1.7

Managing the leaching of water-soluble herbicides in soils using eco-compatible nanocarriers 

Tiziana Tosco, Monica Granetto, Silvia Fogliatto, and Francesco Vidotto

Pesticide use plays a crucial role in achieving high crop yields in the context of a global population growth scenario. However, the extensive application of pesticides has progressively led to the contamination of environmental matrices, particularly soils and groundwater, posing potential risks to human health, flora, and fauna. Nanopesticides can be instrumental in mitigating pesticide pollution, especially for highly soluble and volatile active ingredients. They are formed by nanoparticles (nanocarriers) containing an active ingredient, sometimes shielded by a coating, and dispersed in a colloidal suspension. The nanoformulations proposed in this study utilize low-cost mineral materials (such as montmorillonite, zeolite, kaolin) and food-grade biopolymers to incorporate two distinct herbicides, namely dicamba and S-metolachlor, characterized by high solubility (and thus high migration potentian in the subsoil) and, for dicamba only, moderate volatility.

The efficacy of the newly developed nanoherbicides in terms of reduced mobility in porous media, reduced persistency, and efficacy toward target weeds was assessed in the laboratory against the pure herbicide and commercial formulations containing the same active ingredients. Specifically, the mobility in porous media was tested through column transport experiments under both saturated and unsaturated conditions, using sand and standard soils (representative, respectively, of top soil and aquifers). These tests were conducted at various scales, ranging from small columns (1.6 cm diameter, 10 cm length) to a laboratory lysimeter (30 cm diameter, 70 cm length). Batch degradation tests in soils indicated comparable DT50 values for the nanoformulation and the commercially available product. The efficacy of the nanopesticides was also examined against conventional products in greenhouse settings through dose-response tests on selected sensitive weeds. The greenhouse tests revealed that clay-based nanoformulations do not impede the effectiveness of dicamba against target weeds, showing efficacy comparable to the commercial competitor for both dicamba and S-Metolachlor, although variations were observed depending on the treated species.

Despite the small scale of the tests conducted in the laboratory and greenhouse, these initial results suggest the promising efficacy of the proposed nanoformulation approach in controlling the environmental spread of soluble herbicides without compromising efficacy against target species.

This research was conducted within the Nanograss project, co-funded by the Compagnia di San Paolo Foundation.


Reference

Granetto M., Serpella L., Fogliatto S., Re L., Bianco C., Vidotto F., Tosco T. (2022). Natural clay and biopolymer-based nanopesticides to control the environmental spread of a soluble herbicide. Science of The Total Environment 806(3),151199, https://doi.org/10.1016/j.scitotenv.2021.151199

How to cite: Tosco, T., Granetto, M., Fogliatto, S., and Vidotto, F.: Managing the leaching of water-soluble herbicides in soils using eco-compatible nanocarriers, EGU General Assembly 2024, Vienna, Austria, 14–19 Apr 2024, EGU24-11500, https://doi.org/10.5194/egusphere-egu24-11500, 2024.

The cause of non-exponential decreases in colloid concentrations with distance from source was posited to derive from the emergence of fast- and slow- attaching populations from identical individuals (Johnson, 2018).  Fast-attachers were posited to attach according to a rate coefficient corresponding to favorable conditions, whereas the remainder of the population were posited to attach according to a slower rate coefficient.  This talk demonstrates the emergence of fast- and slow- attaching populations in pore network transport experiments under unfavorable conditions.  We explain the segregation into two subpopulations as being driven by colloid-surface repulsion, topological impacts of the flow field (incomplete pore scale mixing), and consequent impacts on the number of interceptions incurred prior to attachment. 

How to cite: Ullauri, L., Johnson, W., Bolster, D., and Al-Zghoul, B.: Experimental Confirmation of Emergence of Fast- and Slow- Attaching Subpopulations from Identical Individuals Produces Non-Exponential Decreases in Colloid Concentrations with Distance from Source under Unfavorable Conditions, EGU General Assembly 2024, Vienna, Austria, 14–19 Apr 2024, EGU24-13533, https://doi.org/10.5194/egusphere-egu24-13533, 2024.

EGU24-15458 | ECS | Orals | HS8.1.7

Microplastics pollution in groundwater: Case study - Slovenia 

Elvira Colmenarejo Calero, Manca Kovač Viršek, Tine Bizjak, and Nina Mali

Microplastics (MPs), are considered an emerging global pollutant and a significant contributor to environmental pollution. They are defined as plastic particles measuring less than 5 mm which can vary in chemical composition, color, shape, density, size, and other characteristics. MPs generated through urban, industrial, and agricultural activities have the potential to reach the environment, including groundwater. However, despite the significance of groundwater as a vital resource, there is a notable dearth of information regarding the occurrence, transport, and risk of MPs in this environment.

In Slovenia, groundwater resources are the primary source of drinking water for 98% of the population. A considerable number of these resources are affected by different anthropogenic activities that result in contamination by different pollutants, among which MPs are probably included. The present study aimed to investigate the presence of MPs in karst and alluvial aquifers of three different regions of Slovenia. Particular emphasis has been given to the improvement of sampling and detection of MPs in groundwater along with the evaluation of the impact of hydrogeological environment, land use and anthropogenic activities in the recharge zone of each sampling site on the occurrence of MPs in groundwater.

Groundwater samples were collected from a total of 19 locations, 8 were situated in alluvial aquifers and 11 in karst formations. In each location a total of 3 cubic meters of water was sampled using an in-situ filtration system with a filter pore size of 10 - 100 µm. The samples were then analyzed in the laboratory using a digital microscope with a magnification range of 100 - 5000x and stereomicroscope with magnification 12,5 – 100x. The chemical composition of particles was determined using FTIR microscope and ATR-FTIR. The results showed that MPs were present in all sampled sites, with fibers and fragments being the most common observed shapes. The study proves the presence of MPs in both, alluvial and karst aquifers of Slovenia and demonstrates the suitability of an in-situ filtration system for sampling MPs in groundwater.

How to cite: Colmenarejo Calero, E., Kovač Viršek, M., Bizjak, T., and Mali, N.: Microplastics pollution in groundwater: Case study - Slovenia, EGU General Assembly 2024, Vienna, Austria, 14–19 Apr 2024, EGU24-15458, https://doi.org/10.5194/egusphere-egu24-15458, 2024.

Structural dynamics, fluid flow, and reactive transport in permeable media are affected by the presence of and interactions with components of the total mobile inventory (TMI). With the term TMI we take into account the fact that the inventory of mobile substances in natural permeable media extends over an extremely wide range of sizes (spanning five orders of magnitude from the truly dissolved matter in the nanometre range to the large microaggregates and biota, around 250µm) and an almost incomprehensible diversity of proprietary and foreign materials (e.g., organic, inorganic, organo-mineral associations, microaggregates, biota, viruses, MGE, etc.; Lehmann et al. 2021 DOI:10.1016/j.scitotenv.2020.143774). Despite the essential role the larger particles of TMI up to a size of 250µm play for the functions, ecology, and intercompartment exchange in the subsurface and in between the surface and subsurface (Zerfaß et al. 2022 DOI:10.1016/j.watres.2022.118998; Herrman et al. 2023 DOI: 10.1016/j.soilbio.2023.109192), the majority of studies on the subsurface water resources and the biogeochemical cycling are dedicated to the operationally defined dissolved fraction, and, to a lesser extent, to the colloidal sized materials. Larger mobile materials beyond the 2µm size limit are vastly omitted. With increasing size beyond the “magical” 450nm size boundary, however, the understanding of the mechanisms that control the fate of TMI-components gets more demanding. With increasing size, morphology and surface properties control the interactions with the mobile and immobile surfaces and thus the transport behaviour. With increasing size, the effects of gravity on interactions and transport can no longer be neglected (Guhra et al. 2021 DOI: 10.1016/j.jcis.2021.03.153). And with increasing size, the pore-network structure, void-size-distribution, and connectivity constrain the accessibility to fractions of the void space by exclusion. The story does not end here: Interactions of TMI-components with the immobile solid phase change the structure of the void-network (Ritschel et al. 2023, DOI: 10.1016/j.geoderma.2022.116269). And TMI change the properties of the – frequently aqueous fluids in natural systems, e.g., the density, the viscosity, and the surface tension. In sum, fluid dynamics and reactive transport in natural systems like soils, sediments, the vadose and the phreatic zone are rather complex phenomena that are intimately intertwined with the physical and biogeochemical weathering and alteration in the subsurface and pedogenesis at the regolith-atmosphere interface. In view of the growing awareness of the subsurface as a mosaic of habitats and ecosystems (Lehmann and Totsche, 2020 DOI: /10.1016/j.jhydrol.2019.124291; Yan et al. 2020 DOI: 10.1016/j.watres.2019.115341), affected by land-use and climate change, this presentation pleads for a more general and synoptic understanding of fluid flow and reactive transport in natural permeable media and the consequences for their properties, functions and finally life sustaining ecosystem services. Given the power provided by multi-omics in combination with the wide spectrum of (non-invasive) spatio-temporal observational techniques, and the rapid progress in E-science and model-Big-data integration, the reconstruction of the “true” complexity of the subsurface compartments and their development in response to climate and land-use change is possible and allows to define the objectives for ambitious future coordinated research.

How to cite: Totsche, K. U.: Linking the dynamics of the total mobile inventory to the co-evolution of structure and function in the subsurface, EGU General Assembly 2024, Vienna, Austria, 14–19 Apr 2024, EGU24-15559, https://doi.org/10.5194/egusphere-egu24-15559, 2024.

EGU24-16845 | Posters on site | HS8.1.7 | Highlight

GWMicroPlast project – researching microplastics in groundwater 

Manca Kovač Viršek, Tine Bizjak, Elvira Colmenarejo Calero, Katarina Zabret, Anja Koroša, Miloš Miler, and Nina Mali

Microplastics are recognised as an emerging pollutant. Microplastics describe plastic particles between 1 µm and 5 mm, which may be produced in this size (primary microplastics) or originate from bigger plastic debris subjected to decay or wear in the environment (secondary microplastics). Research in the field of microplastics started in the marine environment over 60 years ago but has been focusing on other environments only for the past 25 years. Microplastic particles have been observed almost everywhere – in oceans, rivers, wetlands, groundwater, lakes, air, plants, animals and people. Water is identified as the main transport medium of microplastics, however, only a few more recent studies identified microplastics in groundwater. Groundwater is an important drinking water resource in many parts of the world, e.g., in Slovenia, 98 % of drinking water demands are covered by groundwater resources.

This contribution gives the main subject of the ongoing research project GWMicroPlast, within which we will investigate the entire pathway of the microplastics and other pollutants linked with plastics pollution through the aquifer, starting from potential sources to the transport in the unsaturated zone and saturated zone and focusing on the evaluation of the presence of microplastics in different groundwater zones and on the improvement of understanding of microplastics migration through the aquifer. Within the scope of the proposed project, we aim to check the status of microplastic pollution in all three types of drinking water aquifers, intergranular, karst and fissured, in Slovenia. Special attention will be paid to developing methods for sampling and analysing microplastics in groundwater for different aquifers. The transport processes of microplastics in the gravel unsaturated zone will be investigated in more detail by a tracing experiment in the lysimeter. 


Acknowledgement: This contribution is part of the ongoing research project entitled “Improved methods for determination of transport processes and origin of microplastics in groundwater resources – (GWMicroPlast)” supported by the Slovenian Research and Innovation Agency (J1-50030).

How to cite: Kovač Viršek, M., Bizjak, T., Colmenarejo Calero, E., Zabret, K., Koroša, A., Miler, M., and Mali, N.: GWMicroPlast project – researching microplastics in groundwater, EGU General Assembly 2024, Vienna, Austria, 14–19 Apr 2024, EGU24-16845, https://doi.org/10.5194/egusphere-egu24-16845, 2024.

EGU24-16852 | ECS | Posters on site | HS8.1.7

Exploring microbial PFAS degradation at two contaminated firefighting training sites in Sweden 

Nicola Messinger, Lutz Ahrens, Stefan Bertilsson, Dan Berggren Kleja, and Fritjof Fagerlund

The extensive use of Aqueous Film Forming Foam (AFFF) has led to substantial contamination by per- and polyfluoroalkyl substances (PFAS) of soils and groundwater at many firefighting training sites in Sweden and worldwide. PFAS is a group of extremely persistent anthropogenic substances that pose risk for adverse effect even at low levels. There is consequently a need to understand the potential for natural degradation of these compounds and the controlling environmental factors. Understanding the microbial capacity to degrade and transform PFAS is also crucial for comprehending their transport in soil and groundwater and for the development of a potential bioremediation technique. Despite commonly referred to as “forever chemicals”, there is emerging evidence of PFAS being microbially degraded in laboratory settings. The aim of this study is to investigate the microbial degradation capacity of the natural bacteria at two firefighting training sites (FFTS) contaminated with PFAS. Utilizing a sonic drill, soil samples were collected from both above and below the water table from FFTS near Örnsköldsvik and Sundsvall Timrå airports in Sweden. Enrichment cultures were initiated by mixing these soil samples with four different growth media—two for aerobic and two for anaerobic incubations. The incubation conditions, aerobic or anaerobic, were determined dependent on if the sample was taken above or below the groundwater level. All incubations were spiked with perfluorooctanesulfonic acid (PFOS), perfluorooctanoic acid (PFOA), 6:2 fluorotelomer sulfonic acid (6:2FTSA) and perfluorooctane sulfonaminde (FOSA) to reach a concentration of 9ppm. Samples from the incubations were taken at monthly intervals to screen for fluoride production, as an indicator for PFAS degradation, using ion chromatography. Using this approach, we aim to uncover the capability of the natural microbial community at these sites to degrade PFAS. In the second phase of this study, this will be followed by careful analysis of degradation products with the aim to identify degradation pathways.

How to cite: Messinger, N., Ahrens, L., Bertilsson, S., Berggren Kleja, D., and Fagerlund, F.: Exploring microbial PFAS degradation at two contaminated firefighting training sites in Sweden, EGU General Assembly 2024, Vienna, Austria, 14–19 Apr 2024, EGU24-16852, https://doi.org/10.5194/egusphere-egu24-16852, 2024.

EGU24-17825 | ECS | Posters on site | HS8.1.7

Passive Removal of Stormwater Polar Organic Contaminants in Geomedia-Amended Biofilters 

María Alejandra Cruz Bolaños, Jan Willem Foppen, Enric Vázquez-Suñé, and Marc Teixidó

Next-generation stormwater drainage systems (e.g., green infrastructure) are increasingly implemented to enable runoff infiltration into the subsoil for aquifer recharge. Unfortunately, urban runoff can act as a major transport vector of pollution, and conventional infrastructure fails to remove polar organic contaminants. We studied the transport and removal of novel polar (mobile) stormwater vehicle-related organic contaminants of emerging concern, utilizing batch experiments and laboratory sand biofilters amended with granulated activated carbon (GAC) and biochar. Rapid small-scale column breakthrough curves and a 1D transport model demonstrated geomedia amendments can enhance target organic contaminant removal via sorption. However, contaminant transport was subject to kinetic effects, making it sensitive to infiltration flow rates and hydraulic retention times. To overcome these challenges, we developed pilot-scale 1-m length biofilters operating at relevant environmental conditions. These columns included a water retention zone equipped with various sensors to keep track of hydraulic and contaminant removal performance. Overall, our research contributes to understanding pollutant fate and transport during passive infiltration and enhancing conventional removal technologies for polar organic contaminants.

How to cite: Cruz Bolaños, M. A., Foppen, J. W., Vázquez-Suñé, E., and Teixidó, M.: Passive Removal of Stormwater Polar Organic Contaminants in Geomedia-Amended Biofilters, EGU General Assembly 2024, Vienna, Austria, 14–19 Apr 2024, EGU24-17825, https://doi.org/10.5194/egusphere-egu24-17825, 2024.

Chemical pollution is recognized as a global problem, arising from trace organic contaminants (TOrCs), such as the emerging persistent mobile, and toxic (PMT) and very persistent, very mobile (vPvM) organic compounds. Rapid urbanization has increased impervious surfaces, facilitating the deposition and accumulation of pollutants. Additionally, stormwater acts as a transportation conduit for this PMT/vPvM substances, functioning as a surface pollutant wash-off, discharges into water bodies, and decreases the urban water quality. Green infrastructure, mainly designed to mitigate flood risk and recharge aquifers, may contaminate the soil-groundwater system. It is therefore crucial to develop cost-effective remediation technologies to enhance the removal of polar contaminants before reaching the aquifer.

In this study, a laboratory-based removal evaluation for 20 cost-effective PCMs (e.g., activated carbons and standard biochars) towards 34 PMT/vPvM target compounds (covering a wide range of uses, e.g., biocides, additives, herbicides) has been conducted. Preliminary results show that activated carbon (GAC), regenerated activated carbon (RAC) and MSP700 biochar exhibit strong adsorption capabilities for PMT compounds. The pyrolysis temperature, surface area, and aromaticity of the PCM play a crucial role in the adsorption process. The sorption kinetics for a suite of eight representative PMT compounds (covering a broad range of physicochemical properties) is better reproduced using a pseudo-second order (PSO) model, indicating a diffusion-controlled process. Sorption equilibrium for most adsorbates is achieved within 48 h. GAC, with the highest specific surface area, exhibits rapid adsorption, whereas MSP700 biochar shows the slowest adsorption rates. Furthermore, the sequence of adsorption capacity for the studied adsorbates is: neutral > positive > negative. Finally, the identification of GAC, RAC, and MSP700 as effective adsorbents for PMT/vPvM substances offers valuable insights for next-generation urban water management.

How to cite: Xu, J., Cama, J., and Teixido, M.: Sorption of Persistent, Mobile, and Toxic (PMT) and very persistent, very mobile (vPvM) substances onto pyrogenic carbonaceous materials, EGU General Assembly 2024, Vienna, Austria, 14–19 Apr 2024, EGU24-18027, https://doi.org/10.5194/egusphere-egu24-18027, 2024.

EGU24-19579 | Posters on site | HS8.1.7

DISSOLUTION, TRANSFORMATION AND (HETERO-)AGGLOMERATION OF NMs: NEW METHODOLOGIES TO ALLOW FOR STANDARDIZATION. 

Raisibe Florence Lehutso, Lorenzo Sanjuan Navarro, Melanie Vital, and Frank Von der Kammer

The last decade has seen a tremendous increase in research efforts to develop and apply analytical techniques with the aim of investigating the environmental behavior of colloids (1-1000 nm in diameter) and nanoparticles (NPs, 1-100 nm in diameter). Many of these studies were triggered by the wide application of manufactured nanomaterials, as well as the implications of these products as potentially dangerous, particulate pollutants [1]. During their live cycle, these materials are transported to or within environmental compartments, potentially leading to adverse effects that need to be fully studied and understood. In the environment, NPs are subject to processes such as dissolution, transformation, (over-)coating and (hetero-)agglomeration. These changes can occur in variable time frames, from minutes to geological time scales, causing certain changes in the intrinsic properties that need to be monitored [2]. In this work, new methodologies to evaluate NPs dissolution, transformation and heteroagglomeration for the purpose of standardization are developed.

To develop standardized methods for NP dissolution batch experiments, different parameters such as the impact of pH, types of buffers, types of pH control, initial concentrations, types of agitation, and types of natural organic matter have been investigated. For NP transformation, assessments were undertaken in conditions simulating aquatic environments with realistic sulfide and phosphate concentrations in batch and flow-through reactors. For heteroagglomeration, a model suspended particulate matter (SPM) was designed for interaction with particulate contaminants (e.g., NP, colloids etc.). Furthermore, a system to investigate model SPM and NP heteroagglomerationto determine attachment efficiency was developed.

Methods to investigate NPs dissolution, transformation and heteroagglomeration were successfully developed for later standardization. The batch experiment set-up is practical and efficient for determining NP solubility and dissolution rates. Transformation of NPs via formation of protective layer which significantly decreased NP dissolution was observed. However, in some cases an increase in ion concentration could be related to the formation of amorphous compound in the nanoparticle surface showing a higher apparent solubility compared with high ordered phases. The versatility of results obtained corroborate the methodology effectiveness. For heteroagglomeration, the model SPM was generated, and the designed protocol is highly reproducible and is independent of the SPM component source. NP and model SPM heteroagglomeration attachment efficiencies were determined in different environmental conditions, illustrating system applicability and robustness in different matrix. The methods developed herein edges efforts towards standardizing methods to investigate the behavior and fate of NP in aquatic system.  

[1] Bathi et al., Science of the Total Environment 793 (2021) 148560.

[2] Stetten et al., Nanomaterials 12 (2022) 519.

How to cite: Lehutso, R. F., Sanjuan Navarro, L., Vital, M., and Von der Kammer, F.: DISSOLUTION, TRANSFORMATION AND (HETERO-)AGGLOMERATION OF NMs: NEW METHODOLOGIES TO ALLOW FOR STANDARDIZATION., EGU General Assembly 2024, Vienna, Austria, 14–19 Apr 2024, EGU24-19579, https://doi.org/10.5194/egusphere-egu24-19579, 2024.

EGU24-20496 | Orals | HS8.1.7 | Highlight

A short review of the processes explaining water quality improvement during Soil Aquifer Treatment 

Jesús Carrera, Paula Rodriguez-Escales, Cristina Valhondo, Lurdes Martinez-Landa, Silvia Diaz-Cruz, Benjamín Piña, Albert Contreras, Gerard Quintana, and Laia Navarro-Martin

Soil Aquifer Treatment (SAT) consists of recharging the effluents of wastewater treatment plants across the soil (possibly reinforced with a reactive layer), unsaturated zone, and aquifer. It has been known since long that a dramatic water quality improvement occurs after soil and aquifer passage. However, the actual contaminant removal mechanisms remain open to discussion. Here, we summarize results observed at a number of sites displaying significant degradation of the most recalcitrant chemical compounds, as well as orders of magnitude reduction of antibiotic resistance and pathogen indicators. We have observed that the most toxic species, with significant partition coefficients, tend to accumulate in biofilms, where microorganisms accumulate. The accumulation of degrading microorganisms at the place where they can be degraded suggest natural selection. Further, a broad range of redox conditions, from aerobic to sulphate reduction (and, thus, a broad diversity of microbial communities), do occur during SAT. Together, these processes ensure a an extremely bioactive environment, which explains the dramatic reduction in toxicity we have observed after relatively modest (some 15 days) residence time in the aquifer. An implication from these observations is that the strict conditions imposed by the EU on SAT must be relaxed.

How to cite: Carrera, J., Rodriguez-Escales, P., Valhondo, C., Martinez-Landa, L., Diaz-Cruz, S., Piña, B., Contreras, A., Quintana, G., and Navarro-Martin, L.: A short review of the processes explaining water quality improvement during Soil Aquifer Treatment, EGU General Assembly 2024, Vienna, Austria, 14–19 Apr 2024, EGU24-20496, https://doi.org/10.5194/egusphere-egu24-20496, 2024.

EGU24-21370 | Orals | HS8.1.7 | Highlight

An Assessment of the Global PFAS Burden to Our Waters 

Denis O'Carroll, Diana Ackerman Grunfeld, Daniel Gilbert, Jennifer Hou, Matthew Lee, and Tohren Kibbey

Per- and polyfluoroalkyl substances (PFAS) have been used extensively in a range of consumer and industrial products since the 1950s, including in fire-fighting foam, given their exceptional interfacial properties and stability. However, concerns related to PFAS (eco)toxicity have only become widely known in the last 25 years. Passage of PFAS regulations and advisories has now proceeded at a much quicker rate than for many groups of anthropogenic chemicals, with the breadth of PFAS subject to regulation continually increasing and deemed acceptable levels continually decreasing. Here, we summarize global surface and groundwater PFAS data (n > 45,000) to quantify the extent to which PFAS water concentrations exceed drinking water advisories and regulations globally (e.g., European Union Directive 2020/2184, US EPA, Health Canda) as well as in the context of the Stockholm Convention for the protection of human health and the environment from persistent organic pollutants.  For example, our analysis suggests that 32% and 16% of sampled groundwater and surface water exceed the threshold of 1.0 for the unitless US PFAS hazard index for drinking water, respectively, when there is no known source of PFAS contamination, with the rate of exceedance increasing when there is a known source. The extent of exceedances for other jurisdictions will be discussed. Further, analysis of PFAS embodied in consumer products suggests that typical methods used to quantify PFAS in surface and groundwater likely underestimate total PFAS concentration.  Given this the future environmental burden posed by PFAS is likely underestimated.

How to cite: O'Carroll, D., Ackerman Grunfeld, D., Gilbert, D., Hou, J., Lee, M., and Kibbey, T.: An Assessment of the Global PFAS Burden to Our Waters, EGU General Assembly 2024, Vienna, Austria, 14–19 Apr 2024, EGU24-21370, https://doi.org/10.5194/egusphere-egu24-21370, 2024.

We present the interpretation of the Perfluorooctane sulfonate (PFOS) dataset spread over eighteen years between 2005 to 2023. The data explicitly depicts the essence of i) a growing monitoring network with growing concern i.e. ten to nearly 100 locations; ii) increasing resolution in knowing the chemical closely with advancing technologies i.e. inclusion of branched and linearity of PFOS rather than just ionic form; iii) increasing the diversity of systems being gradually included in the monitoring system to appreciate the environmental interactions, i.e. only groundwater to freshwater to even brackish water systems. This government-supported monitoring data tracks the curve of PFC-related concern for water sectors over the last two decades of the 21st century and thus provides the learnings for the future. The dataset also indicates that knowing a problem is the first step towards taking the right steps towards correcting that given system, as evident by decreasing PFOS concentrations between 2005 (ND to 0.5 µgL−1) to 2023 (ND to 0.012 µgL−1) in the groundwater environment of Yorkshire, UK. However, the data fails to provide confirmatory evidence of PFC pathways linking with surface-groundwater interactions. This work can be an eye-opener for policymakers of developing countries who are so reluctant to acknowledge the lack of regulations, and thus the associated need to monitor of chemicals of emerging concerns like PFAs, thus completely losing the opportunity of establishing stringent guidelines at the right time.

How to cite: Dogra, K., Kumar, M., and Agarwal, V.: Decadal Resolution of ‘Forever Chemical’ of PFOS in the groundwater of Yorkshire County, United Kingdom: The Future of the Past Learnings, EGU General Assembly 2024, Vienna, Austria, 14–19 Apr 2024, EGU24-22399, https://doi.org/10.5194/egusphere-egu24-22399, 2024.

The present communication investigated the dynamics (prevalence, seasonality, and removal) of endocrine disruptive chemicals (EDCs) and seven target pharmaceuticals and personal care products (PPCPs) in the Himalayan city of Dehradun in Uttarakhand province of India. Two municipal and two academic institutions WWTPs were selected for wastewater (WW) sampling in the city during spring, summer, and monsoon seasons. The result showed Diclofenac and Caffeine occurrence in all influent samples of the WWTPs indicative of considerable intake in the city. During the study, Caffeine and Acetaminophen concentrations were consistently higher in the sampled WW influents. The total PPCPs concentration in the WWTPs ranged from 1K to 74K ngL-1 and 22 to 64K ngL-1in influent and effluents, respectively. Seasonal variations in influent wastewater samples indicated high mean PPCP levels during spring, followed by monsoon and summer seasons. Caffeine showed the highest PPCP concentration (71K ngL-1) during monsoon and while Ciprofloxacin concentration was high (16K ngL-1) during the spring season. The study also revealed high correlation between Acetaminophen with Diclofenac (r=+0.77) and Ketoprofen (r=+0.62). In addition, Diclofenac was firmly linked with Ketoprofen (r=+0.89), whereas Ciprofloxacin was strongly linked with Carbamazepine (r=+0.65).

While the estrone showed concentrations at μgL−1 levels in influent concerning ngL−1 levels of triclosan (TCS). The highest global concentration of ~124 μgL−1 is recorded for the estrone during our monitoring period. The tests for Normality showed a non-normal data distribution (p>0.05) for all WW PPCPs samples except for Caffeine influents. PPCP concentration showed a high statistically significant variation between the influent and effluent samples (p<<<0.001), indicating highly decisive evidence for unequal means. The PPCPs treatment rates in the WWTPs ranged from ~69 -100%. In terms of total PPCPs, average removal efficiencies of WWTPs were recorded in the range of 41.66-71.40%. The maximum removal was recorded for Acetaminophen and Ketoprofen, while increased concentrations in the effluents (negative removals) were witnessed for Ciprofloxacin, Carbamazepine, and Caffeine in the WWTPs. The WWTPs have been found to contribute to existing PPCP loads and are channelized toward the disposal sites, posing a severe threat to biodiversity, human health, and the ecological integrity of the region and its downstream. We critically highlighted the limitation of the WWTPs in the treatment, degradation, and assimilation of EDCs leading to several environmental & human health-based threats to one health in the region. This study is vital for setting up baseline data and setting a platform for future research surveillance and control of emerging contaminants (ECs) in ecologically sensitive hilly landscapes.

How to cite: Kumar, M., Silori, R., Madhab Mahapatra, D., and Mahlknecht, J.: Patterns of Prevalence, Seasonality, and Treatment Efficiencies of Endocrine Disruptive Chemicals, Pharmaceuticals, and Personal Care Products in the Wastewaters of the Himalayan City of Dehradun, India, EGU General Assembly 2024, Vienna, Austria, 14–19 Apr 2024, EGU24-22435, https://doi.org/10.5194/egusphere-egu24-22435, 2024.

EGU24-1366 | ECS | Posters on site | HS8.1.8

Parameter estimation for an island aquifer considering tidal overheight (Norderney, Germany) 

Patrick Haehnel, Janek Greskowiak, and Gudrun Massmann

Parameter estimation for coastal aquifers generally is a time-consuming and computationally expensive task. It requires compromises on the number of parameters to estimate as well as how and if to incorporate variable-density driven flow and transport. While locations in coastal aquifers where certain data types (e.g., hydraulic head or salinity data) are most informative for inverse modeling have been established, data at such locations may not be routinely collected. This adds difficulty to the process of estimating a unique parameter set for a coastal aquifer.

A further challenge at coastal sites influenced by ocean tides and episodic sea-level variations (e.g., caused by storm events) is the consideration of tidal overheight, which can elevate the groundwater table well above mean sea level. Due to the computational expenses of simulating tidal influences in regional-scale groundwater flow models, tidal overheight is often neglected in such models. During a parameter estimation procedure, the neglected tidal overheight would be erroneously compensated for by lower hydraulic conductivities to match observed groundwater levels.

Our objective was to include the effects of tidal overheight in a parameter estimation procedure to characterize the hydraulic properties of the island aquifer below Norderney (Germany). For this purpose, a phase-averaged tidal boundary condition and routinely collected groundwater observation data were used. The model was implemented in MODFLOW-2005 and depicts the freshwater lens of the island as a steady-state groundwater flow model. The freshwater/saltwater interface, estimated using the Ghyben-Herzberg relation, is assumed a no-flow boundary due to a lack of salinity data describing the transition zone between fresh- and saltwater. Observed data were hydraulic heads averaged over a time frame of 10 years (2006-2015) and respective vertical differences in hydraulic heads at multi-level observation wells. Observation weights were defined based on measurement uncertainty and standard error of the mean.

Parameter estimation was performed using PESTPP-GLM with Tikhonov regularization and first-order second-moment (FOSM) uncertainty analysis.  Estimated parameters were: horizontal hydraulic conductivities and anisotropy factors for different zones based on a hydrogeological structural model for the island; conductances for river and drainage boundary conditions, which describe surface waterbodies and drainage channels present on the island; water levels for the river boundary condition; a scaling factor for production well skin sediment.

Results suggest that simulated heads match observed heads reasonably well, while prior parameter uncertainties were only reduced for horizontal hydraulic conductivities and vertical anisotropy factors of certain zones. The observed head data show pronounced variability on a smaller scale likely originating from locally present confining clay lenses and areas of lower permeability, which are known to exist from borehole data. For validation, transient simulations were performed with MODFLOW-2005 and the saltwater intrusion package (SWI2) to simulate the salt-/freshwater interface.

How to cite: Haehnel, P., Greskowiak, J., and Massmann, G.: Parameter estimation for an island aquifer considering tidal overheight (Norderney, Germany), EGU General Assembly 2024, Vienna, Austria, 14–19 Apr 2024, EGU24-1366, https://doi.org/10.5194/egusphere-egu24-1366, 2024.

EGU24-1485 | ECS | Orals | HS8.1.8

Seawater intrusion and methane sequestration followed the retreat of the Fennoscandian ice sheet 

Sophie ten Hietbrink, Henry Patton, Beata Szymczycha, Arunima Sen, Aivo Lepland, Jochen Knies, Ji-Hoon Kim, Nai-Chen Chen, and Wei-Li Hong

The efficiency of submarine groundwater discharge (SGD) in transporting solutes into coastal environments during glacial periods remains poorly understood. Moreover, the absence of observational constraints on offshore groundwater emplacement times hinders our understanding of glacial-driven SGD timescales and subsequent solute fluxes. This knowledge gap presents challenges in predicting the impact of ice sheet collapse on critical solute discharge into peripheral oceans. An SGD site with methane seepage offshore northern Norway that experienced drastic changes due to Fennoscandian ice sheet dynamics offers insights into glacial-interglacial transitions and their consequences for offshore groundwater circulation. Radiocarbon (14C) contents of the dissolved inorganic carbon along with chlorinity contents of the upward-advected fluids reveal that the groundwater transit times of the seawater component coincide with the retreat of the Fennoscandian ice sheet from the continental shelf. This suggests that seawater intrusion replaced offshore freshening, flushing the freshened aquifer with seawater. Decelerating groundwater discharge velocities and aquifer salinization as a consequence of glacial unloading allowed the precipitation of authigenic carbonates, sequestering discharged methane. Reduced groundwater advection velocities facilitated the migration of the sulfate-methane transition zone into the marine sediments, while the aquifer salinization likely increased Ca2+ concentrations, promoting carbonate precipitation. Our geochemical evidence conclusively shows that the decreased hydraulic head gradients, coupled with aquifer salinization, mitigated the escape of methane from the subsurface.

How to cite: ten Hietbrink, S., Patton, H., Szymczycha, B., Sen, A., Lepland, A., Knies, J., Kim, J.-H., Chen, N.-C., and Hong, W.-L.: Seawater intrusion and methane sequestration followed the retreat of the Fennoscandian ice sheet, EGU General Assembly 2024, Vienna, Austria, 14–19 Apr 2024, EGU24-1485, https://doi.org/10.5194/egusphere-egu24-1485, 2024.

Traditional physical barriers for mitigating seawater intrusion are expensive and necessitate complex engineering measures such as excavation or piledriving. An alternative cost-effective method involves artificially reducing the hydraulic conductivity in the upper parts of selected areas (modified zones) using a precipitate. This study presents an analytical solution using the finite Fourier Cosine transform to evaluate the impact of a modified zone on mitigating seawater intrusion and improving the maximum sustainable withdrawal rate in a coastal confined aquifer. Numerical solutions employing the variable density flow code SEAWAT are conducted to validate the proposed analytical solution. Effects of hydraulic conductivity, length, and thickness of the modified zone, along with the well location on the interface toe location and maximum sustainable withdrawal rate are investigated. Additionally, the sensitivities of dimensionless parameters are accessed under various combinations of the length and thickness of the modified zone. Results show that the interface toe shifts inland with an increase in the dimensionless equivalent hydraulic conductivity (κ) and a decrease in the dimensionless length of the modified zone (lD). Consequently, the maximum sustainable withdrawal rate increases as κ decreases and lD increases. The location of the pumping well significantly influences the maximum sustainable withdrawal rate in aquifers with finite domains, considering both inland and lateral boundary conditions. Sensitivities of β = L/W and η = K1H2/(qf L) to the maximum sustainable withdrawal rate are an order of magnitude greater than the sensitivity of αT,D = αT/H, considering aquifer length (L), aquifer width (W), aquifer hydraulic conductivity (K1), aquifer thickness (H), constant inland flux (qf), and transverse dispersivity (αT). These findings offer valuable insights for constructing modified zones to migrate seawater intrusion and for deploying pumping wells in coastal areas.

How to cite: Sun, J., Fan, B., and Lu, C.: Effects of Artificially Reducing Hydraulic Conductivity of Coastal Aquifers on Maximum Sustainable Withdrawal Rate, EGU General Assembly 2024, Vienna, Austria, 14–19 Apr 2024, EGU24-2205, https://doi.org/10.5194/egusphere-egu24-2205, 2024.

EGU24-2212 | ECS | Orals | HS8.1.8

Oxycline Variabilities in Intertidal Beach Aquifers Under Seasonally Variable Oxygen Consumption and Physical Forcing Regimes  

Felix Auer, Janek Greskowiak, Anja Reckhardt, and Moritz Holtappels

High-energy beaches mark a highly variable land-ocean transition where matter fluxes are modulated by dynamic subsurface biogeochemical reactions. At the beach face, seawater infiltration into the saline recirculation cell of the intertidal beach aquifer creates a high input of electron acceptors and organic matter. Microorganisms rapidly degrade fresh organic matter in the upper sandy beach layer under advective flow conditions. Filtration of particulate organic matter and constant supply of oxygen (O2) in the shallow sand body result in much of this turnover taking place under predominantly oxic conditions. In temperate regions, this filter effect combined with seasonal seawater inputs results in a strong seasonality of reaction rates as well a seasonally heterogeneous distribution of rates. Additionally, subsurface transport dynamics of seawater containing biogeochemical reactants highly depends on the physical forcings such as tides, waves and the beach morphology, adding complexity to the system. We assume that the variable O2-consuming degradation processes in the upper layer in combination with dynamic physical forcing regimes lead to a fluctuating oxycline in the beach aquifer. Therefore, the aim of our study was to investigate the impact of seasonally variable oxygen demand under different physical forcing regimes on redox zonation in the beach subsurface. We used O2 consumption rates from the beach face at Spiekeroog Beach (Germany), measured down to 1m depth and over a year-long sampling campaign within the project DynaDeep, to develop a numerical reactive transport model at field scale. The results from the field data showed a strong seasonal depth dependency of O2 consumption rates. Lowest rates were found in winter and increased substantially in summer, with the strongest increase in rates in the upper decimeters.Modelling case studies for a summer and a winter situation were carried out to simulate both, quasi-stationary and dynamic conditions. Model results show that the oxic zone is significantly larger in winter than in summer, aligning with the general O2 distribution measured in the field. We found that in summer, dynamic tidal conditions lead to greater variations in O2 concentrations than in winter. In addition, the model shows that during tidal inundation, O2 can overcome the high consumption rates in the upper decimeters in summer, thereby increasing the oxic zone. Finally, the model will be used to explore the impact of additional physical forcings in order to better constrain the oxycline as a variable redox boundary for subsequent anoxic processes.

How to cite: Auer, F., Greskowiak, J., Reckhardt, A., and Holtappels, M.: Oxycline Variabilities in Intertidal Beach Aquifers Under Seasonally Variable Oxygen Consumption and Physical Forcing Regimes , EGU General Assembly 2024, Vienna, Austria, 14–19 Apr 2024, EGU24-2212, https://doi.org/10.5194/egusphere-egu24-2212, 2024.

Seawater intrusion threatens the freshwater resources and the ecosystem in coastal areas. Spatial heterogeneity of hydraulic conductivity is a common feature of coastal aquifers and can significantly influence the location of the seawater-freshwater interface. Conventional approaches primarily rely on numerically solving the advection-dispersion models (e.g. SEAWAT) to determine the interface in three-dimensional heterogeneous aquifers. However, these approaches are mostly computationally intensive. This study developed a semi-analytical approach for determining the location of the sharp seawater-freshwater interface, considering the steady-state seawater intrusion in three-dimensional heterogeneous confined aquifers. The approach decouples the hydraulic conductivity as a spatial variable from the conventional potential definition and defines a new potential expression. A two-dimensional partial differential equation is employed to describe the three-dimensional heterogeneous aquifer system by calculating the transmissivity above the sharp interface. Finally, the potential distribution can be obtained by solving the governing equation using finite-difference method, allowing for determining of the morphology of the sharp interface. 2D cross-sectional and 3D confined coastal aquifers with Gaussian random hydraulic conductivity fields were generated to validate our approach. The seawater-freshwater interfaces were estimated using both the semi-analytical approach and SEAWAT. Comparison analysis showed that the developed semi-analytical approach can accurately simulate the interfaces by correcting the dispersion effect. This study provides a cost-effective means for estimating the seawater-freshwater interface location in three-dimensional heterogeneous confined aquifers. It is useful for future seawater intrusion study of three-dimensional systems and for managing subsurface freshwater resources efficiently.

Key Words: seawater intrusion, semi-analytical, three-dimensional, stochastic heterogeneity

How to cite: Liu, Y., Fan, B., Zhang, J., and Lu, C.: A semi-analytical method for delineating steady-state seawater-freshwater interface in three-dimensional stochastic heterogeneous confined coastal aquifers, EGU General Assembly 2024, Vienna, Austria, 14–19 Apr 2024, EGU24-2276, https://doi.org/10.5194/egusphere-egu24-2276, 2024.

EGU24-3042 | Posters on site | HS8.1.8

A novel toolbox for accurate thalweg determination in riverbed profiling and Salt Wedge Intrusion length extraction 

Fabio Viola, Alessandro De Lorenzis, and Giorgia Verri

The thalweg is the riverbed's lowest continuous path. It profoundly influences river processes, including sediment transport, channel morphology, aquatic habitats, and water quality. It plays a vital role in flood dynamics, navigation, and holds administrative and political significance as it may represent the legal boundary between entities like states. Accurate thalweg determination is crucial for various applications. This study introduces an innovative thalweg determination approach using the ETICO (EstuarIO Thalweg Identification Code) software, part of EstuarIO project within the Copernicus Marine Service Evolution Project led by CMCC (Centro Euro-Mediterraneo sui Cambiamenti Climatici). ETICO serves as the basis for quantifying salt wedge intrusion (SWI) length, which threatens local economy and ecosystem health in estuarine transitional zones.

ETICO is a Python3 highly adaptable tool meeting user-specific requirements for inputs, algorithm parameters, and outputs. It incrementally constructs the thalweg through NetCDF bathymetry and a user-defined origin, analysing a sliding window neighborhood. Next point selection relies on three criteria: 1) Depth-based: In the neighborhood, the highest values are selected with adjustable tolerance. 2) Direction-based: given d (last direction), candidates within the range [d-90, d+90] are assigned a score. Greater similarity to d yields a higher score. 3) Trend-based: Considering the direction of last n movements (defaulting to 10), allowed directions are narrowed to a 90-degree angle bisected by the trend. Scores are then furtherly updated. The highest-scored point is elected as next point. Iterations continues until no eligible candidates remain (each point in the window is either on incompatible direction, inland or already visited). Criteria 2 and 3 only act after an initialization phase. In literature, few algorithms for thalweg computation are documented, among which Moretti and Orlandini 2023 and Zhou et al. 2021. Concerning the latter, selection criteria allows preventing loops. The resulting thalweg is employed to determine the SWI length, moving from mouth to head, along the thalweg by analysing salinity values provided by an unstructured grid model using the same bathymetry. This approach leverages the tendency of highest salinity points to concentrate on the riverbed, thus reducing the analysis to the sole bottom layer. Threshold value for the target length is set to 1psu.

The tool underwent validation on five branches of Po (Dritta, Gnocca, Goro, Maistra, Tolle) and Danube (Chilia 1 to 3, George, Sulina). Bathymetric data originates from merging EMODnet 100m dataset with local multibeam surveys (Po case) or satellite (Danube), interpolated on regular grids with 10 and 100 m resolutions respectively. ETICO successfully faced challenges provided by complex geomorfologies (meanders, marshed and floodplains), and sections with constant values compensating incomplete bathymetry. In these instances, It exhibited strong adaptability while maintaining efficient execution, even with constrained computational resources. Comparison with manually traced GIS-derived thalwegs  revealed higher accuracy and notable improvements in calculating SWI length during the second stage.

Concluding, this study sets the stage for advancements in SWI length identification. Its validity was tested on Po and Danube rivers, but a wider dataset is a scheduled future improvement, besides the development of automated calibration of the algorithm parameters.

How to cite: Viola, F., De Lorenzis, A., and Verri, G.: A novel toolbox for accurate thalweg determination in riverbed profiling and Salt Wedge Intrusion length extraction, EGU General Assembly 2024, Vienna, Austria, 14–19 Apr 2024, EGU24-3042, https://doi.org/10.5194/egusphere-egu24-3042, 2024.

Groundwater serves as the main freshwater resources for water supply in coastal area of Yunlin, Taiwan. However, the development of agriculture, fisheries, and industry, has experienced excessive exploitation of groundwater. This has led to an imbalance in pressure between groundwater and seawater, resulting in an escalating issue of groundwater salinization. Clearly defining the interface between groundwater and seawater and examining the mechanisms behind groundwater salinization is an urgent task for water resources management. This study aims to establish a conceptual model for hydrogeology and seawater intrusion in the coastal areas of Yunlin using various types of data and investigation methods. The methods conducted in this study includes the electrical resistivity tomography (ERT), temperature-depth (TD) profiles, and the numerical model of Quasi-2D to delineate the potential region of salinized groundwater in the coastal area of Yunlin. Based on the long-term water quality data, Yiwu is identified as the potential impact zone of seawater intrusion where the salinity of groundwater exceeds the standard of freshwater. ERT was conducted in the shallow aquifer of Yiwu area and the results indicated that the aquifer is influenced by tidal effects. The thermal contour, derived from TD profiles obtained from nearby observation wells, depict the interface of freshwater and seawater. Subsequently, a Quasi-2D numerical model using TD profiles is employed to simulate groundwater flow directions and velocities around the interface. Ultimately, the hydrogeological conceptual model for seawater intrusion is developed. This study demonstrates that utilizing the long-term measurements and aforementioned series of methods is effective in delineating the interface of freshwater and seawater and developing the conceptual model of seawater intrusion.


Keywords: seawater intrusion, electrical resistivity tomography, temperature, numerical model

How to cite: Chen, K. and Chiu, Y.: Combining long-term monitoring system data with on-site experiments to analyze groundwater salinization and seawater intrusion in the coastal areas of Yunlin, TAIWAN, EGU General Assembly 2024, Vienna, Austria, 14–19 Apr 2024, EGU24-3328, https://doi.org/10.5194/egusphere-egu24-3328, 2024.

EGU24-3694 | ECS | Posters on site | HS8.1.8

Sustained upward discharge of relict high-salinity groundwater through salt marsh tidal creeks 

Lucheng Zhan, Pei Xin, Jiansheng Chen, Xiaogang Chen, and Ling Li

Salt marshes are fine-grained ecosystems widely distributed in the intertidal zone along global coastlines. Recent studies proved that submarine groundwater discharge (SGD) in salt marshes exports abundant nutrients and carbon supporting marine productivity and carbon sequestration in the ocean. However, due to our limited knowledge of groundwater discharge processes in these low-permeability systems, the accurate quantification of SGD-derived fluxes remains a great challenge. In a salt marsh system in East China, we found numerous high-salinity springs discharging from the bottom of tidal creeks. To determine their origin and trajectory, multiple field investigation methods including time-series thermal monitoring, isotope signatures and high-resolution electrical resistivity tomography were combined. Results suggest that these springs originate deep from the ancient relict marine water in the aquifer and keep discharging even during high tide. Such process represents a long-term re-distribution of the ancient marine water trapped in the unconfined aquifer. This spring-derived groundwater flow indicates a hidden SGD pathway in salt marshes, which has significant implications for studies concerning SGD-derived fluxes in similar multi-aquifer-aquitard coastal systems. These findings shed new light on the complex SGD processes in low-permeability coastal systems, while future studies are still required to further determine its driving forces and make quantitative assessments.

How to cite: Zhan, L., Xin, P., Chen, J., Chen, X., and Li, L.: Sustained upward discharge of relict high-salinity groundwater through salt marsh tidal creeks, EGU General Assembly 2024, Vienna, Austria, 14–19 Apr 2024, EGU24-3694, https://doi.org/10.5194/egusphere-egu24-3694, 2024.

EGU24-5043 | ECS | Orals | HS8.1.8

Flow-topography interaction over gravelly sand beds and the implications for transport of submarine groundwater discharge 

Helena Klettke, Leonie Kandler, Sven Grundmann, and Martin Brede

Submarine groundwater discharge is an important pathway of various nutrients and solutes from the land to the ocean. The groundwater discharging across the seabed interface is exposed to the highly dynamic conditions of the coastal ocean. The flow-topography interaction in the benthic boundary layer defines these dynamics and affects how the discharged groundwater is transported and mixed within the water column. Additionally, the flow-topography interaction can also drive convection in the seabed that can enhance fluxes across the seabed interface. 
To investigate these effects, laboratory experiments are conducted, where waves are generated over gravelly sand beds. In these types of beds, gravel protrudes from the seabed. The protruding part is altered to change its size and effective slope, to quantify their respective impact on the flow conditions. Additionally, water with a fluorescent dye seeps through the seabed, resembling groundwater discharge. A coupled PIV-LIF approach (Particle Image Velocimetry, Laser Induced Fluorescence) is used to measure the velocity field and the concentration of discharged water in the water column simultaneously. Both quantities are then correlated, which gives the turbulent Reynolds flux. This approach grants insights on the distribution, transport, and mixing of discharged water within the water column. 
Both, the seabed geometry and the wave scenario, significantly influence the turbulent flux. The results show different processes, such as wave pumping and separated vortex pumping, which drive convection in the seabed and alter the discharge rates. This leads to different concentrations of discharged water being measured in the water column, depending on the boundary conditions. While the outcome of these processes can be visualized and quantified in the water column from experimental data, complimentary surface-subsurface modeling holds the potential of additionally resolving the flow field within the seabed and expanding the investigated two-dimensional region to a three-dimensional domain. 

How to cite: Klettke, H., Kandler, L., Grundmann, S., and Brede, M.: Flow-topography interaction over gravelly sand beds and the implications for transport of submarine groundwater discharge, EGU General Assembly 2024, Vienna, Austria, 14–19 Apr 2024, EGU24-5043, https://doi.org/10.5194/egusphere-egu24-5043, 2024.

EGU24-5152 | Orals | HS8.1.8

Seasonal temperature patterns and variability in salt marshes: Field study and numerical simulation 

Xiayang Yu, Xinghua Xu, Lucheng Zhan, Haifeng Cheng, and Pei Xin

Soil temperature regulates biogeochemical processes and is a key environmental factor affecting salt marsh ecosystems. Previous studies on soil temperature and heat transport in intertidal marshes predominantly focused on short-term changes, leaving seasonal variations still unclear. This study conducted a yearlong field and modeling investigation to examine the temporal and spatial variations of soil temperature in a creek-marsh section under estuarine and meteorological influences. The porewater flow and heat transport processes were simulated using SUTRA-MS. The response of soil temperature to air and tidal water temperature conditions will be discussed here in detail. We will also discuss the impacts of tide-induced porewater circulations on soil temperature response. Finally, there will be a discussion on quantifying the thermal effects of tidal water and air on hourly and depth-averaged shallow soil temperatures in the creek-marsh system.

How to cite: Yu, X., Xu, X., Zhan, L., Cheng, H., and Xin, P.: Seasonal temperature patterns and variability in salt marshes: Field study and numerical simulation, EGU General Assembly 2024, Vienna, Austria, 14–19 Apr 2024, EGU24-5152, https://doi.org/10.5194/egusphere-egu24-5152, 2024.

EGU24-5199 | ECS | Orals | HS8.1.8

Release of ancient dissolved carbon by thawing submarine permafrost in the Canadian Beaufort Sea  

Nai-Chen Chen, Ji-Hoon Kim, Jong-Kuk Hong, and Wei-Li Hong

Long-term warming of the continental shelf of the Canadian Beaufort Sea has caused decomposition of submarine permafrost. Ancient dissolved carbon preserved in submarine permafrost could be transported and released into seawater by submarine groundwater discharge derived from thawing permafrost. However, the rate and scale of such a carbon emission is currently unclear. To fill this knowledge gap, we investigate the δ13C, Δ14C, and composition of sediment pore fluid from samples retrieved from a shelf edge site, where rapid seafloor depressions as a result of permafrost thawing have been observed. Downcore decrease of water isotopic signatures indicate widespread meteoric freshwater seepage from the region. The Δ14C values of dissolved inorganic carbon (DIC) in pore fluids indicate an ancient source of DIC (up to 7.7 cal kyr BP). The carbon isotopic mass balance calculation with Δ14C and δ13C of DIC suggest an input of ancient DIC with little radiocarbon, which is not from in-situ dissolution of carbonate. In other words, mixing of DIC from in-situ degradation of local organic carbon and overlying seawater DIC cannot explain the observed Δ14C values of DIC. Based on these results from porewater profiles, we suggest a lateral discharge of low-chlorinity fluid carrying such an ancient DIC to shallow sediments as a result of the decadal degradation of submarine permafrost.

How to cite: Chen, N.-C., Kim, J.-H., Hong, J.-K., and Hong, W.-L.: Release of ancient dissolved carbon by thawing submarine permafrost in the Canadian Beaufort Sea , EGU General Assembly 2024, Vienna, Austria, 14–19 Apr 2024, EGU24-5199, https://doi.org/10.5194/egusphere-egu24-5199, 2024.

Beach faces form the interface between terrestrial and marine systems. They act as a reactive zone between these two compartments, transporting and biogeochemically modifying chemical constituents such as nutrients, pollutants and carbon. Mixing between saline seawater and fresh terrestrial groundwater in the subsurface is complicated by catchment morphology, variable density flow and very dynamic boundary conditions across temporal scales (e.g. tides, storms, yearly variations in terrestrial groundwater levels). Thus, tracing water and nutrients fluxes through the subterranean estuary is not trivial, especially when attempting to quantify temporal dynamics on time scales from days to weeks. In this work we use long-term (months) temperature profile measurements and numerical heat modelling to investigate the dynamics of water fluxes through the beach sediments into the Königshafen Bay, Sylt Island, North Germany. Temperature measurements were complemented by stable isotope (δ18O, δ2H)  and pore water chemical measurements to infer the origin of water discharging into the bay. The results showed that the temporal fluxes vary considerable depending on season, location and catchment characteristics. The freshwater flow paths are complex, with dune morphology influencing the focal point for fresh groundwater discharge. Moreover, it appears that either the isotope signature of the islands fresh groundwater is variable or there are at least two end-members contribute to the freshwater signature. Seaward, saline and brackish discharge occurs into the tidal creek draining the bay. Overall temperature measurements and heat modelling combined with pore water chemistry show potential to understand the dynamics in water and element exchange through the subterranean estuary and thus help to understand local water and material fluxes and transformations at the land-ocean interface.

How to cite: Gilfedder, B., Böttcher, M. E., von Ahn, C. M. E., and Frei, S.: Quantifying dynamic water fluxes and origin at the land-sea interface from days to weeks using temperature and stable isotopes: An example from Königshafen, Sylt, EGU General Assembly 2024, Vienna, Austria, 14–19 Apr 2024, EGU24-5707, https://doi.org/10.5194/egusphere-egu24-5707, 2024.

EGU24-6975 | ECS | Posters on site | HS8.1.8

Impacts of Sea Level Rise and Tidal Restoration on Groundwater Dynamics in the Herring River Watershed, Cape Cod, USA  

John Richins, Kevin Befus, Kasra Naseri, and Michelle Hummel

Sea levels are expected to rise due to global climate change, leading to significant impacts on coastal systems. One of these impacts is the decrease in the depth to groundwater in shallow coastal aquifers. This decrease could result in changes to groundwater discharge, increased groundwater shoaling, and the loss of dry land due to groundwater emergence and inundation.  

In the past, many tidally influenced coastal drainage networks were diked and drained for human use. However, there is now growing interest in restoring these diked systems to their natural tidal conditions. Tidal restoration will change the surface water levels of estuaries, which will affect the underlying groundwater in ways similar to sea level rise but potentially more rapidly. 

The Herring River watershed in Cape Cod, MA, USA is currently undergoing a tidal restoration project. We have chosen the Herring River as a case study to determine how tidal restoration and sea level rise will change conditions in the surrounding shallow aquifer. To predict the changes in groundwater conditions due to tidal restoration and sea level rise, a MODFLOW 6 groundwater model was coupled with a DELFT3D hydrodynamic model. The hydrodynamic model provided surface water boundary conditions for the groundwater model. Sea level is expected to rise by approximately one meter by the year 2100. Therefore, the model was run for several sea level rise scenarios, including the current sea level and projected sea level rise of 0.6 meters and 0.9 meters, for tidally controlled and restored conditions.  

The preliminary results of the model indicate an increase in groundwater shoaling and emergence as sea level rises and restoration occurs. This shallowing of the water table may also lead to more overall groundwater discharge to the drainage network and coastal waters. If tidal control does not allow sufficient drainage, increased groundwater discharge may become impounded behind similar diked systems leading to more overall flooding than if tidal conditions were restored. Showing how groundwater emergence, shoaling, and discharge will change with sea level rise and tidal restoration can help coastal stakeholders decide which management practices are best implemented during restoration efforts. 

How to cite: Richins, J., Befus, K., Naseri, K., and Hummel, M.: Impacts of Sea Level Rise and Tidal Restoration on Groundwater Dynamics in the Herring River Watershed, Cape Cod, USA , EGU General Assembly 2024, Vienna, Austria, 14–19 Apr 2024, EGU24-6975, https://doi.org/10.5194/egusphere-egu24-6975, 2024.

EGU24-7644 | ECS | Posters on site | HS8.1.8

Effects of temperature fluctuations on tidally-influenced coastal unconfined aquifers 

Li Pu, Xiayang Yu, and Pei Xin

Temperature has been found to play an important role in controlling groundwater flow and salinity distribution in coastal aquifers. However, previous studies focused on the effects of fixed temperature. In nature, both land surface temperature and seawater temperature fluctuate seasonally. The yearly fluctuation ranges of land surface and seawater temperatures can commonly reach 30°C. These surface temperature signals could propagate into coastal aquifers and change the temperature distribution in coastal aquifers. This may further induce seasonal variations in groundwater flow and solute transport processes. This research aims to investigate the effects of seasonal fluctuation in land surface and seawater temperatures on salinity distribution and water exchange in coastal unconfined aquifers subject to semi-diurnal tide. A numerical model, SUTRA-MS, is used to simulate the variably saturated and density-dependent groundwater flow coupled with salt and heat transport. Salt mass stored in the aquifer and water fluxes across the aquifer-ocean interface are used to evaluate the effects. Sensitivity analyses of fluctuation amplitude of temperature and tidal amplitude are also conducted. Finally, we discuss the implications of these results for nearshore biogeochemical processes and for accurate assessment of submarine groundwater discharge.

How to cite: Pu, L., Yu, X., and Xin, P.: Effects of temperature fluctuations on tidally-influenced coastal unconfined aquifers, EGU General Assembly 2024, Vienna, Austria, 14–19 Apr 2024, EGU24-7644, https://doi.org/10.5194/egusphere-egu24-7644, 2024.

Coastal aquifers encompass a variety of flow patterns, with circulating seawater being a prominent phenomenon driven by diverse mechanisms of varying spatial and temporal scales. Understanding the volume of seawater circulation in aquifers is of great interest due to water-rock interactions and consequent modification of seawater composition. While the influence of circulating seawater on ocean biogeochemistry and ecology is well recognized, quantifying its actual effect is challenging due to the involvement of multiple mechanisms.

In this study, we employed element and isotope ocean budgets and groundwater flow modeling to quantify fluxes through specific mechanisms, enabling us to determine solute fluxes from coastal aquifers into the sea. Our budgets included all known ocean sources and sinks, such as river fluxes, mid-ocean ridge hydrothermal circulation, basalt weathering, and diffusive fluxes. We used major element budgets and δ26Mg and 87Sr/86Sr budgets to constrain the long-term SGD flux. Our sensitivity tests included steady-state conditions and scenarios where the hydrothermal fluxes and rivers were over or underestimated, and precipitation of carbonates was over-estimated. We found the steady-state, underestimation of both hydrothermal and river fluxes, and overestimation of carbonate fluxes reasonable scenarios.

Our findings, using groundwater flow models sensitivity tests and geospatial databases, reveal that benthic wave-driven circulation contributes the largest volume of circulating seawater, while other mechanisms such as nearshore circulation, tidal pumping, and density-driven circulation are 2-3 orders of magnitude smaller. However, the short duration (minutes) of water-rock interaction under the wave-driven circulation limits its potential to modify seawater. Long-term density-dependent circulation emerges as the most significant mechanism influencing ocean chemistry, primarily due to its extended time scale of water-rock interaction. The prevailing water-rock interaction process in coastal aquifers is identified as ion exchange, wherein circulating seawater returning to the sea becomes enriched in calcium and depleted in potassium and sodium. The annual volume of seawater circulating through the long-term process is calculated to be approximately 1000-2000 km3/y, resulting in calcium and potassium fluxes of 17 ± 6 and -3.36 ± 1.6 Tmol/y, respectively. Notably, these fluxes are of the same magnitude as solute fluxes from rivers.

How to cite: Kiro, Y. and Levy, Y.: Using ocean chemical budgets and groundwater flow models to quantify SGD individual component fluxes, EGU General Assembly 2024, Vienna, Austria, 14–19 Apr 2024, EGU24-9016, https://doi.org/10.5194/egusphere-egu24-9016, 2024.

EGU24-9053 | Posters on site | HS8.1.8

Seawater Intrusion Mechanisms in Heterogeneous Coastal Aquifers Subject to Pumping 

Mohammadali Geranmehr, Domenico Bau, Alex Mayer, Lauren Mancewicz, and Weijiang Yu

Seawater intrusion (SWI) in coastal aquifers is influenced by both spatial distributions of hydraulic properties and pumping rates. The heterogeneity of parameters such as hydraulic conductivity (K) may have a significant impact on the vulnerability of these systems to SWI and the sustainability of groundwater supply.

In this work vulnerability is assessed in relation to indicators such as: (a) the salt concentration of extracted groundwater (C); and (b) the total dissolved mass (TDM) of salt in the aquifer. This study delves into a modified version of the classical two-dimensional Henry's problem, featuring a single pumping well situated in proximity of the coastline. The well pumping rates are expressed as fractions of the total flow rate entering the aquifer from the inland boundary. The fraction range from a minimum of zero (no pumping) to a maximum of five.

To investigate the impact of aquifer heterogeneity a series of stochastic simulations are conducted using the popular variable density flow model SEAWAT. Heterogeneity in the K spatial distribution is modelled as a geostatistical log-normal process characterized by an exponential covariance function, with variance values ranging from 0.25 to 1.0, horizontal correlation scales from 10 m up to 2000 m, and a single vertical correlation scale of 10 m. This approach allows for investigating the effects of the K heterogeneity, the layering features of the aquifer system, and the intensity of groundwater pumping on C and TDM.

A detailed examination of model results reveals several interesting outcomes. Most notably, the TDM indicator is rather sensitive to the K heterogeneity, whereas the C indicator is much less affected by it. In terms of TDM, selected cases are singled out and discussed. In general, lower K values exhibit minimal SWI even with large pumpage, whereas high K values lead to pronounced SWI even at low pumping. Increased variance and horizontal correlation correspond to varied SWI behaviour. The TDM spread remains generally low due to relatively low variance. With an increase in horizontal correlation, the spread becomes more pronounced for low pumping rates and less pronounced for large pumping rates.

How to cite: Geranmehr, M., Bau, D., Mayer, A., Mancewicz, L., and Yu, W.: Seawater Intrusion Mechanisms in Heterogeneous Coastal Aquifers Subject to Pumping, EGU General Assembly 2024, Vienna, Austria, 14–19 Apr 2024, EGU24-9053, https://doi.org/10.5194/egusphere-egu24-9053, 2024.

EGU24-9178 | Orals | HS8.1.8

The sandy beach subterranean estuary as a potential organic carbon sink 

Kojo Amoako, Grace Abarike, Hannelore Waska, Jutta Niggemann, and Thorsten Dittmar

Subterranean estuaries (STEs) beneath sandy beaches are biogeochemical reactors that can modify the chemical composition of fresh groundwater and recirculating seawater. Compared to surface estuaries, the mechanisms underlying the transformation of dissolved organic matter (DOM) in the STEs remain challenging to disentangle, particularly in high-energy beaches where DOM supplied from marine and terrestrial sources is exposed to alternating redox conditions, salinity gradients, and dynamic flows. Our study is aimed at elucidating the spatio-temporal patterns of DOM sources and sinks in high-energy beach STEs from a case study site on a barrier island in the German North Sea. We present a geochemical analysis of freshwater lens groundwater (FWL), seawater (SW), and beach STE groundwater samples (STEGW) collected over different seasons. STEGW samples were collected from multilevel wells with sampling depths of 6m, 12m, 18m, and 24m close to the dune base (ML1), near the high-water line (ML2), and the low-water line (ML3), and the FWLGW was collected from wells located at the northwestern part of the island. All samples were analyzed for their dissolved organic carbon (DOC) concentrations, and humic-like/terrestrial components of DOM (FDOM) were determined via fluorescence spectroscopy. DOM samples were desalted through solid-phase extraction and molecularly characterized via ultra-high-resolution electrospray ionization Fourier transform ion cyclotron resonance mass spectrometry. We found a decrease of FDOM along the salinity gradient in the land-sea continuum (FWL > STEGW > SW). DOC concentrations were highest in the FWL and SW but relatively lower in STEGW samples, suggesting a role of this STE as net organic carbon sink. The DOM composition of the groundwater samples from all sampling stations was highly diverse, with a total of up to 10,000 detected molecular formulas. The numbers of detected molecular formulas in FWL samples were twofold higher than those in SW samples, with intermediate values observed in the STEGW. There was a general decline in terrestrial DOM signature in the land/sea continuum, suggesting the loss of terrestrial DOM from land to the sea. Our results indicate that STEs under high-energy beaches are powerful sinks for organic carbon from both marine and terrestrial sources.

How to cite: Amoako, K., Abarike, G., Waska, H., Niggemann, J., and Dittmar, T.: The sandy beach subterranean estuary as a potential organic carbon sink, EGU General Assembly 2024, Vienna, Austria, 14–19 Apr 2024, EGU24-9178, https://doi.org/10.5194/egusphere-egu24-9178, 2024.

EGU24-9937 | ECS | Orals | HS8.1.8

Spatio-temporal dynamics of groundwater biogeochemistry in the deep subsurface of high-energy beaches 

Anja Reckhardt, Magali Roberts, Michael E. Böttcher, Rena Meyer, Oliver Wurl, Katharina Pahnke, and Gudrun Massmann

Intertidal permeable high energy beach systems represent complex biogeochemical reactors which attract increasing scientific attention. In these environments morphology variations lead to complex and dynamic groundwater flow paths, saltwater-freshwater mixing zones, and changing biogeochemical conditions. The aim of our study was to assess the spatio-temporal dynamics in the hydrobiogeochemistry of the continuum between a deep subterranean estuary (STE) and the surface of a high-energy beach on Spiekeroog Island (Germany). Several permanent wells distributed along a cross-shore transect (supratidal to intertidal zone) allowed for regular groundwater sampling down to 24 m below ground surface (mbgs). Additional direct push sampling helped to obtain a high resolution cross-sectional view on the deep STE groundwater biogeochemistry. We found salinities below 10 near the dunes increasing to a salinity of about 30 towards the intertidal zone. Tide- and wave induced seawater circulation reached down to more than 24 mbgs. Oxygen and NO3- penetrated 12-15 mbgs deep, at least in the supratidal to upper intertidal area. Below and towards the low water line, conditions were Fe-(hydr)oxide-reducing and accumulating Fe sulfides indicated active microbial net sulfate reduction. At few sites, the concurrent presence of dissolved NO3- and Fe indicated overlapping redox zones. Deep old freshwater from Spiekeroog’s fresh groundwater lens mixed with the saline groundwater in the lower intertidal zone and added nutrients, especially Si, but lowered dissolved Mn and Fe concentrations. Accordingly, these parameters followed the temporally varying location of freshwater discharge at this site. Except for this most seaward well site, biogeochemical conditions were found to be relatively stable in the zone below 12 mbgs of the STE and more variable above. Temporal changes related to seasonally varying input and processing of organic material seemed to be restricted to the top few mbgs around the high-water line, where tide-induced infiltration regularly adds young seawater to the beach system. In the next step, the results will be analyzed by reactive-transport modeling to allow for a further general understanding and extrapolation of flow and reaction dynamics in the deep subsurface below high-energy beaches.

How to cite: Reckhardt, A., Roberts, M., Böttcher, M. E., Meyer, R., Wurl, O., Pahnke, K., and Massmann, G.: Spatio-temporal dynamics of groundwater biogeochemistry in the deep subsurface of high-energy beaches, EGU General Assembly 2024, Vienna, Austria, 14–19 Apr 2024, EGU24-9937, https://doi.org/10.5194/egusphere-egu24-9937, 2024.

EGU24-9972 | Orals | HS8.1.8

The Protective Effect of Mixed Physical Barrier in Heterogeneous Aquifers: Experimental and Numerical Study 

Antoifi Abdoulhalik, Ashraf Ahmed, and Ismail Abd-Elaty

The ability of mixed physical barrier (MPB) as a seawater intrusion countermeasure was explored in heterogeneous coastal aquifer settings. The performance of MPB was examined in a synthetic aquifer containing a low permeability interlayer sandwiched between two layers of high permeability (case HLH). The performance of the MPB was compared to that of a single cut-off wall for various hydraulic gradients in a laboratory setting, whereby performance was measured in terms of measuring the percentage of reduction of the intrusion length. Also, numerical simulations were conducted using SEAWAT to validate and further examine the effects of various layering patterns on MPB performance. In total, five additional heterogeneous scenarios were simulated, including a scenario where a low permeability layer was set at the top of the aquifer (case LH), at the lower part of the aquifer (case HL), at the top and bottom part of the aquifer (case LHL), and two cases with monotonically increasing/ decreasing permeability from top to bottom. The sensitivity of the percentage reduction to the MPB design and hydrogeological parameters was examined thereafter. Experimental results demonstrate that the MPB could perform better than the single cutoff wall, with up to 55 % more reduction of the intrusion length. Also, the numerical results showed that the MPB remained effective regardless of the stratification patterns adopted, whereby it achieved at least around 70% SWI length reduction. The results also showed that the effectiveness of MPB was very sensitive to the thickness of the middle layer as well as the permeability ratio. While increasing the thickness of the interlayer induced a negative impact on the MPB performance, a reduction in the permeability of the interlayer induced better reduction. The findings of this study provide insight into the main parameters affecting the performance of the MPB system in realistic layered heterogeneous coastal aquifer scenarios and further evidence of its reliability as a practical countermeasure for SWI.

How to cite: Abdoulhalik, A., Ahmed, A., and Abd-Elaty, I.: The Protective Effect of Mixed Physical Barrier in Heterogeneous Aquifers: Experimental and Numerical Study, EGU General Assembly 2024, Vienna, Austria, 14–19 Apr 2024, EGU24-9972, https://doi.org/10.5194/egusphere-egu24-9972, 2024.

EGU24-10119 | ECS | Posters on site | HS8.1.8

Rare earth element dynamics in the deep subsurface of a high energy beach in the North Sea 

Magali Roberts, Anja Reckhardt, Grace Abarike, Kojo Amoako, Rena Meyer, Gudrun Massmann, and Katharina Pahnke

Subterranean estuaries (STE) of high energy beaches are important coastal reactors that can alter elemental fluxes to the sea. The advective flow of pore water in these STE systems has rapid transport rates due to the high permeability of medium to coarse grained sediments. This flow is controlled by the inland hydraulic gradient, density differences caused by different matrixes (fresh and saline), and oceanic forces (tides and waves). Rare earth elements (REEs) are useful tracers for biogeochemical processes like scavenging, redox changes and provenance. Therefore, a better understanding of their dynamics in different environments is required. In order to investigate REE cycling in the deep subsurface of a sandy beach on spatial and temporal scales, groundwater REE concentrations were analysed along a cross-shore transect down to a depth of 24 m below the sediment surface over the timespan of a year. Together with other trace element, nutrient, and dissolved organic carbon concentrations as well as environmental data (salinity, temperature, pH) from the same stations and depths, the results provide first insight into spatio-temporal variations of biogeochemical processes and changes that lead to the retention or mobilisation of REEs in the deep STE of a high-energy beach. 

How to cite: Roberts, M., Reckhardt, A., Abarike, G., Amoako, K., Meyer, R., Massmann, G., and Pahnke, K.: Rare earth element dynamics in the deep subsurface of a high energy beach in the North Sea, EGU General Assembly 2024, Vienna, Austria, 14–19 Apr 2024, EGU24-10119, https://doi.org/10.5194/egusphere-egu24-10119, 2024.

EGU24-10924 | Orals | HS8.1.8

Building large-scale 3D coastal groundwater models with iMOD-WQ and global datasets 

Gualbert Oude Essink, Daniel Zamrsky, Jude King, Wahdan Achmad Syaehuddin, and Marc Bierkens

Large-scale coastal groundwater models (LCGMs) covering areas of several tens of thousands of km2 can provide valuable insights into (supra)regional coastal groundwater system dynamics over time. This is crucial in understanding the current and future state of transboundary groundwater resources as well as identifying potential hotspots for fresh groundwater shortages in coastal regions worldwide. Recent developments in code parallelization, namely the SEAWAT based iMOD-WQ code (Verkaik et al. 2021) and high performance computing open new possibilities in building LCGMs using open source tools like Python and available global datasets as input into the LCGMs. These LCGMs, despite simplifications and uncertainties related to hydrogeological data availability, yet provide first order approximations of groundwater conditions in data scarce large-scale regions.. In this research, we describe current and future developments of our tool and demonstrate potential opportunities in using these LCGMs as basis for further developments in (supra)regional water management in data-scarce regions.

The recent development of parallel open-source iMOD-WQ signalled an important breakthrough in variable-density groundwater flow and salt transport modelling with regular (and irregular) grids options and geological data ensemble modules. Whereas in before only serial simulations using the regular SEAWAT code were possible, now these simulations can be split into multiple (practically at least tens of) partitions and executed in parallel, leading to significant reduction in computation time. This opens possibilities in terms of both the physical and temporal size of the LCGMs. The LCGMs developed in this research cover several tens of thousands km2 and simulate groundwater salinity dynamics over a full glacial-interglacial cycle (viz. approx. 125 kA). The HydroBASINS global-watershed-boundaries dataset is used to delineate the boundary of the LCGM in the inland part of the model domain. Our LCGMs also cover the offshore continental shelves; those are manually outlined and added to the selected HydroBASINS. The top elevation is derived from a global DEM dataset (GEBCO) while the bottom elevation is estimated by the bottom of the unconsolidated sediment formations as well as the sedimentary rock formations (limited to siliclastic lithology). Using this approach can lead to considerable uncertainties and therefore, whenever local hydrogeological input data is available (e.g. bore logs, groundwater salinity, extractions), we use tools like GEMPY to improve the hydrogeological model in our LCGM building tool. We believe that building a LCGM using global datasets is a necessary first step to provides valuable information for (supra)regional coastal groundwater management in data-scarce regions.

Verkaik, J., J. Van Engelen, S. Huizer, M.F.P. Bierkens, H.X. Lin, and G.H.P. Oude Essink. 2021. “Distributed Memory Parallel Computing of Three-Dimensional Variable-Density Groundwater Flow and Salt Transport.” Advances in Water Resources 154 (August): 103976. https://doi.org/10.1016/j.advwatres.2021.103976.

How to cite: Oude Essink, G., Zamrsky, D., King, J., Achmad Syaehuddin, W., and Bierkens, M.: Building large-scale 3D coastal groundwater models with iMOD-WQ and global datasets, EGU General Assembly 2024, Vienna, Austria, 14–19 Apr 2024, EGU24-10924, https://doi.org/10.5194/egusphere-egu24-10924, 2024.

EGU24-11169 | Orals | HS8.1.8

Detection of Tidal Signatures in Self-Potential Monitoring of UK Aquifers 

Adrian Butler, Thomas Rowan, Gerard Hamill, Raymond Flynn, Shane Donohue, and Matthew Jackson

Increased groundwater extraction, coupled with potential declines in recharge rates, is anticipated to negatively impact the sustainability of groundwater resources (Mehdizadeh, 2019). Coastal aquifers are particularly vulnerable, as these changes can result in a significant risk of saltwater intrusion (SI). While the fundamental mechanisms of SI are well-understood, tracking the encroachment of saline water into coastal aquifers and its risk to water extraction sources remains a complicated and expensive task. Studies have shown that self-potential (SP) could serve as an effective tool for remotely monitoring the movement of saline-freshwater interfaces due to SI (Graham, 2018).

Self-potential voltages, which originate from subsurface pressure and concentration gradients, occur when these gradients lead to ion separation. This separation results in an electrical potential and a subsequent electron flow to preserve electrical neutrality. These potentials, usually in the millivolt range, can be observed and recorded in the field using electrodes. SP primarily consists of two types: electro-kinetic potentials (VEK), arising from differing flow velocities, and exclusion-diffusion potentials (VED), stemming from ion concentration gradients with varying mobilities. A previous study recorded tidal signatures in SP within a Chalk borehole located less than 2 kilometres from the English Channel (MacAllister et al., 2016). More recent research has detected similar signatures in a sand aquifer on the north coast of Northern Ireland and in a gravel aquifer on the south coast of England.

In each instance, the tidal signature most prominently reflected the M2 (Principal lunar-semidiurnal) component, although in some cases other, less prominent, elements were also identified. Analysis of water level, electrical conductivity and temperature data suggests that these signatures were not due to electrokinetic potentials from tidally induced flows in and around the borehole. Rather, a more likely explanation is that nearby saline-freshwater interfaces, inducing exclusion-diffusion potentials, are responsible. Whilst further investigation is necessary to quantify, model, and fully comprehend these signals, the detection of tidal signatures in an increasing and diverse number of aquifers suggests that self-potential might be a viable technique for monitoring and providing an early warning of saline intrusion.

Bibliography
Graham, M. T., MacAllister, DJ., Vinogradov, J., Jackson, M. D., and A. P., Butler, (2018). Self‐potential as a predictor of seawater intrusion in coastal groundwater boreholes. Water Resources Research, 54, 6055– 6071.
MacAllister, DJ., Jackson, M. D., Butler, A. P., and Vinogradov, J. (2016), Tidal influence on self‐potential measurements, J. Geophys. Res. Solid Earth, 121, 8432– 8452.
Mehdizadeh, S., Badaruddin, S. and S. Khatibi, (2019). Abstraction, desalination and recharge method to control seawater intrusion into unconfined coastal aquifers. Global Journal of Environmental Science and Management, 5, 107-118.

How to cite: Butler, A., Rowan, T., Hamill, G., Flynn, R., Donohue, S., and Jackson, M.: Detection of Tidal Signatures in Self-Potential Monitoring of UK Aquifers, EGU General Assembly 2024, Vienna, Austria, 14–19 Apr 2024, EGU24-11169, https://doi.org/10.5194/egusphere-egu24-11169, 2024.

EGU24-11328 | ECS | Posters on site | HS8.1.8

Sea-land interaction along the Catalan coast (NW Mediterranean): Assessment of Submarine Groundwater Discharge (SGD) based on seawater nutrient concentrations  

Martí Sanchis, Esther Garcés, María Isabel Ortego, and Albert Folch

Submarine Groundwater Discharge (SGD) has garnered attention in the assessment of sea-land interactions within coastal regions. SGD plays a crucial yet uncertain role in coastal ecosystems, involving the release of nutrient-enriched groundwater and recirculation seawater in the geological matrix into the sea. Its significance is particularly relevant in the oligotrophic Mediterranean Sea, characterized by low nutrient concentrations, making SGD a pivotal process in sustaining life within the sea-land transition zone.

This study explores the impact of SGD along the 580 km of the Catalan coast (Western Mediterranean) an area densely populated where land-sea interactions and the effects of SGD on marine ecosystems may be substantial. Leveraging a 23-year dataset, the study seeks to establish connections between SGD and the quality of the coastal area. The primary focus lies in investigate SGD locations through the analysis of salinity and inorganic nutrient composition (NO3, NO2, NH4, PO4, and SiO4) at 70 coastal stations. A novel perspective, Compositional Data Analysis (CoDa), is employed for this purpose. The study also integrates land-based hydrogeological factors, such as the geological nature of the aquifer. Furthermore, it explores the correlations between nutrient composition and biological indicators, specifically chlorophyll in the coastal area, utilizing CoDa techniques. Chlorophyll, as an indicator of photosynthetic activity, serves as a marker for biological responses to nutrient changes induced by SGD.

This innovative approach, centered on the compositional nature of the data, streamlines the identification SGD locations and enables a comprehensive assessment of its ecological impact. The outcomes of this study have the potential to provide valuable insights for the improvement of coastal ecosystem management.

Acknowledgments

This work was funded by the Spanish Government grant no. PID2022-140862OB-C21/C22 and PID2021-125380OB-I00 funded by MCIN/AEI/10.13039/501100011033 and by ERDF A way of making Europe

How to cite: Sanchis, M., Garcés, E., Ortego, M. I., and Folch, A.: Sea-land interaction along the Catalan coast (NW Mediterranean): Assessment of Submarine Groundwater Discharge (SGD) based on seawater nutrient concentrations , EGU General Assembly 2024, Vienna, Austria, 14–19 Apr 2024, EGU24-11328, https://doi.org/10.5194/egusphere-egu24-11328, 2024.

EGU24-11418 | ECS | Orals | HS8.1.8

Integrating groundwater flow models with physical oceanographic models in coastal regions 

Jiangyue Jin, Manuel Espino, Daniel Fernández, and Albert Folch

Abstract 

Amidst increasing human activities and complex interactions between the ocean and land, coastal zones have emerged as dynamic yet vulnerable regions within global ecosystems. Understanding the interplay between groundwater and the ocean is crucial for studying submarine groundwater discharge (SGD) and seawater intrusion (SWI), thereby protecting coastal environments and water resources. This study aims to propose a coupling strategy between groundwater flow models and physical oceanographic models to accurately simulate the interactions between coastal groundwater and the ocean.

In this research a three-dimensional hydrodynamic model based on TELEMAC-3D was first constructed to simulate marine conditions under varying salinities and temperatures. Subsequently, a groundwater model using MODFLOW6 was developed. An efficient coupling strategy was introduced through the integration of Python, facilitating precise integration of the hydrodynamic and groundwater models. Validation results of the coupled model against published experimental results demonstrated high accuracy, closely replicating laboratory outcomes within acceptable error margins.

By combining three-dimensional hydrodynamics with groundwater modeling, this study not only represents an innovative attempt at coupling but also provides a robust tool for understanding the complex mechanisms of interaction between the ocean and land.

How to cite: Jin, J., Espino, M., Fernández, D., and Folch, A.: Integrating groundwater flow models with physical oceanographic models in coastal regions, EGU General Assembly 2024, Vienna, Austria, 14–19 Apr 2024, EGU24-11418, https://doi.org/10.5194/egusphere-egu24-11418, 2024.

EGU24-11535 | ECS | Orals | HS8.1.8

Evaluation of Submarine Groundwater Discharge and Chemical Fluxes along the Coastal Plains of Odisha, India. 

Soumya Kanta Nayak and Janardhana Raju Nandimandalam

Submarine Groundwater Discharge (SGD) and Seawater Intrusion (SWI) are two opposite components of hydrological cycle that occur across the land-sea continuum and their understanding are imperative for development and management of coastal groundwater resources. This study has attempted to identify the SGD and SWI sites along the water stressed coastal plains of Odisha through a three tier investigation system and quantify the SGD and associated chemical fluxes (nutrients and metals) though seepage metric measurements. A total 340 samples (85 each i.e., 30 porewater, 30 seawater and 25 groundwater in two post-monsoons and two pre-monsoons) were collected and their in-situ physicochemical parameters were measured along ~145 km of the coastline. Considering high groundwater EC values (> 3000 μS/cm), three probable SWI and low porewater salinities (< 32 ppt in pre-monsoons and < 25 ppt in post-monsoons), four probable SGD zones were identified. The high positive hydraulic gradient (> 10 m) near SGD site and negative gradient (< 0 m) near SWI site along with anomalous SST (due to cold/warm groundwater input) at SGD locations validated the identified locations. Lee type seepage meters were installed at SGD identified sites during the low tide period and the measured fluxes ranged from 0 to 4247.973 m3 m-2 year-1 in post-monsoon and 0 to 1470.46 m3 m-2 year-1 in pre-monsoon. The metal fluxes were found in the order of B > Sr > Li > Ba > Al > As > Fe > Ni > Cu > Co > Mo > Be > Mn with highest flux of B (2962.86 mmol. m-2 year-1) at Puri beach which was 7x of Sr-flux and 30x of Li-flux respectively. Among the measured nutrients, DSi fluxes were higher than NO3- and PO43- and the highest flux of DSi (849.86 mmol. m-2 year-1) was observed at Puri beach. These nutrients and metal fluxes may lead to an increased chance of eutrophication/algal blooms at the SGD-identified locations and influence the sensitive coastal-marine ecosystems of Odisha; therefore, further investigations focusing on biogeochemical species transformation are needed along the fresh-saline interface.

Keywords: Submarine Groundwater Discharge, Seawater Intrusion, Nutrient flux, Metal flux, Seepage meter, Odisha Coast.

How to cite: Nayak, S. K. and Nandimandalam, J. R.: Evaluation of Submarine Groundwater Discharge and Chemical Fluxes along the Coastal Plains of Odisha, India., EGU General Assembly 2024, Vienna, Austria, 14–19 Apr 2024, EGU24-11535, https://doi.org/10.5194/egusphere-egu24-11535, 2024.

EGU24-12252 | Orals | HS8.1.8

Reactive transport modeling to study the impact of mineral reactions and surface complexation on the transport of dissolved species in a subterranean estuary 

Stephan L. Seibert, Gudrun Massmann, Rena Meyer, Vincent E.A. Post, and Janek Greskowiak

Dissolved species of terrestrial and marine origins are transformed in Subterranean Estuaries (STEs) before they flow into the coastal oceans. The occurring biogeochemical reactions are highly complex, demanding the application of numerical reactive transport modeling (RTM) approaches to achieve a deeper process understanding. The objective of this study was to quantify the impact of organic matter degradation and secondary mineral reactions on the fate of dissolved species in a generic sandy STE. A comprehensive RTM approach was developed for this purpose, investigating the effects of ion activities, pH, pe, redox reactions, mineral equilibria (goethite, siderite, iron sulfide, hydroxyapatite and vivianite) as well as surface complexation. We found that the STE biogeochemistry was very sensitive to the assumed reaction network. For example, dissolved inorganic carbon and pH were mainly controlled by calcite and siderite dynamics. Dissolved Fe2+ and HS- were precipitated as goethite, siderite and/or iron sulfides, respectively. PO43- concentrations were strongly controlled by the formation of P-bearing minerals, e.g., vivianite and hydroxyapatite, as well as surface complexation. Our work helps to establish the relative importance of some of the major biogeochemical processes in the STE. In a next step, field data from a high-energy STE site on Spiekeroog (‘DynaDeep observatory’) will be used to explore which processes take place in real-world STEs.

How to cite: Seibert, S. L., Massmann, G., Meyer, R., Post, V. E. A., and Greskowiak, J.: Reactive transport modeling to study the impact of mineral reactions and surface complexation on the transport of dissolved species in a subterranean estuary, EGU General Assembly 2024, Vienna, Austria, 14–19 Apr 2024, EGU24-12252, https://doi.org/10.5194/egusphere-egu24-12252, 2024.

EGU24-12630 | ECS | Orals | HS8.1.8

Detailed monitoring and simulation of groundwater salinity in response to extractions in coastal aquifers 

Thijs Hendrikx, Gualbert Oude Essink, and Marc Bierkens

High-resolution three-dimensional variable-density groundwater flow and coupled salt transport models (3D-VD-FT models) are useful instruments to support coastal groundwater management strategies and to project impacts of climate change. However, the ability of 3D-VD-FT models to provide accurate groundwater salinity predictions depends on computational capabilities, availability of sufficient and adequate high-resolution temporal and spatial data and knowledge of groundwater salinity processes in the subsurface. Current understanding in saltwater intrusion research is mainly based on theoretical, experimental and numerical studies, with intensive monitoring field studies being uncommon. In this paper, we describe a methodology that combines a high-resolution 3D-VD-FT model with an intensively monitored pilot in a coastal area in the Netherlands to improve our understanding of fresh-saline groundwater dynamics in response to multi-level groundwater extractions. We assess the applicability of 3D-VD-FT models to reproduce observed groundwater salinity changes in response to extractions. Moreover, we evaluate multiple extraction regimes of fresh and brackish groundwater. Subsequently, critical pumping rates are determined to secure fresh groundwater supply and the preventive effect of brackish groundwater extractions on saltwater intrusion is evaluated. Preliminary results show improvement of predictions on the scale of individual wells compared to previous studies conducted on similar scales. The 3D-VD-FT model captures the observed salinity trends such as downconing fresh groundwater and upconing saline groundwater, both of which occurred in response to withdrawals. However, the model’s absolute accuracy of downconing and upconing groundwater salinity still requires improvement.

How to cite: Hendrikx, T., Oude Essink, G., and Bierkens, M.: Detailed monitoring and simulation of groundwater salinity in response to extractions in coastal aquifers, EGU General Assembly 2024, Vienna, Austria, 14–19 Apr 2024, EGU24-12630, https://doi.org/10.5194/egusphere-egu24-12630, 2024.

Due to their saturated conditions resulting from frequent inundations, coastal floodplains are crucial in sequestering atmospheric carbon and regulating nutrient cycling. Tidal inundations can mobilize dissolved oxygen (DO), a critical driver of biochemical function, towards the subsurface, stimulating microbial activity when DO-rich surface water mixes with anoxic groundwater (i.e., hydrodynamics of surface/groundwater exchange driven by periodic flooding). While our knowledge of these systems has improved over the years, we need a greater understanding of the spatiotemporal variability of essential biochemical drivers within tidal floodplains. Mainly, measuring DO at sufficient temporal resolution in such rapidly changing environments to resolve the relative influence of each factor is challenging, limiting our ability to predict how chronic sea-level rise will impact coastal floodplain functionality and spotlighting the urgency to fill this knowledge gap.

We used a state-of-the-art optical DO probe (Opti O2) to continuously measure subsurface DO concentrations at 5 min resolution over ~4 years at Beaver Creek, a freshwater creek in Washington, USA. Following the removal of a barrier in 2014, the site floods during tidal events with water from Gray’s Harbor, located at the northwestern Pacific coast. This data set is the first measurement in a coastal environment with the requisite temporal resolution to obtain in-situ, subsurface oxygen consumption time series (see attached image). With our data, we investigate the evolution of processes following a controlled sea level rise experiment. Co-located instruments monitoring surface water and groundwater levels, salinity, and meteorological parameters (including rainfall, air temperature, barometric pressure, solar flux density) let us parse the critical drivers of coastal floodplain DO dynamics. To understand how drivers of subsurface biogeochemical processes fluctuate across tidal cycles, we used wavelet analyses to explain the interactions between DO and water levels. We observed multiple oxygenation events (34 clusters of hot moments from June 2019 to date) followed by subsequent returns to anoxia. We used information theory to explore DO’s relationship with the hydro-meteorological data. This work highlights the importance of multi-year, high-frequency in-situ measurements, such as DO, to elucidate the non-linear coupling of climate, hydrology, and biochemistry in coastal floodplains.

How to cite: Ghosh, R., Grande, E., and McIntire, C.: Oxic hot moments in a coastal floodplain highlight the bidirectional flow of surface water-groundwater exchanges at the terrestrial-marine interface, EGU General Assembly 2024, Vienna, Austria, 14–19 Apr 2024, EGU24-14357, https://doi.org/10.5194/egusphere-egu24-14357, 2024.

EGU24-14500 | Orals | HS8.1.8

Chemical and biological information in dissolved organic matter across the land-ocean continuum  

Yan Zheng, Alejandro Palomo, Yunjie Ma, Mark Hopwood, Junjian Wang, Peng Zhang, Hailong Li, Lian Feng, Yi Zheng, and Chuanlun Zhang

Biogeochemical cycling of organic matter across the land-ocean continuum (LOC) is important in driving energy and material exchange between the fresh water and saline water ecosystems, including the direction and magnitude of the uptake of carbon dioxide. The “reactivity” of dissolved organic matter (DOM) can range from highly bioavailable (labile) to hardly bioavailable (recalcitrant). Originated in soil biogeochemistry, “priming” refers to when something (nutrients such as inorganic N and P) is added to soil, it affects the rate of decomposition of the soil organic matter (SOM). This concept has recently been introduced to OM cycling across the LOC, for example, the “recalcitrant” DOM can become more bioavailable in coastal waters affected by high anthropogenic inputs of inorganic N and P. This study examines a set of surface fresh water, groundwater and coastal water samples in Pearl River Delta region to understand how biological information (eDNA, usually known with a short degradation time) may be interpreted in the context of still unclear mechanisms of how fast dissolved organic matter degrades in the environment, which we also characterize at molecular level. Metagenomics analysis of eDNA samples collected from Dapeng Bay, Shenzhen has revealed a high range of diverse antibiotic resistance genes (ARG), as well as over 100 genera of eukaryotes. In this highly anthropogenically affected Bay with elevated inorganic N and P inputs by a local stream, ARGs and human pathogens are abundant in the influent of a waste water treatment plant, though a large number of them were efficiently removed with the combination of a wastewater treatment plant and an engineered wetland. However, some ARGs and human pathogens persisted in fresh water downstream of the WWTP, in sea water collected at the beach and in the bay. It is worth noting that the groundwater collected at the beach exhibited the lowest abundance of ARGs and human pathogens. However, minor traces of sulfonamide (a group of semi persistent antibiotics) resistance genes were detected. This study hopes to shed light on whether the highly labile eDNA can be used as a biomonitoring tool or not across the LOC. This will likely depend on the understanding of how the sources and reactivity of DOM affect eDNA degradation. 

How to cite: Zheng, Y., Palomo, A., Ma, Y., Hopwood, M., Wang, J., Zhang, P., Li, H., Feng, L., Zheng, Y., and Zhang, C.: Chemical and biological information in dissolved organic matter across the land-ocean continuum , EGU General Assembly 2024, Vienna, Austria, 14–19 Apr 2024, EGU24-14500, https://doi.org/10.5194/egusphere-egu24-14500, 2024.

EGU24-15903 | Posters on site | HS8.1.8

Nitrogen pollution sources in coastal groundwater discharge at an urbanized tropical coast 

Nils Moosdorf, Mithra-Christin Hajati, Till Oehler, Kirstin Dähnke, Murugan Ramasamy, Suresh Babu, and Isaac R. Santos

Fresh submarine groundwater discharge (FSGD) can be a substantial source of nitrogen (N) to tropical coastal waters. Fertilizers and sewage are generally regarded as major sources. Here, we resolve coastal nitrogen fluxes and sources in southern Kerala, India. The region has a high coastal population density, seasonally intensive tourism, and an industrialized hinterland agriculture.

Nitrate concentrations in post-monsoon coastal spring discharge was 23.7 mg/l. Nitrate leakage to groundwater from agriculture is limited in warm climates due to high denitrification associated with high temperatures. Using slim models, we estimated leakage from the main fertilized land uses of the hinterland region: Paddy fields (56±13 kg-N/ha), rubber plantations (7±2 kg-N/ha) and home gardens (14±4 kg-N/ha). These loads cannot explain the observed nitrate concentrations in coastal springs. Nitrate stable isotope (d15N and d18O) signatures imply that manure or sewage is the main N source. While the local catchment population was stable during the last decade (ca. 40,000), tourism increased from 16,000 visits in 2005 to 208,000 visits in 2017. Tourism increased ammonium stored in pit latrines by 70 %.

This rapid change seems widespread in India and Southeast Asia. We suggest that urban growth without proper sanitary facilities was the largest coastal nitrate pollution source as reflected at the investigated site, while fertilization effect was marginal due to large atmospheric losses of N.

How to cite: Moosdorf, N., Hajati, M.-C., Oehler, T., Dähnke, K., Ramasamy, M., Babu, S., and Santos, I. R.: Nitrogen pollution sources in coastal groundwater discharge at an urbanized tropical coast, EGU General Assembly 2024, Vienna, Austria, 14–19 Apr 2024, EGU24-15903, https://doi.org/10.5194/egusphere-egu24-15903, 2024.

EGU24-15978 | Posters on site | HS8.1.8

An attempt to calibrate a density-dependent groundwater flow model for a high energy subterranean estuary using particle swarm optimization and integrating salinity-, temperature- and 3H/He age observations  

Janek Greskowiak, Rena Meyer, Jairo Cueto, Nico Skibbe, Anja Reckhardt, Thomas Günther, Stephan Seibert, Kai Schwalfenberg, Dietmar Pommerin, Mike Müller-Petke, and Gudrun Massmann

Subterranean estuaries below high-energy beaches are understudied, despite being potential powerful biogeochemical reactors at the land/sea transition zone affecting the quality of coastal waters. Highly transient hydro(geo)logical boundary conditions and density-effects lead to dynamic subsurface flow and transport patterns which are difficult to understand and hard to replicate by models. A comprehensive and unique 1-year dataset of hydraulic heads, salinity and temperature data in combination with apparent 3H/He ages was obtained at a beach research site on Spiekeroog Island in North Germany. The site includes 3 multilevel groundwater monitoring wells and a vertical electrode chain with 10 temperature sensors, all positioned on a transect aligned along the principal cross-shore flow direction and all reaching down to 24 m depth below ground surface. The data-set was used to set up and calibrate a site-specific groundwater flow and transport model, aiming to approximate the highly dynamic groundwater flow patterns on that transect. The simulation time needed to be 20 years because of the long model spin-up. Due to the complex and nonlinear nature of the system, model calibration was carried out via particle swarm optimization, which is superior to gradient-based optimization techniques with respect to finding a global minimum of the objective function. The calibration results were reasonable. The dynamics of hydraulic head data were well captured, however, simulated values were constantly higher than those observed. The observed salinities were best captured for the multilevel wells near the mean high water and low water line. At the highest multilevel well located at the upper beach right at the dune base, simulations matched observations less well. Similarly, groundwater temperatures and ages were best replicated at the location in the infiltration zone near the high-water line. Groundwater ages and their temporal dynamics at the dune base and mean low water line could only be replicated down to 12 m depth. Deviations between simulations and observations are likely due to 3D flow effects in longshore direction, which could not be captured with the 2D vertical cross-sectional model approach. However, long model run times hindered calibration of a full-blown 3D density-dependent, 20-year long-term groundwater flow and transport model. The next step is to estimating the importance of longshore hydraulic gradients. Finally, the model will be extended for hydrobiogeochemical reactions to assist in the analysis and understanding of the observed hydrochemical data at this site.                    

How to cite: Greskowiak, J., Meyer, R., Cueto, J., Skibbe, N., Reckhardt, A., Günther, T., Seibert, S., Schwalfenberg, K., Pommerin, D., Müller-Petke, M., and Massmann, G.: An attempt to calibrate a density-dependent groundwater flow model for a high energy subterranean estuary using particle swarm optimization and integrating salinity-, temperature- and 3H/He age observations , EGU General Assembly 2024, Vienna, Austria, 14–19 Apr 2024, EGU24-15978, https://doi.org/10.5194/egusphere-egu24-15978, 2024.

EGU24-16758 | Orals | HS8.1.8

The dynamic deep subsurface of high-energy beaches  

Gudrun Massmann and the DynaDeep Project Team

Coastal aquifers are dynamic, shaped by natural and anthropogenic boundary conditions acting on very different time scales from seconds (waves) up to millennia (sea-level rise). In subterranean estuaries (STEs), inland aquifers connect with the sea. With terrestrial freshwater and circulating seawater, chemically different waters mix in STEs and are modified before they discharge into coastal waters. The cooperative interdisciplinary project DynaDeep studies the subsurface of high-energy beaches, which have so far hardly been investigated due to the difficulties associated with working under high-energy conditions. We propose that these systems are particularly dynamic environments, where frequent sediment relocation affects groundwater flow and transport up to depths of tens of meters below the ground surface. This may lead to strong spatiotemporal variability of geochemical conditions, presumably attracting a unique microbial community. The state-of-the-art concept of groundwater flow and transport in STEs with an upper saline plume overtopping a freshwater discharge tube is likely distorted under such conditions, with consequences for the biogeochemical functioning of these STEs. Within DynaDeep, a unique cross-shore research site was established on the northern beach of the barrier island Spiekeroog facing the North Sea. It consists of permanent infrastructure, such as a pole with measuring devices, multi-level groundwater wells and an electrode chain. This forms the base for autonomous measurements, regular repeated sampling and interdisciplinary field campaigns using, for example, direct push techniques supported by modelling and experimental work to understand and quantify the functioning of the biogeochemical reactor. Field results show that morpho- and hydrodynamics are clearly affected by waves, tides and stormfloods. Stormfloods are particularly relevant and can be traced into the subsurface. In the infiltration zone, the groundwater is rather young as shown by age dating and temperature tracing. Oxygen and nirtrate reach deep into the subsurface and a redox transition from oxic to anoxic conditions occurs at 12-15 m depth. In contrast, relatively old and anoxic water discharges near the low water line. Numerical modelling aids in process understanding and hypothesis development, and generic models show that moderate deviations in hydrogeological parameters severely change both salinity as well as hydrogeochemical patterns. The dynamic nature of high-energy STEs, depending on frequencies and amplitudes of change in environmental conditions, as well as the global relevance for high-energy STEs have yet to be explored.

How to cite: Massmann, G. and the DynaDeep Project Team: The dynamic deep subsurface of high-energy beaches , EGU General Assembly 2024, Vienna, Austria, 14–19 Apr 2024, EGU24-16758, https://doi.org/10.5194/egusphere-egu24-16758, 2024.

EGU24-18920 | ECS | Posters on site | HS8.1.8

Tracking biogeochemical processes in a Subterranean Estuary (STE): Application of a multidisciplinary approach integrating isotopes, hydrogeochemistry, and dissolved organic matter (DOM)  

Bella Almillategui, Valenti Rodellas Vila, Maarten W. Saaltink, Jesus Carrera, and Albert Folch

Subterranean Estuaries (STEs) have been recognized for their role in the transport and fate of chemical compounds that discharge to the coastal ocean. The enrichment of coastal groundwater with nutrients is affected by different sources and mechanisms. Moreover, the distribution of these substances discharging to the sea is highly affected by the reactions produced at the mixing zone between the fresh and saline groundwater. In this research, we aim to identify the nutrient sources and biogeochemical processes that are actively playing a role in the subterranean estuary located in the alluvial aquifer of Argentona, in the northeast of Barcelona, Catalonia (Spain).

Coastal groundwater in the area has been continuously explored since 2014 with the development of a unique experimental site. The site is 100m long inland from the coastline and 30m wide. It is being monitored with 25 piezometers consisting of 5 nests with 4 piezometers each (with intervals at 10m, 20m, 15m, and 25m) and 4 individual piezometers, equipped with different sensors that collect data every 15 minutes.

This study integrates various approaches such as the N-isotopes (δ15N-NO3-, δ18O-NO3-, δ15N-NH4+), hydrogeochemistry, dissolved organic matter (DOM), and bacteria concentration that has been measured in all piezometers during two sampling campaigns (winter and summer). The results show potential sources of ammonium and nitrate and the biogeochemical transformations that have a main role in the subterranean estuary dynamic.

Acknowledgments

This work was funded by the Spanish Government under the project MUCHOGUSTO (grant no. PID2022-140862OB-C21/C22) and the SENACYT – BID Scholarship by the Panamanian Government.

How to cite: Almillategui, B., Rodellas Vila, V., Saaltink, M. W., Carrera, J., and Folch, A.: Tracking biogeochemical processes in a Subterranean Estuary (STE): Application of a multidisciplinary approach integrating isotopes, hydrogeochemistry, and dissolved organic matter (DOM) , EGU General Assembly 2024, Vienna, Austria, 14–19 Apr 2024, EGU24-18920, https://doi.org/10.5194/egusphere-egu24-18920, 2024.

EGU24-18971 | ECS | Orals | HS8.1.8

Investigating spatio-temporal salinity dynamics in coastal aquifers 

Nico Skibbe, Thomas Günther, Kai Schwalfenberg, Rena Meyer, Anja Reckhardt, Janek Greskowiak, Gudrun Massmann, and Mike Müller-Petke

Coastal aquifers build the transition zone of freshwater and saltwater. Hence, large salinity gradients are encountered in the subsurface below beaches and it is important to assess the salinity in a high resolution in order to understand coastal groundwater flow dynamics and consequently geochemical and microbial processes in subterranean estuaries. Within the project DynaDeep, we used both geophysical and hydrogeological methods to determine the bulk and fluid electrical conductivities (bulk/fluid EC) with the aim to convert the EC to salinity to monitor its temporal and spatial changes. This was done at a high-energy beach on the North Sea Island of Spiekeroog.

Numerous EC techniques have been used to acquire a unique dataset since 2022, covering a 2D transect from the dune base to the low water line. The site was subject to strong topographic changes over the seasons. Among the methods applied, we used electrical resistivity tomography (ERT) to get access to 2D distributions every six weeks. Additionally, continuous monitoring was carried out using a saltwater monitoring system (SAMOS) with a vertical electrode chain down to a depth of 20 meters located at the high water line. Direct push (DP) data at various locations as well as fluid EC values from water samples gathered via DP give access to high resolution information. In three multilevel wells (four levels each at 6, 12, 18, and 24 meter depth below ground) we logged the fluid EC and temperature and took water samples on a regular basis.

For an especially dense dataset between January and March 2023 we compared in detail the applied EC methods and found a general agreement in all of the gathered data after suitable calibration and temperature correction. We furthermore derived a formation factor model for the conversion to salinity.

Finally, we a combined inversion of the ERT data with the additional data aiming for fluid EC directly under the assumption of this temporally fixed formation factor model. In contrast to standard inversion techniques, this allowed for a naturally occurring smooth transition of salinities over the different geological units, which was critical when analyzing the spatial and temporal changes.

How to cite: Skibbe, N., Günther, T., Schwalfenberg, K., Meyer, R., Reckhardt, A., Greskowiak, J., Massmann, G., and Müller-Petke, M.: Investigating spatio-temporal salinity dynamics in coastal aquifers, EGU General Assembly 2024, Vienna, Austria, 14–19 Apr 2024, EGU24-18971, https://doi.org/10.5194/egusphere-egu24-18971, 2024.

EGU24-19567 | ECS | Orals | HS8.1.8

Exploring temporal and spatial dynamics of fresh submarine groundwater discharge: amphibious electrical resistivity tomography in the land-ocean transition zone 

Jose Tur Piedra, Marc Diego-Feliu, Juanjo Ledo, Pilar Queralt, Alex Marcuello, Valentí Rodellas, and Albert Folch

Submarine groundwater discharge (SGD) is a complex hydrological process influenced by multiple mechanisms with various spatiotemporal scales. Quantifying SGD is complex because it depends on various driving forces (e.g., waves, tides, hydraulic gradient) and on the underlying geological context that modulate the occurrence and magnitude of SGD. This poses challenges to the accurate quantification of SGD, especially in heterogeneous nearshore environments. However, there is still limited understanding on SGD spatiotemporal patters hindering the accurate assessment of SGD implications for the coastal ocean.
The aim of this study is to use amphibious electrical resistivity tomography (AERT), which combines terrestrial and marine instruments, to assess spatiotemporal patterns of FSGD (Fresh Submarine Groundwater Discharge) in the land-sea interface. This cost-effective method enables prospecting SGD dynamics at the land-sea transition zone based on the resistivity variations in the subsurface induced by salinity changes. The resistivity study was conducted regularly to assess hourly spatiotemporal variations in two aquifers near Barcelona, Spain, with different geological contexts, including detrital and karst formations. The resistivity data in both study sites have been validated with in situ pore water sampling for physicochemical parameters, with a good agreement between resistivity and subsurface salinity. The time-lapse results indicate that even in micro-tidal environments such as the Mediterranean Sea, SGD patterns are highly dynamic, with the karst environment exhibiting a more significant proportion of freshwater in the marine sediments and faster changes than the alluvial context. This methodology proves effective for the spatial and temporal assessment of FSGD. These findings offer a valuable approach for monitoring subsurface salinity changes in coastal aquifers and enhance our understanding of small-scale and short-term SGD variations, which is fundamental to deriving reliable SGD and nutrient flux estimates. 

How to cite: Tur Piedra, J., Diego-Feliu, M., Ledo, J., Queralt, P., Marcuello, A., Rodellas, V., and Folch, A.: Exploring temporal and spatial dynamics of fresh submarine groundwater discharge: amphibious electrical resistivity tomography in the land-ocean transition zone, EGU General Assembly 2024, Vienna, Austria, 14–19 Apr 2024, EGU24-19567, https://doi.org/10.5194/egusphere-egu24-19567, 2024.

EGU24-19992 | Orals | HS8.1.8

Assessing freshwater plumes, offshore freshened groundwater and the risk of salt intrusions in urbanised karstic groundwater systems using combined resistivity methods  

Jasper Hoffmann, Ercan Erkul, Irfan Yolcubal, Amir Haroon, Pritam Yogeshwar, Simon Fischer, Elif Sen, Wolfgang Rabbel, Ahmet Sener, Jens Schneider von Deimling, Bülent Tezkan, Ertan Peksen, Aaron Micallef, Elnur Gasimov, Ismail Kaplanvural, Felix Gross, Lasse Sander, and Serif Baris

Groundwater acts as a critical link between onshore and offshore environments, connecting freshwater systems to saline oceans.  With 40% of the world's population residing along coastlines, understanding coastal groundwater reserves is paramount. One open question involves the vital role of submarine groundwater springs in global hydrology, and how the distribution and groundwater flux can be better constrained across the coastline to better predict both groundwater discharge into the ocean and saltwater inflow into coastal aquifers. Especially urban areas pose unique challenges where water demand is high and groundwater exploration problematic since geophysical remote sensing techniques often interfere with surface and subsurface constructions (e.g. cables, pipelines etc.), making innovative approaches for groundwater exploration crucial for sustainable groundwater management.

In this study, we aim to address the complex dynamics of coastal karstic groundwater systems in urban regions, where meteoric waters discharge into the ocean through coastal and submarine freshwater springs, while concurrently facing the risk of saltwater intrusions. Our investigations in the bay of Antalya (Turkey) aim to provide a comprehensive understanding of the land-ocean transition zone in the karstic groundwater systems and provide new tools for future groundwater monitoring in coastal regions.

We employ advanced hydroacoustic and resistivity methods, combining onshore and offshore electrical resistivity tomography with electromagnetic measurements to bridge the gap between onshore and offshore domains. This integration of geophysical datasets enables us to (1) delineate karstic groundwater flow pathways from land to ocean, (2) identify coastal and submarine freshwater springs, and (3) assess the risk of saltwater intrusions along the coastline.

The study showcases the potential of offshore geoelectric measurements as a tool for groundwater investigations in urbanized coastal regions. The proposed approach will facilitate exploration efforts for groundwater in urbanised karstic areas, but much more importantly will facilitate monitoring strategies to avoid intrusions of saltwater into freshwater aquifers. Our findings contribute valuable insights for water management strategies in Antalya, with implications for safeguarding todays and future freshwater resources.  

How to cite: Hoffmann, J., Erkul, E., Yolcubal, I., Haroon, A., Yogeshwar, P., Fischer, S., Sen, E., Rabbel, W., Sener, A., Schneider von Deimling, J., Tezkan, B., Peksen, E., Micallef, A., Gasimov, E., Kaplanvural, I., Gross, F., Sander, L., and Baris, S.: Assessing freshwater plumes, offshore freshened groundwater and the risk of salt intrusions in urbanised karstic groundwater systems using combined resistivity methods , EGU General Assembly 2024, Vienna, Austria, 14–19 Apr 2024, EGU24-19992, https://doi.org/10.5194/egusphere-egu24-19992, 2024.

EGU24-20033 | ECS | Orals | HS8.1.8

Submarine groundwater discharges in the Creus Cape (NW Mediterranean): new data for an hydrodynamical and biochemical sea model 

Eva Flo, Savitri Galiana, Joaquim Ballabrera, Elisa Berdalet, Kaori Otsu, Lluís Pesquer, and Xavi Garcia

Eutrophication is a process driven by enrichment of water by nutrients, especially compounds of nitrogen and phosphorus, leading to: increased primary production, changes in the balance of organisms, and water quality degradation. It occurs naturally; however, human activities have accelerated its rate and extent through both point-source discharges and non-point loadings of limiting nutrients into aquatic ecosystems. Since the beginning of the XXIst century, concern regarding eutrophication led to the adoption of policies aimed at combating eutrophication, such as the Water Framework Directive and the Marine Strategy Framework Directive. To implement these policies and achieve their goals, the proper comprehension of aquatic ecosystems structure and dynamics and the exchanges occurring among them are essential; in other words, to provide an integrated vision of the hydrosphere is key.

Under the umbrella of the AquaINFRA project (https://aquainfra.eu/), we are developing a new set of hydrodynamical and biogeochemical simulations of our case study, the Catalan coast (NW Mediterranean), to assess the risks and hazards to its coastal ecosystems. A regional circulation model (BFMcoupler; see Galiana, S. et al. at Session OS2.1) that takes into account continental inputs from both point and non-point source discharges is used, including from riverine to submarine groundwater discharges (SGD).

This work aims to focus on the relevance of SGD and their seasonal pattern in the north of the Creus Cape, the northernmost part of the Catalan coast.

The coastline of this zone is characterized by Mediterranean dry fields, fragmented  forests, few small urban areas and small catchment zones of temporal streams. It shows a 591 mm mean annual precipitation and 14.8 ºC mean annual air temperature. Data, collected from 2011 to 2016 (following Directives requirements) in five sampling stations located at 1m from the coast, reveal lower mean salinity (36.24) and higher mean nitrate (8.63 µM) and silicate (8.10 µM) concentrations compared with zones of similar characteristics, such as the Montgrí coast located further south (three sampling stations; 37.61; 3.18 µM; 2.23 µM), which indicate the presence of SDG. However, their mean chlorophyll-a concentrations are similar, 1.06 and 1.11 µg/l, which implies that primary production is not enhanced by nutrients. The seasonal pattern of this zone is similar to that observed at open and surface Mediterranean waters, except for the decrease in salinity and the increase in nitrate during autumn and winter, typically rain and wet periods, respectively. Therefore and according to Garcia-Solsona, E., et al. (2010), SDG are significant in coastal waters of the Mediterranean Sea, where their influence is more prominent in coastal zones without the influences of urban areas or rivers.

Currently, these SDG data are being included in the hydrodynamical and biochemical model of the AquaINFRA project for a better understanding of the eutrophication process in coastal waters. Thereby, they will provide information for the European Directives and, thus, improve the integrated management of aquatic ecosystems under the ecosystem approach.

------------------------------------

(This project has received funding from the European Commission’s Horizon Europe Research and Innovation programme under grant agreement No 101094434)

How to cite: Flo, E., Galiana, S., Ballabrera, J., Berdalet, E., Otsu, K., Pesquer, L., and Garcia, X.: Submarine groundwater discharges in the Creus Cape (NW Mediterranean): new data for an hydrodynamical and biochemical sea model, EGU General Assembly 2024, Vienna, Austria, 14–19 Apr 2024, EGU24-20033, https://doi.org/10.5194/egusphere-egu24-20033, 2024.

EGU24-20144 | ECS | Orals | HS8.1.8

The origins and fate of dissolved organic carbon in a density-stratified carbonate aquifer on a tropical coastal landscape 

David Brankovits, John Pohlman, Alejandro Martínez García, and Fernando Alvarez

Flooded caves within carbonate coastlines serve as important conduits for carbon transport and transformation prior to groundwater expulsion into the sea. To investigate the sources, magnitude and biogeochemical reactions regulating carbon sources within an unconfined coastal aquifer, we analyzed the concentrations and δ13C values of dissolved organic carbon (DOC) and dissolved inorganic carbon (DIC) at four sites along a flow path, a 6-km shoreline-perpendicular transect of flooded coastal caves in the northeastern Yucatan Peninsula, Mexico. The study revealed significantly higher DOC concentrations after regional rainfall compared to a mid-summer drought, suggesting precipitation as a key driver of the downward DOC flux from the surface. The decomposition of organic matter in the saturated soils of mangroves and tropical forest is the source of high DOC (on average, 678 µM; δ13C-DOC = −28‰) in the shallow fresh groundwater. The regional seaward tendency of DOC in the upper aquifer to become more 13C-enriched is primarily driven by increased mixing near the coast with saline groundwater, which is lower in concentration (70 µM, on average) and more 13C-depleted (δ13C-DOC = −26‰) than the seawater DOC (158 µM; −19‰). Evidence for net DOC consumption, along with positive and negative changes in δ13C-DOC values, is consistent with microbe-mediated transformation of organic matter primarily occurring in the upper aquifer’s low salinity waters. Diminishing DOC, coinciding with 4- to 5-fold increase in DIC concentrations while δ13C-DIC becomes more positive, implies that organic matter diagenesis also enhances carbonate dissolution. These landscape-level observations reveal hydrologic and biogeochemical factors that regulate the internal functioning of a coastal aquifer ecosystem and influence the quality and quantity of carbon exported to the coastal sea, where the Mesoamerican Barrier Reef resides.

How to cite: Brankovits, D., Pohlman, J., Martínez García, A., and Alvarez, F.: The origins and fate of dissolved organic carbon in a density-stratified carbonate aquifer on a tropical coastal landscape, EGU General Assembly 2024, Vienna, Austria, 14–19 Apr 2024, EGU24-20144, https://doi.org/10.5194/egusphere-egu24-20144, 2024.

EGU24-20298 | Orals | HS8.1.8

Mapping saltwater intrusion via Electromagnetic Induction (EMI) for planning a Managed Aquifer Recharge (MAR) facility in Maltese Island 

Lorenzo De Carlo, Antonietta Celeste Turturro, Maria Clementina Caputo, Manuel Sapiano, Julian Alexander Mamo, Oriana Balzan, Luke Galea, and Michael Schembri

In coastal areas, saltwater intrusion causes a depletion of the resource by reducing potable and irrigation freshwater supplies and causing severe deterioration of groundwater quality.This trend is observed in Pwales Valley – Maltese Island, where the water resource management plays a crucial role for the environmental sustainability of the area, given the importance of intensive agricultural activity along this valley. In order to tackle such phenomenon, actions or adaptation measures against climate change are strongly required.  For example, Managed Aquifer Recharge (MAR) is an increasingly important water management strategy to maintain, enhance and secure stressed groundwater systems and to protect and improve water quality.For accurately plan a MAR facility, it is crucial to define a hydrogeological model of the studied area, with the use of traditional hydrogeological measurements and innovative unconventional techniques. In recent years, Electromagnetic Induction (EMI) measurements, based on subsurface electrical conductivity data, have been increasingly used for investigating the saltwater intrusion dynamics due to their high sensitivity to the salinity.In the study area of Pwales Valley, a MAR scheme is being planned and, for this aim, a hydrogeological model has been developed through an EMI survey.More than 20,000 apparent electrical conductivity (ECa) data were collected to generate a quasi 3D high-resolution model of electrical conductivity of the Pwales Valley. The results highlighted the spatial extension of the tongue-shape salt water intrusion from east to west along the valley, as well as some geological-hydrogeological peculiarities such as the thickness of the salt wedge and the irregular top surface of the bottom impermeable layer, otherwise undetectable with other techniques. This approach confirms to be a useful tool for an effective hydrogeological characterization, essential for planning mitigation and tackle climate changes actions or adaptation measures, such as a MAR plant.

How to cite: De Carlo, L., Turturro, A. C., Caputo, M. C., Sapiano, M., Mamo, J. A., Balzan, O., Galea, L., and Schembri, M.: Mapping saltwater intrusion via Electromagnetic Induction (EMI) for planning a Managed Aquifer Recharge (MAR) facility in Maltese Island, EGU General Assembly 2024, Vienna, Austria, 14–19 Apr 2024, EGU24-20298, https://doi.org/10.5194/egusphere-egu24-20298, 2024.

EGU24-20333 | Orals | HS8.1.8

Logging of self-potential gradients to track saline intrusion in chalk, gravel and sand aquifers around the United Kingdom 

Tom Rowan, Adrian Butler, Raymond Flynn, Gerard Hamill, Shane Donohue, and Matthew Jackson

Coastal aquifers, a vital drinking water (and agricultural) resource for over a billion people, are facing increasing risks of seawater contamination due to the dual challenges of population growth and climate-induced sea-level rise. With water stress expected to intensify and water use consumption growing annually, there is an urgent need for innovative methods to track saline intrusion in these aquifers.  Current monitoring techniques like observational boreholes are limited in their warning capabilities, while resistivity imaging, despite its effectiveness, is prohibitively expensive and logistically challenging, (MacAllister et al. 2016).

Self-Potential (SP), naturally occurring voltages arising from ion separation in the subsurface, is a promising geophysical technique to identify and manage saline intrusion, provided its source mechanisms are well understood. There are two key sources of SP in hydrology. Electro-kinetic potentials (VEK), due to fluid flow induced by pressure gradients, and exclusion-diffusion potentials (VED), due to ion concentration gradients in the subsurface. The balance of these effects depends on a variety of variables including the physical and chemical properties of geological material in which the saline-fresh water interface is located. Spatial and temporal changes in these potentials provide  insight into the location and behaviour of the saline-fresh interface.

This study introduces a novel SP profiling approach that employs both fixed and movable electrodes within a borehole, greatly enhancing the data acquired from SP measurements. Observations across various UK locations have revealed SP profiles exceeding 50mV. Coastal aquifers including those of Chalk, Gravel and Sand have been investigated. This talk presents not only gathered results but also details insights in the practical assessment of these gradients. Notably, these SP gradients are dynamic, with changes seemingly connected to the movements and proximity of the saline interface. The findings are corroborated by laboratory experiments and numerical models, showing that the dynamics of SP gradients can serve as an early indicator of saline intrusion in coastal aquifers.


Bibliography

MacAllister, DJ., Jackson, M. D., Butler, A. P., and Vinogradov, J. (2016), Tidal influence on self‐potential measurements, J. Geophys. Res. Solid Earth, 121, 8432– 8452

How to cite: Rowan, T., Butler, A., Flynn, R., Hamill, G., Donohue, S., and Jackson, M.: Logging of self-potential gradients to track saline intrusion in chalk, gravel and sand aquifers around the United Kingdom, EGU General Assembly 2024, Vienna, Austria, 14–19 Apr 2024, EGU24-20333, https://doi.org/10.5194/egusphere-egu24-20333, 2024.

HS8.2 – Subsurface hydrology – Groundwater

EGU24-231 | ECS | Orals | HS8.2.1 | Highlight

Discovery of Resilience of Large and Complex Aquifers to Climatic Extremes under Anthropogenic Influences 

Ishita Bhatnagar, Mehdi Rahmati, Harrie-jan Hendrick Franssen, Chandrika Thulaseedharan Dhanya, and Bhagu Ram Chahar

In the face of intensified climatic extremes and global aquifer stress, a subtle understanding of the complex dynamics of large aquifer systems is necessary. This study delves into the impact of changing climate and anthropogenic activities on hydro-geologically diverse regions crucial for sustaining agricultural activities. Our central hypothesis is that excessive anthropogenic activities may disrupt the connection between groundwater levels and their primary recharge source—precipitation. Leveraging advanced non-linear signal processing technique of cross-wavelet transform, we explore non-linear relationships between groundwater and precipitation. Our findings underscore the complexity of interactions between surface and sub-surface processes in the sub-tropical basins.  A crucial threshold emerges at the basin scale, as the disconnection occurs when the water table falls below 4-5 meters. Intriguingly, at the basin and subbasin scale, the connection between groundwater and precipitation has significantly weakened and broken post the drought year 2002, emphasizing the localized and enduring impact of pumping activities. The recovery from these extremes, vital for sustaining agriculture, is intricately linked to the intensity of anthropogenic activities. This research contributes valuable insights into how the groundwater response to precipitation is changing with time in highly developed large subtropical aquifers facing increasing frequency of droughts. The results will aid in formulating region-specific groundwater management strategies to enhance the resilience of groundwater resources to global warming and climate change.

How to cite: Bhatnagar, I., Rahmati, M., Hendrick Franssen, H., Dhanya, C. T., and Chahar, B. R.: Discovery of Resilience of Large and Complex Aquifers to Climatic Extremes under Anthropogenic Influences, EGU General Assembly 2024, Vienna, Austria, 14–19 Apr 2024, EGU24-231, https://doi.org/10.5194/egusphere-egu24-231, 2024.

Rapid urbanization, fast population growth, agricultural and economic development increase the over-drafting of groundwater resources worldwide, which leads to induced land subsidence results in infrastructure damage and loss of the aquifer's storage capacity (Famiglietti et al., 2015; Galloway and Burbey, 2011). In the North Indian region, the GRACE satellite has observed a total water storage loss of about 19.2 Gt yr-1 (Rodell et al. 2018). Thus, this research is focused on two study areas, Chandigarh and SAS Nagar regions in North India, to analyze the compaction of aquifer systems and groundwater dynamics. We implement the Multi-Temporal Interferometric Synthetic Aperture Radar (MT-InSAR) technique exploring ascending (175 imageries) and descending (170 imageries) passes of Sentienl-1 SAR sensor data of the European Space Agency (ESA) over the study area from 2016 to 2022. The InSAR processing was done for each data stack using an open-source GMTSAR software following a Small BAseline Subset (SBAS) method to generate line-of-sight (LOS) deformation maps (Berardino et al., 2002; Sandwell et al., 2011). The ascending and descending LOS results were further combined, generating vertical land motion (VLM) following Fuhrmann & Garthwaite (2019) approach. We explored and analyzed 12 groundwater head-level data over the study area and integrated with InSAR-derived VLM in a hydro-geophysical model to examine various mechanical characteristics of the aquifer systems (Ojha et al., 2018). Such properties include elastic and inelastic storage coefficients, the aquifer's capacity loss, permanent and seasonal storage loss, etc. The result exhibits a deformation signal of 18 cm/year in Mohali, 16 cm/year in Kharar, 17 cm/year in Dera Bassi, 12 cm/year in Lalru region of SAS Nagar districts, and  8 cm/year of land subsidence in southeast parts of Chandigarh region. We noticed a GW storage loss capacity of about 1.15% of the total aquifer system during the study periods, which occurs due to the inelastic compaction of the aquifer, and the total volume of GW storage loss is about 3 km3. The InSAR-integrated GW observations will provide precise information on understanding groundwater storage change, a necessary precondition for effective water management strategy over such stressed aquifer systems.

References

Berardino, P., G. Fornaro, R. Lanari, and E. Sansosti. 2002. "A New Algorithm for Surface Deformation Monitoring Based on Small Baseline Differential SAR Interferograms." IEEE Transactions on Geoscience and Remote Sensing 40 (11): 2375–83. https://doi.org/10.1109/TGRS.2002.803792.

Famiglietti, J. S., A. Cazenave, A. Eicker, J. T. Reager, M. Rodell, and I. Velicogna. 2015. "Satellites Provide the Big Picture." Science 349 (6249): 684–85. https://doi.org/10.1126/science.aac9238.

Fuhrmann, Thomas, and Matthew C. Garthwaite. 2019. "Resolving Three-Dimensional Surface Motion with InSAR: Constraints from Multi-Geometry Data Fusion." Remote Sensing 11 (3): 241. https://doi.org/10.3390/rs11030241.

Galloway, Devin L, and Thomas J Burbey. 2011. "Regional Land Subsidence Accompanying Groundwater Extraction." Hydrogeology Journal 19 (8): 1459.

Ojha, Chandrakanta, Manoochehr Shirzaei, Susanna Werth, Donald F. Argus, and Tom G. Farr. 2018. "Sustained Groundwater Loss in California's Central Valley Exacerbated by Intense Drought Periods." Water Resources Research 54 (7): 4449–60. https://doi.org/10.1029/2017WR022250.

Sandwell, David, Rob Mellors, Xiaopeng Tong, Matt Wei, and Paul Wessel. 2011. "GMTSAR: An InSAR Processing System Based on Generic Mapping Tools," May. https://escholarship.org/uc/item/8zq2c02m.

How to cite: Chawla, S. and Ojha, C.: Groundwater Dynamics and Aquifer Mechanical Properties over North Indian Region using MT-InSAR technique , EGU General Assembly 2024, Vienna, Austria, 14–19 Apr 2024, EGU24-501, https://doi.org/10.5194/egusphere-egu24-501, 2024.

EGU24-866 | ECS | Posters on site | HS8.2.1 | Highlight

Assessment of groundwater resources resilience to future climate change impacts using a high-resolution aquifer model: the case of the Emilia-Romagna region in Italy 

Ilaria Delfini, Andrea Chahoud, Daniel Zamrsky, and Alberto Montanari

Aquifer depletion and over-exploitation of groundwater through increased pumping are well known global challenges. The impacts of these groundwater withdrawal on aquifer storage and groundwater recharge need to be carefully studied to assess their effect on groundwater conditions in regions where extensive groundwater withdrawals occur. The Emilia-Romagna region in Italy is an excellent case of a highly monitored aquifer system playing an essential role for water supply for civil, agricultural, and industrial use. A large agricultural plain is located in this area, and its subsurface consists of multiple aquifers at different depths in fluvial sediment deposits of several hundred meters thickness in total, underlaid by marine sediment deposits. Large amount of detailed information on aquifer characteristics, water withdrawals, and water table levels is available and enables the calibration of a high-resolution dynamic three-dimensional groundwater model. The MODFLOW 6 numerical code is used in our study to build the aforementioned groundwater model. This model is based on a previous application of MODFLOW to the whole Emilia-Romagna area by the Regional Agency for Environmental Protection (ARPAE), and extends over a wide area east of the Secchia River. Our MODFLOW 6 groundwater model provides satisfactory performances, based on validation with piezometric levels over a time span of 17 years.

Banking on the above detailed groundwater model results and performance, we analyse aquifer resilience to climate change and groundwater withdrawals, by running simulations with assigned perturbations of the current input data. We also analyse the future state of groundwater levels according to predictions provided by global climate models. The aim is to get an insight of the combined effects of changes in natural and artificial stresses on groundwater levels in the Emilia-Romagna region. This, in turn, would provide a guideline for sustainable aquifer management under different climatic conditions improve the resilience of regional aquifers.

How to cite: Delfini, I., Chahoud, A., Zamrsky, D., and Montanari, A.: Assessment of groundwater resources resilience to future climate change impacts using a high-resolution aquifer model: the case of the Emilia-Romagna region in Italy, EGU General Assembly 2024, Vienna, Austria, 14–19 Apr 2024, EGU24-866, https://doi.org/10.5194/egusphere-egu24-866, 2024.

EGU24-1082 | ECS | Posters on site | HS8.2.1 | Highlight

Situation and stresses: a spatial analysis of near-surface drinking water resources in Germany  

Kathrin Szillat, Kerstin Stahl, Jost Hellwig, and Max Schmit

Decreasing groundwater recharge and competing water uses challenge drinking water supplies worldwide and noticeably in Germany as well. Groundwater is a significant source of drinking water, making it essential to maintain its quality and quantity. In Germany, about 74% of drinking water originates from groundwater. However, various stress factors significantly affect the quality and quantity of the groundwater resource. The combined effects of climate change and diverse physical and social factors pose a central challenge for current and future drinking water supply. To address this challenge, a good understanding of the varieties of situations needs to support tools and decision-making frameworks to manage groundwater sustainably and ensure resilient drinking water. This study conducts a nationwide spatial analysis of various influencing factors. It focuses primarily on drinking water protection areas used for agriculture, examining their natural and hydro-climatic characteristics and changes, and the nitrate pollution they experience due to agricultural activities. Currently, Germany has around 11270 designated drinking water protection areas, of which 84 % are used for agriculture. We create a unique dataset for them. This spatial dataset quantifies numerous potential characteristics and stress factors for each of the (n) drinking water protection areas. These factors include groundwater recharge rates, drought response times, agricultural usage, nitrate pollution, aquifer type, and more. Applying clustering methods to the n x m matrix data helps to identify typical situations for drinking water supply. By considering three dimensions—drinking water extraction/hydrogeology, nitrate pollution, and drought vulnerability we aim to characterize and depict diverse situations across Germany while determining broader trends. Achieving sustainable drinking water management requires a systematic analysis of the heterogeneous natural, political-regulatory, and agro-economic conditions to identify transferable success factors. Building on this study with model developments in the "LURCH-StressRes" project, we later aim to develop transferable stress tests for the identified typical situations across Germany to inform adaptation and best practices for achieving sustainable nationwide drinking water management.

How to cite: Szillat, K., Stahl, K., Hellwig, J., and Schmit, M.: Situation and stresses: a spatial analysis of near-surface drinking water resources in Germany , EGU General Assembly 2024, Vienna, Austria, 14–19 Apr 2024, EGU24-1082, https://doi.org/10.5194/egusphere-egu24-1082, 2024.

EGU24-1441 | ECS | Posters on site | HS8.2.1

Exploring the potential of horizontal wells for Aquifer Storage and Recovery 

Simon Kreipl, Boris M. van Breukelen, and Mark Bakker

Aquifer Storage and Recovery (ASR) is a groundwater management technology in which freshwater is infiltrated into the subsurface during periods of abundance and later extracted for use in periods of scarcity. An example application is balancing water supply and demand for agriculture in regions with strong seasonal fluctuations in precipitation or evaporation. Horizontal directionally drilled wells offer advantages over conventional vertical wells. They are suitable in thin aquifers and the drawdown during pumping is spatially distributed and therefore less pronounced. Well fields consisting of multiple vertical wells can be replaced by a single horizontal well, thereby reducing the required above-ground infrastructure. Furthermore, it is expected that horizontal wells are favorable in saline conditions, where the buoyancy effect and dispersion deform the injected freshwater bubble. Such deformations commonly reduce the recovery efficiency, which is the percentage of injected freshwater that can be recovered. There is currently a lack of knowledge on the behavior of a freshwater bubble in a saline aquifer during a horizontal well ASR cycle. An ASR cycle consists of an injection period, a storage period, and a recovery period.

In this investigation, the application of horizontal well ASR is investigated by means of density-dependent, numerical groundwater modeling with SEAWAT. A horizontal well is compared to a system of multiple vertical wells arranged in a line. The concept of Multiple Partially Penetrating Wells is adopted for the vertical wells. The two systems are compared for a variation of hydrogeological conditions and design choices. The investigated hydrogeological conditions include hydraulic conductivity, dispersivity, aquifer thickness, and groundwater salinity. The investigated design choices include pumping rate and well depth in the aquifer. The systems are evaluated based on the recovery efficiency and the maximum pressure induced by pumping. It is demonstrated under what conditions a horizontal well has distinct advantages over a row of vertical wells.

How to cite: Kreipl, S., van Breukelen, B. M., and Bakker, M.: Exploring the potential of horizontal wells for Aquifer Storage and Recovery, EGU General Assembly 2024, Vienna, Austria, 14–19 Apr 2024, EGU24-1441, https://doi.org/10.5194/egusphere-egu24-1441, 2024.

EGU24-1480 | Posters on site | HS8.2.1

Analysis of the spatial distribution of surface and groundwater abstractions in the territory of Slovakia in the last decade 

Katarina Kotrikova, Lubica Lovasova, Michaela Kurejova Stojkovova, and Valeria Slivova

In recent years, we have been observing the increasingly frequent impacts of climate change, we are observing a growing number of occurrences of extreme weather events also in Slovakia. Long periods of warm weather without precipitation causing drought are followed by local high-intensity storms that cause extreme flood events. In connection with the solution to the problem of drought monitoring and the setting of drought warnings, documents are analyzed and prepared, which include the water resource balance of Slovakia (one of the basic background materials for water management planning). The water resource balance is based on an assessment of the relationships between water demands and water resources in the past year and assesses when and where water demands are not sufficiently covered.

The results of the analysis also include a map image of surface and groundwater abstractions in the territory of Slovakia. The analysis is processed for total and individual abstractions of surface and groundwater, as well as their shares in individual categories of abstractions (waterworks, agriculture, industry, etc.).

We present surface and groundwater abstraction averages for the period of the last decade 2013-2022. According to the analysis, over 70% of surface and groundwater abstractions are utilized for public water supply systems, while approximately 20% of these abstractions are used for industrial purposes. 45% of surface water abstractions are used for industrial purposes and 85% of groundwater abstractions are utilized for public water supply systems.

In the last year (2022), we can observe an increase of 1.7% in total abstractions compared to the last decade (2013-2022). In the case of surface water abstractions for the year 2022 compared to the period 2013-2022 we can observe a decrease of 3.4% (water supply - an increase of 6.8%, industry – a decrease of 9.2%, agriculture – an increase of 40.7%). In the case of groundwater abstractions for the year 2022 compared to the period 2013-2022 we can observe an increase of 5.4% (water supply - an increase of 8.2%, industry - an increase of 2.4%, agriculture - a decrease of 17.4%).

How to cite: Kotrikova, K., Lovasova, L., Kurejova Stojkovova, M., and Slivova, V.: Analysis of the spatial distribution of surface and groundwater abstractions in the territory of Slovakia in the last decade, EGU General Assembly 2024, Vienna, Austria, 14–19 Apr 2024, EGU24-1480, https://doi.org/10.5194/egusphere-egu24-1480, 2024.

EGU24-2101 | ECS | Posters on site | HS8.2.1

Increased fresh groundwater extraction from wells in coastal aquifers by simultaneous extraction of brackish groundwater: a numerical modeling study 

Teun van Dooren, Mark Bakker, Niels Hartog, Klaasjan Raat, and Gertjan Zwolsman

In coastal areas, freshwater availability is often limited to fresh groundwater lenses that are fed by natural recharge. Overexploitation causes these freshwater reserves to shrink, resulting in increased seawater intrusion and salinization of groundwater wells. This will only intensify by the increasing freshwater demand in coastal urban areas resulting from rapid population growth and economic development. Simultaneously, the vulnerability of coastal regions to saltwater intrusion increases by ongoing climate change through sea level rise and changes in natural recharge patterns. Hence, proper management is required to extract fresh groundwater sustainably in coastal areas and to prevent saltwater intrusion.

Targeted extraction of brackish groundwater underneath freshwater lenses may be an effective measure to prevent salinization of fresh groundwater extraction wells in coastal aquifers. Moreover, it can increase the potential for freshwater infiltration, minimize freshwater losses by lateral outflow, and subsequently cause the volume of the freshwater lens to increase. But there is also a drawback, as extraction of brackish groundwater underneath freshwater lenses may result in the loss of a portion of the fresh groundwater. On the other hand,  the extracted brackish groundwater may provide an attractive alternative to seawater for desalination.

In this generic numerical modeling study, the dynamics of fresh, brackish and saline groundwater were studied for the case that fresh and brackish groundwater are extracted simultaneously. The wells are placed in an unconsolidated island aquifer that hosts a freshwater lens that is fed by recharge. A radial symmetric variable-density groundwater flow and transport model was constructed with SEAWAT. The performance of the brackish groundwater extraction well was assessed by investigating its effect on the potential fresh groundwater extraction and the associated freshwater losses. A sensitivity analysis was carried out to determine how hydrogeological characteristics and operational parameters affect the performance of the brackish groundwater extraction.

Results so far indicate that the extraction of brackish groundwater increases the volume of fresh groundwater that can be extracted by the freshwater well without salinization, due to the mitigation of upconing of brackish groundwater and the reduction of freshwater losses towards the coast. Placement of the brackish groundwater extraction well right below the freshwater well results in a more effective protection of the freshwater well, as reflected by a lower required brackish groundwater extraction rate. On the other hand, the volume of the freshwater lens may increase when the brackish groundwater extraction well is placed deeper below the fresh groundwater extraction, which may be beneficial for freshwater availability on a regional scale.

How to cite: van Dooren, T., Bakker, M., Hartog, N., Raat, K., and Zwolsman, G.: Increased fresh groundwater extraction from wells in coastal aquifers by simultaneous extraction of brackish groundwater: a numerical modeling study, EGU General Assembly 2024, Vienna, Austria, 14–19 Apr 2024, EGU24-2101, https://doi.org/10.5194/egusphere-egu24-2101, 2024.

EGU24-2435 | Posters on site | HS8.2.1

Current status and future challenges of fresh groundwater assessment in Georgia 

George Gaprindashvili, Merab Gaprindashvili, and Nana Kitiashvili

Groundwater assessment can be considered a base and effective management tool to protect groundwater resources. Fresh groundwater assessment is a multi-component system that is different for each country and depends on existing anthropogenic pressures or ongoing natural processes. However, the key and necessary for all countries is to have groundwater quantitative and qualitative data. These data are essential for groundwater resource assessment and management. Our goal is to review the main issues that reflect the current status of fresh groundwater assessment and management in Georgia and the future challenges that the country must gradually overcome.

Although the study of fresh groundwater resources has a long history in our country, there are currently many challenges for sustainable groundwater management. This is caused by several factors, of which it’s worth noting: Since the beginning of the 1990s, the monitoring of observed waterpoints has been discontinued; Since then-until now, uncontrolled drilling of boreholes to obtain fresh drinking water; The oldness of the technical condition of existing wells; The lack of information on groundwater quality and quantity in aquifers; The termination of updating hydrogeological maps and the absence of historical materials in digital format. In addition to the above topics, there is a lack of qualified personnel, which is especially felt after the renewal of hydrogeological monitoring by the Geology Department of the LEPL National Environmental Agency.

Despite the above and even in conditions of small resources, it became possible, and in recent years, the foundation was laid for the gradual elimination of existing challenges, such important activities as:

  • Renewal of fresh drinking groundwater monitoring, expanding the national monitoring network every year with state efforts and the support of donor organizations; Annually, with the support of the state and donors, the expansion of the national monitoring network;
  • Implementation of online monitoring methodology (remote monitoring of groundwater is carried out by automatic and instrumental stations);
  • Field sampling and preliminary hydrogeological field survey for selection of relevant monitored waterpoints;
  • Groundwater sampling according to the EU Water Framework Directive;
  • Search and systematization of historical materials;
  • Beginning delineation of groundwater bodies;
  • Beginning transboundary groundwater survey;
  • On the basis of the new law „On Water Resources Management“, which was approved by the Parliament of Georgia on June 30, 2023, the resolution of the Government of Georgia is being prepared with the relevant technical regulations: „State registration of drilling wells for the purpose of extracting fresh drinking groundwater“.

The mentioned works allowed the country to participate in the appropriate periodic reporting of the progress of the UN sustainable development goals (SDGs) and in the step-by-step implementation of the Georgia-EU Association Agreement.

Besides, in 2023, in the Department of Geology of the National Environmental Agency, a new structural unit - Hydrogeological Monitoring and Technical Maintenance Division, was created. The goal is to expand and improve the activities listed above by introducing modern methodologies. Accordingly, the issue of providing staff resources with appropriate qualifications is on the agenda, which requires effective solutions and activities, including in the educational direction.

How to cite: Gaprindashvili, G., Gaprindashvili, M., and Kitiashvili, N.: Current status and future challenges of fresh groundwater assessment in Georgia, EGU General Assembly 2024, Vienna, Austria, 14–19 Apr 2024, EGU24-2435, https://doi.org/10.5194/egusphere-egu24-2435, 2024.

EGU24-2733 | Posters on site | HS8.2.1

Refining the Characteristics of Hydrogeolgical Settings in Pingtung Plain of Taiwan 

Chia-Hung Liang, Chien-Chung Ke, Jung-Jun Lin, Tzi-Hua Lai, Chi-Chao Huang, Ping-Hua Shao, and Yuan-Hsi Lee

To improve the benefits of the groundwater resources management and utilization efficiency of Pingtung Plain located at Southern Taiwan, this study focused on the understanding of the hydrogeological settings and groundwater flow behavior of this area as well as assessing the reasonable of the delineation of  groundwater recharge geologically sensitive areas (GWRA) by various field investigation techniques.

Following the aforementioned purposes, totally four boreholes with the depth of 100 meters were drilled spreading around GWRA in 2019. According to the core logging analysis of Zaixing site located at the region of GWRA, we found that the gravel formation, distributed at shallow layer, was playing an important role of the benefit of groundwater recharge due to its hydraulic conductance. Furthermore, the Changxing, Silin and Huamin sites were located spreading around the boundary of the GWRA. The lithology of Huamin site was mainly composed of thick layers of gravel and mud, while Changxing and Silin sites were composed of thick layers of gravel and coarse sand, and thin layers (around 4 to 10 meters thickness) interspersed locally with three to four layers of gravel and coarse sand. The interlayer of fine grain sediments in this area showed that it is unfavorable for vertical infiltration of surface water and rainfall into deeper aquifers. To analyze the characteristics of aquifer and estimate hydrogeological parameters, the constant-rate pumping tests were conducted in two different sites located in GWRA. The hydraulic conductivity (K) and specific yield (Sy) of Zaixing site were 3.8×10⁻³ m/sec and 0.16 respectively, while those of Silin were 1.6×10⁻³ m/sec and 0.17. Finally, we could summarize that the Pingtung Plain had the relative higher conductance and capacity of water resources based on the comparison results of the range of hydraulic conductivity and specific yield with nine major groundwater area.

Therefore, an elaborate plan of hydrogeological investigation and assessment of groundwater resources of Pingtung Plain are very crucial to face the challenge of water scarcity in the near future.

How to cite: Liang, C.-H., Ke, C.-C., Lin, J.-J., Lai, T.-H., Huang, C.-C., Shao, P.-H., and Lee, Y.-H.: Refining the Characteristics of Hydrogeolgical Settings in Pingtung Plain of Taiwan, EGU General Assembly 2024, Vienna, Austria, 14–19 Apr 2024, EGU24-2733, https://doi.org/10.5194/egusphere-egu24-2733, 2024.

EGU24-4580 | ECS | Orals | HS8.2.1 | Highlight

Towards an Integrated Groundwater Management and Flood Control in Arid Qatar: Insights from GIS-Driven Multi-Criteria Decision Analysis 

Sarra Aloui, Adel Zghibi, Annamaria Mazzoni, Adel Elomri, and Tareq Al-Ansari

Groundwater resources in arid regions play a crucial role in meeting water demands; however, they are facing rapid depletion due to unsustainable exploitation practices, exacerbated by climate change. As climate extremes intensify, there is a growing emphasis on harnessing flood and storm flows to replenish overdrawn aquifers. Floods can present a unique opportunity for restoring groundwater levels and mitigating saltwater intrusion into aquifers. The use of effectively managed floodwater for aquifer recharge offers a dual advantage by maximizing the potential of floods as a valuable water resource, while minimizing their negative impacts.

This work proposes an integrated approach to evaluate the geospatial suitability of groundwater recharge using floodwater across Qatar, a peninsula located in the eastern part of the Arabian Peninsula. We applied a Quantum GIS-based Multi-Criteria Decision Analysis (MCDA) approach, namely the Analytic Hierarchy Process (AHP), to delineate flood susceptible zones and groundwater recharge zones in Qatar, considering several influential topographical, hydrological, environmental, and anthropological criteria. The maps of flood susceptibility and potential groundwater recharge zones were validated using recent flooding events and existing recharge wells data, respectively. Sensitivity analysis was conducted on both variables to further assess their accuracy. The overlay analysis of the two validated maps, encompassing 98% of the entire country's surface, suggests that approximately 64% of the Qatar peninsula presents medium to excellent suitability for aquifer recharge using floodwater. The areas best suited for floodwater-based recharge intervention are located in the northern and coastal regions of the peninsula, while the urban areas and southwestern area are less suitable.

The findings of this study provide decision-makers with spatially explicit information for targeted aquifer recharge projects, potentially mitigating groundwater depletion, enhancing water security, and improving flood risk management in Qatar. In addition, we offer insights into further investigation areas, encompassing technical, economic, and regulatory considerations, to enhance the applicability and effectiveness of the proposed groundwater recharge strategies. The approach employed can be effectively applied in similar flood-prone arid regions and is adaptable to diverse contexts.

How to cite: Aloui, S., Zghibi, A., Mazzoni, A., Elomri, A., and Al-Ansari, T.: Towards an Integrated Groundwater Management and Flood Control in Arid Qatar: Insights from GIS-Driven Multi-Criteria Decision Analysis, EGU General Assembly 2024, Vienna, Austria, 14–19 Apr 2024, EGU24-4580, https://doi.org/10.5194/egusphere-egu24-4580, 2024.

EGU24-5011 | Orals | HS8.2.1

Criteria for selection of technology to exploit groundwater in water scare area in Vietnam 

Huy Trieu Duc, Duong Bui Du, Thanh Tong Ngoc, Huy Nguyen Quang, Hung Pham Van, and Quyen Pham Ba

The solutions for water extraction in the high mountains of the North commonly used are rainwater storage, dug wells, drilled wells, springs, and hanging lakes, etc. These solutions have basically met the water needs of the people. However, many water supply works operate inefficiently and operate inflexibly. In this study, 19 criteria belonging to 4 groups: a group of criteria on water resources; a group of criteria on economic and technical; a group of criteria on the social and a group of criteria on the environment have been established to select technologies for exploiting water sources suitable for high mountains and water scarcity to ensure long-term and efficient operation of the project. GIS approach was used, and criteria were integrated using Analytical Hierarchy Process (AHP) method (Saaty, 1980) to select suitable water resources extraction technology with high mountains and water scarcity. The research results show that the evaluation criteria to determine the area to apply technological solutions for sustainable exploitation of suitable water sources and the weights of the established criteria ensure a consistent ratio (CR< 10%) according to the hierarchical analysis method.

How to cite: Trieu Duc, H., Bui Du, D., Tong Ngoc, T., Nguyen Quang, H., Pham Van, H., and Pham Ba, Q.: Criteria for selection of technology to exploit groundwater in water scare area in Vietnam, EGU General Assembly 2024, Vienna, Austria, 14–19 Apr 2024, EGU24-5011, https://doi.org/10.5194/egusphere-egu24-5011, 2024.

EGU24-5577 | Orals | HS8.2.1

Groundwater, armed conflict, and land surface uplift: an InSAR analysis of the Orontes River Basin 

Saeed Mhanna, Landon Halloran, and Philip Brunner

Armed conflicts have a pronounced impact on the environment, leading to changes in land use/land cover (LULC) and water resources. The Orontes River Basin (ORB), which covers parts of Lebanon, Syria, and Turkey, represents a unique case study.  After a prolonged period of intensive groundwater abstraction in the ORB, the Syrian War has led to cropland abandonment in certain areas, whereas continued intensive agriculture persisted in others. Groundwater levels are expected to have recovered due to conflict-related LULC changes and, consequentially, reduced irrigation demands. However, direct observation of this recovery is impeded due the near-complete lack of traditional hydrological or hydrogeological data in the Syrian portion of the ORB.

Just as overexploitation of groundwater can result in land subsidence, groundwater recovery may manifest itself as land surface uplift, given suitable poro-elastic properties of the subsurface hydrogeological units. In order to infer regional groundwater dynamics across the ORB, we use interferometric synthetic aperture radar (InSAR) to detect land uplift and subsidence. Our results show complex transient, non-uniform trends in subsidence/uplift due to conflict-induced changes to LULC and groundwater exploitation across the ORB. The results of this study can be used for optimizing humanitarian aid and as model inputs for future hydrological models in areas where in-situ measurements are almost non-existent.


How to cite: Mhanna, S., Halloran, L., and Brunner, P.: Groundwater, armed conflict, and land surface uplift: an InSAR analysis of the Orontes River Basin, EGU General Assembly 2024, Vienna, Austria, 14–19 Apr 2024, EGU24-5577, https://doi.org/10.5194/egusphere-egu24-5577, 2024.

EGU24-5747 | Orals | HS8.2.1 | Highlight

Groundwater recharge, vegetation and climate change 

Thomas Riedel, Tobias Weber, and Axel Bergmann

Groundwater recharge and evapotranspiration are often strongly related to precipitation in temperate regions. However, climate change is expected to change precipitation patterns and alter evapotranspiration, which will inevitably have consequences for the fraction of precipitation that ultimately turns into recharge. Since evapotranspiration is highly sensitive to climate, predictions of future groundwater recharge depend on accurate representation of this parameter. Factors that shape evapotranspiration in vegetated regions are soil water availability, plant water use efficiency, global radiation and vapor pressure deficit, among others, all of which directly or indirectly affect plant water use. How plants adapt their water use to a changing climate is thus highly informative for predictions of future groundwater recharge.

Current climate models indicate an increase in potential evapotranspiration, especially under scenarios with strong CO2 emissions. But it is still far from clear whether actual evapotranspiration will also increase, especially in regions where summer-time ET is usually water-limited rather than energy-limited and how this affects recharge.

We simulated the consequences of increases in atmospheric CO2 and temperatures for both, evapotranspiration and groundwater recharge, and found that the results are very different for specific vegetations types. For example, some plants will experience an elongation of the growing period, thereby theoretically increasing annual soil water demand. But the growing season for crops may shorten because of faster growing and ripening, so that harvest may occur earlier in the year, thereby decreasing plant soil water demand. Increasing atmospheric CO2 will increase plant-water use efficiency, so that crops may need less water to grow. For trees the picture is even more complicated. Warming spring temperatures may lead to an earlier leafing, but soil water stress at the end the growing season may actually shorten the growing period of trees. Further an increase in leaf area will lead to more transpiration by trees through increased soil-water uptake by roots. But soil evaporation might decrease, as large canopy shading reduces sunlight reaching the ground under trees.

The net effect of plant water use and on groundwater recharge is worth studying, especially under the conditions of climate change, because groundwater will likely remain a valuable resource for future human water consumption.

How to cite: Riedel, T., Weber, T., and Bergmann, A.: Groundwater recharge, vegetation and climate change, EGU General Assembly 2024, Vienna, Austria, 14–19 Apr 2024, EGU24-5747, https://doi.org/10.5194/egusphere-egu24-5747, 2024.

Groundwater is crucial for the economic development in arid and semi-arid areas. However, groundwater resources have been over-exploited for meeting the increasing demands in agriculture, industry and domestic use. Therefore, identifying the key factors influencing groundwater resources carrying capacity (GRCC)GRCC and providing the optimal strategy is critical for sustainable use of groundwater resources. The present study constructed a new GRCC index (D) for assessing the long-term GRCC variation in Zhangjiakou of Hebei Province, China (ZJK) using Budyko equation, Gravity Recovery and Climate Experiment data (GRACE),Global Land Data Assimilation System data (GLDAS), sector water consumption data and GDP data. And we also identify the key factors influencing the GRCC in ZJK using optimal water allocation model and Decision Support System for Agro-technology Transfer model. Our results shows that Budyko-derived long-term (1948–2018) groundwater storage changes (GWC) have declined from −310.9 to −455.6 cm and the large number of constructed wells for irrigation has accelerated the decline of groundwater resources in ZJK. Our results also showed the time series of D in ZJK were < 30%, 30%3, which was reduced by 14% compared to base scenarios in 2016. Also, cropping rotation systems H7 to H9 (H7: two year fallow-maize rotation; H8: two year fallow-potato rotation; H9: two year fallow-wheat rotation)) obtained the lower annual average net water use (14–70 mm) compared to other cropping rotation systems (62–253 mm). The significant difference of net water use, crop yields, water use efficiency and accumulative groundwater table depth changes of nine different cropping systems indicated H4 and H8 is suitable in the study region. Our results are useful for selecting suitable cropping systems based on the water use for local farmers.

How to cite: Gao, F. and Wang, Y.: Research on Construction and Application Of Groundwater Resources Carrying Capacity Model in Typical Semiarid Areas, EGU General Assembly 2024, Vienna, Austria, 14–19 Apr 2024, EGU24-7263, https://doi.org/10.5194/egusphere-egu24-7263, 2024.

One of our planet’s most significant and important widely available resources is groundwater, which is also a major global source of water for domestic, agricultural and industrial uses. Subterranean aquifers typically provide over 40% of the water consumed by California’s towns and farmers, and a substantial amount more during the drought years. Since aquifers are influenced by both natural and anthropogenic processes, groundwater pollution is a major issue worldwide. Ecosystem functions, human health, and socio-economic development, all depend on the quality of the water that it used in different sectors. In order to guarantee the safe and sustainable use of these resources for a variety of purposes, it is crucial to evaluate and monitor the quality of groundwater. In this study, the groundwater quality for the state of California, United States was evaluated using Weighted Index Overlay Analysis to establish the suitability of it for human consumption. The dataset utilized in the study was hosted by the California State Water Resources Control Board (CSWRCB).

Groundwater data collected from CSWRCB website on physiochemical parameters, such as total dissolved solids, total hardness and main cations like Ca2+, Mg2+, Na+ & K+ as well as anions like HCO3-, Cl-, SO42- & NO3-  were analysed to determine the quality of groundwater in California. Using the Inverse Distance Weighted (IDW) approach for interpolation, spatial maps were generated in ArcMap. In accordance with WHO drinking water quality guidelines, weights have been allocated to several physiochemical characteristics for the Weighted Index Overlay Analysis (WIOA).  California's groundwater quality's temporal variation is assessed for last 15 years to investigate the evolution of groundwater usability for drinking in the state.


                           Figure 1. Flowchart showcasing WIOA working procedure for groundwater quality assessment for drinking purpose


How to cite: Das, A., Banerjee, D., and Ganguly, S.: Assessment of the evolution of groundwater quality for the state of California, United States using weighted index overlay analysis, EGU General Assembly 2024, Vienna, Austria, 14–19 Apr 2024, EGU24-8383, https://doi.org/10.5194/egusphere-egu24-8383, 2024.

EGU24-8656 | Posters on site | HS8.2.1

Geological and Hydrogeological Settings of springs in Samaria Gorge (western Crete, Greece) 

Emmanouil Manoutsoglou, Ilias Lazos, Emmanouil Steiakakis, and Antonios Vafeidis

Samaria Gorge is located in the southern and western parts of the prefecture of Chania, in the White Mountains (Western Crete), and forms the main structure of one of the most important National Parks of Greece. It extends for approximately 13 kilometres, with a general N-S direction and exposes one of the essential lithostratigraphic sections of the Plattenkalk Group, the tectonically lowermost paraautochthonous group of metamorphosed rocks that structure the core not only of the White Mountains of Western Crete but also of the major mountains of the island (Tallaia, Psiloritis, Lasithiotika). The gorge runs through a stream that starts about 2 km north of the settlement of Samaria and flows downstream to the sea. In some places, the stream flows subsurface and reappears at topographically lower positions. This situation continues up to Kefalovrysia location , where the stream flows up the riverbed to the Sooth Cretan Sea. During the wet season of the year, the stream receives large amounts of water from the watershed, while during the dry season, it receives the outflows of a relatively small number of springs scattered along the Samaria Gorge. Based on the aforementioned, the main water source during the summer season comes from the the springs, located in the metamorphosed carbonate rocks with siliceous interlayers of the Plattenkalk Group.

The tourist development of the area (with an increasing trend of tourists passing through the gorge), combined with the need to preserve the highest natural beauty of the area, requires full fire safety as well as an improvement of the provided tourist services, which inextricably depends on the quantity and quality of the area’s available water in the various stops of the thousands of tourists inside the gorge as well at its southern exit (Agia Roumeli settlement), where the route terminates. In order to cover to the maximum extent the water supply - hygiene needs of the thousands of tourists, the local community needs both the coverage of any firefighting requirements and the rational management of the existing water resources, as well as the investigation for additional water resources from potential underground aquifers.

Therefore, collecting as much information as possible, related to the springs located within the gorge, is necessary. Beyond their spatial distribution, it is essential to determine the quantitative and qualitative features of the water of each spring. At the same time, the mapping around the springs is also crucial, where the steep topographical relief favours this procedure. This mapping will contribute help to the interpretation of the spring's formation. The presentation and discussion of the conclusions related to the spring's geological mapping within the Samaria gorge is the paper's objective.

Acknowledgment: This research is financially supported by the Green Fund “Forest Protection and Upgrading 2019” under “Other Nationals. Green Fund”.

How to cite: Manoutsoglou, E., Lazos, I., Steiakakis, E., and Vafeidis, A.: Geological and Hydrogeological Settings of springs in Samaria Gorge (western Crete, Greece), EGU General Assembly 2024, Vienna, Austria, 14–19 Apr 2024, EGU24-8656, https://doi.org/10.5194/egusphere-egu24-8656, 2024.

EGU24-9431 | ECS | Posters on site | HS8.2.1

Groundwater resource assessment in the Upper Godavari Sub Basin, India: A soft computing and CMIP6 Ensemble Approach. 

Sourav Choudhary, Santosh Murlidhar Pingale, and Deepak Khare

Groundwater is a critical lifeline for sustaining water resources in Upper Godavari Sub Basin, India's arid regions. However, due to impeding water requirement and demand in these regions along with anthropogenic complexities has raised serious concerns for this vital resource. Along with anthropogenic activities, Climate change also threatens this precious resource due to scarcity of surface water mostly during the summer season of the year. Hence, to comprehend this important issue, the groundwater resource assessment needs to be done for present as well as future scenarios. Therefore, the present study assesses the groundwater resource using a SWAT-MODFLOW model which is a combination of advanced hydrological model with cutting-edge numerical groundwater model. Individual surface and groundwater models are developed in SWAT and MODFLOW respectively and then are linked using the linkages files to get the more enhanced surface and groundwater interaction in the form of recharge, groundwater level and interaction of rivers with sub surface. The surface and groundwater models are calibrated and validated using the streamflow and groundwater level data. The calibrated model thus presents the current scenario of groundwater allocation which is then simulated with different bias corrected climate variables for getting the status of groundwater for future SSPs scenarios. From a range of CMIP6 climate models, the best model is selected based on the statistical index such as NSE, the correlation coefficient, R2, MAE, RMSE, MSE, and NRMSE which was NESM3 in the present case with a highest correlation and R2 with IMD precipitation and temperature dataset. The best selected climate model (NESM3) is then bias corrected using the empirical quantile method. Along with the numerical approach, to map the groundwater level data, soft computing approach using RFR and GBR is also employed to predict the groundwater level data for future scenarios. The optimization of these models was done by the Particle PSO. The study findings in Upper Godavari Sub Basin, India, revealed significant changes in groundwater levels across different seasons, with particularly significant increases observed during the dry season. The study showed that MODFLOW-GBR-PSO is more accurate in predicting groundwater level than MODFLOW-GBR, MODFLOW-RFR-PSO and MODFLOW-RFR. The result also predicted decreased rainfall for the SSP 585 scenario which in turn lead to drop in groundwater level and recharge in the distinct parts of the sub basin. Hence, from the above result a proper mitigation and framework needs to be prepared to counterfort the diminishing groundwater resource for the betterment of environment.

Key words: climate change, hydrological model, SWAT, Nash-Sutcliffe efficiency (NSE), Root mean square error (RMSE), Random Forest regression (RFR) and Gradient Boosting Regression (GBR), Swarm Optimization method (PSO).

How to cite: Choudhary, S., Murlidhar Pingale, S., and Khare, D.: Groundwater resource assessment in the Upper Godavari Sub Basin, India: A soft computing and CMIP6 Ensemble Approach., EGU General Assembly 2024, Vienna, Austria, 14–19 Apr 2024, EGU24-9431, https://doi.org/10.5194/egusphere-egu24-9431, 2024.

Studying water level fluctuation is crucial for water resource management and infrastructures. Groundwater level variations are due to recharge and/or discharge of water from aquifer because of anthropogenic activities or natural processes, e.g., rainfalls, irrigations, etc. Such variations may have a direct impact on ground deformation in the form land subsidence, land uplift, or landslide. Persistent Scatterers Interferometric Synthetic Aperture Radar (PS-InSAR) is an advanced satellite remote sensing technique which allows an effective monitoring of ground movement. In this work, PS-InSAR time series as well as precipitation and hydrological time series in a region in Catania, Italy are utilized, and their possible interconnections are investigated in the time-frequency domain using the tools in the least-squares wavelet software. It is shown how water level (surface water and groundwater) variations may have an impact on ground deformation.

How to cite: Ghaderpour, E. and Scarascia Mugnozza, G.: Ground Deformation Monitoring Using InSAR and Hydrological Time Series and Least-Squares Wavelet Software: A Case Study in Catania, Italy, EGU General Assembly 2024, Vienna, Austria, 14–19 Apr 2024, EGU24-9616, https://doi.org/10.5194/egusphere-egu24-9616, 2024.

EGU24-10022 | Orals | HS8.2.1

Multi-sensor System for Detecting Land Subsidence in Central Taiwan 

Wei-Chia Hung, Shao-Hung Lin, Yi-An Chen, and Guan-Zhong Lin

During 1992-2022 excessive withdrawal groundwater caused large-scale aquifer-system compaction and land subsidence in the Choshui River Alluvial Fan (CRAF) in Taiwan. How to effectively monitor land subsidence has become a major issue in Taiwan. In this paper, we introduce a multiple-sensor monitoring system for detecting land subsidence in central Taiwan, including 46 continuous operation reference stations (CORS), multi-temporal InSAR (MT-InSAR), a 1000-km leveling network, 36 multi-layer compaction monitoring wells, 7 automatic record extensometers, and 223 groundwater monitoring wells. This system can monitor the areal extent of land subsidence and provide data for studying the mechanism of land subsidence. We also develop new low-cost high-performance GNSS equipment and automatic multi-layer compaction monitoring equipment to monitor different aquifer compaction. We also use the Internet of Things (IoT) technology to control and manage the sensors and develop a big data processing procedure to analyse the data from the system of sensors. The procedure makes land subsidence monitoring more efficient and intelligent.

How to cite: Hung, W.-C., Lin, S.-H., Chen, Y.-A., and Lin, G.-Z.: Multi-sensor System for Detecting Land Subsidence in Central Taiwan, EGU General Assembly 2024, Vienna, Austria, 14–19 Apr 2024, EGU24-10022, https://doi.org/10.5194/egusphere-egu24-10022, 2024.

EGU24-10269 | Posters on site | HS8.2.1

Groundwater storage variations in volcanic island aquifers using passive hydrogeophysical data: A feasibility study in Tenerife  

Pablo J. Gonzalez, Miguel González-Jiménez, Mireia Jones, Lucía Martín-Ariza, Thomas Boulesteix, Rayco Marrero, María Charco, and Antonio Eff-Darwich

Groundwater in volcanic islands is usually one of the main sources of freshwater, and it is essential for sustainable development. In Tenerife Island, groundwater extraction occurs mainly by drilling horizontal water tunnels or “galleries”, as well as coastal wells on coastal aquifers systems. Since around 1900, but especially since the 60’s decade, hundreds of galleries and wells have been drilled, mainly for agriculture, industrial and freshwater supply. This has resulted in a sustained extraction of groundwater larger than the natural recharge, leading to a general groundwater table decline (locally up to 200+ m of drawdown). Since 2000, satellite radar interferometry (InSAR) applied to measure surface deformation has located several subsidence bowls in Tenerife. The localized surface deformation patterns have been correlated with water table changes and hence aquifer compaction. 

To investigate the effect of compaction processes on our ability to track groundwater storage variations of volcanic aquifers, we have set up a spatially dense passive hydro-geophysical monitoring network composed of geodetic and seismological instruments. The network has been running since summer 2023 and also enhances satellite radar interferometry estimates of ground deformation associated with the aquifer compaction processes. Here, we present preliminary results of the hydrogeophysical network after its first 9 months of operation (almost one hydrological year, July 2023-April 2024). As a first step towards understanding the dynamics of groundwater in this setting, we correlate the simultaneous observations of land subsidence rates and ambient seismic wavefield changes with respect to environmental variables (e.g., air temperature and proxy for soil moisture and soil temperature measurements as a function of depth). This experimental study will allow us to get close to improving the effectiveness of water management policies in aquifers in volcanic islands. 

Acknowledgements: We thank Spanish Agencia Estatal de Investigación projects PID2019-104571RA-I00 (COMPACT) funded by MCIN/AEI/10.13039/501100011033, and Proyecto PID2022-139159NB-I00 (Volca-Motion) funded by MCIN/AEI/10.13039/501100011033 and “FEDER Una manera de hacer Europa”. Thanks to the Teide National Park for the granted scientific permission to operate the geophysical network.

How to cite: Gonzalez, P. J., González-Jiménez, M., Jones, M., Martín-Ariza, L., Boulesteix, T., Marrero, R., Charco, M., and Eff-Darwich, A.: Groundwater storage variations in volcanic island aquifers using passive hydrogeophysical data: A feasibility study in Tenerife , EGU General Assembly 2024, Vienna, Austria, 14–19 Apr 2024, EGU24-10269, https://doi.org/10.5194/egusphere-egu24-10269, 2024.

EGU24-11526 | Orals | HS8.2.1 | Highlight

Modeling Groundwater Resource in Northern France Amidst Rising Anthropogenic Pressure and Climate Change 

Pascal Audigane, Géraldine Picot-Colbeaux, Ryma Aissat, Etienne Buscarlet, and Nadia Amraoui and the URBEAU, CALL and AMEVA SOMME Project Teams

We present a panel of numerical modeling studies aimed to improve groundwater management resources for different contexts in the Northern part of France (the 'Hauts-de-France' Region). The objective is to demonstrate the capacities and limitations of modeling tools in reproducing observed data and providing predictions on the groundwater evolution under increasing anthropic pressures and climate change. Numerical models are developed in 3D at the regional scale to evaluate various scenarios of groundwater management, considering several types of anthropic or natural constraints such as pumping for irrigation, drinking water and/or industrial use, land use evolution, and modifications in precipitation and/or evapotranspiration due to climate change.

In the three case studies presented, groundwater models are developed using BRGM’s 3D volume finite numerical tool MARTHE. The first case aims to characterize groundwater dynamics to identify the risks of flooding in the sewerage network of the urban communities of Lens-Liévin. The second case explores the role of land use in groundwater modeling for the sustainable management of the Lille Metropolitan Area. The third case evaluates the impact of climate change on the groundwater resource of the Somme River watershed.

Limitations and capacities to assess such complex hydrogeological systems are discussed, particularly concerning the uncertainty in the simulated results, the CPU time and space resolution constraints necessary for a meaningful calibration of observed data.

How to cite: Audigane, P., Picot-Colbeaux, G., Aissat, R., Buscarlet, E., and Amraoui, N. and the URBEAU, CALL and AMEVA SOMME Project Teams: Modeling Groundwater Resource in Northern France Amidst Rising Anthropogenic Pressure and Climate Change, EGU General Assembly 2024, Vienna, Austria, 14–19 Apr 2024, EGU24-11526, https://doi.org/10.5194/egusphere-egu24-11526, 2024.

EGU24-11662 | ECS | Orals | HS8.2.1

Evaporation-driven convective mixing and mineral precipitation in groundwater 

Marco Pieretti, Elena Abarca, and Luis Cueto

The management of groundwater under arid climate conditions represents one of the biggest challenges, and the ongoing trend of climate change suggests that it will result to be even more urgent. This is especially true if we consider the interaction between water, the porous medium and other phases, such as minerals. For example, exploitation/conservation of salt lakes/lagoons, limit salinization of soil and land desertification, study the alteration of soil’s mechanical properties and reliability of wastewater disposal are human activities that are strictly connected to groundwater dynamics and climate regimes. For this reason, more investigation is needed to understand how the complex system composed of surface conditions and the groundwater body, including chemical reactions, works. In this study, the focus is on the interplay between the mixing that occur in the aquifer due to variable density flow and mineral precipitation from the saline water. Variations in groundwater density are relevant in such systems, where the evaporation drives upward the water flow and reconcentrates the solutes at the exposed aquifer surface. The increase in water density with salinity confined to a layer which lays on less dense water may lead to a gravitationally unstable condition. From this stage, saline fingers originate, grow, and sink in the aquifer, establishing a free convective flow throughout the whole thickness. This mechanism forces the solutes to sink to the deeper zones and leave the saline water, from which minerals can precipitate. Here we present a variable-density flow model coupled to reactive transport to replicate a typical salt-lake environment connected to the aquifer beneath, i.e., under saturated conditions. These conditions are obtained by imposing a constant evaporation rate at a segment of the top boundary and a constant pressure at the inlet top boundary, to allow the water to enter while it evaporates. The chemistry of the initial and recharge water is the same to observe the modifications to different parts of the system due to convective flow and reactions. A series of simulations was run, changing the evaporation rate and permeability, corresponding to different Rayleigh numbers, to understand their effects on fluid dynamics and mineral formation. The results show that a saline layer forms at the surface, diffuses, and eventually becomes unstable under steep density gradients. The formation of fingers and dynamic of convection are different among those simulations but for long times the system faces a chemical (and density) stratification where the freshwater flow is constrained progressively toward the surface by the convective cell, which affect in turn the transport toward the unstable saline layer. Evaporation and permeability have different influence and weight in the system, determining how a system would evolve in time. The precipitation of minerals limits the convective flow, on the other hand, spatial distribution of minerals depends on the features of convection, and so, evaporation and permeability. In addition, these two parameters are modified by minerals in porosity.

How to cite: Pieretti, M., Abarca, E., and Cueto, L.: Evaporation-driven convective mixing and mineral precipitation in groundwater, EGU General Assembly 2024, Vienna, Austria, 14–19 Apr 2024, EGU24-11662, https://doi.org/10.5194/egusphere-egu24-11662, 2024.

EGU24-12170 | Orals | HS8.2.1 | Highlight

Accelerated Decline of Groundwater Levels in the 21st century, globally 

Hansjoerg Seybold, Scott Jasechko, Debra Perrone, Ying Fan Reinfelder, Richard Taylor, Mohammad Shamsudduha, Othman Fallatah, and James Kirchner

Groundwater is a vital resource for direct consumption as well as for agriculture, particularly in arid and semiarid climates where groundwater is often a primary water source for irrigation. Here, we analyze more than 170,000 groundwater level timeseries across the globe. We show that groundwater level declines accelerated over the past four decades. Accelerated declines are especially widespread in dry regions with extensive cropland. However, our study also reveals that there are areas where interventions have led to groundwater levels to recover.  This result provides a ray of hope for sustainable management of vital groundwater resources in the decades to come.

How to cite: Seybold, H., Jasechko, S., Perrone, D., Fan Reinfelder, Y., Taylor, R., Shamsudduha, M., Fallatah, O., and Kirchner, J.: Accelerated Decline of Groundwater Levels in the 21st century, globally, EGU General Assembly 2024, Vienna, Austria, 14–19 Apr 2024, EGU24-12170, https://doi.org/10.5194/egusphere-egu24-12170, 2024.

EGU24-12562 | Orals | HS8.2.1

Modeling the groundwater flow of the Agia karstic aquifer in Crete, Greece under present and future conditions 

George Karatzas, Emmanouil Varouchakis, Ioanna Anyfanti, and Nikolaos Nikolaidis

 This study examines the groundwater potential of the Agia aquifer, Crete, Greece,  under the existing water management policies.  Alternative future scenarios of groundwater abstraction and/or climate projections are also examined. The Agia Springs area is characterized by rich groundwater supplies which are used to meet water demand for drinking and irrigation  for the  Chania region. This region belongs to one of the most productive valleys on the island of Crete and plays an important role in the agricultural - food sector. It is also characterized by intensive tourist development. Therefore, the demand for water is higher in the summer season than in the rainy season, which leads to strong seasonal fluctuations. At the same time, the water supply is declining as precipitation is lower than in previous decades.  Climate scenarios presented for the island of Crete,  predict a 20% decrease in rainfall in the near future.The relevant authorities have drawn up a water management plan, which is currently being updated in order to mitigate the problems arising from the increasing demand.  According to the new scheme of the Agia Springs, the total withdrawal is 26 hm3/year, while there is a potential of 31.5 hm3/year. The aim of this study is to model the groundwater flow of the Agia aquifer in order to develop scenarios that could allow full utilization of the groundwater potential and reform the contribution of groundwater resources to the region’s water balance. The groundwater flow simulations were carried out using the Princeton Transport Code (PTC) and the ARGUS ONE 4.2.0.w program. The model considers the hydrogeological characteristics of the area, the precipitation time series, and the pumping rates of the extraction wells. The calibration of the model has shown that the Agia Springs field is a complicated confined aquifer system with large depth values (more than 400 m below sea level). The calibration shows better performance during the dry periods, with a good correlation between the modeled results and the values of the groundwater measurements on site. The final proposed scenarios refer to: 1) the short-term scenario, in which three additional pumping wells are operated alongside the existing ones, resulting in 29 hm3/year and 2) the medium -term scenario, which considers the pumping wells of the short-term scenario and four new ones, providing an additional 5 hm3/year. The results show that there is no significant impact on the response of the springs. The level of the springs deteriorates during the additional pumping. However, it recovers with the interruption of the operation of the pumping wells, which indicates the resilience of the aquifer.


Acknowledgment

This work was supported by OurMED “ Sustainable  water storage and distribution in the Mediterranean” project, funded by the PRIMA Programme supported by the European Union’s Horizon 2020 Research and Innovation Programme under Grant Agreement No 2222


References

Babu, D.K, Pinder, G.F., Niemi A., Ahlfeld, D.P. and Stothoff, S.A., 2002. Chemical Transport by Three-Dimensional Groundwater Flows, argusone.com.

Perleros, C., and Vozinakis, K., 2002. Hydrological study of the Chania county, geological map, Organization for Development of West Crete (ODWC)


How to cite: Karatzas, G., Varouchakis, E., Anyfanti, I., and Nikolaidis, N.: Modeling the groundwater flow of the Agia karstic aquifer in Crete, Greece under present and future conditions, EGU General Assembly 2024, Vienna, Austria, 14–19 Apr 2024, EGU24-12562, https://doi.org/10.5194/egusphere-egu24-12562, 2024.

EGU24-12755 | Orals | HS8.2.1 | Highlight

Assessment of groundwater storage variation at aquifer scale with ready-to-use GRACE Satellite Data: Spanish study cases 

Carolina Guardiola-Albert, Nuria Naranjo-Fernández, Jhonatan S. Rivera-Rivera, José M. Gómez Fontalva, Héctor Aguilera, Fernando Ruíz-Bermudo, and Miguel Rodríguez-Rodríguez

The satellite initiative Gravity Recovery and Climate Experiment (GRACE) has been thoroughly investigated in recent years to monitor groundwater storage (GWS). Since 2002, GRACE has provided distinctive perspectives on fluctuations in Earth's gravity field. Changes in gravity over time serve as valuable indicators for deducing alterations in total terrestrial water storage (TWS), encompassing soil moisture, surface water, snow and ice, canopy interception, wet biomass, and groundwater.

The importance of GRACE data in determining GWS holds crucial implications, particularly in regions with limited hydrogeological information. Numerous analyses published so far have consistently demonstrated a robust correlation between GWS derived from GRACE and measurements obtained directly from wells in extensive aquifers.

The Global Land Data Assimilation System (GLDAS) combines satellite and in situ data with sophisticated land surface modeling and data assimilation techniques. In the NASA GLDAS System Version 2 (GLDAS-2), GRACE data, initially on a 1° global grid, is downscaled to a higher resolution of 0.25°. This extension of data covers a daily scale from 1948, effectively interpolating temporal gaps present in the GRACE dataset. Following the isolation of contributions to temporal mass changes, GLDAS furnishes daily time series for GWS, making the GWS data readily available for utilization.

The present study adds to the existing body of knowledge by showcasing that GRACE is skilled at capturing regionally averaged seasonal variations in observed GWS at two Spanish detritic aquifers: Almonte- Marismas and Alto Guadalentín. Even in these cases, where the study area is relatively small compared to the broader GRACE track, there are good correlations between in situ and satellite information. On the other hand, this work aims to assess the efficacy of readily accessible GWS data obtained from the GLDAS web services. This will be accomplished through the validation of GWS ready-to-use product from GLDAS involving (i) an examination of its correlation with piezometric information in both confined and unconfined aquifers, and (ii) an evaluation of net groundwater recharge rates computed by using GWS data.

How to cite: Guardiola-Albert, C., Naranjo-Fernández, N., Rivera-Rivera, J. S., Gómez Fontalva, J. M., Aguilera, H., Ruíz-Bermudo, F., and Rodríguez-Rodríguez, M.: Assessment of groundwater storage variation at aquifer scale with ready-to-use GRACE Satellite Data: Spanish study cases, EGU General Assembly 2024, Vienna, Austria, 14–19 Apr 2024, EGU24-12755, https://doi.org/10.5194/egusphere-egu24-12755, 2024.

EGU24-13213 | Orals | HS8.2.1

Spatial and temporal variabiliy in drinking water quality in a riverbank filtered drinking water supply system   

Anita Erőss, Petra Baják, Máté Márk Mezei, Endre Csiszár, Katalin Hegedűs-Csondor, Bálint Izsák, Márta Vargha, György Czuppon, and Ákos Horváth

Riverbank-filtered systems are cost-effective and sustainable drinking water supply systems along major rivers. However, they are strongly dependent on the river stage. Climate change-induced extremely low or high river stages may cause water quantity and quality problems. In this study, a riverbank-filtered drinking water supply system along the Danube River in Hungary was investigated from a geochemical aspect at lower and higher river stages. We also aimed to understand the origin of elevated (>100 mBq L–1) gross alpha activity measured in some wells. 

10 producing, 2 monitoring wells, and the Danube were sampled at lower and higher river stages. Physico-chemical parameters were recorded on-site and the samples were analysed for major ions, trace components and hydrogen (δ2H) and oxygen (δ18O) stable isotopic compositions as well. 234U, 238U and 226Ra activity concentrations were determined by alpha spectrometry using selectively adsorbing Nucfilm discs. 222Rn activity was measured by liquid scintillation counting.  

Uranium activity was measured in the highest concentration (up to 222 mBq L–1) among the examined radionuclides. 226Ra and 222Rn activities were barely above the detection limit. Based on these results, the previous non-compliant elevated gross alpha activity is caused by dissolved uranium in the groundwater. A spatial pattern was recognized in the geochemical characteristics of the produced water. Total dissolved solid, iron and manganese content and also uranium activity concentrations show increasing values from N to S, which corresponds well to the occurrence of organic matter-rich, clayey floodplain deposits underlying the aquifer and to their higher position to the S. Stable isotope ratios point to the increased influence of surface waters in the N due to the position of an irrigation channel. Besides spatial variation, a temporal change was observed, too: higher uranium activity was measured at a lower river stage (up to 222 mBq L–1) compared to concentrations at a higher river stage (up to 126 mBq L–1). This phenomenon could be explained by the dynamic relationship between the groundwater and the river. The hydraulic gradient between the river and the wells decreases with decreasing river stage, which resulted in longer residence time of the water. The longer the residence time, the more the oxygen-rich water interacts with the clayey basement layers facilitating uranium remobilization. 

This process will become increasingly dominant in extremely low river stages during long-lasting drought periods in the future and might lead to water quality problems. Our study highlights the vulnerability of riverbank-filtered drinking water supply systems, which can jeopardize their long-term use in the future.  

The research is part of a project which was funded by the National Multidisciplinary Laboratory for Climate Change, RRF-2.3.1-21-2022-00014.  


How to cite: Erőss, A., Baják, P., Mezei, M. M., Csiszár, E., Hegedűs-Csondor, K., Izsák, B., Vargha, M., Czuppon, G., and Horváth, Á.: Spatial and temporal variabiliy in drinking water quality in a riverbank filtered drinking water supply system  , EGU General Assembly 2024, Vienna, Austria, 14–19 Apr 2024, EGU24-13213, https://doi.org/10.5194/egusphere-egu24-13213, 2024.

EGU24-13767 | Posters on site | HS8.2.1

Development of coastal groundwater management solution in Jeju Island, South Korea 

IL Moon Chung, Sun Woo Chang, and So Young Woo

Jeju Island is the region in South Korea that receives the highest amount of rainfall, and most of this precipitation infiltrates into the ground as groundwater, which is utilized as the primary water resource. The major challenge in extracting groundwater in coastal areas is the intrusion of seawater. This study aims to develop management solutions to address the limitations on water resource utilization and water scarcity issues caused by saltwater intrusion in coastal areas. Utilizing observational data from Jeju, precise water circulation analysis and hydrogeological data related to groundwater salinization were collected. The study also involved the construction of a database for hydrological components based on water circulation analysis and the impacts of climate change. Additionally, techniques for predicting coastal groundwater levels and developing a coastal groundwater management system were established. Through the research findings, it is expected that a comprehensive solution for coastal groundwater management in response to climate change, improved accuracy in groundwater level management, and policy recommendations can be achieved.


Acknowledgment : The work was suppored by the KICT Research Program (project no. 20230166-001, Development of Coastal Groundwater Management Solution) funded by the Ministry of Science and ICT.


How to cite: Chung, I. M., Chang, S. W., and Woo, S. Y.: Development of coastal groundwater management solution in Jeju Island, South Korea, EGU General Assembly 2024, Vienna, Austria, 14–19 Apr 2024, EGU24-13767, https://doi.org/10.5194/egusphere-egu24-13767, 2024.

Measuring the existing amount of groundwater in a specific region is no easy task. It is well known that this resource is one of the hardest to acquire and at the same time it is close to one third of existing freshwater on the earth. Satellite data stands as a convenient source of information in developing countries where groundwater levels monitoring remains scarce, but groundwater pressure keeps rising because of the increase of population and global climatic changes.

In this work, satellite data from the World GRACE Land Water Equivalent and GLDAS Terrestrial Water Storage measurement programs were downloaded and processed using the programming language Python. By applying a simple hydrological balance and masking the worldwide downloaded information to Colombia’s extent, groundwater anomalies were estimated.

 Different representations were used in order to comprehend groundwater anomalies data under its possible scopes: geographic, temporal, and extreme value analysis were made for the Colombian region and its five major basins, finding useful information about each region like average, minimum, and maximum values; time-related behavior was observed in early and late times from measurement timestamps; extreme value heat maps allowed us to identify historical geographic outlier regions; a mean value heat map was generated for the full time span of measurement as a reference value for each region; finally, a combined scope helped us identify extreme events geographically and temporally.

As a result, among the observations studied since the first GRACE mission in 2002, until the last downloaded information in February 2023, the Pacific basin showed the least fluctuations in groundwater storage anomalies. This behavior can be attributed to the high precipitation rates in this region and likely the soil's saturation state. Meanwhile, in the Caribbean region, the fluctuations were significant, with a strong tendency toward groundwater depletion. This unique behavior may be linked to the region's geographic exposure to climatic phenomena like El Niño/La Niña.

Lastly, leveraging diverse perspectives on groundwater, we conducted focused seasonal analyses to comprehend its behavior under El Niño and La Niña conditions. We also performed a brief comparison to assess the resemblance between precipitation patterns and groundwater estimations. Considering the Oceanic Niño Index (ONI) for the 2009-2012 La Niña period, groundwater anomalies were generally positive across all studied basins. Conversely, during the 2014-2017 El Niño period, anomalies were predominantly negative, particularly in the Caribbean and Magdalena Cauca basins, highlighting their vulnerability to these climatic phenomena.

How to cite: Romero, P. and Piña, A.: Assemblage of satellite information to produce insights into ground-water storage in Colombia’s five major basins, EGU General Assembly 2024, Vienna, Austria, 14–19 Apr 2024, EGU24-13806, https://doi.org/10.5194/egusphere-egu24-13806, 2024.

EGU24-15224 | ECS | Orals | HS8.2.1

InSAR Decomposition Reveals Varied Deformation Patterns in Coastal Subsidence Regions 

Shao-Hung Lin, Wei-Chia Hung, and Jyr-Ching Hu

The impact of climate change was reported to cause more frequently extreme rainfall or drought events in decades. The disaster like typhoon coming up with excessive rainfall would flood low-lying coastal areas, resulting in devastating damage to local industry. Moreover, the coastal area may also be threatened by relative sea level rise due the lowering land surface height by land subsidence hazards. The Pingtung Plain, one of the major aquaculture-rich counties in Taiwan, suffered from up to 3.5-meter cumulative subsidence in the coastal area from 1972 to 2019. Featuring tropical monsoon climate properties, the land displacement in Pingtung area is highly variated with interannually seasonal changes between dry and rainy seasons. In this study, we apply Persistent Scatterer InSAR (PSI) technique into the high variability coastal area to make up for the lack of either spatial or temporal resolution of in-situ grounded measurements like continuous GNSS station or precision leveling. To comprehensively analyze the transient land deformation responded within a short period, we further employ an unsupervised decomposition method called Principal Component Analysis (PCA) into InSAR observation matrix to distinguish individually spatiotemporal patterns. First two principal components (PCs) reveal that the coastal and inland area in the Pingtung Plain characterize different amplitude of seasonal variations and long-term trends. In addition, the third principal component indicates the heterogeneous patterns due to different types of industrial groundwater usage and hydrogeological environment. The unsupervised method is capable to retrieve different spatial deformation patterns in the high variability coastal area from the bulk InSAR time-series matrix, which can contribute to comprehensive understandings of the relation between land deformation and aquifer system.

How to cite: Lin, S.-H., Hung, W.-C., and Hu, J.-C.: InSAR Decomposition Reveals Varied Deformation Patterns in Coastal Subsidence Regions, EGU General Assembly 2024, Vienna, Austria, 14–19 Apr 2024, EGU24-15224, https://doi.org/10.5194/egusphere-egu24-15224, 2024.

EGU24-15279 | ECS | Posters on site | HS8.2.1

Semi-or fully automatic drainage regulation as a mean to recharge groundwater 

Sara Venuleo, Silas Unrau, Philipp Staufer, and Henning Lebrenz

Climatic change is decreasing water availability, all over the world. Regions which never faced water scarcity need to adapt their practises to face more frequent and severe droughts periods. Among others, agriculture is one of the sectors that will face the consequences of water scarcity. Indeed, while water availability decreases, the use of water for irrigation purposes becomes questionable.

In many regions in Europe, cultivated areas have a sub-surface drainage system, which ensures that crops do not face water stress due to excessive soil water content. These drainage systems convey the water infiltrating during rainfall events to surface channels, reducing the natural water table recharge.

Introducing drainage regulations units in existing drainage systems represent a mean to increase the soil water retention and, consequently, a mean to increase the natural water table recharge while decreasing the need of irrigation and while helping to reduce peak flow during intense rainfall events. Moreover, controlled drainage management can reduce the amount of Nitrogen and Plant Protection Products (PPP) discharged into surface waters.

Given its environmental benefits, drainage water management is today an official conservation practice in the USA and the Conservation Practice Standard 554 (code 554) has been published by the United States Department of Agriculture to inform, advice and guide potential users of this practise.

Drainage control units can be simple structures retrofitted in existing drainage networks outlets. They can consist of sliding weir systems or of a flashboard with adjustable height and they can be operated manually or automatically.

In the present study an automatic drainage control unit has been developed and operated in a laboratory prototype. The objective of our experiment was understanding which technical and practical difficulties are faced in the use of a drainage control unit and thus which issues hinder its spread among farmers. Particular attention was given to possible issues associated with sedimentation.

How to cite: Venuleo, S., Unrau, S., Staufer, P., and Lebrenz, H.: Semi-or fully automatic drainage regulation as a mean to recharge groundwater, EGU General Assembly 2024, Vienna, Austria, 14–19 Apr 2024, EGU24-15279, https://doi.org/10.5194/egusphere-egu24-15279, 2024.

EGU24-15335 | Orals | HS8.2.1

Indicator-based assessment of groundwater resources sustainability in South Korea 

Yunjung Hyun, Eun-Jee Cha, Ayoung Jeong, and Haejin Han

Groundwater level decline and quality deterioration is continuously observed nationwide in South Korea. Meanwhile, the demand for groundwater, which is relatively stable and clean in the face of climate crisis and future industry, is increasing in South Korea. In order to meet sustainable use for growing groundwater demand, it is essential to assess groundwater resources sustainability by taking into account the economic, social, and environmental factors in management and planning of groundwater resources. This study proposes groundwater sustainability management indicators to account for these factors based on DPSIR framework. A case study is performed to assess groundwater resources sustainability on 5 river basins(Han-river, Keum-river, Nakdong-river, Youngsan-river, Seomjin-river) by using indicators with available data in South Korea. The results show that groundwater depletion and contamination is susceptible to occur nationwide with spatial variation. Renewable groundwater resources per capita is evaluated to be approximately ranged from 1,000 to 10,000 m3/yr over the nation, while less than 1,000 m3/yr in the western and southeastern parts of South Korea, which is related to high population and urbanization. Much of Groundwater abstraction occurs with respect to groundwater recharge in the easter areas. Among 5 river basins, groundwater dependence of Geum-river basin area is highest. Overall, the wester parts of Korea including Keum-river, Youngsan-river, Seomjin-river basins, are susceptible to be more stressed. Total nitrogen load is high in subbasins of Han-river and Keum-river basins, but groundwater quality index for nitrate-nitrogen shows different spatial patterns. In South Korea, total e-coli, NO3-N, and Cl- are major contaminants observed in groundwater. The case study shows that proposed groundwater sustainability management indicators can good enough to provide a general view of groundwater resources status. Proposed indicators can also be utilized to evaluate current status of groundwater and policies for National Water Management Basic Plan as well as used as elemental indicators for developing a comprehensive index for necessity. Further data collection and analysis is required for comprehensive assessment of groundwater resources management sustainability.

How to cite: Hyun, Y., Cha, E.-J., Jeong, A., and Han, H.: Indicator-based assessment of groundwater resources sustainability in South Korea, EGU General Assembly 2024, Vienna, Austria, 14–19 Apr 2024, EGU24-15335, https://doi.org/10.5194/egusphere-egu24-15335, 2024.

EGU24-15617 | ECS | Orals | HS8.2.1 | Highlight

Off-season irrigation as a climate adaptation strategy for future groundwater management in Northern Italy 

Paolo Colombo, Pietro Mazzon, and Luca Alberti

Across 2021 and 2023, Northern Italy suffered a harsh meteorological drought due to severely under the norm precipitation. This strongly affected the pre-alpine lake levels as well as rivers discharge and soil moisture. Groundwater was also impacted, resulting in decreased water table levels. These factors led to harsh consequences on agriculture, that in Lombardy region largely relies on flooding and surface irrigation methods using Ticino and Adda rivers water coming from lakes.

To address the challenges posed by this last drought event and to be prepared to possible future dry scenarios, we propose and show the first results of our research around the possibility to harness the capillary irrigation network as an infrastructure for a diffused managed aquifer recharge (MAR). The main idea is to infiltrate water into aquifers in periods of surface water exceedance (historically autumn/winter in this region) using the irrigation network by keeping water in the channels or providing it as irrigation. The increased underground water storage would lead to groundwater levels increase. Relying on the slow groundwater velocity (ca. 350 m/year), water would remain stored in the subsoil just below the irrigated areas, bringing two main advantages during the following spring and summer seasons. First, the possibility to harness groundwater as an additional reservoir from which to extract water for agricultural or urban purposes if surface and meteorological water is insufficient. Second, a sustained flow rate at lowland springs that are scattered around the Po plain, whose water is reused for irrigation downstream and represent biodiversity hotspots. The adaptation measure feasibility will be assessed through field tests by providing water in channels and on fields and through agricultural and groundwater integrated models able to consider climate change scenarios.

During the 2023/24 winter season, a first field test was carried out distributing water in the irrigation network and over some fields selected through the cooperation of farmers. Helped by a regional scale numerical model we tested the potentiality of such practice both at basin and at local scale, by simulating the additional winter recharge. The model simulations clearly show the adaptation measure potentiality both at local and at regional scale. Furthermore, monitored wells around the pilot are showing signs of the expected short-term effects of the measure, but a longer time series is needed to assess its actual impacts. Here some model simulation outcomes are shown together with the first results of the field activities, which are the first steps for planning the main experimental activity planned for the next winter season.

This research is funded by the Interreg Central-Europe programme, as part of Pilot Action Milan from MAURICE project (CE0100184): MAnagement of Urban water Resources In Central Europe facing climate change). The project involves other research and public administration entities from a total of 6 countries involved.

How to cite: Colombo, P., Mazzon, P., and Alberti, L.: Off-season irrigation as a climate adaptation strategy for future groundwater management in Northern Italy, EGU General Assembly 2024, Vienna, Austria, 14–19 Apr 2024, EGU24-15617, https://doi.org/10.5194/egusphere-egu24-15617, 2024.

In recent decades, the increasing water demand in Iran has led to extensive groundwater pumping, which has caused significant depletion of many aquifers across the country. This unsustainable extraction has resulted in the loss of groundwater resources and significant land subsidence, adversely affecting several agricultural and urban areas. While previous studies have identified the problem at local scales in major agricultural centers and metropolitan areas, the extent of land subsidence and its impact on groundwater resources, population, and infrastructure across the country is still unknown. This study aims to fill this gap by extending the monitoring and providing a comprehensive understanding of the issue through a nationwide survey that employs Interferometric Synthetic Aperture Radar (InSAR). We generate a large stack of small baseline interferograms at a spatial resolution of 100 meters. Assuming land subsidence is spatially localized and temporally correlated, we remove other signals, mainly from atmospheric phase delay, to isolate the subsidence. Our analysis of Sentinel-1 data from 2014 to the present has enabled us to map the subsidence rates across the country. Our findings indicate that over 50,000 sq. km of the country's land is experiencing significant land subsidence, primarily in agricultural areas, but also in urban areas. As this subsidence is associated with pumping from confined aquifers, we estimate an annual groundwater loss of almost 2 Billion Cubic Meters in Iran, which is in agreement with independent in-situ measurements and GRACE data. By combining our estimated groundwater loss with a land cover map and official agricultural production data, we explore how inefficient irrigation in certain parts of the country is the main driver of groundwater loss. Our study underscores the urgent need for immediate measures to address the issue of groundwater loss in Iran and mitigate its effects on the country's population and infrastructure.

How to cite: Haghshenas Haghighi, M. and Motagh, M.: The growing groundwater crisis in Iran and its impact on land subsidence: A nationwide survey using satellite InSAR, EGU General Assembly 2024, Vienna, Austria, 14–19 Apr 2024, EGU24-15656, https://doi.org/10.5194/egusphere-egu24-15656, 2024.

EGU24-15807 | ECS | Posters on site | HS8.2.1

Sustainable Utilization of Groundwater Resources through Well of Construction Sites under Climate Change: A Case Study in Taichung City, Taiwan 

Chiung-Ling Liu, Hsun-Chuan Chan, I-Yu Wu, Chao-Chun Chien, Ming-Che Wu, and Shu–Fang Chang

Global climate change has led to an increase risk of drought. It reflects the importance of effective water resource management. In 2011, Taiwan experienced a severe water crisis during a drought, with Taichung bearing the brunt of its impacts. However, this brought to light the use of groundwater resources against drought. Groundwater from dewatering on construction sites played a critical role in supporting industrial and domestic uses while providing approximately 5,000 tons of water daily during the drought. Collaborative efforts resulted in the swift integration of groundwater from nine construction sites into the tap water supply system, providing about 100,000 tons daily, sufficient to support around 400,000 people.

Generally, construction site groundwater is underutilized. This study aims to gather fundamental information on wells at construction sites of Taichung and analyze current water yields from various perspectives. The objective is to identify cases for long-term promotion, propose corresponding measures, and develop a sustainable management model. The results will provide specific strategies and timelines for ongoing, sustainable groundwater utilization efforts at construction sites.

Keywords: drought; construction-site well; groundwater resource; sustainable utilization

How to cite: Liu, C.-L., Chan, H.-C., Wu, I.-Y., Chien, C.-C., Wu, M.-C., and Chang, S.: Sustainable Utilization of Groundwater Resources through Well of Construction Sites under Climate Change: A Case Study in Taichung City, Taiwan, EGU General Assembly 2024, Vienna, Austria, 14–19 Apr 2024, EGU24-15807, https://doi.org/10.5194/egusphere-egu24-15807, 2024.

In India, groundwater is the major source of water for various activities.  Due to over-extraction, the groundwater levels are declining over the period. The Present study has an objective of investigating the groundwater potential zone (GPZ) and finding the most sensitive parameter for the study area which is Raipur district, Chhattisgarh, India. The state is located in the Mahanadi River basin with a coverage area of 2892 Km2. The following study uses the AHP (Analytical hierarchical process) technique for analysis along with geographic information system (GIS) and Remote sensing. Mapping GPZ includes various hydrogeological and topographical features. Seven different datasets namely precipitation data, drainage density, lineament density, slope data, land use land cover (LULC), soil data, and lithological conditions of the area were considered. These thematic maps were created using various raw datasets like meteorological data, digital elevation model (DEM), satellite data, soil data, and lithological data. The AHP method which is based on multi-criteria decision analysis (MCDM) assigns weights on Saaty’s scale to all layers as per their contribution to groundwater potential in the study area. After the formation of the AHP matrix, overlay analysis was performed with the normalized weights in the GIS environment. Layer-wise sensitivity analysis was performed for all the input layers. Sensitivity analysis highlights the importance of parameters by removing each parameter at a time.  The use of sensitivity analysis is to find out the relationship between the given input layers and the output layer generated. The study also cross-validated the groundwater level data of the Raipur district. This verification confirms the authenticity of the method. The study area was divided into five potentiality zones based on spatial distribution analysis. The results indicate that 22.06% and 21.34% of the study area fall under poor and good potentiality zones, respectively whereas the moderate potential zone is the most dominant one with a percentage of 37.82. The analysis also revealed that 7.87% and 10.92% of the area belong to extreme zones i.e. very poor and very good groundwater potential zones respectively. The result also shows that Raipur City and the northeastern parts of the district have a very poor groundwater potential zone. The analysis shows that the most sensitive parameter is land use land cover with a mean variation of 4.37% followed by slope, lineament density, and lithology with 4.20, 3.69, and 2.17% respectively. The least sensitive parameter for groundwater potential zone is soil type with a mean variation of 0.79% followed by drainage density and rainfall with 1.48, and 2.12% respectively. Consequently, this study can be used to locate the Groundwater Potential Zone at a lower scale for effective groundwater extraction and sustainable groundwater management.

How to cite: Dey, M. K. and Sathawane, S.: Geospatial distribution of groundwater potential zone using Remote sensing, GIS and analytic hierarchy process (AHP) approach: a case study of Raipur district, Chhattisgarh, India, EGU General Assembly 2024, Vienna, Austria, 14–19 Apr 2024, EGU24-16281, https://doi.org/10.5194/egusphere-egu24-16281, 2024.

EGU24-16306 | ECS | Posters on site | HS8.2.1

Where could surface water be used for Managed Aquifer Recharge (MAR) in the Besòs catchment, considering quantity and quality aspects?  

Luciana Scrinzi, Sandra Pérez, and Estanislao Pujades

In many parts of the world, including the Mediterranean region, climate projections indicate less average runoff available and more frequent extreme rainfall events. Several sub-catchments in the river basin district of “Cuencas Internas de Catalunya” already need to address an irregular availability of surface water and a high vulnerability to floods in a changing climate, as well as water quality issues in streams and aquifers. In this context, aquifers can play a key role as natural reservoirs to buffer the effects of climate change, although challenges exist to keep a balance between groundwater recharge (inflows) and discharge (outflows) while preserving water quality. With the Besòs catchment as a study area, monitoring data from 2007 to 2023 was gathered from the database of the Catalan Water Agency. Spatial distribution of surface water and groundwater hydrochemistry (CE, Cl, NO3-, PO43-, TOC, pH, T) were analyzed and contrasted for different river stretches, as well as time series of river flow and groundwater levels in alluvial aquifers. Potential interactions between rivers and underlying aquifers and differences in water quality were inferred through descriptive statistics and non-parametric tests for selected areas. Sites where Managed Aquifer Recharge (MAR) could be potentially implemented were identified, considering quantity and quality aspects at catchment scale as well as physical aquifer properties. These preliminary results will guide the development of numerical models where different schemes will be tested of MAR methods (e.g.: streambed channel modifications, bank filtration, water spreading, wells recharge) and recharge sources (e.g.: rivers and streams runoff, reclaimed water) for climate adaptation. 

How to cite: Scrinzi, L., Pérez, S., and Pujades, E.: Where could surface water be used for Managed Aquifer Recharge (MAR) in the Besòs catchment, considering quantity and quality aspects? , EGU General Assembly 2024, Vienna, Austria, 14–19 Apr 2024, EGU24-16306, https://doi.org/10.5194/egusphere-egu24-16306, 2024.

EGU24-16458 | Orals | HS8.2.1 | Highlight

Measures to adapt to climate change and mitigate the impact of droughts in alluvial aquifers and rivers 

Jannis Epting, Annette Affolter Kast, Stefan Scheidler, Carl Love Råman Vinnå, and Oliver S Schilling

As a result of climate change, periods of drought are likely to be longer and more frequent. Many small and medium-sized rivers are already drying up in summer and becoming temporary watercourses with all the limiting factors such as oxygen deficiency, excessively high temperatures and their effects on aquatic fauna in particular.

One way to counteract the drying up of impacted rivers is to artificially recharge the alluvial aquifers that feed the rivers via a geoengineering method called Managed Aquifer Recharge (MAR). There are various infiltration-based methods employed in MAR, including groundwater recharge via natural and technical infiltration basins or particularly in built-up areas with injection wells that recharge the water directly into the aquifer. The enhanced exfiltration of groundwater as a result from MAR to targeted rivers is called Managed Surface Water Recharge (MSWR). By artificially raising the groundwater level using MAR from nearby rivers/basins to such an extent that the groundwater level is subsequently hydraulically higher than the river level, so that the groundwater can flow into the rivers affected by drought.

To sustainably achieve MSWR, MAR should take place when surface water is abundant during medium and high river discharge periods such that groundwater later can exfiltrate into rivers during low water periods. Another positive effect of MSWR lies in the fact that low water periods and drought often occur during hotter summer months. While MAR is often optimal during the cooler snowmelt periods or rain intensive transitional seasons, resulting in comparatively lower temperature of water entering into the ground. MSWR is thus often automatically accompanied by an ecohydrologically relevant cooling effect achieved via the enhanced exfiltration of comparatively cooler groundwater during hotter summer periods. Thus, in addition to an increase in groundwater exfiltration into surface waters during drought periods, MSWR also has the benefit of ecological enhancement in rivers with respect to water temperature and quality.

Here, we present first results of our current research into practical MAR-MSWR, which we have conducted at different sites in urban and rural environments in pre-Alpine Switzerland. We present process-based results for different spatial, temporal and operational scales including both local (river-reach) as well as regional (river-basin) perspectives.

How to cite: Epting, J., Affolter Kast, A., Scheidler, S., Råman Vinnå, C. L., and Schilling, O. S.: Measures to adapt to climate change and mitigate the impact of droughts in alluvial aquifers and rivers, EGU General Assembly 2024, Vienna, Austria, 14–19 Apr 2024, EGU24-16458, https://doi.org/10.5194/egusphere-egu24-16458, 2024.

EGU24-16890 | ECS | Orals | HS8.2.1 | Highlight

Evaluation of optimal conditions for managed aquifer recharge in the west African basement area. 

Palingba Aimé Marie Doulkom, Mahamadou Koïta, Yvan Rossier, Jean-Michel Vouillamoz, Angelbert Chabi Biaou, Fabrice Lawson, Moussa Bruno Kafando, Ousmane Roland Yonaba, and Lawani Adjadi Mounirou

Most African populations depend on groundwater in rural areas for their drinking water. Indeed, in the face of climate change and strong demographic growth, groundwater is increasingly in demand. The sustainability of water resources in this type of environment is becoming a major challenge. Managed Aquifer Recharge (MAR), which consists of inducing water infiltration through appropriate developments to replenish an aquifer's water stock, is therefore one of the measures that can be implemented to secure water supplies, combat the effects of climate change and, more generally, contribute to improving groundwater availability. However, the issue of the effectiveness of MAR systems, depending on the type of environment, still remains. The aim of this research is to determine the influence of aquifer and infiltration basin properties on artificial recharge, with a view to identifying the optimum conditions for setting up such a system.

Using synthetic modeling, we designed a representative domain of basement aquifers incorporating an infiltration basin. The hydrogeological properties of the different layers of the defined alteration profile were then determined, including the boundary conditions of the domain. The study involved varying the various physical characteristics of each layer, such as hydraulic conductivity (homogeneous and inhomogeneous), vadose zone thickness, storage, water table thickness and hydraulic gradient, and the characteristics of the infiltration basin, such as effective infiltration, recharge time, geometry and loading conditions (constant hydraulic head, variable hydraulic head). These simulations were carried out under the FEFLOW numerical model in both saturated and unsaturated zones, in order to test different solutions. The results of the simulations were then compared with those obtained using the Hantush analytical solution. These comparisons not only validated the model results, but also enabled us to carry out a sensitivity analysis of the validity range of the analytical solution by reproducing the different scenarios. This study presents an original approach both in terms of its methodology (analytical model, numerical model, application model) and its implementation in a basement zone and West African context.

The results show that simulations in saturated and unsaturated conditions are virtually identical. Most scenarios show a strong relaxation (1 to 2 days) after the injection time. The main parameters influencing recharge and relaxation are hydraulic conductivity, storage, unsaturated zone thickness and effective infiltration in the infiltration basin, while the hydraulic gradient has no significant influence. In addition, infiltration basins with variable hydraulic head (flow injection) performed better in terms of recharge (13 m difference) than basins with constant hydraulic heading. Finally, these results have enabled us to establish different hydraulic head curves as a function of different aquifer and seepage basin parameters, enabling effective inter-comparison.

Keywords: Basement area, FEFLOW, Infiltration basin, MAR, Modelling.

How to cite: Doulkom, P. A. M., Koïta, M., Rossier, Y., Vouillamoz, J.-M., Biaou, A. C., Lawson, F., Kafando, M. B., Yonaba, O. R., and Mounirou, L. A.: Evaluation of optimal conditions for managed aquifer recharge in the west African basement area., EGU General Assembly 2024, Vienna, Austria, 14–19 Apr 2024, EGU24-16890, https://doi.org/10.5194/egusphere-egu24-16890, 2024.

EGU24-17047 | ECS | Posters on site | HS8.2.1 | Highlight

Evaluation and modelling of the impact of drought on groundwater reserves in Wallonia in the context of climate change 

Julien Hutzemakers, Philippe Orban, Guillaume Vandelois, Alain Dassargues, Pascal Goderniaux, and Serge Brouyère

Climate change has started to impact water resources in many regions and countries. Extreme events 
have become more frequent, with, in particular, severe winter or summer droughts that may affect 
groundwater reservoirs which are essential for drinking water. The exceptionally arid winters of 2016 
and 2017 in Wallonia (Belgium) opened discussions on the necessity to develop tools and indicators 
that allow quantifying such impacts and modelling the responses of aquifer systems to such events.


In this context, the objective here is to describe the methodology that has been developed in
Wallonia (Belgium). The approach relies on numerical groundwater flow models used to obtain 
trends in piezometric levels and groundwater balances using different specific drought scenarios.
Modelling results are used to compute spatial maps of maximal piezometric drawdowns and 
recovery times by comparing baseline and drought scenarios. Adopting a flow budget perspective, 
groundwater flow modelling results are also used to quantify indicators reflecting relative shifts in 
water transfers between aquifer recharge, rivers, adjacent aquifers and exploited groundwater water 
resources. 


The approach is illustrated using different strategic regional aquifers of Wallonia modelled using 
various numerical groundwater flow models able to compute groundwater budgets and simulate 
both the partially saturated and fully saturated zones of aquifers and the interactions with surface 
water courses. To assess the resilience of the groundwater bodies, three different scenarios were 
simulated: the first entailed a series of years with typical recharge levels, the second involved three 
consecutive years with the same recharge as in 2016-2017, followed by years with standard recharge 
rates, and the third replicated the second scenario but follows the three arid years with an 
exceptionally wet year.


Collectively these methodologies yield a better comprehension of drought impacts at a regional scale
both in terms of spatial variability and large-scale water transfers.

How to cite: Hutzemakers, J., Orban, P., Vandelois, G., Dassargues, A., Goderniaux, P., and Brouyère, S.: Evaluation and modelling of the impact of drought on groundwater reserves in Wallonia in the context of climate change, EGU General Assembly 2024, Vienna, Austria, 14–19 Apr 2024, EGU24-17047, https://doi.org/10.5194/egusphere-egu24-17047, 2024.

EGU24-17101 | ECS | Orals | HS8.2.1

Interaction of surface water and groundwater on agricultural plots: Insights from field measurements and numerical modelling 

Deep Chandra Joshi, Christian Hildmann, Rainer Schlepphorst, and Beate Zimmermann

Understanding the interactions between ditch water levels, soil water and groundwater levels in drained lowlands is crucial for agricultural management, particularly under climate change with an increase both in flooding frequency and severity in winter and water scarcity for crop production in the vegetation season. The optimum quantity of water in the subsurface soil is the base for high yields, both on fields and on grassland. Water retention with weirs or sills in the ditches is a possible way to improve water availability in the adjacent areas. The aim of our study is to clarify the influence of ditch water management on groundwater dynamics and by this on soil water content.

Observations were conducted over a transect near Werenzhain, a Lusation village (Germany, south of Brandenburg). Field measurements encompassed the collection of meteorological data essential for calculating potential evapotranspiration. Soil water content was meticulously monitored at various depths (10, 20, 30, 40, 60, and 100 cm), alongside soil tension measurements at depths of 30, 60, 90, and 120 cm. In the laboratory, soil hydraulic properties, texture, and bulk density were measured for these corresponding depths. Additionally, fluctuations in the groundwater level during the study period were observed down to 300 cm. First, measured groundwater levels were simulated using HYDRUS 2D to obtain the dynamics between ditch water and shallow groundwater. Thereafter, different sets of ditch water levels were used to predict the soil water and groundwater levels for vegetation season. Our approach successfully simulated data with observed soil water content, soil water tension, and groundwater level throughout the study period. Further, we could model scenarios for an optimized ditch water level management.

How to cite: Joshi, D. C., Hildmann, C., Schlepphorst, R., and Zimmermann, B.: Interaction of surface water and groundwater on agricultural plots: Insights from field measurements and numerical modelling, EGU General Assembly 2024, Vienna, Austria, 14–19 Apr 2024, EGU24-17101, https://doi.org/10.5194/egusphere-egu24-17101, 2024.

EGU24-17454 | ECS | Orals | HS8.2.1

Factors influencing the subsurface urban heat island in the city of Wrocław (Poland) 

Monika Hajnrych and Magdalena Worsa-Kozak

The growing average air temperature and rapid urbanization deepen the urban heat island (UHI) phenomenon, which mainly affects large cities. Urban areas contribute to changes in the local atmospheric environment but also groundwater. The impact of these changes on the thermal regime of groundwater is documented all over the world by the increased temperature of groundwater in city centers compared to the surrounding rural areas. However, this relationship as well as the impact of other factors on the subsurface urban heat island (SUHI) are not yet well understood. In the case of the city of Wrocław, characterized by an increase in average temperatures in recent decades and the identified UHI phenomenon, present-day the phenomenon of SUHI is unknown.

This work focuses on the analysis of maps of the spatial distribution of groundwater temperature in the city of Wroclaw (Poland), obtained using spatial interpolation. For this purpose, measurement data from 2004-2005 and 2022-2023 were used. In addition, an attempt has been made to compare the distribution of groundwater temperature with the Land Surface Temperature (LST) for each of the periods. In the next part of the work, the relationships between groundwater temperature and other factors such as: distance from the city center, distance from rivers, LST and UHI were determined. Generalized linear regression was used to indicate which factors influence the subsurface urban heat island (SUHI). The highest rate was given to the distance from the city center (R2=0.49).

How to cite: Hajnrych, M. and Worsa-Kozak, M.: Factors influencing the subsurface urban heat island in the city of Wrocław (Poland), EGU General Assembly 2024, Vienna, Austria, 14–19 Apr 2024, EGU24-17454, https://doi.org/10.5194/egusphere-egu24-17454, 2024.

EGU24-17853 | Orals | HS8.2.1

Efficient surrogate-based multi-objective optimisation for sustainable island groundwater management 

Domenico Bau, Weijiang Yu, Alex Mayer, and Mohammadali Geranmehr

Computational burden, resulting from intensive executions of simulators during optimisation, often hinders the application of the simulation-optimisation (SO) methods for deriving optimal pumping schemes in coastal groundwater management, and impedes conducting sensitivity analysis of optimal pumping strategies to management constraints. For quickly identifying optimal pumping strategies under various constraints, this study develops an efficient framework, where adopting a lower-resolution simulator generates data to build surrogate models with a novel offline training algorithm and then applying a global optimization algorithm to determine optimal solutions according to the surrogate predictions. Traditional offline training approach involves developing surrogates before optimisation, often using training datasets that cover the input space either uniformly or randomly, which can prove inefficient due to potential oversampling of low-gradient areas and under-sampling of high-gradient areas. This study proposes an iterative search algorithm that efficiently selects training points by first scoring each unknown point based on its distance to the closest training point and the gradient of the surrogate estimate and then choosing the input candidate with the maximum score as the next sampling point. The proposed surrogate-based optimisation framework is applied to solve a two-objective groundwater management problem formulated on a three-dimensional island aquifer, using hydrogeological conditions representative of San Salvador Island, Bahamas. The goal is to minimize the operation cost resulting from groundwater pumping and desalination, while maximizing the amount of qualified groundwater supply, subject to constraints on seawater intrusion (SWI) control, expressed in terms of aquifer drawdown and salt mass increase in the aquifer.
Gaussian Process (GP) techniques are employed to construct model surrogates, predicting management objectives and constraint values, alongside quantifying associated uncertainties. By conducting repeated Monte Carlo simulations using these GP models, it becomes possible to ascertain the probability of Pareto optimality for each pumping scheme. Derived optimal pumping schemes are characterized by the Pareto-optimal probabilities and validated by the higher-resolution simulator. Results indicate that the proposed surrogate-based multi-objective optimisation framework can efficiently provide trustable optimal pumping schemes and be used to analyse the sensitivity of optimal groundwater supply cost to the constraints.

How to cite: Bau, D., Yu, W., Mayer, A., and Geranmehr, M.: Efficient surrogate-based multi-objective optimisation for sustainable island groundwater management, EGU General Assembly 2024, Vienna, Austria, 14–19 Apr 2024, EGU24-17853, https://doi.org/10.5194/egusphere-egu24-17853, 2024.

Public water suppliers face challenges due to climate change that are increasingly difficult to predict. Although climate models predict slightly increasing or at least constant groundwater recharge rates across most regions of Germany in the long-term future (until 2100), extreme weather events can cause both significant natural and technical supply fluctuations. These, together with peak demand in times of drought, can lead to serious water supply shortages.

In this project, water supply companies and research institutions cooperate to develop adaptation strategies and management models for future drinking water supplies. One goal is to develop and evaluate new operating concepts and possible adaptation strategies for water production from bank filtrate. Using detailed groundwater models, the effects of flood and low flow scenarios on bank filtration are examined.

In a second step, a concept for sustainable groundwater enrichment for bank filtration was developed based on the spatial and resource use analysis. Simulations of groundwater flow were used to evaluate how managed aquifer recharge (MAR) can help to simultaneously ensure sustainable groundwater withdrawals for public water supply as well as agriculture, while at the same achieving nature conservation and flood protection. We conclude, MAR can be used to reduce potential conflicts between different human water demands and ecological conservation by stabilizing land-based groundwater levels.

How to cite: Riedel, T. and Ridavits, T.: Managed aquifer recharge to ensure sustainable groundwater abstraction under extreme drought conditions, EGU General Assembly 2024, Vienna, Austria, 14–19 Apr 2024, EGU24-18093, https://doi.org/10.5194/egusphere-egu24-18093, 2024.

EGU24-20071 | Orals | HS8.2.1

Mitigation strategies against seawater intrusion in the context of climate change 

Paolo Salandin, Enrica Belluco, Matteo Camporese, Elena Crestani, Giovanna Darvini, Pietro Giaretta, and Giulia Mazzarotto

In coastal regions, where about 40% of world population is settled, freshwater aquifers are affected by a saltwater intrusion. The presence of elevate salt concentrations, among the most common pollutants in groundwater aquifers, represents a world-wide spread problem for coastal areas, such as Mediterranean coasts, both East and West coasts in the U. S., Gulf of Mexico and Middle East coasts. The seriousness of the situation is enhanced by the high demand of water supply, especially in the drier periods, and by the mean sea-level rise due to climate change. So that seawater will encroach farther inland and will threaten the available fresh groundwater supply, affecting not only human livelihood, but also coastal ecosystems. The form and transformation of the seaward hydraulic gradient of the aquifer and a constant freshwater discharge into the sea are fundamental in order to control the rate of intrusion.

To maintain the seaward gradient in the system the aquifer may be artificially recharged by freshwater by increasing the inland piezometric heads. The purpose of this solution is to create a hydraulic barrier against the inland flow of saline water by injecting freshwater in the vicinity of the shoreline. For phreatic aquifers both injection wells and surface spreading of water, such as irrigation, may be applied. Surface reservoirs, lakes and canals can be used as recharge systems for unconfined aquifers through freshwater infiltration (Hussain et al., 2019).

To assess the effectiveness of this mitigation approach and the amount of volumes of freshwater required, physical experiments are developed in a laboratory canal developed to reproduce a controlled heterogeneous porous media.

The sandbox measures 500 cm long by 30 cm wide by 60 cm high, with 3 cm thick plexiglass walls. Two tanks are located upstream and downstream from the sandbox, with volumes of about 0.5 m3 and 2.0 m3, respectively. The upstream tank is filled with fresh-water and is continuously supplied by a small pump, providing fresh-water recharge. The downstream tank is filled with salt-water, previously prepared by adding salt to fresh-water till a proper density is reached, and it represents the sea. This canal has been used in previous works (Bouzaglou et al., 2018, Crestani et al., 2022), but in the present the homogeneous porous media has been substituted by three different nominal size ranges of glass beads, equal to 0.3-0.4, 0.4-0.8 and 1.0-1.3 mm respectively, organized in 250 cells, each of size 20x30x5 cm3 to reproduce a prescribed statistical anisotropic structure.

The evidences deduced from the physical experiments developed simulating the seawater intrusion-retreat phenomenon due to drought periods are discussed in comparison with the results of a numerical model.

How to cite: Salandin, P., Belluco, E., Camporese, M., Crestani, E., Darvini, G., Giaretta, P., and Mazzarotto, G.: Mitigation strategies against seawater intrusion in the context of climate change, EGU General Assembly 2024, Vienna, Austria, 14–19 Apr 2024, EGU24-20071, https://doi.org/10.5194/egusphere-egu24-20071, 2024.

EGU24-20595 | Posters on site | HS8.2.1

Advances in hydrogeological knowledge of the island of El Hierro (Canary islands) through the construction of a 3D geological model 

Carlos Baquedano-Estévez, Miguel Ángel Marazuela, Jorge Martínez-León, Noelia Cruz-Pérez, Luis Enrique Hernández-Gutiérrez, Juan Carlos Santamarta, Almudena de La Losa, and Alejandro García-Gil

Due to the critical importance of groundwater in the Canary Islands, it is essential to understand and properly manage the water resources of these regions. Modelling of aquifer systems now provides valuable geoscientific information for their identification, protection and sustainable use. By means of a geological modelling procedure, using the GeoModeller programme, the first 3D geological model of the volcanic island of El Hierro has been produced. The 3D model was created from the Digital Terrain Model, geological maps, geological sections and lithological data from hydraulic works. Eleven formations covering the entire island have been identified, allowing the description and interpretation of the main hydrogeological units and known geological structures relevant to the regional scale. This 3D geological model will serve as the basis for developing, using the FEFLOW code, the first hydrogeological and geothermal model of the island, allowing progress to be made in the sustainability of the island's aquifers.

How to cite: Baquedano-Estévez, C., Marazuela, M. Á., Martínez-León, J., Cruz-Pérez, N., Hernández-Gutiérrez, L. E., Santamarta, J. C., de La Losa, A., and García-Gil, A.: Advances in hydrogeological knowledge of the island of El Hierro (Canary islands) through the construction of a 3D geological model, EGU General Assembly 2024, Vienna, Austria, 14–19 Apr 2024, EGU24-20595, https://doi.org/10.5194/egusphere-egu24-20595, 2024.

Climatology and hydrology depend significantly on the precise spatial characterization of their variables on continuous surfaces. The interpolation of hydrometeorological data emerges as an essential component, allowing for the estimation of values between observation points and facilitating the creation of detailed and comprehensive datasets. This process is crucial for understanding the climatic and hydrological conditions of watersheds. This work describes applying a methodology for the spatial estimation of meteorological variables through geospatial models.

The methodology includes data cleansing and validation to identify and correct outliers or errors, the assessment of model accuracy through cross-validation techniques, and a detailed analysis of the spatial and temporal variability of the data based on data availability in hydrometeorological stations.

A geostatistical analysis is conducted, adapted to the peculiarities of each measured hydrometeorological variable, considering relationships with other meteorological variables and secondary information such as altitude, latitude, longitude, and terrain aspect, using multivariable regressions. This improved the data estimation quality due to high correlations between variables.

The generation of data grids and their subsequent interpolation allow the creation of detailed maps of hydrometeorological variables in areas without monitoring stations, providing a more comprehensive and detailed view of environmental conditions. The uncertainty associated with the results is evaluated and presented to interpret the generated maps properly.

This study, conducted in a Colombian watershed, highlights the applicability of this methodology in basins with limited information. For this purpose, data and maps of temperature, evapotranspiration, and precipitation were generated at different space-time scales of interest, in addition to estimating multi-temporal potential recharge maps.

How to cite: Donado, L. D. and Mercado, O.: Generation of spatial grids for hydrometeorological data for estimation of groundwater recharge in tropical aquifers, EGU General Assembly 2024, Vienna, Austria, 14–19 Apr 2024, EGU24-20744, https://doi.org/10.5194/egusphere-egu24-20744, 2024.

EGU24-21756 | Posters on site | HS8.2.1 | Highlight

Addressing Water Scarcity in Texas: Evaluating Stormwater Quality and Quantity for Managed Aquifer Recharge 

Bridget Scanlon, John John Malito, and Sarah Fakhreddine

The use of stormwater for enhancing aquifer recharge has emerged as an innovative method of addressing increasing water scarcity in Texas. However, there is limited information on the potential (1) volumes of stormwater available for capture and (2) impacts of enhanced stormwater on groundwater quality. Specifically, the relationships between stormwater contaminant loading and various controlling factors have not been well characterized in Texas, along with the feasibility of stormwater capture. In this study we used publicly available datasets of streamflows and water quality to identify and inform opportunities for enhanced stormwater recharge in Texas aquifers. Further, we evaluated the potential availability of stormwater for capture. To do this, we evaluated publicly available water availability models (to ensure compliance with water rights) and environmental flow recommendations to reduce downstream ecological impacts. Statistical analyses show that individual site characteristics such as land cover likely impact various stormwater quality parameters including nutrients, metals, and microbial contaminants. The exact composition of stormwater quality can vary depending on the monitoring station and combination of different event, watershed, and site characteristics. Case studies of water quality in various stormwater recharge structures show that interim storage and partial pre-treatment of excess stormwater before injection can prevent degradation of groundwater quality. Furthermore, unappropriated high magnitude flows are often co-located with depleted major aquifers in Texas, including the Texas Gulf Coast and Trinity aquifers, underscoring the potential for using flood water for managed aquifer recharge to support sustainable water resources. Accordingly, this study provides a foundation for using large publicly available datasets to better understand and inform opportunities for enhanced stormwater recharge in Texas.

How to cite: Scanlon, B., John Malito, J., and Fakhreddine, S.: Addressing Water Scarcity in Texas: Evaluating Stormwater Quality and Quantity for Managed Aquifer Recharge, EGU General Assembly 2024, Vienna, Austria, 14–19 Apr 2024, EGU24-21756, https://doi.org/10.5194/egusphere-egu24-21756, 2024.

EGU24-21917 | ECS | Orals | HS8.2.1 | Highlight

Monitoring Dutch Peatland Subsidence Using InSAR – First Results 

Philip Conroy, Yustisi Lumban-Gaol, Simon van Diepen, Freek van Leijen, and Ramon Hanssen

Actively monitoring ground motion is of the highest importance in The Netherlands, a country in
which many of its regions lie below sea level. Water tables in the country have been managed
for centuries by using a system of dams, dikes and canals through which excess water can be
pumped away to allow for the prevention of flooding, and for the reclamation of submerged land.
However, the effects of centuries of active water management in the region have resulted in
significant land subsidence, and its effects are being felt as it is becoming a significant threat to
the future of the country as sea levels continue to rise [1].
This has created the need to monitor land surface motion at large spatial scales with frequent
temporal sampling. While InSAR is a promising candidate for such a task, the technique often
suffers from drastic losses of signal quality in the spring and summer months when used to
produce time series observations of peatlands. This significantly limits the effectiveness of
InSAR as a tool to monitor peatland surface dynamics [2,3,4].
We present the preliminary results of peatland surface motion using a novel InSAR processing
method which is designed to overcome the issues which have prevented its application over
northern peatlands in the past [5]. This work is the first large scale analysis of the Dutch Green
Heart region made with InSAR, providing land surface motion time series data at the parcel
scale for a 2000 km2 region with sub-weekly sampling over the period Jan. 2015 to Oct. 2023.
Our presentation will briefly outline the results, validation efforts and the various challenges
involved.
References
[1] G. Erkens, M. J. van der Meulen, and H. Middelkoop, “Double Trouble: Subsidence and CO2 Respiration Due to
1,000 Years of Dutch Coastal Peatlands Cultivation,” Hydrogeology Journal, vol. 24, no. 3, pp. 551–568, 2016.
[2] Y. Morishita and R. F. Hanssen, “Temporal decorrelation in L-, C-, and X-band satellite radar interferometry for
pasture on drained peat soils,” IEEE Transactions on Geoscience and Remote Sensing, vol. 53, no. 2, pp. 1096–
1104, 2015.
[3] Y. Morishita and R. F. Hanssen, “Deformation parameter estimation in low coherence areas using a multisatellite
InSAR approach,” IEEE Transactions on Geoscience and Remote Sensing, vol. 53, no. 8, pp. 4275–4283, 2015.
[4] L. Alshammari, D. J. Large, D. S. Boyd, A. Sowter, R. Anderson, R. Andersen, and S. Marsh, “Long-term peatland
condition assessment via surface motion monitoring using the ISBAS DInSAR technique over the flow country,
Scotland,” Remote Sensing, vol. 10, no. 7, 2018.
[5] P. Conroy, S. A. N. van Diepen, F. J. van Leijen, and R. F. Hanssen, “Bridging loss-of-lock in InSAR time series of
distributed scatterers,” IEEE Transactions on Geoscience and Remote Sensing, vol. 61, pp. 1–11, 2023

How to cite: Conroy, P., Lumban-Gaol, Y., van Diepen, S., van Leijen, F., and Hanssen, R.: Monitoring Dutch Peatland Subsidence Using InSAR – First Results, EGU General Assembly 2024, Vienna, Austria, 14–19 Apr 2024, EGU24-21917, https://doi.org/10.5194/egusphere-egu24-21917, 2024.

EGU24-434 | ECS | Orals | HS8.2.2

Sustainable Phosphate Mining: Hydrogeological Insights and Numerical Modeling of the Beni Amir Phosphate Deposit, Morocco 

Ouissal Heddoun, Anasse Ait Lemkademe, and Mostafa Benzaazoua

The phosphate mining from the Beni Amir deposit, located in the southern part of Central Morocco, presents many difficulties, due to the presence of groundwater, which can either partially or completely submerge the phosphate layers. This challenge becomes particularly pronounced in the context of climate change conditions and water scarcity.

To address these issues, a hydrogeological study has been conducted aiming to understand the aquifer’s function and ensure sustainable phosphate extraction from the deposit. Initially, geological, and hydrogeological information from 692 boreholes were collected and analyzed to develop a 3D hydro-stratigraphic conceptual model, which indicate that approximately 73% of the deposit is at least partially submerged by the groundwater, while the remaining 27% constitutes the dry zone.

Additionally, a numerical model was developed and calibrated using the MODFLOW code. Calibration was accomplished under both steady-state and transient conditions by adjusting model parameters until the model's solution aligns with known data, utilizing 580 observed groundwater levels measured in 2023 and 7 pumping wells. The model’s performance was evaluated using R2, RMSE, and NRMSE coefficients, showing high accuracy and consistent model performance.

The hydrogeological model was executed to evaluate the effects of the dewatering process in the surrounding mining areas, revealing a high impact on groundwater resources and the water table level. These findings will be employed to strategize well-considered plans for optimal groundwater pumping and mine dewatering strategies, ensuring the safety of mining operations throughout different stages of mine development.

How to cite: Heddoun, O., Ait Lemkademe, A., and Benzaazoua, M.: Sustainable Phosphate Mining: Hydrogeological Insights and Numerical Modeling of the Beni Amir Phosphate Deposit, Morocco, EGU General Assembly 2024, Vienna, Austria, 14–19 Apr 2024, EGU24-434, https://doi.org/10.5194/egusphere-egu24-434, 2024.

In cases where the excavation depth reaches the groundwater level as a result of open-pit surface mining operations, open mine pit lakes (MPL) form by the discharge of groundwater to the surface. Processes known to affect the MPL chemistry include groundwater inflow, direct precipitation, pit wall-precipitation contact, groundwater-wall rock interaction, evaporation, and other geochemical and limnological processes taking place within the MPL. While changing the hydrogeological system, mining activities might also affect the groundwater chemistry. Degradation of groundwater quality might occur as a result of the interaction between wall-rock and groundwater within the MPL. For this reason, the chemical characteristics of these mine lakes should be revealed in order to protect the groundwater systems and also before using the water inside MPL’s for different purposes like irrigation. Kesikköprü Dam is a dam located in Bala district of Ankara province, the capital of Türkiye, and has been providing drinking water to Ankara in recent years. Although mining activities have been carried out around this dam since the 1950s, where one of Turkey's richest iron deposits is located, no hydrogeological or hydrogeochemical studies have been carried out prior to this study. Therefore, the aim of this study is to evaluate the hydrogeochemical and stable isotopic characteristics of the mine lakes formed as a result of iron mining activities around Kesikköprü Dam. Within this study, three MPL’s were evaluated whose surface areas range from 0.27 ha to 0.92 ha. The pH and Electrical Conductivity values of these three lakes vary between 8.47-8.58 and 883-2500 µS/cm, respectively. According to the major ion chemistry analyses results, Na, Ca and Mg are the dominant major cations and SO4 and HCOare the dominant major anions. The major ion chemistry of these lakes have been influenced by reverse ion exchange processes. The MPL waters are oversaturated with respect to certain minerals like dolomite, aragonite, calcite and magnesite. There is dissolved arsenic in concentrations up to 16 µg/l. Dissolved arsenic is found in the form of pentavalent arsenic (As5+). The stable isotopes of hydrogen and oxygen suggest that there is evaporation from the lake surfaces and the isotopic signatures of MPL water samples prior to evaporation unveiled that there is contribution of groundwater inflow from a shallow groundwater system in the area. The abandoned MPLS’s should be rehabilitated so as to prevent exposure of the groundwater systems which become vulnerable to contaminatation.

Keywords: Open Mine Pit Lakes; Hydrogeochemistry; Stable Isotopes; Dissolved arsenic; Kesikköprü Dam, Ankara; Türkiye

How to cite: Arslan, Ş. and Yurttaş, O.: Hydrogeochemical And Isotopic Assesment of The Open Mine Pit Lakes Near Kesikköprü Dam Area, Türkiye, EGU General Assembly 2024, Vienna, Austria, 14–19 Apr 2024, EGU24-476, https://doi.org/10.5194/egusphere-egu24-476, 2024.

EGU24-580 | ECS | Orals | HS8.2.2

Evaluation of the Hydrogeochemical Characteristics and Heavy Metals Contamination Levels of Shallow Groundwater in the Bafia Agricultural Area, Centre Region Cameroon. 

Carine Enow-Ayor Tarkang, Victorine Neh Akenji, Dmitri Rouwet, Josephine Ndjama, Andrew Ako Ako, Franco Tassi, and Jules Remy Ndam Ngoupayou

Shallow groundwater is an important resource within the framework of potable, continuous, and reliable water supply in the whole of Cameroon, particularly in Bafia, where there is a limited supply of piped-borne water. Increased population and intense agriculture, which involves the use of diverse agrochemicals, make it crucial to assess groundwater quality both for present and future use. The objectives of this study are to (a) identify the major seasonal hydrogeochemical processes, (b) determine groundwater quality with potential health risks and (c) assist local communities and water resource managers to sustainably manage the resource.  57 water samples (31 wells, 20 boreholes, 4 rivers and 2 springs) were collected, filtered, acidified with HNO3 and analyzed for major ions by Ion chromatography (samples for anions were not acidified) and heavy metals content by ICP-MS (Fe, Co, Ti, Sr, Sb, Al, Cr, Cu, Pb, Ni, As, Zn, Mn, Se, Sn, B, Cd). Results show that groundwater is acidic to neutral, soft to very hard, and generally fresh. Major ion concentrations increased from the rainy to the dry season and were within WHO limits (but for a few). The study shows that albite/anorthite, calcite/dolomite, and ion exchange contribute significantly to the major ion concentration in the study area. The 3 major water facies identified in the rainy season are the Ca-Mg-HCO3,Ca-Mg-Cl, and Na-Cl types; while two water types are identified in the dry season, including the Ca-Mg-HCO3 andCa-Mg-Cl types, with mixing types like Ca-Mg-SO4-Cl and Na-K-HCO3. Results of heavy metals analyses show that most of the metals are within and some below WHO limits, while high Ti, Mn, Al, Fe, and Sr concentrations were observed in most samples. The heavy metal concentration was evaluated using indices like heavy metal pollution index (HPI), heavy metal evaluation index (HEI), and degree of contamination (Cd). The mean values of HPI and Cd (741 and 5 respectively) exceeded the critical limit, indicating highly contaminated water samples. Based on the HPI and Cd, 93% and 35% of the samples respectively are unacceptable for drinking purposes. Major ions PCA reveals 4 factors; the first is a result of natural processes with silicate weathering and the second reveals anthropogenic influences, mainly fertilizer input. The first factor for heavy metals reveals high pollution from inorganic fertilizers while the second shows water-rock interactions. Agricultural activities have a great impact on the water chemistry around the area; hence, it is recommended that a periodic and systematic study be carried out regularly, especially for the heavy metal concentrations. The study is the first of its kind to provide insight into heavy metals as well as an in-depth evaluation of hydrogeological processes influencing groundwater in the area and thus can offer a valuable reference point for the design of suitable techniques to manage groundwater resources.

How to cite: Tarkang, C. E.-A., Akenji, V. N., Rouwet, D., Ndjama, J., Ako Ako, A., Tassi, F., and Ndam Ngoupayou, J. R.: Evaluation of the Hydrogeochemical Characteristics and Heavy Metals Contamination Levels of Shallow Groundwater in the Bafia Agricultural Area, Centre Region Cameroon., EGU General Assembly 2024, Vienna, Austria, 14–19 Apr 2024, EGU24-580, https://doi.org/10.5194/egusphere-egu24-580, 2024.

EGU24-750 | ECS | Orals | HS8.2.2

Impact of land-use management and climate variability on hydrological responses of representative groundwater spring typologies in Eastern Himalaya 

Manish Kumar, Sumit Sen, Shrinivas Badiger, Himanshu Kulkarni, and Jagdish Krishnaswamy

In a first-of-its-kind study from Eastern Himalaya, we analysed the relative controls of vegetation, precipitation, soil properties, and hydrogeology on the diurnal and seasonal variability in three representative groundwater springs typologies using high-resolution discharge data. The three springs, Gaddi- a Fracture spring with forest land-use, Mamley - a Karst spring with forest and agriculture land-use and Kamrang - a Depression spring with agriculture land-use, together provide water security to over 600 households in South District, Sikkim, India, and are managed by local community organisations.

Based on hydrogeological traverse mapping and master recession curve (MRC) analysis, we categorised the Kamrang as a high-discharge depression spring fed by a relatively homogenous aquifer with uniformly high transmissivity (Ts) and storage (St) displaying a gradually decreasing smooth recession curve. Conversely, Mamley has a relatively larger springshed area fed by a smaller homogenous aquifer with two components: a low Ts and low St component possibly situated in the upper phyllite-quartzite beds and a high Ts and low St sitting in the karst environment. Similarly, Gaddi has the largest springshed area covered with dense oak forests overlaying a nearby shallow aquifer with high Ts which empties faster than the main distant aquifer body with low Ts. All three springs were classified as highly variable (Coefficient of variability, Cv > 40 %). Annually, Kamrang (95±22 %) showed the highest variability followed by Gaddi (88±7 %) and Mamley (72±41 %). However, in winter Kamrang and Gaddi showed very stable flows (Cv > ~20 %) whereas Mamley had higher variability (Cv > 30%). In summers, Gaddi showed much higher fluctuations (Cv > 40%) than Kamrang and Mamley.

Strong yet contrasting diel fluctuations in discharge were observed with significantly higher amplitude in the depression spring (Kamrang, 19±16 l min-1) and the fracture spring (Gaddi, 12±10 l min-1) than in the karst spring (Mamley, 7±14 l min-1). The daily troughs in diel discharge occurred early in Mamley (1600 h) followed by Gaddi (1700 h) and Kamrang (2000 h), largely attributed to daily evapotranspiration-related abstraction. Mamley recovered almost instantaneously compared to Kamrang and Gaddi, both of them peaking in the morning (1000 h). Among agriculture-dominated springsheds, relatively high Ts along with moderate saturated soil hydraulic conductivity (Ksat.soil) resulted in lower lag-time in Mamley than Kamrang, which had similarly high Ts but lower Ksat.soil. On the contrary, the lag-time was longest in forest-dominated Gaddi, with the lowest Ts and Ksat.soil. The forest land-use may also have influenced the contrasting observations of Gaddi spring discharge responding faster to high-intensity and low-moderate volume rainfall than agriculture-dominated Kamrang and Mamley. Thus, any land-use change negatively affecting Ksat.soil, such as compaction through grazing and topsoil erosion, is likely to have strong negative effects on the longevity of the spring. On the other hand, fracture springs like Gaddi, fed by a larger catchment, are likely to be immune from the effects of small-scale land-use changes. Our results suggest that any future changes in the precipitation patterns and land-use may significantly impact spring behaviour in the Himalaya.

How to cite: Kumar, M., Sen, S., Badiger, S., Kulkarni, H., and Krishnaswamy, J.: Impact of land-use management and climate variability on hydrological responses of representative groundwater spring typologies in Eastern Himalaya, EGU General Assembly 2024, Vienna, Austria, 14–19 Apr 2024, EGU24-750, https://doi.org/10.5194/egusphere-egu24-750, 2024.

EGU24-934 | ECS | Orals | HS8.2.2 | Highlight

Connecting the dots: groundwater temperature data as a key element in Climate Change conversation 

Elena Egidio, Domentico Antonio De Luca, and Manuela Lasagna

As our planet faces the complex challenges of global climate change, understanding and effectively communicating critical environmental indicators becomes critical. This study explores the importance of monitoring and reporting variation of groundwater temperature as a key component in understanding the broader implications of climate change.

Groundwater, a key reservoir of the Earth's freshwater, plays a crucial role in moderating surface temperature and sustaining ecosystems. However, its temperature dynamics remain poorly studied despite its fundamental influence on groundwater dependent ecosystems and geothermal processes.

This research synthesises groundwater temperature data from 15 different monitoring wells located in the unconfined shallow aquifer, consisting of gravel and sand, of Piedmont Po plain (NW Italy).
Daily groundwater temperature data, available from 2010 onwards, were analysed and statistical elaboration performed evaluating the trend and the temperature anomalies.
The regional distribution of mean monthly groundwater temperatures varied 7.7 and 14.0 ◦C and showed a general increase of the value up to 2.1 °C/10 years.
Because the findings underline the urgent need for improved data communication strategies to disseminate valuable information to policy makers, researchers and the society, a proposal of dissemination approach is proposed in the paper.

By illustrating and communicating the intricate interplay between groundwater temperature and climate change, this research aims to facilitate informed decision-making and promote a proactive approach towards climate resilience. The study not only contributes to the expansion of knowledge on climate science and groundwater impacts, but also underlines the imperative of easy and accessible reporting of data in addressing the multiple challenges posed by a rapidly changing global climate.

How to cite: Egidio, E., De Luca, D. A., and Lasagna, M.: Connecting the dots: groundwater temperature data as a key element in Climate Change conversation, EGU General Assembly 2024, Vienna, Austria, 14–19 Apr 2024, EGU24-934, https://doi.org/10.5194/egusphere-egu24-934, 2024.

EGU24-941 | ECS | Posters on site | HS8.2.2

Investigating the groundwater contribution to the lakes and streams by environmental tracers in the catchment area of Lake Velence (Hungary)  

Viktória Pénzes, Anita Erőss, Katalin Hegedűs-Csondor, Petra Baják, Ákos Horváth, and György Czuppon

Lake Velence is a shallow soda lake, the third largest natural lake in Hungary. The lake’s water level has been decreasing and the water quality has been declining in recent years. The shallow depth of the lake makes it more susceptible to droughts and evaporation. Climate change in Hungary will likely cause these phenomena to be more common in the future. In the lake’s water budget, only the surface water components and precipitation are considered. Revisiting the water management in the area is necessary for the local ecosystem and tourism industry. We intend to aid the efforts of the authorities and locals to stop the deterioration of the lake with exploring the surface water-groundwater interactions in the area using natural tracers. Groundwater may buffer the effects of climate change, which highlights the importance of the study. 

Groundwater mapping in the area proved that the lake is at the discharge point of local groundwater flow systems. In this previous study, similar uranium activity concentrations were also measured in the lake water and in groundwater samples collected by the lake indicating a close interaction between the lake and the groundwater.  

To further investigate this question, water samples were collected from different water sources in the catchment area of Lake Velence: from the lake, inflow streams, an artificial reservoir, and groundwater wells. The samples were analysed for stable isotopes δ2H and δ18O. Furthermore, 234U, 238U, 226Ra ,228Ra and 222Rn activity were measured by an innovative technique: alpha spectrometry applied on selectively adsorbing Nucfilm discs. Both the stable and the radioisotopes function as environmental tracers in this study to collect thorough evidence about the contribution of groundwater in the water budget of Lake Velence and in the inflowing streams. This will contribute to the sustainable water management of the whole catchment area of the Lake Velence by highlighting the role of groundwater.  

The research was supported by the János Bolyai Research Scholarship of the Hungarian Academy of Sciences and the research was funded by the National Multidisciplinary Laboratory for Climate Change, RRF-2.3.1-21-2022-00014 project. 

How to cite: Pénzes, V., Erőss, A., Hegedűs-Csondor, K., Baják, P., Horváth, Á., and Czuppon, G.: Investigating the groundwater contribution to the lakes and streams by environmental tracers in the catchment area of Lake Velence (Hungary) , EGU General Assembly 2024, Vienna, Austria, 14–19 Apr 2024, EGU24-941, https://doi.org/10.5194/egusphere-egu24-941, 2024.

EGU24-1032 | ECS | Posters on site | HS8.2.2

Identification of groundwater recharge zones using comparative analysis of drainage networks 

Sourav Sundar Das, Arun Kumar Saraf, and Ajanta Goswami

Groundwater, being limited extent in hardrock terrain is undeniably a precious resource for livelihood. In the hardrock terrain of Bundelkhand, India where seasonal rainfall is mostly discharged through surface runoff, it is necessary to check and delay the surface runoff to mitigate water table decline caused due to overgrowing demand for groundwater as to drinking and irrigation purposes. The objective of this study is to identify suitable places for groundwater recharge where the process of recharge to the groundwater offers optimum results as per the prevailing hydrogeological conditions. This objective has been achieved by remote sensing and GIS based techniques using DEM and toposheet of the Narain watershed of the Bundelkhand region. In this present study a comparative analysis has been carried out by superimposing drainage network extracted from the toposheet over simulated drainage network derived from the DEM to visualise the clustering tendency of the two data sets. The comparative analysis reveals a mismatch of the two datasets at some places having randomness number less than 1 indicating potential groundwater recharge zones. Such mismatch has appeared at places where the degree of infiltration is significant enough to divert the course of the existing drainage network from the simulated one because of the assumption of the surface to be insulated. This study proves to be a quick reliable method for the identification of groundwater recharge zones for hard rock terrain.

How to cite: Das, S. S., Saraf, A. K., and Goswami, A.: Identification of groundwater recharge zones using comparative analysis of drainage networks, EGU General Assembly 2024, Vienna, Austria, 14–19 Apr 2024, EGU24-1032, https://doi.org/10.5194/egusphere-egu24-1032, 2024.

Deep groundwater extraction alters both the reservoir's hydraulic and hydrochemical state. Although deep groundwater is part of the hydrologic cycle, it is considered a limited resource regarding the original hydrochemical composition and age structure. Mineral water producers share the privilege to use this resource for commercial purposes. Here, geological protection against surface influences and highly constant hydrochemical conditions are legally required.

This study evaluates the development of a deep groundwater aquifer that has been used for bottled water production since the 1900s. Production stopped in late 2019, offering the unique opportunity to study the recovery of the aquifer. Detailed data from the past 40 years show a hydrochemical stratification in the mineral water aquifer with salinity and age increasing with depth. The saltwater horizon seems to have been lowered significantly due to extraction, and the hydraulic potential has also decreased. A connection to shallow groundwater was confirmed through the detection of herbicide metabolites. Isotope activities and metabolite concentrations indicate that the travel times are between 5-10 years.

After the shutdown of the operation, the hydraulic potential increased and some of the wells are now again artesian. In the first analyses of the hydrochemical conditions the deepest wells reveal increasing salinity and CO2 concentrations. This indicates that the saltwater horizon is now moving upwards. The shallower wells, however, still show slightly decreasing salinity and are far away from the original hydrochemical composition. This indicates that the water extraction at this site has to be considered a mining operation.

The measurements of the hydraulic and hydrochemical development together with an investigation of the flow paths for the recharge will allow an assessment of the sustainability of the groundwater extraction at this and other sites.

How to cite: Hegels, M. and Baumann, T.: Depletion of a Mineral Water Aquifer – Implications on Sustainable Groundwater Management, EGU General Assembly 2024, Vienna, Austria, 14–19 Apr 2024, EGU24-1888, https://doi.org/10.5194/egusphere-egu24-1888, 2024.

EGU24-2954 | ECS | Orals | HS8.2.2

Groundwater flow components and environmental problems in a groundwater flow system, center-west Mexico 

Selene Olea Olea, Aurora Guadalupe Llanos Solis, Morales-Casique Eric, Medina-Ortega Priscila, Armas Vargas Felipe, Ariadna Camila Salgado Albiter, Betsabé Atalía Sierra García, and Lorena Ramírez González

The Cuitzeo groundwater flow system in central Mexico is facing challenges due to intensive groundwater extraction, nitrate pollution, and a decline in groundwater levels. To understand the processes underlying these environmental impacts, we used compiled data from 2013 and employed cluster analysis to identify distinct groups. Four groups were identified based on flow trajectories, incorporating geological information, structural features, and hydrochemical diagrams such as Piper, Gibbs, and Mifflin.

The determined flow trajectories or components consist of local, intermediate, and two regional components. The spatial distribution of these flow components is associated with recharge areas and structural features, displaying a non-sequential evolution to groundwater flow direction.

This work presents preliminary findings from the analysis of environmental problems such as nitrates and a decrease in groundwater levels, contributing to an enhanced understanding of the origins of these impacts and offering insights for future solutions.

How to cite: Olea Olea, S., Llanos Solis, A. G., Eric, M.-C., Priscila, M.-O., Felipe, A. V., Salgado Albiter, A. C., Sierra García, B. A., and Ramírez González, L.: Groundwater flow components and environmental problems in a groundwater flow system, center-west Mexico, EGU General Assembly 2024, Vienna, Austria, 14–19 Apr 2024, EGU24-2954, https://doi.org/10.5194/egusphere-egu24-2954, 2024.

EGU24-3267 | ECS | Orals | HS8.2.2

The hydraulic and chemical evolution of groundwater-fed pit lakes following mine closure 

Birte Moser, Peter Cook, Tony Miller, Shawan Dogramaci, and Ilka Wallis

When an open pit mine closes, dewatering to keep the pit dry ceases, causing the water table to start recovering. In arid and semi-arid climates, hydraulic recovery is often predominantly governed by groundwater inflow into the former mine pit and evaporation from the developing pit lake. Low hydraulic conductivities and low hydraulic background gradients as well as high net evaporation rates can cause pit lakes to remain ‘terminal sinks’, i.e., groundwater enters the pit while outflow only occurs via evaporation. With time the ambient hydraulic gradient re-establishes and may cause pit lake water to exit into the adjacent aquifer, transforming the pit into a ‘throughflow system’. Due to prolonged residence times and evapoconcentration, the pit lake water quality may deteriorate as the salinity increases, a specific problem in arid and semi-arid regions, such as the extensive mining regions of Western Australia. Knowing whether a pit lake remains a terminal sink or transitions into throughflow systems is important for mine closure management as the pit lake water quality might decline to a lesser extent under throughflow conditions compared to terminal sinks as residence times of pit lake water decrease with higher outflow rates. Nevertheless, downgradient aquifers might be affected by exiting pit lake water in throughflow systems. Terminal sinks, however, may, over time affect local aquifer systems also: with increasing salinity due to evapoconcentration, the pit lake water becomes denser and may leak along the density gradient into the less dense groundwater.

This work improves the basic understanding of processes that occur during the hydraulic and geochemical evolution of pit lakes after mine closure. The timeframe for transformation from terminal sink to throughflow system, the salinity concentrations in pit lakes and the shape of salinity plumes are investigated through numerical modelling. Furthermore, the impact of density-driven flow under varying environmental factors is explored.

Opposed to what often is intuitively expected to happen in arid climates, it was found that the transformation from terminal sinks to throughflow systems happens frequently and quickly (< 20 years) after the mining operation ceases under a wide range of hydrogeological site conditions. This is while the groundwater heads are still recovering. The evolution of salinity in the evolving pit lake and surrounding aquifers is thereby largely dependent on the initial concentration of surrounding groundwater. When the initial concentrations are low, density-driven flow has no substantial effect over the simulation time of 500 years. However, when the initial groundwater concentration is higher (e.g., TDS > 1500 mg/l) the impact of density-driven flow is significant and higher concentrations in the pit lake see larger impacts on the adjacent aquifer.

Forecasting the hydraulic and geochemical conditions of pit lakes post-mining is essential for mine closure planning and fundamental knowledge to determine any potential use of post-mining landscapes.

How to cite: Moser, B., Cook, P., Miller, T., Dogramaci, S., and Wallis, I.: The hydraulic and chemical evolution of groundwater-fed pit lakes following mine closure, EGU General Assembly 2024, Vienna, Austria, 14–19 Apr 2024, EGU24-3267, https://doi.org/10.5194/egusphere-egu24-3267, 2024.

EGU24-3297 | ECS | Orals | HS8.2.2

Stagnation and pseudostagnation lines for separating 3D groundwater flow systems in Tothian basins 

Zhi-Yuan Zhang, Xiao-Wei Jiang, Peng-Yu Zhou, Okke Batelaan, Xu-Sheng Wang, Peng-Fei Han, and Li Wan

Stagnation points have been found to be useful in characterizing groundwater flow regimes in 2D or 3D domains. However, in 3D basins with complicated water table undulation and/or fluctuation, knowledge on stagnation points is limited. In this study, we first derived transient solution of basinal flow under spatially undulating and periodically changing water table in 3D Tóthian basins and examined the occurrence of stagnation points. Based on the analysis of groundwater flow systems distribution in simple 3D basins, we extend the method of delineating groundwater flow systems in 2D profiles using stagnation points to delineating 3D groundwater flow systems using stagnation or pseudostagnation lines, which consist of a series of stagnation or pseudostagnation points. This novel approach was successfully applied to 3D synthetic basins with more complex water table configuration (with undulations in all directions). Based on the transient hydraulic head solution in 3D Tóthian basins with a periodically fluctuating water table, it was found that the evolution of (pseudo)stagnation lines are controlled by the combination of hydraulic diffusivity and the period of the water table fluctuation, both of which determine the dimensionless response time. The change in shape of (pseudo)stagnation lines, induced by spatial undulations and/or temporal fluctuations of the water table, also reflects the variation of groundwater flow systems in penetration depth and horizontal range. The method proposed here improves the efficiency of partitioning groundwater flow systems in 3D domains, and our analytical study of (pseudo)stagnation lines partially fills the knowledge gap between stagnation points and stagnation zones.

How to cite: Zhang, Z.-Y., Jiang, X.-W., Zhou, P.-Y., Batelaan, O., Wang, X.-S., Han, P.-F., and Wan, L.: Stagnation and pseudostagnation lines for separating 3D groundwater flow systems in Tothian basins, EGU General Assembly 2024, Vienna, Austria, 14–19 Apr 2024, EGU24-3297, https://doi.org/10.5194/egusphere-egu24-3297, 2024.

EGU24-3797 | ECS | Orals | HS8.2.2

Multivariate statistical analysis of groundwater geochemistry to characterize flow in the Kurikka buried valley aquifer system, Western Finland 

Marie-Amélie Pétré, Niko Putkinen, Timo Ruskeeniemi, and René Lefebvre

The Kurikka buried valley aquifer system (Western Finland) contains significant groundwater resources in coarse-grained sediments alternating with till layers. Over the past 10 years, this multilayered aquifer system has been the object of growing interest to increase the water supply to the towns of Vaasa, Kurikka and nearby municipalities. In this context, it is important to understand the groundwater flow system to assess its sustainable exploitation rate and implement sustainable management of this resource. The goal of this study was to assess groundwater quality in the Kurikka aquifer system and interpret the geochemical data to better understand groundwater flow patterns. This goal was achieved through the geochemical characterization of groundwater and the use of multivariate statistical analysis to interpret results. 

The study area (600 km2) encompasses 4 buried valleys connected to the main Kyrönjoki valley. Compilation of historical geochemical data (56 samples) from 2011-2021 was completed in June-August 2023 by a large groundwater sampling campaign (42 samples) from observation wells, bedrock boreholes, production wells and springs, covering all parts of the study area. Samples were analyzed for major ions, minor and trace elements and tritium analyses were performed on a subset of 25 samples. Multivariate statistical analysis (Hierarchical Clustering and Principal Components) was carried out based on 18 physicochemical parameters for 98 samples.

Five water groups emerged from the hierarchical classification. The first three clusters (C1-C2-C3) represent water from sediments, cluster 4 corresponds to water from the bedrock in the upgradient areas and cluster 5 represents water from the bedrock deep beneath the buried valleys. The major recharge area is located to the west of the study area, in the topographic highs where less evolved, tritiated waters were found (C3). From the recharge area, groundwater flows to the north, east and south-east. A similar groundwater evolution from Ca-HCO3 to Na-HCO3 water types was observed in both sediments and bedrock in the recharge area (C4). This suggests there is either an evolution within the buried valleys themselves or the buried valleys act as discharge and mixing feature for the evolved bedrock waters. Groundwater from the northernmost buried valley and the northern part of the Kyrönjoki valley (C1) are geochemically distinct from the rest of the study area and contain tritiated waters, reflecting a different context of modern esker with a shallower system. Bedrock groundwater (C4-C5) are characterized by a lower pCO2 value and higher pH. While one bedrock borehole beneath the central Paloluoma buried valley showed a more evolved water type and was tritium-free, fresh groundwater was still found until 100 m depth, suggesting deep active flow in bedrock.

This study will be complemented by an additional dataset of groundwater residence time tracers (3H, 14C) and isotope data (87Sr, 18O/2H) that will provide more information on groundwater origin and support the interpretation of the evolution of the water groups found in the Kurikka aquifer system.

How to cite: Pétré, M.-A., Putkinen, N., Ruskeeniemi, T., and Lefebvre, R.: Multivariate statistical analysis of groundwater geochemistry to characterize flow in the Kurikka buried valley aquifer system, Western Finland, EGU General Assembly 2024, Vienna, Austria, 14–19 Apr 2024, EGU24-3797, https://doi.org/10.5194/egusphere-egu24-3797, 2024.

Abstract: The depth of groundwater is a critical factor that significantly influences the development and conservation of both surface water and groundwater in lakes located in Northern China, exemplified by Baiyangdian (BYL), the largest lake situated in the North China Plain. It forms a critical foundation for the ecological integrity of BYL by quantifying hydrological fluxes and investigating variations in surface water and groundwater across distinct groundwater depths. To address this inquiry, we established a distributed hydrological model for the basin, enabling the simulation of surface runoff (horizontally) and vertical processes such as evapotranspiration and infiltration. Findings for the period 1966-1980 reveal an overall shallow groundwater condition in the Baiyangdian plain area, with a multi-year average depth of approximately 4 meters. Precipitation recharge, lake evaporation, surface water inflow, surface water outflow, groundwater inflow, and groundwater outflow during this phase were quantified at 187 million m3, 288 million m3, 960 million m3, 683 million m3, 160 million m3, and 40 million m3, respectively. The predominance of horizontal flux (62%) signifies rapid lake water replenishment. Conversely, during the later period of 1981‒2018, groundwater depth in the plain area substantially increased, averaging 23.48 meters. Precipitation recharge, lake evaporation, surface water inflow, surface water outflow, and groundwater outflow were computed at 179 million m3, 227 million m3, 294 million m3, 118 million m3, and 127 million m3, respectively. The horizontal flux contribution diminished to 22%, while the vertical flux surged to 78%, indicating slower lake water renewal and heightened risks of water quality degradation. Climate change and human activities emerged as drivers of rising groundwater depth, subsequently weakening water cycle dynamics over BYL. In the future, the comprehensive recovery of groundwater facilitated by the South-to-North Water Diversion for lake and river replenishment will play a pivotal role in reinstating water cycle dynamics and enhancing ecological integrity. This study establishes a foundation for understanding the intricate interactions between lakes, rivers, and aquifers as groundwater depth evolves over time. It holds significance for water conservation and the preservation of BYL's water quantity and quality in the future.

Key words: Baiyangdian Lake; distributed hydrological model; hydrological flux; Groundwater depth

How to cite: Cui, Y., Long, D., and Cui, Y.: Hydrological Impacts of Groundwater Depth on Lakes in Northern China: Exploring the Mechanisms through Climate Change and Human Activities, EGU General Assembly 2024, Vienna, Austria, 14–19 Apr 2024, EGU24-8680, https://doi.org/10.5194/egusphere-egu24-8680, 2024.

EGU24-8712 | Orals | HS8.2.2 | Highlight

Drought effects on the occurrence of emerging contaminants in an alluvial aquifer: Implications for groundwater resources management. 

Nonito Ros-Berja, Meritxell Gros, Lúcia Helena Santos, Anna Menció, and Josep Mas-Pla

Human activities, such as agriculture and reclaimed water discharges, are the main sources of pharmaceuticals (PhACs) and emerging contaminants (ECs) in groundwater. Their occurrence is expected to be linked to the hydrogeological dynamics of the aquifer, especially during severe drought periods when recharge from human sources dominates; therefore, it is paramount to relate groundwater flow dynamics and pollutant occurrence to properly control and manage water resources quality.

This study evaluates the presence of ECs, including PhACs and endocrine disrupting compounds (EDCs) along the Onyar River alluvial aquifer (NE Catalonia, Spain; 295 km2) in two sampling campaigns depicting different hydrological scenarios. The first survey took place in June-July 2021 including the analysis of 45 PhACs in 18 groundwater samples, and the second one in March 2023, after almost two years of a severe drought, focused on 12 groundwater and 10 stream water samples for the determination of 45 PhACs, plus 9 transformation products (TPs) and metabolites, and 32 EDCs. Hydraulic head and hydrochemical data were also collected.

Five PhACs were detected in groundwater (acetaminophen, carbamazepine, hydrochlorothiazide, ibuprofen, and venlafaxine) at 0.6 to 57 ng/L in 2021. Sulfamethoxazole was the only antibiotic found. The second campaign (2023) identified eight PhACs in river samples, including trimethoprim, clindamycin, sulfamethoxazole, sulfapyridine, flubendazole, carbamazepine, citalopram, and venlafaxine, ranging from 5.9 to 81.8 ng/L, whereas in groundwater only six PhACs: sulfamethoxazole, sulfamethazine, sulfadiazine, carbamazepine, venlafaxine, and hydrochlorothiazide were identified at 0.5 to 20 ng/L. TPs and metabolites, such as carbamazepine-10,11-epoxy and carbamazepine-2-hydroxy were only found in river samples, while metoprolol acid was present in both river and groundwater samples. Several EDCs were present in both river and groundwater samples, including tolyltriazole, benzotriazole-1H, bisphenol A, caffeine, methylparabens, TCEP, TBEP, TCPP and estrone at concentrations from 0.3 to 142.2 ng/L.

Such distinct results are influenced by hydrological factors. As a general interpretation supported by head and chemical data, stream water induced aquifer recharge due to groundwater withdrawal is more intensive during drought periods when the water table is lower, as in 2023. This enhances the transport of ECs introduced by reclaimed water inputs towards the aquifer. Conversely, in periods with a higher water table: June-July 2021, the hydrological setup reverses and pollutants introduced by stream recharge, yet relevant, do not reach wells located far away from the drainage network because of larger groundwater recharge and reduced withdrawal irrigation rates. Therefore, a temporal variability of ECs concentration in groundwater is not a matter of uncertainty, but a consequence of observable and predictable changing hydrological conditions. Ignoring hydrological variability in the interpretation of PhACs and ECs will result in erroneous actions about preventing pollution migration and understanding their actual hazard to human and environmental health.

Funding: project EC-FATE, call “MINECO-AEI, PID2022-139911OB-C42” and the Ramon y Cajal contract (RYC2020-030324-I).

How to cite: Ros-Berja, N., Gros, M., Santos, L. H., Menció, A., and Mas-Pla, J.: Drought effects on the occurrence of emerging contaminants in an alluvial aquifer: Implications for groundwater resources management., EGU General Assembly 2024, Vienna, Austria, 14–19 Apr 2024, EGU24-8712, https://doi.org/10.5194/egusphere-egu24-8712, 2024.

EGU24-8822 | Posters on site | HS8.2.2

Integrating multiple methods for simulating lake catchment water balance in northern Europe 

Maile Polikarpus, Joonas Pärn, Siim Tarros, Leonid Latsepov, and Sten Suuroja

The potential expansion of an oil shale quarry near environmentally protected Lake Uljaste in northern Estonia has ignited a public discourse on its potential impact on the lake's water level. This study, conducted between 2021 and 2023, aimed to elucidate the hydrogeological dynamics of the area, understand the functioning of groundwater flow systems, and predict the consequences of quarry expansion on the lake's water balance over the next 15 years.

Lake Uljaste is a small (area of 0,64 km2) closed-basin lake with an average depth of 3,4 m. As the lake does not have any channelized surface water inflow or outflow, most of the water budget components have to be estimated indirectly. For this purpose, two water balance models were developed, incorporating hydrological/meteorological and stable isotope data, respectively, serving as inputs for a transient groundwater model.

In addition, several different methods were applied including geophysical mapping, coring surveys, monitoring well construction, electrometry, and groundwater/surface water monitoring to characterize the local geological conditions and groundwater-surface water interaction. Seismo-acoustic profiling provided insights into the depth of lake bottom sediments, while electrical conductivity and isotopic composition of surface water and groundwater aided in conceptualizing the local groundwater flow system.

The study revealed that, the lake water balance is mainly controlled by precipitation and evaporation and is very sensitive to changes in climatic conditions. Despite the fact, that the amount of direct groundwater inflow is small, the groundwater level beneath the lake significantly influences its water level. Predictions from the groundwater model indicate a notable lake level decline due to the potential water abstraction of the planned quarry. Thus, without preventive measures against groundwater level decline beneath the lake, the expansion of the quarry to its planned position would result in a significant decline in lake water level leading probably to severe environmental problems.

Several uncertainties remain regarding the conceptual understanding of the lake water balance and catchment hydrology which need to be addressed to improve the existing models. The most important of these concerns need for a more precise determination of hydrodynamic properties of the lake bottom sediments, which are needed to estimate the subsurface outflow from the lake. In addition, the installation of a weather station for characterizing the microclimatic conditions near the lake and refining of the stable isotope mass-balance model through improved characterization of vertical and horizontal mixing in the lake, are needed for more accurate water balance calculations. These refinements are crucial for assessing the extent of lake water seepage into the groundwater, a vital parameter for groundwater modeling and an important pre-requisite for sustainable groundwater resource management in the area.


How to cite: Polikarpus, M., Pärn, J., Tarros, S., Latsepov, L., and Suuroja, S.: Integrating multiple methods for simulating lake catchment water balance in northern Europe, EGU General Assembly 2024, Vienna, Austria, 14–19 Apr 2024, EGU24-8822, https://doi.org/10.5194/egusphere-egu24-8822, 2024.

EGU24-9965 | Orals | HS8.2.2

Moderate impact of landfill gas on a naturally reducing aquifer should not be confused with leachate pollution    

Elisabetta Preziosi, Daniele Parrone, Eleonora Frollini, Stefano Ghergo, Alessandra Sciarra, Livio Ruggero, and Giancarlo Ciotoli

The processes leading to high levels of arsenic, iron, and manganese in a naturally reducing aquifer beneath a landfill are investigated. Between 2016 and 2022, groundwater monitoring (physical-chemical parameters, major and trace inorganic compounds) has been complemented with the analysis of environmental isotopes (tritium, δ2H, and δ13C) of groundwater and of the dissolved gases (δ13C of CH4 and CO2, 14C of CH4). Statistics, including Pearson/Spearman correlation and PCA, were used to define the main correlation among variables. The presence of methane and carbon dioxide was attributed to landfill gas migration from the waste as 14C dating confirmed that methane is modern (F14C = 1.0684) and likely produced by methyl fermentation within the waste. While methane, enhancing the naturally reducing conditions of the aquifer, appears to be the driver of the high concentration of Fe and As, Mn appears to be governed by carbon dioxide. At the same time, CO2 may locally lower the pH, thus increasing the dissolution of sedimentary carbonates and ultimately producing high alkalinity and salinity. Furthermore, the reuse of water from leachate treatment to meet circular economy requirements was invoked to explain the elevated levels of tritium and 2H, associated with significantly negative 13C, observed in a production well and in a nearby piezometer. The integration of environmental isotopes and geochemical parameters allowed to exclude leachate contamination: tritium, δ2H, and δ13C were within the expected range for natural groundwater. No compounds typical of leachate contamination were detected. Environmental isotopes can fruitfully complement traditional monitoring when the comprehension of processes is desired, but this requires an expert judgment and a solid conceptual hydrogeological model.

How to cite: Preziosi, E., Parrone, D., Frollini, E., Ghergo, S., Sciarra, A., Ruggero, L., and Ciotoli, G.: Moderate impact of landfill gas on a naturally reducing aquifer should not be confused with leachate pollution   , EGU General Assembly 2024, Vienna, Austria, 14–19 Apr 2024, EGU24-9965, https://doi.org/10.5194/egusphere-egu24-9965, 2024.

EGU24-10464 | Posters on site | HS8.2.2 | Highlight

Human impact on groundwater levels: identification and quantification 

Ainur Kokimova, Heike Brielmann, and Steffen Birk

Groundwater is a crucial source of freshwater globally, sustaining agriculture, industry, domestic consumption, and the environment. Understanding the human-induced impacts on groundwater is vital, especially in regions threatened by quantitative and qualitative problems. Unfortunately, very often not all information on human activities that may affect groundwater is easily available. We, therefore, test a simple approach combining time series analysis and point detection to identify human impacts on groundwater. The time series models are built by using accessible climate data. In cases where a simulation does not perform well, multiple changepoint detection is applied to capture the time for a potential human impact event and its significance. The method is applied to two Austrian cities where disturbances caused by dam construction and pumping events were detected. The presented results illustrate the capacity to identify and characterize shifts in groundwater dynamics attributed to human interventions. Notably, the methodology proves effective in scenarios where extensive datasets are unavailable, providing a practical and reproducible means to comprehend human-induced alterations in groundwater resources.

How to cite: Kokimova, A., Brielmann, H., and Birk, S.: Human impact on groundwater levels: identification and quantification, EGU General Assembly 2024, Vienna, Austria, 14–19 Apr 2024, EGU24-10464, https://doi.org/10.5194/egusphere-egu24-10464, 2024.

EGU24-10717 | ECS | Posters on site | HS8.2.2

Dyke-impounded fresh groundwater resources on volcanic islands: learning from the Canary Islands (Spain) 

Miguel Angel Marazuela, Carlos Baquedano, Noelia Cruz-Pérez, Jorge Martínez-León, Chrysi Laspidou, Juan Carlos Santamarta, and Alejandro García-Gil

Freshwater in coastal and island aquifers is a valuable resource whose availability is strongly conditioned by heterogeneity. More than 80 % of the Earth’s surface is of volcanic origin, but the effect of volcanic dykes on the geometry of the saline interface that separates freshwater from seawater is still underexplored. This paper analyses the impact of volcanic dykes on the depth of the saline interface in coastal and island aquifers and, subsequently, on the availability of fresh groundwater. Hydrogeological and hydrochemical data from a gallery, perpendicularly crossing several tens of dykes, were integrated with numerical modelling on the volcanic island of El Hierro (Canary Islands, Spain). Measured hydraulic heads demonstrated that the presence of dykes increased the hydraulic gradient by more than an order of magnitude, with respect to an adjacent area not affected by dykes. Numerical assessment confirmed that the lower the hydraulic conductivity of the dykes, the greater the depth of the saline interface inland. This impact led to fresh groundwater reserves increasing inland, relative to a hypothetical case without dykes. Numerical simulations also demonstrated that dykes can prevent salinization of production wells in coastal and island aquifers, if they are correctly located. Locating production wells far enough inland in an area affected by dykes allowed a higher freshwater extraction rate than if dykes did not exist; near the coastline, the effect tended to be the opposite. These results will be key to improving the management of fresh groundwater resources in coastal volcanic aquifers, and especially on volcanic islands such as the Hawaiian Islands or the Macaronesian archipelagos.

How to cite: Marazuela, M. A., Baquedano, C., Cruz-Pérez, N., Martínez-León, J., Laspidou, C., Santamarta, J. C., and García-Gil, A.: Dyke-impounded fresh groundwater resources on volcanic islands: learning from the Canary Islands (Spain), EGU General Assembly 2024, Vienna, Austria, 14–19 Apr 2024, EGU24-10717, https://doi.org/10.5194/egusphere-egu24-10717, 2024.

EGU24-11280 | Orals | HS8.2.2

Using a colloidal borescope to define groundwater flow directions at contaminated sites  

Michele Rodighiero, Andrea Sottani, Stefano Buggiarin, and Luca Vettorello

Detailed knowledge of the groundwater flow field is one of the fundamental technical prerequisites for designing effective remediation measures for contaminated aquifers.

The environmental issues under discussion concern both the implementation of emergency measures, commonly carried out by means of Pump&Treat (P&T) hydraulic containment systems, and remediation actions, developed through the adoption of in-situ technologies and treatments.

In hydrogeological practice, the analysis of groundwater flow directions is implemented on a piezometric basis, reconstructing the water table trend from point-level measurements. These point measurements are appropriately interpreted using geostatistical contouring algorithms.

However, within a single contaminated site, very specific circumstances may be found, due to both natural and operational reasons or other logistical challenges. The first group includes intrinsic geological factors, which derive e.g. from depositional mechanisms: typically, saturated alluvial systems are characterized by structural heterogeneity and anisotropy that can sometimes influence the design choices for remediation. Similarly, the geometry of the site and the presence of structures in relation to the position of the contamination source and the direction of groundwater flow can influence the location of interventions and installations, such as the position of pumping and monitoring wells, the latter placed behind the hydraulic barrier to verify its effectiveness.

In these environmental contexts, a methodological in-depth study is underway, aimed at combining traditional hydrogeological parameterization techniques with an advanced experimental measurement system with colloidal borescope.

The borescope is an optical device capable of following the movement of colloids in monitoring wells: field observation of the motion of these particles shows that the directional measurements, in addition to being generally consistent with the expected flow field, also provide complementary point-based results compared to those achievable with traditional techniques (Kearl, 1997). The instrument detects the flow of colloids from stagnant conditions up to flow rates close to 3 cm/s, allowing the prevailing azimuthal direction of transport to be established using statistical criteria.

This work describes the preliminary results of unpublished measurements, carried out in contaminated aquifers controlled by hydraulic barriers in operation. The results achieved to date suggest the opportunity for the use of the colloidal borescope to refine the conceptual hydrogeological model in contaminated sites even in dynamic regime situations.

How to cite: Rodighiero, M., Sottani, A., Buggiarin, S., and Vettorello, L.: Using a colloidal borescope to define groundwater flow directions at contaminated sites , EGU General Assembly 2024, Vienna, Austria, 14–19 Apr 2024, EGU24-11280, https://doi.org/10.5194/egusphere-egu24-11280, 2024.

Climate changes cause droughts and storms in many places, impacting sustainable development. Water scarcity caused by climate change will be a significant obstacle to climate adaptation and sustainability. Therefore, rainfall harvesting is becoming a significant approach in arid regions that suffering from water scarcity. Such an approach allowed for capturing and holding water resources in ponds, lakes, and groundwater aquifers needed to expand agricultural, urban, and industrial activities. In this project, radar and optical remote sensing data have been integrated with climatic, hydrologic, and geological data that successfully enabled the identification of potential water accumulation zones and optimum areas for rainwater harvesting. The processing of the SRTM, Sentinel-1&2, Landsat-8, TRMM, ALOS/PALSAR, and InSAR coherence change detection (CCD) data revealed geomorphic, structural, and hydrologic properties of the catchments and rainfall intensity zones of Wadi Safag which is a significant drainage system that drains into the Red Sea, Egypt. Several factors were combined, after assigning weights to each using a GIS-based knowledge-driven methodology. The results delineated the promising areas for rainfall harvesting and groundwater potential zones (GPZs). Additionally, the results identified the optimum areas for constructing lakes and dams to store rainwater and protect the mining, industrial, and tourism areas in the studied basin. Overall, identifying the probable areas for water accumulation and groundwater abstraction is crucial for planners and decision-makers for the achievement of sustainable development in Wadi Safaga, Egypt.

How to cite: Abdelkareem, M., M. Mansour, A., and Akawy, A.: Revealing the plausible areas for rainwater harvesting and groundwater abstraction for the accomplishment of sustainable development purposes in arid regions , EGU General Assembly 2024, Vienna, Austria, 14–19 Apr 2024, EGU24-11780, https://doi.org/10.5194/egusphere-egu24-11780, 2024.

EGU24-12831 | ECS | Posters virtual | HS8.2.2 | Highlight

Regional groundwater flow mapping in NE Hungary – a tool to understand drinking water quality and quantity problems for sustainable resource management 

Katalin Hegedűs-Csondor, Réka Jávorcsik, Reyana Dawn Garcia, Petra Baják, Viktória Kohuth-Ötvös, and Anita Erőss

In Hungary, the drinking water supply almost exclusively uses groundwater resources. Recent investigations revealed that waterworks have difficulties in maintaining the proper quantity and quality (e.g. because of elevated gross alpha activity concentration) of drinking water in certain settlements in NE Hungary. To understand and to solve these groundwater-related issues, there is a need for a thorough understanding of groundwater flow dynamics and the associated geochemical characteristics in the broader area. The aims of the present study in the research area are 1) to evaluate the groundwater flow systems based on measured hydraulic data on regional and local scale, 2) to characterize the geochemical composition of the waters based on archive geochemical data to support the hydraulic studies 3) to use natural radioanuclides (234U/238U ratio, 226Ra and 222Rn) as natural tracers to evaluate local water quality issues. Firstly, regional groundwater flow mapping was carried out in the study area. Based on data collected from archive well documentation, a database was built containing the main properties (e.g. coordinates, water level, well depth, screening) of 722 wells. Pore pressure and hydraulic head values were calculated. To examine the horizontal groundwater flow directions, six potential maps were constructed between -200 m asl and 600 m asl elevation intervals. On the other hand, 34 pressure-elevation profiles were compiled to understand the vertical flow dynamics and identify the different flow regime areas (i.e. recharge, midline, discharge). The results showed that in the examined depth, topography-driven groundwater flow systems exist. Recharge areas are characteristic of the hilly and mountainous areas along the Hungarian-Austrian border, while discharge regime is dominant in the surroundings of Lake Fertő/Neusiedl and along water courses. The dominant horizontal flow direction is from W- SW to E-NE. The geochemical results were evaluated in the groundwater flow system context. Uranium was identified as the main cause of elevated gross alpha activity. The results contribute to the sustainable production of healthy drinking water and planning of new drinking water abstraction sites. 

The research is part of a project which was funded by the National Multidisciplinary Laboratory for Climate Change, RRF-2.3.1-21-2022-00014. The study is also supported by the ÚNKP-23-5 New National Excellence Program of the Ministry for Culture and Innovation from the source of the National Research, Development and Innovation Fund.

How to cite: Hegedűs-Csondor, K., Jávorcsik, R., Dawn Garcia, R., Baják, P., Kohuth-Ötvös, V., and Erőss, A.: Regional groundwater flow mapping in NE Hungary – a tool to understand drinking water quality and quantity problems for sustainable resource management, EGU General Assembly 2024, Vienna, Austria, 14–19 Apr 2024, EGU24-12831, https://doi.org/10.5194/egusphere-egu24-12831, 2024.

EGU24-12919 | ECS | Orals | HS8.2.2

Utilizing Remote Sensing Data to Locate Managed Aquifer Recharge Facilities Using Floodwater  

Núria Ferrer, Paula Rodríguez-Escales, Daniel Fernández, and Javier Ignacio Martínez

Climate projections from the IPCC for the Mediterranean indicate anticipated increases of up to 3.5ºC in average temperatures and a consequential reduction of approximately 10% in precipitation. Such projections suggest a shift in climatic regimes, predicting an escalation in extreme events, particularly floods. In the face of water scarcity, diverting floodwater to the sea signifies a significant loss of a valuable resource. Enabling the recharge of this water into the aquifer not only increases water resources but also mitigates flood severity and enhances resilience against droughts.

To identify optimal locations for aquifer recharge strategies, the integration of remote sensing and Geographic Information Systems (GIS) proves invaluable. In this study, we coupled both tools to propose a methodology for locating the best places for Managed Aquifer Recharge using floodwater. For that, we have processed a set of river images using Sentinel-2 satellite imagery to evaluate the evolution of river width. Subsequently, this data was integrated into a proposed multicriteria analysis to determine the optimal location for MAR. Upon establishing the methodology, we applied it to the Llobregat River (Spain), a crucial source of groundwater supplying Barcelona. Located in the Mediterranean region, the aquifer is particularly vulnerable to the impending droughts predicted by the IPCC.


How to cite: Ferrer, N., Rodríguez-Escales, P., Fernández, D., and Martínez, J. I.: Utilizing Remote Sensing Data to Locate Managed Aquifer Recharge Facilities Using Floodwater , EGU General Assembly 2024, Vienna, Austria, 14–19 Apr 2024, EGU24-12919, https://doi.org/10.5194/egusphere-egu24-12919, 2024.

Water availability in the border region of New Mexico and Texas, US, and Chihuahua, Mexico, is limited. The transboundary aquifers of the Hueco Bolson, Mesilla (US)/Conejos Medanos(Mexico), and Valle de Juarez in Mexico, as well as the surface water of the Rio Grande, are the primary sources of this border area. The transboundary aquifer of Mesilla, known by this name in the US, is called Conejos Medanos on the Mexican side; the southern part of this aquifer is located in the north of Chihuahua, Mexico. In this area, water is scarce and does not exist recharge. Then, the transboundary aquifers in the area are being depleted. These challenges, along with the rapid population growth, have created significant issues for water management in the transboundary region, as they also involve challenges in maintaining water availability. Therefore, it is necessary to understand the groundwater flow to promote the sustainability of the transboundary aquifers and promote groundwater recharge in the area.

A comprehensive understanding of this aquifer's groundwater dynamics and flow patterns is essential to ensure effective transboundary water resource management. This study employed ArcGIS 10.4.1 to conduct a geospatial analysis of binational drawdown data of static groundwater levels from 2019. The Municipal Water and Sanitation Board of Juarez City (JMAS by its acronym in Spanish) provided the data from the Mexican side. At the same time, the United States Geological Service (USGS) supplied information from the US side. Results show groundwater flowing from north to south into Mexico, forming cones of depression around JMAS-administered well infrastructure supplying water to Juarez City. These findings indicate the aquifer's sensitivity, emphasizing the potential influence of intense pumping on groundwater availability and future economic growth. The research offers insights into data-driven approaches for understanding groundwater dynamics in transboundary regions, promoting sustainable water resource management, water security, and cross-border cooperation, which is good for promoting the Transboundary Aquifer Assessment Program (TAAP), Transboundary Groundwater Resilience (TGR) Network of Networks (formerly known as TGRR) funded by the National Science Foundation's Accelerating Research through International Network-to-Network Collaborations (AccelNet) program. This network promotes collaborative efforts, which are essential to address transboundary aquifer management issues and ensure the resiliency and sustainability of groundwater resources for current and future generations on both sides of the border. As we face increasing water-related challenges in a changing world, this study highlights the importance of understanding and managing transboundary aquifers as critical components of sustainable water resources management strategies.

How to cite: Garcia Vasquez, A. C., Samani, Z., Granados, A., and Fernald, S. ".:  "Groundwater Dynamics of the Transboundary Mesilla-Conejos Medanos Aquifer by Geospatial Analysis to Addressing Depletion Challenges and Find Sustainable Solutions along the US-Mexico Border.", EGU General Assembly 2024, Vienna, Austria, 14–19 Apr 2024, EGU24-13342, https://doi.org/10.5194/egusphere-egu24-13342, 2024.

EGU24-13451 | ECS | Posters on site | HS8.2.2

Monitoring of the spatial and temporal evolution of marine intrusion in the estuary area of the river Magra and estimation of its effects on the groundwater. 

Marco Sabattini, Francesco Ronchetti, Diego Arosio, Alessio Mainini, Gianpiero Brozzo, and Andrea Panzani

Marine intrusion is one of the main consequences of climate change in coastal areas. The progression of the salt wedge inland compromises the quality and quantity of groundwater, seriously damaging agriculture and gradually desertifying the territory.

Marine intrusion is often enhanced by rivers. During the summer period, when the discharge is lower, tidal oscillations can favour the progression of the salt wedge along the riverbed, even for several km inland. This phenomenon is increased in rivers with estuarine morphology.

In this research, we present the results of a study conducted in the lower Val di Magra, a coastal territory in central Italy. The river Magra is one of the main estuarine rivers in Italy. In its final part, Magra River flows through a wide alluvial plain. Here it feeds an important coastal aquifer currently exploited for drinking water purposes.

The objective of this research is the monitoring of the spatial and temporal evolution of marine intrusion in the estuarine zone of the R. Magra and the estimation of its effects on the coastal aquifer. The monitoring covered a period of 2 years, from 2022 to 2023.

The drought conditions during the monitoring years were determined using the monthly Standard Precipitation Index (SPI). The index was calculated using data of the Sarzana weather station from 1932 to the present. The SPI indices were calculated with aggregation at 3, 6, 12 and 24 months. In all scenarios they show a severe-extreme drought condition during 2022 and 2023.

River waters were monitored (water electrical conductivity (EC) measurements) and sampled periodically in a series of stations located from the sea until upstream of the estuarine zone.

The same type of periodic monitoring also involved a series of wells located along the Magra riverside and instrumented with CTD multi-parameter probes.

The monitoring data were collected in maps showing the variations over the year of the surface water EC of the R. Magra. The measurements performed confirm that a natural hydraulic barrier, located between the towns of Romito and Sarzana, currently defines the limit of the R. Magra estuary.

The water samples were analysed using an IRMS to obtain Oxygen isotopic values. δO18 is used as a natural tracer of the R. Magra waters. The correlation between EC and δO18 effectively highlights seawater-freshwater mixing and validates the EC data.

The monitoring results show that the river water can be chemically summarised as a 3-element system: R. Magra, R. Vara (a major tributary) and the sea. For each sample, the contribution of the three members can be determined as a function of the pairs of EC-δO18 measurements in relation to the values of the pre-mixing end-embers. Using the Montecarlo simulation, the probability of all possible natural values of the end-embers was calculated.

A chemical map (EC-δO18) of the mixing values between the end-members was produced. The chemical map was compared with data recorded in the wells along the riversides to identify mixing water. This method revealed a fraction of seawater in the aquifer near Romito and a source area downstream of the monitored well.

How to cite: Sabattini, M., Ronchetti, F., Arosio, D., Mainini, A., Brozzo, G., and Panzani, A.: Monitoring of the spatial and temporal evolution of marine intrusion in the estuary area of the river Magra and estimation of its effects on the groundwater., EGU General Assembly 2024, Vienna, Austria, 14–19 Apr 2024, EGU24-13451, https://doi.org/10.5194/egusphere-egu24-13451, 2024.

EGU24-13760 | Posters on site | HS8.2.2

Groundwater quality assessment for human consumption. A case study of the Middle Magdalena Valley  – Colombia. 

Boris Lora-Ariza, Adriana Piña, Leonardo David Donado, and Mónica Vaca

Water quality is one of the major causes affecting human health, especially in vulnerable populations in developing countries. In Colombia, groundwater is often consumed by rural populations as drinking water without any treatment. Therefore, a groundwater quality assessment in the Middle Magdalena Valley in Colombia (MMV) was conducted to determine potential health hazards associated with its consumption. The study area covers approximately 8500 km2 and is bounded by the piedmont of the San Lucas Mountain range and the Central and Eastern Mountain Ranges of the Andes.

In this study, 458 water samples were analyzed. They were collected during three (3) field campaigns conducted between February 2020 and March 2021, encompassing contrasting hydrologic periods. Based on laboratory results, the potential health hazards associated with groundwater consumption were assessed using the Colombian Water Quality Risk Index (CDQRI-IRCA).

CDQRI-IRCA values in the MMV ranged from 0 to 80, with a mean of 51 and a standard deviation of 21. Furthermore, more than 84% of the analyzed samples were classified as high risk for human consumption. This outcome is associated with the presence of fecal and total coliforms in 58% and 89% of the analyzed samples, respectively. These parameters hold the highest specific weights in the CDQRI-IRCA calculation.

The presence of fecal and total coliforms in groundwater in the MMV is associated with deficiencies in sanitation coverage, particularly in rural areas where water supply wells are often located near septic tanks, handmade pit latrines without proper hygienic protection, or in areas with backyard livestock farming.


Acknowledgments

The researcher thanks the MEGIA Research Project, Contingent Recovery Contract FP44842-157-2018 funded by Minciencias and the National Hydrocarbons Agency


How to cite: Lora-Ariza, B., Piña, A., Donado, L. D., and Vaca, M.: Groundwater quality assessment for human consumption. A case study of the Middle Magdalena Valley  – Colombia., EGU General Assembly 2024, Vienna, Austria, 14–19 Apr 2024, EGU24-13760, https://doi.org/10.5194/egusphere-egu24-13760, 2024.

The Costa de Hermosillo is a coastal flow system located in the northwest of Mexico. Since 1954, it has been subject to intensive exploitation of groundwater resources, resulting in a significant drop in the water table. It is important to note that the water table is now several meters below sea level. As a result, seawater intrusion has extended tens of kilometers inland. The impact of this problem on the region is significant in economic, social, and environmental terms. Extensive agricultural areas have been abandoned due to the salinity of the water extracted from wells affected by seawater intrusion.

The present study proposes a statistical methodology based on historical hydrogeochemical data from the Hermosillo coast to determine three fundamental aspects. 1) determining the number of flow components in the groundwater, 2) identifying the proportion of each component in the wells, and 3) analyzing the spatial and temporal distribution of these components.  The research involved three main aspects: To begin, historical data on hydrogeological and hydrogeochemical aspects, climatic variables, and static water level elevations in the area were compiled. This data was then subjected to rigorous quality control to select appropriate years for analysis. The analysis focused on wells that had records of major ions and some physical parameters for the years 1980, 1987, 1989, 1991, 1992, and 1993. Statistical techniques were used to identify four components present in the study area and to determine their proportions in the wells.

The identification and hydrogeochemical characterization of groundwater constituents are essential to enhance knowledge of the region. This approach is based on analyzing the concentrations of dominant ions in wells, which allows the establishment of relationships with the hydrogeological environment. The main objective is to overcome the current limitations of groundwater management in the coastal region of Hermosillo. The hydrogeochemical characterization proposed here is a crucial step toward addressing interrelated challenges and achieving integrated and sustainable water resource management in the region.

How to cite: Priscila, M.-O., Oscar, E.-F., Eric, M.-C., and Selene, O.-O.: Identification and variations of the components of a regional groundwater flow system with intensive exploitation based on historical hydrogeochemical records in a coastal flow system., EGU General Assembly 2024, Vienna, Austria, 14–19 Apr 2024, EGU24-14331, https://doi.org/10.5194/egusphere-egu24-14331, 2024.

EGU24-15092 | Posters on site | HS8.2.2

The effectiveness of river bank filtration system on nitrate removal (Śrem site, Poland) 

Krzysztof Dragon, Marcin Siepak, Dariusz Drożdżyński, and Józef Górski

In the river bank filtration systems (RBF) the extracted water quality is strongly depending on source (river or lake) water quality. It is well known that these systems can effectively remove emerging contaminants (pharmaceuticals, personal care products or pesticides) from polluted river waters. The common river water contamination is related to nitrate which is observed at high concentrations commonly. Moreover, the nitrate concentrations in the rivers are usually very changeable seasonally. The current work presents the effectiveness of the RBF system in nitrate removal from polluted source (river) water. For this purpose, the water chemistry changes during filtration between the river and productive wells were used, while for identification of denitrification processes the isotopes of d18O and d15N dissolved in nitrate were used. The RBF site located in Śrem (Wielkopolska region, Poland) was selected for the presented research. The water samples were taken from the river and six continuously pumped wells. The water sample representing ambient groundwater was analysed as well. The wells at a close distance from the river (40-50 m) and the wells located at a greater distance from the river (70 – 95 m) were chosen for investigation. The visible differentiation of nitrate concentration was observed. The highest nitrate concentrations were observed in the river and wells located at a close distance from the river (~5 mg/l) and then the nitrate concentrations decrease (to a level of <0,5 mg/l). The spatial differentiation of the isotopes of d18O and d15N dissolved in nitrate is correlated with nitrate decrease and indicates that the denitrification processes are responsible for nitrate removal. The research presented demonstrates that RBF systems are reliable methods for nitrate removal from source water. This work has received funding from the National Science Centre of Poland (grant no. 2021/41/B/ST10/00094).

How to cite: Dragon, K., Siepak, M., Drożdżyński, D., and Górski, J.: The effectiveness of river bank filtration system on nitrate removal (Śrem site, Poland), EGU General Assembly 2024, Vienna, Austria, 14–19 Apr 2024, EGU24-15092, https://doi.org/10.5194/egusphere-egu24-15092, 2024.

EGU24-16280 | ECS | Posters on site | HS8.2.2

Groundwater vulnerability and pollution risk assessment in the Estonian-Latvian transboundary area 

Magdaleena Männik, Jānis Bikše, and Enn Karro

Protecting groundwater resources is of fundamental importance as groundwater is a crucial source of drinking water worldwide. Despite its overall abundance, the task of maintaining both the quality and quantity of groundwater is challenging due to population growth and intensified agricultural activities. Therefore, proactive protection measures are needed to prevent the contamination of this vital resource. In order to improve groundwater management and protection, groundwater vulnerability assessment methods are developed to identify the most vulnerable areas.

This study focuses on the Estonian-Latvian transboundary area, recognizing the need to effectively manage the protection of the shared resource between the countries. The assessment of the natural groundwater vulnerability in the Estonian-Latvian transboundary area is conducted with the index-based modified DRASTIC method. Particularly crucial in areas characterized by diverse Quaternary sediments and a confined aquifer, a modified version of the DRASTIC method increases precision in vulnerability assessment results. Additionally, a numeric vulnerability assessment method based on pollutant movement time is used to compare and validate the results, enhancing the reliability of the vulnerability maps.

In addition to the natural vulnerability assessment, the pollution risk map serves as a valuable tool in identifying areas in need of protection by connecting the impact of anthropogenic pressure with the vulnerability defined by hydrogeological factors. To accomplish this, the DRASTIC-L method is used to determine the pollution risk in the Estonian-Latvian transboundary area. The DRASTIC-L method uses an additional parameter, land use, for a more precise vulnerability assessment.

The results emphasize the importance of developing accurate vulnerability assessment methods based on regional geological conditions. While natural vulnerability maps offer insights to the intrinsic vulnerability of an area to groundwater contamination, a comprehensive risk assessment requires the inclusion of pollution risk maps, highlighting the significance of anthropogenic activities in shaping contamination risks.

In addition to advancing groundwater vulnerability and pollution risk assessment methodologies, this study emphasizes the necessity of international collaboration. Groundwater flow knows no national borders, highlighting the collective responsibility for protecting this shared resource and ensuring the availability of safe drinking water for present and future generations.

How to cite: Männik, M., Bikše, J., and Karro, E.: Groundwater vulnerability and pollution risk assessment in the Estonian-Latvian transboundary area, EGU General Assembly 2024, Vienna, Austria, 14–19 Apr 2024, EGU24-16280, https://doi.org/10.5194/egusphere-egu24-16280, 2024.

EGU24-18288 | ECS | Orals | HS8.2.2

Origin and mineralization processes of groundwater in metamorphic hardrock aquifers in West Africa: Insights from stable isotopes (δ2H and δ18O) and major ions 

Mozimwè Ani, Jessy Jaunat, Beatrice Marin, Frederic Huneau, and Kissao Gnandi

The groundwater contained in the basement formations of sub-Saharan countries is the main source of drinking water for the population in rural and semi-rural areas. Captured by boreholes and wells, it is used for domestic purposes, irrigation, and other socio-economic activities. Given the increased pressure on the resource due to population growth and urbanization, assessing its origin, availability, and quality for sustainable management is imperative. This study was carried out in the Kara River Watershed (KRW) in northern Togo. The study aimed at determining the recharge and mineralization processes of the groundwater in the watershed using conventional graphs, multivariate statistical analyses, and geochemical modelling. Physico-chemical (pH, temperature, and TDS), chemical (Ca2+, Mg2+, Na+, K+, HCO3-, SO42-, Cl-, NO3- and SiO2), and isotopic (δ2H and δ18O) analyses were carried out on 149 groundwater samples (boreholes and wells). The results showed that the isotopic composition of the groundwater suggests recharge of meteoric origin, often influenced by secondary evaporation and important mixing processes. From a hydrochemical point of view, the groundwater is generally low mineralized with TDS ˂ 1000 mg/L. These waters' main mineralization processes are water/rock interactions and human activities influence. The heterogeneity of the geological formations is responsible for the spatial variability of the water chemistry, with CaMg-HCO3-, intermediate, and Na-HCO3- water types predominating. Hydrolysis of silicate minerals, ion exchanges, and dissolution of carbonate minerals (calcite and dolomite) are responsible for water mineralization. Nitrates of human and animal origin often strongly degrade water quality. The results of this study will enable decision-makers to implement a relevant strategy for the sustainable management of groundwater resources, particularly in the city of Kara, where human activities massively impact groundwater quality.

Keywords: Recharge processes, hydrochemistry, water/rock interactions, hard-rock aquifer, human activities, Kara River, Togo.

How to cite: Ani, M., Jaunat, J., Marin, B., Huneau, F., and Gnandi, K.: Origin and mineralization processes of groundwater in metamorphic hardrock aquifers in West Africa: Insights from stable isotopes (δ2H and δ18O) and major ions, EGU General Assembly 2024, Vienna, Austria, 14–19 Apr 2024, EGU24-18288, https://doi.org/10.5194/egusphere-egu24-18288, 2024.

EGU24-18664 | ECS | Orals | HS8.2.2

The use of water isotopes as environmental tracers in contamination phenomena between groundwater and leachate 

Stefania Franchini, Francesco Maria De Filippi, Maurizio Barbieri, and Giuseppe Sappa

Nowadays, one of the serious environmental threats is groundwater contamination due to leachate from municipal solid waste landfills. In recent years, the use of stable isotopes as environmental tracers to identify potential groundwater contamination phenomena has found increasing application in environmental engineering. Deuterium (2H) and oxygen (18O) isotopes have been successfully used to determine contamination phenomena, when groundwater interact with leachate from municipal solid waste landfills with a significant organic amount. In these cases, groundwater present isotopic compositions relating to 2H and 18O, which highlight an enrichment of δ2H, an enrichment probably caused by methanogenesis phenomena, during which the bacteria preferentially use the "lighter" isotope of hydrogen (1H) and the remaining part enriched in the "heavier" isotope (2H). A parameter that influences the isotopic content of deuterium and oxygen18 is the deuterium excess (d or d-excess). An index F is then identified as a percentage change in d-excess, which allows the definition of a system of alert levels to evaluate and control the contamination of aquifers by leachate. F index values higher than 1.1 highlight possible phenomena of contamination of the aquifers due to leachate.

In the case study, the results of the isotopic analyses of oxygen18, deuterium and tritium show mixing phenomena of the leachate and groundwater. The influence of the leachate, following mixing phenomena with groundwater, can determine a reduction in the ORP redox potential in groundwater such that it takes on low and sometimes negative values. This condition ensures the establishment of anaerobic environments and reduces the mobilization of metals, such as Mn, in groundwater. Therefore, in the study area, the overlap of these two phenomena seems evident, such as causing the deterioration of groundwater.

How to cite: Franchini, S., De Filippi, F. M., Barbieri, M., and Sappa, G.: The use of water isotopes as environmental tracers in contamination phenomena between groundwater and leachate, EGU General Assembly 2024, Vienna, Austria, 14–19 Apr 2024, EGU24-18664, https://doi.org/10.5194/egusphere-egu24-18664, 2024.

EGU24-18858 | Posters on site | HS8.2.2

Unveiling groundwater flow connection in carbonate aquifers through the combined use of hydrochemical and isotopic data and water budget evaluation: a case study in Southern Italy 

Stefania Stevenazzi, Alfonso Corniello, Daniela Ducci, Luisa Stellato, Luigi Massaro, and Elena Del Gaudio

Carbonate rocks cover about 15% of the global continental surface and represent important water resources in terms of water quality and availability. The understanding of groundwater flows in karst aquifers is beneficial for satisfying human water demand, avoiding potential conflicts among users and preserving groundwater dependent ecosystems, that is for a sustainable management of water resources. The consequences of water utilization in karst areas are revealed through monitoring activities of hydrochemical characteristics and water utilization (withdrawals and piezometric levels).

We investigated the hydrogeological relationship between two neighboring carbonate aquifers, which were considered as two separate aquifer units in the past. Archival and newly acquired data on groundwater availability, hydrochemical and isotopic features were considered. Their combined use led to the proposal of new hypotheses regarding the connection between these aquifers. This issue is not only of scientific relevance but also has practical implications; indeed, there are important springs and well fields providing water to about 3.8 million inhabitants.

The aquifers examined in this study are the carbonate mountains of Mt. Maggiore and Mt. Tifata located in Campania Region in Southern Italy. The mountains are geographically separated by the Volturno River valley, filled with alluvial-pyroclastic deposits. The aquifers have been exploited for drinking purposes since the late 1980s. The exploitation of these aquifers and the availability of historical and recent data (i.e., long-term monitoring) revealed their hydrogeological connection. This connection would be induced by the strong groundwater withdrawals from the well fields at Mt. Tifata (located south of the Volturno River). In fact, the exploitation provoked the depletion of the groundwater table and the disappearance of the major spring. The connection, with groundwater flowing from Mt. Maggiore to Mt. Tifata, can explain the absence of signs of overexploitation in the groundwater of Mt. Tifata even in the presence of withdrawals that exceed the natural recharge of the aquifers. As a consequence of the connection, a recall of mineralized waters characteristic of the southern portion of Mt. Maggiore has been observed in well fields at Mt. Tifata. At Mt. Maggiore the mineralization of groundwater is related to local faults, while moving away from them the mineralization is greatly reduced. This opens broader prospects for water utilization, for example, a more specific use for mineralized waters (such as bottling, balneotherapy, etc.) and a potable use in areas distant from the mineralized zone. In conclusion, as revealed in this study, stakeholders and water managers need to consider these carbonate aquifers as a whole groundwater body (i.e., not anymore as separated aquifers) when planning their utilization.

How to cite: Stevenazzi, S., Corniello, A., Ducci, D., Stellato, L., Massaro, L., and Del Gaudio, E.: Unveiling groundwater flow connection in carbonate aquifers through the combined use of hydrochemical and isotopic data and water budget evaluation: a case study in Southern Italy, EGU General Assembly 2024, Vienna, Austria, 14–19 Apr 2024, EGU24-18858, https://doi.org/10.5194/egusphere-egu24-18858, 2024.

EGU24-19087 | ECS | Posters on site | HS8.2.2

Improvement in the subterranean knowledge of the Limarí river basin to support decision making in the context of drought. 

Giulia De Pasquale, Pedro Sanzana, Yerelin Carcamo, Etienne Bresciani, Remi Valois, and Pablo Alvarez

Water scarcity has 35% of Chile's population under a severe drought for over a decade. Local communities formed by users of surface or groundwater resources have been pushing to reach agreements prioritizing human consumption and ecosystem services over productive uses (e.g., Industry, Agriculture, and Mining). The new Chilean Water Code, in operation from April 2022, indicates that once a flow shortage evolves into a “Severe Drought”, the General Water Directorate of the country can request a “Redistribution Agreement” in coordination with the local water communities. In the last decades, in the Limarí Basin (semi-arid northern Chile), groundwater exploitation has increased significantly to maintain irrigation and drinking water supplies.  Therefore, a good knowledge about groundwater resources and their vulnerability is essential to develop sustainable water management strategies at a collective level. Also, because at the basin there is a coastal wetland (Salala) of high environmental interest. In this study, we aimed to characterize and model a mountainous watershed in the semi-arid Chilean Andes. The area of interest is distinguished by a high topographic gradient and narrow valleys filled with sedimentary deposits of various origins and surrounded by plutonic and volcanic-sedimentary rocks. To characterize the hydrostratigraphy of this complex sedimentary system and to estimate the volume of groundwater stored, we implemented a multidisciplinary approach integrating geophysical data from transient electromagnetic sounding (TEM), hydrogeological, geological, geomorphological and groundwater quality information. The results indicate the presence of two aquifer layers in most of the investigated areas: a superficial unconfined aquifer and a deeper confined (or semi confined) aquifer. We found that the width and depth of the sedimentary deposits increase with decreasing topography, while the proportion of fine material increases, in coherence with the sedimentation processes. Finally, we quantified the groundwater contribution of the different areas of the catchment and identified the main aquifer potential area in the pediplanes of the coastal mountain range (storing approximately 49% of the water available for extraction).The main contributions to the total uncertainties on the groundwater storage (ranging between 30 and 80% of the estimated volumes) are due to the propagation of the uncertainty on the thickness and porosity/specific yield of the modeled hydrostratigraphic layers. Due to the large spacing between TEM soundings and the limited number of stratigraphic bore logs in part of the studied area, the obtained characterization should be integrated with additional data for precise borehole sittings. Nevertheless, the implementation of TEM allowed us to cover an extensive area and to reach a large depth of exploration, so that it was possible to extract general information about the hydrostratigraphy of the different areas of the catchment.

How to cite: De Pasquale, G., Sanzana, P., Carcamo, Y., Bresciani, E., Valois, R., and Alvarez, P.: Improvement in the subterranean knowledge of the Limarí river basin to support decision making in the context of drought., EGU General Assembly 2024, Vienna, Austria, 14–19 Apr 2024, EGU24-19087, https://doi.org/10.5194/egusphere-egu24-19087, 2024.

EGU24-20789 | Posters on site | HS8.2.2 | Highlight

Hydrogeological vigilance in the Eternal City: Insights from the development and strengthening of Rome's groundwater monitoring network 

Francesco La Vigna, Claudio Papiccio, Mauro Roma, Rossella Maria Gafà, Lucio Martarelli, Angelantonio Silvi, Valerio Vitale, Gennaro Maria Monti, Maria Pia Congi, and Isidoro Bonfà

The Groundwater Monitoring Network of Rome (GMNR) was born on 2014 when the Environmental Protection Department of Roma Capitale (Municipality of Rome) decided to dedicate the more than 200 existing water wells (mainly developed for green areas irrigation) also for monitoring purposes. The GMNR considerably contributed to the development of the new Hydrogeological Map of Rome on 2015. Recently, by an agreement between Roma Capitale and ISPRA (Geological Survey of Italy) the monitoring activities have been strengthen, several new wells have been surveyed and all data are inserted and are available in a web-GIS system and an interactive map.

Each monitoring station visible on the interactive map have a link to a graph showing the trend over time of the measured parameters. In this regard, a system has been developed in order to allow the collection and the entry to the central database of investigated data even in real time by means of portable devices (tablet or smartphone), through a survey form. As a whole, this actually allow the field workers to quickly transmit the measured data - piezometric levels and in situ chemical-physical parameters - from the hydrogeological data collection site to a single online central database.

Moreover, recently, thanks to the CARG project (National Geological and Geothematic Cartography), several probes are going to be purchased and to be installed in a selection of the monitoring stations, contributing to the real time data sharing.

With the described agreement related to the GMNR, the survey activities are going to lead to a systematic structuring of information relating to the groundwater of the city of Rome, probably developing the first dedicated urban example in Italy, and contributing to enhance the local groundwater resource knowledge and also to increase public awareness in this regard.

How to cite: La Vigna, F., Papiccio, C., Roma, M., Gafà, R. M., Martarelli, L., Silvi, A., Vitale, V., Monti, G. M., Congi, M. P., and Bonfà, I.: Hydrogeological vigilance in the Eternal City: Insights from the development and strengthening of Rome's groundwater monitoring network, EGU General Assembly 2024, Vienna, Austria, 14–19 Apr 2024, EGU24-20789, https://doi.org/10.5194/egusphere-egu24-20789, 2024.

EGU24-499 | Posters on site | HS8.2.10

Simulating the Hydro-Geo-Chemical Processes during Submarine Groundwater Discharge by TOUGHREACT 

Tao Wang, Chenming Zhang, Ling Li, and Yajuan Yin

More than 60% of the global population lives in coastal areas, especially within 100 km from the coastlines, relying mostly on shallow groundwater resources. Seawater intrusion and submarine groundwater discharge (SGD) occur in the coastal aquifer systems, threatening these critical freshwater resources. Salinity seawater and fresh groundwater complexly interact with each other via SGD and SI. The SGD drives the discharge of not only a large volume of freshwater, but also terrestrial geochemical substances into the ocean through a mixing zone between discharging freshwater and recirculating seawater. The flux of SGD may be even greater than that of surface water through rivers and estuaries. For example, the SGD was estimated to be ~40 % and 80 %~160 % of the river water discharging flux into the South Atlantic Bight and Atlantic Ocean, respectively, and as a major source of dissolved organic matter and nutrients to Arctic coastal waters and the Mediterranean Sea.

A few hydrological models, including MARUN, SEAWAT, SUTRA, and PHT3D, are commonly used for SGD studies. The recently developed TOUGHREACT is robust in simulating coupled hydrodynamic, thermodynamic, and geochemical processes. From TOUGH2 (Transport Of Unsaturated Groundwater and Heat, version 2), a multi-dimensional numerical model for simulating coupled transport of water, vapor, non- condensable gas, and heat in porous and fractured media. However, TOUGHREACT is rarely used for SGD analysis, despite it being a well-rounded model with wide applications. Additionally, relevant studies on the iron (Fe) precipitation during SGD have focused predominantly on its spatial distribution and the adsorption of dissolved species, and studies on the genesis and geochemical evolution are scarce.

Therefore, we developed a systematic method using TOUGHREACT to simulate the hydrological processes in STEs and benchmarked the estimations; and then we numerically explored the groundwater flow and salt transport dur SGD by considering the influencing factors of tidal amplitude, freshwater head, seawater diffusion coefficient, and beach slope ratio. Consequently, by employing TOUGHREACT simulation, we analyzed the formation and spatiotemporal distribution of the Fe precipitation in the shallow beach aquifer due to the mixing of freshwater and seawater, and identified the key influencing factors during SGD.

The results show that, freshwater-derived Fe2+ is oxidized by O2(aq) in seawater during SGD, then precipitates as Fe (hydr)oxides (Fe(OH)3) to form an Fe precipitation zone. Fe(OH)3 tends to accumulate in the freshwater side of the mixing zone, whereas Fe(OH)3 precipitation in the seaward side of the mixing zone is inhibited by locally high H+ concentrations. The Fe(OH)3 first precipitates in the shallow aquifer, then extends to deeper layers over time, which is attributed to the increase in the residence time with the depth of both freshwater and seawater. The spatial distribution, and particularly, the extent of the iron curtain are influenced by the water flux and the concentration ratio of O2(aq) to Fe2+. These results are beneficial for better understanding the formation and distribution of iron curtains, and shed light on enhancing the understanding of the hydrogeochemical processes in subterranean estuaries.

How to cite: Wang, T., Zhang, C., Li, L., and Yin, Y.: Simulating the Hydro-Geo-Chemical Processes during Submarine Groundwater Discharge by TOUGHREACT, EGU General Assembly 2024, Vienna, Austria, 14–19 Apr 2024, EGU24-499, https://doi.org/10.5194/egusphere-egu24-499, 2024.

EGU24-1319 | ECS | Orals | HS8.2.10

Identifying urban subsurface thermal and hydraulic processes from time-series groundwater temperature data 

Ashley Patton, Peter Cleall, and Mark Cuthbert

The subsurface Urban Heat Island effect has been proposed as a shallow geothermal energy resource, however, annual near-subsurface temperature variation may result in unexpected system performance. Understanding heat transport processes in the urban subsurface is key to managing and modelling city-scale thermal regimes for geothermal energy resource development. Existing studies have focussed on analysis of repeat temperature-depth profiles rather than long-term groundwater temperature time-series. We show here how time-series analysis can complement temperature-depth profiles and offer additional insights into the controls on subsurface thermal transport processes.

Annual variations in temperature time-series from 49 boreholes in the Cardiff Geo-observatory (UK), recorded between 2014-2018, fall into several distinct shape categories. We hypothesise these shapes are indicative of the dominance of particular flow and heat transport mechanisms such that sinusoidal profiles are associated with conduction-only settings, while ‘right-skewed’ profiles denote the influence of advection. Short-lived temperature events are observed on the cooling limbs of such profiles and are correlated with groundwater level rises, indicative of recharge events. These winter temperature drops have the effect of cooling groundwater faster in winter than it is warmed in summer. The short timescales of these events suggest recharge is localised and may be controlled by preferential flow paths within the superficial deposits overlying the aquifer. While these events do have an overall cooling effect on the seasonal temperature profile, groundwater temperatures following these events recover quickly to levels near what they were before the recharge event, suggestive of the presence of local thermal non-equilibrium with the gravel aquifer. More complex behaviours observed in boreholes located close to the city’s rivers indicate recharge responses coupled with the influence of stream-aquifer interactions. Thus, temperature time-series data have potential as a tool to identify subsurface hydraulic and thermal processes, with implications for geothermal exploration and the wider field of hydrogeology.

How to cite: Patton, A., Cleall, P., and Cuthbert, M.: Identifying urban subsurface thermal and hydraulic processes from time-series groundwater temperature data, EGU General Assembly 2024, Vienna, Austria, 14–19 Apr 2024, EGU24-1319, https://doi.org/10.5194/egusphere-egu24-1319, 2024.

EGU24-1879 | ECS | Orals | HS8.2.10

Does an anthropogenically induced subsurface temperature hotspot affect groundwater ecology? 

Maximilian Noethen, Julia Becher, Kathrin Menberg, Philipp Blum, Simon Schüppler, Erhard Metzler, and Peter Bayer

Worldwide shallow groundwater is increasingly exposed to anthropogenic impacts. The thermal state of this important resource is affected not only by global warming but also by various local structures that release heat into the subsurface. This additional heat can accumulate and lead to local hotspots or - mostly urban - areas of elevated groundwater temperatures. The consequences of this warming for groundwater quality and ecology are widely unknown. Groundwater ecosystems are embedded in a naturally relatively stable environment, where temperature changes can affect the highly specialized, cold-stenotherm invertebrate community and meso- to psychrophilic microorganisms. In this study, we examine whether and how a groundwater temperature hotspot impacts groundwater ecology. We identified such a thermal anomaly in Hockenheim, Germany, caused by a water park with heated swimming pools and basements. The thermal impact was monitored over the course of a year by temperature data loggers in nine wells – four upstream and downstream of the structure each and one inside the basement. The same wells were sampled for chemical and microbiological parameters, such as the microbial total cell count and the cellular ATP content, as well as groundwater fauna. We additionally tested three wells in a nearby forest to obtain reference values that are mostly unaffected by anthropogenic interference. The measurements were repeated every three months in order to account for seasonal variations. The preliminary results show a local heat plume and an increase in groundwater temperatures by up to 8 K. However, there is no significant deterioration in the ecological parameters. Regarding the fauna, which generally shows low abundance due to oxygen depletion in the study area, we observed only a minor decrease within the thermally affected zone. Finally, the outcome of this study will improve our understanding of the vulnerability of groundwater ecosystems in the context of subsurface warming.

How to cite: Noethen, M., Becher, J., Menberg, K., Blum, P., Schüppler, S., Metzler, E., and Bayer, P.: Does an anthropogenically induced subsurface temperature hotspot affect groundwater ecology?, EGU General Assembly 2024, Vienna, Austria, 14–19 Apr 2024, EGU24-1879, https://doi.org/10.5194/egusphere-egu24-1879, 2024.

Springs offer insight into the sources and mechanisms of groundwater recharge and can be used to characterize fluid migration during earthquakes. However, few reports provide sufficient annual hydrochemical and isotopic data to compare the variation characteristics and mechanisms with both atmospheric temperature and seismic effects. As such, it is critical to obtain time series observations of stable isptopes (δ2H, δ18O and δ13CDIC) to understand the complex interactions between hydrological processes, cycle, and relationship with earthquakes. In this study, we used continuous δ2H, δ18O, δ13CDIC, and major ion data from four springs over 1 year to understand the groundwater origin, recharge sources, circulation characteristics, and coupling relationships with atmospheric temperature and earthquakes. We found that (1) the four springs are likely recharged by deep circulation of meteoric water from Bogda Mountain in the east, as well as long-distance runoff recharge from the Turpan Basin to the south. (2) atmospheric temperatures above and below 0 °C can cause significant changes in ion concentrations and water circulation depth, resulting in the mixing of fresh and old water in the aquifer, it can cause changes in δ13CDIC but it doesn’t work in δ2H and δ18O. (3) Earthquakes of magnitude ≥ 4.8 within a 66 km epicentral distance can alter fault zone characteristics (e.g., permeability) and aggravate water–rock reactions, resulting in significant changes in δ2H, δ18O, and hydrochemical ion concentrations, accompanied by limited changes in δ13CDIC. (4) Hydrogen and oxygen isotopes are the most sensitive precursory seismic indicators. The results of this study offer a reference for the establishment of long-term hydrochemical and isotopic monitoring, with the potential for use in earthquake forecasting.

This work is financially supported by the Natural Science Foundation of China (Grant No. 42373067) and by the Science for Earthquake Resilience (grant number XH23048C).

How to cite: Zhou, Z., Ren, X., Zhong, J., and Feng, X.: Response Characteristics of Hydrogen, Oxygen, and Carbon Isotope Composition to Atmospheric Temperature and Seismic Activity in Spring Water Hydrogeochemistry, EGU General Assembly 2024, Vienna, Austria, 14–19 Apr 2024, EGU24-2499, https://doi.org/10.5194/egusphere-egu24-2499, 2024.

EGU24-4000 | Posters on site | HS8.2.10

The impact of our warming climate on global groundwater temperatures 

Susanne A. Benz, Dylan J. Irvine, Gabriel C. Rau, Peter Bayer, Kathrin Menberg, Philipp Blum, Rob C Jamieson, Christian Griebler, and Barret Kuryly

Groundwater, the largest reservoir of unfrozen freshwater on Earth, plays a crucial role in supporting life and ecosystems. Its thermal regimes influence various environmental processes, impacting groundwater-dependent ecosystems, geothermal potential, and groundwater quality. Despite its significance, little is known about how groundwater responds to surface warming across spatial and temporal scales. Here we present a comprehensive analysis of global groundwater temperature patterns, utilizing the latest CMIP6 scenarios.

In this study we developed the first global model of groundwater temperature patterns, combining analytical solutions to conductive heat transport with high-resolution maps of ground thermal diffusivity and geothermal gradient. This model, validated with over 8,000 groundwater temperature measurements, allows users to estimate present and future temperature depth profiles globally. Past trends show a median global groundwater temperature increase of 0.3 °C over the last two decades. When simulating projected groundwater temperatures globally, our model reveals an average warming of 2.2°C (SSP 245) to 3.8°C (SSP 585) between 2000 and 2100 at the depth of the water table. Regional variations are substantial due to climate change and water table depth variability, with mountainous regions exhibiting the lowest warming rates. These distinct regional variations emphasize important thermal controls and the need for localized analysis.

Our work sheds light on the importance of understanding groundwater warming patterns, identifying 'hot spots' that may pose risks to both ecosystems and human well-being. In this study we also offer a specific focus on Europe, providing averages to enhance regional relevance and address emerging challenges in groundwater quality and habitat preservation.

How to cite: Benz, S. A., Irvine, D. J., Rau, G. C., Bayer, P., Menberg, K., Blum, P., Jamieson, R. C., Griebler, C., and Kuryly, B.: The impact of our warming climate on global groundwater temperatures, EGU General Assembly 2024, Vienna, Austria, 14–19 Apr 2024, EGU24-4000, https://doi.org/10.5194/egusphere-egu24-4000, 2024.

EGU24-4575 | ECS | Orals | HS8.2.10

Offshore freshened groundwater identified in southern Sicily (Italy) by applying well logs petrophysical interpretation.  

Damiano Chiacchieri, Lorenzo Lipparini, Aaron Micallef, and Elizabeth Quiroga

The work focused on the Oligo-Miocene Ragusa Formation, a known regional shallow aquifer in the Hyblean Plateau in southern Sicily, made of medium to high porosity carbonates deposited in the ramp environment, also investigated in the adjacent offshore by deep well drilling.

The main objective was to investigate if and how this known shallow onshore aquifer extend in the coastal area and possibly offshore.

A detailed methodology was defined for the quantitative use of geophysical logs from about five deep Oil & Gas wells to characterize groundwater in the Ragusa Formation in terms of pressure, piezometry and salinity distribution, as it follows:

  • A first step was the digitization of the full suite of logs required for the application of petrophysical workflow for each well analysed, for a total of about 25 km of digitized logs, such as SP (Spontaneous Potential), GR (Gamma Ray), DT (Sonic log) and Resistivity logs.
  • At the same time a synthetic lithological log for each selected well was built, to support the understanding of lithological influence of electrical logs.
  • A customised petrophysical workflow to calculate porosity and salinity (concentration of salts in TDS) was applied, considering: lithotypes, BHT (borehole temperatures), porosity (derived to DT – sonic log), pore fluid resistivity.
  • A comparison of TDS results with salinity data from DST and composite logs was performed.
  • A detailed well correlation and comparison between onshore shallow water wells and deep Oil&Gas wells, both onshore and offshore, was carried out.

By applying this petrophysical approach, it was possible to identify and quantified key indications of the presence of fresh groundwater in the Ragusa Formation carbonates both onshore and offshore in southern Sicily (Italy). Indeed, has been demonstrated that the onshore outcropping aquifer appear likely connected with the deep offshore aquifer due to positive indications in the same geological formation 10 km offshore from the coastline.

How to cite: Chiacchieri, D., Lipparini, L., Micallef, A., and Quiroga, E.: Offshore freshened groundwater identified in southern Sicily (Italy) by applying well logs petrophysical interpretation. , EGU General Assembly 2024, Vienna, Austria, 14–19 Apr 2024, EGU24-4575, https://doi.org/10.5194/egusphere-egu24-4575, 2024.

EGU24-4855 | ECS | Orals | HS8.2.10

Hydrogeochemical Characteristics and Genetic Mechanisms of Geothermal Fields in the Xi'an Depression of the Weihe Basin 

Jian Liu, Zhanli Ren, Qiang Yu, Xinyun Yan, Kai Qi, Zhen Wang, Sasa Guo, Huaping Lan, Mingxing Jia, and Yanzhao Liu

The geothermal resources in sedimentary basins have high potential for development and utilization, and have become an important research topic worldwide(Olasolo et al.,2016; Pasvanoğlu and Çelik., 2019; Duan et al.,2022). This paper focuses on the genetic mechanism and evolution process of deep geothermal water were explored through the analysis of hydrogeochemical and isotope geochemical data, which can provide technical and theoretical support for the sustainable development of geothermal fields in the Weihe basin. The study indicates that: (1)the hydrochemical type of geothermal water of Dongda geothermal field are predominantly HCO3·SO4-Na type. Meanwhile, the hydrochemical type of geothermal water of the northern Xi'an Depression are mainly SO4·HCO3-Na and SO4·HCO3·Cl-Na types. The ionic fraction is primarily influenced by the dissolution of silicate and evaporite minerals, as well as alternating cation adsorption. (2) Geothermal water is primarily recharged by atmospheric precipitation originating from the Qinling Mountains. The recharge elevation ranges from 677.94 m to 1467.65 m. (3) The Dongda geothermal field has a thermal storage temperature ranging from 50.19℃ to 80.29℃, and a depth of thermal circulation ranging from 1126.32 m to 2129.62m. Meanwhile, the northern Xi'an depression has a thermal storage temperature ranging from 73.17℃ to 109.50℃, and a depth of thermal circulation ranging from 1892.41 m to 3103.22 m. (4) The δ18O of the geothermal water in the northern Xi'an depression is more significantly shifted to the right of the atmospheric precipitation line than that of the Dongda geothermal water, indicating a significant “oxygen drift”.(5) The Dongda geothermal reservoir in the southern Xi'an Depression mainly experiences heat transfer through convection, while the geothermal reservoir in the northern Xi'an depression experiences heat transfer through conduction.

References

[1]Duan, R., Li, P., Wang, L., He, X., & Zhang, L. (2022). Hydrochemical characteristics, hydrochemical processes and recharge sources of the geothermal systems in Lanzhou City, northwestern China. Urban Climate, 43, 101152.

[2]Olasolo, P., Juárez, M. C., Morales, M. P., & Liarte, I. A. (2016). Enhanced geothermal systems (EGS): A review. Renewable and Sustainable Energy Reviews, 56, 133-144.

[3]Pasvanoğlu, S., & Çelik, M. (2019). Hydrogeochemical characteristics and conceptual model of Çamlıdere low temperature geothermal prospect, northern Central Anatolia. Geothermics, 79, 82-104.

How to cite: Liu, J., Ren, Z., Yu, Q., Yan, X., Qi, K., Wang, Z., Guo, S., Lan, H., Jia, M., and Liu, Y.: Hydrogeochemical Characteristics and Genetic Mechanisms of Geothermal Fields in the Xi'an Depression of the Weihe Basin, EGU General Assembly 2024, Vienna, Austria, 14–19 Apr 2024, EGU24-4855, https://doi.org/10.5194/egusphere-egu24-4855, 2024.

EGU24-5269 | Orals | HS8.2.10

Exploring the Hidden Exchanges: Groundwater-Surface Water Interactions in a Critical Zone Observatory 

Julian Klaus, Günter Blöschl, Enrico Bonanno, Barbara Glaser, Laurent Gourdol, Christophe Hissler, Luisa Hopp, Laurent Pfister, and Keith Smettem

The exchange between groundwater (GW) and surface water (SW) plays a crucial role for streamflow generation and the biogeochemical cycles within landscapes. However, accurately observing and predicting this exchange remains challenging due to the spatial heterogeneity and temporally dynamic fluxes of groundwater within the stream corridor. This presentation offers new insights into the characteristics of GW-SW interactions and hydrological processes within the hillslope-riparian-stream continuum, employing a combined experimental and modeling approach. The research builds on a comprehensive, long-term dataset obtained through baseline monitoring in the Weierbach Experimental Catchment (WEC) in Luxembourg that is a 45-hectare forested catchment. In addition to baseline monitoring, our approach involved (i) a network of 43 wells and piezometers along a selected stream reach for continuous monitoring and tracer experiments, (ii) a network of 13 wells along the riparian-hillslope interface, and (iii) ground-based thermal infrared imagery to observe spatiotemporal dynamics of surface saturation along the stream corridor. An integrated surface-subsurface hydrologic model served as a hypothesis-testing tool to examine whether surface saturation is predominantly driven by groundwater inflow or precipitation and how the relevance of the processes – surface ponding from precipitation or subsurface exfiltration – change in space and time.

We coupled the hydrological model with a hydraulic mixing-cell approach that enabled deciphering the contributions from different water sources to SW. The well network and associated artificial tracer experiments provided valuable insights into the direction of GW-SW exchange, revealing directional variability at scales of a few meters. Additionally, wells at the riparian-hillslope interface demonstrated a strong non-linearity of GW contributions to SW, influenced by GW table fluctuations. The observed and simulated surface saturation aligned well, suggesting that GW exfiltration primarily controls surface saturation in the stream corridor. Furthermore, the mixing-cell simulations revealed that subsurface water exfiltration is the dominant source for riparian surface water and intermittent streamflow, with distinct differences between stream water and riparian surface saturation. Overall, the combination of experimental techniques, hydrologic modeling, and well networks clearly improved our understanding of GW-SW interactions and revealed previously hidden exchanges in the WEC.

How to cite: Klaus, J., Blöschl, G., Bonanno, E., Glaser, B., Gourdol, L., Hissler, C., Hopp, L., Pfister, L., and Smettem, K.: Exploring the Hidden Exchanges: Groundwater-Surface Water Interactions in a Critical Zone Observatory, EGU General Assembly 2024, Vienna, Austria, 14–19 Apr 2024, EGU24-5269, https://doi.org/10.5194/egusphere-egu24-5269, 2024.

The analysis of twenty geophysical well logs covering a shelf area of about 3,500 km2 in front of the Emilia-Romagna coast (Italy), has shown apparent resistivity (ρa) values consistent with important Offshore Freshened Groundwater (OFG) reserves stored in the first 450 m of the Middle-to-Upper Pleistocene succession, and extending seaward about 60 km from the modern shoreline. Four classes with different ρa intervals (i.e., different salinities) were identified. The first three (1, 2 and 3) classes are characterized by ρa ranges of 7-28 Ω m, 4-7 Ω m and 2-4 Ω m, respectively. These values are higher than seawater resistivity (< 2 Ω m - i.e., class 4) and, based on the OFG definition (i.e., “the water stored in the sub-seafloor with a total dissolved solid concentration below that of seawater”), they have been used for OFG identification. Class 1 ρa is coherent with fresh-to-brackish water content, whereas classes 2 and 3 have been interpreted as transitional to seawater.
The correlation of offshore wells (spontaneous potential and ρa profiles) with onshore data (stratigraphic and lithological) from water wells and additional geophysical well logs, led to the stratigraphic architecture reconstruction of the Plio-Pleistocene siliciclastic succession along onshore-offshore transects, up to 60 km-long, from the Apennine front to the Adriatic shelf. The uppermost (first 450 m) Middle to Upper Pleistocene interval displays a vertical alternation of high-permeability (amalgamated and laterally continuous gravel to sand bodies) and low-permeability (mud-dominated) strata made of fluvio-deltaic, coastal and shelfal deposits. The high-permeability bodies represent the offshore extension of the onshore aquifer systems, whereas the low-permeability units make the aquitards. Along the transects, different stratigraphic intervals characterized by the four ρa classes have been identified. The highest ρa values (class 1) have been documented in the first 300 m of the succession, despite its deposition mostly occurred in deltaic to marine (i.e., saline water) conditions. This interval wedges out seawards, with ρa progressively decreasing down to class 3 values at about 35 km from the coast. Similarly, ρa decreases vertically, between about 300 and 450 m depth. Such a vertical gradual decrease may suggest that locally aquitards do not completely prevent water exchange, and transitional classes 2 and 3 likely resulted from freshwater and seawater mixing through space and time. Below 450 m depth, ρa drops to < 2 Ω m (class 4), thus defining the lowermost limit of the OFG reserves.    
Onshore-offshore reconstructions additionally revealed how OFG aquifers are actively recharged in correspondence of the Apennine front, where the topographic gradient is higher and permeable units are subaerially exposed. Their extremely high degree of amalgamation even allows the topographically-driven recharge of the deeper (and marine) strata.
The relatively shallow depth (< 350 m) of the northern Adriatic aquifers and the presence of several and abandoned oil&gas platforms in the area, provide a good opportunity to further investigate these OFG reserves that are strategic for the densely populated Emilia-Romagna coastal plain.

How to cite: Campo, B. and Antonellini, M.: Offshore freshened groundwater reserves identification as revealed by geophysical and stratigraphic data: insights from the Northern Adriatic shelf (Italy) , EGU General Assembly 2024, Vienna, Austria, 14–19 Apr 2024, EGU24-5599, https://doi.org/10.5194/egusphere-egu24-5599, 2024.

EGU24-7016 | Posters on site | HS8.2.10

Characterization of near-shore fresh water and seawater interactions-the scale issues drawn from the experimental and numerical approaches 

Chuen-Fa Ni, Thanh Quynh Duong, Chia-Yu Hsu, Nguyen Thai Vinh-Truong, and Yu-Huan Chang

Understanding the dynamics of water and mass interactions in the coastal area is essential to quantify the influences of near-shore land use on the coastal aquifers and water environment. The study aims to integrate innovative experiments and modeling techniques to assess the heat and water exchanges in the coastal aquifer of the Taoyuan Tableland in northwestern Taiwan. The site-specific hydraulic and heat tracer tests are conducted to obtain flow and heat transfer properties for the specific aquifer layers at the site. We then used the SEAWAT numerical model to quantify the freshwater and seawater interactions. The model calibration relies on the groundwater levels and quality obtained from monitoring wells installed perpendicular to the shoreline. The experimental results show that the active heat tracer tests could significantly improve the identification of aquifer layers along a well and allow for the estimations of high-resolution natural groundwater flux toward the sea. The estimated flow rate based on the heat tracer test is approximately 0.2 m/day per unit depth. The numerical model shows good agreement with the observed water levels in wells. In the study area, the location of the seawater/groundwater mixing interface is estimated at approximately 350m seaward from the shoreline, which suggests the submarine groundwater discharge zone for the site. The vertical profile model shows that the flow rate for the 100m depth aquifer varies from 51 to 60 m3/day per unit width, depending on the tidal variations and upstream groundwater levels. The results show a large flow rate discrepancy between experimental and numerical approaches, which the resolution scales of the approaches might induce in the calculations. The water levels obtained from the fully opened screen wells might mix the flow responses in different aquifer layers.

How to cite: Ni, C.-F., Duong, T. Q., Hsu, C.-Y., Vinh-Truong, N. T., and Chang, Y.-H.: Characterization of near-shore fresh water and seawater interactions-the scale issues drawn from the experimental and numerical approaches, EGU General Assembly 2024, Vienna, Austria, 14–19 Apr 2024, EGU24-7016, https://doi.org/10.5194/egusphere-egu24-7016, 2024.

EGU24-7668 | ECS | Orals | HS8.2.10

Downhole passive fiber optics temperature monitoring for improved characterization of aquifer heterogeneities 

Davide Furlanetto, Matteo Camporese, Luca Schenato, Leonardo Costa, and Paolo Salandin

Unconfined shallow aquifers are particularly exposed to the risk of contamination. Especially when exploited for drinking water production, for which water quality is of particular concern, careful monitoring of the physical processes and detailed characterization of the subsurface properties are crucial. Furthermore, the possible presence of heterogeneities, such as intricate networks of hydraulically conductive paleo-channels that are often inherent in alluvial aquifers, can establish preferential pathways. Consequently, monitoring activities in these complex environments pose serious challenges and raise the demand for advanced techniques and innovative approaches. In this context, recent advances have been made possible by employing Fiber Optics Distributed Temperature Sensing (FO-DTS). This technology combines the use of heat as a natural tracer with a detailed spatiotemporal resolution and has proven informative in a wide variety of applications. In this study, we applied downhole passive FO-DTS to a cluster of piezometers in a highly heterogeneous phreatic gravelly aquifer. The aquifer is exploited for irrigation and drinking water supply, and exhibits both natural and pumping-induced groundwater temperature fluctuations. Vertical transient water temperature profiles were acquired over a 1-month experiment. Borehole-dependent and depth-related features of the temperature measurements were ascribed to possible spatial structures having different hydraulic conductivity. The collected data were used to invert the three-dimensional saturated hydraulic conductivity field of a physics-based numerical model that couples flow and heat transport. Even without active heating, FO-DTS has demonstrated its ability to provide valuable insights at an unprecedentedly high resolution.

How to cite: Furlanetto, D., Camporese, M., Schenato, L., Costa, L., and Salandin, P.: Downhole passive fiber optics temperature monitoring for improved characterization of aquifer heterogeneities, EGU General Assembly 2024, Vienna, Austria, 14–19 Apr 2024, EGU24-7668, https://doi.org/10.5194/egusphere-egu24-7668, 2024.

EGU24-9552 | ECS | Posters on site | HS8.2.10

Spatio-temporal distribution of subsurface urban heat islands – Insights from shallow groundwater temperature monitoring in Vienna 

Eva Kaminsky, Gregor Laaha, Cornelia Steiner, Eszter Nyéki, Constanze Englisch, Christian Griebler, and Christine Stumpp

In numerous cities worldwide, a rise in surface temperatures had been observed, contributing to the so-called "urban heat island effect". This effect leads to extended and hotter periods of warm weather within urban areas not only above but also below ground. The heat in the subsurface can be used for shallow geothermal energy, but it requires knowledge of spatial and temporal variations in groundwater temperature for efficient and environmentally friendly utilization of groundwater for heating and cooling. In the course of the 'Heat below the City' project, we have compiled spatial high-resolution data and developed groundwater temperature maps for the city of Vienna targeting the coldest and warmest annual conditions. Borehole temperature profiles were recorded in October 2021 and April 2022. This enabled the identification of distinct urban heat islands. Additionally, available long-term data (2001-2020) was used to conduct annual temperature trend analyses and extreme value assessments to evaluate temperature changes over time. In Vienna, an average annual temperature increase, considering all significant trends, of 0.9 ± 0.1 K/decade was observed for air, soil and shallow groundwater between 2001 and 2021. However, the increase is non-linear and, over the last decade, the change has accelerated with an increase of 1.4 ±0.2 K/decade (only significant trends taken into account). The current annual mean temperature is 14.1 °C (2021/ 2022) with individual warmer urban heat islands and locally heated locations of up to 30.6°C. Trends in extreme temperatures (represented by the lower/upper 10th percentile air, soil and groundwater temperature in quantile regression) generally show the strongest increase in the lower 10th percentile temperatures for all air and soil temperatures. But this varies site-specifically in shallow groundwater, where urban infrastructure and the interaction between surface and groundwater, in addition to climate change, influence groundwater warming. Potentially, those urban heat islands with increasing trends in groundwater temperatures have great potential for heat utilization, but should not be used for extraction of cold. These findings emphasize the importance of spatial and temporal high-resolution data and highlight the necessity for site-specific aquifer characterization for a sustainable use of shallow geothermal energy for heating and cooling.

How to cite: Kaminsky, E., Laaha, G., Steiner, C., Nyéki, E., Englisch, C., Griebler, C., and Stumpp, C.: Spatio-temporal distribution of subsurface urban heat islands – Insights from shallow groundwater temperature monitoring in Vienna, EGU General Assembly 2024, Vienna, Austria, 14–19 Apr 2024, EGU24-9552, https://doi.org/10.5194/egusphere-egu24-9552, 2024.

EGU24-10761 | ECS | Orals | HS8.2.10

Conceptual 3D groundwater models of offshore freshened groundwater extraction and its economic viability assessment 

Daniel Zamrsky, Joep J.H. van Lith, and Rens van Beek

Offshore freshened groundwater reserves have been identified in numerous regions worldwide. These reserves were often deposited during past sea level lowstands and are therefore non-renewable and slowly salinized by infiltrating seawater. However, in some cases these offshore freshened groundwater reserves can be connected to inland groundwater systems and can be recharged by fresh groundwater inflow from the landward direction. It has recently been suggested that these offshore freshened groundwater reserves could provide an additional source of fresh (and brackish) water for coastal communities that often face increasing fresh water stress. The feasibility, both economic and physical, of offshore freshened groundwater extraction is investigated in this study. To assess this feasibility from a physical point of view we built a set of 3D semi-conceptual groundwater flow models using the imod-wq code which allows us to estimate the offshore groundwater salinity development over large time scales (i.e. one glacial-interglacial cycle). The result of these large time scale models can be interpreted as estimations of the current offshore groundwater salinity conditions and thus provide a better picture of the current presence and magnitude of the offshore freshened groundwater resources in the model domain. In the next modelling stress period we introduce a set of pumping wells into the offshore domain and simulate several offshore freshened groundwater extraction scenarios. In such way we can evaluate the time it takes for these offshore freshened groundwater reserves to be fully salinized and exhausted. Additionally, we can also assess any potential negative impacts on the groundwater system in the coastal hinterland such as decreasing groundwater levels and/or increased salinization.

In the second part of our study we evaluate the economic feasibility of the offshore freshened groundwater pumping and use as additional fresh water resource for coastal communities. Several coastal areas located in south and south-east Asia (e.g. Pearl River delta) were selected since this region is identified as a region with high possibility and magnitude of offshore freshened groundwater resources. The economic parameters that are taken into account as favourable for offshore freshened groundwater exploration are (i) the overall economic development (e.g. GDP, HDI), (ii) the presence of groundwater pumping and desalination plants inland meaning the technology is already present in the region and (iii) costs of fresh water and groundwater pumping and desalination infrastructure in the region. Our study is only the first step in assessing the feasibility of offshore freshened groundwater exploration and hopefully our approach will be improved and tested in other coastal regions around the world to evaluate the full potential of these still untapped fresh groundwater resources.

How to cite: Zamrsky, D., van Lith, J. J. H., and van Beek, R.: Conceptual 3D groundwater models of offshore freshened groundwater extraction and its economic viability assessment, EGU General Assembly 2024, Vienna, Austria, 14–19 Apr 2024, EGU24-10761, https://doi.org/10.5194/egusphere-egu24-10761, 2024.

The validation of hydrogeological distributed models in western african countries is limited by the quality and availability of point station data measured in-situ. Climate models, satellite and reanalysis data have been suggested to overcome this limit. Here, we assessed the quality of ERA5 reanalysis on water table depth (WTD), and soil water content (SWC) over the Benin basins at spatial scale and monthly time scale. The single-levels version with 0.25° x 0.25° resolution (ERA5) and the land surface version with 0.1° x 0.1° resolution (namely LAND) were compared with point station data using the correlation performance evaluators and the Mean Absolute Error (MAE). The results showed that ERA5 and LAND reanalysis present well the water planes of Benin (WTD =0m). Outside wetlands areas, both reanalyses slight overestimation the WTD (MAE of ERA5=4.73m vs. LAND=3.13m. The SWC between 0-7 cm; 7-28cm and 28-100cm presented on both reanalyses are well in line with observations for all stations and on a monthly scale (correlation sometimes > 0.85 for LAND and 0.83 for ERA5). We recommend the use of LAND for validation of hydrogeological distributed models in Benin. Correcting the variables of these reanalyses could improve their performance.

How to cite: Bodjrenou, R.: Assessment of water table depth and soil water content Estimates from ERA5 reanalysis in Benin (West Africa), EGU General Assembly 2024, Vienna, Austria, 14–19 Apr 2024, EGU24-12160, https://doi.org/10.5194/egusphere-egu24-12160, 2024.

EGU24-12406 | ECS | Posters on site | HS8.2.10

Investigating Submarine Groundwater Transmissivity in Svalbard Fjord Sediments through the Analyses of Physical Properties and Chemical Composition 

Zaga Trisovic, Matthew O'Regan, Sophie ten Hietbrink, Beata Szymczycha, Arunima Sen, Aivo Lepland, Jochen Knies, and Wei-Li Hong

We investigate submarine groundwater transmissivity within Svalbard fjord sediments, where offshore freshened groundwater (OFG) was confirmed through analyses of dissolved chloride concentration and water isotope signatures (δ18O and δ2H). The analyses are comprised of physical, mechanical, and chemical attributes of three cores recovered from Tempelfjorden and Hornsund fjords. Multi-Sensor Core Logger (MSCL) analyses provide high-resolution physical characteristics of the sediment cores, including bulk density, p-wave velocity, magnetic susceptibility, and electrical resistivity. These are integrated with X-ray computed tomography (CT) images, acquired with a Geotek rotating X-ray CT system (RXCT), to identify sedimentary facies, which are used to investigate internal core structures. Discrete measurements of grain density and grain size are used to calculate sediment porosity and to estimate the permeability. Our results indicate a heterogeneous sediment matrix with frequent drop stones and ice-rafted debris interlayered with finer-grained materials. We hypothesize that the sediment matrix packaging and configuration is an important control for the sediment permeability and thus for freshened groundwater transmissivity in the sediments of these fjords. This work is not only relevant for characterizing groundwater transmissivity in Svalbard's fjords but also will contribute to ongoing geological modeling efforts. Our findings pave the way for hydrogeological simulations, enhancing our understanding of OFG occurrence, emplacement mechanisms, and OFG volumes over successive glacial cycles.

How to cite: Trisovic, Z., O'Regan, M., ten Hietbrink, S., Szymczycha, B., Sen, A., Lepland, A., Knies, J., and Hong, W.-L.: Investigating Submarine Groundwater Transmissivity in Svalbard Fjord Sediments through the Analyses of Physical Properties and Chemical Composition, EGU General Assembly 2024, Vienna, Austria, 14–19 Apr 2024, EGU24-12406, https://doi.org/10.5194/egusphere-egu24-12406, 2024.

EGU24-13147 | Posters on site | HS8.2.10

Assessing Surface Water and Groundwater Interactions Using Long-Term Hydrological and Time-Lapse Seismic Data in the Orgeval Critical Zone Observatory 

Agnès Rivière, Marine Dangeard, Ludovic Bodet, Ramon Sanchez Gonzalez, and Alexandrine Gesret

Quantifying the water and heat fluxes at the interface between surface water (SW) and groundwater (GW) is a key issue for hydrogeologists to consider for safe yield and good water quality. However, such quantification with field measurements is not straightforward because the SW-GW changes depend on the boundary conditions and the spatial description of the hydrofacies, which aren't well known and are usually guessed by calibrating models using standard data like hydraulic heads and river discharge. We provide a methodology to build stronger constraints to the numerical simulation and the hydrodynamic and thermal parameter calibration, both in space and time, by using a multi-method approach. Our method, applied to the Orgeval Critical Zone Observatory (France), estimates both water flow and heat fluxes through the SW-GW interface using long-term hydrological data, time-lapse seismic data, and modeling tools. We show how a thorough interpretation of high-resolution geophysical images, combined with geotechnical data, provides a detailed distribution of hydrofacies, valuable prior information about the associated hydrodynamic property distribution. The temporal dynamic of the WT table can be captured with high-resolution time-lapse seismic acquisitions. Each seismic snapshot is then thoroughly inverted to image spatial WT variations. The long-term hydrogeological data (such as hydraulic head and temperature) and this prior geophysical information are then used to set the parameters for the hydrogeological modeling domain. The use of the WT geometry and temperature data improves the estimation of transient stream-aquifer exchanges.

How to cite: Rivière, A., Dangeard, M., Bodet, L., Sanchez Gonzalez, R., and Gesret, A.: Assessing Surface Water and Groundwater Interactions Using Long-Term Hydrological and Time-Lapse Seismic Data in the Orgeval Critical Zone Observatory, EGU General Assembly 2024, Vienna, Austria, 14–19 Apr 2024, EGU24-13147, https://doi.org/10.5194/egusphere-egu24-13147, 2024.

EGU24-13973 | ECS | Orals | HS8.2.10

Turn up the heat to locate and quantify groundwater flow in fractured rock aquifers in coastal zones of the tropical island of Curaçao 

Titus Kruijssen, Mike Wit, Sandra Akkermans, Joshua Leusink, Boris van Breukelen, Martine van der Ploeg, and Victor Bense

Dual porosity flow is an important mechanism for groundwater transport in fractured rock aquifers. However, quantification and characterization of fracture flow systems remains challenging, as it often involves complex procedures such as the injection of tracers. In this study we conducted single-well pumping tests in 11 uncased wells in a coastal fractured rock aquifer while monitoring in-well salinity and temperature gradients through downhole casts using a Conductivity-Temperature-Depth (CTD) logger. In this way, we aimed to observe how naturally occurring salinity gradients in the well become disturbed by induced groundwater flow to the well, and if these gradients may serve as natural tracers for fracture flow. Since natural temperature gradients in the wells are minimal, we applied point electrical heating at the bottom of the well to create a plume of slightly warmer water to migrate up the wellbore during pumping from the top. During the pumping tests in this set-up, repeated CTD casts suggest that groundwater flow to these wells is strongly focused along narrow zones and is occurring at various rates over a range of salinities and temperatures. Hence, the observed patterns in both salinity and temperature presumably reflect the presence of fracture zones, which could indeed be confirmed by downhole camera observations for some wells. Further data analysis resulted in detailed hydrogeological characterization of the 11 wells, comprising an assessment of the fracture density and hydraulic conductivity of the aquifers, as well as the origin of the inflowing water being meteoric mostly fresh water or deeper saline groundwater.

How to cite: Kruijssen, T., Wit, M., Akkermans, S., Leusink, J., van Breukelen, B., van der Ploeg, M., and Bense, V.: Turn up the heat to locate and quantify groundwater flow in fractured rock aquifers in coastal zones of the tropical island of Curaçao, EGU General Assembly 2024, Vienna, Austria, 14–19 Apr 2024, EGU24-13973, https://doi.org/10.5194/egusphere-egu24-13973, 2024.

Geothermal heat production and aquifer thermal energy storage have significant potential to contribute to the energy transition. However, due to higher temperature inside the wells used, it is known that this leads to heat loss through conduction to the surrounding cooler, shallower groundwater systems. Therefore it is important to be able to anticipates such impacts to allow effective monitoring and prevention or mitigation measures when needed. However the thermal impact on groundwater systems is expected to strongly depend on local conditions. Therefore, this study focused on the impact of operational conditions (e.g. effective well temperatures and intermittency) and aquifer conditions (e.g. permeabilities and heterogeneity) on the resulting heat transport processes into the aquifer by conduction and density driven flow. To evaluate the degree and variation of impact that may occur under field conditions, the heat loss to a shallow groundwater system was simulated using a 2D axisymmetric numerical MODFLOW 6 model for a wide range of conditions considering both the impact of conduction and density-driven flow. The results of this study indicate that the total thermal impact and its distribution (up to >10 m from the hot well in 10 years) in shallow groundwater systems is strongly impacted by the induced density driven flow in the relatively permeable layers of the groundwater system. Conduction is dominant in transfer of heat from the hot well in the low permeability confining layers and for mitigating temperature differences in the groundwater system induced by buoyancy flow. Overall, this study highlights the importance of considering local conditions in assessing thermal impact by heat losses from hot well casings, to allow distinguishing these thermal impacts from those induced by leakage and to allow efficient thermal groundwater impact monitoring.

How to cite: de Vries, E. and Hartog, N.: Thermal impact on shallow groundwater systems by heat loss from hot wells: the impact of operational conditions and subsurface heterogeneity, EGU General Assembly 2024, Vienna, Austria, 14–19 Apr 2024, EGU24-15116, https://doi.org/10.5194/egusphere-egu24-15116, 2024.

The presented study focuses on quantifying the impact of the anthropogenic heat input from residential buildings on the subsurface temperature regime, employing an innovative approach that combines building physics simulations with heat and groundwater flow modelling. To enhance the applicability of the approach, sensitivity analyses of various parameters that govern the heat transfer from the investigated buildings are performed. The investigated parameters took hydrogeological and meteorological conditions, building properties (including different insulation standards and building types) as well as petrophysical rock properties into account.

The findings contribute to a comprehensive understanding of the subsurface temperature regimes within densely settled areas, which is particular significant for the impact assessment of shallow geothermal applications. Results of the study show that neglecting anthropogenic heat input may lead to an underestimation of the effects of shallow geothermal applications on the underground temperatures.

How to cite: Hastreiter, N. and Vienken, T.: Anthropogenic heat input into the subsurface: Influencing factors and its importance during shallow geothermal impact assessment, EGU General Assembly 2024, Vienna, Austria, 14–19 Apr 2024, EGU24-16623, https://doi.org/10.5194/egusphere-egu24-16623, 2024.

EGU24-17299 | ECS | Orals | HS8.2.10

Groundwater Level Assessment using Data logger and Manual monitoring in developing Country, southwestern Ethiopia 

Adisu Befekadu Kebede, Fekadu Fufa Feyessa, Thomas Hermans, and Kristine Walraevens

Groundwater monitoring is fundamental, especially for areas where there is a high dependency on groundwater use. Groundwater level (GWL) monitoring is poorly known in Ethiopia. The study focused on evaluating groundwater levels and their relation to precipitation in Ethiopia's Gilgel Gibe and Dhidhessa catchment areas. Groundwater levels (GWL), spring discharges, and rainfall data were collected from various points over the 2022/2023 hydrological year.  Rainfall varied across the region, increasing from April to September and decreasing from plateaus to lowlands with a value between 1539 mm to 1973mm annually. Groundwater levels showed significant spatial and temporal variation, influenced by precipitation and local topography.  Maximum water level varies between 17.6 and 5.75 m in the northwest, 11.6 and 6.2 m in the central part, 11.5 and 3.2 m in the east, 13.1and 4.2 m in the south. Minimum water level varies between 13.2 and 3.8 m in the northwest, 5.8 and 2.7 m in the central, 3.5 and 1.1 m in the east and 7 and 3. 6 m in the south of the study area. Groundwater level fluctuation in the automatically monitored well was 1.55m in the deep well and 3.99m in the shallow well. The spatial drop of the water table in the northwest and south is due to a hydraulic gradient to lowlands and depressions, and evapotranspiration from dense forest coverage. In the central and eastern study area, GWL is shallow and intermediate based on the positions of monitoring wells. Some wells are fully saturated during the rainy season between August and September. Shallow wells reacted swiftly to rainfall, but their levels declined in the dry season. Some wells in high elevation areas experienced minimal fluctuations due to their perched aquifer positions. Groundwater drawdown from usage in dug wells quickly recovered, suggesting potential for small-scale agricultural use. Long-term monitoring and increased data logging are recommended for future studies.

How to cite: Kebede, A. B., Feyessa, F. F., Hermans, T., and Walraevens, K.: Groundwater Level Assessment using Data logger and Manual monitoring in developing Country, southwestern Ethiopia, EGU General Assembly 2024, Vienna, Austria, 14–19 Apr 2024, EGU24-17299, https://doi.org/10.5194/egusphere-egu24-17299, 2024.

EGU24-17913 | Posters on site | HS8.2.10

Exploring historical anthropogenic influences on groundwater in the alluvial plain of the Upper Seine River 

Anne Jost, Gurpreet Dass, Fanny Picourlat, Shuaitao Wang, Laurence Lestel, David Eschbach, Nicolas Flipo, and Agnès Ducharne

Human activities have significantly influenced the hydrological functioning of wetlands since they were first settled, often with the aim of reducing their perceived inconvenient wetness. Reconstructing these historical developments and understanding their impacts on hydrosystems is essential to inform strategies for the sustainable management and conservation of these vital resources. We take the example of the upper Seine valley upstream of Paris, within the vast Bassée floodplain, to illustrate and quantify how the many artificial changes it has undergone over the centuries may have had a reciprocal effect on groundwater resources. We have identified three main types of land development, ranging from hydraulic works to direct groundwater abstraction, including land use changes associated with the extraction of alluvial sands and gravels that give rise to the gravel pit lakes that are particularly prominent in the study area. Our approach is based on a detailed cartographic reconstruction of each of these influences, feeding into a hydrogeological model of the plain. We outline the main principles behind its conception and then quantify the relative impacts of anthropogenic pressures on the aquifer system budget and water table depth.

How to cite: Jost, A., Dass, G., Picourlat, F., Wang, S., Lestel, L., Eschbach, D., Flipo, N., and Ducharne, A.: Exploring historical anthropogenic influences on groundwater in the alluvial plain of the Upper Seine River, EGU General Assembly 2024, Vienna, Austria, 14–19 Apr 2024, EGU24-17913, https://doi.org/10.5194/egusphere-egu24-17913, 2024.

EGU24-19115 | ECS | Orals | HS8.2.10

Passive characterization of aquifer permeability and shear modulus and their evolution following earthquakes using tidal signals 

Augustin Thomas, Jerome Fortin, Benoit Vittecoq, and Sophie Violette

Tidal analysis of borehole pressure has become in the recent years’ literature an essential method to follow the evolution of the hydraulic conductivity of an aquifer over time. Most traditional methods (mainly pumping or slug tests) only produce a small number of observations, and come at a greater cost. However, groundwater level tidal analysis only requires monitoring data at a sampling rate of 1 hour, data which is extensively available. These solutions are applicable provided aquifers respond to at least one tidal phenomenon among oceanic, earth or atmospheric tides.

Martinique Island, in the Lesser Antilles, is a very interesting field to study these techniques, since 16 years of piezometric level data have been recorded on this volcanic island in a monitoring network of 29 boreholes. Here we focus our study on a closely monitored study site in the Galion plain, with three boreholes, a seismometer and past conducted pumping tests and seismic surveys. We compute amplitude and phase response of aquifers to atmospheric and earth tides. Then, the response of the semi-confined aquifers to different loading sources at the tidal frequencies (between 1 and 2 cycles per day) is modelled. A careful inversion is done to obtain the characteristics of the aquifer, including aquifer transmissivity and shear modulus.

Finally, we analyse the evolutions of these inverted parameters and decipher their reversible and irreversible changes. Between earthquakes, we show the dominant effect of effective stress to control aquifer hydraulic conductivity. At the time of the earthquake, with the help of seismic stress numerical simulation, we show that seismic shear stresses are the most probable cause of aquifer properties changes both in permeability and shear modulus.

How to cite: Thomas, A., Fortin, J., Vittecoq, B., and Violette, S.: Passive characterization of aquifer permeability and shear modulus and their evolution following earthquakes using tidal signals, EGU General Assembly 2024, Vienna, Austria, 14–19 Apr 2024, EGU24-19115, https://doi.org/10.5194/egusphere-egu24-19115, 2024.

Temperature-depth profiles in the central part of the Netherlands collected over the past 7 years in a large number of piezometers document a regional increase in groundwater temperatures to depths of upto ~100 meters. This rise is congruent to observed increases in air temperature, related to climatic change. For some locations the data collected recently can be compared to similar observations done in the 1970-80s. Our observations show that the magnitude and rate of increase in groundwater temperature strongly vary by location and across depth. In part these differences can be explained by contrasts in land-surface conditions, but our analysis demonstrates that varying groundwater flow conditions also play an important role in explaining the observed patterns. Moreover, we show that an analysis of the transience in the temperature-depth profile can yield quantitative estimate of groundwater flow rates and subsurface hydraulic properties when combined with observations of hydraulic head gradients. We conclude that the current rising trends in groundwater temperature should provide a significant opportunity for the hydrogeological community to quantitatively analyze groundwater flow systems worldwide.

How to cite: Bense, V. and Kurylyk, B.: Drifting groundwater temperatures in the Netherlands: opportunities for hydrogeological analysis, EGU General Assembly 2024, Vienna, Austria, 14–19 Apr 2024, EGU24-19219, https://doi.org/10.5194/egusphere-egu24-19219, 2024.

EGU24-19836 | ECS | Posters on site | HS8.2.10

Offshore freshened groundwater emplacement in an evolving siliciclastic margin (Canterbury Bight, New Zealand): A 3D modeling approach 

Ariel Thomas, Daniel Zamrsky, Kamaldeen Omosanya, Mark Person, Joshu Mountjoy, and Aaron Micallef

Offshore freshened groundwater (OFG) represents a globally distributed subsurface resource with potential applications in water management, oil recovery, and environmental studies. Despite growing interest, the understanding of OFG systems, including their geometry, distribution, and emplacement dynamics, remains limited. In this study, we address these gaps by employing a novel 3D geostatistical modeling approach, focusing on the Canterbury Bight, a passive siliciclastic margin with proven OFG resources. Our methodology integrates high-resolution 2D seismic lines and borehole data, allowing us to capture the geological heterogeneity of the passive margin. Unlike traditional static models, our 3D approach considers the evolving stratigraphic architecture over multiple sea-level cycles, offering a more comprehensive understanding of OFG systems. Key findings include the successful incorporation of isostatic shifts and decompaction into our model, resulting in OFG distributions closely resembling those observed in the Canterbury Bight. We emphasize the importance of infilled buried channels and paleo-topographic highs in promoting OFG emplacement, shedding light on distribution patterns not easily explained by current seafloor topography or hydraulic heads. Our study advances the field by demonstrating how a 3D consideration of continental margin evolution significantly influences numerical estimations and improves the characterization of OFG resources. These findings contribute to a better understanding of OFG systems and provide valuable insights for future research and resource management.

How to cite: Thomas, A., Zamrsky, D., Omosanya, K., Person, M., Mountjoy, J., and Micallef, A.: Offshore freshened groundwater emplacement in an evolving siliciclastic margin (Canterbury Bight, New Zealand): A 3D modeling approach, EGU General Assembly 2024, Vienna, Austria, 14–19 Apr 2024, EGU24-19836, https://doi.org/10.5194/egusphere-egu24-19836, 2024.

The traditional territory of the Lù'àn Män Ku Dän (Kluane Lake People) is found along the Saint Elias Mountains in Yukon. It hosts the Burwash Landing community, home of the Kluane First Nation, which is one of eleven self-governing First Nations operating in tripartite with Yukon Government and Canada. Burwash Landing is primarily dependent on diesel for space heating and power generation. Cutting-edge technologies were deployed in the scope of geothermal resource assessment to evaluate the thermal state and properties of the subsurface. Active distributed temperature sensing was conducted with a composite heating and fiber-optic cable installed in the water column of two existing wells with the objective of quantifying the geothermal potential and groundwater flow along available wellbores. Heat injection tests were made in the 220 and 385 m deep wells located on the south and north side of the Denali fault, near a probable releasing bend that is favorable to permeability. Melting glacier water infiltrates in mountains and groundwater flows toward Kluane Lake, which is hypothesized to be a major groundwater discharge zone. The shallower well is at an altitude of 925 masl and intercepted 40 m of quaternary deposits before hitting fractured bedrock while the deeper well is at the valley bottom near the lake (altitude of 795 masl) and entirely drilled in quaternary deposits. Passive temperature monitoring was initially made and revealed a geothermal gradient of 34 ⁰C km-1 and 47 ⁰C km-1 in the shallow south side and deep north side wells. Heat was injected during active tests for 2 and 3 days and thermal recovery was monitored for 6 and 8 days, respectively. Temperature was measured every 25 cm at 4-minute intervals. The infinite line source equation and the superposition principle were used to analyze data and calculate a thermal conductivity profile. Nearly continuous ground thermal properties and temperature profiles were combined to assess the Earth natural heat flux, considering paleoclimate and topographic corrections. Analysis indicated a heat flux above 90 mW m‑2, thought to be favorable for geothermal resource development. Peclet number analysis was undertaken to infer horizontal groundwater flow in permeable horizons. Results are being used to develop a regional groundwater flow and heat transfer model to evaluate temperature at kilometer depth and assess the communities’ geothermal potential. This presentation will illustrate how active temperature sensing can be deployed to reduce geothermal exploration risks, acknowledging Kluane First Nation that allowed us to better understand groundwater flow in this magnificent territory.  

How to cite: Raymond, J., Chapman, F., Klepikova, M., Bour, O., and Soucy Laroche, R.: Active fiber-optic distributed temperature sensing to assess the geothermal potential and groundwater flow over the traditional territory of the Lù'àn Män Ku Dän, Yukon, EGU General Assembly 2024, Vienna, Austria, 14–19 Apr 2024, EGU24-20169, https://doi.org/10.5194/egusphere-egu24-20169, 2024.

EGU24-20229 | Posters on site | HS8.2.10

Characterization of deep infiltrations in subsurface drained agricultural system 

Hocine Henine, Julien Tournebize, Cedric Chaumont, Arnaud Blanchouin, Agnès Rivière, and Rémi Clément

Subsurface drainage practice is widely used in agriculture to eliminate temporary winter waterlogging of hydromorphic soils. Soil surface saturation is mainly due to the presence of an underlying layer (~1m deep) with a high clay content, considered as semi-impermeable. Generally, deep infiltration under this layer has been neglected in many hydrological studies. However, considering the variations in the ground water table levels, the recharge is mainly due to the deep infiltration. Understanding the dynamic of this infiltration is very important both for the quantitative management of groundwater resources and for the protection of its quality. Indeed, this infiltration can transfer spreading products (fertilizers and pesticides) used in agriculture, mainly the water-soluble molecules.

To understand the dynamic of the deep infiltration, hydrological and geophysical monitoring using ERT (Electrical Resistivity Tomography) method was set up on the drained experimental plot of Boissy le Châtel (Orgeval Observatory, in France). The water balance at the scale of the experimental plot highlighted the contribution of the deep infiltration to the groundwater table rise at the beginning of fall season.

Time-lapse geophysical survey coupled with water content monitoring on a 1.5m vertical profile showed the movement of a rewetting front from the soil surface towards deep layers during this very short transition period, which follows a precipitation event. After this period, during the intense drainage season, the deep infiltration below the drains continues (in the order of 0.12 mm/day compared to 2mm/day for subsurface drained flow) despite the rise of the water table to the surface layer. However, it is difficult to monitor its pathway using the passive ERT method, less sensitive to electrical resistivity variations in the range of soil water content close to saturation.

How to cite: Henine, H., Tournebize, J., Chaumont, C., Blanchouin, A., Rivière, A., and Clément, R.: Characterization of deep infiltrations in subsurface drained agricultural system, EGU General Assembly 2024, Vienna, Austria, 14–19 Apr 2024, EGU24-20229, https://doi.org/10.5194/egusphere-egu24-20229, 2024.

EGU24-21278 | ECS | Posters on site | HS8.2.10

 Using thermal tracer tests and numerical models to evaluate the layered flow characteristic in a coastal aquifer system  

An-Yi Hsu, Chuen-Fa Ni, Chia-Yu Hsu, and Yu-Huan Chang

 With the increasing economic development in coastal areas, the problem of coastal degradation has emerged. To facilitate subsequent planning of water resources management, it is essential to determine the coastal aquifer's dynamic exchange with ocean. In this research, our objective is to integrate innovative experiments and modeling techniques to assess the heat and water exchanges in the coastal aquifer of the Taoyuan Tableland in northwestern Taiwan. Specific hydraulic and heat tracer tests are conducted at this location to obtain the flow and heat transfer characteristics of the layered flow. In subsequent steps, we employed the MODFLOW and MT3DMS numerical model to simulate the influence of interactions between freshwater and seawater on the temperature field of the coastal aquifer. The calibration of the model is based on the groundwater levels and the temperature acquired from monitoring wells which installed near the coastline at the TAICOAST observation station. The experimental results show that the thermal responses from the active heat tracer test can match with the core sample and calculate the groundwater flux toward the sea. Significant thermal responses are observed vertically in the observation well near the heating well, ranging from the water level to a depth of 12 m, with BW08 being the observation well showing the maximum thermal response. The simulation of numerical model aligns well with the observed water levels and temperature in wells. The simulation provides a three dimensional depiction of the groundwater flow direction, which was used to calculate the velocity of groundwater flow and estimates thermal conductivity at this site. The results reveal the dynamic impacts of tidal variations on the coastal aquifer with high spatial resolution provides the valuable insights into understanding the groundwater discharge in the coastal aquifer system. 

How to cite: Hsu, A.-Y., Ni, C.-F., Hsu, C.-Y., and Chang, Y.-H.:  Using thermal tracer tests and numerical models to evaluate the layered flow characteristic in a coastal aquifer system , EGU General Assembly 2024, Vienna, Austria, 14–19 Apr 2024, EGU24-21278, https://doi.org/10.5194/egusphere-egu24-21278, 2024.

Before extraction of offshore freshened groundwater (OFG) begins, ownership must first be determined in order to confirm the right to access, possess and distribute of the resource.  Since the geological formations sheltering OFG extend beyond the coastline, the UN Convention on the Law of Sea, which has been ratified by most countries in the world, will apply, and it provides that the nation having rights to the continental shelf where the OFG is located will have sovereign rights to the resource.  However, political boundaries do not often respect geologic formations, and some deposits of OFG will straddle national boundaries.  The Law of the Sea Convention is silent on transboundary resources, so policymakers must look to other legal principles that address governance of natural resources in order to develop a governance regime.  This presentation will summarize the applicable international law principles and will provide guidance on how transboundary OFG may be governed.

How to cite: Martin-Nagle, R.: Transboundary Offshore Freshened Groundwater: What Law Applies?, EGU General Assembly 2024, Vienna, Austria, 14–19 Apr 2024, EGU24-21423, https://doi.org/10.5194/egusphere-egu24-21423, 2024.

EGU24-495 | ECS | Posters on site | HS8.2.12

Groundwater level prediction using hybrid ML: Bridging the gap between nature-based solutions and nature-inspired algorithms 

Abhilash Singh, Vipul Bhadani, Vaibhav Kumar, and Kumar Gaurav

Effective groundwater management requires accurate prediction of GroundWater Level (GWL) fluctuations. This study proposes six novel regression algorithms by integrating a Fuzzy Inference System (FIS) with six Nature-inspired Algorithms (NiA) to enhance GWL prediction accuracy. The proposed algorithms contribute to several Nature-based Solutions (NbS) goals, including improving water security by ensuring that groundwater resources are used sustainably and helping to ensure that people have access to clean and safe water. In this study, we coupled FIS with Invasive Weed Optimization (IWO), Ant Colony Optimization (ACO), Teaching-Learning-Based Optimization (TLBO), Differential Evolution (DE), Harmony Search (HS), and Weevil Damage Optimization Algorithm (WDOA). We used precipitation, relative humidity, and groundwater level lag as potential input features to predict the groundwater level. We found that the Fuzzy-IWO-GWL model accurately predicts GWL fluctuations, achieving a high correlation coefficient (R = 0.89), low normalized root mean square error (nRMSE = 0.18), and minimal bias (bias = 0.08). A comparative analysis involving eleven benchmark algorithms (consisting of standalone and deep learning algorithms) reveals the superior performance of the proposed algorithm. This study highlights the potential of Nature-Based Solutions and nature-inspired algorithms in groundwater management applications, providing valuable insights for policymakers and stakeholders involved in ensuring groundwater sustainability.

How to cite: Singh, A., Bhadani, V., Kumar, V., and Gaurav, K.: Groundwater level prediction using hybrid ML: Bridging the gap between nature-based solutions and nature-inspired algorithms, EGU General Assembly 2024, Vienna, Austria, 14–19 Apr 2024, EGU24-495, https://doi.org/10.5194/egusphere-egu24-495, 2024.

EGU24-899 | ECS | Posters on site | HS8.2.12

Analysis of Hydrogeological Parameters of the Nairobi Aquifer Suite Using GIS-Based Spatial Interpolation Methods  

Dennis Wambugu Kahuthu, Meshack O. Amimo, Samson Oiro, and Balázs Székely

Groundwater resources in the Nairobi Aquifer Suite (NAS), Kenya, face significant problems largely due to rapid urbanization and the rising water demand. The depletion of groundwater resources at the local level could potentially extend to regional extents, and hence affect natural water flows. This therefore calls for the prediction of aquifer hydrogeological parameters for sustainable groundwater management. This study aims to utilize GIS-based spatial interpolation methods for the in-depth analysis of NAS hydrogeological parameters. Classical geostatistical tools are employed to develop models that can be used to accurately predict hydrogeological parameters of the NAS. Field-measurable predictors, that is, geographic position, elevation, depths and first water struck level, are used to demonstrate the efficacy of the predictive models. Data from hydrogeological measurements, geological surveys and satellite imagery are integrated during the development of the predictive models for key hydrogeological parameters, including, groundwater level, discharge, drawdown, electrical conductivity, and transmissivity. Classical geostatistical tools such as kriging and natural neighbour interpolation are applied to develop spatially explicit maps of the NAS hydrogeological parameters. The distribution of borehole data is analyzed using geostatistical tools such as trend analysis and semi variogram. Cross-validation has been performed to identify the most suitable spatial interpolation model. While, in general, the prediction worked well based on model evaluation metrics such as mean absolute error (MAE), mean squared error (MSE), root mean square error (RMSE) and coefficient of determination (R2), during the testing we observed characteristic deviations from the measured values at some locations. These differences could be due to the geological setting; however, a few outliers may appear due to yet unknown reasons. Further studies utilizing machine learning techniques are expected to develop accurate predictive models that can help in sustainable groundwater management in the NAS. The generated spatial maps provided insightful information on the spatial distribution of hydrogeological parameters in the NAS, facilitating the accurate identification of prospective locations for ideal groundwater extraction.

Keywords: GIS; hydrogeological parameters; Nairobi Aquifer Suite; machine learning; predictive modelling; spatial mapping

How to cite: Kahuthu, D. W., Amimo, M. O., Oiro, S., and Székely, B.: Analysis of Hydrogeological Parameters of the Nairobi Aquifer Suite Using GIS-Based Spatial Interpolation Methods , EGU General Assembly 2024, Vienna, Austria, 14–19 Apr 2024, EGU24-899, https://doi.org/10.5194/egusphere-egu24-899, 2024.

EGU24-2045 | Orals | HS8.2.12

Data driven assessment of quantitative status of groundwater in the Netherlands 

Willem Jan Zaadnoordijk and Eldert Fokker

In the Netherlands, there is no national groundwater monitoring network. The national government has delegated groundwater quantity management to the regional authorities, which perform groundwater head monitoring for this purpose. The regional authorities upload their groundwater head measurements to a national repository that is maintained by TNO Geological Survey of the Netherlands (TNO-GSN).

As part of the Geological Survey task,  TNO-GSN makes available information based on these groundwater head measurements through an online Groundwater head viewer (https://www.grondwatertools.nl/gwsinbeeld). Currently, we are working on an extension of this viewer to show the status of the heads for the entire country. The aim is to give a data driven assessment which is independent of physics based distributed three dimensional groundwater modelling. The main reason is that the use of such modelling depends on successful calibration of a national groundwater model and on inclusion of all relevant processes and changes in boundary conditions (land use, pumping, water management, . . .). A second reason is that an independent assessments helps to improve the existing national model (https://nhi.nu) and better understand the changes in the Dutch groundwater system. For the assessment a limited number of monitoring wells are selected, so that the status can be shown qualitatively by colouring the dots. The main challenge is make a representative selection for:

  • Yearly change of groundwater volume.
  • Drought or wetness.
  • Regional differences.
  • The 3 dimensional character of the groundwater system: not only phreatic but also deeper aquifers.
  • Assessment of large scale trends caused by e.g. climate change, urbanisation.
  • Effectiveness of large scale governance measures (‘water en bodem sturend’).

Monitoring wells in the national database are selected based on the following criteria:

  • Being used currently;
  • The longer the measurement timeseries the better;
  • Preferably multilevel;
  • Spatial spread and variation in land use;
  • Covering national variation in precipitation and reference evaporation;
  • Covering range of response times of transfer-noise models with precipitation and reference evaporation as explaining variables;
  • Preferably equipped with telemetry and transmitting data to the national database daily.

The current groundwater head for each piezometer can be characterized in various ways, with and without seasonal correction, such as the percentile of all measurements or all measurements in the same month, or a percentile in the regime curve generated with a 30-year simulation of a timeseries model with precipitation and evaporation.

The resulting selection will be a useful extension of the trends, vertical head differences, dynamics already available on the Groundwater head viewer for national operational water management, groundwater governance and outreach.

How to cite: Zaadnoordijk, W. J. and Fokker, E.: Data driven assessment of quantitative status of groundwater in the Netherlands, EGU General Assembly 2024, Vienna, Austria, 14–19 Apr 2024, EGU24-2045, https://doi.org/10.5194/egusphere-egu24-2045, 2024.

EGU24-3538 | ECS | Orals | HS8.2.12

A Numerical Method for InSAR-Based Estimation of Head Changes using Storativity Parameters 

Behshid Khodaei, Hossein Hashemi, Mazda Kompanizare, Amir Naghibi, and Ronny Berndtsson

Significant groundwater (GW) head decline due to excessive withdrawal is an essential hydrological concern in several major plains of Iran. The capacity of an aquifer to retain GW can be described through the storativity parameters. Traditional methods to define these parameters are costly, time-consuming, and sometimes ineffective.

The storativity of an aquifer, irrespective of its confinement type, is defined as the ratio of land surface deformation caused by GW withdrawal to the corresponding changes in GW head during a specified period. Interferometric Synthetic Aperture Radar (InSAR) is an effective tool to measure the gradual land surface deformation through backscattered radar signals. Additionally, the GW head changes can be monitored using available piezometric wells within the area. Depending on the hydrogeological properties of the aquifer, the GW head changes can lag the deformation by a few days to several years.

Previous studies aimed at deriving the aquifer’s storativity parameters by focusing on extracting the storativity coefficient of the confined aquifer based on analyzing the seasonal components of both deformation and GW head signals. In this study, three parameters have been considered as representative indicators of the storativity for each target aquifer, independent of its type and complexity arising from multi-layered structures. These parameters encompass the lag time between the GW head change and induced land surface deformation, which is calculated through cross-correlation analysis. The other two parameters, seasonal and long-term skeletal storage coefficients, are estimated through a joint analysis of the head signal and the deformation signal shifted by the lag-time value. By estimating these parameters at each piezometric well location, a simulation of the GW head signal is feasible using InSAR data. The final year of both signals is isolated to evaluate the method's efficiency for predicting head changes.

Our method was implemented on random observation wells across three areas encompassing different aquifer types and geological settings in order to evaluate its performance. The model demonstrated satisfactory performance in simulating and predicting the GW head, as evidenced by the average R-squared values of 0.77 and 0.54, respectively.

How to cite: Khodaei, B., Hashemi, H., Kompanizare, M., Naghibi, A., and Berndtsson, R.: A Numerical Method for InSAR-Based Estimation of Head Changes using Storativity Parameters, EGU General Assembly 2024, Vienna, Austria, 14–19 Apr 2024, EGU24-3538, https://doi.org/10.5194/egusphere-egu24-3538, 2024.

EGU24-4174 | ECS | Posters on site | HS8.2.12

Automated analysis of strain-stress curves for aquifer system characterization  

María Navarro-Hernández, Sergio Pozo, Javier Valdes-Abellan, and Roberto Tomás

Excessive groundwater extraction, often leads to changes in aquifer-system layers, causing  anthropogenic-triggered land subsidence. The reduction in pore pressure due to groundwater withdrawal acts as an external factor, while soil compressibility serves as the primary internal factor of land subsidence. The interaction between stress and strain within an aquifer-system, or specific layers, is typically represented through stress-strain curves. These curves, illustrating the hydrograph data (stress induced by piezometric level variations) against land subsidence compaction records (strain), offer valuable insights into the geomechanical behaviour of the aquifer-system, such as elastic, plastic, elasto-plastic, or visco-elasto-plastic behaviour. Additionally, these curves can be employed to estimate hydrogeological parameters like the storage coefficients of the aquifer-system. Traditionally, determining storage coefficients from stress-strain curves has relied on subjective visual assessments by skilled researchers. In this study, we proposed a MATLAB© application designed to automate and streamline the analysis of land subsidence datasets. The application facilitates the exploration of potential correlations with piezometric levels and allows for the estimation of storage coefficients. This approach reduces the time-cost of analysis and minimizes potential human-interpretation errors. The developed application integrates temporal series of groundwater levels from observation wells and ground deformation measurements o automatically generate stress-strain curves. To illustrate and validate the effectiveness of the proposed application, the proposed app is applied to diverse aquifer-systems worldwide, each exhibiting distinct geomechanical behaviour. The results showcase the tool's capability in efficiently studying and understanding land subsidence, providing a valuable resource for scientists and researchers investigating the impacts of excessive groundwater extraction on land deformation. 

How to cite: Navarro-Hernández, M., Pozo, S., Valdes-Abellan, J., and Tomás, R.: Automated analysis of strain-stress curves for aquifer system characterization , EGU General Assembly 2024, Vienna, Austria, 14–19 Apr 2024, EGU24-4174, https://doi.org/10.5194/egusphere-egu24-4174, 2024.

EGU24-4730 | ECS | Posters on site | HS8.2.12

Remote Sensing-Enhanced Assessment of Groundwater Potential Zones in the Wadi Waj, Western Saudi Arabia: An AHP-GIS Framework 

Ahmed Al-Areeq, Mohammed Benaafi, Mohammed Al-Suwaiyan, Shakhawat Chowdhury, and Isam Aljundi

This study represents a thorough investigation into groundwater potential within a substantial basin situated in the western region of Saudi Arabia. Fueled by the escalating demand for potable water, agricultural irrigation, and industrial applications, a profound understanding of the capacity of underground water reservoirs, or aquifers, is imperative. Leveraging advanced techniques, this research integrates Geographic Information System (GIS), the Analytic Hierarchy Process (AHP), and remote sensing data to conduct a comprehensive assessment and mapping of groundwater potential zones (GWPZ). The evaluation process involves the meticulous analysis of several thematic layers: geology, slope, land use, lineament densities, soil characteristics, drainage density, and rainfall. The AHP method is then employed to assign weights to each class within the thematic maps, considering the unique characteristics of each parameter and its consequential influence on water potential. The resultant GWPZ map classifies the region into five distinct zones: very low, low, moderate, high, and very high, providing a nuanced understanding of groundwater potential across the basin. By leveraging the synergy of GIS, AHP, and remote sensing data, this research contributes valuable insights into the nuanced intricacies of groundwater potential assessment. The developed methodology can be adapted for similar regions globally, emphasizing the importance of integrating cutting-edge technologies to address critical challenges associated with sustainable water resource management amidst increasing global demands. The findings of this research can inform decision-making processes for sustainable water resource management in the basin, helping to prioritize areas for groundwater development and conservation efforts.

How to cite: Al-Areeq, A., Benaafi, M., Al-Suwaiyan, M., Chowdhury, S., and Aljundi, I.: Remote Sensing-Enhanced Assessment of Groundwater Potential Zones in the Wadi Waj, Western Saudi Arabia: An AHP-GIS Framework, EGU General Assembly 2024, Vienna, Austria, 14–19 Apr 2024, EGU24-4730, https://doi.org/10.5194/egusphere-egu24-4730, 2024.

In general, some parameters assumption or model simplifications are needed for hydrogeological simulation by the limitations of computing loading and lack of survey data. In addition, the hydrogeological simulation result and other geological investigation information are usually displayed separately, which are not able to provide a comprehensive interpretation. However, geological modelling technique provides a solution for these limitations.

In this study, a conglomerate and sandstone distributed site in Taoyuan city, Taiwan, was applied for hydrogeological model establishment, flow simulation, and particle tracking calculation by FracMan software. Furthermore, regional investigation data including geological map, resistivity imaging profile (RIP), geological drilling, and hydrogeological simulation result, were applied to SKUA-GOCAD and integrated into a three-dimensional geological model, which provided comprehensive interpretations. At last, the lithology distribution model built by SKUA-GOCAD was applied to FracMan for another case simulation. This result was compared with the previous result simulated with simplified geological model, showing that how much geological modelling can help hydro-geological simulation. 

How to cite: Chen, L.-G. and Tong, C.-Z.: Combination of Hydrogeological Simulation and Geological Modeling: A Case Study of Conglomerate and Sandstone Distributed Site., EGU General Assembly 2024, Vienna, Austria, 14–19 Apr 2024, EGU24-5019, https://doi.org/10.5194/egusphere-egu24-5019, 2024.

 This research primarily focuses on predicting and analyzing land subsidence and groundwater level caused by the groundwater abstraction for snow melting during winters in Nagaoka City in Niigata Prefecture , Japan. In this area, significant inconvenience caused by heavy snowfall during winters has led to the adoption of groundwater extraction for snow melting purposes. This countermeasure results in seasonal fluctuations in groundwater levels, contributing to plastic compaction occurrences during winter seasons every year. The uncertainty in modeling land subsidence due to the inability to accurately determine the distribution of subsurface physical property values poses a challenge. Additionally, inadequate data regarding the amount of water extracted for snow melting further complicates the analysis.Combining groundwater level data obtained through Kriging interpolation, we utilized numerical simulations by MODFLOW with subsidence package (IBS) and adjusted model parameters to reproduce the scenarios in this region. The model was calibrated to reproduce groundwater level and subsidence data. By referencing parameters in the existing literatures parameters and experimenting with various scenarios, the model successfully simulated changes in groundwater levels and land subsidence, demonstrating the effectiveness of the model. Moreover, by assigning different permeability coefficients in possible ranges, we determined the maximum extent of snowmelt water's contribution to groundwater replenishment. Through the analysis of various extraction and replenishment schemes, we clarified the main causes of land subsidence and the primary sources contributing to groundwater recovery. We also proposed possible extraction strategies to address the challenge of groundwater extraction under acceptable land subsidence considering the increasing demand for groundwater due to urbanization and possible climate change.

How to cite: Yang, Y. and Aichi, M.: Seasonal variation of land subsidence caused by the groundwater abstraction for snow removal in Nagaoka city , Japan, EGU General Assembly 2024, Vienna, Austria, 14–19 Apr 2024, EGU24-5629, https://doi.org/10.5194/egusphere-egu24-5629, 2024.

EGU24-7598 | Posters on site | HS8.2.12

Optimization of Data from Local Groundwater Head Monitoring Network Using Principal Component Analysis 

Ahsan Raza, Roland Baatz, Leonardo Inforsato, and Claas Nendel

Ascending near-surface groundwater is an important source of water supply to crops and grasslands. Tapping this sub-surface water source, they exhibit a more stable productivity over time as compared to groundwater-distant sites. Assessing crop and grass productivity at high resolution with the help of simulation models therefore requires groundwater table distance information in an apposite spatial and temporal resolution. Groundwater level monitoring networks offer point-based data with variable observation frequency and data quality, impairing assessments of local variations in the hydrographs at each observation well. We propose an efficient and structured process for applying principal component analysis (PCA) in optimizing the groundwater level monitoring network. The PCA functions were used to determine the relative contributions of individual observation wells in determining the spatio-temporal variations in hydrographs. For each well, the Principal Components (PCs) derived from the PCA were used as predicted variables to draw reference hydrographs that describe the expected normal behavior of individual observation wells. This reference hydrograph was then compared with the observed hydrograph so that the residuals describe the local deviations from the normal behavior of the observation well. Deriving a time series of the residuals facilitates a rapid screening for idiosyncrasies unique to each well. Based on a ranking of all wells in the network according to their degree of deviation from the reference, we discarded irrelevant monitoring wells and time series. In a case study using 1300 observation wells in Brandenburg State, Germany, with mean monthly data from 2000 to 2022, we showed in preliminary results that the overall difference in groundwater level between the original observation well network and the optimized network developed with PCs is less than 5%, while the total number of observation wells in the network is reduced by 10%, which will save the time and cost to monitor groundwater levels in the area.

How to cite: Raza, A., Baatz, R., Inforsato, L., and Nendel, C.: Optimization of Data from Local Groundwater Head Monitoring Network Using Principal Component Analysis, EGU General Assembly 2024, Vienna, Austria, 14–19 Apr 2024, EGU24-7598, https://doi.org/10.5194/egusphere-egu24-7598, 2024.

EGU24-8584 | Posters on site | HS8.2.12

Climatic controls on streamflow and groundwater dynamics in a semi-arid catchment: Long-term trends and importance of episodic events 

Elisa Bjerre, Trine Enemark, Søren Jessen, and Karsten Høgh Jensen

Groundwater is a vital water source in semi-arid and arid regions characterized by little and erratic precipitation and ephemeral river flow. In these regions, water scarcity is becoming more critical due to population growth, increasing irrigation demands, and climate change. Groundwater recharge here primarily occurs as episodic events and specifically as focused recharge during high river flow, but the controlling processes are poorly understood. Thus, understanding and quantifying the relationships between climate, streamflow and groundwater dynamics is crucial to assess the impact of climate change on future water availability. Historically, water resources assessments in Africa have relied on large-scale hydrological models, however, they often lack validation from groundwater observations. Here, we take an observation-based approach to identify climatic controls on streamflow and groundwater dynamics in the semi-arid Hout-Sand River catchment, Limpopo, South Africa. Using data spanning from 1940-2023, we analyze time series of precipitation, air temperature, stream discharge, and groundwater level and evaluate long term trends and relationships across a range of climatic indices and hydrologic and groundwater signatures. While we find no significant trends in long-term annual precipitation, the precipitation patterns are becoming increasingly extreme and exhibit higher intensities with longer dry periods. In response, streamflow patterns are changing towards longer no-flow periods although there is no significant trend in total annual flows. Long-term groundwater levels are not unanimously increasing or decreasing. However, we observe a dependence of streamflow and groundwater levels on multi-annual patterns of climate variability. Furthermore, preliminary results suggest that episodic precipitation and streamflow events contribute to the majority of total groundwater recharge, and that the recharge mainly occurs close to streams, i.e. as focused recharge. Finally, we aim to use machine-learning regression techniques to identify the most important controls on focused and diffuse recharge in order to perform spatial regionalization.

How to cite: Bjerre, E., Enemark, T., Jessen, S., and Høgh Jensen, K.: Climatic controls on streamflow and groundwater dynamics in a semi-arid catchment: Long-term trends and importance of episodic events, EGU General Assembly 2024, Vienna, Austria, 14–19 Apr 2024, EGU24-8584, https://doi.org/10.5194/egusphere-egu24-8584, 2024.

EGU24-9393 | ECS | Posters on site | HS8.2.12

Quantification of climate-induced changes in groundwater levels using fuzzy rule-based modelling 

Ronja Iffland and Uwe Haberlandt

"Quantification of climate-induced changes in groundwater levels using fuzzy rule-based modelling"

Ronja Iffland and Uwe Haberlandt
Institute of Hydrology and Water Resources Management, Leibniz University of Hanover, Germany (iffland@iww.uni-hannover.de)

The impact of climate change on hydrological processes, such as increased flooding and prolonged droughts, also affects groundwater recharge and therefore groundwater levels. To make reliable statements about possible changes in groundwater level dynamics prediction models are needed. In this study, fuzzy rule-based models are used to analyse and quantify the effects of changing climate conditions on groundwater levels.

Focussing on 114 groundwater wells in Lower Saxony, Germany, the study aims to explain groundwater dynamics using assumed relationships between climatic indices and groundwater levels. Starting from linear methods, we used fuzzy logic to capture the non-linearities in groundwater level systems. While fuzzy logic models have mostly been considered in combination with neural networks in groundwater level prediction, our approach utilises the transparency of fuzzy rule-based modelling to maintain model interpretability. To improve the forecast accuracy, we introduced moving averages and time lags to account for the persistent influence of meteorological indices. As reference we calculated multiple linear regression models. The performance of both fuzzy rule-based models and linear regression models are evaluated using split validation. To predict future changes in groundwater levels, we applied both models to climate model data based on the RCP8.5 scenario. It is expected that the non-linear fuzzy rule-based models outperform the linear regression models.

How to cite: Iffland, R. and Haberlandt, U.: Quantification of climate-induced changes in groundwater levels using fuzzy rule-based modelling, EGU General Assembly 2024, Vienna, Austria, 14–19 Apr 2024, EGU24-9393, https://doi.org/10.5194/egusphere-egu24-9393, 2024.

EGU24-10066 | ECS | Orals | HS8.2.12 | Highlight

Nitrate spatial predictions by means of machine learning to improve groundwater monitoring networks 

Victor Gómez-Escalonilla, Pedro Martínez-Santos, David Pacios, Lidia Ruíz-Álvarez, Silvia Díaz-Alcaide, Esperanza Montero-González, Miguel Martín-Loeches, and África De la Hera-Portillo

Recently, machine learning approaches are being explored as tools to underpin water management, encompassing applications such as groundwater level prediction and the integration of artificial intelligence combined with classical numerical models. This study introduces a method to support the design of groundwater quality monitoring networks through machine learning spatial predictions. Several supervised classification algorithms were trained to identify spatially distributed variables explaining the presence of nitrates in the groundwater of various aquifers in central Spain, including the Madrid Tertiary Detrital Aquifer. The dataset comprised over 240 nitrate concentration measurements and 20 explanatory variables related to geology, climatic factors, and pressures such as agricultural land, urban areas or intensive farming location. Subsequently, the algorithms with the best predictive capability were used to map nitrate contamination in order to locate unmonitored sites where contamination is likely to occur. Ensemble tree-based classifiers, such as random forests or gradient boosting, showed the most accurate predictions of groundwater contamination, with area under the curve scores around 0.8. The map-based output of this approach facilitates identifying new areas of interest requiring observation points. This method provides an alternative to expert-based criteria for locating new groundwater monitoring stations and is easily transferable to other environments.

How to cite: Gómez-Escalonilla, V., Martínez-Santos, P., Pacios, D., Ruíz-Álvarez, L., Díaz-Alcaide, S., Montero-González, E., Martín-Loeches, M., and De la Hera-Portillo, Á.: Nitrate spatial predictions by means of machine learning to improve groundwater monitoring networks, EGU General Assembly 2024, Vienna, Austria, 14–19 Apr 2024, EGU24-10066, https://doi.org/10.5194/egusphere-egu24-10066, 2024.

EGU24-10084 | ECS | Orals | HS8.2.12

Improving recharge-controlled groundwater level behavior in a transient data-driven 3D model 

Mikhail Tsypin, Mauro Cacace, Björn Guse, Andreas Güntner, and Magdalena Scheck-Wenderoth

Data-driven models are powerful tools for analyzing the evolution of groundwater flow and thermal field in response to hydrometeorological forcing. However, they usually come with uncertainties in flux boundary conditions and in the distribution of rock properties. To overcome this, we coupled a subsurface 3D model of Brandenburg (NE Germany) with the distributed hydrologic model mHM to simulate a 60-year-long monthly time series of regional groundwater dynamics.

Recharge fluxes, derived from mHM and assigned to the top of the saturated subsurface model, allowed us to reproduce magnitudes of seasonal groundwater level fluctuations as observed in shallow monitoring wells (0-5 m). However, approximating the multi-annual periodicity that is pronounced in deeper wells (10-30 m) and the long-term decline in groundwater levels recorded in parts of Brandenburg has proven to be more challenging. This highlights the need to consider damping the infiltration signal in order to better approximate the delayed response of the subsurface to the imposed precipitation pulses, as well as additional sinks contributing to the loss of groundwater storage.

To this purpose, we analyzed the frequency of groundwater level fluctuations in >100 observation wells as a function of the unsaturated zone thickness and compared them against the results obtained from a 1D analytical model solution. The established relationship of recharge damping with depth was then utilized to correct the flux boundary conditions. This, along with optimization of river network density and aquifer storativity, resulted in an improved match in modeled versus monitored hydraulic heads. This enables further use of the coupled groundwater and surface-water model for ongoing forecasting studies of the thermo-hydraulic evolution of the aquifer system with respect to climate scenarios.

How to cite: Tsypin, M., Cacace, M., Guse, B., Güntner, A., and Scheck-Wenderoth, M.: Improving recharge-controlled groundwater level behavior in a transient data-driven 3D model, EGU General Assembly 2024, Vienna, Austria, 14–19 Apr 2024, EGU24-10084, https://doi.org/10.5194/egusphere-egu24-10084, 2024.

EGU24-10089 | ECS | Orals | HS8.2.12 | Highlight

Groundwater Prediction in the Thames Basin, London, Using Temporal Fusion Transformer Models  

Ali Ali, Ashraf Ahmed, and Maysam Abbod

Addressing Thames Basin aquifer complex dynamics in England, this study uses a Temporal Fusion Transformer (TFT) for groundwater level prediction. Our research combines extensive hydrological data with advanced machine learning suited to Thames Basin, where a complex network of rivers and streams substantially affects groundwater dynamics. Unlike previous studies, this research focuses on long-term forecasting with deep learning, offering a long prediction horizon. To rigorously examine the model performance and robustness on new, unseen data, we applied the walk-forward validation method and other matrices such as RMSE and R2 coupled with the Holdout technique. Our approach contrasts traditional Long-Short Term Memory (LSTM), Attention-based LSTM, and TFT, focusing on the basin’s aquifers, Chalk, Oolitic Limestone, and Lower Greensand. Whilst both LSTM models were optimised using the Bayesian technique, TFT was applied for its inherent capability in complex time series. Our methodology processed historical groundwater and rainfall data from 2001-2023, accounting for the potential lag in aquifer response to the proximity of the river system. The dataset served as training, validation, and holdout for each model, focusing on capturing the dynamic temporal fluctuation. The results clearly showed the superiority of the TFT model in all aquifer types compared to other models across all horizons 7, 30, and 60 days. In the 60 days, the best results were observed in the Chalk aquifer with RMSE of 0.04 and R2 of 0.97 in holdout validation. However, in Limestone and Lower greensand aquifers, the TFT showed RMSEs of 0.12 and 0.016 and R2s of 0.65 and 0.32, respectively. Traditional LSTM models demonstrated limited predictive power, with negative values in all aquifers, while Attention-based LSTM slightly improved the efficacy. This study highlights the potential of sophisticated machine learning in managing complex aquifers and predicting water tables.

How to cite: Ali, A., Ahmed, A., and Abbod, M.: Groundwater Prediction in the Thames Basin, London, Using Temporal Fusion Transformer Models , EGU General Assembly 2024, Vienna, Austria, 14–19 Apr 2024, EGU24-10089, https://doi.org/10.5194/egusphere-egu24-10089, 2024.

EGU24-10386 | ECS | Orals | HS8.2.12

Announcing the Groundwater Spatial Modeling Challenge 

Maximilian Nölscher, Marc Ohmer, Ezra Haaf, and Tanja Liesch

Ugh! - Haven’t we already fully explored the potential of spatial modeling of groundwater parameters? Haven’t we reached the limits there? In response to questions about whether we have fully explored the potential in these areas, we are launching this challenge to harness the swarm intelligence of the groundwater modeling community. Our aim is to dispel doubts and encourage creativity in feature development, model selection and training strategies. And why? Because regionalization, interpolation from point data into space, remains a crucial step in generating spatially continuous information and maps. And maps remain a crucial basis of information in sustainable water and resource management.

For this purpose we provide a dataset of Nitrate-concentrations in approximately 1800 wells taken within a single month in southwestern Germany. The measured concentrations in the wells are representing concentrations in the most shallow aquifers. Besides Nitrate concentration as target variable, the dataset contains various features, describing the environmental and geological context of each sample site. Different types of models can be applied to model Nitrate concentrations, ranging from deterministic and geostatistical models to statistical/data-driven approaches such as machine learning models. We invite all interested researchers and data science enthusiasts to participate in this challenge as a team or single person. A ranking will be carried out while the challenge is open using a predefined set of model performance metrics on a secret test split. Further information on how to participate and the required data is available at https://groundwater-spatial-modeling-challenge.github.io/challenge2024/.

The well defined rules of the challenge regarding the feature set, data splitting and metric choices, will allow the groundwater community to learn from different approaches and conduct a systematic comparison. 

The results of the challenge will be presented at the General Assembly of the EGU in 2025 and documented in a peer-reviewed paper with model contributors as co-authors on request. Through  this challenge, we hope to increase the awareness in the groundwater community on the range of approaches available for (spatial) modeling of groundwater variables and their advantages and disadvantages.

How to cite: Nölscher, M., Ohmer, M., Haaf, E., and Liesch, T.: Announcing the Groundwater Spatial Modeling Challenge, EGU General Assembly 2024, Vienna, Austria, 14–19 Apr 2024, EGU24-10386, https://doi.org/10.5194/egusphere-egu24-10386, 2024.

Sustainable groundwater management requires accurate and reliable prediction of long-term aquifer water balances. This can be achieved with catchment-scale groundwater balance models such as the recently developed Lumped Geohydrological Model (LGhM) (Ejaz et al., 2022, Journal of Hydrology). As a lumped model similar to hydrological rainfall-runoff models, the LGhM offers high computational speed, lower data requirements compared to spatially explicit groundwater flow models, and suitability for uncertainty analysis. Unlike rainfall-runoff models, LGhMs allow simulating total groundwater storage (TGS) by incorporating additional terms for water budget and dedicated, distributed groundwater storage boxes, inspired by the catchment's aquifer characteristics.

Calibration of LGhMs requires both river discharge data and TGS data. LGhMs have shown remarkable performance in synthetic studies (MODFLOW generated data for calibration and validation). The remaining challenge is therefore to obtain TGS data for calibration without full groundwater flow models. Geostatistical methods can help here. They can directly estimate groundwater surfaces from well-based time series, and TGS can then be obtained through spatial aggregation. In this study, we employ space-time kriging to estimate TGS and quantify associated uncertainties. To enhance TGS predictions, we integrate hydrogeological information into the kriging model. These include spatial and temporal trends and soft information inspired by hydrological ideas, such as digital elevation maps, river exchange components, aquifer confinement, and boundary conditions.

The Wairau Plain aquifer in New Zealand serves as the testing ground for this approach, where an existing MODFLOW model provides data for calibration and validation for proof of concept. Once validated, this method can be applied in regions without pre-existing groundwater flow models.

How to cite: Ejaz, F., Wildt, N., Nowak, W., and Wöhling, T.: Estimating catchment-wide total groundwater storage via space-time kriging provides calibration data for catchment-scale groundwater balance models, EGU General Assembly 2024, Vienna, Austria, 14–19 Apr 2024, EGU24-10521, https://doi.org/10.5194/egusphere-egu24-10521, 2024.

EGU24-10638 | Posters on site | HS8.2.12

Applicability of groundwater recharge estimation from time series modeling of groundwater levels in a (semi-)urban area 

Steffen Birk, Ainur Kokimova, and Raoul Collenteur

Groundwater recharge estimates can be obtained from time series of hydrometeorological variables and groundwater levels using a data-driven approach that combines a root-zone model with a lumped-parameter groundwater model. This approach was successfully tested at an agricultural site where lysimeter data of seepage is available (Collenteur et al. 2021). At that site, groundwater levels are assumed to be solely driven by recharge from precipitation. Frequently, however, groundwater levels are affected by other hydrological stresses, for example, resulting from stream-aquifer interaction or direct human impacts such as water abstraction or construction activities. To assess the method under more complex conditions, we evaluate the recharge estimates obtained from the model application to a multitude of groundwater monitoring wells located in the urban area of Graz (Austria) and the semi-urban and agricultural area south of the city (Kokimova et al. 2022). Possible influences from the River Mur, including changes in hydraulic structures, were taken into account in the model, whereas other stresses were insufficiently known and thus ignored. The resulting recharge estimates show a wide range, with values in agricultural areas often plausible. However, at some locations, particularly in the urban area, extraordinarily high values that appear implausible were estimated. Besides the possible impact of unknown water abstraction and construction activities, the simplified representation of the urban recharge processes may explain these findings. Even where the model failed to provide reasonable recharge estimates, the results support the identification of possible local influences on groundwater levels, which should be further investigated to enable a better assessment of groundwater recharge, particularly in the urban area.

Collenteur, R., Bakker, M., Klammler, G., Birk, S. (2021): Estimation of groundwater recharge from groundwater levels using non-linear transfer function noise models and comparison to lysimeter data. Hydrol. Earth Syst. Sci. 25: 2931-2949. doi: 10.5194/hess-25-2931-2021

Kokimova, A., Collenteur, R., Birk, S. (2022): Data-driven time series modeling to support groundwater model development for the Grazer Feld Aquifer. EGU General Assembly 2022, Vienna, Austria, 23–27 May 2022, EGU22-7734, https://doi.org/10.5194/egusphere-egu22-7734

How to cite: Birk, S., Kokimova, A., and Collenteur, R.: Applicability of groundwater recharge estimation from time series modeling of groundwater levels in a (semi-)urban area, EGU General Assembly 2024, Vienna, Austria, 14–19 Apr 2024, EGU24-10638, https://doi.org/10.5194/egusphere-egu24-10638, 2024.

EGU24-11326 | Posters on site | HS8.2.12

Forecasting Groundwater Level in Florida using Advanced Machine Learning Approaches 

Saman Javadi, Mohsen Najafi, Golmar Golmohammadi, Kourosh Mohammadi, and Aminreza Neshat

Mismanagement of groundwater resources leads to groundwater depletion and other environmental issues such as quality reduction and subsidence. Water table prediction is essential for optimal management of groundwater resources. Hence, artificial intelligence (AI) methods have been used widely to predict water tables in recent years. This paper adopted some new methods of machine learning, e.g., categorical boosting (CATBoost), extreme gradient boosting (XGBoost), and Convolutional neural network-Long Short-Term Memory (CNN-LSTM), to predict water table. The key input parameters were evaporation/transpiration, rainfall, temperature, and water table in the prior month. To better compare the models, simulations were executed in daily and monthly periods. DeLuca Preserve located in Florida was selected to test the proposed algorithms.  The results indicated that in general machine learning algorithms are appropriate approaches to predict water tables. CNN-LSTM algorithm with RMSE = 0.22 m and R2 = 0.96 showed better performance in predicting daily groundwater levels.  However, monthly water tables were predicted much better using CATBoost algorithm with RMSE = 0.11 m and R2 = 0.99.

How to cite: Javadi, S., Najafi, M., Golmohammadi, G., Mohammadi, K., and Neshat, A.: Forecasting Groundwater Level in Florida using Advanced Machine Learning Approaches, EGU General Assembly 2024, Vienna, Austria, 14–19 Apr 2024, EGU24-11326, https://doi.org/10.5194/egusphere-egu24-11326, 2024.

EGU24-11371 | ECS | Orals | HS8.2.12

Development of an Innovative web-DSS Tool for sustainable groundwater resource management 

Antonios Lyronis, Emmanouil Varouchakis, Vanessa A Godoy, Janire Uribe-Asarta, Daniele Secci, Valeria Todaro, Marco D'Oria, Tanda Maria Giovanna, Andrea Zanini, Seifeddine Jomaa, Nadim Copty, George P Karatzas, and Jaime Gómez-Hernández

In the Mediterranean region, groundwater is a crucial drinking and irrigation source. However, the sustainability of this vital resource is often jeopardized by overuse and the impact of climate change. It is, therefore, crucial for decision-makers to have basic tools for managing aquifers.

In this study, a Decision Support System (DSS) tool is developed to support the sustainable management of groundwater resources. The DSS tool is demonstrated using surrogate groundwater models developed for five sites in the Mediterranean region under the scope of the European project InTheMED, promoted by the PRIMA program. The DSS tool (Varouchakis et al., 2023) works within a fuzzy logic framework and is available online (http://147.27.70.139:9988/webapps/home/).

The DSS operation employs data-driven techniques tailored based on the case study and data availability.

The Random Forest method (Godoy et al., 2022) is used for the Requena-Utiel area (Spain), Artificial Neural Networks (Todaro et al., 2023) for the Konya basin (Türkiye), while spatio-temporal geostatistical modelling is applied to the Tympaki site (Greece) (Lino Pereira et al., 2023). For the Grombalia (Tunisia) and Castro Verde (Portugal) sites, the surrogate models are developed using a statistical approach based on regression models (Secci et al., 2021).

The DSS tool is used to classify the vulnerability of the demo sites using a fuzzy clustering method. The clustering algorithm inputs the difference or absolute difference in groundwater levels between two scenarios the user selects. These scenarios are defined by changing parameters related to climate scenarios, groundwater pumping, and simulation periods. The output clusters groundwater vulnerability areas, reflecting variations in climate conditions and groundwater utilization across different time horizons. The DSS tool can classify the sites into six categories: very low, low, low to medium, medium to high, high, and very high vulnerability. Based on this information, groundwater managers can decide on remediation measures related to groundwater use and apply them to areas in the same cluster. The tool is freely accessible and readily transferred to other regions for policy and educational purposes.


Acknowledgment

InTheMED project, which is part of the PRIMA Programme supported by the European Union’s Horizon 2020 Research and Innovation Programme under Grant Agreement No 1923.


References

Godoy, V. A., Uribe-Asarta J. Gómez-Hernández, J. J. (2022). Innovative and accessible tool to support groundwater management in the Requena-Utiel and Cabrillas-Malacara aquifers in Spain. IAHR Europe Congress. Athens, Greece.

Lino Pereira, J., Varouchakis, E. A., Karatzas, G. P., & Azevedo, L. (2024). Uncertainty Quantification in Geostatistical Modelling of Saltwater Intrusion at a Coastal Aquifer System. Mathematical Geosciences, 1-19.

Secci, D., Tanda, M.G., D’Oria, M., Todaro, V., Fagandini, C., (2021). Impacts of climate change on groundwater droughts by means of standardized indices and regional climate models. J. Hydrol. 603, 127154.

Todaro, V., Secci, D., D'Oria, M., Tanda, M. G., & Zanini, A. (2023). InTheMed D3.2 Report on Surrogate Models in the Case Studies (Version 3). Zenodo.

Varouchakis, E., Lyronis, A., Anyfanti, I., & Karatzas, G. (2023). InTheMED D6.3 Atlas of the Maps Produced Using the DSS (1.1). Zenodo.

How to cite: Lyronis, A., Varouchakis, E., Godoy, V. A., Uribe-Asarta, J., Secci, D., Todaro, V., D'Oria, M., Maria Giovanna, T., Zanini, A., Jomaa, S., Copty, N., Karatzas, G. P., and Gómez-Hernández, J.: Development of an Innovative web-DSS Tool for sustainable groundwater resource management, EGU General Assembly 2024, Vienna, Austria, 14–19 Apr 2024, EGU24-11371, https://doi.org/10.5194/egusphere-egu24-11371, 2024.

EGU24-11647 | Orals | HS8.2.12 | Highlight

Advancing water resource management: Insights and implications from global machine learning models in groundwater prediction 

Maria Wetzel, Stefan Kunz, Maximilian Nölscher, Alexander Schulz, Felix Biessmann, and Stefan Broda

Accurate and reliable predictions of groundwater levels are essential for sustainable water resource management. Faced with the impacts of climate change and the increasing stress on groundwater resources, there is a growing necessity to balance domestic, agricultural, and industrial utilization. To address these challenges, innovative and progressive approaches in predicting groundwater levels are necessary, such as the application of machine learning (ML) methods. The advancement of these ML-based prediction models is a crucial component of the BMBF project KIMoDIs. Within this research initiative, an AI-based monitoring, data management, and information system for coupled prediction and early warning of low groundwater levels and groundwater salinisation is being developed.

Currently, the state-of-the-art in hydrogeology involves individual models for each groundwater monitoring well (local models). While local models can achieve high predictive accuracy, their application to a multitude of measurement points is impractical. Conversely, global models allow training and prediction for multiple measurement wells simultaneously. This model class has the potential to learn and capture dynamics beyond a single well and their dependency on dynamic input variables (e.g., meteorological parameters) as well as static variables (e.g., specific hydro(geo)logical or morphometric site properties). Particularly with extensive training datasets, global model approaches can provide predictions at measurement points sharing similar site properties to those used in training (generalization). Additionally, they offer advantages in terms of computational requirements as well as model management, as only one model needs to be trained and applied over a large area.

The objective of this study is to demonstrate the predictive capabilities of modern ML methods in the context of groundwater level prediction. Further, it provides insights and recommendations regarding the extent to which global models, with a wealth of spatial and temporal information, can contribute to improve prediction accuracy. Global ML models are used for short-term prediction of groundwater levels on a regional scale: Two model architectures (Temporal Fusion Transformer and Neural Hierarchical Interpolation for Time Series Forecasting) are applied to over 5000 groundwater monitoring points in Germany in order to predict groundwater levels for up to 12 weeks. Meteorological data and historical groundwater level data dating back to 1990 (dynamic features) as well as hydrogeological, soil and morphometric properties (static features) are used as input data. Additionally, feature importance is assessed, and eliminating various inputs enabled to identify suitable features for groundwater level prediction.

How to cite: Wetzel, M., Kunz, S., Nölscher, M., Schulz, A., Biessmann, F., and Broda, S.: Advancing water resource management: Insights and implications from global machine learning models in groundwater prediction, EGU General Assembly 2024, Vienna, Austria, 14–19 Apr 2024, EGU24-11647, https://doi.org/10.5194/egusphere-egu24-11647, 2024.

EGU24-11916 | Posters on site | HS8.2.12

Exploring Groundwater Memory in Baltic States: Controls and Complexities of timeseries analysis 

Jānis Bikše, Inga Retike, and Ezra Haaf

This study used groundwater memory timeseries as a proxy for groundwater drought vulnerability to unveil dominant patterns and their correlations with physiographic and climatic controls within hydrogeological systems of Baltic states. Clustering of groundwater memory timeseries was performed to identify regions with similar hydrodynamic systems, while random forest classification identified significant site-descriptive features, giving insights into system similarities and dissimilarities. Catchment characteristics showed the greatest importance followed by climate, topography and land use features. Moreover, spatial analysis of cluster distribution revealed feature combinations which are not covered by groundwater observations, presenting a challenge in understanding groundwater dynamics in these data-scarce locations. The study underscores the importance of considering not only locations with groundwater level data but also regions of typical feature patterns without monitoring infrastructure, thus identifying possible locations for new groundwater monitoring wells. 

How to cite: Bikše, J., Retike, I., and Haaf, E.: Exploring Groundwater Memory in Baltic States: Controls and Complexities of timeseries analysis, EGU General Assembly 2024, Vienna, Austria, 14–19 Apr 2024, EGU24-11916, https://doi.org/10.5194/egusphere-egu24-11916, 2024.

EGU24-12586 | ECS | Posters on site | HS8.2.12

Error-aware surrogate modelling with input dimension reduction for groundwater modelling in heterogenous media 

Maria Fernanda Morales Oreamuno, Sergey Oladyshkin, and Wolfgang Nowak

Machine learning approaches have gained high notoriety to approximate computationally-expensive models in the geosciences. Surrogate models are trained using input-output pairs to emulate the numerics of full complexity models. These fast models then assist in forward and inverse uncertainty quantification for various applied problems. However, large input dimensions, typically found in groundwater modelling for very heterogeneous environments, present a challenge for surrogate models. Input dimension reduction (IDR) methods, such as the Karhunen-Loéve expansion (KLE), are known to reduce the number of input parameters used to train surrogate models, while also generating stochastic realizations of the input random fields for groundwater modelling applications. Traditionally, KLE truncates the input parameters such that 90% of the input variance is considered. However, in some applied cases, this dimension remains too large for reliable surrogate model training. Specifically, using a smaller number of input parameters (considering a smaller percentage of the input variance) may introduce IDR-associated errors in the surrogate output. These errors are often overlooked when assessing uncertainty in surrogate model outputs and could be particularly significant in Bayesian inverse modelling. We are offering a surrogate modelling framework tailored for high-dimensional problems that accounts for IDR-induced errors in the context of Bayesian inverse modelling. Our framework allows for more informed decision-making when using surrogate models as approximators and to widen the scope in which surrogates can be used in heterogeneous media applications. We demonstrate the introduced approach using a groundwater flow and transport model with a heterogeneous hydraulic conductivity field to estimate contaminant concentrations and pressure head values.

How to cite: Morales Oreamuno, M. F., Oladyshkin, S., and Nowak, W.: Error-aware surrogate modelling with input dimension reduction for groundwater modelling in heterogenous media, EGU General Assembly 2024, Vienna, Austria, 14–19 Apr 2024, EGU24-12586, https://doi.org/10.5194/egusphere-egu24-12586, 2024.

EGU24-12713 | Posters on site | HS8.2.12

Data-driven models for groundwater nitrate contamination prediction: A nation-wide approach for Mexico 

Jurgen Mahlknecht, Juan Antonio Torres-Martínez, Abrahan Mora, Manish Kumar, Dugin Kaown, and Frank J Loge

Nitrate (NO3-N) stands as one of the prevalent chemical contaminants in groundwater, posing potential repercussions on both the environment and public health. However, the monitoring of this parameter on a national scale is notably limited, especially in developing regions. To address this gap, we applied distinct machine learning (ML) algorithms (Extreme Gradient Boosting, Boosted Regression Trees, Random Forest, and Support Vector Machines) capable of quantifying/predicting NO3-N concentrations in groundwater. These algorithms were validated through comprehensive application across Mexico. The models initially considered 68 covariates and identified significant predictors of NO3-N concentration spanning from climate, geomorphology, soil, hydrogeology, and human factors. We achieved an outstanding performance with about 10 times less availability of information compared to previous large-scale assessments, and thus efficiently countered the challenge of limited data availability/monitoring stations. Our success can be attributed mainly to the implementation of the 'Support Points-based Split Approach' during pre-processing, which effectively transformed the limited national groundwater quality database into spatial points suitable for appropriate train/test datasets. Areas exhibiting NO3-N concentrations exceeding the drinking water standard (>10 mg/L) were identified, notably in the north-central and northeast regions of the country, linked to agricultural and industrial activities. Individuals living in these regions face potential exposure to elevated NO3-N levels in groundwater. These NO3-N hotspots align with reported health implications such as gastric and colorectal cancer. This study not only showcases the potential of ML in data-scarce regions but also provides actionable insights for policy and management strategies.

How to cite: Mahlknecht, J., Torres-Martínez, J. A., Mora, A., Kumar, M., Kaown, D., and Loge, F. J.: Data-driven models for groundwater nitrate contamination prediction: A nation-wide approach for Mexico, EGU General Assembly 2024, Vienna, Austria, 14–19 Apr 2024, EGU24-12713, https://doi.org/10.5194/egusphere-egu24-12713, 2024.

Groundwater hydraulics and aquifer processes are largely investigated using techniques that involve some kind of borehole test pumping. Such techniques are well established in the engineering and scientific community but are resource demanding. Time series analysis offer a collection of alternative methods that can be used to evaluate groundwater processes like recharge by using natural groundwater levels as input data. In this work, time series analyses were used to increase the hydrogeological knowledge of an area characterised by a glacial buried valley in southern Sweden. The hydrogeological environment is characterized by an upper aquifer (often clay till) and a deep aquifer consisting of different types of sediment (fine sand and gravel). The two aquifers are often separated by dense clays or massive low-permeability tills. The work aimed to implement time series analysis for estimating the amount of groundwater infiltrating at several points of the buried valley, which is one of the most important groundwater reservoirs in southern Sweden. The goals were to (a) contribute new knowledge about groundwater recharge and (b) evaluate the use of time series analysis to answer hydrogeological questions in this particular geological setting. The data processing steps included barometric compensation, Fast Fourier Transform (FFT) for identification of dominant unwanted frequencies, median filter to remove any disturbances in the signal, and corrections for possible signal shifts. Data filtering or correction was in some cases also applied to precipitation data and other meteorological parameters used to evaluate the reliability of the results. Recharge calculations were carried out using the water table variation method. The results suggest that for the period 2020 – 2021 the recharge was in the order of 350 mm for the upper aquifer and that around 10% of the precipitated water may be available for further infiltration to the deeper high-permeable sediments. Attempts to compare the obtained results with calculations made with the water budget method brought uncertainties as calculating the parameters for the water budget method implied using data with variable quality, scale and accuracy. However, using time series analysis has the potential to qualitatively monitor the recharge process in the area. The reliability of such recharge estimations can be supported by evapotranspiration measurements.

How to cite: Mendoza, A.: Groundwater recharge evaluation in a glacial buried valley using time series analyses of water levels., EGU General Assembly 2024, Vienna, Austria, 14–19 Apr 2024, EGU24-12764, https://doi.org/10.5194/egusphere-egu24-12764, 2024.

EGU24-13495 | Posters on site | HS8.2.12

Event-based groundwater recharge: drip observations reach new depths in mine tunnels 

Wendy Timms, Andy Baker, Margaret Shanafield, Martin Andersen, Stacey Priestley, and Marilu Melo Zurita

Drip sensors in underground spaces such as mine tunnels can quantify vertical water flux through the vadose zone during rainfall events. Australia’s National Groundwater Recharge Observing System (NGROS), established in 2022, provides the first dedicated sensor network for observing the recharge of groundwater at an event-scale across a wide range of geologies, environments, and climate types. As part of this program, differences in recharge fluxes and patterns through fractured metamorphic rock were analysed for hourly data in a shallow mine tunnel (14 sensors at ~30-50 m below ground) and a deep mine tunnel (12 sensors at ~115 m below ground). Average annual rainfall varied from <500 to >1200 mm per annum at the deep and shallow tunnel sites respectively. Recharge was evident despite a thick (>100 m) unsaturated zone above the tunnel. In the shallow mine tunnel, distinct recharge pathways including fracture zones around quartzite intrusions were evident, and time-lags were relatively short. Data analysis will include patterns of rainfall thresholds at which vertical fluxes occur, and spatial patterns within tunnels and between different sites in the NGROS network. The drip data can be useful for managing mine water related risks, and to complement recharge estimates from other methods for sustainable groundwater management. 

How to cite: Timms, W., Baker, A., Shanafield, M., Andersen, M., Priestley, S., and Melo Zurita, M.: Event-based groundwater recharge: drip observations reach new depths in mine tunnels, EGU General Assembly 2024, Vienna, Austria, 14–19 Apr 2024, EGU24-13495, https://doi.org/10.5194/egusphere-egu24-13495, 2024.

EGU24-14311 | ECS | Orals | HS8.2.12 | Highlight

A Novel Hyper-Resolution Water Table Depth Product for the Contiguous US 

Yueling Ma, Laura Condon, Julian Koch, Andrew Bennett, Amy Defnet, George Artavanis, Peter Melchior, and Reed Maxwell

Groundwater is our largest freshwater reservoir, playing a key role in supplying drinking water, guaranteeing food security, supporting biodiversity, and sustaining surface water bodies. While we have water table depth (WTD) observations at approximately one million wells over the contiguous US (CONUS), WTD data are sparse at the city or individual farm level, where local decisions are often made. To address the challenge, we introduce a novel WTD product for the CONUS, that consists of hyper-resolution (1 arcsec, ~30 m) long-term mean WTD estimates from a random forest model trained on available WTD observations. Uncertainty assessment is also provided. The input data to the random forest model include annual mean precipitation and temperature, elevation, distance to stream, soil texture, and other geology-related data. The model implicitly learns pumping from the WTD observations used for training, and thus the WTD product accounts for human interference with groundwater. Compared to coarser-resolution WTD data, it provides better estimates for groundwater storage and the proportions of very shallow and very deep aquifers over the CONUS. The 1-arcsec WTD product represents our most accurate estimate of accessible freshwater for the CONUS to date, useful for sustainable freshwater management, groundwater depletion studies, and hydrological modeling improvement. Since the CONUS covers many different hydrogeological settings, the random forest model trained for the CONUS may be transferrable to other regions with a similar setting and limited observations. We plan to extend the study globally, with the initial effort focused on transferring groundwater knowledge between the CONUS and Denmark.

How to cite: Ma, Y., Condon, L., Koch, J., Bennett, A., Defnet, A., Artavanis, G., Melchior, P., and Maxwell, R.: A Novel Hyper-Resolution Water Table Depth Product for the Contiguous US, EGU General Assembly 2024, Vienna, Austria, 14–19 Apr 2024, EGU24-14311, https://doi.org/10.5194/egusphere-egu24-14311, 2024.

Artificial Recharge (AR) is pivotal in managing groundwater resources and addressing hydrogeological issues. Over the past decades, significant research has focused on the clogging mechanisms but paid limited attention to devising effective strategies. This study introduces an optimization framework that integrates a clogging model with two objective functions aimed at minimizing clogging during groundwater recharg by using multi-objective particle swarm optimization(MOPSO) algorithm .The proposed clogging model for groundwater recharge accounts for both physical clogging and iron oxide clogging. It comprehensively addresses suspended solids' adsorption and iron oxidation reactions using a coupled COMSOL and PHREEQC approach. The MOPSO algorithm is employed to obtain Pareto bounds, aiding in identifying suitable recharge and backwash options among diverse groundwater recharge scenarios. This approach enables stakeholders to assess varied scenarios based on blockage conditions and recharge efficiency. The optimization findings underscore the effectiveness of proper backwashing in significantly reducing clogging and extending equipment life in groundwater recharge projects.

How to cite: Zhang, T., Wen, Z., and Zhu, Q.: Optimizing managed Artificial Recharge backwash using a Multi-objective Particle Swarm Optimization coupled with a clogging simulation model , EGU General Assembly 2024, Vienna, Austria, 14–19 Apr 2024, EGU24-14465, https://doi.org/10.5194/egusphere-egu24-14465, 2024.

EGU24-14793 | Posters on site | HS8.2.12

Modelling inundated area in wetlands combining satellite and hydrological data: A comparison of classical methods and machine learning algorithms 

Antonio-Juan Collados-Lara, Héctor Aguilera, David Pulido-Velazquez, Eulogio Pardo-Igúzquiza, Leticia Baena-Ruiz, Juan de Dios Gómez-Gómez, Miguel Mejías, and Juan Grima

Wetlands, which are systems with significant environmental value, can be very sensitive to global change. The inundated area of wetlands, reflecting water quantity, stands as a key variable in the decision-making process for evaluating sustainable management strategies in these ecosystems.
Satellite optical sensors are effective for regional and global surface water monitoring. However, depending on the satellite, they may not offer a comprehensive long-term time series of inundated areas to study the effects of global change. This limitation arises from factors such as presence of clouds, sensor failure, low revisit time or spatial resolution, or recent launch. 
We propose leveraging hydro-climatological data to enhance and complement satellite-observed inundated area dynamics. In this approach, we evaluate the effectiveness of classical methods such as ARIMA and multiple regression models, along with advanced techniques like artificial autoregressive neural networks and other machine learning algorithms. The goal is to integrate covariate information and simulate extensive and continuous inundated area time series. This methodology is valuable not only for filling gaps in observational data but also for projecting the impacts of climate change on inundated area in wetlands.
The suggested methodology was implemented in the Lagunas de Ruidera wetland area in south-eastern Spain. This region exhibits a significant natural interplay between groundwater and surface water, highlighting a conflict between groundwater-dependent ecosystems and groundwater extraction for irrigation. From January to June, the average observed inundated area is approximately 4.3 km². In summer, there is a reduction of about 13% in the surface water area, which is subsequently recovered during the autumn.

Acknowledgments: This research has been partially supported by the project SIGLO-PRO (PID2021-128021OB-I00) funded by the Spanish Ministry of Science, Innovation and Universities and the project C17.i7.CSIC – CLI 2021-00-000 funded byEuropean Union NextGenerationEU/PRTR.

How to cite: Collados-Lara, A.-J., Aguilera, H., Pulido-Velazquez, D., Pardo-Igúzquiza, E., Baena-Ruiz, L., Gómez-Gómez, J. D. D., Mejías, M., and Grima, J.: Modelling inundated area in wetlands combining satellite and hydrological data: A comparison of classical methods and machine learning algorithms, EGU General Assembly 2024, Vienna, Austria, 14–19 Apr 2024, EGU24-14793, https://doi.org/10.5194/egusphere-egu24-14793, 2024.

EGU24-15833 | Posters on site | HS8.2.12

Better mapping of groundwater-surface water exchanges over the Seine River catchment in a surface hydrological model 

Shu-Chen Hsu, Alban de Lavenne, Vazken Andréassian, Amal Rabah, and Maria-Helena Ramos

Surface hydrological models usually define their modelling units using topographic catchment  boundaries, which are then connected by the river network. Inter-catchment Groundwater Flows (IGFs) are water fluxes that do not respect these topographic boundaries. They can significantly influence river discharge. Therefore, surface hydrological models usually estimate IGFs indirectly, by adjusting the water balance across the topographic catchment. As they cannot be measured directly, the realism of these simulated fluxes can be questioned.

Here, we investigate how a model calibration strategy could help to improve the physical realism of simulated IGFs. We propose a multi-objective calibration strategy, where we optimise the model simulation on two fluxes: river discharge and actual evapotranspiration using MODIS satellite estimates. Indeed, we hypothesize that better IGFs could be estimated if the water balance is more constrained by evaporation. We explore different objective functions to identify the most efficient way to use satellite data by looking at the model robustness in time and space.

The Seine catchment is characterised by a complex, multi-layered aquifer system where the river loses water in some places and gains water in others. We evaluate the ability of the GRSD model, a semi-distributed hydrological model that implements the lumped GR5J in each subcatchment, to consistently describe this system thanks to this calibration strategy. The influence of four upstream dams is also considered in the modelling, as they have a significant impact on the hydrology. In particular, this work could help to understand the extent to which low flows are maintained naturally by groundwater or artificially by these dams.

This work is partly funded by the ANR (CIPRHES project) and by the European Union’s HORIZON Research and Innovation Actions Programme under Grant Agreement No. 101059372 (STARS4Water project).

How to cite: Hsu, S.-C., de Lavenne, A., Andréassian, V., Rabah, A., and Ramos, M.-H.: Better mapping of groundwater-surface water exchanges over the Seine River catchment in a surface hydrological model, EGU General Assembly 2024, Vienna, Austria, 14–19 Apr 2024, EGU24-15833, https://doi.org/10.5194/egusphere-egu24-15833, 2024.

EGU24-16289 | ECS | Posters on site | HS8.2.12

Decadal trends in groundwater quality observed in national groundwater monitoring wells - assessment of climate change effects using machine learning. 

Georgios Ikaros Xenakis, Søren Jessen, Julian Koch, and Jolanta Kazmierczak

As pressures on water resources are expected to increase due to climate change and population growth, ensuring sufficient quantity and quality of drinking water emerges as a global challenge. Climate change can affect groundwater quantity and quality through changes in chemical equilibria, reaction kinetics, and soil processes induced by shifting temperature, precipitation, and evapotranspiration. However, the impact of climate change on groundwater quality has not been studied thoroughly and thus is identified as an important scientific challenge and knowledge gap. To address this challenge, we analyzed high-quality long-term datasets, spanning from 1993 to 2022 of several environmental and hydroclimatic factors, as well as groundwater quality and quantity, available at national scale in Denmark. Initial results from around 200 groundwater monitoring wells distributed across Denmark show a decrease in pH and oxygen content in most of the wells for the period 1993-2022. Expected results will show the temporal change of selected geogenic compounds and other major chemicals and physical properties and their trends for this climatic period. Machine learning analysis will be applied in future work to identify the main drivers of change in concentrations of selected geogenic compounds, oxygen, and pH, and to create baseline maps of the recent period (2017-2022/23). The baseline maps, representing current conditions, will be derived by geospatial machine learning modelling frameworks linking covariate maps with borehole scale information of water quality parameters. How to distinguish the impacts of climate change from human-induced changes such as pumping, as well as link observed trends in the past, current baseline maps, and expected future hydroclimatic changes to investigate groundwater quality patterns under future conditions still needs to be studied. As some geogenic compounds are harmful to human health and the environment, decrease drinking water quality and increase purification costs, a better understanding of the linkages between climate change and groundwater chemistry will be vital for future groundwater management in Denmark. The developed machine learning model and its potential for global upscaling could contribute to sustainable groundwater management worldwide.

How to cite: Xenakis, G. I., Jessen, S., Koch, J., and Kazmierczak, J.: Decadal trends in groundwater quality observed in national groundwater monitoring wells - assessment of climate change effects using machine learning., EGU General Assembly 2024, Vienna, Austria, 14–19 Apr 2024, EGU24-16289, https://doi.org/10.5194/egusphere-egu24-16289, 2024.

EGU24-17093 | Posters on site | HS8.2.12

Numerical models of groundwater flow in folded and faulted aquifers in mountainous areas: trade-offs between numerical error and runtime 

Cristina Di Salvo, Randall J. Hunt, Max Newcomer, Daniel T. Feinstein, and Elisabetta Preziosi

Groundwater flow in folded and faulted terrains is governed by the geological structure, which exerts a significant influence on the flow directions and on the spring location.  Numerical modeling can be challenging because the complex geometry of model layers can result in steep inclination of aquifer bed and different thicknesses of saturated portions within the same numerical layer. Drying and rewetting of cells during model iterations leads to numerical instabilities, increasing numerical error and runtime. However, excessive simplification of the system, seeking for numerical stability, may lead to an unsatisfactory predictive capability of the model.

Recent advances have addressed such issues, including the development of solvers that facilitate convergence and/or reduce computational errors due to model nonlinearities [1], [2].

The aim of this research was to develop and test a procedure for the simulation of groundwater flow in a complex karst, folded, multilayer aquifer, while minimizing numerical errors and runtime.

We applied this procedure to a 3D model, previously developed in steady state conditions with an equivalent porous media approach using the Newton-Raphson formulation of MODFLOW-2005 (MODFLOW-NWT) [3]. The major impact of folded and faulted geological structures on controlling the flow dynamics in terms of flow direction, water heads, and spatial distribution of the outflows to the river and springs was accounted for in a numerical model where three aquifer layers and two semipermeable layers have been constructed respecting their true geometry as far as possible. 

A transient simulation was performed on this model using monthly stress periods and variable pumping simulated by MODFLOW’s WEL package to test effects of withdrawals for water supply on the aquifer system. Initial runs showed a very high mass balance error (2% discrepancy over cumulative volume) and a runtime of 1 hour and 38 minutes. To reduce both mass balance error and runtime, the USGS software for the optimization of the MODFLOW-NWT solver inputs, NWTOPT [4], was used.  NWTOPT identified improved solver inputs, which gave a superior tradeoff between acceptable mass balance error (-0.39%) and much reduced runtime (40 minutes and 9 seconds).

The added stability and shorter runtimes are particularly welcome if many iterations of the model were needed for automated calibration, application or uncertainty analysis.

References

[1]  Niswonger, R. G., Panday, S., & Ibaraki, M. (2011). MODFLOW-NWT, a Newton formulation for MODFLOW-2005. US Geological Survey Techniques and Methods, 6(A37), 44.

[2] Hunt, R. J., & Feinstein, D. T. (2012). MODFLOW-NWT–Robust handling of dry cells using a Newton Formulation of MODFLOW-2005. Ground Water, 50(5), 659-663.

[3] Preziosi, E., Guyennon, N., Petrangeli, A.B., Romano, E., Di Salvo, C. (2022) A stepwise modelling approach to identifying structural features that control groundwater flow in a folded carbonate aquifer system. Water, 14 (16), art. no. 2475,  DOI: 10.3390/w14162475

[4] Newcomer, M. W., & Hunt, R. J. (2022). NWTOPT–A hyperparameter optimization approach for selection of environmental model solver settings. Environmental Modelling & Software, 147, 105250.

How to cite: Di Salvo, C., Hunt, R. J., Newcomer, M., Feinstein, D. T., and Preziosi, E.: Numerical models of groundwater flow in folded and faulted aquifers in mountainous areas: trade-offs between numerical error and runtime, EGU General Assembly 2024, Vienna, Austria, 14–19 Apr 2024, EGU24-17093, https://doi.org/10.5194/egusphere-egu24-17093, 2024.

EGU24-17563 | ECS | Posters on site | HS8.2.12

Investigating Long-Term Interrelation between Groundwater and Surface Water Using Transfer Entropy 

Guang-YI Chen and Li-Chiu Chang

The accelerated global development process has further intensified climate change, leading to a continuous rise in global temperatures and an exacerbation of climate change severity. This has resulted in an increased frequency of extreme hydrological events. Taiwan, influenced by complex terrain and uneven rainfall distribution, faces challenges in effectively storing rainfall, with individual rainfall allocations falling below the global average. In situations of insufficient surface water supply, groundwater becomes a crucial water source due to its low cost, resistance to pollution, and convenient accessibility. However, prolonged excessive extraction of groundwater not only causes land subsidence but also poses risks of severe disasters such as seawater intrusion.


Taiwan’s groundwater is widely distributed and abundant, especially in some regions with advanced agriculture, where it becomes an indispensable key water resource. However, in the context of climate change, rainfall characteristics are subtly and gradually changing, which in turn has an indirect impact on groundwater resources. This study area is the Choshui River Basin located in central Taiwan. We utilize transfer entropy to analyze time series data from groundwater and surface water resources. Transfer entropy is a statistical masure used to quantify the directional flow of information between systems. This method excels in analyzing complex systems where traditional linear methods might fall short, offering insights into how one system influences or is influenced by another over time. It can be adeptly employed to analyze the long-term interaction mechanisms between groundwater and surface water. It specifically investigates the interrelationships and variations in regional groundwater levels during wet and dry seasons, both temporally and spatially. Through an integrated analysis of methods and relevant results, the study aims to explore the primary factors influencing groundwater variations, comprehend trends in groundwater level changes, and provide crucial information on groundwater characteristics. This study contributes to the optimization of the joint allocation and utilization of surface water and groundwater, and can serve as a reference strategy for the allocation and management of regional groundwater.

How to cite: Chen, G.-Y. and Chang, L.-C.: Investigating Long-Term Interrelation between Groundwater and Surface Water Using Transfer Entropy, EGU General Assembly 2024, Vienna, Austria, 14–19 Apr 2024, EGU24-17563, https://doi.org/10.5194/egusphere-egu24-17563, 2024.

EGU24-18457 | Orals | HS8.2.12

Use of Dynamic Mode Decomposition for the reconstruction of contaminant release history  

Valentina Ciriello, Giulia Libero, and Daniel M. Tartakovsky

The design of effective remediation actions is crucial to protect human health and the environment against the risks posed by aquifer contamination. To improve the predictions of plume properties and the assessment of the efficiency of remediation strategies, much effort has been spent to model subsurface transport processes. One of the most challenging components of the analysis is the identification of the sources of groundwater contamination, which involves the estimation of both locations of the contaminant release and its temporal history. This inverse-modeling task must deal with the complexity of flow path in the aquifer, while contending with the sparsity (both in space and time) of observations of solute concentration. Subsurface heterogeneity and data scarcity require the use of computationally expensive probabilistic methods to solve this inverse problem. We present dynamic mode decomposition (DMD) as an alternative tool to reduce the computational burden of contaminant source identification. DMD is a data-driven, equation-free technique able to interpret the behavior of a system and generate a computationally efficient reduced-order model of the system behavior directly from the data. The method is based on singular value decomposition and consists of a regression of spatially distributed data, collected from a dynamical system at multiple times, onto locally linear dynamics. It allows one to discern dominant spatiotemporal patterns in the dynamical system behavior. We use DMD algorithms to recombine these structures to get system states back in time and reconstruct the contaminant release history.

How to cite: Ciriello, V., Libero, G., and Tartakovsky, D. M.: Use of Dynamic Mode Decomposition for the reconstruction of contaminant release history , EGU General Assembly 2024, Vienna, Austria, 14–19 Apr 2024, EGU24-18457, https://doi.org/10.5194/egusphere-egu24-18457, 2024.

EGU24-18672 | Orals | HS8.2.12 | Highlight

A hybrid analytical and machine learning framework for groundwater resources management 

Aitor Iraola, María Pool, Albert Nardi, Ester Vilanova, Jorge Molinero, and Marco Dentz

In Hydrogeology, numerical models are presented as essential tools for integrating, understanding, and predicting groundwater processes. However, these models face significant challenges: on the one hand, boundary conditions and hydraulic parameters are often subject to a large degree of uncertainty, and, on the other hand, numerical models usually require advanced solving and calibration techniques that generally imply long runtimes. Recently, innovative machine learning models have emerged as a promising alternative to address these issues and thus, the application of artificial intelligence in hydrology has increased significantly. In this study we present a hybrid model designed to predict groundwater heads in response to pumping. This model generates an initial analytical approximation of groundwater heads which is later enhanced by a machine learning framework based on recurrent neural networks. A real application of a pumping field for urban supply in Spain is presented as an illustration of the practical application of the presented methodology. Following model training and validation, we have also integrated a genetic algorithm to optimise flow rates, aiming to minimise energy consumption and/or head drawdowns. The results reveal that our hybrid approach achieves highly accurate head predictions with normalised absolute mean error lower than 4% which implies that the model reproduces properly the head measurements. Additionally, the optimisation algorithm successfully reduces energy consumption by 25%. This methodology represents a groundbreaking approach to quantify the effects of intense pumping and to facilitate long-term management of groundwater resources.

How to cite: Iraola, A., Pool, M., Nardi, A., Vilanova, E., Molinero, J., and Dentz, M.: A hybrid analytical and machine learning framework for groundwater resources management, EGU General Assembly 2024, Vienna, Austria, 14–19 Apr 2024, EGU24-18672, https://doi.org/10.5194/egusphere-egu24-18672, 2024.

EGU24-20788 | Orals | HS8.2.12

Advancing Groundwater Vulnerability Assessment in Coastal Regions: Integrating Machine Learning and Traditional Frameworks 

Rahim Barzegar, Fatemeh Jafarzadeh, Asghar Asghari Moghaddam, Siamak Razzagh, Vincent Cloutier, and Eric Rosa

We introduce an innovative machine learning (ML)-enhanced method to assess groundwater vulnerability in coastal regions, with a specific focus on the Azarshahr plain near Urmia Lake in Northwestern Iran. Our methodology integrates the traditional DRASTIC and GALDIT frameworks to surpass their limitations (e.g. subjectivity) in varied contexts such as coastal and agricultural-industrial environments. The traditional frameworks including the DRASTIC framework form the core of our approach, featuring seven key layers: Depth to water [D], Net Recharge [R], Aquifer Media [A], Soil Media [S], Topography [T], Impact of Vadose Zone [I], and Hydraulic Conductivity [C], each meticulously developed with specific ratings and weights according to DRASTIC standards. Similarly, the GALDIT framework contributes a six-layer map, including Groundwater Occurrence [G], Aquifer Hydraulic Conductivity [A], Height of Groundwater Level [L], Distance from the Shore [D], Impact of Existing Seawater Intrusion Status [I], and Aquifer Thickness [T], each layer uniquely rated and weighted. To address the limitations of these traditional frameworks, our study integrates an advanced ML recalibration of the GALDIT and DRASTIC indices, using the maximum concentrations of Total Dissolved Solids (TDS) and Nitrate (NO3) in the study area as proxies. We employed a range of decision tree-based ML models, including Adaptive Boosting (AdaBoost), Extreme Gradient Boosting (XGBoost), Light Gradient Boosting Machine (LGBM), and Random Forest (RF), to predict the adjusted vulnerability indices, applying six predictors for GALDIT and seven for DRASTIC. These models were trained and validated on a dataset split into 70% for training and 30% for validation. Our results indicate that the traditional DRASTIC indices correlate weakly with NO3 concentrations. However, the ML-augmented models, particularly AdaBoost, significantly improved predictive accuracy. Likewise, GALDIT results were greatly enhanced by incorporating the AdaBoost model. A key innovation in our research is the development of a sophisticated meta-ensemble ML model. This model, based on the most effective AdaBoost applications in the DRASTIC and GALDIT assessments, marks a significant methodological advancement. It integrates vulnerabilities from both frameworks using a Fuzzy operation and then redeveloping a meta-ensemble ML model. This comprehensive model demonstrated exceptional performance, highlighting the effectiveness of our integrated ML approach in providing a more detailed, accurate, and robust assessment of coastal aquifer vulnerability. Moreover, our study includes an extensive spatial analysis of groundwater vulnerability in the Azarshahr plain. The DRASTIC model indicated varying vulnerability levels, with heightened susceptibility in central and southern regions, albeit showing a weaker correlation with NO3 concentrations. Conversely, AdaBoost exhibited a strong correlation with actual NO3 levels, showcasing its predictive capability. The GALDIT index identified several high-risk areas, particularly those vulnerable to seawater intrusion, with the AdaBoost-enhanced model outperforming other ML approaches. Our comprehensive AdaBoost meta-ensemble model merges insights from both NO3 and TDS evaluations, offering a holistic groundwater vulnerability. This model is crucial for informed decision-making, identifying areas where NO3 and TDS risks converge. Its spatial analysis strongly correlates 'Very High' vulnerability zones with high NO3 and TDS concentrations, confirming its integrative efficiency in environmental risk assessment.

How to cite: Barzegar, R., Jafarzadeh, F., Asghari Moghaddam, A., Razzagh, S., Cloutier, V., and Rosa, E.: Advancing Groundwater Vulnerability Assessment in Coastal Regions: Integrating Machine Learning and Traditional Frameworks, EGU General Assembly 2024, Vienna, Austria, 14–19 Apr 2024, EGU24-20788, https://doi.org/10.5194/egusphere-egu24-20788, 2024.

EGU24-20895 | Posters on site | HS8.2.12

Short-term and Long-term Groundwater level forecast by applying conceptual and neural networks approaches. 

Leticia Baena-Ruiz, Antonio Juan Collados, David Pulido-Velazquez, Juan de Dios Gomez-Gomez, Luis Gonzaga Baca Ruiz, and María del Carmen Pegalajar Jimenez

Aquifers are crucial resources for mitigating the impact of droughts, which are expected to exacerbate in the future. Nevertheless, in many cases, there is not enough monitoring data to define distributed models to forecast future potential groundwater (GW) levels. In this work, we apply and compare different approaches for short-term predictions of GW levels. We use conceptual models (e.g., AQUIMOD, EMM, etc) and machine learning techniques (e.g., NAR, NARX, ELMAN, LSTM and/or GRU). We follow the next steps: calibration/training, validation and testing of the behaviour of conceptual models and neural networks for short-term prediction. We consider exogenous variables (precipitation, temperature, recharge, etc.) for short-term prediction. Multiple series of exogenous variables have been generated by using a stochastic weather generator, which will be used to perform a stochastic forecast. The results will be analysed for dry, medium and wet seasonal horizons. The predictions made with "machine learning" are compared with those generated by the conceptual models. In order to assess potential impacts of Climate Change on GW levels, we simulated some simulated some future local climate scenarios within the conceptual models. We analyzed the robustness of the results and their uncertainty. The risk of droughts has also been studied by evaluating the severity of droughts from the series generated by applying the “SPI” indices to the generated series. The method has been applied in two aquifers, namely Campo de Montiel (Center Spain) and Vega de Granada (Southern Spain).


Acknowledgments: This research has been partially supported by the projects: STAGES-IPCC (TED2021-130744B-C21) and SIGLO-PRO (PID2021-128021OB-I00), from the Spanish Ministry of Science, Innovation and Universities.

How to cite: Baena-Ruiz, L., Collados, A. J., Pulido-Velazquez, D., Gomez-Gomez, J. D. D., Baca Ruiz, L. G., and Pegalajar Jimenez, M. C.: Short-term and Long-term Groundwater level forecast by applying conceptual and neural networks approaches., EGU General Assembly 2024, Vienna, Austria, 14–19 Apr 2024, EGU24-20895, https://doi.org/10.5194/egusphere-egu24-20895, 2024.

The global issue of saltwater intrusion (SWI) is impacting coastal aquifers more prominently due to climate changes and the escalating demand of freshwater for various anthropogenic activities. Consequently, there has been a heightened focus on research in this area to improve predictions regarding the effect of geological media on the advancement of salt water into fresh aquifers. The current study simulated saltwater flow into a freshwater zone for a coastal environment, considering density-dependent effects. Two specific scenarios were considered: one involving homogeneous media and the other involving heterogeneous media. In prior studies, researchers commonly employed homogeneous media exclusively for simulating SWI experiments. However, for the present work, we also incorporated heterogeneous media with a geophysical Direct Current (DC) sounding approach to determine the interface between fresh and saltwater. The experimental responses were numerically modelled to know the behaviour of geological constraints during the flow of saline water. For validation, a field example of the DC resistivity survey was incorporated for a better correlation. The experimental findings suggest that the interface between freshwater and saltwater was influenced when the advancing saltwater wedge encountered the clay layer. For a coastal environment, a clay layer (which is porous but not permeable) is crucial in influencing saltwater intrusion dynamics. The agreement between experimental data, numerical simulations, and DC-sounding outcomes indicates that the proposed integrated approach can be a valuable benchmark for future studies on seawater intrusion, even in environments with more complex geological conditions.


Keywords: Aquifers, Saltwater Intrusion (SWI), DC Sounding, Numerical modeling.

How to cite: Tiwari, P. and Sharma, S. P.: Investigating the influence of geological heterogeneity in the advancement of the saltwater wedge: A novel perspective study employing Experimental, DC Sounding and Numerical modeling approach, EGU General Assembly 2024, Vienna, Austria, 14–19 Apr 2024, EGU24-314, https://doi.org/10.5194/egusphere-egu24-314, 2024.

EGU24-654 | ECS | Orals | HS8.2.13

Geoelectrical and electromagnetic imaging methods applied to groundwater systems: recent advances and future potentials 

Paula Rulff, Octavio Castillo-Reyes, Philipp Koyan, Tina Martin, Wouter Deleersnyder, and Maria Carrizo Mascarell

The impacts of climate change, combined with population growth, necessitate practical and effective solutions for locating groundwater resources and ensuring drinking water quality. Our contribution explores recent advances in geoelectrical and electromagnetic imaging methods applied to investigate groundwater systems. Geoelectrical and electromagnetic imaging techniques are popular methods for characterising subsurface properties, such as electrical resistivity or dielectric permittivity. These electrical properties are strongly related to the hydrogeological characteristics of the subsurface. Therefore, geoelectrical and electromagnetic investigations can provide valuable insights into finding groundwater resources, assessing the water quality in terms of contaminations and conducting effective groundwater management.

Our study examines state-of-the-art approaches in modelling and instrumentation of induced polarisation and electrical resistivity tomography, as well as time- and frequency-domain electromagnetics and ground-penetrating radar methods. We review recent impactful and innovative groundwater case studies where the above-mentioned methods were applied and further developed. Emphasising the combination of geoelectrical and electromagnetic methods, the studies provide insights into the variation of electrical subsurface properties at different scales, contributing to an improved understanding of the hydrological dynamics in the studied areas. Furthermore, we provide an outlook on the potential for applying geoelectrical and electromagnetic imaging techniques for large-scale groundwater investigations in the exascale computing area.

How to cite: Rulff, P., Castillo-Reyes, O., Koyan, P., Martin, T., Deleersnyder, W., and Carrizo Mascarell, M.: Geoelectrical and electromagnetic imaging methods applied to groundwater systems: recent advances and future potentials, EGU General Assembly 2024, Vienna, Austria, 14–19 Apr 2024, EGU24-654, https://doi.org/10.5194/egusphere-egu24-654, 2024.

EGU24-2176 | ECS | Posters virtual | HS8.2.13

Predicting Soil Bulk Density in Boreal Podzolic Soil using Ground-Penetrating Radar and Electromagnetic Induction 

Sashini Pathirana, Lakshman Galagedara, Sébastien Lambot, Manokararajah Krishnapillai, Christina Smeaton, and Mumtaz Cheema

Soil compaction is one of the major challenges in sustainable agriculture, primarily due to the use of heavy farming machinery. Tillage and soil compaction influence soil properties, state variables, and processes, ultimately affecting soil health, crop growth, and yield. Traditional methods to estimate soil compaction level, like bulk density (BD) and penetration resistance, are laborious, destructive, time-consuming and provide point-scale measurements only. Near-surface geophysical techniques like Ground-Penetrating Radar (GPR) and Electromagnetic Induction (EMI) are being increasingly utilized to estimate soil properties and state variables in the agricultural landscape since GPR and EMI can address some of drawbacks of traditional methods. However, there is a lack of studies with GPR and EMI examining the BD change associated with tillage and soil compaction. We hypothesize that proxies from GPR and/or EMI can be used to predict BD as an indicator of soil compaction. The objectives were to: 1) evaluate the impact of BD change on dielectric constant (Kr) and direct ground wave amplitude (A) measured from GPR, and apparent electrical conductivity (ECa) measured by EMI; and 2) assess the predictive capability of GPR and EMI for BD determination. The experiment was conducted on a loamy sand textured soil at a boreal podzolic site in Newfoundland, Canada. Proxy data (i.e., Kr, A and ECa) were collected using a 500 MHz center frequency GPR system and an EMI sensor representing three compaction treatments (i.e., after tillage, after 4- and 10-time roller passes). Treatment effects and relationships between proxies and the average BD of 0-30 cm soil depth were tested using analysis of variance (ANOVA) and correlation analysis. A Random Forest (RF) regression approach was employed to identify the most significant variables for predicting BD. Subsequently, simple, and multiple linear regression models (LRM) were developed. The accuracy of these LRMs was assessed by comparing predicted and measured BD values. ANOVA results reveal that the measured BD and proxies are significantly different at all three compaction levels. The average BD strongly correlated with soil proxies; Kr(r=0.72), A (r=0.71), and ECa(r=0.89). Based on RF, ECa and Kr are the most important variables to predict BD for the studied data set. Therefore, ECaand Kr were used to develop simple and multiple LRMs. The simple LRM developed with ECa showed a higher coefficient of determination, R2=0.80, compared to Kr (R2=0.63), while the multiple LRM showed the highest R2 (R2=0.83). The model predicted BDs did not deviate from 1:1 line with a root mean square error of <0.14 g/cm3. This study highlights the potential of using GPR and EMI to predict BD non-destructively while covering a larger sample volume. Further research must be conducted to assess the applicability and limitations of this approach under different water contents, electrical conductivities, and soil types.

How to cite: Pathirana, S., Galagedara, L., Lambot, S., Krishnapillai, M., Smeaton, C., and Cheema, M.: Predicting Soil Bulk Density in Boreal Podzolic Soil using Ground-Penetrating Radar and Electromagnetic Induction, EGU General Assembly 2024, Vienna, Austria, 14–19 Apr 2024, EGU24-2176, https://doi.org/10.5194/egusphere-egu24-2176, 2024.

EGU24-2394 | Orals | HS8.2.13

Unveiling the characteristics of ZVI-AC-sand mixtures in remediating contaminated groundwater using spectral induced polarization 

Deqiang Mao, Xinmin Ma, Alex Furman, Nimrod Schwartz, Chen Chao, Teng Xia, Kai Yang, and Xiaolei Guan

The long-term performance of the permeable reactive barriers in remediating contaminated groundwater may diminish as a result of oxidation, precipitation on the particle surfaces, and pore space clogging. Evaluating its performance through monitoring could address this dilemma. We investigate the spectral induced polarization (SIP) response of zero valent iron (ZVI)-activated carbon (AC)-sand mixtures.The chargeablity exhibits a perfect linear relation to the volumetric concentration of ZVI (2.5-50%) and AC (2.5%-75%) with r = 0.99. However, the low-frequency electrical conductivity shows low sensitivity to the volumetric content of ZVI and AC. The relaxation time increases with the particle sizes. When these two particles are mixed, chargeablity is approximated as a superposition of their individual values. In terms of phase values and frequencies of the phase peaks, it also exhibits this superposition effect. Furthermore, we conducted 720-hour SIP measurements on ZVI-AC-sand columns flushed with NaCl or NaNO3 solutions. It suggests that precipitation of 0.06 mm thick sedimentation onto the ZVI surface induced by changes in redox chemistry observed in micromorphology images, resulting an increase in the normalized chargeability by 44.05%, the scaled relaxation time and Cole–Cole model exponent by 1098.99% and 23.11%. Compared to flow-through by NaCl solution, changes in these parameters are more pronounced for columns saturated with NaNO3 solution, indicating the corrosion of ZVI. Our findings illustrate that induced polarization parameters vary in response to the chemical alteration of ZVI-AC-sand mixed media, showing the potential for noninvasive long-term monitoring of the reactive barriers.

How to cite: Mao, D., Ma, X., Furman, A., Schwartz, N., Chao, C., Xia, T., Yang, K., and Guan, X.: Unveiling the characteristics of ZVI-AC-sand mixtures in remediating contaminated groundwater using spectral induced polarization, EGU General Assembly 2024, Vienna, Austria, 14–19 Apr 2024, EGU24-2394, https://doi.org/10.5194/egusphere-egu24-2394, 2024.

Groundwater level, permeability and chemical components can be affected by earthquakes, however there are few comprehensive investigations on the combination of long-term continuous monitoring data and multiple strong earthquakes. In this study, continuous two-year dataset of groundwater levels and chemical compositions of groundwater (Ca2+, Mg2+ and HCO3-) in well #32 were collected to analyze the groundwater dynamic changes induced by earthquakes in the aquifer-aquitard system. The groundwater level appeared co-seismic rise change induced by Yangbi MW 6.1 earthquake and Luding MW 6.6 earthquake. The vertical permeability, estimated by the tidal response model, exhibited decrease changes during the period of Yangbi MW 6.1 earthquake and Luding MW 6.6 earthquake. Meanwhile, the continuous two-year chemical compositions showed that Ca2+ and HCO3- concentrations decreased, and Mg2+ concentrations increased during the two earthquakes period. The correlation between the vertical permeability and chemical compositions showed that there was a significant negative correlation between the vertical permeability and Mg2+, and a significant positive between the vertical permeability and Ca2+, HCO3-. A possible mechanism for observed fluctuations in some chemical compositions during earthquakes periods was that the reduction of mixing effect of different groundwater caused by permeability decreased. The flow of groundwater richened in Ca2+ and HCO3- from the overlying aquifer to the observation aquifer has been reduced. Meanwhile, due to the weakening of dilution effect, the Mg2+ concentration of the observation aquifer increased. This study can enhance understanding of the groundwater dynamic changes induced by earthquakes.

How to cite: Feng, X., Zhou, Z., and Zhong, J.: Groundwater dynamic changes induced by earthquakes in an aquifer-aquitard system from well monitoring in Southwest China, EGU General Assembly 2024, Vienna, Austria, 14–19 Apr 2024, EGU24-2961, https://doi.org/10.5194/egusphere-egu24-2961, 2024.

EGU24-3994 | Posters on site | HS8.2.13

Coupled multiphysics approach to characterize groundwater flow system around a near-surface fault zone 

Marceau Gresse, Akinobu Miyakoshi, Shogo Komori, Hinako Hosono, Yuki Tosaki, Tsutomu Sato, Daisuke Asahina, Hitoshi Tsukamoto, Makoto Otsubo, and Mikio Takeda

Fault zones intensively disturb local hydrogeologic structures, and, consequently, can play a critical role in governing small to large-scale groundwater flow. Extensive studies have focused on the permeability variation along faults in the light of the conduit or barrier function for the deep groundwater flow. However, little attempt has been made to characterize the hydrological functions of near-surface fault zone.

Exposed to atmospheric conditions, fault zones are further disturbed by stress relief and chemical weathering, modifying their structure and generally increasing their permeability. Consequently, the fault zone, which functions as a recharge or discharge zone at the near surface, exerts a non-negligible influence on groundwater flow. However, identifying the hydrological function of near-surface fault zone remains challenging when relying solely on conventional, often non-integrated, geophysical or hydrological investigation approaches.

This study proposes a multiphysics coupled strategy to understand the groundwater flow regime around near-surface fault zone. The proposed approach is applied to an active reverse fault zone in Kamikita Plain, NE Japan, which extends for 30 km within the recharge zone of the catchment.

The proposed multiphysics approach consists of 5 successive steps:

  • 2-D Electrical Resistivity Tomography (ERT) Survey: A 2.3 km-long profile crossing the fault zone, consisting of 7 roll-along surveys with a 6-m electrode spacing.
  • Self-Potential Survey: Conducted along the 2.3 km ERT profile.
  • Rock Property Characterization: A 80 m deep borehole was drilled in the fault zone and physical properties were measured.
  • 3-D Groundwater Flow Simulation of the Fault Zone: Utilizing areal hydrogeological data, measured rock properties, and geophysical imaging.
  • Model Validation Process: Using the results from the groundwater flow simulation, electrical conductivity and self-potential responses were calculated, and compared with observed field data.

Preliminary results successfully reproduce the overall resistivity signature and the self-potential anomaly (+35 mV) in the fault zone, attributed to local groundwater upwelling. This newly proposed multiphysics approach could be an essential tool to evaluate the groundwater flow in a region including large-size fault zone, which is important for radioactive waste disposal. Furthermore, this approach could also be effective in capturing the local fluid flow circulation for a variety of applications.

Acknowledgements: Main part of this research project has been conducted as the regulatory supporting research funded by the Secretariat of the Nuclear Regulation Authority, Japan.

How to cite: Gresse, M., Miyakoshi, A., Komori, S., Hosono, H., Tosaki, Y., Sato, T., Asahina, D., Tsukamoto, H., Otsubo, M., and Takeda, M.: Coupled multiphysics approach to characterize groundwater flow system around a near-surface fault zone, EGU General Assembly 2024, Vienna, Austria, 14–19 Apr 2024, EGU24-3994, https://doi.org/10.5194/egusphere-egu24-3994, 2024.

EGU24-4487 | ECS | Orals | HS8.2.13

Water transport in agricultural soils estimated by time-lapse electrical resistivity tomography technique 

Jia-Wei Liu, Young-fo Chang, and Tsang-Sen Liu

It is well-recognized that soil moisture plays an important role in the management of water resources, as well as soil and crop production. This research proposed the use of time-lapse Electrical Resistivity Tomography (ERT) to overcome the limitations of point-based soil moisture measurement, which often fails to capture detailed spatiotemporal data. ERT is a widely used geophysical technique for the non-destructive exploration of subsurface media’s resistivity. Since the electrical resistivity is sensitive to the water content in soil, the variation of the soil’s resistivity in time and space can be obtained by using this technique that can be correlated to water transport in soil. Thus, using time-lapse ERT for the exploration of water transport in the soil was launched in this study.

This research conducted a time-lapse ERT survey executed in a farm during a sprinkling rainfall. A 50 meters time-lapse ERT survey was employed for 29 days with a hybrid-array configuration at a fallow land. The electrode spacing was 1 meter and measurement were conducted every 2 hours, thus a resistivity section of the land with 50 meters in length and 4 meters in depth was estimated with a period of 2 hours. In addition, five moisture meters were set up in the middle of the ERT survey line and at depths of 10, 20, 30, 50, and 100 cm, respectively. Then, the variation of the resistivity was compared with the precipitation data and the soil moisture readings from the meters. The results showed that the decrease of soil resistivity was consistent with the increase of the precipitation and soil moisture. The water transport rates in soils estimated by this technique and moisture meters were similar, they were 20 mm/hour and 16 mm/hour, respectively.

This study demonstrates that time-lapse ERT is an effective tool for dynamically monitoring water transport in soils. By employing this technique, near real-time 2D soil moisture monitoring becomes feasible, which could significantly enhance the optimization of water resources and crop production, when integrated with an automatic irrigation system.

How to cite: Liu, J.-W., Chang, Y., and Liu, T.-S.: Water transport in agricultural soils estimated by time-lapse electrical resistivity tomography technique, EGU General Assembly 2024, Vienna, Austria, 14–19 Apr 2024, EGU24-4487, https://doi.org/10.5194/egusphere-egu24-4487, 2024.

Accurately determining soil hydraulic properties is a complex task due to significant variations in spatial information, posing ongoing challenges in managing subsurface and agricultural practices effectively. Geophysical methods, alongside traditional techniques, play a crucial role in monitoring subsurface state variables and inferring soil properties. Electrical Resistivity Tomography (ERT) is an appealing geophysical method due to its non-invasive, easy-to-apply and cost-effective nature. In ERT, electrical resistivity tomograms, obtained with surface measurements, are used to monitor the hydraulic state of the subsurface by translating the electrical tomograms to water content or pore-water salinity maps using calibrated petrophysical relations. However, obtaining 2D (or 3D) electrical tomograms from raw measurements requires the inversion of an ill-posed problem, which causes smoothing of the actual structure. Furthermore, the spatial resolution of the electrical tomograms is determined from the distances in the electrode placement, thus inherently upscaling the obtained structure. In this study, we explored the applicability of Physics-Informed Neural Networks (PINNs) for simultaneously upscaling soil properties, specifically the permeability and the petrophysical relations, and monitoring water dynamics at heterogeneous soils, using time-lapse geoelectrical measurements as the training data. High-resolution numerical simulations mimicking water infiltration to the subsurface were used as benchmarks to test the provided approach. Synthetic time-lapse ERT surveys with electrode spacing ten times larger than the numerical model resolution were conducted to provide upscaled 2D electrical resistivity tomograms. The electrical tomograms were fed to a PINNs system to obtain the permeability, petrophysical relations, and water content spatiotemporal maps simultaneously. To examine the system sensitivity to the measured data, an additional PINNs system that also incorporates water content measurements at 20 random locations was trained separately. Results have shown that the PINNs system could produce reliable results regarding the upscaled (heterogeneous) permeability and petrophysical relations fields. Water dynamics at the subsurface was accurately predicted by the PINNs system with an average error of ∼3% in the upscaled water saturation maps. The two separately trained PINNs systems have provided similar results in the obtained fields, indicating that the PINNs system can produce unique solutions for highly ill-posed problems. The addition of water content measurements at 20 random locations to the PINNs system training slightly improved the system outcomes, where a reduction of ∼0.25% in the upscaled water saturation average misfit was observed. Improvements were primarily located at the ERT low sensitivity zones, i.e., at the array's outskirts and large depths, thus implying the cost over benefits for obtaining additional hard data for training the system.

How to cite: Sakar, C., Schwartz, N., and Moreno, Z.: Upscaling Permeability, Petrophysical Relations and Water Saturation Maps of Heterogeneous Soils Using Physics-Informed Neural Networks Trained with Time-lapse Geo-electrical Tomograms, EGU General Assembly 2024, Vienna, Austria, 14–19 Apr 2024, EGU24-6719, https://doi.org/10.5194/egusphere-egu24-6719, 2024.

EGU24-8903 | ECS | Posters on site | HS8.2.13

Pore Structure Affecting the NMR Relaxation in Unsaturated porous media  

Junwen Zhou and Chi Zhang

Nuclear magnetic resonance (NMR) uniquely reveals pore water properties due to the magnetization and relaxation dynamics of water molecule hydrogen atoms. Importantly, the correlation between NMR signals (amplitude and relaxation times) and water content and distribution aids in discerning water retention patterns in porous media. While this relationship is well understood in saturated media, comprehending water dynamics under unsaturated conditions using NMR datasets is a considerable challenge, owing to the complexities of the pore environment (e.g. pore structure and interactions between different phases and components). In many previous studies, an increased amplitude of shorter relaxation T2 time distribution components has often been associated with enhanced water bound in micropores in unsaturated versus saturated media. The interpretation is counterintuitive as smaller pores cannot exceed their saturation water capacity, implying a potential misinterpretation of water distribution dynamics and pore structure within unsaturated media. To address this misinterpretation, our study develops a model to simulate the T2 peak shift from unsaturated to saturated pore states. The simulations successfully reconcile these anomalies, indicating that unsaturated macropores can display short relaxation times akin to saturated micropores and demystifying the decrease in shorter relaxation time components in T2 distributions of non-expansive, multi-pore-sized media from saturated to unsaturated states. By establishing different models to idealize pore structure characteristics (e.g. size and shape), the simulated NMR relaxation can clarify how pore structure affects the NMR relaxation, and how information about water distribution and pore structure are interpreted from NMR outcomes in unsaturated porous media.

Keywords: Nuclear magnetic resonance; porous media; water distribution; pore structure

How to cite: Zhou, J. and Zhang, C.: Pore Structure Affecting the NMR Relaxation in Unsaturated porous media , EGU General Assembly 2024, Vienna, Austria, 14–19 Apr 2024, EGU24-8903, https://doi.org/10.5194/egusphere-egu24-8903, 2024.

EGU24-9432 | ECS | Orals | HS8.2.13

Electrical conductivity estimation from a new fractal model for porous media under reactive processes 

Mariangeles Soldi, Flore Rembert, Luis Guarracino, and Damien Jougnot

Near-surface geo-electrical methods monitoring the electrical conductivity have gained particular interest for environmental studies. Their sensitivity to key properties of storage and transport in porous media and their non-destructive nature make these methods a significant asset for studying the subsurface. Nevertheless, their quantitative interpretation depends on the efficiency of the used petrophysical relationship to link the physical properties, obtained from the electrical measurements, with the hydrological properties and state variables of interest. Therefore, the electrical conductivity of a porous medium is related to several geological parameters such as mineral matrix, porosity, permeability, and degree of water saturation. All of these parameters are controlled by the pore structure which plays a key role in the distribution of the conductive fluid. During reactive processes, the pore structure is significantly affected which translates into surface and volume variations. This evolution of the pore space leads to changes in the macroscopic hydraulic properties and, therefore, the electrical conductivity. In this study, we present an analytical fractal model to describe the electrical conductivity evolution during reactive processes. Under the assumption that the pore system is represented by a bundle of tortuous capillaries with constrictivity, we account for the reactive processes in the model by considering the geometrical variations in the pore structure (i.e., the increase and decrease of the pores aperture). The derivation of the electrical conductivity is based on upscaling procedures and a fractal law which describes the size distribution of pores. Considering the electrical charges dragged by the water in one capillary, we upscale the electrical property and obtain closed-mathematical expressions to calculate the electrical conductivity of the medium. This can be achieved thanks to the independence from scales of fractal media. For partially saturated conditions of the medium, the model’s expressions can estimate the electrical conductivity as a function of hydraulic properties. The performance of the model has been tested with published data from different soil and rock textures, under reactive fluid flow or partial saturation conditions. The comparison shows that the model can satisfactorily reproduce the behavior of the data. The fractal distribution is consistent with mico-CT results and the dissolution rate is within the same order of magnitude of the value obtained from experimental results. From a geometrical approach and within a fractal framework, we included the effect of reactive processes in the estimates of the medium electrical conductivity which opens up new possibilities to characterize media from geoelectrical techniques.

How to cite: Soldi, M., Rembert, F., Guarracino, L., and Jougnot, D.: Electrical conductivity estimation from a new fractal model for porous media under reactive processes, EGU General Assembly 2024, Vienna, Austria, 14–19 Apr 2024, EGU24-9432, https://doi.org/10.5194/egusphere-egu24-9432, 2024.

We pioneer microscale geoelectrical acquisition with advanced microfabrication technologies to investigate hydrogeological processes using microfluidics that couples direct visualization of the pore scale dynamics with the geoelectrical response. Geoelectrical monitoring gives information at various scales (µm to m) about dynamic and reactive processes involving multiphase flow, solute transport, and mineral dissolution/precipitation, which rely on microscopic interactions. Yet, the field scale geophysical survey interpretation is challenging due to the superposition of the couplings and the heterogeneity of the natural environment. We focus on developing electrical conductivity monitoring with the spectral induced polarization (SIP) method. The interpretation of the SIP signal is based on developing petrophysical models that relate the complex electrical conductivity to structural, hydrodynamical, and geochemical properties. State-of-the-art petrophysical models, however, suffer from a limited range of validity and presume many microscopic mechanisms to define macroscale parameters. Thus, direct observations of the underlying processes coupled with geoelectrical monitoring are keys to deconvolute the signature of the bio-chemo-physical mechanisms at play and for using reliable models. Microfluidic experiments enable direct visualization of flows, reactions, and transport at the pore scale thanks to transparent micromodels coupled with high-resolution imaging techniques. Micromodels are a two-dimensional representation of the porous medium, ranging in complexity from single channels to replicas of natural rocks. Cutting-edge micromodels use reactive minerals to investigate the water-mineral interactions. Here, we investigate calcite dissolution, a key multiphase process involved, e.g., in karstification. Our micromodel is a channel containing a calcite grain in the middle. Thin gold electrodes are deposited on the bottom surface of the channel for SIP monitoring. We highlight the strong correlation between SIP response and dissolution through electrical signal examination and image analysis. In particular, degassed CO2 bubbles generated by dissolution play a critical role in the acid trajectory, the evolving calcite shape, and the decreasing real part of the complex conductivity. Then, we perform image processing to retrieve petrophysical parameters such as porosity and water saturation. These parameters are used as inputs to model the complex electrical conductivity with petrophysical modeling based on the concept of equivalent circuits representing bulk and surface conductivities. We show that the petrophysical model can be applied to pore scale geoelectrical monitoring and is consistent with optical observations. We show that the time variations are linked to partially saturated conditions, pore water composition, and evolving mineral surface state. These results demonstrate that the proposed technological advancement provides a breakthrough in understanding the subsurface processes through SIP monitoring.

How to cite: Rembert, F., Leroy, P., and Roman, S.: Microfluidic investigation of calcite dissolution with spectral induced polarization. Direct observation and petrophysical modeling., EGU General Assembly 2024, Vienna, Austria, 14–19 Apr 2024, EGU24-11251, https://doi.org/10.5194/egusphere-egu24-11251, 2024.

EGU24-12001 | ECS | Orals | HS8.2.13

Bayesian sensitivity analysis of seismic data to van Genuchten parameters in unsaturated and unconsolidated soils 

Ramon Sanchez Gonzalez, Ludovic Bodet, Alexandrine Gesret, and Agnès Rivière

Increasing anthropogenic and climate pressures on water resources and thermal energy call for a better understanding of the transient water storage and the water fluxes within the Critical Zone (CZ). Recharge, as the main water inflow feeding groundwater (GW), is critical for the proper management of GW systems. GW recharge is defined as the water percolating from the last unsaturated horizon down to the water table and is therefore broadly inaccessible to direct observations. Recharge is spatially heterogeneous and controlled by multiple factors such as porous media properties and hydrogeological conditions. Hydrogeophysics provide valuable approaches to determining hydraulic parameters in unconsolidated and unsaturated soils. In this domain, electromagnetic and electrical methods predominate due to their obvious dependence on water content. While crucial for water-related assessments, the transition to mechanical properties emphasizes the complementary role of seismic techniques. Specifically, seismic refraction tomography and surface-wave dispersion analysis stand out in delimiting boundaries between saturated and unsaturated zones. Recent studies underscore the synergy of employing both 2D electrical and seismic methods, showcasing their collective efficacy in identifying hydrofacieses and delineating the water table. However, these techniques fall short of providing a detailed saturation profile in the unsaturated zone. Recent studies suggest to employ the Van Genuchten model, coupled with a rock physics model that incorporates capillary suction effects, to determine the mechanical properties of the soil, accounting for both depth and saturation dependencies. This method enables the analytical 1D modeling of both P- and S-wave velocities in various hydrofacieses with various water table depths (in static conditions). Then by utilizing these velocity models, it is possible to calculate synthetic P-wave travel times (P-TT) and surface-wave dispersion (SWD) from an artificial seismic setup. This constitute a forward problem from saturation versus depth models towards seismic data. In this study, we propose to do the inverse problem, e.g. estimating the VG parameters (VG) from P-TT and SWD. We use the database provided by Carsell and Parrish to compute synthetic observations in wide a priori ranges. We propose the employment of a straightforward grid search and formulate the results in a Bayesian framework. Our results indicate that both SWD and P-TT are responsive to changes in water saturation, allowing for the retrieval of the VG parameters from observed data. Moreover, our study highlights that the sensitivity of geophysical data varies with soil composition, particularly underscoring the complexities of estimating VG parameters in soils with a high sand content.

How to cite: Sanchez Gonzalez, R., Bodet, L., Gesret, A., and Rivière, A.: Bayesian sensitivity analysis of seismic data to van Genuchten parameters in unsaturated and unconsolidated soils, EGU General Assembly 2024, Vienna, Austria, 14–19 Apr 2024, EGU24-12001, https://doi.org/10.5194/egusphere-egu24-12001, 2024.

EGU24-12830 | ECS | Posters on site | HS8.2.13

Designing and optimizing an Electrical Resistivity Tomography (ERT) time lapse acquisition for mapping hedgerow impacts on water transfers 

Hanifa Bader, Jean Marçais, Nadia Carluer, Laurent Lassabatere, Fanny Courapied, Arnold Imig, and Rémi Clément

Hedgerows have an a priori beneficial influence on hillslope hydrology in the context of climate change. Thanks to their root network, they enhance the infiltration of rainwater or upcoming runoff (Wallace et al., 2021). However, the fate of the water that infiltrates under the hedgerows has not been quantified: evapotranspiration, runoff, groundwater recharge, subsurface runoff to the watercourse. This is a crucial question to better understand the role of hedgerows in hillslope hydrology and the fate of associated contaminants. In this context, we plan to deploy a hydrogeophysical study based on Electrical Resistivity Tomography (ERT) time lapse to investigate the infiltration processes beneath a hedgerow located on a long-term observatory catchment near Lyon, France (Lagouy et al., 2015). Time-lapse ERT has significantly developed in recent years to provide quantitative measurements of subsurface properties and relevant information on hydrological processes, particularly water infiltration into soils (Brunet et al., 2011). Yet geophysical experimental setups are often designed heuristically and seldom optimized a priori (i.e. without specific optimization procedure beforehand). In our case, considering that the development of Open Source resistivity meter such as Ohmpi (Clement et al., 2020) will make it possible to monitor hydrological processes intensively, the aim is to optimize our acquisition strategy to obtain a compromise between the best image and a minimal acquisition time.

In order to ensure that our experimental hydrogeophysical setup is « data worth » and optimized for our field applications, we adapted a classical numerical approach to generate data (referred to as numerical experiments) to size and design our experimental parametrization of an ERT acquisition. Therefore, we investigate the unit of electrode spacing in order to (i) achieve the desired optimal resolution beneath the hedgerow (to enhance the monitoring of hydrological flows), (ii) maintain a sufficient depth of investigation (to visualize water table fluctuations and to study the soil and root properties of the hedgerows), and (iii) select the most appropriate electrode configuration (Wenner, Dipole-dipole, Schlumberger) for the specific studied site. To validate this approach, we simulated resistivity anomalies similar to those expected in the field (as the result of soil heterogeneity or soil wetting due to rainfall events and preferential flows). These simulations were rendered by ERT after the inversion step and compared to the prescribed field of electrical resistivity. The objective was to determine if we could detect these types of resistivity heterogeneities and which resistivity gaps were detectable. Besides these considerations, several key questions arise regarding the time of experimental design. Specifically, we tested different sequencing strategies to optimize measurements and minimize acquisition time. Finally, field tests will be conducted to validate this « data worth » experiment and validate the gain in acquisition time while minimizing the loss in ERT image rendering.

References

Brunet et al., 2010, Journal of Hydrology, 10.1016/j.jhydrol.2009.10.032.

Clément et al. 2020, HardwareX, 10.1016/j.ohx.2020.e00122.

Lagouy et al., 2015, 10.17180/OBS.YZERON.

Wallace et al., 2021, Hydrological Processes, 10.1002/hyp.14098.


How to cite: Bader, H., Marçais, J., Carluer, N., Lassabatere, L., Courapied, F., Imig, A., and Clément, R.: Designing and optimizing an Electrical Resistivity Tomography (ERT) time lapse acquisition for mapping hedgerow impacts on water transfers, EGU General Assembly 2024, Vienna, Austria, 14–19 Apr 2024, EGU24-12830, https://doi.org/10.5194/egusphere-egu24-12830, 2024.

EGU24-16241 | ECS | Posters on site | HS8.2.13

Data fusion and classification of electromagnetic induction and remote sensing data for management zone delineation in sustainable agriculture  

Salar Saeed Dogar, Cosimo Brogi, Marco Donat, Harry Vereecken, and Johan Alexander Huisman

A precise and reliable characterization of intra-field heterogeneity of soil properties and water content is vital in precision agriculture as these significantly impact crop growth and yield. Non-invasive hydrogeophysical methods such as electromagnetic induction (EMI) can be used to delineate intra-field agricultural management zones that represent areas where field characteristics tend to be homogeneous and have similar impact on crops. The combination with additional data sources, for example, remote sensing or yield maps, has the potential to improve the quality of the management zones. However, extracting subsurface information from multiple datasets and for large agricultural fields poses several challenges in data harmonization and analysis. The selection of optimal dataset combinations and the influence of different data products on the creation of management zones have also not been sufficiently investigated. In this study, we present an approach to produce intra-field management zones that combines a) electromagnetic induction (EMI) measurements performed with a CMD Mini-Explorer and a CMD Mini-Explorer Special-Edition (with 3 and 6 coil separation, respectively) and b) normalized difference vegetation index (NDVI) from PlanetScope satellite imagery. The method was tested on a 70-ha field of the PatchCrop experiment in Tempelberg, Brandenburg (Germany). This field is challenging to investigate as it contains 30 small patches of 0.5 ha (72 x 72m) that are managed separately. EMI measurements were collected in three different campaigns in 2022 and 2023 depending on the availability of these small patches. The EMI data were automatically filtered, temperature corrected, and interpolated onto a 1x1 meter resolution grid. Furthermore, EMI measurements were normalized by testing different methodologies (min-max, log, and z-transformation) to reduce the influence of measuring in different periods. Satellite NDVI maps with 3 m resolution for selected years within the period 2019-2023 were obtained from PlanetScope and provided information on crop development over the growing season. For validation, yield maps with 10 m resolution for the period 2011-2019 were available. Both the EMI and the NDVI maps revealed the presence of sub-surface heterogeneities that clearly impact plant productivity, but their patterns did not fully match. To delineate agricultural management zones, ISODATA and K-means clustering algorithms were employed by using a) EMI data, b) NDVI maps, and c) a combination of these datasets. Silhouette and elbow methods were used to identify the optimal number of clusters. The adequacy of the resulting management zones was assessed by comparing them to the available yield maps. The results revealed that a combination of EMI and NDVI datasets could often improve the spatial representation of yield patterns, which confirms the relevance of this method for precision agriculture. Nonetheless, further research is needed to assess the relevance of each dataset and to evaluate the applicability in different regions and contexts.

How to cite: Dogar, S. S., Brogi, C., Donat, M., Vereecken, H., and Huisman, J. A.: Data fusion and classification of electromagnetic induction and remote sensing data for management zone delineation in sustainable agriculture , EGU General Assembly 2024, Vienna, Austria, 14–19 Apr 2024, EGU24-16241, https://doi.org/10.5194/egusphere-egu24-16241, 2024.

EGU24-17325 | ECS | Orals | HS8.2.13

Tracking shallow groundwater response to a pumping test using a dense passive seismic array  

Cécile Baudement, Antoine Guillemot, Eric Larose, Stéphane Garambois, Alexandra Royer, Etienne Rey, and Vincent Cappoen

Facing the societal issues related to water resources management, the development of ambient noise-based seismology for monitoring fluids in the subsurface is promising but still challenging (1). In this study, we propose a seismological monitoring of shallow groundwater with high spatial resolution, by applying ambient noise interferometry techniques. On a glacio-alluvial plain containing a shallow aquifer near Grenoble (France), we installed a dense array of 50 seismic nodes settled during five days. A pumping test was performed in a borehole during the experiment, inducing a fast and heterogeneous response of the aquifer. We estimated relative changes in surface wave velocity (dV/V) from autocorrelations of ambient noise recorded by the 50 sensors. During the pumping phase, dV/V increases by more than 10% near the borehole, indicating a significant decrease in pore pressure. Mapping the seismological response to pumping suggests a high channelization of the hydrogeological paths. Poroelastic modeling combined with active seismic campaigns improves the interpretation of observations (2), paving the way to a high-resolution time-lapse 3D mapping of the water dome and potential fluxes.

References

1 - Gaubert‐Bastide, T., Garambois, S., Bordes, C., Voisin, C., Oxarango, L., Brito, D., & Roux, P. (2022). High‐resolution monitoring of controlled water table variations from dense seismic‐noise acquisitions. Water Resources Research58(8), e2021WR030680.

2 - Voisin, C., Garambois, S., Massey, C., & Brossier, R. (2016). Seismic noise monitoring of the water table in a deep-seated, slow-moving landslide. Interpretation4(3), SJ67-SJ76.

How to cite: Baudement, C., Guillemot, A., Larose, E., Garambois, S., Royer, A., Rey, E., and Cappoen, V.: Tracking shallow groundwater response to a pumping test using a dense passive seismic array , EGU General Assembly 2024, Vienna, Austria, 14–19 Apr 2024, EGU24-17325, https://doi.org/10.5194/egusphere-egu24-17325, 2024.

EGU24-17523 | Posters on site | HS8.2.13

Electrical resistance measurement strategies and their implementation in OhmPi 

Olivier Kaufmann, Arnaud Watlet, Guillaume Blanchy, Yannick Fargier, Hélène Guyard, and Rémi Clément

Various strategies can be envisaged to optimise the performance of an automatic resistivity meter when measuring electric resistances on a quadrupole. The objectives may be, for example, to maximise the signal-to-noise ratio of each measurement, to minimise the power delivered while ensuring that the voltage measured at the receiver reaches a fixed threshold, or to try to inject a given current independently of variations in the contact resistances. We describe how the variables controlled at the transmitter affect the signals received at the receiver as a function of the uncontrolled quantities during a soil resistivity measurement. We then propose some strategies for acquiring soil resistivity measurements based on these relationships, taking into account the physical characteristics and limitations of the transmitter and receiver. These strategies have been implemented in the software redesign included in version 2024 of OhmPi, an open-source resistivity meter.

How to cite: Kaufmann, O., Watlet, A., Blanchy, G., Fargier, Y., Guyard, H., and Clément, R.: Electrical resistance measurement strategies and their implementation in OhmPi, EGU General Assembly 2024, Vienna, Austria, 14–19 Apr 2024, EGU24-17523, https://doi.org/10.5194/egusphere-egu24-17523, 2024.

EGU24-19108 | ECS | Orals | HS8.2.13

Monitoring 3D soil moisture dynamics at a karst forest site with OhmPi, an open source resistivity meter 

Arnaud Watlet, Olivier Kaufmann, Anthony Mahieu, Arnold-Fred Imig, Hélène Guyard, Pascal Goderniaux, Nicolas Forquet, Yannick Fargier, Vivien Dubois, Guillaume Blanchy, and Rémi Clément

Karst aquifers are particularly vulnerable to changes in environmental factors such as climate change or pollutants. In the critical zone, the role of the superficial layer, the soil and the so-called epikarst, is crucial as it can delay water infiltration and host temporary perched water reservoirs, due to high contrasts in hydraulic conductivity with deeper layers. In an effort to better characterise the effect of the plant activity on the water content in the shallow subsurface, we have designed a time-lapse ERT experiment at the Rochefort Cave Observatory (Belgium). We present results from (at least) 6 months of daily 3D ERT measurements on 64 electrodes installed in a 40x60 cm grid covering a 6.0 x 1.8 m surface area centred on a young beech tree. The ERT dataset is supported by data from a vertical profile of soil moisture probes and in-cave water percolation gauges. Our study also includes an artificial drying and sprinkling experiment which main purposes are to replicate extreme weather events and investigate their effect on the soil moisture condition.

This experiment also serves as a testbed for using OhmPi as a monitoring tool in the field. OhmPi is an open-source, open-hardware resistivity meter, which runs on a Raspberry Pi. It is designed for enabling flexible data acquisition, and is primarily dedicated to the research community. Relying on low-cost components and devices, and using a low-power injection module (0-50V), OhmPi is particularly suited for small-scale field and laboratory experiments.

How to cite: Watlet, A., Kaufmann, O., Mahieu, A., Imig, A.-F., Guyard, H., Goderniaux, P., Forquet, N., Fargier, Y., Dubois, V., Blanchy, G., and Clément, R.: Monitoring 3D soil moisture dynamics at a karst forest site with OhmPi, an open source resistivity meter, EGU General Assembly 2024, Vienna, Austria, 14–19 Apr 2024, EGU24-19108, https://doi.org/10.5194/egusphere-egu24-19108, 2024.

Lake Sibaya is the largest groundwater-fed freshwater lake in South Africa. In the past several decades the lake levels have declined substantially, largely due to drought, human water demands, and the expansion of eucalyptus plantations. These falling lake levels have resulted in the formation of isolated basins, most notably a northern main basin and a southern secondary basin, where water levels behave independently. The southern basin plays an important water resource and ecological role in the area, consequently, there is a need to better understand the groundwater-surface water connectivity and hydrogeological structure.

The area is characterized by a complex depositional system comprising dune and fluvial-deltaic sediments which makes understanding the groundwater and surface water connectivity non-trivial. To better understand the subsurface structure land and waterborne transient electromagnetic (TEM) surveys were conducted using a towed TEM system. The TEM method utilizes a transmitter and a receiver coil to estimate the subsurface resistivity distribution to depths of 50 – 70 m. Firstly, a primary electromagnetic field is generated by passing an electric current around the transmitter coil. The primary electromagnetic field induces currents in the subsurface which then generate a secondary electromagnetic field. The receiver coil then detects the secondary electromagnetic field. The rate of decay of this secondary electromagnetic field can be used to model the subsurface resistivity distribution. The resistivity models can be used with local borehole data to constrain geological boundaries in the survey area.

The resistivity models derived from the surveys, combined with borehole data, revealed distinct geological layers comprising organic sediments, sands, silts, and calcareous sandstones. Furthermore, whereas the northern basin is connected to the deeper aquifer, the southern basin is not. This work highlights the ability of high-productivity TEM methods to gain a better understanding of complex hydrogeological systems and provide context for their management.

How to cite: McLachlan, P.: Assessing groundwater-surface water connectivity using land and waterborne transient electromagnetic surveys, EGU General Assembly 2024, Vienna, Austria, 14–19 Apr 2024, EGU24-20461, https://doi.org/10.5194/egusphere-egu24-20461, 2024.

EGU24-466 | ECS | Orals | HS8.2.14

Combination of Multiple Investigation Methods to Reveal the Recharge Area of a Karst Aquifer 

Suleyman Selim Calli, Mehmet Celik, and Zehra Semra Karakas

Karst aquifers are heterogeneous groundwater systems having both diffuse and concentrated recharge mechanisms. Since their complex recharge, storage, and discharge characteristics, the groundwater divide is generally different from the topographical catchment borders. As a result, karst hydrogeologists are using different methods to obtain more certain recharge areas. Tracer tests are very important and preferred tools to obtain the groundwater recharge areas. An ideal tracer must be detectable in very low concentrations, conservative along the pathways, and cost-effective. In this manner, mineralogical analysis of the suspended particles would be a very good alternative to the isotopic, biochemical, and dye tracers due to the easy collection and cost-efficient analysis methods. In the present study, we collected rock samples from approximately 10 locations surrounding the potential recharge area of the karst aquifer covering all lithological units surrounding the study area. Then, we collected sediment samples at the discharge outlet of the karst spring and suspended particles by filtering the water samples. We analyzed both the sediments and rock samples by the petrographic thin-sections, XRD whole rock, and XRD-clay fraction analysis to compare the minerals between the rock and sediment samples. We obtained Eocene-aged Planktonic Foraminiferal fossils in the spring sediments (in the thin sections), which perfectly fit the Eocene-aged limestone formation in the study area. By overlapping the lithological outcrop of the formation with the isotope-derived recharge elevation, we obtained the locations of two major dolines in the study area. As the final step, we validated our results by conducting dye-tracer tests from these points, and we recovered the tracer dye from the karst springs.

How to cite: Calli, S. S., Celik, M., and Karakas, Z. S.: Combination of Multiple Investigation Methods to Reveal the Recharge Area of a Karst Aquifer, EGU General Assembly 2024, Vienna, Austria, 14–19 Apr 2024, EGU24-466, https://doi.org/10.5194/egusphere-egu24-466, 2024.

EGU24-602 | ECS | Orals | HS8.2.14

Using contrasting tracers to characterize groundwater dynamics under a prolonged drought in the lowland catchments in the North German Plain 

Zhengtao Ying, Doerthe Tetzlaff, Jonas Freymueller, Jean-Christophe Comte, Tobias Goldhammer, Axel Schmidt, and Chris Soulsby

Groundwater, as the key strategic reserve in times of drought, is sensitive to climate change, especially unconfined, shallow aquifers. Frequent and prolonged drought provides an urgent impetus to improve understanding of groundwater dynamics and its residence times in drought-sensitive areas where water and food security are threatened. The Demnitzer Mill Creek catchment is a long-term environmental observatory typical lowland of North German Plain where streams are dominated by groundwater, however its groundwater recharge and dynamics remain poorly constrained. We applied water table observations, isotopic (δ18O, δ2H, 3H), hydrogeochemical, and geophysical investigations to characterize the spatial and temporal patterns of groundwater recharge in a shallow, unconfined aquifer system. Long-term groundwater levels showed a declining trend since 2011, which accelerated after 2018 resulting in increasingly intermittent seasonal streamflow. Geophysical surveys and groundwater monitoring indicated that shallow water tables (typically <3 m deep) in low to moderate permeability surficial deposits are generally recharged during winter, leading to higher groundwater – surface water connectivity in riparian alluvial aquifers, which is the first order control on streamflow generation. This was supported by similar geochemical characteristics of groundwater and streamflow. Water stable isotopes indicated a high damping in groundwater with a bias towards winter precipitation and direct recharge. Although 3H dating showed that the age of shallow groundwater was young (~5 years) and generally similar to streamflow, estimates had high uncertainty and some deeper groundwater was free of 3H. Such multiple approaches help understand changes in groundwater recharge and dynamics during droughts and contribute to the development of sustainable land and water management strategies for groundwater systems that are sensitive to climate change.

How to cite: Ying, Z., Tetzlaff, D., Freymueller, J., Comte, J.-C., Goldhammer, T., Schmidt, A., and Soulsby, C.: Using contrasting tracers to characterize groundwater dynamics under a prolonged drought in the lowland catchments in the North German Plain, EGU General Assembly 2024, Vienna, Austria, 14–19 Apr 2024, EGU24-602, https://doi.org/10.5194/egusphere-egu24-602, 2024.

EGU24-1565 | ECS | Posters on site | HS8.2.14

Advancing in the estimation of effective recharge and its propagation in karst aquifers by combining soil moisture observations and the natural responses of springs. An example from Southern Spain. 

Alejandro Carrasco Martín, Matías Mudarra Martínez, Beatriz De la Torre Martínez, Andreas Hartmann, and Bartolomé Andreo Navarro

Improving our comprehension of infiltration processes in karst systems is crucial for a better adaptation to the global change regarding water resources availability and management. In this work, the effective recharge under different meteorological conditions and its transfer along the vertically distributed compartments of a geologically complex karst aquifer in southern Spain have been evaluated. Continuous records of soil moisture and temperature values (at 5 and 10 cm depth and the soil-rock transition -average depth of 28 cm-) have been combined with hourly hydrodynamic and hydrothermal responses recorded at two springs with a marked influence of the unsaturated zone (UZ) and the saturated zone (SZ), respectively.

Most rainfalls generate soil moisture signal in the shallowest probes. However, a mean increase of soil water content of 10.5% in summer (from background values of 2.5%) and 6.1% in autumn-winter (from 9.6%) at the soil-rock interface were needed to produce hydrodynamic responses in the system: first in the spring related to the UZ, with a time delay of 4-9 hours after moisture peaks, and then (14-18 hours) in the spring draining the SZ, but only during autumn-winter recharge events. In addition, recharge caused decreases (up to 0.9°C) in the temperature of the water drained by the first spring, while lagged rises (up to 0.6°C) occurred in the second outlet.

Transmission of the input signal would be favoured by stronger karstification, but the presence of inter-bedded detrital formations in the lithological sequence of the aquifer (partially confined in the SE border) filter and buffer groundwater flows before being drained by the spring related to the SZ. These findings will help to assess thresholds for effective infiltration and to predict groundwater recharge in karst aquifers under different climate change scenarios.

How to cite: Carrasco Martín, A., Mudarra Martínez, M., De la Torre Martínez, B., Hartmann, A., and Andreo Navarro, B.: Advancing in the estimation of effective recharge and its propagation in karst aquifers by combining soil moisture observations and the natural responses of springs. An example from Southern Spain., EGU General Assembly 2024, Vienna, Austria, 14–19 Apr 2024, EGU24-1565, https://doi.org/10.5194/egusphere-egu24-1565, 2024.

In the epikarst zone of carbonate areas, numerous fractures have different sizes, shapes, and filling materials. Determining the fractures' horizontal hydraulic conductivity (Kh) simply using slug tests is challenging due to variable flow states (e.g., steady and unsteady). In this study, we characterized fracture features of apertures and soil fillings in terms of 260 fractures of 25 borehole logs at five sites in a karst area of southwest China. The Bouwer and Rice (B & R) solution and a numerical model were used to determine Kh based on the best fitting of observed water head in 105 slug tests. The results comparatively show that Kh from the B & R solution is significantly underestimated. For numerical modeling, the non-linear flow expressed by the Dupuit and Forchheimer equation can improve the water head fitting when the Reynolds number (Re) > 17.27. The optimized Kh ranges 0.014 – 2673 m/d. The mean value of Kh is about 100 times the median value, suggesting that epikarst flow might be controlled by a limited number of larger fractures. Expectedly, Kh exponentially increases with d, but three is a turning point for the fracture aperture d around 10 mm, Kh abruptly decreases due to soil filling. The hydraulic permeability in the naturally full-filling fractures resembles the soil matrix. In contrast, the partial-filling fractures can create preferential pathway with a high Kh around the soil-rock interfaces, allowing preferential flow in fractures. These results fundamentally improve our understanding of water infiltration, retention, and availability for plant uses. 

How to cite: Liu, X.: Estimating fracture characteristics and hydraulic conductivity from slug tests in epikarst of southwest China, EGU General Assembly 2024, Vienna, Austria, 14–19 Apr 2024, EGU24-2436, https://doi.org/10.5194/egusphere-egu24-2436, 2024.

EGU24-2828 | ECS | Orals | HS8.2.14

An ancient river disappears in a Mediterranean karst land: the old history of Cana River (Apulia, Southern Italy)  

Vito Cofano, Umberto Samuele D'Ettorre, Isabella Serena Liso, Domenico Capolongo, and Mario Parise

Apulia is one of the most interesting karst lands in the Mediterranean area, hosting a variety of distinctive surficial and underground landforms. Among these, polje, a wide and flat depression of tectono-karstic origin, represents one of the most typical epigean landforms in karst. The “Canale di Pirro” polje, located in the central part of Apulia (SE Italy), is the largest in the region (Pisano et al., 2020), bounded on both sides by tectonically-controlled ridges, with an overall length of some 12km and a remarkable underground system of caves, among which there is the deepest of Apulia, where the water table is reached at -264 m from the ground (Parise & Benedetto, 2018). As a karst land, within the polje the water rapidly infiltrates into the ground, making difficult its accumulation at the surface, with the exception of the period of heavy rainfall, when wide sectors of Canale di Pirro become temporary lakes which require several hours to days to be absorbed underground. In ancient documents and maps, with particular regard to historical cartography, the Canale di Pirro polje was drawn as being crossed by a long river, nowadays missing, called Cana (from this river, it seems that the same toponym of the polje took its name). The first written testimonies concern in particular a parchment dating back from the twelfth century; the more recent document we found, still showing the presence of the river, instead, is an ancient map of the nineteenth century. Considering the time span in which Cana River is still represented in historical writings and maps, it is possible to identify its existence between 1195 and 1840, and to hypothesize a presumed coincidance with the Little Ice Age, a climate interval characterized by a long cooling period, especially in the northern hemisphere. In this work, we present a series of historical documents about the existence of the Cana River, collected through literature research, in order to evaluate all the possible causes that led to the river disappearance over the centuries.

References

Parise M. & Benedetto L. (2018). Surface landforms and speleological investigation for a better understanding of karst hydrogeological processes: a history of research in southeastern Italy. In: Parise M., Gabrovsek F., Kaufmann G. & Ravbar N. (Eds.), Advances in Karst Research: Theory, Fieldwork and Applications. Geological Society, London, Special Publications, 466, p. 137-153, https://doi.org/10.1144/SP466.25.

Pisano, L., Zumpano, V., Liso, I. S., & Parise, M. (2020). Geomorphological and structural characterization of the ‘Canale di Pirro’ polje, Apulia (Southern Italy). Journal of Maps16(2), 479-487, https://doi.org/10.1080/17445647.2020.1778550.

How to cite: Cofano, V., D'Ettorre, U. S., Liso, I. S., Capolongo, D., and Parise, M.: An ancient river disappears in a Mediterranean karst land: the old history of Cana River (Apulia, Southern Italy) , EGU General Assembly 2024, Vienna, Austria, 14–19 Apr 2024, EGU24-2828, https://doi.org/10.5194/egusphere-egu24-2828, 2024.

EGU24-3029 | ECS | Orals | HS8.2.14

Application of anomalous transport modeling for karst aquifer discharge response to rainfall 

Dan Elhanati, Simon Frank, Nadine Goeppert, and Brian Berkowitz

Discharge in many karst aquifers exhibits distinctive long tails during recession that follow recharge events, a phenomenon often associated with the intricate flow paths that develop due to the underground structure of karst systems. This complexity poses a unique task from the perspective of modeling the flow and discharge patterns. In this study, we propose a novel approach to address long tail discharge during base-flow conditions, by adapting the continuous time random walk (CTRW) framework, known as a robust tool for modeling the long-tailed behavior observed in breakthrough curves of chemical species during transport, under diverse flow conditions. By establishing a theoretical analogy between partially saturated karst flow and chemical transport, we develop and implement a particle tracking (CTRW-PT) model that provides robust fits of three years of data from the Disnergschroef high alpine study site in the Austrian Alps, underscoring the predominance of slow diffusive flow over the rapid conduit flow. The agreement between measured and simulated data not only validates the proposed analogy between partially saturated karst flow and chemical transport but also highlights the utility of the CTRW-PT model, offering valuable insights and enhanced modeling capabilities for future research in this complex field.

How to cite: Elhanati, D., Frank, S., Goeppert, N., and Berkowitz, B.: Application of anomalous transport modeling for karst aquifer discharge response to rainfall, EGU General Assembly 2024, Vienna, Austria, 14–19 Apr 2024, EGU24-3029, https://doi.org/10.5194/egusphere-egu24-3029, 2024.

EGU24-3143 | ECS | Posters on site | HS8.2.14

Geomorphological and hydrogeological features of submerged coastal sinkholes in the Apulian karst 

Michele Onorato, Raffaele Onorato, Isabella Serena Liso, Sergio Orsini, Pino Palmisano, Mario Parise, and Luca Zini

Low coastal karst is often characterized by widespread presence of sinkholes flooded by mixing of fresh and salt water. Such a mixture creates peculiar environments and ecosystems, at the same time predisposing the areas to possible hazards, in the form of formation of new sinkholes, or enlargement and coalescence of the existing ones through failures at their rims. This is definitely the situation for the south-western coast of Salento (Apulia, southern Italy), where the local karst setting is dominated at the surface by presence of flooded sinkholes, and by bays and inlets of circular shape along the coast. These latter are typically the result of coalescing processes of original individual sinkholes, which outer rim is eventually broken by the action of sea waves. Such a situation characterizes actually many other sites in the region, not only limited to the Ionian side but also involving the Adriatic coastine of Apulia, to the east (Liso & Parise, 2023).

In the coastal stretch extending from Torre Castiglione to Palude del Capitano, we have started a variety of activities, with further more on the way: among these, mapping of the sinkholes and interpretation of their mechanisms of formation, both along the coast and inland; identification of the main structural lineations, and of the likely control they exert on sinkhole development and evolution; monitoring of the physico-chemical parameters of the waters, with particular focus on those where upwelling of sulphureous waters has been observed; evaluation of the dissolution rate of carbonate rocks within the submerged areas; assessment of the sinkhole hazard, also in relation to the widespread presence of tourist sites, highly frequented during the summer season. Comprehension of the main flowpath of groundwater, from the inland areas toward the coast, is one of the main goals of our research, which is part of a wider project addressed also to evaluate the biological aspects in these peculiar, high biodiversity, ecosystems.


References


Liso I.S. & Parise M., 2023, Sinkhole development at the freshwater-saltwater interface in Apulia (southern Italy). In: Land L., Kromhout C. & Suter S. (Eds.), Proceedings of the 17th Multidisciplinary Conference on Sinkholes and the Engineering and Environmental Impacts of Karst, Tampa (Florida, USA), 27-31 March 2023, NCKRI Symposium no. 9, p. 229-238.

Parise M., Palmisano P. & Onorato R., 2017, Contributo alla conoscenza dei fenomeni carsici di collasso in zone costiere del Salento Jonico (Puglia): la Spunnulata della Pajara. Thalassia Salentina, n. 39, p. 99-121. 

How to cite: Onorato, M., Onorato, R., Liso, I. S., Orsini, S., Palmisano, P., Parise, M., and Zini, L.: Geomorphological and hydrogeological features of submerged coastal sinkholes in the Apulian karst, EGU General Assembly 2024, Vienna, Austria, 14–19 Apr 2024, EGU24-3143, https://doi.org/10.5194/egusphere-egu24-3143, 2024.

EGU24-4793 | Orals | HS8.2.14

Changes in the residence time of a spring in a tectonic active zone of central Mexico 

Betsabe Atalia Sierra Garcia, Selene Olea-Olea, and Priscila Medina Ortega

The residence time of a spring located in central Mexico has been affected by seismic activity. The region is influenced by the interaction of five tectonic plates - Cocos, North American, Pacific, Rivera, and Caribbean - with convergent, divergent, and transform boundaries, leading to frequent earthquakes.

The spring, known as the name “Agua Hedionda”, has therapeutic properties due to sulfate concentrations exceeding 1 g/L that contributes significantly to the local economy. However, the earthquake of magnitude 7.1 in 2017 had a substantial impact, particularly on the flow quantity and sulfate concentrations, evidencing the vulnerability of the spring and, consequently, the community's economy.

To comprehend the vulnerability and changes in the spring, data of tracers (O-18, H-2, H-3, C-14), major ions and flow measurements were collected in 2022.Then, these data were compared with pre- and post-earthquake information.

Tracers facilitated the estimation of residence time for water reaching the spring, indicating a regional flow after the earthquake and an intermediate flow before and currently. The chemical and isotopic data suggest a mixing of flows.

Tectonic movements imply that the spring received water with a longer residence time compared to its original state. The combined analysis of these data in tectonically active areas offers valuable insights into changes in residence times, thereby understanding variations and the vulnerability of groundwater resources.

How to cite: Sierra Garcia, B. A., Olea-Olea, S., and Medina Ortega, P.: Changes in the residence time of a spring in a tectonic active zone of central Mexico, EGU General Assembly 2024, Vienna, Austria, 14–19 Apr 2024, EGU24-4793, https://doi.org/10.5194/egusphere-egu24-4793, 2024.

EGU24-5158 | ECS | Orals | HS8.2.14

Flux tracking of groundwater via integrated modelling for abstraction management 

Leyang Liu, Marco Bianchi, Christopher Jackson, and Ana Mijic

In systems where surface water and groundwater interact, management of the water resource often involves conflicting objectives between water supply and baseflow maintenance. Balancing such objectives requires understanding of the role of groundwater in integrated water systems to inform the design of an efficient strategy to minimise abstraction impacts. This study first develops a reduced-complexity, processed-based groundwater model within the water systems integration modelling framework (WSIMOD). This model is applied to the Lea catchment, UK, as a case study and evaluated against monitored groundwater level and river flow data. A flux tracking approach is developed to reveal the origins of both river baseflow at a critical assessment point and abstracted groundwater across the systems. The insights obtained are used to design two strategies for groundwater abstraction reduction. Results show that the model has good performance in simulating the groundwater and river flow dynamics. Three aquifer bodies that contribute the most to the river baseflow in the dry season at the assessment point are identified; contributions being 17%, 15%, and 5%. The spatial distribution of abstracted groundwater originating from these aquifer bodies is illustrated. Compared to the default equal-ratio reduction, the strategy prioritising abstraction reduction in these three aquifer bodies increases a similar amount of baseflow (13%) by reducing much less abstraction (23%). The other strategy, which further decreases abstraction in the adjacent aquifer bodies, increases more baseflow (16%) with a similar abstraction reduction (30%). Both strategies can more efficiently improve the baseflow. The flux tracking approach can be further implemented to trace water from other origins, including runoff, stormwater, and wastewater, to enable coordinated management for better systems-level performance.

How to cite: Liu, L., Bianchi, M., Jackson, C., and Mijic, A.: Flux tracking of groundwater via integrated modelling for abstraction management, EGU General Assembly 2024, Vienna, Austria, 14–19 Apr 2024, EGU24-5158, https://doi.org/10.5194/egusphere-egu24-5158, 2024.

EGU24-6096 | Posters on site | HS8.2.14

Investigating the hydrological behaviour of a shallow karst aquifer flooding intermittently: the Pivka Karst Aquifer (Slovenia) 

Cyril Mayaud, Blaž Kogovšek, Metka Petrič, Nataša Ravbar, Matej Blatnik, and Franci Gabrovšek

The Pivka Karst Aquifer is a shallow karst aquifer located under the Upper Pivka Valley, about 40 km SW from Ljubljana (Slovenia). This aquifer is connected to the larger Javorniki Karst Aquifer that borders the Upper Pivka Valley on the NE. While the geometry of the conduit system in the Pivka Karst Aquifer is practically unknown, the geometry of the Javorniki Karst Aquifer is better characterized. Under low water conditions, water from the Pivka Karst Aquifer drains through the Javorniki Karst Aquifer towards the Unica and Malenščica Springs in the N, which are the terminal outlets of the region. Under high-water situations, the regional groundwater level rises up to 45 m, and the regional flow direction is modified. The Pivka Karst Aquifer receives water from the Javorniki Karst Aquifer which provides in the meantime autogenic water to the Unica and Malenščica Springs. The rise of water level in the Pivka Karst Aquifer result in the appearance of 17 intermittent lakes in the Upper Pivka Valley. This work aims establishing a conceptual hydrological model of the Pivka Karst Aquifer to better understand its interaction with the Javorniki Karst Aquifer. To do so, a network of automatic stations recording water level, specific electrical conductivity and water temperature at a 30 min interval has been progressively established in the Upper Pivka Valley since 2020. The four years dataset were analysed with data collected in the water active caves of the Javorniki Karst Aquifer and at the Unica and Malenščica Springs. The interpretation of water level records suggest that the Javorniki Karst Aquifer is a large recharge contributor of the Pivka Karst Aquifer, which act as an overflow of the whole system. However, the southern and western parts of the Pivka Karst Aquifer are also recharged locally. Such finding is supported by the analysis of specific electric conductivity data, which suggests the existence of several preferential flow paths in the Pivka Karst Aquifer that activate during flooding.

How to cite: Mayaud, C., Kogovšek, B., Petrič, M., Ravbar, N., Blatnik, M., and Gabrovšek, F.: Investigating the hydrological behaviour of a shallow karst aquifer flooding intermittently: the Pivka Karst Aquifer (Slovenia), EGU General Assembly 2024, Vienna, Austria, 14–19 Apr 2024, EGU24-6096, https://doi.org/10.5194/egusphere-egu24-6096, 2024.

EGU24-6376 | ECS | Orals | HS8.2.14 | Highlight

Understanding groundwater chemistry and residence times of two thermal springs in east-central Mexico. 

Lorena Ramírez González, Oscar Escolero, Selene Olea-Olea, and Priscila Medina-Ortega

Thermal springs are natural discharge points that can offer valuable information on groundwater circulation. The use of tracers to determine residence times can help us understand complex hydrogeochemical processes despite limited data availability.

The present work aims to determine groundwater chemistry composition of two thermal springs located in east-central Mexico as well as understand some of the processes that may impact residence time estimation.

Tritium and carbon-14 tracers indicated a significant component of pre-modern water. Major ions data collected showed both springs have concentrations of HCO3- greater than 1,000 mg/l and temperatures around 41 °C. Saturation indices showed water-rock interaction with geological formations present in the area, such as limestone sequence ‘El Doctor’, that could influence groundwater residence time. Isotope data (δ18O) was used to determine a recharge elevation ranging from 2900 to 3000 meters above sea level. Additionally, SiO2 geothermometers were also applied to quantify circulation depth and reservoir temperature.

Analysis of hydrochemical composition, residence times, and any other information obtained from tracers, such as tritium and C-14, allows us to gain a better understanding of how groundwater systems work, along with a more accurate interpretation of results.

How to cite: Ramírez González, L., Escolero, O., Olea-Olea, S., and Medina-Ortega, P.: Understanding groundwater chemistry and residence times of two thermal springs in east-central Mexico., EGU General Assembly 2024, Vienna, Austria, 14–19 Apr 2024, EGU24-6376, https://doi.org/10.5194/egusphere-egu24-6376, 2024.

EGU24-7450 | ECS | Posters on site | HS8.2.14

Spatial variability of lacustrine groundwater discharge at basin scale 

Xiaoliang Sun, Yao Du, and Yiqun Gan

Lacustrine groundwater discharge (LGD) is a crucial component of water balance in lakes. However, research on the spatial variability of LGD on a large basin scale is scarce, and the factors controlling this variability are not well understood. In this study, we examined various lakes located throughout the CYRB using multiple tracers and field surveys to determine the occurrence of LGD. We employed a 222Rn mass balance model to determine LGD rates in various lakes within the central Yangtze River basin (CYRB). Additionally, we identified the factors controlling the spatial variability of the LGD rates using correlation analysis and a multiple linear regression model. Our findings revealed that while the 222Rn concentration in groundwater (6082.27 ± 3860.16 Bq/m3) was within the global average, the concentration in lake water (306.97 ± 239.45 Bq/m3) was relatively high, indicating a stronger LGD in the CYRB. The stable isotopes, 222Rn concentration, and the groundwater seepage and springs, collectively confirm the occurrence of LGD. The LGD rates in lakes within the CYRB area exhibited significant spatial variability, ranging from 13.76 to 83.96 mm/d, with larger LGD rates found at the interior of the basin than at the edges. Hydrological connectivity, location within basin, and lake water depth collectively control the LGD rate, with each contributing 53.95%, 22.90%, and 23.16%, respectively. This study not only enriches our understanding of LGD, serving as a reference for global research on LGD, but also provides theoretical guidance for local water resource management.

How to cite: Sun, X., Du, Y., and Gan, Y.: Spatial variability of lacustrine groundwater discharge at basin scale, EGU General Assembly 2024, Vienna, Austria, 14–19 Apr 2024, EGU24-7450, https://doi.org/10.5194/egusphere-egu24-7450, 2024.

Bedding plane partitions are an important geological medium to guide cave passages during the early stages of karstification in limestone formations. However, how stress load affects karst genesis processes along the large rough fractures remains poorly understood. Here, we develop a novel coupled hydro-mechanical-chemical (HMC) model to improve the understanding of this complicated process. This model considers a two-way mechanical-chemical coupling where dissolution perturbs the contact-stress distribution, in return impacting the fracture dissolutional enlargement. A non-linear correlation between the local fracture stiffness and contact stress is further incorporated. We study a two-dimensional horizontal fracture surface embedded in a three-dimensional rock block subjected to vertical stress loading. Simulation results show that dissolution causes local stress reduction (mechanical weakening), simultaneously accompanied by stress concentration at its fringe. The competition between dissolution-induced aperture enlargement and compaction-induced closure significantly retards the dissolution evolution. Without mechanical effect, linear dissolution fingering exhibits. As the applied stress increases, the secondary karstic conduits become more pronounced and a ramiform dissolution fingering featuring branching and winding is induced. Our results also provide important implications for understanding other engineering applications such as geothermal development and carbonate acidification.

How to cite: Jiang, C., Wang, X., and Jourde, H.: Stress-induced ramiform karstic conduits along a bedding plane: insights from a coupled hydro-mechanical-chemical (HMC) model, EGU General Assembly 2024, Vienna, Austria, 14–19 Apr 2024, EGU24-9657, https://doi.org/10.5194/egusphere-egu24-9657, 2024.

EGU24-9697 | ECS | Orals | HS8.2.14

Optimizing Water Storage in a Mediterranean Karst Aquifer: A Comprehensive Vadose and Phreatic Modeling Approach 

Lysander Bresinsky, Jannes Kordilla, Yakov Livshitz, and Martin Sauter

This study focuses on the role of karst aquifers in the Mediterranean Basin as a buffered storage of freshwater, especially considering the anticipated increase in drought periods due to climate change. Climate change underscores the need for innovative groundwater management approaches to maximize the storage capacity of these aquifers. This study emphasizes the importance of enhancing aquifer recharge during normal or high rainfall to mitigate the impacts of droughts. Notably, many karst aquifers in this region, which developed extensively during the lower base levels of the Messinian Salinity Crisis, exhibit a dual-domain flow pattern. This pattern consists of a slower flow through the rock matrix and a faster flow through conduits. Despite the rapid drainage of these mature karst systems, some, particularly those in the Mediterranean, are limited in their outflow to the sea by marine clay deposits, as highlighted by Bakalowicz (2015, Environmental Earth Sciences). These systems have shown a significant capacity for storage over several years.

In our study, we applied dual-permeability flow modeling to evaluate the storage potential of the Western Mountain Aquifer in Israel and the West Bank. The model utilizes the volume-averaged Richards' equation and integrates a term to account for the characteristic preferential infiltration in karst aquifers, even under nearly dry conditions. The model includes phreatic and vadose zone flows to comprehensively assess the storage capacities of the aquifer comprehensively. The results indicate that despite its advanced karst development, the Western Mountain Aquifer possesses a notable long-term storage capability. This is attributed to its extensive vadose zone and the restricted outflow, which is constrained by surrounding and overlying low-permeability formations (such as the Talme-Yafe, Negba, Daliya, and Menuha Formations, composed mainly of chalk and marl). The study explores various infiltration sites for managed aquifer recharge and considers current and future climatic conditions based on the RCP4.5 climate change scenario.

How to cite: Bresinsky, L., Kordilla, J., Livshitz, Y., and Sauter, M.: Optimizing Water Storage in a Mediterranean Karst Aquifer: A Comprehensive Vadose and Phreatic Modeling Approach, EGU General Assembly 2024, Vienna, Austria, 14–19 Apr 2024, EGU24-9697, https://doi.org/10.5194/egusphere-egu24-9697, 2024.

EGU24-11063 | ECS | Orals | HS8.2.14

Understanding the impacts of human wastewater effluent pollution on karst springs using chemical contamination fingerprinting techniques 

Luka Vucinic, David O'Connell, Donata Dubber, Patrice Behan, Quentin Crowley, Catherine Coxon, and Laurence Gill

Groundwater from karst aquifers is a major source of drinking water worldwide. These complex aquifer systems are exceptionally vulnerable to pollution and may be impacted by multiple contamination sources. Consequently, water contaminated with pollutants, such as microbial and chemical, from different sources can reach water sources used for human supplies (i.e. karst springs, boreholes, and wells that are being used for domestic purposes and/or irrigation).

In rural and suburban areas, human wastewater effluent (from on-site domestic wastewater treatment systems - DWTSs) and agricultural sources are generally considered among the most significant threats to groundwater quality. This is particularly of concern in Ireland given that more than one third of the population (>500,000 homes) use DWTSs. However, significant knowledge gaps exist with respect to linking contaminants with the origins of pollution and quantifying different pollution impacts on groundwater quality in karst environments.

The domestic wastewater is primarily discharged from toilets, washing machines, showers, and dishwashers, therefore, a wide range of contaminants (including source-specific contaminants) eventually reach the environment even after on-site wastewater treatment processes. We evaluated a range of chemical contamination fingerprinting techniques in terms of their ability to determine human wastewater pollution impacts on karst aquifers. Springs provide appropriate natural locations for monitoring pollutant concentrations in karst aquifer systems as they provide an integrated picture of contaminant transport through a karst conduit network, compared to wells and boreholes which are not necessarily directly connected to the most transmissive parts of the aquifer. Hence, nine separate karst springs in the West of Ireland (of varying catchment sizes) were studied and monitored over a 14-month period.

The results demonstrate how fluorescent whitening compounds (FWCs; well-known indicators of human contamination since their origin is mostly from laundry detergents), microplastic particles, and faecal sterols and stanols can be used together to cover different detectability chances, and provide useful information about DWTSs pollution impacts on karst springs. This study also provides an important benchmark for microplastic contamination in low-lying karst aquifer systems. Furthermore, a link between changes in FWCs signals and microplastic concentration changes in karst groundwater has been found, which indicates that the majority of microplastic particles originated from human wastewater sources. Unsurprisingly, the highest detection rates of FWCs and high concentrations of microplastic particles were found in karst catchments with very high densities of DWTSs and high percentages of DWTSs in the catchment that are within 200 m of at least one karst feature (such as swallow hole), indicating a direct pathway into the underlying aquifer. Moreover, the results suggest that while total sterol content in collected groundwater samples was generally low, faecal sterols and stanols can still be used as chemical faecal markers at karst springs.

How to cite: Vucinic, L., O'Connell, D., Dubber, D., Behan, P., Crowley, Q., Coxon, C., and Gill, L.: Understanding the impacts of human wastewater effluent pollution on karst springs using chemical contamination fingerprinting techniques, EGU General Assembly 2024, Vienna, Austria, 14–19 Apr 2024, EGU24-11063, https://doi.org/10.5194/egusphere-egu24-11063, 2024.

EGU24-11841 | Posters on site | HS8.2.14

Karst geomorphology, hydrogeology and caves in the areas of the Prespa Lakes, at the Albania-Macedonia-Greece border 

Mario Parise, Viacheslav Andreychouk, Isabella Serena Liso, Antonio Trocino, and Romeo Eftimi

The lakes of Prespa and Ohrid represent a very important hydrogeological system shared between Albania, FYR of Macedonia and Greece, and are the largest tectonic lakes in Europe. Prespa Lake is about 150 m higher in elevation than Ohrid, and the twos are separated by high mountains (Mali Thate, 2,287 m, and Galičica Mt., 2,262 m a.s.l.), built up during the Pliocene-Quaternary tectonic events. These mountains mainly consist of Upper Triassic–Lower Jurassic limestones, with wide graben to the E (Prespa) and the W (Ohrid). Pliocene clays, sandstones, and conglomerates fill most of the lakes. In 2002, an artificial tracer experiment physically demonstrated the underground connection between them (Amataj et al., 2007).

In the past, periodical oscillations of the level at Prespa Lake were in the 1-3 m range. After middle 1980’s, a steady decrease of water level has been recorded, producing serious disturbance to its ecological balance. Shape of Lake Prespa is quite irregular: the narrow sandy isthmus Gladno Polje separates it into Macro and Micro Prespa. In the recent past, Micro Prespa was a gulf of Macro Prespa, but then, due to erosion and sedimentation processes, the isthmus has been formed and the lakes separated (Popovska & Bonacci, 2007).

In this contribution we illustrate the main karst geomorphological characters, also providing updated information on its hydrogeology. In Galičica Mt. the most important surface karst forms are the Petrinska Plateau, a 20 km2 feature developed at elevation of 1500 m a.s.l., and the Samari blind valley, about 7 km long, in the NE part at about 1300–1400 m a.s.l. At least 12 high elevation caves have been documented, the longest being Samoska Dupka with length of 279 m. Numerous small caves are also situated along the Prespa Lake coastline near the villages of Stenie and Gollomboc; the longest is Treni cave (315 m long) at the W point of MicroPrespa Lake (Trocino et al., 2010). The Zaver swallow hole is situated at the Prespa W border, near Mala Gorica, with an extensive karst cave just uphill. Other smaller swallow holes are near Gollomboc; about in the same area, several caves of limited size (up to some tens of meters) are present, too. All these elements are important to describe the Prespa Lakes area as a sector of potential interest for further karstological studies, addressed to a better comprehension of the karst phases that interested this trans-boundary sector.


References

Amataj S. et al., 2007, Tracer methods used to verify the hypothesis of Cvijic about the underground connection between Prespa and Ohrid lake. Environ. Geol. 51 (5), 749-753.

Eftimi R., Stevanovic Z. & Stojov V., 2021, Hydrogeology of Mali Thate–Galičica karst massif related to the catastrophic decrease of the level of Lake Prespa. Environ. Earth Sci. 80, 708.

Popovska & Bonacci O., 2007, Basic data on the hydrology of Lakes Ohrid and Prespa. Hydrol. Proc. 21, 658-664.

Trocino A., Parise M. & Rizzi A., 2010, Ricerche speleologiche in Albania: primi dati sulle cavità nei pressi del lago di Prespa. XII Reg. Meeting Speleology “Spelaion 07”, 246-259.

How to cite: Parise, M., Andreychouk, V., Liso, I. S., Trocino, A., and Eftimi, R.: Karst geomorphology, hydrogeology and caves in the areas of the Prespa Lakes, at the Albania-Macedonia-Greece border, EGU General Assembly 2024, Vienna, Austria, 14–19 Apr 2024, EGU24-11841, https://doi.org/10.5194/egusphere-egu24-11841, 2024.

EGU24-12200 | Orals | HS8.2.14

Data-driven approaches to infer transit time distributions from high-resolution tracer data 

Paolo Benettin, Quentin Duchemin, Maria Grazia Zanoni, Andrea Rinaldo, and James Kirchner

Catchment transit times are often inferred by assuming a transit time distribution (TTD) or a SAS function and calibrating their parameters against measured tracer data. In the presence of high-resolution tracer data, machine learning tools may offer a promising avenue for advancing TTD estimation by leveraging data-driven approaches, integrating diverse data sources, and improving accuracy, scalability, and adaptability. Here, we lump together ideas coming from Large Languages Models, survival analysis and sum of squares techniques to introduce a novel data-driven model for estimating TTDs. Our model is influenced by SAS-based approaches; however, unlike previous studies, we avoid imposing strong parametric assumptions on the SAS function. We showcase the performance of our model against a benchmark of eight virtual datasets that differ in precipitation amounts, seasonality and runoff flashiness. We find that machine learning methods may effectively predict solute concentration in streamflow yet struggle to accurately estimate the true TTDs. However, when the appropriate inductive bias is incorporated, numerous key aspects of TTDs, such as the young water fraction and the average TTDs, can be estimated robustly. We also identify settings where the estimation task is more challenging for our model. This analysis, based on reproducible virtual benchmarks, provides a first overview of machine learning capabilities in estimating TTDs and inspires future TTD model inter-comparisons.

How to cite: Benettin, P., Duchemin, Q., Zanoni, M. G., Rinaldo, A., and Kirchner, J.: Data-driven approaches to infer transit time distributions from high-resolution tracer data, EGU General Assembly 2024, Vienna, Austria, 14–19 Apr 2024, EGU24-12200, https://doi.org/10.5194/egusphere-egu24-12200, 2024.

EGU24-12814 | Posters on site | HS8.2.14

Helium-isotope data and groundwater ages of 700 shallow and deep groundwater sites in and around the Austrian Eastern Alps  

Martin Kralik, Heike Brielmann, Franko Humer, and Jürgen Sültenfuß

Groundwater ages provide valuable insights for water managers and users, helping them understand the timeframe required for water quality improvement measures to become effective and the timeframe in which groundwater bodies are renewed. To estimate groundwater ages in important shallow Austrian aquifers more than 700 tritium/helium-3 analyses and some tracer gas (CFC, SF6) investigations were conducted within the national groundwater monitoring and additional research projects. Noble gases 3He, He and 20Ne were measured at the Institute of Environmental Physics (IUP), University of Bremen, Germany and some at the Isotope Hydrology Section of the IAEA in Vienna, Austria. Groundwater ages vary across Austria and within groundwater bodies due to hydrogeological heterogeneities and depending on gradients of precipitation amounts and recharge rates. They range generally between 0 – 25 yrs. Tritium/helium-3 analyses are an essential tool for groundwater age estimation and the respective piston flow model ages of the shallow aquifers are mostly in the range of 0 – 15 years. However, the missing correlation with the sampling depth indicate partly an internal mixing in the observation wells due to large screen lengths.

The existent of elevated 4He-concentrations in aquifers with low background U and Th-content are good indicators of the admixture of old groundwater or just increased 4He-fluxes. The 4He concentrations range from air-equilibrium up to 1.6E-03 (cm3 STP /kg).  The 3He/4He- ratio decreases down to 8.0E-08. Preliminary studies of increased 4He-data with major tectonic fault zones indicate a positive correlation. Clear indications of the admixture of mantle helium were discovered at the end of Eastern Alps toward the western border of the Pannonian Basin.


[1]        Kralik, M., Humer, F., Fank, J., Harum, T., Klammler, D., Gooddy, D., Sültenfuß, J., Gerber, C., Purtschert, R. (2014): Using 18O/2H, 3H/3He, 85Kr and CFCs to determine mean residence times and water origin in the Grazer and Leibnitzer Feld groundwater bodies (Austria). Applied Geochemistry, 50 (2014), 150-163 http://dx.doi.org/10.1016/j.apgeochem.2014.04.001

[2]        Bundesministerium für Land- und Forstwirtschaft, Regionen und Wasserwirtschaft, Grundwasseralter 2009-2021, Wien (2022).

 (https://info.bml.gv.at/themen/wasser/wasserqualitaet/grundwasser/grundwasseralter2019-2021.html)

How to cite: Kralik, M., Brielmann, H., Humer, F., and Sültenfuß, J.: Helium-isotope data and groundwater ages of 700 shallow and deep groundwater sites in and around the Austrian Eastern Alps , EGU General Assembly 2024, Vienna, Austria, 14–19 Apr 2024, EGU24-12814, https://doi.org/10.5194/egusphere-egu24-12814, 2024.

EGU24-13483 | ECS | Posters on site | HS8.2.14

Groundwater travel time distribution in the subsurface of a high energy beach – a multi tracer approach 

Rena Meyer, Janek Greskowiak, Anja Reckhardt, Stephan Seibert, Jürgen Sültenfuß, and Gudrun Massmann

In beach aquifers two water bodies, relatively old terrestrial freshwater and young oceanic saltwater mix, biogeochemical reactions change the solute composition of the water and groundwater discharge modifies element net fluxes to the ocean. Residence times are baseline information for the biogeochemical interpretation and help to understand groundwater flow and transport regimes. In the present study we used environmental tracers, i.e. apparent tritium-helium (3H/He) ages, temperatures and silica (Si) concentrations to derive groundwater ages and travel times in the subsurface along a cross-shore transect at the high energy beach aquifer on Spiekeroog, a barrier island in North-Western Germany. Recent generic modelling studies suggested that in beach aquifers under high energy conditions, characterized by high waves and tidal amplitudes as well as seasonal storm floods, flow and transport patterns in space and time are highly variable. As a consequence, the typical salinity and age stratification is distorted as compared to the classical stable concept of water bodies in beach aquifers derived from more embayed sites. To advance the understanding of such highly dynamic systems we obtained two sets of apparent 3H/He ages one year apart at three permanently installed multilevel wells each filtered in four depths (6, 12, 18, 24 m bgs), located at the dune base, near the mean high water line and near the mean low water line respectively. At the same locations, data loggers continuously recorded groundwater temperatures and were used to calculate travel times. In addition, Si was measured in samples taken every six weeks over one year. The results show relatively young apparent 3H/He ages in all samples, ranging from weeks to approximately 18 years. The water was youngest in the shallow part and near the high water line and ages increased with depth and towards the low water line and dune base. Interestingly, 3H/He ages vary significantly at some locations in the two data sets. Temperature derived travel times, representing the young water component (from the North Sea), overall agree well with the mixed apparent 3H/He ages. Si accumulating with time shows a similar trend. In the next steps, the results will help to constrain site specific groundwater modelling and support the interpretation of geochemical data and underlying processes in order to finally better understand the functioning  of high energy beach systems.

How to cite: Meyer, R., Greskowiak, J., Reckhardt, A., Seibert, S., Sültenfuß, J., and Massmann, G.: Groundwater travel time distribution in the subsurface of a high energy beach – a multi tracer approach, EGU General Assembly 2024, Vienna, Austria, 14–19 Apr 2024, EGU24-13483, https://doi.org/10.5194/egusphere-egu24-13483, 2024.

Karst landscapes develop distinct surface landforms intricately connected to a more complex subsurface drainage system due to the highly soluble nature of its bedrock. Because of this, surface processes can more directly affect the groundwater system through conduits such as caves and sinkholes. Due to high hydraulic conductivity, aside from surface and groundwater, the soil produced from weathering and erosion of karst is also affected. Samcheok, found in southeastern Gangwon Province, is an example of an area that is underlain by limestone-bearing formations, allowing the formation of karst. In this study, the patterns in the hydrochemical characteristics of surface water and the land use of areas adjacent to the streams in Samcheok karst were explored through geospatial analyses. Additionally, recent land use change in the area was also investigated. Surface waters from four streams in Samcheok were analyzed: Osipcheon River, Yeosam Stream, Sohan Stream, and Gyogok River. Results show that hydrochemical parameters in northeast Samcheok karst are mostly varied and to an extent dependent on the stream where the samples were taken from more than the sampling distance from the coast. Usual patterns for pH and dissolved oxygen in terms of salinity were not observed. Concentrations of cations and anions mostly varied between the two sampling seasons (winter and spring for February and April 2020 samples, respectively) and were also varied in terms of linear correlation for concentration vs. distance to stream outlet graphs. High linear correlation was observed for spring samples from Gyogok River for the following ions: Ca2+ (R2 = 0.976), Mg2+ (R2 = 0.9321), SO42- (R2 = 0.879), and HCO3- (R2 = 0.955). More than 50% of the area adjacent to streams is classified as “other bare land”. Between 2019 and 2020, there was an increase in the total land area for coniferous forests and a decrease in mixed forest and undeveloped arable field. Research on geospatial patterns for hydrochemical parameters and land use change in environments susceptible to pollution such as karst areas are useful for land use planning and erosion studies. This research was funded by the Basic Science Research Program through the National Research Foundation of Korea funded by the Ministry of Education (Nos. 2019R1I1A2A01057002, and 2019R1A6A1A03033167) and the Korea Ministry of Environment as "The SS (Surface Soil conservation and management)” project (No. 2019002820004).

How to cite: Lumongsod, R. M. and Kim*, H.: Geospatial patterns in surface water parameters and recent land use change in the karst of Samcheok, South Korea, EGU General Assembly 2024, Vienna, Austria, 14–19 Apr 2024, EGU24-13787, https://doi.org/10.5194/egusphere-egu24-13787, 2024.

The study of hydrogeochemical processes in Karst Critical Zone (KCZ) is of great significance for scientific understanding of their internal evolutionary environment and structural characteristics. Karst groundwater is the main information carrier after water-rock interaction. Quantitative analysis of its hydrochemical characteristics and causes is an effective means to reveal the medium environment and hydrodynamic conditions of aquifer system in KCZ. In this paper, three typical karst aquifer systems in the KCZ of central Yunnan Plateau are taken as the research objects. Through field sampling and laboratory testing of karst springs exposed by different aquifer systems, mathematical statistics analysis, hydrochemical diagram, ion ratio coefficient and hydrogeochemical simulation are comprehensively used to deeply analyze the characteristics of hydrochemical components, genesis and aquifer medium of karst groundwater in each aquifer system, and the internal relationship and law between water cycle and hydrochemistry in the key belt are discussed. The results show that : (1)  HCO3 and Ca2+ are the highest and stable ion components in regional karst groundwater, and Mg2+ is the key factor to control the alienation of hydrochemical types in each aquifer system ; (2)  The rock weathering and mineral dissolution of carbonate rocks are the main causes of the chemical composition characteristics of karst water in each aquifer system, and the karst groundwater dissolution on the aquifer of Huaning aquifer system is still occurring. The alternation of cation adsorption and the weathering and dissolution of silicate rocks are the main sources of Na+ and K+ in regional karst groundwater. (3)  The development intensity of regional karst, the exposed condition of karst aquifer and the lithology and connectivity of aquifer medium jointly shape the groundwater chemical characteristics of different aquifer systems in the KCZ of central Yunnan Plateau.

How to cite: Xu, M. and Huang, J.: Hydrochemical characteristics and genesis analysis of typical aquifer system in Karst Critical Zone of central Yunnan Platea, EGU General Assembly 2024, Vienna, Austria, 14–19 Apr 2024, EGU24-14478, https://doi.org/10.5194/egusphere-egu24-14478, 2024.

The characteristics of groundwater flow and solute transport in karst aquifers differ considerably from those in intergranular and fissured aquifers. To understand how they function, appropriately adapted hydrogeological research techniques and analyses are required. In this study, a binary karst aquifer in the recharge area of the Malenščica and Unica springs, which covers an area of about 820 km2 in southwestern Slovenia, was selected as the study area. A monitoring network was set up to obtain data on precipitation and discharge at the two springs, two sinking streams and two water-active caves in their catchment over a period of two hydrological years. First, a classical approach of correlation and spectral analysis of these time series data was applied to determine and compare the flow characteristics and storage capacity of selected springs and their recharge areas. The allogenic and autogenic recharges were considered separately as input functions and the results of the analysis were compared. Although these widely used methods provided a good characterization of the studied karst system, the interpretation can be ambiguous due to the interference of the two input components. To avoid this problem, an innovative method of partial cross-correlation analysis was used, which has previously only been applied to separate the influence of different precipitation stations in karst. Here, its application was extended to the evaluation of the influence of allogenic recharge. By controlling the input parameters precipitation and discharge of one of the sinking streams, it was possible to determine the contribution of the other sinking stream to the observed spring. The differences in the recharge characteristics of the Unica and Malenščica springs were revealed, and the ability of this innovative approach to provide additional insights into the functioning of binary karst aquifers was confirmed.


Key words: karst aquifer, autogenic and allogenic recharge, time series analysis, partial cross-correlation, Slovenia.

How to cite: Kogovšek, B., Jemcov, I., and Petrič, M.: Distinguishing between different sources of recharge in a complex binary karst aquifer: a case study of the Unica springs (SW Slovenia), EGU General Assembly 2024, Vienna, Austria, 14–19 Apr 2024, EGU24-14951, https://doi.org/10.5194/egusphere-egu24-14951, 2024.

EGU24-15310 | ECS | Posters on site | HS8.2.14 | Highlight

Assessing tritium and persistent organic micropollutants as tracers for investigating surface and groundwater interaction in a large river system (Moselle River)  

Jessica Landgraf, Liza-Marie Beckers, Sabrina Quanz, Dirk Radny, and Axel Schmidt

Understanding the couplings of surface-groundwater interaction as well as their environmental impact is crucial for sustainable water management. However, water fluxes vary depending on external factors like water levels or heavy rain events and may alter the quantity and quality of surface and groundwater. As direct measurements of the ongoing mixing processes are challenging, various tracers are utilized to estimate water fluxes and transit times. Tritium as an environmental radioactive tracer introduced into the environment via nuclear bomb tests in the late 1950s has widely been used for water flux and transit time analyses. However, the tritium concentrations in surface waters in most regions declined to background concentrations due to the nuclear decay of tritium. Therefore, scientists are searching for alternatives like stable water isotopes or other chemical tracers to investigate surface-groundwater fluxes. Persistent organic micropollutants emitted into surface waters might present suitable alternative tracers.

The Moselle River has its source in the southern Vosges mountains and flows through France, along Luxembourg and through western Germany. The river contains high tritium concentrations (up to 50 Bq/l) induced by the French nuclear power plant Cattenom. Hence, tritium concentrations of the Moselle River surface water surpass the naturally abundant tritium concentrations ( ~1 Bq/l) found in groundwater reservoirs adjacent to the river. The German part of the Moselle River was monitored in 2020 to 2022 with monthly to quarterly intervals. Two spatially distributed sampling campaigns along the German Moselle River as well as continuous monthly investigations of a barrage site at Lehmen roughly 20 km upstream of Koblenz were conducted. The analysis of the water samples involves on-site parameters, cations, anions, metals, dissolved organic carbon, stable water isotopes, radon-222, tritium, and organic trace substances like pharmaceuticals. The study found significant surface-groundwater interaction at Lehmen. Thus, we evaluated correlations between tritium and detected organic micropollutants at this site. So far, seven organic micropollutants including the corrosion inhibitor benzotriazole and its derivative 5-methyl-1H-benzotriazole as well as the pharmaceuticals carbamazepine, lamotrigine, tramadol, candesartan and olmesartan were selected for this investigation. These pollutants enter the environment via wastewater release.

In this study, we explored the capability of tritium and persistent organic micropollutants tracers to reflect surface-groundwater interaction. So far, we compared the suitability of different organic micropollutants to reflect the observed water fluxes and transit time estimations with estimated results from tritium. Furthermore, we discuss the possible utility of benzotriazole or other organic compounds for future investigations of surface-groundwater-interaction.

How to cite: Landgraf, J., Beckers, L.-M., Quanz, S., Radny, D., and Schmidt, A.: Assessing tritium and persistent organic micropollutants as tracers for investigating surface and groundwater interaction in a large river system (Moselle River) , EGU General Assembly 2024, Vienna, Austria, 14–19 Apr 2024, EGU24-15310, https://doi.org/10.5194/egusphere-egu24-15310, 2024.

EGU24-18008 | Orals | HS8.2.14 | Highlight

Characterisation of drainage dynamics of karst landscapes over Europe 

Tunde Olarinoye, Nane Weber, Tom Gleeson, Vera Marx, Yan Liu, and Andreas Hartmann

Karst aquifers play a crucial role as water sources globally, with several European countries relying significantly on them for their water supply. Managing these aquifers is challenging due to their subsurface hydraulic heterogeneity. Hydrological modeling has proven valuable, offering insights into the hydraulic dynamics and management of karst water resources. However, characterizing karst drainage attributes at large catchment and regional scales remains challenging, hindering the incorporation of spatial heterogeneity and complexity in large-scale models and leading to unrealistic estimations in karst regions. This study addresses the issue by providing the first regional estimation of karst drainage attribute across Europe, this attribute is herein called Karstification Index (KI). Leveraging a newly developed automated karst spring recession analysis tool, and extensive climatic and physiographic datasets, we applied a regression-based regionalization model to estimate slow and quick flow parameters in karstic landscapes. By estimating KI as the ratio of quick to slow flow parameters, we were able to identify sub-regions with higher and lower degrees of karstification. Our findings highlight the significance of drainage density metrics, particularly in combination with specific climate signals, as predictors of KI. The regionalization model demonstrated high performance, validated by high R2 values, especially in well-gauged European catchments. Encouraged by these results, the analysis is being extended to a global scale, marking the first attempt to estimate karstic drainage attributes globally. We believe that this large-scale parameterization of karstification will enhance regional and global karst water resource management. By improving the parameterization and consideration of karst processes in large-scale hydrological models, our research contributes to a more accurate understanding of karst aquifers on a global scale.

How to cite: Olarinoye, T., Weber, N., Gleeson, T., Marx, V., Liu, Y., and Hartmann, A.: Characterisation of drainage dynamics of karst landscapes over Europe, EGU General Assembly 2024, Vienna, Austria, 14–19 Apr 2024, EGU24-18008, https://doi.org/10.5194/egusphere-egu24-18008, 2024.

EGU24-18110 | ECS | Posters on site | HS8.2.14

Monitoring of microfiber pollutants in karst environments 

Valentina Balestra, Adriano Fiorucci, Paola Marini, and Rossana Bellopede

Recent studies highlighted a preoccupant pollutant which impact natural environments: the microfibres. The term “anthropogenic microfibres” (MFs) includes fibres <5 mm in length of any composition (natural, regenerated and synthetic) derived from larger primary textiles manufactured for human use. MFs have been detected in different environments, as well as in human and animal organs, and adverse effects on animal health have been studied. Not-synthetic MFs have been often considered microplastics because of their colours, and because a lot of them are extruded and processed industrially. However, natural and regenerated fibres are a source of carbon for organisms, and are generally considered biodegradable. However, despite the general consensus on the reduced dangerousness of the not-synthetic fibres in the environment, little is known about their degradation in ecosystems. Their potential faster degradation could release toxic compounds into the environment, such as resins, dyes, and flame retardants. In addition, natural and regenerated textiles release more fibres than synthetic ones during laundering. All these factors may explain a long-term accumulation of MFs in the environment over time.

The Classical Karst Region represents important habitats characterized by the presence of dissolution feature in carbonate rock such as caves and sinkholes, which connect surface and subterranean environments. The Classical Karst waters played an important role for the development of this region: thanks to the high water quality, this area has been heavily exploited and was strongly altered by human activities, which irreversibly modified the hydrology of the system.

In this preliminary study we collected and investigated several water and submerged sediment samples in different caves and springs of the Classical Karst Region. MFs from 5 to 0.1 mm were counted and characterized by size, color and shape via visual identification under a microscope, with and without UV light. Spectroscopic analyses were carried out on 10% particles.

MFs were found in all samples, highlighting MF pollution in surface and subterranean habitats in the karst system. The 81% in water and 74% in submerged sediments were natural and regenerated fibres, while only 13% and 10% respectively were synthetics. The size distribution of collected MFs indicated that big MFs (1-5 mm) are less abundant (<22%). More than 80% of fibres were fluorescent under UV light. Of the fluorescent MFs, 91% were transparent; non-fluorescent MFs were mainly black and blue. Of the synthetic fibres, samples contained especially polyesters and copolymers.

Our results improve knowledge on micro pollutants in aquatic and karst environments, laying the foundations for future research. MF pollution monitoring in karst areas must become a priority for species protection, habitat conservation, and waters management, improving analyses on a larger number of aquatic environments, taking into account the ecological connections between surface and subterranean habitats.

How to cite: Balestra, V., Fiorucci, A., Marini, P., and Bellopede, R.: Monitoring of microfiber pollutants in karst environments, EGU General Assembly 2024, Vienna, Austria, 14–19 Apr 2024, EGU24-18110, https://doi.org/10.5194/egusphere-egu24-18110, 2024.

EGU24-18189 | ECS | Orals | HS8.2.14

Use of dissolved gases as tracers to study the impacts of floods and river works on Surface water – Groundwater interactions. 

Théo Blanc, Friederike Currle, Morgan Peel, Matthias S. Brennwald, Yama Tomonaga, Oliver S. Schilling, Daniel Hunkeler, Rolf Kipfer, and Philip Brunner

Alluvial aquifers have a significant potential for pumping large quantities of groundwater, essential for meeting drinking water needs. Abstracted water typically consists of a mix of regional groundwater and freshly infiltrated river water. A good understanding of surface water – groundwater interactions in these types of systems is required for managing both qualitative and quantitative aspects of riverbank filtration or river renaturations. Tracers are important tools in these contexts, as they provide crucial information on travel times and mixing ratios.

We present data from a comprehensive multi-tracer approach obtained in a field experiment conducted in a pre-alpine valley in central Switzerland. Over several months, river works were undertaken in an infiltrating river in the proximity of an important field of groundwater wells used for drinking water production. We investigated the impact of these river modifications on surface water - groundwater dynamics by monitoring the natural concentrations of (noble) gases with multiple potable mass spectrometers (miniRuedi, Gasometrix) and radon detectors (Rad7, Durridge). Additionally, we injected different noble gas species as artificial tracers both in the river and in groundwater and gained valuable insights into the evolving dynamics of the system.

The combination of these different tracers provided insights that could not have been obtained by a single tracer. Our results demonstrate that during and immediately after restoration works the infiltration of river water increases temporarily and provide insights about the time it takes for a riverbed to recover after restoration works and for river-groundwater interactions to reach a new dynamic equilibrium.

How to cite: Blanc, T., Currle, F., Peel, M., Brennwald, M. S., Tomonaga, Y., Schilling, O. S., Hunkeler, D., Kipfer, R., and Brunner, P.: Use of dissolved gases as tracers to study the impacts of floods and river works on Surface water – Groundwater interactions., EGU General Assembly 2024, Vienna, Austria, 14–19 Apr 2024, EGU24-18189, https://doi.org/10.5194/egusphere-egu24-18189, 2024.

EGU24-19597 | ECS | Orals | HS8.2.14

Simulation of Carbonated Fault Zones Hydrodynamics and Transport Considering Parametric and Predictive Uncertainty 

Boura Aurelie, Cousquer Yohann, Clauzon Victor, Valois Rémi, and Leonardi Véronique

Hydrodynamic understanding of karstic aquifers is a real challenge due to the complexity of their internal structures. However, their societal significance lies in the substantial quantity of groundwater resources they embody. Among these complexities, faults partially control the organization of flows in these systems. The nature of this control can either facilitate rapid flow transfer or act as a barrier, impacting both groundwater quality and quantity. Understanding the behavior of fault zone features is crucial for efficiently management of karstic aquifer resources. However, there is a lack of studies that estimate and simulate flow within fault zones. In this study we estimate the hydraulic properties of the fault zone within carbonate karstic aquifers for flow and transport forecasting purposes based on cross-hole pumping tests simulation and inversion. The flow and transport are modeled using MODFLOW6 and MODPATH7. The inverse modeling approach is based on the Gauss-Levenberg-Marquardt Algorithm (GLMA) and the Iterative Ensemble Smoother (IES) integrated into the PEST++ code. Initially, we applied and validated the approach on a synthetic fault zone and subsequently on a real case studies within karstic carbonate aquifers of interest (Lez aquifer, Montpellier (France)). The inverse modeling approach has proven efficient in exploring hydrodynamic properties and then obtained both flow and transport forecasts with a satisfactory level of uncertainty. These works contribute to a better understanding of the hydrodynamic aspects of fault zones in carbonate environments through an innovative approach specific to its application. This study offers a reproducible method to understand and quantify hydrodynamics in aquifer in general and carbonated aquifer fault zones in particular. This improvement enhances the management strategies for groundwater resources in carbonated aquifers.

How to cite: Aurelie, B., Yohann, C., Victor, C., Rémi, V., and Véronique, L.: Simulation of Carbonated Fault Zones Hydrodynamics and Transport Considering Parametric and Predictive Uncertainty, EGU General Assembly 2024, Vienna, Austria, 14–19 Apr 2024, EGU24-19597, https://doi.org/10.5194/egusphere-egu24-19597, 2024.

EGU24-20334 | ECS | Orals | HS8.2.14

Conclusions from an IAEA Meeting on the sample preparation and measurement of radio sulfur in natural water samples 

Stephen Kamau, El Mostafa Amghar, Richard Bibby, Lorenzo Copia, Laura Coulson, Sandra Damatto, Astrid Harjung, Juergen Kopitz, Martin Kralik, Bradley McGuire, Michael Schubert, and Stefan Terzer-Wassmuth

Research on groundwater residence times is essential for evaluating groundwater abstraction rates and aquifer vulnerabilities, and hence, for sustainable water resources management. Naturally occurring radionuclides are suitable tools for related investigations. While the applicability of several long-lived radionuclides for the investigation of long-term processes has been demonstrated frequently, tracer-based approaches for studying residence times of less than one year have not been fully exploited. That is due to the rather small number of applicable radionuclides that show adequately short half-lives. A promising approach for investigating sub-yearly residence times applies radioactive Sulphur (35S). Radio-Sulphur is naturally produced by high-energy cosmic radiation in the upper atmosphere from where it is transferred with precipitation to the groundwater. As soon as the meteoric water enters the subsurface its 35S activity concentration decreases with an 87.4-day half-life. This makes 35S suitable for investigating sub-yearly groundwater residence times. However, the low 35S activities in natural waters require sulphate pre-concentration for 35S detection by means of liquid scintillation counting. This is done by sulphate extraction from large water samples with anion-exchange resins or/and precipitation as BaSO4. The resulting samples are usually associated with background interferences and quenching. The presented experiments aim at (i) optimizing the sample preparation procedure by simplifying the pre-concentration of sulphate to make it applicable for field sampling and at (ii) reducing quench and background during measurement. We will discuss the different sample preparation methods and lessons learned for the detection and quantification of 35S pre-concentrated from natural water samples that contain a wide range of SO42− concentrations.

How to cite: Kamau, S., Mostafa Amghar, E., Bibby, R., Copia, L., Coulson, L., Damatto, S., Harjung, A., Kopitz, J., Kralik, M., McGuire, B., Schubert, M., and Terzer-Wassmuth, S.: Conclusions from an IAEA Meeting on the sample preparation and measurement of radio sulfur in natural water samples, EGU General Assembly 2024, Vienna, Austria, 14–19 Apr 2024, EGU24-20334, https://doi.org/10.5194/egusphere-egu24-20334, 2024.

During flood events, due to extreme hydraulic loading in recharge areas of aquifers, groundwater flow dynamics can change, causing a risk of pathogens being flushed into aquifers used for drinking water supplies. Extreme flood events, as they are increasingly experienced with climate change, have potential to cause impacts not seen before, and drinking water sources that were free of pathogen contamination in the past may become contaminated in the future.

As an example, in the Heretaunga Plains, Hawkes Bay, contaminated water from heavy rain inundated paddocks entered an unconfined part of the aquifer and drinking water wells in it, resulting in >6260 cases of illness including 42 hospitalizations, and Campylobacter infection contributed to at least four deaths.

Most of the c. 30 drinking water wells in the Heretaunga Plains, including those supplying the cities of Hastings and Napier, are, however, in the confined part of the aquifer and these were not affected by pathogen contamination. But will more extreme flood events, predicted with climate change, eventually also compromise drinking water sources in the confined aquifer which were deemed safe in the past? Wells in the confined aquifer have shown indications of changing groundwater flow dynamics, for example variable water age, and changing hydrochemistry after flood events, which might be associated with younger water, bearing the risk of pathogen intrusion.

On 13 and 14 February, 2023, Cyclone Gabrielle lashed Hawke’s Bay, with record rainfalls causing rivers to burst their banks causing a death toll of 11. To improve understanding of the impact of the extreme hydraulic loading on the aquifers through such events, specifically changes to the water flow dynamics with potential for new, previously unrecognised contaminant pathways and associated risks for drinking-water supply wells, we measured age-tracers in selected wells again, two months after Cyclone Gabrielle. Comparing the results of this survey with age-tracer data from just three months prior to the cyclone provided an opportunity to test how extreme events like
Cyclone Gabrielle change groundwater flow dynamics in confined aquifers.

On 12 and 13 April 2023 we re-sampled for age tracers a selection of drinking-water supply wells in partnership with Hastings District Council and Napier City Council, and of private and monitoring
wells in the central and marginal confined parts of the aquifer system in partnership with
Hawkes Bay Regional Council.

The data indicate that groundwater ages in these wells have not changed significantly because of Cyclone Gabrielle. The wells that showed slight changes in age-tracer concentrations consistently showed older water after Cyclone Gabrielle. Other wells, despite showing no detectable changes in age-tracer concentrations, contained water that was more evolved after the cyclone, indicated by decreased dissolved oxygen and elevated methane, ammonia, and phosphorous concentrations.

These observations all point toward older (probably deeper) groundwater having been
pushed into the active groundwater flow paths by the increased hydraulic loading. With no younger water detected in the investigated wells following Cyclone Gabrielle, there is no indication of increased risk of pathogen contamination in the confined aquifer system following extreme flood events.

How to cite: Morgenstern, U.: Did Cyclone Gabrielle increase the risk of pathogen contamination for drinking water supply wells in the confined aquifer of the Heretaunga Plains, New Zealand?, EGU General Assembly 2024, Vienna, Austria, 14–19 Apr 2024, EGU24-20783, https://doi.org/10.5194/egusphere-egu24-20783, 2024.

HS8.3 – Subsurface hydrology – Vadose zone hydrology

EGU24-833 | ECS | Posters on site | HS8.3.2

Quantification of Temporal Variability of Soil Hydraulic Properties in an Agricultural Plot  

Saurabh Kumar, Ajit Kumar Srivastava, and Richa Ojha

An improved understanding of temporal variability of soil hydraulic properties (SHPs) can lead to better prediction of soil water dynamics in agricultural fields. This study aims to quantify the temporal variations and trends in SHPs of an experimental agricultural plot in IIT Kanpur during rice and wheat crop seasons. Statistical analysis is performed to investigate the effects of crop-cover, sampling time and depth on temporal variability of SHPs. The soil samples were collected in 6 plots at depths of 10 cm, 25 cm, and 50 cm for the period 2022-23. The samples were analysed for variations in organic carbon content, bulk density (ρb), saturated hydraulic conductivity (Ksat) , saturated moisture content (θs), and soil water characteristic curve. The results show significant temporal variations in ρb and θs. The lowest temporal variation in observed in organic carbon content. The temporal trends in SHPs for both rice and wheat crops offer valuable insights into the dynamic nature of soil behaviour during crop cultivation. The findings of this study will contribute to better understanding of soil-water relationships, aiding farmers in optimizing irrigation practices and promoting sustainable agricultural management for improved crop productivity.

How to cite: Kumar, S., Srivastava, A. K., and Ojha, R.: Quantification of Temporal Variability of Soil Hydraulic Properties in an Agricultural Plot , EGU General Assembly 2024, Vienna, Austria, 14–19 Apr 2024, EGU24-833, https://doi.org/10.5194/egusphere-egu24-833, 2024.

EGU24-1708 | ECS | Orals | HS8.3.2

A Wetting-Front Model for Vadose Zone Infiltration via Drywells 

Ziv Moreno, Amir Paster, and Tamir Kamai

Drywell infiltration is a common approach to recharge groundwater and reduce load from drainage systems. Due to rapid acceleration in urban developments, as well as climate change that predicts an increase in frequencies and magnitude of extreme precipitation events in the Mediterranean area, it is critical to predict the drywell infiltration capacity, i.e., its response to anticipated precipitation events. The infiltration capacity of a drywell is mainly determined by the geometrical parameters, i.e., diameter and depth, and the soil hydraulic parameters, i.e., hydraulic conductivity, porosity, and water retention. Predictions of drywell infiltration capacity are commonly conducted using models that solve the unsaturated flow in the subsurface using complex and costly numerical schemes. This work proposes a different approach based on a semi-analytical model that relies on a sharp interface wetting front assumption. The proposed model can predict the water levels in the well and the subsurface wetting front location during and after an infiltration event. The semi-analytical model was tested and compared with numerical simulations of Richards' equation and with data from a field experiment and proved to be sufficiently accurate. The typical run times of the semi-analytical model are smaller than 1 second and about three orders of magnitude shorter than the numerical model of Richards' equation. The field data was further utilized to calibrate the soil hydraulic properties by matching the semi-analytical model's outcomes to the measured water levels in the well. A sensitivity analysis of the drywell response to variable hydraulic properties, climatic scenarios, and well configurations (depth and diameter) was conducted, demonstrating some practical applications for analysis, which may be used for adequately determining site-specific drywell design.

How to cite: Moreno, Z., Paster, A., and Kamai, T.: A Wetting-Front Model for Vadose Zone Infiltration via Drywells, EGU General Assembly 2024, Vienna, Austria, 14–19 Apr 2024, EGU24-1708, https://doi.org/10.5194/egusphere-egu24-1708, 2024.

Deep-rooted vegetation transpires a considerable amount of deep soil water with different ages in the unsaturated zone. However, the tradeoffs between new water of transpiration (temporally originating from post-planting precipitation) and old water of transpiration (temporally originating from pre-planting precipitation) across the vegetation lifespan are poorly understood. In this study, we collected soil samples from beyond 28 m soil depth on the Loess Plateau of China to investigate the influence of deep-rooted vegetation on the age of soil water and analyze the proportion of new and old water of transpiration in the unsaturated zone under grassland, 22-year-old apple orchard, and 17-year-old peach orchard. Water isotopes (2H, 18O, and 3H), solutes (chloride, nitrate, sulfate), and soil water content were used to identify the critical water ages in the unsaturated zone (one-year water age, water age corresponding to stand age, and the maximum water age of transpiration), and to determine soil water deficit, soil evaporation loss fraction, and potential groundwater recharge. The results showed that soil water mainly moved as piston flow in these soil profiles, and deep soil water largely came from heavy precipitation. Deep-rooted vegetation restrained new pore water velocity and potential groundwater recharge. New pore water velocity declined from 0.40 m yr-1 to 0.14 m yr-1 and 0.34 m yr-1 for apple and peach, respectively. Deep-rooted vegetation decreased groundwater recharge by 9.46 % for apple and 7.04 % for peach, compared to grassland. Over the vegetation lifespan, annual average transpiration was 500.56 mm yr-1 and 468.89 mm yr-1 with maximum water age of 63 years and 45 years for apple and peach, respectively. The transpiration of deep-rooted vegetation mainly used new water (94.97 % for apple and 97.47 % for peach). The total old water of transpiration was 553 mm for apple and 209 mm for peach. Our results identify the temporal sources of vegetation water use, offering new insights into the transpiration process of deep-rooted vegetation.

How to cite: Li, M. and Chen, G.: Quantitative partitioning of temporal origin of transpiration into pre- and post-plantation under deep-rooted vegetation on the Loess Plateau of China, EGU General Assembly 2024, Vienna, Austria, 14–19 Apr 2024, EGU24-2584, https://doi.org/10.5194/egusphere-egu24-2584, 2024.

EGU24-2639 | Posters on site | HS8.3.2

Water vapor adsorption and flow dynamics in dry desert soils 

Dilia Kool and Nurit Agam

Water vapor adsorption is the least studied form of non-rainfall water inputs but is likely the most common one in arid and hyper-arid areas. It is determined by the magnitude of the downward gradient in water vapor pressure between the atmosphere and the soil; the surface area of the adsorbing soil; and the penetration depth of water vapor adsorption. Water vapor adsorption was measured using micro-lysimeters and profiles of relative humidity (RH) sensors in both loess and sand in the Negev desert, Israel, over the summers of 2021 and 2022. The RH sensor array allowed measurement of detailed changes in water content in the soil profile and provided an unprecedented insight into processes governing water vapor adsorption dynamics under arid conditions in-situ. The RH sensors significantly underestimated total water vapor adsorption, indicating that a finer array is needed to capture the full process. However, even with the current array, extremely small changes in water content were captured. With these measurements we explored the three main factors contributing to water vapor adsorption. The onset of a downward vapor pressure gradient coincided with the arrival of the sea breeze, indicating that the sea breeze is the primary source for water vapor adsorption in the uppermost soil layer. Water vapor adsorption was higher in loess than in sand, due to its finer texture and larger surface area. The most important finding of this research is that the dominant mechanism for water vapor flow under natural arid conditions (relative humidity in the soil (RHs) <100%) is different than under the generally assumed RHs = 100% conditions. Under natural arid conditions, temperature affects water vapor flow through advection rather than through diffusion. This means water vapor moves from lower to higher, rather than from higher to lower, temperatures. The fact that advection is a much faster process compared to diffusion potentially explains the rather deep penetration of water vapor adsorption observed in deserts.

How to cite: Kool, D. and Agam, N.: Water vapor adsorption and flow dynamics in dry desert soils, EGU General Assembly 2024, Vienna, Austria, 14–19 Apr 2024, EGU24-2639, https://doi.org/10.5194/egusphere-egu24-2639, 2024.

Recent models of the unsaturated hydraulic conductivity curve (UHCC) are the sum of separate UHCCs for domains of capillary water, film water, and water vapor. A new theoretical framework for aggregating domain conductivities to a bulk soil UHCC reveals that this requires parallel domains. The same theory also generates arithmetic, harmonic, and geometric averages of the liquid-water conductivities, which can be arithmetically averaged with the vapor conductivity. However, current models for capillary and film conductivities are intrinsic, i.e., valid within their respective domain. The vapor conductivity is a bulk conductivity, i.e., it gives the conductivity of the gaseous domain as it manifests itself in the soil. Conversion relationships use the domain volume fractions as approximations of the as-yet unknown weighting factors to convert between intrinsic and bulk conductivities. This facilitates consistent averaging of domain conductivities. The fitted curves for the capillary and film water depend on the averaging (or adding) method. Hence, they are not strictly characteristic of their respective domains. Truly intrinsic domain conductivity functions may not exist, or are perhaps merely tools to arrive at a good fit of the UHCC of the bulk soil. Given these complications, a simpler junction model that joins a capillary and a film limb at a junction point offers an attractive alternative. 

How to cite: de Rooij, G. H.: The unsaturated soil hydraulic conductivity as a sum, an average, or a junction of domain conductivities, EGU General Assembly 2024, Vienna, Austria, 14–19 Apr 2024, EGU24-2947, https://doi.org/10.5194/egusphere-egu24-2947, 2024.

EGU24-3493 | ECS | Orals | HS8.3.2

Investigating the feasibility of Bioengineering and Hydropedological techniques in controlling shallow water table problem in urban areas 

Shahad Al-Yaqoubi, Ali Al-Maktoumi, Anvar Kacimov, Osman Abdalla, and Said Al-Ismaily

The continuous and frequent occurrence of the Shallow Water Table (SWT) in urban regions aggravates the severity of geotechnical and environmental problems. Exploring possible measures that effectively reduce the negative impact of SWT in urban aquifers is of extreme importance. This research investigated the effectiveness of bioengineering techniques in lowering SWT in the framework of hydropedological factors (soil structure in the vadose zone, where most pore water fluxes take place). The methodology includes physical models (sand tank experiments) and field-scale studies. A total of nine sand tanks were utilized, segmented into three distinct groups, to investigate the reduction of the water table through different mechanisms: (1) evapotranspiration drawdown by soil water uptake by the roots of vegetation (specifically Reeds), (2) evaporation by bare homogeneous topsoil, and (3) evaporative “soil siphoning” in tanks that were made as “smart composites” with a fine-textured vertical “moisture chimney”. The dynamics of SWT were monitored over 6 months (March–September 2023). Each tank measures 100 cm in length, 70 cm in height, and 15 cm in width. All tanks were packed with two horizontal soil layers (sand and clay) to simulate a perched aquifer, common prototypes of which were explored in Muscat, Oman. In the siphoning experiment, a small trench was made and packed with silt loam soil. This trench extended the entire thickness of the aquifer to enhance capillarity and, hence, evaporation. Analysis of the results showed that the drawdown of the water table ranged from 75% to 300% (winter to summer seasons) in the tanks containing plants (Reeds) compared with the control tanks. In addition, the SWT in the tanks with “soil siphons” was reduced in the range of 22%-46% compared with the control tanks. Another experiment with Reeds was conducted on a larger field scale using Concrete Agricultural Basins (CABs) with dimensions of 1000 cm length, 200 cm width, and 60 cm depth. The experiment spanned three months (June-September 2023) and aimed to investigate the impact of Reeds on SWT levels in larger-scale 3D pore water dynamics (in sand tank experiments flows were 2D). Overall, the large-scale experiment showed that over the three months, the evapotranspiration from Reeds reduced the water level by 16.7%, 66.7%, and 116.7% more than evaporation from bare soil during the first, second, and third months, respectively.

This investigation highlights the significant influence of bioengineering through phreatophytic Reeds, seasonal variations of weather conditions, and the hydropedology of the root zone on checking the SWT levels. The influence of fine-textured soil lenses, strata, and engineered soil siphons in controlling water levels was studied. While the presence of Reeds plays a crucial role in influencing water levels, seasonal fluctuations, usually modeled by ET0-ETc, also contribute, with drastic differences between summer and winter. The investigated drainage techniques are ecologically and environmentally benign: no electricity or fuel is used for the reduction of waterlogging because only soil capillarity and solar energy maintain the processes of evaporation and transpiration; the Reeds’ biomass, accumulated during the ecoengineering process, additionally intercepts and sequesters CO2.

How to cite: Al-Yaqoubi, S., Al-Maktoumi, A., Kacimov, A., Abdalla, O., and Al-Ismaily, S.: Investigating the feasibility of Bioengineering and Hydropedological techniques in controlling shallow water table problem in urban areas, EGU General Assembly 2024, Vienna, Austria, 14–19 Apr 2024, EGU24-3493, https://doi.org/10.5194/egusphere-egu24-3493, 2024.

The SWAP model employs a finite difference numerical solution of the Richards equation, including root water uptake, to simulate the movement and predict the state of soil water and associated quantities in the vadose zone. The relation between hydraulic conductivity K, pressure head h, and water content θ can be described by parameters of the Van Genuchten-Mualem (VGM) relations, where the quality of these parameters determines the quality of the model output. We developed a stochastic procedure to evaluate the outputs of the SWAP model according to the uncertainty and correlations in the VGM parameters. Specific software was developed to (1) fit VGM parameters to observed retention and conductivity data to obtain values, standard errors, and correlations of transformed parameters (software HPFit); (2) generate p stochastic realizations of the VGM parameters using Cholesky decomposition (software StochHyProp), and (3) run the SWAP model with each of the p parameter realizations for specific scenarios, extracting simulation results (software RunSWAP), e.g., the simulated water balance components evaporation, transpiration, bottom flux, and runoff. The results from the last step yield the respective frequency distributions of the output values. Examples will show that the most commonly performed prediction using the average VGM parameter values does not always agree with the median of the stochastic realizations. The developed procedure allows the quantitative analysis of the uncertainty of SWAP model output, adding to the interpretation of the predictive power of hydrological models like SWAP.

How to cite: de Jong van Lier, Q.: Using the SWAP model for the stochastic analysis of hydraulic parameter uncertainty propagation in soil water balance components, EGU General Assembly 2024, Vienna, Austria, 14–19 Apr 2024, EGU24-3939, https://doi.org/10.5194/egusphere-egu24-3939, 2024.

Films, rivulets, snapping rivulets, sliding drops, slugs—many flow modes besides filled-tube, Poiseuille-type flow occur in macropores. Some of these fit reasonably into Darcian formulations and the analog of laminar viscous flow in water-filled tubes. But others do not. These exceptions may be the main reason for failures to predict the speed and travel distance of preferential flow.

A useful first step for an improved model of macropore flow is the classification of diverse flow modes into categories based on their intrapore boundary conditions. Within a flowing macropore, the gas-liquid and liquid-solid interfaces, with the effects of interfacial constraints such as surface tension and contact angles, determine the geometry of the flowing liquid phase and its controlling frictional influences. A classification scheme with four categories can account for the various flow modes that have been observed in lab and field experiments. This categorization helps to distinguish which flow modes are amenable to Darcian or Poiseuille-type representation and which are not. Some of the exceptions are approachable with wave or film-flow concepts as in several recently-developed models. Yet there are other flow modes that do not fit well in any of these models, and in some cases these may be the most important means of rapid and long-distance transport. Other sorts of physical processes may provide suitable analogs for these, for example free-fall concepts like initial acceleration, speed-dependent frictional forces, and terminal velocity. In any case, the diversity of macropore flow modes needs to be considered in the development of markedly improved models of preferential flow.

How to cite: Nimmo, J. R.: Diverse modes of macropore flow—How to include them in predictive models?, EGU General Assembly 2024, Vienna, Austria, 14–19 Apr 2024, EGU24-4130, https://doi.org/10.5194/egusphere-egu24-4130, 2024.

Understanding the change of soil hydraulic conductivity with temperature is a key to predicting the groundwater flow and solute transport in permafrost and seasonally frozen area. The most commonly used models for hydraulic conductivity during freeze-thaw cycles only consider the flow of capillary water in the soil and neglect water flowing along thin films around the particle surface. This paper proposed a new hydraulic conductivity model of frozen soil via Clausius-Clapeyron equation based on an unsaturated soil hydraulic conductivity model over the entire moisture range using analogy between freeze-thaw and dry-wet process in soils. The new model used a simple single equation to describe the conductivity behaviors resulting from both capillary and adsorption forces, thus accounting for effect of both capillary water and thin liquid film around soil. By comparing with other existing models, the results demonstrated that the new model is applicable to various types of soils and the predicted hydraulic conductivity is in the highest agreement with the observed data. Finally, our new model was validated with a thermal-hydrological benchmark problem and a laboratory experiment result, and the benchmark results indicated that the advective heat transfer was more significant and the phase change completed earlier when considering both capillary and adsorption forces than that only considering capillary forces. Further, the coupled flow-heat model with the FXW-frozen-M2 replicate well the results from a laboratory column experiment.

How to cite: Qiao, S.: A New Model for Predicting Hydraulic Conductivity of Soil during Freeze-thaw Processes that Accounts for Both Capillary and Adsorption Forces, EGU General Assembly 2024, Vienna, Austria, 14–19 Apr 2024, EGU24-4578, https://doi.org/10.5194/egusphere-egu24-4578, 2024.

EGU24-5914 | ECS | Posters on site | HS8.3.2

A Stochastic Approach to Quantifying Uncertainty in Soil Organic Carbon 

Leonardo Inforsato, Pablo Rosso, Ahsan Raza, Magdalena Main-Knorn, and Claas Nendel

Soil organic carbon (SOC) is a key driver of soil hydraulic properties like, field capacity and wilting point, necessary for in-field scale yield prediction using tipping bucket models. However, the labor-intensive nature of obtaining spatially distributed SOC often leads to its extrapolation using satellite imagery, resulting in significant inaccuracies in SOC prediction. In this study, we propose a Monte Carlo-based (MC) procedure to quantify the propagation of SOC error to simulated yield estimates. This procedure stochastically generates data, considering both uncorrelated and correlated data. For uncorrelated data, each SOC value is generated following an independent normal distribution. For correlated data, covariances are considered, accounting for the spatial correlation of in-field SOC variability. The autocorrelation between each pair of pixels is calculated, building a correlation matrix, which is submitted to the Cholesky decomposition, resulting in a lower triangular matrix. This matrix is then used to generate correlated SOC values for each pixel, maintaining the shape of the SOC clusters while varying the SOC value in each pixel according to its error. We validated our methodology using synthetic data, then used the methodology to assist error propagation of SOC with true data in a field located in Booßen, Germany. We generated 5000 SOC images, each with approximately 6000 pixels, and simulated the yield for each pixel. The results were analyzed by the field as a whole and each pixel across different images, by generating probability distributions for both. Another comparison was made by direct measurement between measured and simulated yields. Our results confirm the consistency of our method. In the specific scenario analyzed, preliminary results show that the SOC uncertainty was sufficient to explain the entire difference between the true and estimated crop yield, highlighting the importance of accurately assessing SOC uncertainty in yield prediction models.

How to cite: Inforsato, L., Rosso, P., Raza, A., Main-Knorn, M., and Nendel, C.: A Stochastic Approach to Quantifying Uncertainty in Soil Organic Carbon, EGU General Assembly 2024, Vienna, Austria, 14–19 Apr 2024, EGU24-5914, https://doi.org/10.5194/egusphere-egu24-5914, 2024.

EGU24-6420 | ECS | Posters virtual | HS8.3.2

Direct measurement and indirect estimation of unsaturated soil hydraulic properties in Tunisian soils. 

Asma Hmaied and Claude Hammecker

Abstract

The hydrological cycle is strongly affected by climate changes causing extreme weather events with long drought periods and intense rainfall events. To predict the hydrological functioning of Tunisians catchments, modelling is an essential tool to estimate the consequences on water resources and to test the sustainability of the different land uses. Soil physical properties describing water flow, are therefore essential to feed the models and need to be determined all over the watershed.

In order to complete this task, lightweight, cost effective but robust methods are needed. In the present study, both physically based and empirical models or pedo-transfer functions (PTF) have been used to estimate unsaturated soil hydraulic properties based on particles size distribution (PSD), and straightforward in-situ infiltration experiments.

The specific Pedo-Transfer Functions (PTFs) embedded within the Rosetta model, the physically grounded Arya-Paris model, and the Beerkan Estimation of Soil Transfer parameters (BEST) have been specifically developed to gauge soil hydraulic parameters based on soil texture, bulk density, and, eventually, outcomes from single-ring infiltration experiments. These models were applied to a diverse array of soil types from both Northern and Central Tunisia, with a subsequent comparative analysis aimed at evaluating their potential applicability and individual performances.

Consequently, the estimated parameters derived from these models were incorporated into Hydrus to compute water flow in the vadose zone under the actual weather conditions prevailing in Tunisia. The resultant effects on the calculated water balance, encompassing infiltration, drainage, and runoff, were systematically compared for a comprehensive understanding of their implications.

Results show that soil hydraulic parameters determined with different techniques are significantly different. The results for simulated water balance over 3 years, show also differences especially for intense rainfall events. It seems that the BEST method is a valuable technique for estimating soil hydraulic parameters, offering a cost-effective and practical alternative to traditional methods, especially as it leverages on experimental infiltration data.


How to cite: Hmaied, A. and Hammecker, C.: Direct measurement and indirect estimation of unsaturated soil hydraulic properties in Tunisian soils., EGU General Assembly 2024, Vienna, Austria, 14–19 Apr 2024, EGU24-6420, https://doi.org/10.5194/egusphere-egu24-6420, 2024.

EGU24-6425 | ECS | Orals | HS8.3.2

Does model complexity of a pedotransfer function for soil hydraulic properties hamper its transferability? 

Julian Schoch, Madlene Nussbaum, Lorenz Walthert, Andrea Carminati, and Peter Lehmann

Land surface models need information on soil hydraulic properties (SHP) that are often estimated using pedotransfer functions (PTFs). Due to a lack of calibration data, PTFs must be applied that were trained for regions and land use types outside the region of interest. In this study, we quantify the transferability of PTFs to new regions as function of mathematical complexity and number of covariates. For that purpose, we trained new PTFs for forest soils based on a dataset of 25 soil profiles from climatically moderate regions of Switzerland. In a second step, we tested the new and some existing PTFs in a drier and hotter Swiss region (Valais). Tests of transferability showed that increasing the mathematical complexity (from a linear model to a highly non-linear random forest model) was always beneficial for the predictive power in new regions. Increasing the number of covariates revealed a trade-off between improving the accuracy of the predicted soil water retention curve and reducing accuracy of the soil hydraulic conductivity. Interestingly, the use of environmental predictors (climate data) hampers transferability the most due to large climatic contrasts between the calibration and validation regions. These results suggest that transferability works better for PTFs using fewer predictors. We recommend the use of non-linear PTFs based on soil texture, soil density, and organic carbon content for optimal prediction accuracy in regions without training data. This work highlights that the models with the highest number of predictors are not optimal for achieving transferability and that reducing the number of predictors can be beneficial.

How to cite: Schoch, J., Nussbaum, M., Walthert, L., Carminati, A., and Lehmann, P.: Does model complexity of a pedotransfer function for soil hydraulic properties hamper its transferability?, EGU General Assembly 2024, Vienna, Austria, 14–19 Apr 2024, EGU24-6425, https://doi.org/10.5194/egusphere-egu24-6425, 2024.

EGU24-6734 | Posters on site | HS8.3.2

Soil structure determined from interrelationships in hydraulic, thermal and electrical properties 

Josh Heitman, Yongwei Fu, and Robert Horton

The presentation will focus on the interrelationships of soil hydraulic, thermal and electrical transport properties. We will highlight how some more easily measured transport properties can be used as surrogates for others, which cannot be readily measured. We will specifically illustrate how the thermo-TDR sensing platform can be used to collect detailed in situ thermal and electrical property measurements at millimeter to profile scale. We will utilize the interrelationships between hydraulic, thermal and electrical properties together with thermo-TDR measurements in order to demonstrate how soil density and structure can be determined in situ. We will also highlight opportunities for extending such approaches to other sensing platforms at other scales.

How to cite: Heitman, J., Fu, Y., and Horton, R.: Soil structure determined from interrelationships in hydraulic, thermal and electrical properties, EGU General Assembly 2024, Vienna, Austria, 14–19 Apr 2024, EGU24-6734, https://doi.org/10.5194/egusphere-egu24-6734, 2024.

EGU24-7481 | ECS | Posters on site | HS8.3.2

Concept to quantify the effects of SOM on water retention hysteresis and hydrophobicity in sandy soils and their implication for soil water modeling 

Daniel Schwarze, Johanna Metzger, Mathias Spieckermann, Joscha Becker, Yva Herion, Marc-Oliver Göbel, Jörg Bachmann, and Annette Eschenbach

Global warming is promoting extreme weather conditions like more frequent heavy rainfall events and longer periods of drought in central Europe. This can lead to an increase in hydrophobicity and hysteretic behavior of soils, potentially reducing its water retention capabilities and changing the soil water balance. These soil characteristics are also highly dependent on the amount and properties of soil organic matter (SOM). Climate change effects are expected to be particularly pronounced in sandy soils, which have comparatively low water retention capacities.

In this study, we will quantify the effects of SOM on soil hydraulic properties and analyze their impact on the soil water balance in hydrological models in comparison to data acquired by pedotransfer functions.

To cover a wide range of SOM content and properties, we sampled sandy soils (> 80% sand) from five different land use categories (arable land, heathland, grassland, deciduous and coniferous forest). The samples were taken in the Southwest of the Metropolitan region of Hamburg, near Lüchow-Dannenberg. The samples were analyzed for their total soil organic carbon and nitrogen content, and will further be analyzed for their fractions of particulate organic matter (POM) and mineral associated organic matter (MAOM). Hydrophobicity was determined using the water-drop-penetration-time test and contact angle measurements with the sessile drop method. Furthermore, the Integrative Repellency Dynamic Index (IRDI) will be determined for all topsoils to quantify the average hydrophobicity of the sample. Soil water retention is acquired using the porous plate method as well as the evaporation method (HYPROP), including wetting and drying curves. This data will serve as a starting point for simulations under different climate scenarios using HYDRUS.

The aim of this study is to improve our understanding on how hydrophobicity and water retention (wetting and drying) in sandy soils are influenced by the content and properties of SOM, and how this affects the results of hydrological models under different climate scenarios. This will contribute to improve the ability to assess future soil water dynamics, which is vital for sustainable land use and climate change adaptation.


The study is funded by the Deutsche Forschungsgemeinschaft (DFG, German Research Foundation) under Germany‘s Excellence Strategy – EXC 2037 'CLICCS - Climate, Climatic Change, and Society' – Project Number: 390683824, contribution to the Center for Earth System Research and Sustainability (CEN) of Universität Hamburg".

How to cite: Schwarze, D., Metzger, J., Spieckermann, M., Becker, J., Herion, Y., Göbel, M.-O., Bachmann, J., and Eschenbach, A.: Concept to quantify the effects of SOM on water retention hysteresis and hydrophobicity in sandy soils and their implication for soil water modeling, EGU General Assembly 2024, Vienna, Austria, 14–19 Apr 2024, EGU24-7481, https://doi.org/10.5194/egusphere-egu24-7481, 2024.

EGU24-7858 | Orals | HS8.3.2

Water flow across the skin of the Earth – how badly are we doing? 

Peter Lehmann, Patrick Duddek, and Andrea Carminati

Despite its limited vertical extent, the thin soil layer provides essential functions for climate and ecosystems globally. For accurate large scale process description, land use models compute the water distribution in soils based on spatial domains with a width-to-thickness ratio of about 1000:1: a geometry as thin as a sheet of paper. Most models simulate the water flow in these ‘soil sheets’ by solving the Richardson-Richards equation in 1D, neglecting smaller scale structures and lateral flow, and implicitly making strong assumptions on the relations between water content, matric potential, hydraulic conductivity, and water flux. To quantify the accuracy of this conceptualization, we compare drainage simulations of wet soils for the 1D column simplification with the full 2D-and 3D geometry using the correct sheet-like size ratio. The role of different climates, soil types, and heterogeneities at smaller scale is analyzed. These simulations based on the full geometry provide guidelines for (i) the applicability of Richardson-Richards equation in land surface models and (ii) the development of appropriate averaging schemes of soil hydraulic properties in the 1D scenario.

How to cite: Lehmann, P., Duddek, P., and Carminati, A.: Water flow across the skin of the Earth – how badly are we doing?, EGU General Assembly 2024, Vienna, Austria, 14–19 Apr 2024, EGU24-7858, https://doi.org/10.5194/egusphere-egu24-7858, 2024.

EGU24-7923 | ECS | Orals | HS8.3.2

Advancing estimates of groundwater recharge by integrating multi-sensor observations across the vadose zone in a drying climate 

Simone Gelsinari, Sarah Bourke, James McCallum, and Sally Thompson

Understanding the impact of climate change on groundwater recharge is crucial for the sustainable management of groundwater systems, especially when regulatory agencies are managing aquifers already fully allocated. Recharge emerges as the outcome of Critical Zone (CZ) processes such as interception, runoff, or plant water uptake that use or store water from rainfall as it traverses the soil-plant-atmosphere continuum. Consequently, recharge is best understood and observed through multiple observations that can characterise storage, potentials and transport of water both in the soil and in the groundwater. Understanding how these CZ processes respond to a variable climate is essential for informing groundwater allocation management and decision-making.

We present the results of field observations and a meta-analysis of recharge studies spanning the last 50 years in the Mediterranean climate area around Perth (Australia). This period coincides with a 15% reduction in winter rainfall, with the impacts on recharge partly revealed by the meta-analysis, but confounded by varying observation methods and sites. Seven field observation sites with consistent, multi-sensor instrumentation were therefore established to reveal recharge dynamics and estimate recharge fluxes. Electromagnetic soil moisture sensors provide vertical information across the soil profile (up to 10 meters below ground), complemented with soil water potential sensing at the surface and capillary fringe. ERT observations and manual soil moisture measurements in ancillary access tubes extend this information laterally (i.e. from 1D to 2D).  Groundwater depth, meteorological and remotely sensed information enables contextualisation of the observations. 

Historical data analysis shows that rainfall reductions lead to nonlinear (3 to 4 times higher), decreases in recharge. The installed monitoring stations reveal how the dynamics of wetting fronts are influenced not only by the climatic variables but also by the types of vegetation and their response to a drying climate. This suggests the presence of distinct local recharge mechanisms operating within the transient systems of the area. The insights obtained from these monitoring sites can be benchmarked against broader observations, such as data provided by remote sensing or borewell measurements, to generate databases of recharge estimates useful for models.

How to cite: Gelsinari, S., Bourke, S., McCallum, J., and Thompson, S.: Advancing estimates of groundwater recharge by integrating multi-sensor observations across the vadose zone in a drying climate, EGU General Assembly 2024, Vienna, Austria, 14–19 Apr 2024, EGU24-7923, https://doi.org/10.5194/egusphere-egu24-7923, 2024.

EGU24-7939 | ECS | Orals | HS8.3.2

Neutron imaging unveils heterogeneous flow patterns in homogeneous porous media and limitations of Darcy-Richards models 

Alexander Sternagel, Ashish Dinesh Rajyaguru, Luca Trevisan, Ralf Loritz, Brian Berkowitz, and Erwin Zehe

We applied neutron imaging techniques to unveil pore scale flow processes occurring during desaturation of a homogeneous, saturated sand pack. For this purpose, we used a small glass flow cell (2 cm x 2 cm x 0.1 cm) filled with pure, artificial S250 quartz sand. The pore space of the sand was initially fully saturated with double distilled water (DDW). The saturated flow cell was subjected to a series of suction phases with increasing suction tensions to extract water via a bottom outlet, controlled by a vacuum pump. In the first phase, a tension of 0.016 MPa (low suction) was applied for 248 min, followed by 1.14 MPa (mid suction) for 227 min, and finally, 10 MPa (high suction) for 397 min. Throughout the entire duration of the experiment, the flow cell was continuously exposed to neutrons. A back-end detector collected the neutron beams passing through the different matters (sand, water, air) contained in the flow cell and generated snapshot images of the internal pore structure and the water distribution with a pixel resolution of 5 µm at one-minute intervals.

The resulting images revealed that water did not redistribute homogeneously during the desaturation of the flow cell, over dimensions of a few millimeters. Despite using “perfectly homogeneous” sand under initially fully water-saturated, controlled conditions, heterogeneous patterns of stable water pockets were observed inside the pore space of the sand, where water became immobilized.

These experiments demonstrate that truly homogeneous flow does not occur even under controlled laboratory conditions in a “perfectly homogeneous” porous medium.

Subsequent simulations of the experiments with common Darcy-Richards models showed that the macroscopic 1D desaturation time series of the flow cell could be realistically depicted. However, even after parameter calibration and the manual addition of heterogeneity, the microscopic, heterogeneous 2D distribution of water observed inside the flow cell could not be reproduced.

This highlights limitations on the applicability of Darcy-Richards models, which may be effective at a macroscopic level but simultaneously fail to represent accurately the internal dynamics of the system. This insight is crucial for the application of Darcy-Richards models and the interpretation of their results.

How to cite: Sternagel, A., Rajyaguru, A. D., Trevisan, L., Loritz, R., Berkowitz, B., and Zehe, E.: Neutron imaging unveils heterogeneous flow patterns in homogeneous porous media and limitations of Darcy-Richards models, EGU General Assembly 2024, Vienna, Austria, 14–19 Apr 2024, EGU24-7939, https://doi.org/10.5194/egusphere-egu24-7939, 2024.

EGU24-8608 | ECS | Posters on site | HS8.3.2

“rswap” – an R package for automated and command-based interaction with the SWAP4.2 model. 

Moritz Shore and Csilla Farkas

“rswap” is an R package under development for SWAP 4.2 with the goal of simplifying, automating, and improving user interaction with the model. The package functions by detecting and translating SWAP input files into R-compatible dataframes, allowing for easy and automated modifications to parameters. Modified model inputs can then be re-written to files and run in SWAP from the R console using "rswap". SWAP model output can be automatically imported into the R environment and visualized using a variety of (interactive) graphing functions. If observational data is provided by the user, then the package can adjust output settings to match (variables and depth).  Modelled and observed data can then be graphically compared in-line and “goodness-of-fit” statistics can be generated and plotted. Additionally, model runs can be saved and interactively compared with each other, functions are thoroughly documented with runnable examples, and a baseline runnable model setup can be automatically initialized. Further planned developments to the package include support for parallel running of model runs, enabling rapid automated sensitivity analysis, scenario analysis, as well as automated “hard calibration” routines and parameter estimation. Through this functionality, “rswap” can connect the SWAP model to an integrated development environment (IDE), such as “RStudio”, allowing users to efficiently perform all their work (setup, calibration, execution, analysis) in a single environment. Importantly, the packages allows for direct use of  SWAP with the vast array of research software on the R platform. “rswap” is an open-source project originally developed for use in OPTAIN (optain.eu) and has been applied in multiple case studies and thesis projects.

How to cite: Shore, M. and Farkas, C.: “rswap” – an R package for automated and command-based interaction with the SWAP4.2 model., EGU General Assembly 2024, Vienna, Austria, 14–19 Apr 2024, EGU24-8608, https://doi.org/10.5194/egusphere-egu24-8608, 2024.

The variability of soil hydraulic properties across different spatial and temporal scales leads to heterogeneous sub-surface water flows, affecting the accuracy of predicting soil water distribution and solute transport. Since soils such as Andosols can describe extreme physical behaviours and water rarely is in hydraulic equilibrium in the porous media, it is still challenging to derive hydraulic functions that realistically represent the influence of soil structure dynamics under different land uses, as well as to predict the occurrence of non-uniform flows at field conditions. This work aimed to describe the spatiotemporal variability of unimodal and dual-porosity (bi-modal) soil water retention (SWR) functions using high-resolution field observations in structured soil affected by compaction. We focused on the influence of water-filled pores volumes at wet and dry conditions, wetting/drying cycles, and soil structure dynamics using three depths (10, 20, and 60 cm). The land use was a diverse grassland sown in September 2019, including three compaction levels (0.65, 0.75, and 0.85 g cm-3, named Control, T1, and T2, respectively) in an Andosol of Southern Chile. A two-year 10-min-resolution dataset (June 2020 to June 2022) of soil moisture content (48 sensors) and matric potential (18 sensors) collected by 6 monitoring stations was analysed by i) separating wet and dry periods dynamics based on soil moisture states, ii) determining wetting and drying cycles using time derivatives of soil moisture content, and iii) fitting and comparing the parameters of unimodal and dual-porosity formulations of the Mualen-van Genuchten numerical solution. Separating soil moisture observations in wet and dry conditions, as well as in wetting and drying cycles, resulted in different SWR curves starting from contrasting water-filled pores volumes. This dynamic-based hydrological parameterisation resulted in a range of high goodness of fit (mean R2 of 0.89 ± 0.07 and 0.94 ± 0.06 for unimodal and dual-porosity van Genuchten models) while deriving SWR functions. However, the dual-porosity formulation better represented complex curvatures in SWR curves towards the soil surface in wet conditions, which would increase our capacity to describe near-saturation macropore dynamics at high resolution. Thus field observations allowed the representation of expected spatial variability between soil depths due to different physical properties and compaction influence. While at the same time, high-resolution time series were used to describe significant different SWR curves for wet and dry conditions when soil structure is affected by compaction, mainly influencing α and n parameters in unimodal formulations, and n1, α2, and n2 in dual-porosity formulations.

How to cite: Bravo-Peña, S., van Schaik, L., and van Dam, J.: Soil water retention function variability based on soil structure and moisture dynamics at field conditions affected by compaction in an Andosol, EGU General Assembly 2024, Vienna, Austria, 14–19 Apr 2024, EGU24-9410, https://doi.org/10.5194/egusphere-egu24-9410, 2024.

EGU24-10348 | ECS | Posters on site | HS8.3.2

Connecting soil structure and hydraulic properties under different land use on a European climate gradient 

Dymphie Burger, Wulf Amelung, Heike Schimmel, Lutz Weihermüller, Harry Vereecken, and Sara Bauke

The infiltration of water into the soil, especially during extreme rainfall events, is controlled by soil hydraulic properties such as saturated hydraulic conductivity. Usually, the saturated hydraulic conductivity of the soil at larger scales is estimated by pedotransfer functions that use easily available soil properties such as soil texture, bulk density, and soil carbon content. Unfortunately, it has been already shown that those predictors do not contain the information for precise prediction of the saturated hydraulic conductivity. Moreover, it is widely accepted that the soil structure caused by aggregation, which defines the soil pore network, are important characteristics towards correctly estimating the saturated hydraulic conductivity.

To analyze and quantify the impact of aggregation on the saturated hydraulic conductivity we combined analyses of soil structure based on drop-shatter tests and aggregate size fractionation, with analyses of infiltration pathways via dye tracer application and in-field infiltration measurements. As soil structure is strongly influenced by soil management and climate, we sampled croplands, grasslands, and forests along a European climate gradient.

Our results indicate that both soil structure parameters and the classical predictors used in pedotransfer functions (soil texture, bulk density, and soil carbon content) had a significant influence on the saturated hydraulic conductivity. Regression models using soil structure parameters had a very similar Aikaike Information Criterion (AIC) as regression models without taking soil aggregation into account. This was different for the near-saturated hydraulic conductivity (K-2 cm), where the regression models based on soil texture, bulk density and soil organic carbon content  performed better than the model using soil structure parameters. Additionally, it was found that landuse and plant type had a large influence on soil structural parameters. We found less stained areas (0- 30 cm depth) in forests than in croplands and grasslands, which indicates more occurrences of preferential flow, and this was also  negatively correlated with the initial soil moisture at the time of measurement. In addition, higher levels of aggregation, indicated by a higher mean weight diameter of the soil aggregates, was associated with higher preferential flow as indicated by the dye tracer Both, stained area and peds and clods were influenced by the plant type as well, since the sites with vegetation having predominantly fibrous root systems responded differently than the sites with tap-rooted plants, trees, or heathland vegetation. The enhanced information on soil structure can therefore help us better understand landuse and land cover effects on saturated hydraulic conductivity and soil water infiltration.

How to cite: Burger, D., Amelung, W., Schimmel, H., Weihermüller, L., Vereecken, H., and Bauke, S.: Connecting soil structure and hydraulic properties under different land use on a European climate gradient, EGU General Assembly 2024, Vienna, Austria, 14–19 Apr 2024, EGU24-10348, https://doi.org/10.5194/egusphere-egu24-10348, 2024.

EGU24-10493 | ECS | Posters on site | HS8.3.2

Groundwater influence on the frequency of heatwaves: A global perspective 

Anastasia Vogelbacher, Milad Aminzadeh, Mehdi H. Afshar, and Nima Shokri

Groundwater plays a crucial role in land-atmosphere interactions through its effect on soil moisture, evaporation and thus surface heat fluxes (1). Variation of rainfall patterns in a changing climate and the increase in water demands are expected to influence groundwater dynamics that affect soil moisture-air temperature feedback processes and subsequently the occurrence of heatwaves. The decline in groundwater levels with intensified abstraction could hinder its buffer capacities to impede soil desiccation and onset of heatwaves. The current understanding of the relationship between shallow groundwater tables and heatwave events is often limited to regional studies or specific land covers, with a very few endeavors seeking to characterize global-scale trends and responses. We thus aim to globally investigate the relation between groundwater levels and heatwave events considering different land cover types and environmental variables by conducting a wide-ranging statistical analysis. Our approach involved leveraging a comprehensive dataset, allowing us to distinguish potential links between groundwater tables and the frequency of heatwaves over a range of geographical and climatological parameters. The findings from our investigation provide valuable insights into the relationship between groundwater dynamics and heatwave frequency within the broader context of the interactions between soil moisture and air temperature. This information will aid in devising effective action plan to mitigate the adverse effects of climate change.


Reference:

(1) Maxwell, R., Kollet, S. Interdependence of groundwater dynamics and land-energy feedbacks under climate change. Nature Geosci1, 665–669 (2008). https://doi.org/10.1038/ngeo315


How to cite: Vogelbacher, A., Aminzadeh, M., Afshar, M. H., and Shokri, N.: Groundwater influence on the frequency of heatwaves: A global perspective, EGU General Assembly 2024, Vienna, Austria, 14–19 Apr 2024, EGU24-10493, https://doi.org/10.5194/egusphere-egu24-10493, 2024.

EGU24-10596 | ECS | Orals | HS8.3.2

Comparing the accuracy of soil moisture estimation derived from environmental and spectroscopic gamma radiation measurements  

Sonia Akter, Johan Alexander Huisman, and Heye Reemt Bogena

Continuous monitoring of root-zone soil moisture status is important to ensure the effective management of water resources for agricultural production, and to improve our understanding of land-atmosphere interactions in a changing climate. Utilizing gamma radiation to monitor soil moisture at the field scale is an emerging non-invasive technique that can also bridge the gap between point and remote sensing measurements. The measurement principle relies on the increased attenuation of gamma radiation emitted from soil with increasing soil moisture content. In a previous study, we successfully obtained soil moisture estimates from low-cost environmental gamma radiation (EGR) detectors. However, since EGR detectors provide the bulk response to gamma radiation over a wide energy range (0 to 3000 keV), EGR signals are influenced by several confounding factors, e.g., skyshine radiation, atmospheric and soil radon variability. To what extent these confounding factors deteriorate the accuracy of soil moisture estimates obtained with EGR is still not fully understood. Therefore, the aim of this study is to compare EGR measurements with K-40 gamma radiation (at 1460 keV) measurements that are much less influenced by these confounding factors. For this, two different kinds of gamma radiation detectors were installed close to each other at an agricultural field in Selhausen, Germany: an EGR detector based on a G-M counter tube (MIRA, ENVINET GmbH) and a spectroscopic scintillation-based detector (SARA, ENVINET GmbH). The field was also equipped with in-situ soil moisture sensors to measure reference soil moisture and a climate station to measure meteorological parameters. The EGR measurements were corrected for atmospheric radon-washout during precipitation events and the contributions of meteorologically influenced secondary cosmic radiation were also eliminated. In case of the spectroscopic measurements, no further corrections were applied as the analysis was only focused on the K-40 energy window. Both sets of gamma radiation measurements were related to reference soil moisture using a functional relationship derived from theory. We found that daily soil moisture can be predicted more accurately from K-40 gamma radiation (RMSE 4 vol.%) than from EGR (RMSE 6 vol.%). Regardless of the higher prediction uncertainty obtained due to the influence of the confounding factors at low energy, the long-term availability of ERG data, e.g., in Europe via EURDEP, makes it interesting for continental scale analysis of soil moisture. 

How to cite: Akter, S., Huisman, J. A., and Bogena, H. R.: Comparing the accuracy of soil moisture estimation derived from environmental and spectroscopic gamma radiation measurements , EGU General Assembly 2024, Vienna, Austria, 14–19 Apr 2024, EGU24-10596, https://doi.org/10.5194/egusphere-egu24-10596, 2024.

EGU24-10970 | Posters on site | HS8.3.2

Assessing heterogeneity of preferential soil water fluxes in situ with zero-tension microlysimeters in a temperate forest 

Johanna Clara Metzger, Volker Kleinschmidt, Truxton Oldridge, Matthias Beyer, and Annette Eschenbach

Macropore flow in structured soils constitutes an important component of soil water fluxes. This is especially true for unmanaged ecosystems. Preferential flow substantially affects ecohydrological separation, the partitioning of precipitation water into green (soil matrix, vegetation) and blue (recharge) water. Event characteristics, which are affected by changing climate, impact preferential flow; this, in turn, has an impact on ecohydrological separation and water resource availability. Though its importance is widely acknowledged since decades, it remains a challenge to measure preferential flow in soils. Additionally, small-scale heterogeneity of soil and environmental properties triggers spatial heterogeneity of preferential flow. In this study, we test the potential of zero-tension microlysimeters to measure preferential flow in a high spatial resolution. Zero-tension lysimeters have been used to sample soil water solution for chemical analysis. Methodical studies have shown that soil matric fluxes flow around zero-tension lysimeters and only gravity-driven water fluxes are captured. Using this to our advantage, we aim to develop a low-cost and simple method to sample preferential (gravity-driven) soil water fluxes in point measurements. This enables the implementation of a statistical design due to a high possible number of repetitions and the comparison with standard soil water status sensors due to similar scales. We are testing our lysimeters in a temperate mixed deciduous forest at Apelern, Lower Saxony, Central Germany. The soils are shallow and consist of weathered limestone intermingled with loess. By implementing transects starting from tree stems, we aim to cover a range of input fluxes and soil properties. We are combining lysimeters with measurements of soil water content, stand precipitation and soil properties. With our setup, we will be able to gain insight into the heterogeneity of preferential fluxes in situ and compare soil, stand and event impact factors to get a better understanding of the role of macropore flow in ecohydrological separation.

How to cite: Metzger, J. C., Kleinschmidt, V., Oldridge, T., Beyer, M., and Eschenbach, A.: Assessing heterogeneity of preferential soil water fluxes in situ with zero-tension microlysimeters in a temperate forest, EGU General Assembly 2024, Vienna, Austria, 14–19 Apr 2024, EGU24-10970, https://doi.org/10.5194/egusphere-egu24-10970, 2024.

EGU24-11862 | Posters on site | HS8.3.2

Experimental evidence of non-equilibrium water flow during bare-soil evaporation 

Sascha Iden, Efstathios Diamantopoulos, Magdalena Sut-Lohmann, and Wolfgang Durner

The Richards equation is de facto the standard model for simulating variably-saturated water flow in soils. It is based on the assumption that water content and matric potential are in instantaneous equilibrium. Their relationship is the water retention curve which is widely used to evaluate soil quality, to determine the effective pore-size distribution, and to derive the soil hydraulic conductivity curve. Experimental data collected over the last 6 decades show that the water retention curve depends not only on the history of wetting / drying, but also on the dynamics of water flow (transient vs equilibrium conditions). Many studies present experimental evidence on the hypothesis that the faster the water flow in soils, the more pronounced is the deviation of the dynamic retention curve from the equilibrium one. In this contribution, we present experimental data which show that these effects also occur during experiments in which water flow can be characterized as relatively slow. We conducted evaporation experiments on two soils, a sand and a silt loam, and varied the evaporation rate. Evaporation rates were controlled by wind speed, and flow interruptions were induced by temporarily covering the samples. We measured soil temperature and matric potential at different depths. The results show a relaxation of the matric potential with changes in wind speed, in particular during the flow interruptions. A complete analysis of the data requires a distinction between the vertical redistribution of moisture caused by changes in the evaporation rate, the effect of temperature on matric potential, and the “true” nonequilibrium between matric potential and water content. Contrary to the general assumption that bare-soil evaporation is a slow process during which equilibrium between water content and matric potential is ensured, our results show that dynamic nonequilibrium occurs even in the case of relatively slow, upward water flow. This results in a shift in the dynamic water retention curve estimated from evaporation experiments, indicating that more water is retained in the soil when water is flowing, as compared to static experiments.

How to cite: Iden, S., Diamantopoulos, E., Sut-Lohmann, M., and Durner, W.: Experimental evidence of non-equilibrium water flow during bare-soil evaporation, EGU General Assembly 2024, Vienna, Austria, 14–19 Apr 2024, EGU24-11862, https://doi.org/10.5194/egusphere-egu24-11862, 2024.

EGU24-11928 | ECS | Orals | HS8.3.2

The dynamics of field soil water retention curves predicted by autoencoder neural network 

Nedal Aqel, Andrea Carminati, and Peter Lehmann

The matric potential plays a pivotal role in understanding of water movement, plant water availability, and mechanical stability. In lack of direct measurements, the matric potential dynamics must be deduced from soil water content values, using the soil water retention curve. This approach is of particular importance at larger scales where only the water content (but not the potential) can be deduced from satellite data. However, because the relationship between water content and matric potential in natural field soils is highly ambiguous, not unique and dynamic, the prediction of matric potential from water content data is a big challenge. This ambiguity is related to different structures controlling drainage and wetting, dynamic effects, and seasonal changes of structures controlling the water distribution. In this study we present an autoencoder neural network as a new approach to analyze the soil moisture dynamics and to predict matric potential from water content data. The autoencoder compresses the water content time series into a site-specific feature (denoted as autoencoder value, AUV) that is representative of the underlying soil moisture dynamics. The AUV can then be used as predictor of the matric potential and the highly hysteretic soil water retention curve. The approach was tested successfully for nine soil profiles in the region of Solothurn (Switzerland). Three sites were chosen to establish the connection between AUV and the ambiguous soil water retention curve using a deep neural network, that was then applied to predict the matric potential dynamics of the other six sites. This method offers the potential to (i) deduce matric potential dynamics by relying solely on soil water content measurements (including satellite data), even when strong seasonal effects challenge standard methods, and (ii) serves as a warning system for changes in soil properties and in the intricate relationship between soil water content and matric potential dynamics.

How to cite: Aqel, N., Carminati, A., and Lehmann, P.: The dynamics of field soil water retention curves predicted by autoencoder neural network, EGU General Assembly 2024, Vienna, Austria, 14–19 Apr 2024, EGU24-11928, https://doi.org/10.5194/egusphere-egu24-11928, 2024.

EGU24-11976 | Posters on site | HS8.3.2

Manual versus Automated Beerkan run for characterizing the hydraulic properties of sandy soil in Senegal's Sahel 

Laurent Lassabatere, Deniz Yilmaz, Faye Waly, Didier Orange, Hanane Aroui, Djim ML Diongue, Saint-Martin Saint-Louis, Thierry Winiarski, Brice Mourier, Rafael Angulo-Jaramillo, Simone Di Prima, Olivier Roupsard, and Frederic C. Do

The comprehension of hydrological processes inherent in the water cycle and its constituents is of paramount significance when formulating adaptation strategies to address climate and global changes. The Sahel region serves a crucial role as a buffer zone between the arid desert and the more verdant and precipitation-laden areas of Senegal. The savanna region comprises a dynamic amalgamation of woody perennials intermixed with agricultural crops and pastures. The sustained vitality of this ecosystem hinges upon sustainable agriculture, mandating the judicious utilization of water resources. The formulation of strategies geared towards optimizing water resource management necessitates a comprehensive understanding of hydrological processes. This includes the investigation of water infiltration at the soil surface, the dynamics of water redistribution within the soil profile, and the mechanisms governing groundwater recharge. These scientific insights will help to develop effective strategies for the sustainable utilization of water resources within the Sahel region.  The intended investigation seeks to characterize the hydraulic properties of sandy soils that extensively prevail within the savanna ecosystem.

The utilization of water infiltration experiments coupled with corresponding modeling presents a robust framework for non-intrusive on-site hydraulic soil characterization. These methodologies have been widely employed across diverse contexts (Angulo-Jaramillo et al., 2019, for a review). To achieve this objective, the Beerkan method, initially proposed by Braud et al. (2005), involving the controlled infiltration of known water volumes into a designated ring, has been identified as a pertinent approach. Recently, Di Prima et al. (2016) have introduced an automated infiltrometer as a substitute for the manual Beerkan method, thereby streamlining and enhancing the procedural aspects of hydraulic soil characterization.

The study pursues a dual objective: (i) to characterize the hydraulic properties of sandy soil and delineate their spatial variability, both horizontally and vertically across the soil profile; and (ii) to assess the influence of the chosen water infiltration setup (Manual versus Automated Beerkan) on the obtained results. The investigation involved the excavation of three pits arranged as steps, providing access to five distinct horizons that spanned from the soil surface to a perched aquifer positioned at 2.5/3 m depth. Both Manual and Automated Beerkan experiments were conducted at the soil surface and for each horizon. Cumulative infiltrations were subjected to analysis using the BEST methods for precise determination of hydraulic parameters. Furthermore, bulk density and particle size distributions were determined for each Beerkan run by coring the soil at the conclusion of the experiment.

The examination of infiltration rates and hydraulic parameter profiles across the soil profiles, along with the comparative analysis of values derived from manual versus automated Beerkan runs, furnished pertinent insights to address the study's dual objectives.

References

Angulo-Jaramillo, R., et al., 2019. Journal of Hydrology. 576, 239–261. https://doi.org/10.1016/j.jhydrol.2019.06.007

Braud, I., et al., 2005. European Journal of Soil Science 56, 361–374. https://doi.org/10.1111/j.1365-2389.2004.00660.x

Di Prima, S., et al.,2016. Geoderma 262, 20–34. https://doi.org/10.1016/j.geoderma.2015.08.006

How to cite: Lassabatere, L., Yilmaz, D., Waly, F., Orange, D., Aroui, H., Diongue, D. M., Saint-Louis, S.-M., Winiarski, T., Mourier, B., Angulo-Jaramillo, R., Di Prima, S., Roupsard, O., and Do, F. C.: Manual versus Automated Beerkan run for characterizing the hydraulic properties of sandy soil in Senegal's Sahel, EGU General Assembly 2024, Vienna, Austria, 14–19 Apr 2024, EGU24-11976, https://doi.org/10.5194/egusphere-egu24-11976, 2024.

EGU24-12002 | Posters on site | HS8.3.2

Ground-penetrating radar can ascertain the influence of biochar on soil wetting 

Lakshman Galagedara, Sashini Pathirana, and Manokararajah Krishnapillai

Incorporating biochar (BC) as a soil amendment has become a prominent agricultural management practice since it has many advantages. Most soils amended with BC have shown improvements in soil physical and hydraulic properties, including bulk density, soil porosity, water retention, field capacity, and permanent wilting point. Ground-penetrating radar (GPR) is a non-destructive geophysical technique that is used to study soil properties and state variables. Yet, there is a lack of research studying the influence of amendments on soil hydrology using GPR.  Therefore, this study was aimed at evaluating the ability of GPR in assessing the effect of BC on soil hydrology. The experiment was conducted under laboratory conditions using plastic containers measuring 28.6 cm in length, 20 cm in width and 16.4 cm in height. These plastic containers were filled up to 14 cm height with three different treatments (T); T1 (100% Sand+0% BC), T2 (99.5% Sand+0.5% BC), and T3 (98% Sand+2% BC) on a mass basis. Soil moisture sensors were placed horizontally at 2, 7, and 12 cm depths while packing the containers. The GPR data were collected using 1000 MHz center frequency transducers by keeping transmitter and receiver on opposite sides of the container (zero-offset profiling survey) at 20 cm antenna offset. Data were collected before, during, and after the wetting process over a one-hour timeframe. A 204 mL of water was applied every 4 min (13 times) to increase the soil water content at each time by 2% from initial water content. The GPR data were processed, and radargrams were prepared to observe the wetting front movement. Soil water contents were estimated utilizing the travel time of the GPR direct wave through the treatment media. GPR travel time and moisture sensor data were compared in each treatment. The GPR estimated soil water contents correlated well with moisture sensor data (correlation coefficient (r)>0.93) in all three treatments. Results have shown that the travel time of GPR direct wave responded differently for three treatments. The rate of change in GPR estimated soil water content over time exhibits an increase with the percentage of BC (T1<T2<T3). This suggests that the amendments with BC influence the soil water dynamics as expected, and the GPR effectively captures these rapid water content changes indicating its ability to monitor soil water dynamics non-destructively. Furthermore, the identification of the wetting pattern by GPR was noticeably distinct as compared to that observed with soil moisture probes in the BC amended treatments (T2 and T3), as compared to 100% sand (T1). Accordingly, our study demonstrates the capability of GPR in non-destructively capturing and distinguishing soil water dynamics influenced by BC amendments, emphasizing its potential for evaluating the impact of BC on soil hydrology.

How to cite: Galagedara, L., Pathirana, S., and Krishnapillai, M.: Ground-penetrating radar can ascertain the influence of biochar on soil wetting, EGU General Assembly 2024, Vienna, Austria, 14–19 Apr 2024, EGU24-12002, https://doi.org/10.5194/egusphere-egu24-12002, 2024.

EGU24-12041 | Orals | HS8.3.2

Overview of water retention and suction stress properties of layered pyroclastic ashes in landslide prone areas of Campania, southern Italy 

Daniel Camilo Roman Quintero, Emilia Damiano, Lucio Olivares, and Roberto Greco

The loose, stratified composition of pyroclastic soil covers typically consists of layers of air-fall ashes and pumices. When these deposits are resting on steep slopes, they pose a significant geohazard due to slope instabilities. This scenario is evident in the carbonate massifs covered by pyroclastic soils in Campania (southern Italy), an extensive area of about 400 km2 prone to landslides. In these porous deposits, the soil suction in unsaturated conditions plays a crucial role in enhancing the slope stability by providing additional shear strength.

This study aims to present a comprehensive overview of the hydraulic and shear strength characteristics observed in different layers of pyroclastic ashes across various sites in the Campania study area. By gathering datasets from previous studies and introducing new experimental data, the relationship between soil index, hydraulic properties and the shear strength in unsaturated conditions is examined.

The findings highlight notable differences in hydraulic properties of soils originating from the same location but belonging to different layers: ashes from intermediate layers within the soil profile, where failure surface usually occurs; weathered ashes in direct contact with the carbonate bedrock, responsible of water exchange with deeper systems. The water retention curves of intermediate ashes exhibit air entry values at approximately 4 kPa, while those in contact with the bedrock show values around 25 kPa. Conversely, soils from the same layer but from different sites exhibit relatively similar hydraulic characteristics. For example, intermediate ashes from the same layer typically display air entry values varying between 0.5 kPa and 4 kPa. The same behavior also appears regarding the influence of soil suction on the shear strength of the investigated materials, which can be estimated directly from the water retention curves.

How to cite: Roman Quintero, D. C., Damiano, E., Olivares, L., and Greco, R.: Overview of water retention and suction stress properties of layered pyroclastic ashes in landslide prone areas of Campania, southern Italy, EGU General Assembly 2024, Vienna, Austria, 14–19 Apr 2024, EGU24-12041, https://doi.org/10.5194/egusphere-egu24-12041, 2024.

EGU24-12145 | ECS | Posters virtual | HS8.3.2

Comparing manual versus automated Beerkan runs for the estimation of water infiltration and soil hydraulic parameters for an urban soil 

Saint Martin Saint Louis, Fasnet Boncourage, Simone Di Prima, Dieuseul Prédélus, Rafael Angulo-Jaramillo, and Laurent Lassabatere

Adapting cities to climate and global changes requires tremendous progress in managing the water cycle in cities. So far, the water pathways are disconnected from the natural water cycle in urban areas. Runoff water is collected and routed to sewer systems. Best management practices were then developed to restore the natural water cycle by promoting water infiltration into specific urban drainage systems. These are often called “SUDS” for Sustainable Urban Drainage Systems and infiltrate the runoff water collected over urban catchments. However, SUDS may lose their capability to infiltrate water as the soil clogs and becomes less permeable. For these devices, soil hydraulic conductivity must be monitored over time.

Water infiltration techniques have been developed to characterize the soil hydraulic properties. The Beerkan method was pioneered by Braud et al. in 2005 and then used by many soil scientists (Angulo-Jaramillo et al., 2016). Several algorithms were developed to treat the data and estimate the soil hydraulic properties. In 2006, Lassabatere et al. (2006) initiated the BEST method to identify the saturated hydraulic conductivity and the whole set of unsaturated hydraulic parameters from Beerkan runs combined with field data (bulk density and particle size distribution). Since then, the method has been improved and adapted to many types of soils and configurations (see Angulo-Jaramillo et al., 2019, for a review).

The Beerkan run is easy to perform. It requires one operator to prepare known volumes of water, infiltrate them into a ring inserted in the soil, and score the infiltration times. The cumulative infiltration, which assigns the cumulative infiltrated volume to the infiltration time, is the raw data that is used in most hydraulic characterization algorithms. However, its ease of use requires human resources (one operator) and may be time-consuming, particularly for fine soils that infiltrate very slowly. Di Prima et al. (2016) recently designed an automated infiltrometer that replaces the operator. The device automatically supplies the water before desaturation of the soil surface and records the infiltrated volume as a function of time. This device has been deployed for several studies, allowing the hydraulic characterization of several types of soils under several field conditions.

However, so far, no studies have focused on comparing the automated infiltration, referred to as “Automated Beerkan,” and the manual version of the Beerkan runs. In this study, we performed the two types of runs at the same places in order to avoid uncontrolled variations due to spatial variability in urban soils. We present the cumulative infiltrations obtained at the same point with the automated Beerkan and the original Beerkan (manual version). The cumulative infiltrations were inverted using the BEST methods, and the obtained hydraulic parameters were compared.

Di Prima, S., et al.,2016. Geoderma 262, 20–34. https://doi.org/10.1016/j.geoderma.2015.08.006

Angulo-Jaramillo, R., et al., 2016. Springer, Switzerland. https://doi.org/10.1007/978-3-319-31788-5

Angulo-Jaramillo, R., et al., 2019. Journal of Hydrology 576, 239–261. https://doi.org/10.1016/j.jhydrol.2019.06.007

Braud, I., et al. 2005. European Journal of Soil Science 56, 361–374. https://doi.org/10.1111/j.1365-2389.2004.00660.x

Lassabatere, L., et al., 2006. Soil Science Society of America Journal 70, 521–532. https://doi.org/10.2136/sssaj2005.0026

How to cite: Saint Louis, S. M., Boncourage, F., Di Prima, S., Prédélus, D., Angulo-Jaramillo, R., and Lassabatere, L.: Comparing manual versus automated Beerkan runs for the estimation of water infiltration and soil hydraulic parameters for an urban soil, EGU General Assembly 2024, Vienna, Austria, 14–19 Apr 2024, EGU24-12145, https://doi.org/10.5194/egusphere-egu24-12145, 2024.

EGU24-12183 | ECS | Posters on site | HS8.3.2

Extending the measurement range for determining soil hydraulic properties with the simplified evaporation method using relative humidity sensors 

Jannis Bosse, Sascha C. Iden, Wolfgang Durner, Magdalena Sut-Lohmann, and Andre Peters

A precise knowledge of soil hydraulic properties is crucial for many applications, with the unsaturated hydraulic conductivity being most challenging to measure accurately. Direct measurement under dry conditions presents difficulties, lacking simple and precise methods. While the simplified evaporation method (SEM) has become the standard for determining the water retention curve (WRC) and hydraulic conductivity curve (HCC), its classic implementation only provides conductivity values within a relatively narrow suction range measurable by tensiometers, typically between 60 and 1000 cm.

In this study, we extended the experimental setup of the SEM by incorporating small sensors to measure temperature and relative humidity alongside the tensiometers. Applying the Kelvin equation, this addition allows for suction measurements between the wilting point and air-dry conditions. Using this setup, we conducted evaporation experiments on soils spanning various textures, from silt loam to pure sand. Analyzing the data through (i) inverse modeling using the Richards equation and (ii) the SEM revealed that combining tensiometers and relative humidity sensors facilitates the determination of HCC over a broad moisture range. This includes the suction range covered between the measurement ranges of the sensors, given proper interpolation between the two sensor types.

Crucially, successful inverse modeling relies on a suitable parametric representation of the soil hydraulic properties, considering water adsorption, film, and vapor flow. Our findings indicate that the classic SEM evaluation tends to overestimate HCC in the tensiometer's measuring range and underestimate it in the hygroscopic range, especially in coarse-textured soils with a narrow pore size distribution. Despite this limitation, the proposed test setup, when coupled with the SEM, offers practical advantages due to its relative simplicity and ease of data evaluation.

How to cite: Bosse, J., Iden, S. C., Durner, W., Sut-Lohmann, M., and Peters, A.: Extending the measurement range for determining soil hydraulic properties with the simplified evaporation method using relative humidity sensors, EGU General Assembly 2024, Vienna, Austria, 14–19 Apr 2024, EGU24-12183, https://doi.org/10.5194/egusphere-egu24-12183, 2024.

EGU24-12291 | ECS | Orals | HS8.3.2

Evaluation of Soil Mapping Methods for SWAT Hydrological Modeling through Multi-Objective Calibration 

Fernando Gimeno, Mauricio Zambrano-Bigiarini, Mauricio Galleguillos, and Rodrigo Marinao

Soil data is a crucial component for hydrological models operating at the catchment scale, such as the Soil and Water Assessment Tool (SWAT). Nevertheless, the reliability of these models is heavily contingent upon the quality and spatial resolution of the soil information employed. This study addresses the pressing need for robust soil data in SWAT modeling by evaluating various soil mapping techniques.

The first objective was to prove different mapping techniques, such as textural class combination and clustering approach using soil grid data to have different soil maps. The performance of those maps, together with WRB, WSR, Zobler, HWSD v2.0 and DSOLMAPS, was evaluated to improve the accuracy and reliability of the SWAT hydrological model. To achieve this, we conduct a comprehensive investigation involving multi-objective calibration, utilizing both flow data and soil moisture data to calibrate the model. Finally we incorporate a  pedotransfer function to include the landcover effect on Saturated Hydraulic Conductivity to improve the reliability of soil hydrological processes in the SWAT model.

The study area, situated within the Cauquenes River Catchment, presents a complex hydrological system characterized by substantial spatial heterogeneity in soil properties. The soil mapping techniques under evaluation encompass traditional soil survey data integrated with remotely sensed soil information and machine learning-based soil mapping methodologies. These methods are compared in their ability to enhance the SWAT model's representation of the catchment's hydrological dynamics.

In the case of the kmeans clustering approach the results of soil clusters are equivalent to soil units. A number of clusters from 3 to 100 were evaluated with the lowest DB index. Clusters from 3 to 16 presented an optimal range. The SWAT model calibration was performed under multi-objective evaluation, with kmeans soil cluster and DSoilMaps with better result for daily simulations.

The work to correct the application of soil data, including in situ observation, satellite data and machine learning approach, provides a valuable approach to improve the calibration and validation processes of hydrological models in semi-arid regions, important for cacthment management and decision making processes, and to correctly assess the impacts of land use changes, climate variability and extreme events on water resources. 

How to cite: Gimeno, F., Zambrano-Bigiarini, M., Galleguillos, M., and Marinao, R.: Evaluation of Soil Mapping Methods for SWAT Hydrological Modeling through Multi-Objective Calibration, EGU General Assembly 2024, Vienna, Austria, 14–19 Apr 2024, EGU24-12291, https://doi.org/10.5194/egusphere-egu24-12291, 2024.

EGU24-12832 | ECS | Orals | HS8.3.2

Tree influence on water dynamics in sloped forest soils: insights from stemflow and throughflow experiments and time-lapse ground-penetrating radar monitoring 

Gersende Fernandes, Maria Burguet Marimon, Maria Paz Salazar, Elisa Marras, Ilenia Murgia, Konstantinos Kaffas, Filippo Giadrossich, Ryan D. Stewart, Majdi R. Abou Najm, Alessandro Comegna, Laurent Lassabatère, Daniele Penna, Christian Massari, and Simone Di Prima

Incident gross precipitation is divided by tree canopies into three main parts: i) intercepted rainfall, which evaporates directly from the canopies, ii) throughfall, which reaches the soil surface after passing through the canopies, and iii) stemflow, which is concentrated from the canopies to the stems. Stemflow tends to infiltrate preferentially around the base of the stem, and once belowground, is channeled by tree roots.

The objective of this research was to investigate the contribution of stemflow and throughflow to subsurface water dynamics in a hillslope forested with beech trees. The experimental activities were carried out in a 10 x 10 m plot located in the Lecciona catchment of the Appennine Mountains, Central Italy.  Stemflow was collected from seven beech trees located within the plot. Stemflow and throughfall were sequentially and then simultaneously induced using controlled water applications. Time-lapse ground-penetrating radar (GPR) surveys were conducted under each line of trees. Overland flow and subsurface runoff were collected with V-shaped gutters positioned at the bottom of the trees and at the downhill plot edge.

Stemflow infiltration rates were calculated by a mass balance, i.e., subtracting the collected overland flow from the injected volume and then dividing by the stem basal area and the time of steady infiltration. Mean values for each tree and for the entire plot, the latter considering the throughfall experiments, were approximately 1000 mm/h. The GPR data enabled the detection of active preferential flow paths, assessment of hillslope connectivity, and estimation of flow velocities. GPR gave relevant information in the flow pathways in the soils, the effects of root systems and its combination with matrix flow.

This experiment represents a straightforward, replicable, and non-invasive method for characterizing the role of trees in water runoff and infiltration at the hillslope spatial scale, and more broadly, in understanding how forested hillslope respond to rainstorms.

How to cite: Fernandes, G., Burguet Marimon, M., Paz Salazar, M., Marras, E., Murgia, I., Kaffas, K., Giadrossich, F., D. Stewart, R., R. Abou Najm, M., Comegna, A., Lassabatère, L., Penna, D., Massari, C., and Di Prima, S.: Tree influence on water dynamics in sloped forest soils: insights from stemflow and throughflow experiments and time-lapse ground-penetrating radar monitoring, EGU General Assembly 2024, Vienna, Austria, 14–19 Apr 2024, EGU24-12832, https://doi.org/10.5194/egusphere-egu24-12832, 2024.

EGU24-13115 | ECS | Posters on site | HS8.3.2

Advancing hydrological monitoring: Terrestrial gravimetry surveys in the Selke Catchment, Germany 

Sara Sayyadi, Daniel Rasche, Marvin Reich, Theresa Blume, and Andreas Güntner

In this study, spatial and temporal variations of soil moisture and water storage were monitored with two complementary methods: terrestrial gravimetry and cosmic ray neutron sensing (CRNS). CRNS monitors near-surface soil moisture by measuring low-energy neutron abundance in the near-surface atmosphere, which inversely correlates with soil moisture in the top decimeters of the soil. Terrestrial gravimetry monitors water storage variations in an integrative way over the entire unsaturated zone and the groundwater. Both methods allow for non-invasive spatially integrated field-scale monitoring around the instruments.

The study area is the Selke catchment in Central Germany with an area of 456 km². It has notable variations in topography, land use, and meteorology from the lowlands to the low mountain ranges. A combined approach was applied for terrestrial gravimetry: continuous stationary and time-lapse network surveys. We deployed a gPhone in a container-based housing (SolarCube) which serves as a base station for the relative gravity campaigns. Using two CG-6 gravimeters, the campaigns were conducted at six sites within the catchment area with co-located CRNS installations. In total five relative gravity surveys were carried out from July to October 2023. Each of them consisted of a two-day campaign where each survey point was visited three times by the two gravimeters. In order to ensure a high quality of the gravity data, capable of resolving a signal in the magnitude typical for hydrological processes in the area, a network adjustment of the repeated survey data was carried out. This included device-specific drift estimations. The results are combined with the continuous time series of the gPhone and analyzed jointly in a spatio-temporal approach with CRNS and in-situ soil moisture observations. Temporal dynamics of storage dynamics are assessed and spatial differences between the upland and the lowland areas are analyzed.

How to cite: Sayyadi, S., Rasche, D., Reich, M., Blume, T., and Güntner, A.: Advancing hydrological monitoring: Terrestrial gravimetry surveys in the Selke Catchment, Germany, EGU General Assembly 2024, Vienna, Austria, 14–19 Apr 2024, EGU24-13115, https://doi.org/10.5194/egusphere-egu24-13115, 2024.

EGU24-13600 | Orals | HS8.3.2

A hydrothermal model for unsaturated frozen rocks based on lattice Boltzmann method 

Zheng Wang, Chi Zhang, Yaning Zhang, and Bingxi Li

Frost weathering is considered the primary cause of erosion in periglacial environments. This process is initiated by the freezing of water within rock pores and its subsequent expansion, which generates substantial forces leading to the physical fragmentation and disintegration of the rock structure. To detail the mechanism and predict the patterns of rock fracturing, this study has developed a specialized numerical model. In previous study, researchers typically studied the mechanical failure of rocks via macroscopic numerical methods. However, these methods often face limitations in depicting mesoscale forces, particularly in the context of multiphase flow processes of water migration. Moreover, the influences of various hydrothermal conditions on the mechanical behavior of rocks are frequently overlooked. In this study, a coupled lattice Boltzmann model (LBM) was developed to simulate the freezing process in rocks. The porous structure with complexity and disorder was generated by using a stochastic growth method, and then the Shan-Chen multi-phase model and enthalpy-based phase change model were coupled by introducing a freezing interface force to describe the variation of phase interface. By utilizing the developed model, the ice growth process in rock pores can be well depicted under porous conditions characterized by varying contact angles, porosities, and specific surface areas. Building on this foundation, our work advances the understanding of the complex interaction between thermal dynamics and mechanical processes in periglacial environments, shedding light on the mechanisms of frost weathering and the predictive modeling of rock fracture patterns under varying hydrothermal conditions.

How to cite: Wang, Z., Zhang, C., Zhang, Y., and Li, B.: A hydrothermal model for unsaturated frozen rocks based on lattice Boltzmann method, EGU General Assembly 2024, Vienna, Austria, 14–19 Apr 2024, EGU24-13600, https://doi.org/10.5194/egusphere-egu24-13600, 2024.

The location of dry layer interface (LDI), which varies during soi drying process, is a key parameter for characterizing soil water evaporation process. Recently the heat pulse (HP) technique has been applied to estimate the LDI indirectly. However, errors may occur with the HP method when analytical solutions are used because of soil heterogeneity across the measurement plane, especially when a heterogeneous interface lies between the two probes. In this study, we propose a numerical inversion-based heat pulse method for estimating the LDI under five configurations. The inputs are thermal properties of dry and wet soils, and the temperature rise-by-time curves at two locations from the heat source. The heat source was positioned at different distances from the LDI. The inversion method was evaluated with temperature rise-by-time curves from 17 scenarios obtained from numerical simulation and 14 scenarios obtained from laboratory measurements. Results demonstrated that the new approach produced reasonable LDI estimates within the range of 0.1 to 5 cm to the soil surface, with relative errors (REs) less than 0.30, except for the situation that the LDI was close to the heat source. The proposed method has significant implications in groundwater management and modeling hydrological processes in unsaturated soils.

How to cite: Liu, L., Xie, X., Lu, Y., and Ren, T.: Locating the dry layer interface during soil water evaporation by using numerical inversion-based heat pulse method, EGU General Assembly 2024, Vienna, Austria, 14–19 Apr 2024, EGU24-13980, https://doi.org/10.5194/egusphere-egu24-13980, 2024.

Extensive cropland-to-orchard transition alters water flow and nitrate transport in the vadose zone (VZ) of the Earth’s Critical Zone (CZ), which may impact groundwater recharge and threaten future water quality from intensive nitrogen fertilizer application. Understanding the regional unsaturated water and nitrate fluxes and travel times in the deep VZ is crucial for the sustainable management of the groundwater system. Here, a regional-scale model was developed to estimate the recharge and nitrate transport in the cultivated loess CZ of China’s Guanzhong Plain (CGP), where cropland-to-orchard transition has been extensively promoted in the past few decades. Besides, uncertainties and sensitivities in estimated fluxes of water and nitrate induced by variations in soil hydraulic parameters (SHPs) were evaluated. A comparison between model simulations and observations at 12 sites exhibits good simulation performance. Comparing the measured SHPs, SHPs from Rosetta and Global SHPs products introduced 86.28% and 48.94% uncertainties in the simulation of nitrate leaching fluxes from cropland and orchard, respectively, as well as 44.76% uncertainties in the simulation of groundwater recharge fluxes from the orchard. Application over the CGP based on measured SHPs indicates that the central and eastern CGP were the hotspots for groundwater nitrate contamination. By comparing traditional cropland and orchard scenarios, simulations reveal that cropland-to-orchard transition results in a 39.3-fold increase in nitrate leaching fluxes and a 9.8% decrease in groundwater recharge fluxes. Modeled nitrate travel times through the deep VZ range between decades and centuries under both land use scenarios; however, the cropland-to-orchard transition would extend the time (~22.4 years) it takes for nitrate to reach the aquifer. Although cropland-to-orchard transition delays nitrate transport to the aquifer, the increased nitrate leaching flux will increase the risk of nitrate groundwater pollution, especially in areas with shallow VZs and coarse soil texture. This study provides valuable information for assessing the future vulnerability of groundwater resources under agricultural land use and management changes in the cultivated loess CZ.

How to cite: Niu, L. and Jia, X.: Future Orchard Expansion May Decrease Groundwater Recharge and Increase Nitrate Contamination in An Intensively Cultivated Loess Critical Zone, EGU General Assembly 2024, Vienna, Austria, 14–19 Apr 2024, EGU24-14516, https://doi.org/10.5194/egusphere-egu24-14516, 2024.

EGU24-14811 | ECS | Posters on site | HS8.3.2

Predicting phosphorus loss from structured soils through macropores 

Ping Xin, Charles Pesch, Trine Norgaard, Lis Wollesen Wollesen de Jonge, Maarit Mäenpää, Goswin Heckrath, and Bo Vangsø Iversen

Macropore transport is an important process of phosphorus (P) loss from tile-drained agricultural land to surface waters where P inputs may cause accelerated eutrophication. Many laboratory experiments or plot studies have shown that P loss by macropore transport increases with increasing concentrations of mobilizable P in the topsoil. However, operational models that quantify the risk of P losses by macropore transport based on typically available information on soil properties, including P status and soil hydrological properties, are currently lacking.

This study has collated and analyzed comprehensive existing data from standardized column-leaching experiments with 193 topsoils from different locations in Denmark. In addition to general physical and chemical soil properties including soil P pools, water, and P transport were measured on the large undisturbed soil columns. This data has been used to investigate relationships between P loss and soil properties under varying degrees of macropore transport. Specifically, we have used two statistical methods to analyze relationships between variables and to explore predictive models – multiple linear mixed models (MLMM) and structural equation modeling (SEM). The latter technique allows for testing complex causal relationships among observed and latent variables.

Our SEM approach has so far yielded rather poor model fits, and the model structures for estimating the loss of dissolved and particulate P from the columns were characterized by low significance. This was partly due to missing data. In contrast, different MLMM fitted the measured dissolved and particulate P losses satisfactorily. Water-extractable P and saturated hydraulic conductivity were the most important variables for estimating dissolved P losses, while colloid mobilization in soils and tritium leaching breakthrough time explained particulate P losses to a large degree.

Our initial statistical analyses show that P loss in dissolved and particulate form from large columns under macropore runoff scenarios can be reasonably explained by soil properties that are typically mapped in Denmark. This approach could bridge empirical and mechanistic modeling and facilitate mapping the risk of P loss by macropore transport.

How to cite: Xin, P., Pesch, C., Norgaard, T., Wollesen de Jonge, L. W., Mäenpää, M., Heckrath, G., and Vangsø Iversen, B.: Predicting phosphorus loss from structured soils through macropores, EGU General Assembly 2024, Vienna, Austria, 14–19 Apr 2024, EGU24-14811, https://doi.org/10.5194/egusphere-egu24-14811, 2024.

EGU24-15146 | ECS | Orals | HS8.3.2

Extraction of recharge in variably saturated subsurface flow models 

Chengcheng Gong, Peter Cook, René Therrien, and Philip Brunner

Variably saturated subsurface flow models have been widely used in the context of water resources management as they conceptualize and simulate water flow in the unsaturated and saturated zone. By solving the Richards equation and using infiltration flux as an input, these models do not require groundwater recharge. As the models simulate the infiltration dynamics through the unsaturated zone, recharge is expected to be reliably extracted from such kinds of models. In this study, we explore to what extent variably saturated subsurface flow models can actually be used to extract groundwater recharge. In this context, we implement numerous definitions of groundwater recharge in a simple, variably saturated 1D model, extract groundwater recharge for a wide range of infiltration and groundwater dynamics imposed through boundary conditions, and assess the reliability of the extracted values. The results show that the value of recharge cannot be uniquely obtained from such kinds of models. The problem is attributed to the storage dynamics in the capillary fringe above the water table. However, it is important to keep in mind that if a variably saturated subsurface flow model of a project area is available, extracting recharge is superfluous as the model is capable of representing all the relevant flux and dynamics.  

Keywords: Variably saturated subsurface flow models; Groundwater recharge; unsaturated zone; Water resources management.

Reference: Gong, Chengcheng, Peter G. Cook, René Therrien, Wenke Wang, and Philip Brunner. "On groundwater recharge in variably saturated subsurface flow models." Water Resources Research 59, no. 9 (2023): e2023WR034920.

How to cite: Gong, C., Cook, P., Therrien, R., and Brunner, P.: Extraction of recharge in variably saturated subsurface flow models, EGU General Assembly 2024, Vienna, Austria, 14–19 Apr 2024, EGU24-15146, https://doi.org/10.5194/egusphere-egu24-15146, 2024.

EGU24-16238 | Orals | HS8.3.2

Saturated hydraulic conductivity spatialization strategy to model recharge and hydrogeological transfers on an industrial site in France 

Salohy Nantenaina Andriatahiana, Idrissou Sinabarigui, Nathalie Courtois, Jean-Pierre Vandervaere, and Jean-Martial Cohard

Pollutant transfers in the critical zone is an issue for decades both because of complex physico-chemical interactions in the porous media and because of the emergence of new materials/molecules rejected in the environment for which rules are not ready. The study presented here is part of a research project which aimed to predict transfers and residence time of pollutants in the critical zone including the Unsaturated Zone (UZ), and in aquifers on the CEA Cadarache site (France). This site benefits from a large instrumentation for decades to survey both the water dynamic and quality in the aquifers below the industrial facilities. One of the remaining challenges is to study the distributed recharge in the UZ. In situ measurements of saturated hydraulic conductivity Ks are often time-consuming, but also costly to implement at a catchment scale. To overcome this difficulty, an approach using Pedotransfer Functions (PTFs) is possible in order to spatialize this parameter of the UZ (Nasta et al., 2021; Weihermüller et al., 2021). The main objective of the study is to evaluate a spatialization strategy of Ks values using PTFs calibrated from an intensive in situ measurement campaign.

A total of 48 measurement points were selected on the study site, covering an area of around 900 hectares. The points were chosen to represent the different types of geological formations at the outcrop as well as the different types of land cover on the site. For all those locations, in situ hydraulic conductivity measurements were carried out with a disc infiltrometer, using the multi-potential method (Vandervaere, 1995), together with physico-chemical analyses of the surface soils. The results obtained show that for most of the measurement points, a fairly clear break in the slope of the exponential function K(h) appears for potentials h around -30 / -20 mm. The estimate of the value of Ks is chosen as being the value of K(h) obtained for the last value of potential h = - 5 mm, considering that saturation has been reached. On site, Ks varies from 20 to 410 mm/h.

Several PTFs for estimating Ks were selected (Rawls & Brakensiek, 1985, Wösten et al., 1999, Weynants et al., 2009, Szabó et al., 2021, Rosetta (Schaap et al., 2001; Zhang & Schaap, 2017)). The study will help us to identify some geological or land cover drivers for Ks ranges and to select which PTFs are able to represent such a variability.

How to cite: Andriatahiana, S. N., Sinabarigui, I., Courtois, N., Vandervaere, J.-P., and Cohard, J.-M.: Saturated hydraulic conductivity spatialization strategy to model recharge and hydrogeological transfers on an industrial site in France, EGU General Assembly 2024, Vienna, Austria, 14–19 Apr 2024, EGU24-16238, https://doi.org/10.5194/egusphere-egu24-16238, 2024.

The modeling of the coupled thermo-hydro-mechanical processes within a soil undergoing freeze-thaw cycles is an increasingly relevant problem in the era of accelerating climate change. One can hope to alleviate and prepare for infrastructure damages due to e.g., frost heave and frost quakes by modeling the interplay of hydrology and soil mechanics and identifying at-risk structures and environmental profiles (i.e. temperature gradient, snow cover, soil water/ice saturation) that make those structures susceptible to said damages.

Our work is focused on developing a linked computational framework for thermo-hydro-mechanical modeling of soils. We achieve this currently by linking the state-of-the-art thermo-hydrological modeling of Amanzi-ATS with the thermo-mechanical modeling capabilities of OpenGeoSys, allowing us to have an accurate understanding of both the intricate hydrology of freezing soils as well as being able to determine the stress and pressure fields within the system. This framework is then to be applied to understand the mechanics and triggering circumstances at the frost quake site at Talvikangas in Oulu, Finland as well as developing a risk-assessment tool for damages to infrastructure and built environment.

How to cite: Remes, J. and Okkonen, J.: Modeling mechanical stress in freezing soils: sub-Arctic infrastructure, built environment and frost quakes, EGU General Assembly 2024, Vienna, Austria, 14–19 Apr 2024, EGU24-16485, https://doi.org/10.5194/egusphere-egu24-16485, 2024.

EGU24-17257 | ECS | Posters on site | HS8.3.2

Groundwater recharge estimates in agriculturally managed site in Northeast Germany: combining Cosmic ray neutron sensing and soil hydrological modelling 

Lena M. Scheiffele, Katya Dimitrova Petrova, Maik Heistermann, and Sascha E. Oswald

Brandenburg is among the driest regions in Germany, and heavily relies on groundwater resources for both agricultural and drinking water supply. Already suffering from declining groundwater tables, climate change is expected to exacerbate the situation. For a sustainable management of groundwater resources, the rate of groundwater recharge (GWR) is a key variable. Yet, its quantification remains a challenge, as it cannot be measured directly at the field scale

One way to estimate GWR is using vadose zone models to simulate the local water balance and the vertical percolation of water towards the groundwater. Observations of soil moisture (SM) in the root zone can provide a means to calibrate such models so that they can adequately represent the local water balance. However, conventional point-scale SM observations notoriously suffer from a lack of horizontal and vertical representativeness, compromising the validity of the calibration.

In this study, we explore the potential of cosmic-ray neutron sensors (CRNS) to address this issue. CRNS allow for non-invasive SM monitoring of the shallow root zone at the hectare-scale. We use daily CRNS-based soil moisture estimates to calibrate the vadose zone model HYDRUS-1D, and hence to derive daily estimates of the downward water fluxes below the root-zone, as an approximation of GWR.

For this purpose, we explore a unique dataset that was obtained in a research site near Potsdam, Brandenburg, over a period of more than three years. The site features a diversity of agricultural plots, and sits on a gentle hillslope over a glacial till aquifer, with the groundwater table at depths between 1 to 10 m. In an area of around 10 ha, we operated eight CRNS sensors and 27 SM profile probes, complemented by measurements of soil texture and soil hydraulic properties, among others.

In various simulation experiments, we evaluate the added value of using CRNS-based soil moisture estimates for model calibration, as a replacement or as a supplement of conventional profile probes. Based on a calibrated model, we also assess long-term (centennial) changes of GWR.

How to cite: Scheiffele, L. M., Dimitrova Petrova, K., Heistermann, M., and Oswald, S. E.: Groundwater recharge estimates in agriculturally managed site in Northeast Germany: combining Cosmic ray neutron sensing and soil hydrological modelling, EGU General Assembly 2024, Vienna, Austria, 14–19 Apr 2024, EGU24-17257, https://doi.org/10.5194/egusphere-egu24-17257, 2024.

EGU24-18554 | ECS | Orals | HS8.3.2

Can 3-D X-Ray tomography imaging improve the estimation of saturated hydraulic conductivity of soils? 

Einar Emil Låker, Attila Nemes, and Daniel Hirmas

Saturated hydraulic conductivity (Ksat) is one of the most fundamental parameters in soil hydrology. It governs the rate of saturated flow through porous media and functions as a scaling factor for unsaturated flow. Knowledge of Ksat is key to understanding the movement of water in soils, transport and recharge of groundwater, suspended and dissolved transport in soils, and soil-air water exchange. In hydrology and climate modeling Ksat is often estimated through pedotransfer functions. A large effort has been committed to the development of these models, using an array of differing algorithms and methods. However, estimating Ksat has been somewhat troublesome, since the commonly measured soil properties, such as soil texture, bulk density and organic matter content, used as predictor variables in PTFs do not explain Ksat variation well. Instead, Ksat is largely controlled by pore-network characteristics especially in highly-structured soils. Using an extended, methodologically homogeneous dataset of commonly measured soil physical properties, 3-D X-ray computed tomography imaged pore-network parameters, and quasi-continuous particle-size measurements using the Integral Suspension Pressure method, we assess the benefits of using combined soil textural and structural information on the estimation of Ksat. Using this dataset, we have built models that estimate Ksat using a boosted random forest algorithm (XGboost) and used explanatory model analysis to tune and evaluate the models. Three input data scenarios included (i) basic soil inputs only (ii) imaged pore metrics only, and (iii) their combination. Using or adding imaged pore metrics as inputs greatly improved the Ksat estimations that were reflected, for example, by the respective coefficients of determination, evaluated using a cross-validation scheme (R2 = -0.05/0.60/0.58 for the three input scenarios respectively). 3-D imaging of soil and the subsequent characterization of its pore-space may serve multiple research purposes, but such data are still not routinely collected due to cost of measurement and general lack of access to equipment. Our study confirms, however, that when collecting such metrics will become economically feasible through e.g. better automation of image processing using tools like SoilJ, having those metrics will show great potential towards improving the estimation of the soil’s water transport properties. 

How to cite: Låker, E. E., Nemes, A., and Hirmas, D.: Can 3-D X-Ray tomography imaging improve the estimation of saturated hydraulic conductivity of soils?, EGU General Assembly 2024, Vienna, Austria, 14–19 Apr 2024, EGU24-18554, https://doi.org/10.5194/egusphere-egu24-18554, 2024.

Soil moisture is an important state variable with high spatiotemporal variability depending on land and climate variables. The importance of various physical controls on soil moisture varies depending on the scale and extent of the study. At a fine scale, soil properties are proven to be critical in defining spatiotemporal variability of soil moisture. In the context of agricultural applications in India, soil moisture estimates at the farm scale (finer spatial resolution) over various root depths are essential.  Traditional Land Surface Models (LSMs) are limited to large spatial scales (in the order of tens of kilometers). They have been designed for synergistic coupling with Earth system models. Besides, they do not account for the vertical heterogeneity of soil. LSMs, including Noah-MP, use a lookup table to obtain soil properties corresponding to soil texture while assuming vertically homogeneous soil texture. Recent studies proved that accounting for vertical heterogeneity in the soil using state-of-art soil maps and pedotransfer functions in LSM can significantly improve the surface soil moisture estimations. However, the effects of incorporating vertical heterogeneity in soil properties on deeper layer soil moisture simulations are yet to be explored. Considering the importance of farm scale root water uptake processes, understanding soil moisture heterogeneity at deeper layers is essential. In this context, the present study hypothesizes that a hyperresolution LSM, which accounts for subgrid spatial heterogeneity while maintaining soil heterogeneity between layers, can improve the characterization of rootzone soil moisture. 

In this work, we used HydroBlocks, a semi-distributed hyper-resolution LSM, which uses Noah-MP at its core, and the concept of Hydrologic Response Units (HRU) to simulate the land surface variables. The analysis is carried out for the first time in India over the Upper Bhima Basin, for the year 2020. Initially, we investigated the benefit of vertical heterogeneity in soil properties to simulate soil moisture at five different layers till one meter deep using HydroBlocks. We used SoilGrids data for different layers to calculate soil hydraulic properties using PTFs and feed them as inputs in the HydroBlocks model. We compare HydroBlocks surface and rootzone soil moisture to existing reanalysis and satellite products, including GLEAM, ERA5-Land, SMAP-L3, and SMAP L4 statistically in terms of bias, ubRMSE and R2. Further, an intercomparison of surface and rootzone soil moisture simulations is made between the two cases of Hydroblocks model, first with vertically homogeneous soil properties, and second, with vertically heterogeneous soil properties. The objective of this step is to emphasize the role of vertically heterogeneous soil layers in a hyper-resolution LSM towards addressing the spatiotemporal variability of soil moisture. Finally, a soil parameter sensitivity analysis (using Sobol technique) is carried out using HydroBlocks for five soil layers (up to 1 meter depth), for the first time, to assess the influence of eight soil textural parameters such as wilting point, porosity, pose size distribution, and likewise, on soil moisture simulations. In this process, we also assessed the seasonal variability of parameter sensitivity.

How to cite: U Krishnan, V., Vergopolan, N., Jayaluxmi, I., and Lanka, K.: Examining the benefits and sensitivity of vertically heterogeneous hyper resolution land surface model towards simulating a farm scale soil moisture profile in Upper Bhima Basin, India, EGU General Assembly 2024, Vienna, Austria, 14–19 Apr 2024, EGU24-18945, https://doi.org/10.5194/egusphere-egu24-18945, 2024.

EGU24-19388 | ECS | Posters on site | HS8.3.2

Modeling the impact of stone content on the shape of water retention curve 

Anne Doat, Caroline Vincke, and Mathieu Javaux

Heterogeneous soils with stone fractions are very common in non-agricultural areas. The characterization of their hydraulic properties is important but face technical challenges. Therefore, the retention of the stony fraction (larger than 2 mm) is often considered as null. However, when soil stone content is large (>15%), even a slight change of water with suction in the stone fraction will affect the shape of the bulk soil retention curve.

In this study, we analyzed the retention data, between pF 0 and pF 4.2, of more than 2400 aggregates extracted from 48 soil horizons in forests down to 2-m depth. For each horizon, at each suction level, we characterized water content and stone content of at least 8 replicates of aggregates. We propose a novel methodology to extract and separate the hydraulic properties of the stony and of the fine fractions from these data. It proved to be efficient beyond 15% of stone content.

In general, the change of volumetric water content between pF 2 and pF 4.2 was below 5% for stones but for some of them, it could reach up to 15%.  In addition, we could propose a general expression of the bulk retention curve that explicitly contains the fraction of stones. It is observed that the shape of the bulk retention curve (mono or bimodal) evolves with stone content for a given horizon.

How to cite: Doat, A., Vincke, C., and Javaux, M.: Modeling the impact of stone content on the shape of water retention curve, EGU General Assembly 2024, Vienna, Austria, 14–19 Apr 2024, EGU24-19388, https://doi.org/10.5194/egusphere-egu24-19388, 2024.

EGU24-19703 | Orals | HS8.3.2

Infiltration as dynamic non-uniform stochastic flow field – repeatable, high-resolution 4D GPR measurements at the plot scale 

Conrad Jackisch, Sophie Marie Stephan, Jens Tronicke, and Niklas Allroggen

Infiltration is a central concern in soil physics. The advective and diffusive redistribution of event water depends on various factors such as initial wetting, the establishment of film connectivity, and capillary gradients and hydraulic conductivity. Non-uniform infiltration patterns are prevalent. However, direct infiltration measurements do not account for this reality and tracer experiments require a destruction of the experimental plot. We developed a data acquisition strategy based on time-lapse 3D ground-penetrating radar (GPR) to monitor fast and small-scale subsurface flow processes during irrigation in a non-invasive manner.

The technique combines an irrigation pad (1 m2 drip irrigation to simulate moderate, non-erosive rain events) with a GPR measurement platform (manually driven two-channel GPR antenna array with positioning guides). We will present a systematic field experiment consisting of two recurrent irrigations (40 mm/2 h, 1 irrigation per day) and a respective replicate. For evaluation, the GPR measurements were sidelined with soil moisture measurements (TDR profile) and tracer applications (dye and salt). Our data show that the achieved high resolution of less than 5 cm in space and 10 minutes in time makes it possible to monitor and quantify infiltration processes in their spatial and temporal non-uniformity.

The experiment supports the hypothesis from earlier experiments at various sites: Non-uniform infiltration patterns and dynamically connected flow-fields are highly heterogeneous but share stochastic features, such as distribution, randomness, and skewness. Our approach opens new options for repeated, spatially resolved infiltration measurements and theory development for soil hydrology and land surface models.

How to cite: Jackisch, C., Stephan, S. M., Tronicke, J., and Allroggen, N.: Infiltration as dynamic non-uniform stochastic flow field – repeatable, high-resolution 4D GPR measurements at the plot scale, EGU General Assembly 2024, Vienna, Austria, 14–19 Apr 2024, EGU24-19703, https://doi.org/10.5194/egusphere-egu24-19703, 2024.

EGU24-19745 | ECS | Posters on site | HS8.3.2

pySWAP: Python wrapper for SWAP hydrological model 

Mateusz Zawadzki

The Soil-Water-Atmosphere-Plant (SWAP) model has been continuously developed since 1974 and has gained a community of users. The need for clearer and more reproducible model development and interpretation drove the development of wrapper packages in R, such as SWAPTools and RSWAP. Due to the steady increase in the community of Python users, it became important to provide similar interface tools written in Python. This work introduces the pySWAP Python package, developed as a wrapper for the SWAP model.

A key feature of pySWAP is its user-friendly, object-oriented design. Users provide the essential model setup, for example, in the form of a Jupyter notebook, and the package creates the input files while preemptively checking for errors. This ensures a smooth setup and execution process, significantly reducing common user errors and streamlining the model setup. This is especially beneficial for those new to SWAP, who can easily access documentation through their Integrated Development Environments (IDEs). The package also runs the model, captures the results, and provides tools for simple data visualization.

pySWAP also aims to optimize work with multiple scenarios and the parameter estimation process. This is achieved through the integration of a SQLite database, which stores data from intermediate simulations. This method not only reduces file storage requirements but also enhances the efficiency of data retrieval and manipulation during and after simulation runs. The use of open-source SQLite is also beneficial for sharing models between users, as it can efficiently store input and output data of multiple models in a single file, accessible on all operating systems. Furthermore, we are in the process of developing a Dockerized version of PySWAP, which may further improve collaboration on models and allow users to effortlessly deploy and execute simulations developed on local machines on supercomputers.

As a proof-of-concept, we use pySWAP in the Grow project to develop a SWAP model for a pilot site in Kinrooi, East Belgium, where treated wastewater is reused through a subirrigation system.

How to cite: Zawadzki, M.: pySWAP: Python wrapper for SWAP hydrological model, EGU General Assembly 2024, Vienna, Austria, 14–19 Apr 2024, EGU24-19745, https://doi.org/10.5194/egusphere-egu24-19745, 2024.

Hydraulic Conductivity and Water Retention Functions of Porous Rock and Glacial Till Soil: Quasi-Steady Centrifuge versus Evaporation Methods

Maria Clementina Caputo1, Lorenzo De Carlo1, Antonietta Celeste Turturro1, Horst Herbert Gerke2

1CNR National Research Council, IRSA Water Research Institute, via Francesco De Blasio 5, 70132 Bari, Italy

2Research Area 1 “Landscape Functioning”, Leibniz-Centre for Agricultural Landscape Research (ZALF), Eberswalder Straße 84, D-15374 Müncheberg, Germany


Experimental laboratory measurements of the hydraulic conductivity and the water retention functions have a crucial role in describing the solid matrix-water dynamics. However, the direct determination of the hydraulic conductivity, K, as a function of the pressure head, h, is still difficult.  It is often estimated indirectly from the water retention curve, which relates the water content, θ, to h, or obtained by using pedotransfer functions or by field data of  pumping tests.

In this study the unsaturated hydraulic conductivity values of carbonate porous rocks and soil clods were measured by means of evaporation, Quasi-Steady Centrifuge (QSC) and double-membrane steady-through flow methods. Water retention curves were obtained by using the evaporation, QSC, suction table, Mercury Intrusion Porosimetry (MIP) and pressure chambers methods. Samples belonging to two rock lithotypes collected in southern Italy and to two soil clods coming from northeastern Germany were tested. The data were fitted to the unimodal and bimodal functions of van Genuchten and the Peters-Durner-Iden models by using the LABROS SoilView Analysis software. The bimodal functions better described the experimental data of both the studied rocks and soils.

The soil compaction during the centrifuge runs performed by applying the QSC method, corroborated by changed values of bulk density, porosity, tortuosity, and pore connectivity after the runs, confirms that this method is not suitable to non-rigid media.

The results confirm that the QSC method allows measuring the unsaturated hydraulic conductivity values for rock samples. The larger range of experimental hydraulic conductivity values helps to improve the fitting and obtain the more accurate of the hydraulic conductivity function to better describe the unsaturated rock-soil-water dynamics.

How to cite: Caputo, M. C.: Hydraulic Conductivity and Water Retention Functions of Porous Rock and Glacial Till Soil: Quasi-Steady Centrifuge versus Evaporation Methods, EGU General Assembly 2024, Vienna, Austria, 14–19 Apr 2024, EGU24-20473, https://doi.org/10.5194/egusphere-egu24-20473, 2024.

EGU24-20755 | Posters on site | HS8.3.2

An Integrated Approach for Estimation and Uncertainty Analysis of Soil Pore Electrical Conductivity 

Jose A Sanchez-Espigares, Basem Aljoumani, and Birgit Kleinschmit

This study proposes an integrated methodology to advance the estimation and uncertainty analysis of soil pore electrical conductivity. Drawing on previous work from Aljoumani et al. (2015), where modifications were made to the Hilhorst model, and subsequent enhancements in Aljoumani et al. (2018), this research unfolds in a systematic manner.

Commencing with a comprehensive examination of critical data from the Aljoumani el al.(2015) study, including bulk electrical conductivity, soil permittivity, and pore water permittivity, we transition into the construction of an improved Hilhorst model. This advanced model convert the deterministic Hilhorst model to stochastic model incorporates linear dynamic modeling and the Kalman filter, enabling precise estimation of soil salinity (pore electrical conductivity) and determination of corresponding offsets.

To address uncertainty comprehensively, we employ a multifaceted strategy. Beginning with the modeling of relationships using the Long Short-Term Memory (LSTM) algorithm, an artificial recurrent neural network, we intricately examine the interplay between the original time series of soil permittivity, pore water permittivity, and bulk electrical conductivity.

Subsequently, we utilize bootstrapping to generate 1000 series for soil permittivity and pore water permittivity. The LSTM model then produces 1000 series of bulk electrical conductivity, using the generated soil and pore water permittivity series as input.

Applying the modified Hilhorst model to the 1000 series obtained from bootstrapping and the LSTM model, we obtain 1000 models, each providing 1000 offsets and predicted pore water electrical conductivity series. Returning to the original data, the modified model is applied to construct predicted series of pore electrical conductivity. Upper and lower bounds are established using the calculated 5th and 95th percentiles of the 1000 offset values from the generated data.

In summary, this integrated methodology not only ensures accurate estimations of soil pore electrical conductivity but also provides a robust framework for quantifying uncertainty comprehensively.

How to cite: Sanchez-Espigares, J. A., Aljoumani, B., and Kleinschmit, B.: An Integrated Approach for Estimation and Uncertainty Analysis of Soil Pore Electrical Conductivity, EGU General Assembly 2024, Vienna, Austria, 14–19 Apr 2024, EGU24-20755, https://doi.org/10.5194/egusphere-egu24-20755, 2024.

EGU24-21584 | ECS | Orals | HS8.3.2

Design of a spatially differentiated water balance modelling tool 

Frederik Graaf, Michael Bock, Olaf Conrad, and Robin Sur

Existing water balance assessments may lack precision due to overlooking the spatial variations in factors such as soil and topography while transferring the results from point modelling to a wider area. In cooperation with Bayer AG Crop Science Division and Hamburg University, within the DREAM (Digital Run-off Exposure Assessment and Management) project, a model is being developed which is temporally dynamic as well as spatially differentiated to provide a more nuanced and location-specific understanding of quantitative water dynamics. It is based on high resolution grid data and features a multi-layered soil water model, the goal of which is to depict volumes of water in different soil layers. It is to be employed in an agricultural context and serve as a toolbox of possible runoff reduction measures for plant protection products.

Since risk management is a highly localized undertaking, the model operates at a field- or sub-field-level with a spatial resolution of up to one meter. The temporal resolution of simulation steps is variable; from one hour to a day. The necessary input data – that being a digital terrain model, information about the vegetation as well as soil and weather data – create conditions specific to the site.

It is embedded in the open source geoinformation system (GIS) SAGA. The modular approach allows for flexible development and changes on short notice. The model includes an algorithm that determines soil water movement, incorporating the groundwater layer as the model’s lower boundary. To achieve this, an expanded bucket model for soil water movement, based on the works of Glugla, is used. Should the infiltration capacity of the soil - calculated via the Green-Ampt-Method - be surpassed, runoff occurs. In this case, the model possesses the ability to depict runoff and its flow paths through the terrain, along with the respective volumes and flow velocity based on Gauckler-Manning-Strickler.

While the current focus lies on the movement of water, the model is designed for gradual expansion and improvement, allowing for future considerations such as the tracking of solutes moving into larger depths or even into groundwater.

How to cite: Graaf, F., Bock, M., Conrad, O., and Sur, R.: Design of a spatially differentiated water balance modelling tool, EGU General Assembly 2024, Vienna, Austria, 14–19 Apr 2024, EGU24-21584, https://doi.org/10.5194/egusphere-egu24-21584, 2024.

EGU24-22326 | Orals | HS8.3.2

Soil management using lignite to improve soil cracking properties and performance 

Nima Baghbani, Franziska Bucka, and Thomas Baumgartl

Incorporating Victorian brown coal (VBC) into the soil as a reliable amendment can markedly alter the hydraulic properties of the soil. A pivotal phenomenon influencing soil hydraulic parameters, particularly the soil permeability coefficient, is the extent of cracking and shrinkage observed during the drying process and consequent moisture loss. This study investigates the impact of incorporating VBC into clay and its influence on the two-dimensional cracking and shrinkage characteristics of the mixture. Various mixtures of brown coal from Latrobe valley in Victoria, Australia and clay, ranging from 2% to 20% brown coal content, were prepared and subjected to liquid limit and plastic limit tests. The samples were then readied for cracking and shrinkage assessments under liquid limit moisture conditions as an initial moisture content, featuring a sample diameter of 150 mm and a thickness of 10 mm. Results from the liquid limit tests demonstrated a decreasing trend in the liquid limit of the mixture with increasing brown coal content, registering values of 38.3%, 37.4%, 36.5%, 34.9%, and 32.9% for 0%, 2%, 5%, 10%, and 20% brown coal mixtures, respectively. Plastic limit tests indicated a 1.7% reduction, decreasing from 20.6% to 18%.9, with the addition of 20% brown coal. Furthermore, cracking and shrinkage tests revealed a substantial reduction in the cracking index (cracking intensity factor, CIF) of the mixture upon the addition of brown coal, reaching zero for mixtures containing 5%, 10%, and 20% brown coal after exposure to a 45℃ temperature for 30 hours. Additionally, the shrinkage index (shrinkage intensity factor, SIF) decreased from 15.4% for the clay soil sample to 14.9%, 14.6%, 13.9%, and 13.1% for the 2%, 5%, 10%, and 20% brown coal mixtures, respectively. This underscores the positive influence of brown coal on mitigating soil cracking and shrinkage, emphasizing its significance in soil science research.

How to cite: Baghbani, N., Bucka, F., and Baumgartl, T.: Soil management using lignite to improve soil cracking properties and performance, EGU General Assembly 2024, Vienna, Austria, 14–19 Apr 2024, EGU24-22326, https://doi.org/10.5194/egusphere-egu24-22326, 2024.

EGU24-978 | ECS | Orals | HS8.3.3

What impacts the soil moisture dynamics in the near-natural beech forest? 

Alina Azekenova, Karl-Heinz Feger, and Stefan Julich

Soil moisture in forested regions displays considerable spatial and temporal variability within the soil-plant interaction. The high frequency of drying and wetting cycles exacerbates the uncertainty in this already complex relationship. Recent studies in forest hydrology have frequently postulated that soil physical properties and precipitation partitioning induce soil water content (SWC) variability. However, in-situ evidence for this linkage is scarce. To support the notion of SWC patterns corresponding to these two elements, a transect-based method was utilised. It clarifies the variation in soil moisture on a small scale and facilitates the identification of specific patterns with the distance from the tree stem. An intensive monitoring of SWC (52 profiles) and precipitation, including throughfall and stemflow, has been carried out in the near-natural beech forest in north-eastern Germany since 2022. It covers three study sites that are stocked over a terminal moraine and are classified as wet, intermediate and dry on the basis of the soil moisture gradient. The result stipulates increase of the SWC away from the stem during drying cycles at the dry study site. However, this appears to be the reverse for the wet site. During the wetting phase, soil moisture at intermediate and dry sites exhibited homogeneous variation, although the wet site experienced an increase in soil moisture by stem distance. Therefore, uncovering the distance from stem, root density distribution and canopy structure as possible controlling factors.  It is concluded, that within soil-plant interaction both soil physics and precipitation define the patterns of soil moisture variation during wetting cycles. Conversely, soil retention characteristics mainly anticipate water fluxes in the soil during drying periods.

How to cite: Azekenova, A., Feger, K.-H., and Julich, S.: What impacts the soil moisture dynamics in the near-natural beech forest?, EGU General Assembly 2024, Vienna, Austria, 14–19 Apr 2024, EGU24-978, https://doi.org/10.5194/egusphere-egu24-978, 2024.

EGU24-1452 | ECS | Orals | HS8.3.3

The biomechanics of path of least resistance of roots in heterogeneous substrates 

Jiaojiao Yao, Jonathan Barès, Evelyne Kolb, and Lionel Dupuy

Rooting depth is critical for plants to acquire water and nutrient efficiently. However, when progressing deeper into the soil, a growing root must overcome physical obstacles such as stones and zones with different mechanical impedance (like hard pans and aggregates) which results in tortuous trajectories and a reduced ability to reach deeper soil horizons. We have developed different model systems which consists of roots growing in artificial substrates made of a customized arrays of stiff or deformable obstacles which the root can either bypass or penetrate based on the resistance of the obstacle. High-throughput imaging systems were used to capture time lapse data and image analysis techniques were used to track root responses to obstacles. In the presence of rigid obstacles, only a limited number of growth responses were observed with a transition from vertical to oblique trajectories observed as a function of size and distance between physical obstacles. When obstacles were deformable the likelihood of penetration could be predicted from factors such as the incidence angle, the length of the root that can bend freely, and the degree to which previous obstacles compress and anchor its base. Overall, our results showed that primary root growth in heterogeneous substrates is largely deterministic and can be predicted from the maximum curvature a root can bend, the spatial arrangements of obstacles and the mechanical stress anchoring the base of the root.

Keywords: root, soil, mechanical impedance, heterogeneity, biomechanics

How to cite: Yao, J., Barès, J., Kolb, E., and Dupuy, L.: The biomechanics of path of least resistance of roots in heterogeneous substrates, EGU General Assembly 2024, Vienna, Austria, 14–19 Apr 2024, EGU24-1452, https://doi.org/10.5194/egusphere-egu24-1452, 2024.

EGU24-2130 | ECS | Posters on site | HS8.3.3

The relationship between volatile organic compounds and apple replant disease 

Anne-Sophie Wachter, Alain Tissier, Esther Armah Harding, and Doris Vetterlein

Apple replant disease (ARD) refers to the observed decline in plant growth, fruit yield, and quality after repeated planting of apples at the same site. It is a phenomenon in all apple-producing areas worldwide which leads to an estimated profitability reduction of 50 % over the lifetime of an apple orchard. Up to now, the mechanisms behind ARD are only poorly understood. It has been attributed to the action of a site-specific, multi-kingdom, pathogenic, and parasitic biological complex. Thus, the soil faces (micro-) biome alterations due to previous apple cultures.

Upon initial contact, apple roots can detect and avoid soil affected by ARD. So far, it is not known how the roots can sense ARD in soil. Volatile organic compounds (VOCs) are promising candidates as communicators between soil and plant. It is known that VOCs mediate many cases of plant responses to pests or pathogens. Nevertheless, their role in ARD has so far been neglected.

A rhizobox experiment was set up to determine the volatile emission of apple plantlets growing in ARD and non-ARD soil. Volatiles are analyzed using untargeted gas chromatography-mass spectrometry with prior concentration on an adsorbents (here: stir bar sorptive extraction, SBSE) and thermodesorption.

This first pre-experiment run with the interpretation of the gas chromatogram as the next step. Our aim is to determine whether there are any differences between the volatiles detected in the close proximity of apple roots growing in ARD and in non-ARD soil. Noticeable VOCs will be identified to specify the occurring volatile profiles.

We will examine the potential role of VOCs as communicators between plants, the microbiome, and soil. It will be addressed whether the sensing of ARD is related to volatile production.

How to cite: Wachter, A.-S., Tissier, A., Harding, E. A., and Vetterlein, D.: The relationship between volatile organic compounds and apple replant disease, EGU General Assembly 2024, Vienna, Austria, 14–19 Apr 2024, EGU24-2130, https://doi.org/10.5194/egusphere-egu24-2130, 2024.

EGU24-3544 | ECS | Posters on site | HS8.3.3

Sorghum water use efficiency and yield variations discerned by 13C isotopic technique under managed agricultural practices in Upper Eastern Kenya 

Jane Omenda, Milka Kiboi, Felix Ngetich, Gerd Dercon, Monicah Mucheru-Muna, Jayne Mugwe, Said Ahmed Hami, Fabian Kaburu, Samuel Nii Akai Nettey, Daniel Mugendi, Roel Merckx, and Jan Diels

Current knowledge on using 13C discrimination as an indirect measure of yield and water use efficiency (WUE) under different soil moisture conditions and soil fertility inputs in C4 crop species has considerable uncertainty. The objective of this study was to test for (i) the effect of selected soil water conservation measures and soil fertility inputs on sorghum yield, water use efficiency, and 13C discrimination, (ii) evaluate the relationship between various measures of water use efficiency and 13C discrimination, between sorghum yield and 13C discrimination; (iii) sorghum stem diameter and WUE and, the use of stem diameter and 13C discrimination as potential yield and WUE proxy. We implemented a field trial on-station for five seasons in the semi-arid areas of Upper Eastern Kenya. The experiment was designed in a randomized complete block design (RCBD) with three levels of nitrogen fertilization (120 kg ha−1, 60 kg ha−1, and 30 kg ha−1) application with four replications. The selected soil water conservation measures and soil fertility management were minimum tillage, mulching, tied ridging, and Managing Beneficial Interactions in Legume Intercrops (MBILI) along a control (no input). Water use efficiency was determined using carbon discrimination analysis and gravimetric technique. The leaves and post-harvest grain samples were analyzed for %N, %C, and δ13C on an Isotope Ratio Mass Spectrometer (IRMS). A clear and significant (p≤ 0.05) treatment effect was observed on the 13C isotopic discrimination and sorghum yield and growth attributes over the five seasons. The highest (4.85 Mg ha-1) grain yield was observed with minimum tillage with crop residue treatment. The δ13C values ranged from -13.14to -11.86‰for the sorghum grain. Treatments under minimum tillage with residue and tied ridges and the MBILI intercrop had significantly (p≤ 0.05) higher sorghum grain yield, WUE, stem diameter, chlorophyll content, and high δ13C values. The 13C discrimination was significantly (p≤ 0.05) associated with yield, WUE, stem diameter, and leaf chlorophyll. In the treatment with high N rate, the equation relating 13C discrimination to yield was Yield (Mg ha-1) = 1.4822δ13C + 20.879; R² = 0.3518. A significant positive relationship (R2 = 0.31) was observed between grain N fertilizer use efficiency and grain δ13C in sorghum harvested from plots with high N rate treatments. There was also a correlation (R2 = 0.341; p=0.001) between WUE and sorghum stem diameter. Based on these results, we conclude that grain 13C discrimination values at maturity and stem diameter are a potential complementary criterion for assessing sorghum yield performance and WUE under different soil moisture and nutrient availability conditions. Therefore, it can be deduced that minimum tillage with crop residue with a high fertilizer application rate (120N/ha) improves sorghum grain yield, WUE, and higher grain δ13C values. The high grain δ13C values observed with minimum tillage with crop residue over the five seasons indicate that plants suffered less water stress under minimum tillage with crop residue treatment. Therefore, grain δ13C discrimination and stem diameter can be used as water use efficiency proxy with C4 crops like sorghum.

How to cite: Omenda, J., Kiboi, M., Ngetich, F., Dercon, G., Mucheru-Muna, M., Mugwe, J., Hami, S. A., Kaburu, F., Nettey, S. N. A., Mugendi, D., Merckx, R., and Diels, J.: Sorghum water use efficiency and yield variations discerned by 13C isotopic technique under managed agricultural practices in Upper Eastern Kenya, EGU General Assembly 2024, Vienna, Austria, 14–19 Apr 2024, EGU24-3544, https://doi.org/10.5194/egusphere-egu24-3544, 2024.

EGU24-3773 | ECS | Orals | HS8.3.3

Individual versus combined effects of drought, warming and eCO2 on grassland water uptake and fine roots 

Maud Tissink, Jesse Radolinski, David Reinthaler, Sarah Venier, Erich M. Pötsch, Andreas Schaumberger, and Michael Bahn

In a changing climate, grasslands are expected to experience major shifts in water supply and demand. To date, little is known about how projected future conditions of severe drought, climate warming, and rising CO2 affect grassland water uptake, and whether adaptations of fine roots affect the capacity to extract water from soil. Using a multifactor global-change experiment in a managed montane C3 grassland, we studied the individual and combined effects of drought, warming (+3 ℃), and elevated CO2 (eCO2; +300 ppm) on root water uptake (RWU) over three growing seasons. RWU was assessed across different layers of the main rooting horizon using diel soil moisture dynamics during non-rain periods. We also investigated treatment effects on fine roots (production, traits), fine-root-to-shoot ratios, and consequences for RWU capacity. By increasing vapour pressure deficit (VPD) and its effect on RWU rates normalized to soil water content (RWUSWC), warming reduced RWU during hot periods. Under sustained warming, grassland decreased specific root length, and increased root diameters and fine-root-to-shoot ratios. Conversely, eCO2 slowed RWUSWC at high VPD, though fine-root adaptations were negligible. Compared to warming alone, future conditions (warming, eCO2) increased RWUSWC to a lesser extent and induced no fine-root adaptations, but reduced RWU to a similar degree. Drought reduced RWU (-66–75%) and increased water sourcing from deeper soil layers; however, a hot season amplified any RWU reductions under future conditions by 20%. Altogether, our study demonstrates that (i) RWU in C3 grasslands declines in a warmer, drier future, though (ii) eCO2 will mitigate the need for fine-root adaptations, maintaining RWU capacity. However, (iii) rising temperatures will exacerbate RWU reductions under drought. Therefore, hot droughts should have significant repercussions for water dynamics in C3 grasslands.

How to cite: Tissink, M., Radolinski, J., Reinthaler, D., Venier, S., Pötsch, E. M., Schaumberger, A., and Bahn, M.: Individual versus combined effects of drought, warming and eCO2 on grassland water uptake and fine roots, EGU General Assembly 2024, Vienna, Austria, 14–19 Apr 2024, EGU24-3773, https://doi.org/10.5194/egusphere-egu24-3773, 2024.

EGU24-5513 | Posters on site | HS8.3.3

Effect of adaptive rootzone development in quantitative land evaluation studies 

Martin Mulder, Marius Heinen, and Mirjam Hack-ten Broeke

For quantitative land evaluation studies often simulation models are used to determine differences between soil types in terms of water availability (actual transpiration) or crop productivity. In the Netherlands we developed a land evaluation system specifically for water authorities, provinces and drinking water companies. The system allows answering questions on how water management influences crop development due to too dry or too wet conditions in the unsaturated zone. This system is based on the linked simulation model SWAP (Soil-Water-Atmosphere-Plant) and WOFOST (WOrld FOod STudies). The impact of changes in climate or hydrology can then be studied in terms of effects on crop growth and farm income.

Although SWAP and WOFOST are process based models, the rootzone development is simulated in a straightforward way: the development of the root extension is specified by the user in advance and the root length density distribution is assumed static in time. Roots play a key role in the interaction between soil water and crop growth and crop yield simulation. Although plant roots are highly adaptable, their adaptability is often neglected in simulation models that are used for predicting impacts on yield. For a more realistic approach we implemented a simple and innovative root growth model which will react on the hydrological conditions within the rootzone. This means that newly formed roots will be assigned to regions where there is no or the least stress, and less or no new roots to regions where water stress was experienced. As a result the drought and oxygen stress will be less dependent on the initial root distribution as specified by the user.

The model performance of the adaptive root growth model is compared with a rhizobox experiment where the root growth of maize was tracked while influencing soil moisture conditions at the same time (Maan et al., 2023). An example for a regional study will be provided to show the relevance of adaptive rootzone development for assessing land qualities in space and time.

How to cite: Mulder, M., Heinen, M., and Hack-ten Broeke, M.: Effect of adaptive rootzone development in quantitative land evaluation studies, EGU General Assembly 2024, Vienna, Austria, 14–19 Apr 2024, EGU24-5513, https://doi.org/10.5194/egusphere-egu24-5513, 2024.

The functional role and genetic control of many root anatomical and architectural traits are poorly understood. Our research focuses on characterizing root traits for enhanced stress tolerance and identifying genetic mechanisms controlling the expression of root traits. We have identified a candidate gene for root cortical aerenchyma formation which mapped to a root cortex-expressed bHLH transcription factor gene. A bHLH121 Mu transposon mutant line and a CRISPR/Cas9 loss-of-function mutant exhibited reduced root cortical aerenchyma formation, whereas an overexpression line exhibited significantly greater root cortical aerenchyma formation when compared to the wildtype line in many environments. Overall functional validation of the bHLH121 gene’s importance in root cortical aerenchyma formation provides a functional marker to select varieties with improved soil exploration and thus yield. Characterization of these lines under suboptimal water and nitrogen availability in multiple soil environments revealed root cortical aerenchyma is plastic in response to abiotic stress. Our results suggest that phenotypic plasticity is highly quantitative and plasticity loci are distinct from loci that control trait expression in stress and non-stress conditions. The identification of genes and functional phenotypes of root traits will facilitate efforts for the development of novel nutrient and water efficient crop varieties.

How to cite: Schneider, H.: Genetic Control and Phenotypic Plasticity of Root Cortical Aerenchyma in Maize, EGU General Assembly 2024, Vienna, Austria, 14–19 Apr 2024, EGU24-6403, https://doi.org/10.5194/egusphere-egu24-6403, 2024.

EGU24-7315 | Orals | HS8.3.3

From hydraulic root architecture models to efficient macroscopic sink terms  

Daniel Leitner, Andrea Schnepf, and Jan Vanderborght

Root water uptake strongly affects soil water balance and plant development. It can be described by mechanistic models of soil-root hydraulics based on soil water content, soil and root hydraulic properties, and the dynamic development of the root architecture. Recently, novel upscaling methods have emerged (Vanderborght et al. 2023, 2021), which enable the application of detailed mechanistic models on a larger scale, particularly for land surface and crop models, by using mathematical upscaling.

In this study, we explore the underlying assumptions and the mathematical fundamentals of the upscaling approach. Our analysis rigorously investigates the errors introduced in each step during the transition from fine-scale mechanistic models, which considers the nonlinear perirhizal resistance around each root, to more macroscopic representations. Upscaling steps simplify the representation of the root architecture, the perirhizal geometry, and the soil spatial dimension and thus introduces errors compared to the full complex 3D simulations. In order to investigate the extent of these errors, we perform simulation case studies: spring barley as a representative non-row crop and maize as a representative row crop, and using three different soils.

We show that the accuracy of the upscaled modeling approach strongly differs, depending on  root architecture and soil type. Furthermore, we identify the individual steps and assumptions that lead to the most important losses in accuracy. An analysis of the trade off between model complexity and accuracy provides valuable guidance for selecting the most suitable approach for specific applications.


References 

Vanderborght, J., Couvreur, V., Meunier, F., Schnepf, A., Vereecken, H., Bouda, M., and Javaux, M. (2021). From hydraulic root architecture models to macroscopic representations of root hydraulics in soil water flow and land surface models. Hydrology and Earth System Sciences, 25(9):4835–4860.

Vanderborght, J., Leitner, D., Schnepf, A., Couvreur, V., Vereecken, H., and Javaux, M. (2023). Combining root and soil hydraulics in macroscopic representations of root water uptake. Vadose Zone Journal, e20273.

How to cite: Leitner, D., Schnepf, A., and Vanderborght, J.: From hydraulic root architecture models to efficient macroscopic sink terms , EGU General Assembly 2024, Vienna, Austria, 14–19 Apr 2024, EGU24-7315, https://doi.org/10.5194/egusphere-egu24-7315, 2024.

EGU24-7397 | Posters on site | HS8.3.3

Upscaling of 3D root hydraulic architectures of trees to 1D root hydraulic models 

Jan Vanderborght, Juan Baca Cabrera, Guillaume lobet, Daniel Leitner, Mathieu Javaux, Valentin Couvreur, and Andrea Schnepf

Root systems of trees are obviously much larger than those of herbaceous plants. Considering a root length of 30 km of roots below a surface area of 1m2 in a forest and considering that the root system of a single tree extends over a horizontal area of 10 m², this would mean that a root system of one tree is 300 km long. To simulate the water flow in the root system, the root system is typically discretized in 1cm long root segments and a set of flow equations is setup and solved to derive the water potential and flux in each segment of the 3D root hydraulic architecture. For a system with n root segments and n+1 nodes at which segments are connected, this results in a set of n equations that need to be solved. Solving this set of equations corresponds with inverting an n by n matrix. For the root system of a tree, the size of this matrix would be 3 107 by 3 107. The linear equation matrix is sparse and could be solved using equation solvers that do not calculate the inverse matrix. But, also these solutions might still be too expensive so that an upscaled and reduced set of equations is needed. We developed an approach to upscale flow equations in root hydraulic architectures (Vanderborght et al., 2021), which were subsequently coupled to non-linear flow equations that account for resistance to flow in the soil around root segments (Vanderborght et al. 2023). But, these upscaling approaches require an inversion of the linear equation matrix. In order to address this problem, we developed an inversion method that uses the hierarchical structure of the root network to divide the inversion into a set of smaller inversion problems that can be solved in parallel. In this presentation, we outline the principle of the inversion method and demonstrate it for large root systems of trees.


References

Vanderborght, J., et al. (2021) From hydraulic root architecture models to macroscopic representations of root hydraulics in soil water flow and land surface models. Hydrol. Earth Syst. Sci., 25(9), 4835-4860. https://doi.org/10.5194/hess-25-4835-2021

 Vanderborght, J., et al. (2023). Combining root and soil hydraulics in macroscopic representations of root water uptake. Vadose Zone Journal, n/a(n/a), e20273. https://doi.org/https://doi.org/10.1002/vzj2.20273

How to cite: Vanderborght, J., Baca Cabrera, J., lobet, G., Leitner, D., Javaux, M., Couvreur, V., and Schnepf, A.: Upscaling of 3D root hydraulic architectures of trees to 1D root hydraulic models, EGU General Assembly 2024, Vienna, Austria, 14–19 Apr 2024, EGU24-7397, https://doi.org/10.5194/egusphere-egu24-7397, 2024.

EGU24-7991 | ECS | Orals | HS8.3.3

Evolution of root hydraulic properties of wheat with breeding and its influence on root water uptake: insights from a field experiment and modelling 

Juan C. Baca Cabrera, Jan Vanderborght, Dominik Behrend, Thomas Gaiser, Thuy Huu Nguyen, Yann Boursiac, and Guillaume Lobet

Root water uptake is a pivotal process in the regulation of water movement within the soil-plant-atmosphere continuum. At a specific atmospheric demand, root water uptake is determined by the architecture of the root system and the hydraulic properties of individual roots and root segments. In agricultural settings, root traits are affected by management practices, including breeding. Specifically for wheat, the most important European crop, a decrease in root system size has been observed in modern varieties compared to historical ones1, and differences in root hydraulic properties between cultivated and wild species have been documented2. However, an assessment on the long-term evolution of root hydraulic properties with breeding is still absent.  

Here, we investigated the effect of breeding on root hydraulic properties of wheat and its implications for root water uptake at the plant scale. For this, an experiment encompassing six wheat cultivars spanning over a century of breeding history was conducted. We measured the number of root axes (crown roots and seminal roots) of plants grown in the field during the tillering phase (BBCH <30) and the root hydraulic conductivity of young plants grown in hydroponics (<12 days, no crown roots), using the pressure chamber technique.

Average root hydraulic conductivity (per root surface area) did not differ among cultivars, but a pronounced decrease in the number of root axes was observed in the most recent cultivars. Based on these observations, simulations with the whole-plant 3-D model CPlantBox were performed, indicating a higher whole-root system conductance in the oldest cultivars at the end of the tillering phase, associated with a higher number of tillers and root axes. This suggests an evolution of wheat cultivars towards more conserving root water uptake strategies, a feature of special importance under water-limited conditions.


References 

  • 1Zhao et al. (2005). 10.1111/j.1744-7909.2005.00043.x
  • 2Fradgley et al. (2020). 10.1007/s11104-020-04585-2 

How to cite: Baca Cabrera, J. C., Vanderborght, J., Behrend, D., Gaiser, T., Nguyen, T. H., Boursiac, Y., and Lobet, G.: Evolution of root hydraulic properties of wheat with breeding and its influence on root water uptake: insights from a field experiment and modelling, EGU General Assembly 2024, Vienna, Austria, 14–19 Apr 2024, EGU24-7991, https://doi.org/10.5194/egusphere-egu24-7991, 2024.

EGU24-8276 | Posters on site | HS8.3.3

Inter-row soil management affecting the soil-plant-water system in vineyard  

Ágota Horel, Levente Czelnai, Tibor Zsigmond, Imre Zagyva, and Csilla Farkas

The objectives of the study was to 1) investigate soil-plant-water interactions based on field measurements of plant reflectance and soil water content (SWC) in different inter-row managed vineyards, and 2) modeling changes in the SWC due to differences in soil physical parameters among slope positions and management methods. The study explored the impact of three different soil management practices on grapevine growth and soil health in vineyards: tilled (T), cover crops (CC), and perennial grass (NT) inter-rows. Data was collected for 2022 and 2023. At each study slopes, we had two measurement points along a slope section. To continuously monitor soil water and temperature conditions, sensors were strategically positioned at two depths of 15 cm and 40 cm below the soil surface along the slopes, both at the upper and lower points of the vineyard, while topsoil SWC was measured bi-weekly. Normalized Difference Vegetation Index (NDVI) and Photochemical Reflectance Index (PRI) sensors were used to measure leaf reflectance, while handheld instruments were used to measure additional NDVI and leaf Chlorophyll contents (SPAD). For the hydrological modeling we used SWAP (Soil-Water-Atmosphere-Plant), where the rswap R-package was used for calibration (2020 15 and 40cm data), validation (2021 15 and 40cm data), and statistical evaluation.

In 2022, all three slopes showed a significantly higher SWC content for the higher points compared to the lower, while in 2023 the grassed slope upper point showed higher SWC (0.18 vs 0.15%). The highest NDVI values were measured for the cover cropped vineyard site (0.68). However, we found no significant differences among NDVI values based on inter-row management or slope position, only the grassed inter-row vineyard had differences in the NDVI values at the lower and upper points (p=0.034). The highest leaf chlorophyll contents were measured for the cover cropped vineyard site (305). Most of the leaf Chlorophyll values were not significantly different among slope positions. Using the SWAP model, data from the cover cropped inter-row vineyard was used for calibration and validation. We found good model fitting (NSE > 0.52; d_daily > 0.81). Reduced-tillage (RT) and drought tolerant plant (DTP) management scenarios were run to simulate SWC changes over time. Preliminary data shows that DTP significantly reduced, while RT did not significantly affect our site’s SWC.

Acknowledgments: This material is based upon work supported by the Hungarian National Research Fund (OTKA/NKFI) project OTKA FK-131792. The research presented in the article was carried out within the framework of the Széchenyi Plan Plus program with the support of the RRF 2.3.1 21 2022 00008 project.

How to cite: Horel, Á., Czelnai, L., Zsigmond, T., Zagyva, I., and Farkas, C.: Inter-row soil management affecting the soil-plant-water system in vineyard , EGU General Assembly 2024, Vienna, Austria, 14–19 Apr 2024, EGU24-8276, https://doi.org/10.5194/egusphere-egu24-8276, 2024.

EGU24-9160 | ECS | Posters on site | HS8.3.3

Impact of drought on Sentinel-2 derived winter wheat growth dynamics and the relation to soil properties 

Hanna Sjulgård, Lukas Graf, Tino Colombi, Juliane Hirte, Thomas Keller, and Helge Aasen

Drought can severely limit plant growth, and in turn crop productivity, and poses challenges to global food production. Plant growth can be measured with the Green Leaf Area Index (GLAI), and satellite images offer opportunities to estimate GLAI at field and landscape scales. Analysing satellite-estimated GLAI development at the landscape level could reveal new insights into how soil characteristics influence crop performance under various weather conditions, which in turn could provide information on how to mitigate the impacts of extreme weather. In this study, we quantified winter wheat growing patterns in two years with contrasting weather conditions (2018: early summer drought; 2021: normal growing conditions) on farmers’ fields using Sentinel-2 derived GLAI, and assessed the impacts of drought on GLAI dynamics. Moreover, we tested whether soil properties can explain differences in GLAI dynamics between a dry and a normal weather year.

Sentinel-2 scenes were downloaded from Microsoft Planetary Computer and the radiative transfer model PROSAIL was used to estimate GLAI throughout the winter wheat vegetative growing season on farmers’ fields in the south of Sweden. Characteristic GLAI parameters such as growth rate, area under the curve, peak GLAI and timing of the peak were calculated from the GLAI time series. The impact of drought on winter wheat growth was assessed by comparing the GLAI parameters between the dry year 2018 with the normal weather year 2021. In addition, the GLAI parameters were related to several biological, chemical and physical soil properties measured on the farmers’ fields.

The results showed lower GLAI parameters during the dry year compared to the normal weather year on the farmer’s fields. For some fields, there was a large difference between the years while for other fields a smaller difference. Plant available water content was found as the most important soil property in explaining the differences in GLAI parameters between the years. Our study demonstrates that satellite image analysis of GLAI dynamics can be used to identify plant stress responses on farmer’s fields. By analysing a dry and a normal year, we show that the impacts of drought can vary considerably between fields, and by combining GLAI estimates with measurements of soil properties, we identified plant available water content as a key soil property to explain differences between years. Thus, our results contribute to knowledge towards developing soil management strategies to mitigate the impacts of extreme weather.

How to cite: Sjulgård, H., Graf, L., Colombi, T., Hirte, J., Keller, T., and Aasen, H.: Impact of drought on Sentinel-2 derived winter wheat growth dynamics and the relation to soil properties, EGU General Assembly 2024, Vienna, Austria, 14–19 Apr 2024, EGU24-9160, https://doi.org/10.5194/egusphere-egu24-9160, 2024.

The SWAP model allows studying the behavior of agricultural systems at different spatial and temporal scales, addressing climate change adaptation and mitigation issues.

In recent years, it has been used in the viticultural sector to study the soil-plant-atmosphere (SPA) relationships in vineyards and to define and support the terroir concept and its resilience under climate change.

This contribution presents the results relating to the ability of the model to (i) shed light on the relationships between water stress and grape quality characteristics and (ii) evaluate the impact of climate change on the responses of the vineyard system of three vine varieties cultivated in southern Italy (Aglianico, Cabernet sauvignon and Greco).

In each case study, the calibrated and validated SWAP model output has been used to explore the relations between the plant water stress realized during the growing season and vine responses (physiological and productive responses). The identified relations were successively applied to evaluate the climate change (CC, RCP 4.5 and 8.5 ) adaptation of each vineyard system studied. Furthermore, in the case of the Aglianico grapevine, the evaluation of adaptation to CC was spatially extended to a region of southern Italy (Valle Telesina, BN; 20.000 ha) devoted to high-quality wine production, and the resilience of the terroir concept evaluated.

Finally, the strengths and limitations of SWAP application in the viticultural context will be discussed.

Keywords: grapevine, SPA system, terroir, climate change, vine water stress, grape quality.

How to cite: Bonfante, A.: SWAP model potentiality in the viticultural system study and analysis., EGU General Assembly 2024, Vienna, Austria, 14–19 Apr 2024, EGU24-9239, https://doi.org/10.5194/egusphere-egu24-9239, 2024.

EGU24-9866 | ECS | Posters on site | HS8.3.3

The concomitance of water use regulations and loss in soil-plant hydraulic conductivities 

Mohanned Abdalla, Andrea Carminati, and Mutez Ahmed

Stomatal regulation, which governs water loss and hence plant water use, is a key feature facilitating plant adaptation to water-limited environments. Nevertheless, the underlying mechanisms governing stomatal closure remain disputed. Recent studies proposed that the loss in hydraulic conductivities within the soil-plant system is the main driver of stomatal closure. However, the primary hydraulic constraint along the system, being in the soil and/or within the plant, remains without consensus. Furthermore, simultaneous measurements of the hydraulic limitation and stomatal regulation, especially in intact plants, is challenging. Here, we reviewed the recent literature on the relationship between stomatal closure and the loss of hydraulic conductance of key elements across the soil-plant-atmosphere continuum: soil, root, root-soil interface, xylem and leaf. We observed higher correlation between stomatal closure and declining below-ground hydraulics rather than leaf and/or xylem hydraulics. This analysis confirms the notion that stomatal closure is triggered by the decline of the soil-plant hydraulic conductance, and that this decline has often a below-ground origin. Understanding the key regulatory role of below-ground hydraulics is critical for forecasting and managing plant behavior under drought. 

How to cite: Abdalla, M., Carminati, A., and Ahmed, M.: The concomitance of water use regulations and loss in soil-plant hydraulic conductivities, EGU General Assembly 2024, Vienna, Austria, 14–19 Apr 2024, EGU24-9866, https://doi.org/10.5194/egusphere-egu24-9866, 2024.

EGU24-11051 | ECS | Orals | HS8.3.3

The effect of lithology on leaf litter decomposition of Pinus pinaster forests along a Mediterranean precipitation gradient 

Daniel Fishburn, Andy Smith, Lars Markesteijn, and Ana Rey

Above-ground plant litter decomposition has a major influence on the global carbon (C) cycle by transferring 50% of net primary productivity to soil organic matter and releasing 60 Pg C annually into the atmosphere. Despite extensive research devoted to disentangling the main drivers controlling litter decomposition, the role of lithology remains understudied. Here, two studies were conducted to investigate the combined effects of lithology and climate on needle litter decomposition on three distinctive lithological substrates (calcareous, peridotite, and metapelite) along a precipitation gradient (ranging from 641 to 1097 mm yr-1) in the province of Málaga, south of Spain.

Study one examined needle litter decomposition of Pinus pinaster (maritime pine) along the experimental gradient, and study two was a reciprocal transplant experiment established on calcareous and peridotite lithological substrates located in the centre of the precipitation gradient with litter of contrasting chemical recalcitrance obtained from P. pinaster and Abies pinsapo (Spanish fir) to assess the impact of lithology on the home field advantage hypothesis.

Total litter mass loss during decomposition was highest in the calcareous substrate, exceeding metapelite and peridotite substrates by 24% and 50%, respectively. Decreased precipitation reduced litter mass loss only in calcareous soils (35%) but had little effect on metapelitic and peridotite sites indicating that more productive bedrock types are influenced to a greater degree by reducing precipitation, supporting the boom-bust hypothesis. On peridotite substrates, decomposition of the labile soluble cell fraction and cellulose-based crude fibre fractions of intermediate recalcitrance was delayed by one dry season whereas lignin decomposition ensued immediately highlighting physicochemistry-induced modification of substrate accessibility.  Moreover, study two demonstrated a pronounced home-field advantage for litter on calcareous substrates, contrasting with an away-field advantage for litter derived from peridotite substrates. These results underscore the significant role of lithology in dictating litter decomposition dynamics, directly influencing both litter quality and microbial substrate accessibility.

Given that lithology directly impacts litter quality and its response to changing precipitation patterns—both critical variables in global ecosystem carbon models—incorporating lithological factors is essential for accurately predicting how plant litter decomposition will respond to climate change.

How to cite: Fishburn, D., Smith, A., Markesteijn, L., and Rey, A.: The effect of lithology on leaf litter decomposition of Pinus pinaster forests along a Mediterranean precipitation gradient, EGU General Assembly 2024, Vienna, Austria, 14–19 Apr 2024, EGU24-11051, https://doi.org/10.5194/egusphere-egu24-11051, 2024.

EGU24-11140 | ECS | Posters on site | HS8.3.3

Genotypic variability of plant water use strategies during increasing atmospheric drought in 15 spring wheat (Triticum aestivum L.) genotypes 

Emma Ossola, Tina Köhler, Andrea Carminati, and Walid Sadok

The rise of global temperatures and shifts in precipitation patterns lead to increasing vapour pressure deficit (VPD), which was shown to have a detrimental impact on yield of many crops. A reduction in the transpiration rate (TR) at high VPD has been proposed as a key drought tolerance breeding trait to avoid excessive water loss. Our hypothesis is that with climate change, it will be more convenient for plants to have traits that restricts TR under high VPD levels. With this research we aimed to identify relevant hydraulic traits impacting plant water use during atmospheric drying.

We measured water use and hydraulic traits of 15 different Minnesota spring wheat (Triticum aestivum L.) genotypes. We grew 45 plants (3 replicates for each genotype) in a climate chamber with controlled climatic conditions, while the soil was kept moist. After six weeks of growth, we monitored TR at 6 different VPD levels, between 0.5 and 2.8 kPa. Additionally, we measured maximum stomatal conductance (gs), leaf area (LA), plant hydraulic conductance (Kplant), stomatal density (SD), and root and leaf total biomass.

Our findings show that total transpiration per LA, LA, and root/shoot-ratio differed significantly between genotypes. Conversely, transpiration sensitivity to rising VPD (indicated by the critical VPD upon which plants restricted transpiration, VPDBP), Kplant and maximum gs did not significantly differ between genotypes. However, we observed that plants with a low Kplant and a high maximum gs expressed a relatively low VPDBP, indicating a higher transpiration sensitivity to VPD. Our results align well with a hydraulic explanation of the TR response to increasing VPD and suggest that plant hydraulics play a key role in regulating TR during atmospheric drying. If the goal of future breeding is to modify plant water use under increasing VPD, targeting hydraulic traits has still much underexplored potential.

How to cite: Ossola, E., Köhler, T., Carminati, A., and Sadok, W.: Genotypic variability of plant water use strategies during increasing atmospheric drought in 15 spring wheat (Triticum aestivum L.) genotypes, EGU General Assembly 2024, Vienna, Austria, 14–19 Apr 2024, EGU24-11140, https://doi.org/10.5194/egusphere-egu24-11140, 2024.

EGU24-11972 | Orals | HS8.3.3

Ecosystem scale evapotranspiration is controlled by small scale processes and soil hydraulic properties 

Andrea Carminati, Fabian Wankmüller, Louis Delval, Martin J Baur, Mathieu Javaux, Sebastian Wolf, Peter Lehmann, and Dani Or

The upscaling of hydrologic processes at catchment scale from small scale soil hydraulic parameterization has been met with limited success. For example, spatially variable attributes (topography, surface properties, preferential flow paths) affect infiltration and runoff rates, introducing uncertainties that mask the role of soil properties at catchment scales. In contrast, evidence suggests that evapotranspiration (ET) remains controlled by small scale processes (flow of water to roots, capillary pumping to drying surface) that are critically dependent on soil hydraulic properties. This scale invariance of ET offers opportunities for upscaling emergent ecosystem scale ET dynamics from basic soil information.

ET switches from being energy to water limited at a critical soil water threshold when the water flow through the soil matrix can no longer sustain the atmospheric water demand. This transition depends on the soil water characteristics and soil hydraulic conductivity curve (characterized by their nonlinearity and dependence on soil texture), on plant traits (root length density, leaf area, and xylem vulnerability), and on atmospheric conditions (e.g., vapor pressure deficit and wind velocity). Despite the importance of plant hydraulic traits and atmospheric conditions, the large variations in soil hydraulic properties as a function of soil texture, make small scale hydraulic properties the key in controlling ET during soil drying (Lehmann et al. 2008, Carminati and Javaux 2020). It follows that soil moisture thresholds of ET are controlled by water flow in soils and by the soil hydraulic conductivity. Accordingly, small-scale models of water flow to the soil surface and to the roots successfully predict soil moisture thresholds that have been measured at the ecosystem scale.

The question of why upscaling flow equations and properties derived from small sample and single plants to ecosystems proved to be successful is an important one. In contrast to water infiltration and run-off affected by the scale-dependent size of surface heterogeneities, the spatial scale of water flow from soils to roots does not increase with the scale of observation. It is the limiting flow through the soil matrix, with spatial scales of 0.01-0.1 m, which sets the point when plants downregulate transpiration and photosynthesis as the soil dries; a process that is similar to the evaporation from the soil surface.

In conclusion, despite the challenges and uncertainties in applying soil physical laws to larger scale, the application of Buckingham-Darcy law to properly predict matrix flow and evapotranspiration at the ecosystem scale is doable and relevant for understanding drought effects on ecosystem water use and productivity.


Carminati A, Javaux M. Soil rather than xylem vulnerability controls stomatal response to drought. Trends in Plant Science. 2020 Sep 1;25(9):868-80.

Lehmann P, Assouline S, Or D. Characteristic lengths affecting evaporative drying of porous media. Physical Review E. 2008 May 16;77(5):056309.

How to cite: Carminati, A., Wankmüller, F., Delval, L., Baur, M. J., Javaux, M., Wolf, S., Lehmann, P., and Or, D.: Ecosystem scale evapotranspiration is controlled by small scale processes and soil hydraulic properties, EGU General Assembly 2024, Vienna, Austria, 14–19 Apr 2024, EGU24-11972, https://doi.org/10.5194/egusphere-egu24-11972, 2024.

EGU24-12359 | Orals | HS8.3.3

 Improving the sustainability of arable cropping systems by modifying root traits: a modelling study for winter wheat 

Elsa Coucheney, Thomas Kätterer, Katharina Meurer, and Nick Jarvis

Crop breeding to increase below-ground production and inputs of organic matter into soil has been attracting increasing attention as a potentially effective strategy to enhance soil organic matter (SOM) stocks and thus the quality of soil and sustainability of arable cropping systems. We used the new soil-crop model USSF (Uppsala model of Soil Structure and Function) to investigate the potential for increasing SOM whilst maintaining or improving yields by modifying the root system of winter wheat in terms of below-ground allocation of carbon and key root traits. USSF combines physics-based descriptions of soil water flow, water uptake and transpiration by plants, with a simple (generic) crop growth model and a model of soil structure dynamics and soil organic matter turnover that considers the effects of soil physical protection and microbial priming. 

The USSF model was first calibrated against field data on soil water contents and both above-ground and root biomass of winter wheat measured during one growing season in a clay soil in Uppsala, Sweden. Based on five acceptable calibrated parameter sets, we created four model crops (ideotypes) by modifying root-related parameters to mimic winter wheat phenotypes with improved root traits. Long-term (30-year) simulations of a conventionally tilled monoculture of winter wheat were then performed to evaluate the potential effects of cultivating these ideotypes on soil water balance, soil organic matter stocks and grain yields.

Our results suggest that exploiting winter wheat varieties that allocate more assimilate to the root system would not in itself have any positive effect on soil organic matter storage and would also decrease grain yields. In contrast, deeper root systems or root systems that are more effective for water uptake were predicted to slightly increase grain yields, as well as increasing SOM stocks in the soil profile by ca. 3 to 5%. Combining all three improved root traits showed even more promising results: compared with the baseline “business-as-usual” scenario, SOM stocks in the soil profile were predicted to increase by ca. 7% in a 30-year perspective (as an average of the five parameter sets) without negatively impacting yields.

How to cite: Coucheney, E., Kätterer, T., Meurer, K., and Jarvis, N.:  Improving the sustainability of arable cropping systems by modifying root traits: a modelling study for winter wheat, EGU General Assembly 2024, Vienna, Austria, 14–19 Apr 2024, EGU24-12359, https://doi.org/10.5194/egusphere-egu24-12359, 2024.

EGU24-12431 | Posters on site | HS8.3.3

Effect of soil-plant interactions on nutrient availability and supply in a tropical Andean ecosystem  

Armando Molina, Veerle Vanacker, Oliver Chadwick, Santiago Zhiminaicela, Marife Corre, and Edzo Veldkamp

Plants play a key role in absorbing nutrients and water through their roots, and modulate the biogeochemical cycles of terrestrial ecosystems. Nutrient uptake mechanisms of water and nutrient by plants depend on climatic and edaphic conditions, as well as of their root systems. Soil solution is the medium in which abiotic and biotic processes exchange nutrients, and nutrient concentrations vary with the abundance of reactive minerals and fluid residence times. High-altitude grassland ecosystems of the tropical Andes are particularly interesting to study the relationship between vegetation communities, soil hydrology and mineral nutrient availability. In páramo ecosystems, forest, tussock grasses and cushion plants co-occur across the landscape. In the nutrient-depleted nonallophanic Andosols, the plant rooting depth varies with drainage and soil moisture conditions. Vegetation composition is a relevant indicator of rock-derived nutrient availability in soil solutions. Significant variations in the soil solute chemistry revealed patterns in plant available nutrients that were not mimicking the distribution of total rock-derived nutrients nor the exchangeable nutrient pool, but clearly resulted from strong biocycling of cations and removal of nutrients from the soil by plant uptake or deep leaching. Our findings highlight the importance of vegetation communities, soil hydrological condition, and the bioavailability of mineral nutrients to trigger rapid and complex changes in the biogeochemistry of soil waters. Moreover, the findings have important implications for future management of Andean ecosystems where vegetation type distributions are dynamically changing as a result of warming temperatures and anthropogenic disturbances. Such alterations may not only lead to changes in soil hydrology and solute geochemistry but also to complex changes in weathering rates and solute export downstream with effects on nutrient availability in Andean rivers and high-mountain lakes.

How to cite: Molina, A., Vanacker, V., Chadwick, O., Zhiminaicela, S., Corre, M., and Veldkamp, E.: Effect of soil-plant interactions on nutrient availability and supply in a tropical Andean ecosystem , EGU General Assembly 2024, Vienna, Austria, 14–19 Apr 2024, EGU24-12431, https://doi.org/10.5194/egusphere-egu24-12431, 2024.

EGU24-12839 | ECS | Posters virtual | HS8.3.3

Sensitivity analysis of a process-based root water uptake model to predict drought stress in soybean and wheat in a tropical winter-dry climate 

Marina Luciana Abreu de Melo, Quirijn de Jong van Lier, Jos C. van Dam, and Marius Heinen

Drought stress is one of the main reasons for reduced yields in soybean and wheat crops in Brazil. Process-based root water uptake (RWU) models are valuable tools to assess soil-water-plant relations and improve crop water management. We aimed to perform a pioneer sensitivity analysis (SA) of a process-based RWU model using three methods and two sampling strategies. The SWAP agro-hydrological model with the recently implemented MFlux RWU function was used to predict drought stress in soybean and wheat crops simulated on five soils with different hydraulic properties sampled in southeast Brazil, characterized by a tropical winter-dry climate. Three SA methods were used: local, global Morris, and global Sobol. Seven parameters of the MFlux function were selected, together with their reference values and ranges of variability. The local sensitivities were predominately negative, indicating that the drought stress increased as the values for each RWU parameter decreased. The Morris method revealed parameter interactions not addressed in the local method. The Sobol method also evidenced parameter interactions calculated through robust variance-based indices. Although the three SA methods provided different results regarding parameter contributions to drought stress prediction, the root length density was the most sensitive parameter for all simulated scenarios. Hence, it should be a priority in future model calibration efforts.

How to cite: Abreu de Melo, M. L., de Jong van Lier, Q., C. van Dam, J., and Heinen, M.: Sensitivity analysis of a process-based root water uptake model to predict drought stress in soybean and wheat in a tropical winter-dry climate, EGU General Assembly 2024, Vienna, Austria, 14–19 Apr 2024, EGU24-12839, https://doi.org/10.5194/egusphere-egu24-12839, 2024.

Desertification is one of the most important environmental problems in the world. In arid and semi-arid regions, desert shrub reconstruction is one of the most effective ways to prevent desertification and promote ecological restoration. Recently, many studies have reported the hydraulic trade-off, coordination, and hydraulic segmentation of woody plants, however, the mechanism of how the hydraulic segmentation drives morphological adjustment of desert shrub to response to drought is still largely unclear. Here, the two-year-old seedlings of Caragana korshinskii and Artemisia ordosica as materials were subjected to continuous drought treatment. The aim is to explore hydraulic strategies and quantify the hydraulic threshold when morphological adjustments drive occurs. The results showed that tissues water content of C. korshinskii and A. ordosica under persistent drought showed an exponential decrease with the decrease of soil water content, but it is with a certain lag effect. Meanwhile, the leaf water potential, xylem specific hydraulic conductivity, degree of natural embolism and photosynthetic rate, etc. showed decrease trend with persistent drought. Above results suggested that hydraulic functional traits were drove by changes of soil water, but the tissue hydraulic capacitance acts as a buffer against decline of above traits. Moreover, the water potential thresholds of 88% stomatal closure and hydraulic safety margin in C. korshinskii was significant high than A. ordosica’s, which indicated that C. korshinskii are more vulnerable to drought. Then, the morphological adjustments such as leaf wilting and lateral branches wilting further occurred with the continued drought, however, the lateral branches of C.korshinskii could germinate again after soil water recovery, but A.ordosica could not. Overall, the water potential and hydraulic conductivity threshold for morphological adjustment of desert shrub such as leaves wilting and lateral branches wilting under continuous drought were quantified and the hydraulic strategies were elucidated that was regulated by hydraulic segmentation.

How to cite: Huo, J. and Zhang, Z.: Hydraulic strategies of desert shrubs responding to morphological adjustment under persistent drought, EGU General Assembly 2024, Vienna, Austria, 14–19 Apr 2024, EGU24-14434, https://doi.org/10.5194/egusphere-egu24-14434, 2024.

EGU24-15054 | ECS | Posters on site | HS8.3.3

Sensitivity analysis of root water uptake reduction using the Bartholomeus model in shallow water table scenarios 

Laura Raquel Quinonez Vera and Quirijn de Jong van Lier

A frequently used approach to estimate the reduction of the root water uptake (RWU) caused by oxygen stress in hydrological models such as SWAP is the empirical model of Feddes, which describes RWU using a piecewise linear function. Critical values associated with the threshold pressure heads defining oxygen stress (h1 = -10 cm and h= -25 cm) seem not to be able to represent properly this condition, because oxygen may start at more negative values of h. As an alternative, Bartholomeus et al. (2008) proposed a model based on physical and physiological soil and root processes to calculate the minimum gas-filled porosity of the soil at which oxygen stress occurs. We performed a sensitivity analysis of the Bartholomeus model focusing on two parameters, the threshold to stop root extension in case of oxygen stress and the air-filled root porosity in shallow water table scenarios cropped with soybean. We performed simulations for five soil types in combination with several water table depths. To do so, the water table was used in SWAP as the lower boundary condition. The sensitivity of the RWU and relative transpiration to combinations of parameters will be shown and discussed.


How to cite: Quinonez Vera, L. R. and de Jong van Lier, Q.: Sensitivity analysis of root water uptake reduction using the Bartholomeus model in shallow water table scenarios, EGU General Assembly 2024, Vienna, Austria, 14–19 Apr 2024, EGU24-15054, https://doi.org/10.5194/egusphere-egu24-15054, 2024.

EGU24-15318 | ECS | Orals | HS8.3.3

In situ grapevine hydraulic response to drought is soil-texture specific 

Louis Delval and Mathieu Javaux

Climate change will exacerbate drought events in many regions, increasing the demand on freshwater resources and creating major challenges for viticulture. The knowledge on grapevine drought stress physiology has increased significantly in recent years, but a holistic comprehension on how soil-grapevine hydraulic conductances develop and are regulated in the soil-grapevine-atmosphere continuum (SPAC) remains poorly understood. In particular, how soil type affects the grapevine hydraulic response to drought is still an open question.

The aim of this work is to understand how the hydraulic conductances in the SPAC continuously evolve according to soil type, during drought.

The continuous, concomitant and automatic monitoring of soil and collar water potentials, as well as sap flow, made it possible to characterize the evolution of the soil-grapevine hydraulics in situ in real-time. To investigate the impact of the soil type, two vineyards planted with Vitis vinifera cv. Chardonnay were selected due to their intra-field heterogeneity of soil properties (two subplots per vineyard). In a first vineyard, soil-grapevine hydraulics were measured on a sandy subplot and on a loamy subplot. In a second vineyard, we worked on a loamy subplot and on a silty-clay subplot.

We found that grapevine hydraulic response to soil drying is soil texture specific. Stomatal closure was observed for grapevines planted on coarse-textured soils, but not, or little, on fine-textured soils. This stomatal response was triggered by a decrease in belowground hydraulic conductance and not xylem cavitation in the trunk. This suggests that the interaction between the grapevine and the soil hydraulic environment plays a crucial role in shaping hydraulic behaviour of Chardonnay during drought periods.

While soil dries out, the decline in soil hydraulic conductivity led to a steep and nonlinear reduction in soil matric potential at the soil-root interface, with greater reduction in sandy soils compared to loamy soils. This rapid decline in soil hydraulic conductivity implies that the soil is more rapidly limiting (at less negative soil water potential), triggering earlier stomatal closure in coarse-textured soils. Stomatal regulation is amplified in sandy profile as compared to fine textured profile within the same grape variety.

How to cite: Delval, L. and Javaux, M.: In situ grapevine hydraulic response to drought is soil-texture specific, EGU General Assembly 2024, Vienna, Austria, 14–19 Apr 2024, EGU24-15318, https://doi.org/10.5194/egusphere-egu24-15318, 2024.

EGU24-15448 | ECS | Posters on site | HS8.3.3

Multi-year aboveground dataset of minirhizotron facilities on a cropland site with two soil types in Western Germany 

Thuy Nguyen, Gina Lopez, Sabine Seidel, Lena Lärm, Felix Bauer, Anja Klotzsche, Andrea Schnepf, Thomas Gaiser, Hubert Hüging, and Frank Ewert

Improved understanding of crops’ response to soil water stress is important to advance soil-plant system models and to support crop breeding, crop and varietal selection, and management decisions to minimize negative impacts. Studies on eco-physiological crop characteristics from leaf to canopy for different soil water conditions and crops are often carried out at controlled conditions. In-field measurements under realistic field conditions and data of plant water potential, its links with CO2 and H2O gas fluxes, and crop growth processes are rare. Here, we presented a comprehensive data set collected from leaf to canopy using sophisticated and comprehensive sensing techniques (leaf chlorophyll content, hourly leaf stomatal conductance and photosynthesis, canopy CO2 exchange, sap flow, and canopy temperature) including detailed crop growth characteristics based on destructive methods (seasonal dynamics of crop height, leaf area index, above-ground biomass, and yield). Data were acquired under field conditions with contrasting soil types, water treatments, and different cultivars of wheat and maize. The data from 2016 up to now will be made available together with the below-ground data. This dataset produced under field conditions is unique and could be used by different users (agronomists, hydrologists, crop modelers, breeders, etc.) for studying soil/water-plant relations and improving soil-plant-atmospheric continuum models.

How to cite: Nguyen, T., Lopez, G., Seidel, S., Lärm, L., Bauer, F., Klotzsche, A., Schnepf, A., Gaiser, T., Hüging, H., and Ewert, F.: Multi-year aboveground dataset of minirhizotron facilities on a cropland site with two soil types in Western Germany, EGU General Assembly 2024, Vienna, Austria, 14–19 Apr 2024, EGU24-15448, https://doi.org/10.5194/egusphere-egu24-15448, 2024.

EGU24-15520 | Orals | HS8.3.3

The influence of irrigation on root zone storage capacity 

Ruud van der Ent, Fransje van Oorschot, Andrea Alessandri, and Markus Hrachowitz

Vegetation plays a crucial role in regulating the water cycle through transpiration, which is the water flux from the subsurface to the atmosphere via vegetation roots. The amount and timing of transpiration is controlled by the interplay of seasonal energy and water supply. The latter strongly depends on the size of the root zone storage capacity (Sr) which represents the maximum accessible volume of water that vegetation can use for transpiration. Sr is primarily influenced by hydro-climatic conditions as vegetation optimizes its root system in a way it can guarantee water uptake and overcome dry periods. Sr estimates are commonly derived from root zone water deficits that result from the phase shift between the seasonal signals of root zone water inflow (i.e., precipitation) and outflow (i.e., evaporation). In irrigated croplands, irrigation water serves as an additional input into the root zone. However, this aspect has been ignored in many studies, and the extent to which irrigation influences Sr estimates was never comprehensively quantified. In this study, our objective is to quantify the influence of irrigation on Sr and identify the regional differences therein. To this aim, we integrated two irrigation methods, based on irrigation water use and irrigated area fractions, respectively, into the Sr estimation. We evaluated the effects in comparison to Sr estimates that do not consider irrigation for a sample of 4511 catchments globally with varying degrees of irrigation activities. Our results show that Sr consistently decreased when considering irrigation with a larger effect in catchments with a larger irrigated area. For catchments with an irrigated area fraction exceeding 10%, the median decrease of Sr was 17 mm and 22 mm for the two methods, corresponding to 12% and 17%, respectively. Sr decreased the most for catchments in tropical climates. However, the relative decrease was the largest in catchments in temperate climates. Our results demonstrate, for the first time, that irrigation has a considerable influence on Sr estimates over irrigated croplands. This effect is as strong as the effects of snow melt that were previously documented in catchments that have a considerable amount of precipitation falling as snow.

A manuscript associated with this abstract is available as preprint:

van Oorschot, F., van der Ent, R. J., Alessandri, A., and Hrachowitz, M.: Influence of irrigation on root zone storage capacity estimation, EGUsphere [preprint], https://doi.org/10.5194/egusphere-2023-2622, 2023.

How to cite: van der Ent, R., van Oorschot, F., Alessandri, A., and Hrachowitz, M.: The influence of irrigation on root zone storage capacity, EGU General Assembly 2024, Vienna, Austria, 14–19 Apr 2024, EGU24-15520, https://doi.org/10.5194/egusphere-egu24-15520, 2024.

EGU24-15793 | ECS | Orals | HS8.3.3

Spatial variation in soil hydraulic properties in an agricultural field estimated using Tension Disc Infiltrometer 

Nirali Vashishth, Souradip Dey, and Dr. Richa Ojha

Understanding spatial variation in soil hydraulic properties is important for comprehending the physical behaviour of soil and for analysing field-scale water flow and solute transfer processes. Tension disc infiltrometers are commonly used for measuring in-situ unsaturated hydraulic properties of soil. In this study, spatial variation in soil hydraulic properties is analysed for an experimental plot at IIT Kanpur, India after harvest of rice crop using tension disc infiltrometer. Measurements were taken at three different depths of 10, 25 and 50 cm and at multiple locations in the field for consecutive supply pressure heads of -12, -9, -6 and -3 cm. The measured data was analysed using HYDRUS-2D model and four Maulem-van Genutchen parameters (θs, α, n and Ks) were inversely estimated. The maximum variation was observed in α at the depth of 50 cm. The reduced variability observed in pore size distribution index (n) could be attributed to the flooded irrigation practice in rice. The findings of this study enhance our understanding of soil-water interaction in agricultural settings.

Keywords: Soil hydraulic properties, Tension disc infiltrometer, HYDRUS-2D

How to cite: Vashishth, N., Dey, S., and Ojha, Dr. R.: Spatial variation in soil hydraulic properties in an agricultural field estimated using Tension Disc Infiltrometer, EGU General Assembly 2024, Vienna, Austria, 14–19 Apr 2024, EGU24-15793, https://doi.org/10.5194/egusphere-egu24-15793, 2024.

EGU24-16031 | ECS | Posters on site | HS8.3.3

New methods of measuring and modeling biomass partitioning in winter wheat under field conditions. 

Dominik Behrend, Thuy Huu Nguyen, Hubert Hüging, Juan C. Baca Cabrera, Guillaume Lobet, Clara Oliva G. Bazzo, Sabine J. Seidel, and Thomas Gaiser

Partitioning of biomass between roots and the above ground organs of crops is a key plant physiological processes that is closely linked to root growth and, thus, water and nutrient uptake. This makes investigations and knowledge about the partitioning of carbon between below and above ground plant organs important for accurately simulating water and carbon fluxes from croplands. Previous experiments have shown that carbon partitioning between root and shoot of crops could be altered by drought. However, most crop models do not explicitly consider the alteration of carbon partitioning caused by drought. This might partly be due to the difficulties in measuring the complete root biomass under field conditions and, thus, a lack of data on the field scale. Current methodologies such as soil coring and shovelomics are time-consuming and limited with regards to the measured depth, they do not necessarily capture the whole root biomass of deep rooting winter crops like winter wheat.

The overall aim of the study is to improve our understanding of responses of below and above ground growth processes to different soil water availability. A field experiment has been conducted to investigate how drought stress affects the root: shoot ratio of different winter wheat cultivars under field conditions. A carbon partitioning subroutine, based on the sink strength principle and considering the direct effects of drought stress on carbon allocation, is implemented in the crop model SIMPLACE<LintulCC2>. The experimental data was used to test whether this newly developed model could successfully represent the effects of drought stress on biomass partitioning for different wheat cultivars.

In the experiment, tubes with a diameter of 11 cm and a length of 1 m, filled with a sandy substrate and closed on the bottom with a fine mesh fleece that allows water to flow through but stops roots from growing through, were buried in 1m deep holes. Winter wheat was sown inside the tubes and the field around them to catch the whole plant biomass under canopy conditions. Half of the tubes were watered during the growth period, the other half were sheltered from rain during early growth stages. Root biomass and traits were investigated after harvesting the tubes. The data from this experiment was used to calibrate the carbon partitioning subroutine in the crop model under non-stressed and water-stressed conditions. The carbon partitioning subroutine calculates organ-specific potential daily growth rates. These growth rates are used to calculate the organ-specific sink strength, which can be affected by water stress and is used to define the amount of carbon distributed to each organ per day.

The first experimental results show that water stress did affect the carbon partitioning between root and shoot biomass of winter wheat. The implemented model improved the simulation of biomass partitioning between root and above ground plant organs under drought conditions.

How to cite: Behrend, D., Nguyen, T. H., Hüging, H., Baca Cabrera, J. C., Lobet, G., G. Bazzo, C. O., Seidel, S. J., and Gaiser, T.: New methods of measuring and modeling biomass partitioning in winter wheat under field conditions., EGU General Assembly 2024, Vienna, Austria, 14–19 Apr 2024, EGU24-16031, https://doi.org/10.5194/egusphere-egu24-16031, 2024.

EGU24-16651 | Orals | HS8.3.3 | Highlight

Tropical humid forests: water consumers or producers? The case of a forest fragment in the Atlantic Forest 

Laura Borma, Fabio Sakagushi, Wilian Demetrio, Breno Pupin, Dione Ventura, Carlos Daniel Meneghetti, Basile Devoie, Charlotte Dermauw, Lola Parmentier, and Mathieu Javaux

Given the critical role of tropical forests in providing ecosystem services, extensive global efforts have been made to conserve and restore these vital areas. Despite the recognized environmental value of preserved forests, substantial uncertainties persist regarding the impact of reforestation activities on water recharge. While some studies suggest that reforestation might lead to a reduction in surface and groundwater reserves, other research, backed by public opinion, indicates that forest recovery enhances water reserve.

Recognizing this as a crucial scientific and environmental management concern, our study aims to explore the role of de and reforestation on soil hydraulic properties. Combining in situ monitoring of water status and soil physical properties, our study aimed at addressing the following scientific question: how does soil structure evolve with different revegetation stages?

We selected several plots along a hillslope transect in the oceanic forest (Sao, Paulo, Brasil), with different reforestation stages (40 y.o. forest vs deforested pasture).  Deep percolation measurements were conducted using sealed bottom lysimeters. A comparative analysis of soil conditions in contrasted study areas involved soil physical properties such as texture, permeability, and bulk density, along with assessing the seasonal variability of matric potential and soil moisture content.

Our findings reveal that soil infiltration capacity of pasture was lower than under a 40 yr-old forest. We also observed that soil macroporosity  was higher under the forest area than  under the pasture area, potentially influencing infiltration rates and favoring deep drainage in the forest compared to the pasture.

How to cite: Borma, L., Sakagushi, F., Demetrio, W., Pupin, B., Ventura, D., Meneghetti, C. D., Devoie, B., Dermauw, C., Parmentier, L., and Javaux, M.: Tropical humid forests: water consumers or producers? The case of a forest fragment in the Atlantic Forest, EGU General Assembly 2024, Vienna, Austria, 14–19 Apr 2024, EGU24-16651, https://doi.org/10.5194/egusphere-egu24-16651, 2024.

EGU24-16680 | ECS | Posters on site | HS8.3.3

Eco-hydrology modelling in arid areas : Study of root density impact on water fluxes in the Sahelian region 

Lucie Rapp-Henry, Jean-Martial Cohard, Mahamadi Tabsoba, Basile Hector, Jérôme Demarty, and Laura Condon

The Sahelian region experienced intense droughts between 1970 and 1990 and despite a precipitation « recovering », soils remain degraded and a decrease in the soil ability to infiltrate - an essential characteristic for vegetation recover – is observed, together with an increase of desertification and of eroding floods frequency.

To tackle with this phenomenon, coordinated agricultural strategies, like the Great Green Wall project, have been encouraged and spread over large areas through NGOs. This consists in applying agro-ecological practices, like micro dams, to harvest water, favor infiltration, and hence vegetation growth. These strategies still require critical assessments and optimisation. To study such agroecological practices we are developing a modelling framework based on ParFlow-CLM to simulate the interactions between surface hydrology and vegetation in the context of crusted Sahelian soils where water transfers are highly dependent on both surface hydrodynamical properties and root distribution below the surface. Indeed, the very thin eolian crust acts as a hydraulic discontinuity that slows down soil evaporation transfers but not transpiration, which benefits from the roots below the crust and from the stems which bridge to the atmosphere.

However, since the CLM family models were designed for large scale with a relatively thick mesh at the surface, the root density function proposed as a decreasing exponential function distribute the majority of roots just below the surface. This disposition is irrelevant for finer millimeter underground meshes modelling, particularly in areas with a hot and dry climate such as the Sahelian one, that dries very rapidly the first centimetres of soil.

Thus, In the CLM land surface model framework and according to literature, we propose a new root distribution in the soil, using a parameterised function which is zero at the surface and at infinity, and adapt the maximum root density depth and the root concentration around this maximum. We compare the impact of both initial and proposed root functions on a Sahelian case study in Niger where all necessary data are available thanks to the AMMA-CATCH observatory. Studying this function highlighted simple causal relations between root density function parameterisation and evapotranspiration flux.

By modifying the root density function, we can find a set of parameters corresponding to a better representation of transpiration, global evapotranspiration and soil moisture, and accordingly, a better representation of the studied ecosystem.

Once this representation is relevant, a dynamic LAI based on allocation laws, available in the latest version of CLM, will then complete this modification of the vegetation scheme. We will then introduce the changes on surface due to agricultural practices and study the impact of their sizing.

How to cite: Rapp-Henry, L., Cohard, J.-M., Tabsoba, M., Hector, B., Demarty, J., and Condon, L.: Eco-hydrology modelling in arid areas : Study of root density impact on water fluxes in the Sahelian region, EGU General Assembly 2024, Vienna, Austria, 14–19 Apr 2024, EGU24-16680, https://doi.org/10.5194/egusphere-egu24-16680, 2024.

EGU24-16788 | ECS | Posters on site | HS8.3.3

Investigating electrical polarization signatures of sugar beet and maize: A field study using spectral electrical impedance tomography 

Valentin Michels, Maximilian Weigand, and Andreas Kemna

Despite their vital role for agricultural management practices and plant breeding experiments, it is still challenging to characterize plant roots non-invasively in their natural environment. A promising new method for plant root characterization is the spectral electrical impedance tomography (sEIT) method, which is able to image the conductive and polarizable subsurface properties with high spatio-temporal resolution. Electrical polarization signatures have been shown to be sensitive to root structure and activity, although superimposed soil signatures complicate the interpretation. Recent studies have demonstrated that impedance measurements can be used to estimate root traits under laboratory conditions, especially in hydroponic experiments. However, field studies using sEIT on plant-root systems are still scarce.

In this study we present a field dataset of multi-frequency sEIT measurements on sugar beet and maize. Three different growth stages were measured during a whole growing season. We performed complex resistivity inversions for each measurement frequency, and subsequently analyzed the spatially resolved spectral response using a Debye decomposition analysis. Characteristic relaxation times, extracted from the spectral analysis, serve as proxies indicating the length scales of the observed polarization processes. We find that the physiologically different plant root systems cause distinct polarization responses in the low-frequency range. While both root systems exhibit an increasing polarization response towards higher frequencies, sugar beet develops an additional low-frequency polarization peak near 10 Hz later in the season, corrseponding with increasing size of the sugar beets. We attribute this peak to the polarization of root structures associated with the macroscopic dimensions of the beet roots, and demonstrate this link through the correlation of the retrieved mean relaxation time at the sugar beet positions with the square of the respective maximum beet diameter. Additionally, we evaluate the intrinsic spectral form of the polarization signatures extracted from the maize root area, and find a moderate correlation with the fresh biomass.

In conclusion, our results highlight that sEIT can be used in the field for plant root trait estimations, but structurally differing plants require different analysis procedures to extract root information. Additionally, environmental factors, like a varying soil composition or soil water content, have a strong influence on the measured impedance signal, and can make precise root trait estimation difficult.

How to cite: Michels, V., Weigand, M., and Kemna, A.: Investigating electrical polarization signatures of sugar beet and maize: A field study using spectral electrical impedance tomography, EGU General Assembly 2024, Vienna, Austria, 14–19 Apr 2024, EGU24-16788, https://doi.org/10.5194/egusphere-egu24-16788, 2024.

EGU24-17711 | ECS | Orals | HS8.3.3 | Highlight

How grasslands are managed will determine their ability to adapt to increased water scarcity under climate change 

Sven Westermann, Jan Bumberger, Martin Schädler, Stephan Thober, and Anke Hildebrandt

Grasslands are highly dynamic ecosystems that adapt to environmental drivers such as climate, soil properties and anthropogenic management. However, the belowground response and adaptation of grassland communities to environmental drivers are poorly understood. Here, we investigate differences in the temporal dynamics of root water uptake, its depth pattern and the evolution of plant-available soil water storage between three different grassland management types and in two different climate treatments (control and future). The climate scenarios included treatments with and without a precipitation manipulation that partially shifts the precipitation from summer to spring and autumn. Soil moisture measurements were carried out at 6 depths up to 90 cm on three land use types (i) extensively and (ii) intensively managed grassland and (iii) extensive pasture at the Global Change Experimental Facility (GCEF) in Central Germany. Afterwards, root water uptake was estimated from diurnal variations in soil water content. We found that the grassland vegetation, in general, extracts water to depths of up to 90 cm during the growing season and can go even deeper. Extensively managed grasslands in the future climate scenario had increased root water uptake depths even in spring when water was not limiting indicating an adaptation to changing rainfall patterns. In contrast, more intensively managed grasslands could not compensate for greater water limitation with deeper root water uptake. Root water uptake depths during summer differed between the management types only in the future climate scenario, with drier conditions, along with the management intensity: The more intense, the shallower the uptake. This demonstrates that the ability to adapt to changing climate depends on management. Cumulative atmospheric water deficit was the main driver of root water uptake depth until the first mowing while ecosystem structure (vegetation height) and soil properties (plant available water at the beginning of the vegetation period) affect that relationship.

How to cite: Westermann, S., Bumberger, J., Schädler, M., Thober, S., and Hildebrandt, A.: How grasslands are managed will determine their ability to adapt to increased water scarcity under climate change, EGU General Assembly 2024, Vienna, Austria, 14–19 Apr 2024, EGU24-17711, https://doi.org/10.5194/egusphere-egu24-17711, 2024.

EGU24-17850 | ECS | Orals | HS8.3.3

Coupling a Functional-Structural Plant Model with a Rhizosphere Model To Gain Multiscale Insights into Plant-Soil-Atmosphere Interactions for Water and Carbon Cycles 

Mona Giraud, Ahmet Sircan, Guillaume Lobet, Thilo Streck, Daniel Leitner, Holger Pagel, and Andrea Schnepf

To assess the impact of agricultural practices on water and carbon cycles within specific Genome-Environment-Management combinations, understanding the interactions across the Soil-Plant-Atmosphere continuum (SPAC) is crucial.

Indeed, soil water conditions influence carbon concentration and transport, impacting soil carbon physical and biochemical reactions.

The soil water and carbon status affect, in turn, the plant water and carbon dynamics directly via the plant-to-soil water or carbon gradient, and indirectly via plant water status, influencing its inner balance of water (uptake, transpiration and flow) and carbon (assimilation, usage for maintenance and growth, storage, respiration, rhizodeposition, and transport).

Reciprocally, plant water and carbon balances affect the soil carbon cycle in the short term through root water uptake and rhizodeposition. Those rhizodeposits are, for the most part, made of exudates and mucilage. Root exudates are low molecular weight organic compounds that are mainly passively diffused, while mucilage is a fluid made of polymers with high molecular weight created from starch via an active process.

Modelling plant and soil water and carbon processes, along with their interactions, can help to understand better and represent the effects of the underlying feedback loops. In this study, we therefore coupled the Functional Structural Plant Model (FSPM) CPlantBox with the rhizosphere model TraiRhizo, implemented using the porous medium flow and transport solver DuMux.

The overall coupled model and multiscale framework includes a module of 3D plant architecture development, and modules to represent flow and transport within the plant, the soil and the perirhizal zone around each root segment. Flows between compartments are solved implicitly via fixed-point iteration, using parallel computation for both the 3D soil and rhizosphere models.

We present a case study in which we simulated the growth of a C3 monocot and observed how changes in soil water content, due to root water uptake, influenced dissolved carbon concentration and (de)activation of the soil microbial communities during a dry spell.

In the future, the model will be applied to assess the impact of small dry spells at various stages of plant development against a baseline scenario. In time, this model could support plant breeding efforts to find root traits that aim for more drought-resistant plants in specific pedoclimatic environments.

How to cite: Giraud, M., Sircan, A., Lobet, G., Streck, T., Leitner, D., Pagel, H., and Schnepf, A.: Coupling a Functional-Structural Plant Model with a Rhizosphere Model To Gain Multiscale Insights into Plant-Soil-Atmosphere Interactions for Water and Carbon Cycles, EGU General Assembly 2024, Vienna, Austria, 14–19 Apr 2024, EGU24-17850, https://doi.org/10.5194/egusphere-egu24-17850, 2024.

EGU24-19179 | ECS | Posters on site | HS8.3.3

Effect of soil texture on root water uptake   

Imen Mhimdi, Dagmar van Dusschoten, and Mathieu Javaux

Effect of soil texture on root water uptake 

I.Mhimdi, D.van Dusschoten, M.Javaux

Forschungszentrum Jülich, Institute for Plant Sciences (IBG-2 ),  Jülich, Germany

Catholic University of Louvain, Earth and Life Institute, Louvain La Neuve, Belgium

Understanding how root water uptake (RWU) depends on soil properties is a key to estimate plant transpiration dynamics and its response to climate. Despite the fact that soil texture plays an important role in determining plant water availability and mechanical resistance, texture and RWU have not often been considered simultaneously in literature. Recently, a novel method was developed by (van Dusschoten et al, 2020), the SWaP (Soil Water Profiler), in which soil water content and its depletion could be monitored during a modulated light regime in order to derive the RWU profile. The scope of our work is to investigate with the SWaP how soil texture impacts RWU dynamics. We hypothesize that the soil texture will impact the distribution of the rhizosphere resistance in the rhizosphere and thereby its RWU.

Eight faba bean (Vicia Faba) plants were grown in 45cm PVC pots, two soil textures (Loamy and Sandy) with different dry density were used. The plants were subjected to progressive water deficits, and were measured continuously with the SWaP, while applying light modulations during daytime to measure instantaneous 1D water content and derived root water uptake profiles. In combination with the SWaP, several MRI measurements were performed combined with image analysis, in order to determine the local root length distribution and its relation to RWU.

For loamy soil, MRI measurements showed a structured spiral shape, an extensive and deeper root system with higher root diameter. Roots were less smooth, tortuous and with denser lateral roots in sandy soil. In both textures, root water uptake decreased with depth, which can be explained by the less abundant roots in lower soil layers and a higher resistance for the deeper roots (Müllers et al, 2023). Root water uptake profiles and total water uptake dynamics were different, between soil types, which could partially be attributed to differences in root distribution.

References

van Dusschoten et al., 2020, Spatially resolved root water uptake determination using a precise soil water sensor, Plant Phys.

Müllers et al., 2023, Deep-water uptake under drought improved due to locally increased root conductivity in maize, but not in faba bean, Plant, Cell & Environment.

How to cite: Mhimdi, I., van Dusschoten, D., and Javaux, M.: Effect of soil texture on root water uptake  , EGU General Assembly 2024, Vienna, Austria, 14–19 Apr 2024, EGU24-19179, https://doi.org/10.5194/egusphere-egu24-19179, 2024.

EGU24-20215 | Orals | HS8.3.3

Modelling of soil water regime in forested areas: potential benefits of seasonally variable soil hydraulic properties 

Václav Šípek, Lukáš Vlček, Jan Hnilica, and Miroslav Tesař

Soil moisture plays a key role in the hydrological cycle by partitioning of precipitation between evapotranspiration and deep infiltration. The ongoing climate change is causing an increase in air temperatures, changes in precipitation patterns and decrease in winter snow cover. It simultaneously shifts spring snowmelt towards winter months. Both air temperature and precipitation patterns are suspected to be one of the influential factors affecting changes in soil hydraulic properties. Thus, the ongoing climate change can alter soil hydraulic properties, commonly considered time-invariant, and the prediction of future soil moisture regime can therefore be more uncertain than originally thought.

We measured a saturated hydraulic conductivity using an automatic single-ring infiltrometer thorough one entire year in a monthly time-step in the spruce covered site. Higher infiltration rates were regularly observed in the middle of a vegetation season compared to lower rates observed in a dormant season. Based on this finding we implemented a new function, enabling the seasonal variation of the saturated hydraulic conductivity, into the simple bucket-type soil moisture model. The root-mean square error of soil moisture prediction decreased by one-third and Nash-Sutcliffe efficiency increased significantly indicating possible benefits of a new concept. Main reasons behind the seasonal variability of soil hydraulic properties in uncultivated sites can be numerous (encompassing biological activity, changes in the root architecture, wetting/drying and freezing/thawing cycles altering the pore space) and deserve further investigation.

The major outcome is represented by the concept enabling a more efficient prediction of soil moisture regime outside the vegetation season, which is increasingly more important as the onset of soil drought can often be observed at the end of the dormant season. Furthermore, modelling of a climate change impact on the availability of water resources will also benefit from a better prediction of the soil moisture by considering regular structural changes of soil.

How to cite: Šípek, V., Vlček, L., Hnilica, J., and Tesař, M.: Modelling of soil water regime in forested areas: potential benefits of seasonally variable soil hydraulic properties, EGU General Assembly 2024, Vienna, Austria, 14–19 Apr 2024, EGU24-20215, https://doi.org/10.5194/egusphere-egu24-20215, 2024.

EGU24-21812 | Orals | HS8.3.3

SWAP 50 year: Advances in modelling soil-water-atmosphere-plant interactions 

Marius Heinen, Martin Mulder, Jos van Dam, Ruud Bartholomeus, Quirijn de Jong van Lier, Janine de Wit, Allard de Wit, and Mirjam Hack-ten Broeke

Modelling soil-water-atmosphere-plant interactions and the modelling of processes in the unsaturated zone is performed in research and engineering projects worldwide, often extended to practical applications by stakeholders. The hydrological model SWAP stands out as a frequently used tool in this context. We consider the SWAP model and its predecessors like SWATR and SWACROP to have been initiated half a century ago, in 1974, in an article by Feddes, Bresler and Neuman in Water Resources Research entitled ‘Field test of a modified numerical model for water uptake by root systems’.


Over the years, the evolution to the present version of SWAP went through a great number of alterations, additions and improvements. In this contribution we will provide an overview on these developments, especially those from most recent years. This will include, amongst others, root growth dynamics, root water uptake and links to crop growth modelling. We aim on further improvements given new challenges like those resulting from climate change, extreme weather events, aspects of environmental sustainability, model parameterization, and model structure.


How to cite: Heinen, M., Mulder, M., van Dam, J., Bartholomeus, R., de Jong van Lier, Q., de Wit, J., de Wit, A., and Hack-ten Broeke, M.: SWAP 50 year: Advances in modelling soil-water-atmosphere-plant interactions, EGU General Assembly 2024, Vienna, Austria, 14–19 Apr 2024, EGU24-21812, https://doi.org/10.5194/egusphere-egu24-21812, 2024.

EGU24-22231 | Orals | HS8.3.3

Forest succession drives systematic change of root-mycorrhizal foraging strategies 

Zeqing Ma, Gaigai Ding, Wenjing Zeng, Tao Yan, and Lijuan Sun

Plant nutrient foraging depends on roots and mycorrhizal fungi, which are affected by plant carbon (C) investment and soil nutrient availability. The C supply for root metabolism and associated fungi might be diminished as the host plant size increases, while the quality and quantity of soil nitrogen (N) change with forest succession. There is still no holistic understanding of how the organization of belowground mycorrhizal root structure and fungi in the nutrient acquisition continuum shifts with forest age and soil resources, which restrains our understanding of the functional relations among roots, fungi, and soil. Here we examined the shifts in the absorptive root and mycorrhizal strategies, and changes in soil-associated fungal community compositions along a temperate larch forest chronosequence nested with a long-term N fertilization gradient. We found that the effect of forest age outweighed soil N addition in our forest. As tree age increased, root respiration and specific root length decreased, but protective investments such as tissue density and phenolics decreased. Meanwhile, the proportion of ectomycorrhizal fungi with a short-distance exploration type increased, but those with a long-distance exploration type decreased. The shifts in root and mycorrhizal fungal traits demonstrate a nutrient acquisition continuum from "young explorative roots with long mycorrhizas" to "mature conservative roots with short mycorrhizas". A trade-off between the root architecture and root segment metabolism, and a complementarity between the size of the root system and mycorrhizal exploration types functionally constrains this nutrient acquisition continuum. Our results thus suggested forest succession drives the covariations among root system size, root metabolic rate, mycorrhizal fungal exploration type, and soil-associated fungal functional groups.

How to cite: Ma, Z., Ding, G., Zeng, W., Yan, T., and Sun, L.: Forest succession drives systematic change of root-mycorrhizal foraging strategies, EGU General Assembly 2024, Vienna, Austria, 14–19 Apr 2024, EGU24-22231, https://doi.org/10.5194/egusphere-egu24-22231, 2024.

EGU24-692 | ECS | Orals | HS8.3.7

Field quantification of the water productivity of a peach orchard within an arid climate zone. 

Ines Toumi, Mohamed Ghrab, Olfa Zarrouk, and Kamel Nagaz

Irrigation management is the key to improving water productivity in fruit orchards growing under marginal conditions in dry areas where the water for irrigation is significantly decreasing. The aim of this work was to determine the yield response to variable water supply of an early maturing peach orchard and to assess the water productivity in an environment where the water is extremely scarce. Field experiments were carried out on peach trees for a private farm in south of Tunisia for two relevant period (2010/2011 and 2013/2015), in an area with sandy soil, hot summer and mild winter conditions.  Old trees were irrigated with different irrigation strategies 100%, 60%, 50%, 40% and 20% of the estimated ETc. In the first experimental period, Flordasar peach trees were subjected to DI40, DI60 and DI20 and gave a variable yields ranged between 23-30 Kg tree-1. The highest WP values were obtained for DI60 et DI40, respectively 4.26 and 3.63 kg m-3. However, experimental work in peach trees under DI50 with two irrigation strategies, average water productivity varied between 2.21-2.24 and 2.81-3.14 kg m-3 respectively when yields was increased from 25.5 to 34.1 Kg tree-1. The yield reductions under low to severe water defcits accompanied by gains in WP may be justifable in the light of anticipated water restriction.

How to cite: Toumi, I., Ghrab, M., Zarrouk, O., and Nagaz, K.: Field quantification of the water productivity of a peach orchard within an arid climate zone., EGU General Assembly 2024, Vienna, Austria, 14–19 Apr 2024, EGU24-692, https://doi.org/10.5194/egusphere-egu24-692, 2024.

EGU24-1726 | ECS | Orals | HS8.3.7

Benefits of increasing soil organic carbon to reduce drought stress in maize under climate change 

Maria Eliza Turek, Annelie Holzkämper, and Attila Nemes

Increasing frequencies and intensities of drought periods are likely to aggravate conflicts between agricultural demands and other human and ecological demands for water resources. Improving the natural soil water retention capacity can help to defuse these conflicts and at the same time strengthen climate mitigation, biodiversity, and food security. Increasing soil organic carbon content (SOC) is seen as a promising negative emission technology for the agricultural sector, with the co-benefit of potentially increasing the soil water retention capacity. We tested how different levels of SOC at varying soil depths influence in the transpiration reduction caused by drought stress (Treddry) in maize under current and future climatic conditions. We used the SWAP (Soil Water Atmosphere Plant) model validated utilizing information from a long-term lysimeter for a typical Swiss soil and applied it at three distinct climatic regions. A pedotransfer function (PTF) was used to indirectly assess the effects of SOC on soil hydraulic properties that affected the drought stress. Study findings revealed that increasing SOC down to 65 cm depth is beneficial to reduce drought limitations in maize. These benefits are minimal if SOC is only increased in the top 25 cm but become considerable if SOC is increased down to 65 or 135 cm depth. With a 2% addition of SOC down to 65 cm depth, a considerable average transpiration gain of 40 mm can be reached. It appears that a greater or deeper SOC addition would not return substantial extra benefits in terms of offsetting more crop drought stress rooting in the changing climate.

How to cite: Turek, M. E., Holzkämper, A., and Nemes, A.: Benefits of increasing soil organic carbon to reduce drought stress in maize under climate change, EGU General Assembly 2024, Vienna, Austria, 14–19 Apr 2024, EGU24-1726, https://doi.org/10.5194/egusphere-egu24-1726, 2024.

EGU24-2081 | ECS | Orals | HS8.3.7 | Highlight

Exploring the possibilities to reduce irrigation demands through adaptations in soil and crop management 

Malve Heinz, Maria Eliza Turek, Annelie Holzkämper, Bettina Schaefli, and Christoph Raible

In Central Europe, increasing temperatures and declining summer precipitation intensify the water and heat stress on crops and reduce water availability for irrigation from rivers and groundwater. Thus, approaches that reduce the need for irrigation are required. In this study, we quantify the potential of soil and crop management adaptations to reduce irrigation deficits for a mid-sized rainfed catchment in Switzerland. The Broye catchment, comprising 68 % agricultural land with a notable portion dedicated to irrigated agriculture, faces frequent summer irrigation bans. We employ the field-scale agro-hydrological model (SWAP) aiming to 1) quantify irrigation demand at the catchment scale, 2) assess the impacts of temporary irrigation bans on irrigation deficits, and 3) explore the potential of soil and crop management adaptations to reduce these irrigation deficits. SWAP simulates horizontal solute, heat and water flow in the vadose zone and crop growth at a daily timestep. The model calibration process involves a comprehensive global sensitivity analysis and parameter optimization. The optimization aims to maximize the model's fit to reference data on crop yield and seasonal irrigation amounts from the study region. Spatial climate, land use, and soil input data enable the quantification of irrigation water demand on the catchment scale. We simulated the exceptionally hot and dry summer of 2022, revealing a 57 % deficit in water supply and again emphasizing the importance of reducing reliance on irrigation. We further evaluate the effectiveness of measures such as increased soil organic carbon content and planting earlier maturing crop varieties in reducing irrigation demand. Our findings provide valuable insights for sustainable water management in midsized rainfed catchments, particularly in the face of climate change and evolving water use conflicts. As a next step, we plan to couple the field-scale model with a catchment-scale rainfall-runoff model to evaluate the effects of implementing such measures on the catchment's water balance.

How to cite: Heinz, M., Turek, M. E., Holzkämper, A., Schaefli, B., and Raible, C.: Exploring the possibilities to reduce irrigation demands through adaptations in soil and crop management, EGU General Assembly 2024, Vienna, Austria, 14–19 Apr 2024, EGU24-2081, https://doi.org/10.5194/egusphere-egu24-2081, 2024.

EGU24-2190 | ECS | Orals | HS8.3.7

Field and numerical experiments of subsurface drainage systems in saline and clay interlayered fields in arid regions 

Chenyao Guo, Chenzhi Yao, Jingwei Wu, Shuai Qin, and Haoyu Yang

A reasonable layout of subsurface drainage systems is considered essential for maximizing its drainage and salt control effectiveness. In the saline-alkali farmland of arid regions in Northwest China, clay interlayers are common; however, the influence of clay interlayers on the layout of the subsurface drainage has not been extensively considered in the literature. This study investigated the process of subsurface drainage and salt discharge in salt-affected fields with clay layers using field experiments and numerical simulations. Four field experiments were conducted, considering three different relative positions between the drainage pipes and clay interlayers. The results showed that the clay interlayers hindered water infiltration; however, the distribution of soil salinity in the soil profile varied with the buried depth of drainage pipes at different positions relative to the clay layer. When the buried depth of drainage pipes increased, the amount of water and salt discharged from drainage pipes increased, and the increase rate in salt discharge was greater than water drainage. A numerical model was calibrated and validated using the field experiment data, and 25 orthogonal numerical experiments were conducted to investigate the soil desalination effects of buried depth of drainage pipes, spacing between the pipes, permeability of the interlayer, and position of the clay interlayer. The results showed that the drainage pipe buried depth, spacing, and permeability of the clay layer had significant effects on the desalination rate (P < 0.01), while the position of the clay interlayer had no significant effect (P > 0.05). Therefore, subsurface drainage pipes should be placed below the clay interlayer. The desalination rate linearly increased with the buried depth of drainage pipe and permeability of the interlayer, and it increased exponentially with decreased spacing. An empirical formula for soil desalination rate considering interlayer and subsurface drainage pipe layout parameters was fabricated and used to determine the appropriate layout parameters.

How to cite: Guo, C., Yao, C., Wu, J., Qin, S., and Yang, H.: Field and numerical experiments of subsurface drainage systems in saline and clay interlayered fields in arid regions, EGU General Assembly 2024, Vienna, Austria, 14–19 Apr 2024, EGU24-2190, https://doi.org/10.5194/egusphere-egu24-2190, 2024.

EGU24-3837 | ECS | Posters on site | HS8.3.7 | Highlight

Exploring climate-adaptive drainage in water management: Enhancing soil moisture, crop resilience and groundwater recharge. 

Erika Lucía Rodríguez Lache, Guillaume Blanchy, Ali Mehmandoostkotlar, and Sarah Garré

Drainage systems are essential for cultivated fields, ensuring optimal growth conditions for crops by preventing root zone wet stress. However, these conventional drainage systems also lead to a significant loss of water, a valuable resource that could be used to sustain crops during dry (summer) months. To address this, climate adaptive drainage or controlled drainage is employed, raising the water table “when possible given the ongoing agricultural activities”. This approach enhances aquifer recharge and stores excess water for use during the summer. Nevertheless, it remains unclear for farmers and water managers whether climate-adaptive drainage will improve agricultural performance and, if so, how to precisely manage water levels throughout the growing season to optimize performance. 

In this study, we conduct a synthetic experiment using the SWAP model to investigate the complex interaction between drainage types under different meteorological conditions, soil characteristics, and crop types. Our research aims to provide insights into the effect of climate-adaptive drainage for both farmers and water managers.

Our findings highlight that controlled drainage significantly enhances soil water content in sandy and loamy soils, contributing to climate resilience. However, its effectiveness in clay soils is small. It is important to note that climate-adaptive drainage has the potential to raise groundwater levels across all soil types, posing a potential risk of oxygen stress on crops. Regardless of soil type, the implementation of controlled drainage results in increased surface runoff and groundwater recharge, associated with a reduction in drainage flux. While the augmented surface runoff  poses potential issues such as soil erosion and water pollution, the positive aspect lies in the enhanced groundwater recharge, crucial for maintaining water availability and supporting ecological systems.

How to cite: Rodríguez Lache, E. L., Blanchy, G., Mehmandoostkotlar, A., and Garré, S.: Exploring climate-adaptive drainage in water management: Enhancing soil moisture, crop resilience and groundwater recharge., EGU General Assembly 2024, Vienna, Austria, 14–19 Apr 2024, EGU24-3837, https://doi.org/10.5194/egusphere-egu24-3837, 2024.

EGU24-6546 | ECS | Posters on site | HS8.3.7

The effect of land use types and climate change on soil moisture profile dynamics 

Mengqi Wu, Tobias Klauder, Mika Tarkka, Doris Vetterlein, and Steffen Schlüter

Soil moisture, as a key indicator of soil functionality, is significantly influenced by the evolution of soil-plant systems and the hydrologic cycle. Little long-term data is available about how land use and climate change affect the spatial and temporal distribution of soil water. In particular the variations in deeper subsoil layers are poorly documented. Here, the effects of five land use types, including two croplands with conventional and organic farming (CF and OF) and three grasslands with intensive and extensive meadow (IM and EM), as well as extensive pasture (EP) on soil moisture profiles were investigated at the Global Change Experimental Facility (GCEF), at Bad Lauchstädt in the German dryland belt. The facility harbors two climate treatments. The ambient climate and a future climate with increased temperature by ~0.55 C across seasons, and the altered precipitation patterns by ~9 % additional irrigation in spring and autumn, and ~21 % reduction in summer. The soil moisture profiles were bi-weekly monitored with a portable probe (TRIME Pico IPH) down to 110 cm for two continuous years.

Soil moisture content in topsoil and subsoil reflected the presence and size of transpiring plants, i.e. from October to next April, the soil water content was lower in grasslands than in croplands, which planted winter crops. During summer, there was a marked decrease in soil water content in the deeper soil layers of grasslands, while the crop on the cropland was already harvested. As a result, the recovery of soil water storage was faster during winter in croplands than in grasslands. Within croplands, OF had higher moisture than CF below 30 cm during the whole growing season and beyond due to less vigorous growth imposed by nutrient deficits. Within grasslands, differences in soil moisture only emerged in deeper soil (> 70 cm). In general, soil moisture in the shallow soil layers (0 - 20 cm) was very similar across land uses and climate scenarios and these clear differences only emerged in deeper soil. In the deeper soil (< 50 cm), croplands and extensively used grasslands showed an obvious increase of soil moisture in future treatment, especially during wet spring and summer.

Our results clearly indicate long-term differences in soil moisture between the land uses. Climate manipulation at the GCEF only manifests itself in the subsoil (> 50 cm), by contrast, topsoil (< 30 cm) was more controlled by short-term dynamics induced by evaporation and precipitation. These findings stress the importance of deep soil moisture monitoring for a more comprehensive assessment of the water budget. 

How to cite: Wu, M., Klauder, T., Tarkka, M., Vetterlein, D., and Schlüter, S.: The effect of land use types and climate change on soil moisture profile dynamics, EGU General Assembly 2024, Vienna, Austria, 14–19 Apr 2024, EGU24-6546, https://doi.org/10.5194/egusphere-egu24-6546, 2024.

EGU24-6804 | ECS | Posters on site | HS8.3.7 | Highlight

Groundwater Recharge in Pecan Orchards Under Different Irrigation Systems to Reduce the Impacts of Climate Change in the Southwest USA 

Jorge Preciado, Alexander Fernald, and Richard Heerema

Water balance is important to provide information and to conserve water. The flow of water in the system can be used to help and manage water supply, changes in management can increase water productivity in arid regions. For this study, soil water content was measured from one soil column within the orchards using time-domain reflectometry probes installed at different depths in the root zone of pecan fields. This data was analyzed to compare the irrigation systems. Water that passes the root zone was considered deep percolation. This research compared the amount of water stored on each field and water consumed by the trees for the last four irrigation seasons 2020 - 2023. Quantifying water from irrigation was essential to know how much water would recharge the Mesilla basin. Percolation was higher in the flood section, with 52 % of the total water applied, while in the drip, percolation was less than 5% of the total water applied moving down in the field for the 2021 growing season. In addition, there were differences in crop yield between the irrigation systems. This study estimated recharge and modeled water flow through the soil in drip and flood-irrigated pecan orchards to understand better surface water and groundwater interactions for improved river basin water management strategies and quantifies water stored in the ground lost through evapotranspiration. In addition, this project evaluates which irrigation scenario could best grow sustainable pecans in arid regions, reducing water use while maintaining crop production. It presents a balance of the two irrigation systems to understand the implications of climate change on the water cycle and achieve sustainability in the crops grown in the area.

How to cite: Preciado, J., Fernald, A., and Heerema, R.: Groundwater Recharge in Pecan Orchards Under Different Irrigation Systems to Reduce the Impacts of Climate Change in the Southwest USA, EGU General Assembly 2024, Vienna, Austria, 14–19 Apr 2024, EGU24-6804, https://doi.org/10.5194/egusphere-egu24-6804, 2024.

EGU24-6964 | ECS | Orals | HS8.3.7

Surface Fertigation Practices for Smallholder Farmers in the North China Plain 

Xiulu Sun, Henk Ritzema, Jos van Dam, and Petra Hellegers

The North China Plain (NCP) stands as a densely populated region vital for agriculture, sustaining a large population through intensive farming practices. However, the reliance on irrigation and fertilization in the region has led to inefficiencies in water and nutrient use, compromising the sustainability of agriculture and contributing to environmental degradation. To address these challenges, the focus of this study is on optimizing water and fertilizer management, particularly through surface fertigation. This method involves applying fertilizers dissolved in irrigation water to enhance water use efficiency (WUE) and nitrogen use efficiency (NUE). Each section explores different facets of surface fertigation, aiming to improve the uniformity of fertilizer distribution in irrigation water, subsequently enhancing crop yields while reducing water and fertilizer leaching.

A participatory study in the People's Victory Canal Irrigation District revealed farmers' satisfaction with current practices but identified obstacles to adopting more efficient technologies. Challenges included a lack of knowledge about advanced fertigation systems, constraints of small-scale farming, and high implementation costs. Tailored guidelines grounded in empirical evidence and considering socio-economic factors are crucial for overcoming these challenges. An experimental approach in subsequent sections evaluated surface fertigation practices tailored to NCP farmers' fields. Traditional methods showed low field application efficiency and uneven distribution of water and fertilizers. The WinSRFR model aided in understanding these practices, leading to proposed methods for enhancing application efficiency and distribution uniformity. Optimal irrigation depths for wheat and maize were identified to be 95 mm and 80 mm, respectively. Continuing with field experiments and modeling, the study analyzed the impact of irrigation and fertigation practices on crop yield, WUE, NUE, and nitrogen loss. The findings emphasized the need for integrating optimized irrigation and fertigation strategies for sustainable crop production and minimized nitrogen loss. The viability of transitioning smallholder farmers in the NCP to organic fertilizer application through surface fertigation was explored. A 50% organic fertilizer ratio was found to balance maintaining crop yield and minimizing nitrogen leaching. The study advocated for compensation to offset additional costs for farmers adopting organic fertilizers.

In conclusion, the study highlights inefficiencies in current irrigation and fertilization practices in the NCP and suggests surface fertigation as a promising solution. Refining practices, such as adjusting irrigation depth and fertigation scheduling, can significantly enhance WUE, NUE, and mitigate environmental impacts. The research underscores the importance of tailoring solutions to local conditions and farmer preferences, emphasizing the need for government support and incentives to facilitate the adoption of sustainable practices. The research methodology reflects a commitment to evidence-based approaches, utilizing participatory tools, field experiments, and simulation models to assess and refine fertigation strategies. Looking ahead, successful implementation of improved practices relies on understanding and engaging with the local farming community, addressing their concerns, enhancing their knowledge, and providing cost-effective solutions. The research suggests a pathway towards sustainable agriculture in the NCP, emphasizing the need for a comprehensive approach considering both environmental and socio-economic factors.

How to cite: Sun, X., Ritzema, H., van Dam, J., and Hellegers, P.: Surface Fertigation Practices for Smallholder Farmers in the North China Plain, EGU General Assembly 2024, Vienna, Austria, 14–19 Apr 2024, EGU24-6964, https://doi.org/10.5194/egusphere-egu24-6964, 2024.

Abstract: The Hetao Irrigation District (HID) is located in the arid region along the upper reach of the Yellow River and is an important grain production area in northwest China. Water diverted from the Yellow River is an indispensable water supply of the crop production in this region. Unfortunately, traditional irrigation, drainage and fertilization practices have resulted in severe soil salinization and inefficient of water use, which poses a great challenge to food security and water resources. Therefore, it is important to search a new practice that can achieve water saving, salinity control, and yield increase simultaneously. To this end, this study applied a framework that combined the SWAP model and a multi-criteria decision-making method.

First, we used a total of 21 station-years of experimental data from 12 spring wheat and spring maize sites for parameter calibration by the PEST package. The sensitive parameters of spring wheat and spring maize were obtained, and the evaluation showed that the SWAP model is capable of simulating seasonal variations of leaf area index, evapotranspiration, soil moisture and soil salt content. Specially, we showed that the parameters SALTMAX (threshold salt concentration in soil water) and TSUMEA (temperature sum from emergence to anthesis) were obviously different from the default values of wheat and maize in the SWAP.

Second, we designed simulation scenarios based on the combinations of irrigation, drainage and fertilization practices, constrained by the local customs and water supply from the Yellow River. The simulated crop yield, water use efficiency (i.e., the crop production per irrigation water amount), and soil salt content change were obtained by the SWAP model.

Finally, based on the SWAP-simulated results, optimal practices were obtained with the help of the VIKOR method, a multi-criteria decision-making method which has the advantage of objectively determining the weights of water use efficiency, crop yield, and soil salt content change. Compared with the traditional practices by farmers, the optimal practice can not only increase crop yield by 20 per cent and improve water use efficiency by more than 10 per cent, but also ensure the soil salt content does not increase.


Keywords: Irrigation; Drainage; Fertilization; SWAP model; VIKOR method

How to cite: Duan, S. and Lei, H.: Searching for optimal practices for water saving, salinity control and yield increase in an arid and salinity irrigated area of China using the SWAP-based method., EGU General Assembly 2024, Vienna, Austria, 14–19 Apr 2024, EGU24-7726, https://doi.org/10.5194/egusphere-egu24-7726, 2024.

EGU24-8199 | Posters on site | HS8.3.7

Comparing Hydrus-2D/3D and Philip (1984)’s model to assess wetting bulb expansion from buried and surface point sources 

Dario Autovino, Massimo Iovino, and Giorgio Baiamonte

In surface and subsurface drip irrigation systems, predicting the size expansion of the wetting bulb and the irrigation time are mandatory for water saving, and help drive their design and scheduling. At this aim, different hydrological models have been suggested to predict the wetting bulb expansion from buried and surface point sources. In this work, we compare the results obtained by the application of Hydrus-2D/3D and Philip (1984) model.

The Philip (1984) model accounts for the Gardner conductivity function, which is not implemented in Hydrus 2D/3D. Moreover, in the Philip (1984) model, a certain approximation in the choice of the water contents to be used for calculating the average volumetric water content behind the wetting front, θav, is necessary, also considering that definitions do not seem univocal. For example, the water content at the wetting front was assumed as the θav, value when soil hydraulic conductivity, K, was equal to 1 mm/day by Cook et al. (2003) and 1 mm/h by Thorburn et al. (2003).

For the purpose of the comparison, an extended analysis aiming at detecting the parameter ranges of the van Genuchten-Mualem model (van Genuchten 1980), which provide hydraulic conductivity functions matching those of Gardner, was preliminary conducted. Then, for van Genuchten-Mualem parameters falling in such parameters’ ranges, the average volumetric water content that is required in the Philip (1984) model was calculated in Hydrus-2D/3D.

For sandy-loam soil, results showed a quite good agreement between the simplified Philip (1984) model and the more accurate but numerically demanding Hydrus 2D/3D, suggesting that Philip (1984)’s model can be successfully applied to predict the wetting bulb expansion from buried and surface point sources, provided the average volumetric water content in the soil behind the wetting front and the saturated hydraulic conductivity are appropriately considered.

Keywords: wetting bulb, buried sources, surface sources, Philip (1984)’s model, Hydrus 2D/3D.

Acknowledgement: This study was carried out within the RETURN Extended Partnership and received funding from the European Union Next-GenerationEU (National Recovery and Resilience Plan – NRRP, Mission 4, Component 2, Investment 1.3 – D.D. 1243 2/8/2022, PE0000005).

References:

Cook, F.J., P.J., Thorburn, K.L., Bristow, and C.M., Cote, “Infiltration from surface and buried point sources: The Average wetting water content”, Water Resour. Res., 2003, 39(12): 1364, doi:10.1029/2003WR002554.

Philip, J.R., “Travel times from buried and surface infiltration point sources”, Water Resour. Res., 1984, 20(7), 990–994, https://doi.org/10.1029/WR020i007p00990.

Thorburn, P.J., F.J., Cook, and K.L., Bristow, “Soil-dependent wetting from trickle emitters: Implications for system design and management”, Irrig. Sci., 2003, 22: 121–127, doi 10.1007/s00271-003-0077-3.

van Genuchten, M. Th., “A closed form equation for predicting the hydraulic conductivity of unsaturated soils”, Soil Sci. Soc. Am. J., 1980, 44: 892-898.

How to cite: Autovino, D., Iovino, M., and Baiamonte, G.: Comparing Hydrus-2D/3D and Philip (1984)’s model to assess wetting bulb expansion from buried and surface point sources, EGU General Assembly 2024, Vienna, Austria, 14–19 Apr 2024, EGU24-8199, https://doi.org/10.5194/egusphere-egu24-8199, 2024.

EGU24-9057 | ECS | Orals | HS8.3.7

Temporal impact of treated wastewater irrigation on field hydraulic conductivity 

Lin Wang, Tim De Cuypere, Sabien Pollet, Sarah Garré, and Wim Corneils

Hydraulic properties of agricultural soils exhibit dynamic temporal variations influenced by field management practices, such as tillage and irrigation, as well as climatic factors, particularly changes in precipitation and temperature. With the emergence of using treated wastewater (TWW) in irrigation as a solution to alleviate increased pressure on available water resources, but characterized by elevated salt and solute concentrations, understanding its potential impact on soil hydraulic properties is crucial. In this study, we aimed to discern the influences of field management practices and irrigation water sources on the temporal variability of soil hydraulic conductivity.

Mini disk infiltrometers were employed to assess near-saturated hydraulic conductivity Kh and associated soil indicators (including soil’s electrical conductivity ECe, sodium adsorption ratio SAR, water repellency WR, bulk density BD, aggregate stability AS, and air permeability Ka) in the top 20 cm of a Retisol soil in Beitem (50°91′N, 3°12′E), Belgium. A comparative analysis was conducted to evaluate the effects of irrigation using treated wastewater (from households, from vegetable industry and from potato industry) and rainwater, relative to those under rainwater irrigation conditions. All treatments significantly affected ECe and SAR. Across four replicated plots per treatment, Kh was measured at distinct matric potentials on various dates, spanning a wet (2021) and a dry (2022) year, during a crop rotation of cauliflower (Brassica oleracea L.) and spinach (Spinacia oleracea L.). The plots were tilled with a rotary harrow till 30 cm depth to prepare the seedbeds.

Our findings highlighted tillage as the predominant factor influencing Kh . Irrespective of the irrigation type, Kh increased post-tillage and subsequently decreased throughout the growing season. Yearly weather differences also played a significant role, with the dry, warm year resulting in a higher average Kh at each matric potential. Surprisingly, there were no significant differences in Khbetween irrigation treatments over two crop cycles

Despite the elevation of soil salinity (ECe) and sodicity (SAR) with TWW irrigation, it did not detrimentally impact or other soil attributes (WR, BD, AS, and Ka) in this study. Our results underscore the importance of considering the interplay of tillage, weather conditions, the timing/frequency of irrigation/rain events, and matric potential when evaluating the effects of different irrigation sources on soil hydraulic properties.

How to cite: Wang, L., Cuypere, T. D., Pollet, S., Garré, S., and Corneils, W.: Temporal impact of treated wastewater irrigation on field hydraulic conductivity, EGU General Assembly 2024, Vienna, Austria, 14–19 Apr 2024, EGU24-9057, https://doi.org/10.5194/egusphere-egu24-9057, 2024.

EGU24-9563 | ECS | Orals | HS8.3.7

A model for predicting permeability of geotextile envelope after combined clogging in arid areas 

Shuai Qin, Chenyao Guo, and Jingwei Wu

The clogging problem of geotextile envelopes in subsurface drainage pipes in arid areas can lead to a reduction of the drainage capacity in the drainage system. The current research on combined clogging is mostly in the stage of phenomenological observations or indoor experiments, and quantitative methods are lacking. In this study, a model for predicting permeability of geotextile envelope was developed using pore distribution theory of geotextile envelope. Then, a stepwise coupled combined clogging model was proposed based on the evolution characteristics of physical and chemical clogging. The coupled model was verified by field sampling, and the measured results of the three sites were within the range of the predicted values. Then, the main factors affecting the combined clogging model of the geotextile envelope were analyzed, and the clogging evolution was predicted. The results showed that the combined clogging model was sensitive to the physical clogging coefficient β1 during the first 30 days and more sensitive to the calcium carbonate saturation index (SI) after 30 days of drainage. When β1 was equal to 0.3, a saturation index greater than 1.0, which corresponds to drainage mineralization exceeding 3.0 g/L, indicated a high risk of clogging in Xinjiang.

How to cite: Qin, S., Guo, C., and Wu, J.: A model for predicting permeability of geotextile envelope after combined clogging in arid areas, EGU General Assembly 2024, Vienna, Austria, 14–19 Apr 2024, EGU24-9563, https://doi.org/10.5194/egusphere-egu24-9563, 2024.

EGU24-11295 | ECS | Orals | HS8.3.7

Development of a new modeling framework for estimating water needs in lowland agricultural areas: linking GIS database and SWAP simulation 

Giulio Gilardi, Darya Tkachenko, Michele Rienzner, and Arianna Facchi

The implementation of adaptation strategies is becoming increasingly important to mitigate climate-related risks and water resource overuse in agriculture. When considering large spatial domains, the assessment of alternative irrigation techniques can be carried out using a modelling approach, useful to take into consideration all the relevant processes in complex agro-ecosystems.

In ‘fully distributed’ models, the domain of interest is divided into simulation units, each characterized by a unique set of parameters and inputs, by using a regular grid. In ‘semi-distributed’ models, simulation units correspond with spatial units of different size and shape but homogeneous in terms of parameters and inputs. Moreover, if the description of processes is based on simplified schematization of the physical system and equations, models are referred as ‘conceptual’, whereas if an accurate physical-mathematical description is adopted, they are considered as ‘physically based’. Because of their complexity and computational requirements, ‘physically based’ models are often applied in a ‘semi-distributed’ manner when describing large territories.

A framework is currently under development to directly link a file-based vector database (GeoPackage), describing the main features of an agricultural area, and ‘physically based’ simulations carried out by the SWAP model (https://www.swap.alterra.nl/). The framework, written in Python, runs within the QGIS environment. It requires the user to define seven basic themes: I) a district domain, II) soil types, III) land uses, IV) irrigation water distribution areas, V) homogeneous groundwater depth polygons or groundwater level measuring stations, VI) homogeneous agro-meteorological polygons or agro-meteorological stations, and VII) a DTM raster layer. From the intersection of the layers considered, a number of polygons are generated. Next, the polygons are post-processed based on of the following options: a) aggregate all polygons characterized by the same value of the input themes, b) maintain all the polygons obtained through the intersection operation, or c) aggregate polygons based on a critical distance (meters). This last option is useful to limit the number of polygons and reduce the computational effort. In the case of multiple groundwater level or agro-meteorological measuring stations, the framework calculates the values of the variables to be assigned to each polygon through the ‘Inverse Distance Weighting’ (IDW) algorithm. Finally, the framework links each unit to its parameter set, transferring the information stored in the database into the SWAP input files. Simulation results are saved in a tabular format that allows them to be analyzed according to different aggregations (by land use, soil type, etc.) and to produce time series graphs or vector maps.

The application of the tool for the estimation of the irrigation requirements and the percolation fluxes of the Lomellina region (northern Italy) under the current and alternative irrigation strategies will be presented and discussed. The study area, located on the left bank of the Po River, covers more than 125,000 hectares mainly cropped with rice. In more recent years, this area is experiencing water shortages and a reduction in aquifer levels.

How to cite: Gilardi, G., Tkachenko, D., Rienzner, M., and Facchi, A.: Development of a new modeling framework for estimating water needs in lowland agricultural areas: linking GIS database and SWAP simulation, EGU General Assembly 2024, Vienna, Austria, 14–19 Apr 2024, EGU24-11295, https://doi.org/10.5194/egusphere-egu24-11295, 2024.

Agricultural activities account for a significant portion of global water consumption, emphasizing the need to improve water productivity in this sector. This can be achieved through the implementation of effective agricultural management practices, such as optimizing crop patterns, adjusting irrigation methods, and improving fertilization practices. The Water Footprint (WF) concept offers a comprehensive approach to assessing water consumption in agriculture, considering different types of water use. By integrating the WF methodology with hydrological modeling programs, a more detailed analysis of water consumption patterns can be achieved, overcoming previous limitations in understanding agricultural water use. This study aims to assess the water consumption patterns of maize under different spatio-temporal dynamics. The WF of maize, including blue, green, and grey components, was calculated using the Soil and Water Assessment Tool (SWAT) model in the Ceyhan Basin (Turkey) between 2011-2020. The study outputs indicated considerable spatial and temporal variations, with a total WF ranging from 350 to 1320 m3/t. Green WF (61-385 m3/t) is found to be less dominant in maize production across the basin, while blue water emerges as the primary component (25 to 870 m3/t). In this study, the utilization of the SWAT model provided detailed spatio-temporal results, allowing for adjustments in agricultural patterns. We obtained that, optimizing the cultivation regions of maize within the Ceyhan Basin has the potential to reduce the total WF by approximately 26% and the blue WF by 47%. This optimization could result in an annual saving of around 135 million m3 of irrigation water. Furthermore, the study also analyzed temporal water consumption patterns. The findings highlight the significant potential for water conservation in agricultural activities through the spatio-temporal optimization of blue and green water, taking into account hydrological characteristics.

How to cite: Muratoglu, A. and Demir, M. S.: Understanding spatio-temporal variations in crop water consumption: Applying the WF Methodology Integrated with the SWAT Model, EGU General Assembly 2024, Vienna, Austria, 14–19 Apr 2024, EGU24-12151, https://doi.org/10.5194/egusphere-egu24-12151, 2024.

EGU24-12460 | ECS | Posters on site | HS8.3.7

Water vapor movement and utilization with condensation in the upper layers of a sandy soil column 

Simran Sekhri, Volker Kleinschmidt, Annette Eschenbach, and Joscha N Becker

In semi-arid and arid regions, prolonged dry spells lead to a significant reduction in topsoil moisture, forming a dry soil layer, where water can only move as vapor. Such conditions hinder young crops with weakly developed root systems to directly reach deep water reservoir. Since there is no indication of gaseous water uptake from soil pores, plants might be able to acquire water from these deep sources when water vapor condensates at night or at a vapor barrier (mulch). To trace potential water vapor uptake by plants, we developed a sand column experiment using deuterium labeled water. The water source column was separated by a glass bead layer and a root barrier (50µm mesh) from the soil to ensure that there was no capillary rise or root uptake of liquid water. Four treatments with three replicates, including planted (Pl), unplanted (Un), mulch variation (Pl+M; Un+M) and an additional unlabeled control column, were installed in a climatic chamber. Vigna radiata a moderately drought resistant plant species was selected for this experiment. Constant day-night cycle with stable temperature and light conditions were maintained for a period of seven days without irrigation. Afterwards, soil samples were collected at 0-5, 5-10 and 10-15 cm depths. Vigna radiata saplings and condensed water samples were collected separately. Cryo-extraction of water from the samples and liquid isotopic water analysis revealed substantial results for the uptake of water vapor by young saplings. Evaporation from the water source into the column was recorded to be 0.7-2.1 ml. The δD/H ratios were analysed using Triple Isotope Water Analyser (Los Gatos Research). The relative potential uptake of water vapor by young saplings was recorded to be as high as 0.56ml for the 'Pl' and 0.35ml for the 'Pl+M' treatment. The utilization of water vapor by young plants in the upper soil layer could prolong plant life during dry spells. Although, it remains uncertain to what extent the prolongation could be maintained.

Keywords: Deuterium Labeled Water, Plant Vitality, Water Conductivity

How to cite: Sekhri, S., Kleinschmidt, V., Eschenbach, A., and Becker, J. N.: Water vapor movement and utilization with condensation in the upper layers of a sandy soil column, EGU General Assembly 2024, Vienna, Austria, 14–19 Apr 2024, EGU24-12460, https://doi.org/10.5194/egusphere-egu24-12460, 2024.

EGU24-18026 | Posters on site | HS8.3.7

Wappfruit, a project for the optimization of the irrigation in agriculture: final results 

Davide Canone, Davide Gisolo, Luca Nari, Francesca Pettiti, Alessio Gentile, Stefano Ferraris, Mattia Barezzi, Umberto Garlando, and Danilo Demarchi

The Wappfruit project objective is to optimize the irrigation techniques for water and energy saving in fruit orchards in the Piemonte Region, Northwest Italy. The stakeholders of the project are Politecnico and the University of Torino, Piemonte Region, Agrion Foundation for Research in Agriculture, Astel S.r.l. (for the industrialisation of the experimental hardware developed by Politecnico di Torino), and three farms (“La Marchisa” and “Lorenzo Sacchetto” – apple orchards and “Paolo Vassallo” – actinidia orchard).  In each farm, two areas were identified, an “experimental area” where the new set-up was tested and a control area where the farmers continued the irrigation as usual.

In the year 2023, the Wappfruit project has shown the potentiality of a smart irrigation solution composed of two kinds of IoT (Internet of Things) nodes employing LoRa technology and governed by a 24/7 server script, written in Python, that acquires soil matric potential and decides the opening and closure of the irrigation pumps in real-time. The soil matric potential thresholds, identified in 2022 and early 2023, (-60 kPa and -25 kPa at 20 cm of depth for the activation of the irrigation, respectively in the apple and Actinidia orchards; -50 kPa at 40 and 20 cm of depth and -18 kPa at 20 cm of depth, for the deactivation of the irrigation, again respectively for apple and Actinidia orchards) were verified again after a campaign in which soil parameters (saturated soil water content, infiltration velocity at saturation) were measured. These values were used for new model simulations that included irrigation. The thresholds for the apple orchards were confirmed, whereas new thresholds were identified for the Actinidia: -12 kPa (activation) and -5 kPa (deactivation). Results highlight that these thresholds can activate and deactivate the irrigation appropriately. The 2022 simulations show a matric potential in agreement with the measures collected (R between 0.51 and 0.88). Moreover, the 2023 simulations with modelled irrigation show a good agreement with the measures in the experimental area. Both the simulations and the real optimized irrigation generally show lower values if compared with the irrigation of the farmers (range: 13 – 217.5 mm/ha), with an exception in one apple orchard, where the model suggests more irrigation than expected, likely because of an overestimation of the water infiltration velocity. The hardware/software design and implementation have shown that low-cost low-power electronic devices and artificial intelligence can be reliable and very inexpensive for water and energy savings. The remote control of the system is another important achievement. Moreover, optimized irrigation does not affect the vegetation productivity and increases the fruit quality.

How to cite: Canone, D., Gisolo, D., Nari, L., Pettiti, F., Gentile, A., Ferraris, S., Barezzi, M., Garlando, U., and Demarchi, D.: Wappfruit, a project for the optimization of the irrigation in agriculture: final results, EGU General Assembly 2024, Vienna, Austria, 14–19 Apr 2024, EGU24-18026, https://doi.org/10.5194/egusphere-egu24-18026, 2024.

EGU24-18956 | Posters virtual | HS8.3.7

Innovative irrigation strategies for rice in the Mediterranean areas 

Olfa Gharsallah, Arianna Facchi, Gerard Arbat, Sílvia Cufí, Francisco Ramírez de Cartagena, Marco Romani, Michele Rienzner, Darya Tkachenko, Concepcion Mira, Isabel Pedrosa de Lima, José Manuel Gonçalves, Abdrabbo Shehata Aboukheira, Saad Shebl, and Melih Enginsu

Rice is the world's most important food crop, as it is a staple food for more than half of the world's population, and the global demand for rice is expected to increase. More than 1,000,000 hectares in the Mediterranean basin are devoted to rice cultivation. The most important producing countries are Italy (IT) and Spain (SP) in Europe (over 310,000 ha), and Egypt (EG) and Turkey (TR) among non-EU countries (over 600,000 ha). In the Mediterranean region, rice production is of great socio-economic and environmental importance, as rice is often a crucial product for internal consumption and export, especially in Egypt, where it is considered strategic for food security. Despite of this, the peculiar flooding conditions in which rice is traditionally grown lead to the use of huge water volumes, as well as to the potential release of greenhouse gases and pesticides into the environment. For this reason, the introduction of water-saving irrigation strategies could reduce water consumption and decrease the harmful environmental impacts associated with rice flooding, while maintaining yield and rice grain quality.

In the context of the MEDWATERICE project (https://www.medwaterice.org/; PRIMA-2018), alternative irrigation methods to WFL were tested in case studies implemented in five Mediterranean countries (Italy, Spain, Portugal, Turkey, Egypt). Irrigation strategies for each CS were selected with the support of local Stake-Holder groups and applied in experimental fields measuring/estimating all the water balance terms on a daily basis. Wet seeding and alternate wetting and drying (AWD), dry seeding and delayed flooding (DFL), reduction of inlet/outlet discharges (WIR), a better control of ponding water level through automated gates (DFL-aut), hybrid irrigation (HYBRID), sprinkler irrigation (SPRINKLER), surface drip (DRIP) and subsurface drip irrigation (SDI) were implemented for at least two years in the period 2019-2021 alongside the traditional WFL, to investigate their environmental and economic sustainability and social acceptability.

How to cite: Gharsallah, O., Facchi, A., Arbat, G., Cufí, S., Ramírez de Cartagena, F., Romani, M., Rienzner, M., Tkachenko, D., Mira, C., de Lima, I. P., Gonçalves, J. M., Aboukheira, A. S., Shebl, S., and Enginsu, M.: Innovative irrigation strategies for rice in the Mediterranean areas, EGU General Assembly 2024, Vienna, Austria, 14–19 Apr 2024, EGU24-18956, https://doi.org/10.5194/egusphere-egu24-18956, 2024.

EGU24-19384 | ECS | Posters on site | HS8.3.7

Effective radius of corrugated drainage pipes wrapped with a thin geotextile envelope 

Haoyu Yang, Chenyao Guo, and Jingwei Wu

Subsurface drainage is widely used in farmland. Entrance resistance occurs when water flows into a perforated drain pipe, reducing the drainage efficiency and resulting in a high water table. Using the real radius will overestimate the drainage discharge. Accurately calculating effective radius is essential for subsurface drainage calculation and simulation. New effective radius formulas for corrugated drains wrapped with a thin geotextile were proposed by dividing the entrance resistance into corrugation and perforation resistance. The accuracy of the formulas was verified by sand tank experiments. Sensitivity analysis was conducted to determine the factors that affected effective radius, indicating that corrugation was the main factor. When the radius and structure of the drain wall were determined, the opening area exhibited high sensitivity with interactivity between it and drainage discharge. The effect of the opening area and position of the perforations on the effective radius was evaluated for different drainage discharges. Putting the perforations on the bottom was better for drainage efficiency. For small drainage discharge of less than 0.1 cm3 s-1 cm-1, the opening area was not significant, and an opening area of 15 cm2 m-1 was sufficient. However, for greater drainage discharge, an opening area of 60 cm2 m-1 with three or more row perforations would be required.

How to cite: Yang, H., Guo, C., and Wu, J.: Effective radius of corrugated drainage pipes wrapped with a thin geotextile envelope, EGU General Assembly 2024, Vienna, Austria, 14–19 Apr 2024, EGU24-19384, https://doi.org/10.5194/egusphere-egu24-19384, 2024.

EGU24-20020 | Posters on site | HS8.3.7 | Highlight

Enhancing Vegetation Cover in Fujairah through Sustainable Honey Tree Plantations and Water Harvesting Technique: A Multi-Criteria Suitability Mapping 

Youssouf Belaid, Abeyou Worqlul, Mira Haddad, Aseela Al Moalla, and Fouad Lamghari Ridouane

The emirate of Fujairah, spanning approximately 1,450 km², is characterised by a landscape dominated by rugged mountains, encompassing 77% of its total surface area. Despite its average precipitation of less than 150 mm, Fujairah hosts a thriving ecosystem supported by national tree plantations, including Acacia nilotica, Acacia tortilis, Prosopis cineraria, and Zizyphus spina-christi. These plantations are crucial in providing ecosystem services, notably contributing to honey bee production.

This study attempts to support the increase of vegetation cover in Fujairah through sustainable land management practices of using water harvesting and planting native trees by employing cutting-edge technology. Through the integration of Remote Sensing and Geographic Information System (GIS)-driven Multi-Criteria Evaluation (MCE), the research identifies optimal areas for planting native honey trees. Emphasising sustainability, the methodology incorporates water harvesting techniques that eliminate reliance on traditional irrigation methods for plantation.

Local and international datasets encompassing biophysical parameters such as land use, digital elevation models, slope, topographic wetness index, soil texture, and climate data are combined. Additionally, the study considers optimal ecological conditions for native trees, including temperature and soil pH. The resulting suitability maps, treated as future land cover maps, are employed alongside soil sample data to estimate carbon storage and sequestration potential.

Furthermore, the research investigates indigenous water harvesting knowledge in Fujairah through a comprehensive survey. This survey explores community awareness, historical context, current applications, technical specifics of water harvesting and native tree plantation practices, environmental considerations, and potential obstacles and solutions.

The findings aim to inform a holistic approach to sustainably enhancing Fujairah's vegetation cover, providing valuable insights for environmental conservation and community engagement.

Keywords: Suitability mapping, water harvesting techniques, Sustainable land management, and Ecosystem Services

How to cite: Belaid, Y., Worqlul, A., Haddad, M., Al Moalla, A., and Lamghari Ridouane, F.: Enhancing Vegetation Cover in Fujairah through Sustainable Honey Tree Plantations and Water Harvesting Technique: A Multi-Criteria Suitability Mapping, EGU General Assembly 2024, Vienna, Austria, 14–19 Apr 2024, EGU24-20020, https://doi.org/10.5194/egusphere-egu24-20020, 2024.

EGU24-20913 | Posters on site | HS8.3.7

Effectiveness of natural soil water retention measures at field scale under current and future climate – case studies in three European biogeographical regions 

Csilla Farkas, Moritz Shore, Ágota Horel, Gökhan Cüceloglu, Levente Czelnai, Dorota Mirosław-Świątek, Maria Eliza Turek, Natalja Cerkasova, Brigitta Szabó, Antonín Zajiček, Attila Nemes, Sinja Weiland, Petr Fucik, Annelie Holzkaemper, Rasa Idzelyté, and Stepan Marval

Within the EU Horizon project OPTAIN (OPtimal strategies to reTAIN and re-use water and nutrients in small agricultural catchments across different soil-climatic regions in Europe, optain.eu) project, the effects of Natural/Small Water Retention Measures (NSWRMs) on water regime, soil erosion and nutrient transport are evaluated at both, catchment- and field-scales for present and future climate conditions. Our goal is to perform an integrated, model-based assessment of the effectiveness of NSWRMs at field scale and cross-validated these results from those obtained from the catchment-scale modelling. The field-scale assessment is based on the adaptation of the SWAP mathematical model to seven pilot sites across three European biogeographical regions and on combined NSWRM – projected climate scenario analyses. The scenarios are designed to evaluate the efficiency and potential of different natural/small water retention measures in improving soil water retention and reducing flash floods and the loss of soil and nutrients under changing climate conditions. We present the harmonized SWAP modelling workflow and the combined scenario analyses, including the implementation of various in-field measures in the SWAP model. Examples of model calibration, validation and scenario results for selected pilot sites will be given.

How to cite: Farkas, C., Shore, M., Horel, Á., Cüceloglu, G., Czelnai, L., Mirosław-Świątek, D., Turek, M. E., Cerkasova, N., Szabó, B., Zajiček, A., Nemes, A., Weiland, S., Fucik, P., Holzkaemper, A., Idzelyté, R., and Marval, S.: Effectiveness of natural soil water retention measures at field scale under current and future climate – case studies in three European biogeographical regions, EGU General Assembly 2024, Vienna, Austria, 14–19 Apr 2024, EGU24-20913, https://doi.org/10.5194/egusphere-egu24-20913, 2024.

EGU24-20983 | Posters on site | HS8.3.7

A framework based on Melisenda’s aridity index and on Budyko’s curve to assess the crop proneness to the hydrological sustainability 

Stefano Barontini, Martina Greta Caffi, Muhammad Faisal Hanif, Elpida Kolokytha, Dimitrios Malamataris, and Marco Peli

Many agroecosystems are experiencing an increase of agricultural water demand which risks depleting the natural reservoirs, viz lakes and aquifers. The increasing temperature reduces glacier extent and snow accumulation, thus reducing the dry—season water availability, and challenging the agricultural systems and the food security, particularly in arid and semiarid regions.

Aiming at contributing to defining effective strategies that are able to provide robust and parametric parsimonious estimates of the irrigation water demand of the agroecosystems at the planning level, we propose a framework based on the joint use of Melisenda’s aridity index, Benfratello’s water balance and Budyko’s curve to define the crop proneness to the hydrological sustainability.

The strategy is based on Benfratello’s (1961) explicit and conservative method to assess the soil water balance and the irrigation deficit in semiarid Mediterranean climates. The method is parametrized by means of an aridity index (Melisenda, 1964) to assess the soil proneness to water surplus formation, and the results are compared with the natural ecosystem deficit as provided by Budyko’s (1974) curve. Coupling these climatic water balances with a crop based estimate of the maximum required evapotranspiration, as given by the FAO procedure, it is possible to assess the expected crop irrigation deficit.

Our strategy is two—step. The first step is mapping Melisenda’s index, to identify the climatically—wet areas and the potentially climatically—dry areas. In potentially dry areas field capacity may not be refilled during the dry season, if it is greater than a critical value. It is worth noting that the greater is the field capacity, the smaller is the surplus water, and the greater is the crop water availability during the dry season. These maps may be produced both for the actual cultivations, and for some reference crops, viz millet, barley, rice and wheat, which are important for food security, to depict the local hydrological attitude to them.

The second step is the calculation of the monthly and annual irrigation deficit by means of Benfratello’s water balance. The irrigation deficit does not depend only on the annual precipitation and on the annual crop water demand, but also on their annual regime. Benfratello’s irrigation deficit is then compared with the ecosystemic water deficit, provided by Budyko’s curve. The closer is the crop behaviour to Budyko’s curve, the closer is its water demand to the ecosystemic one, considered as a reference natural water demand.

In order to test the sensitivity of the procedure at characterising the water balance also in presence of small climatic differences, we applied it with promising results to two important and comparable Mediterranean agricultural districts, the Bonifica della Capitanata (Southern Italy, 4,410 km2, mainly cultivated with herbaceous crops, olives, fruit and grapevine trees) and the Mygdonia water basin (Northern Greece, 2,100 km2, 1,030 of which are cultivated mainly with cereals). The Köppen—Geiger climate type is mainly Cfa for both areas. De Martonne aridity index depicts a semi—dry to Mediterranean condition for the Capitanata and a mainly Mediterranean condition for the Mygdonia.

How to cite: Barontini, S., Caffi, M. G., Hanif, M. F., Kolokytha, E., Malamataris, D., and Peli, M.: A framework based on Melisenda’s aridity index and on Budyko’s curve to assess the crop proneness to the hydrological sustainability, EGU General Assembly 2024, Vienna, Austria, 14–19 Apr 2024, EGU24-20983, https://doi.org/10.5194/egusphere-egu24-20983, 2024.

HS9 – Erosion, sedimentation & river processes

EGU24-20 | ECS | Orals | HS9.2

Effect of Sampling Design on Characterizing Surface Soil Fingerprinting Properties. 

Maria Luna, Alexander Koiter, and David Lobb

Purpose: The characterization of soil properties is an important part of many different types of agri-environmental research including inventory, comparison, and manipulation studies. Sediment source fingerprinting (i.e., tracing) is a method that is increasingly being used to link sediment sources to downstream sediment. There is currently not a standard approach to characterizing sources and the different approaches to sampling have not been well assessed.

Methods: Grid, transect, and likely to erode sampling designs were used to characterize the geochemical, colour, grain size distribution, and soil organic matter content at two sites under contrasting land uses (agricultural and forested). The impact of the three sampling designs on fingerprint selection, source discrimination, and mixing apportionment results was evaluated using a virtual mixture.

Results: The sampling design had a significant impact on the characterization of the two sites investigated. While the number and composition of the fingerprints selected varied between sampling designs there was strong discrimination between sources regardless of the sampling approach. There were deviations in the expected apportionment results, but the overall patterns were similar across the three sampling designs.

Conclusions: Despite having an impact on the characterization of sources, the sampling design used ultimately had little impact on the conclusions drawn from the final apportionment results. Continued work at the watershed scale is needed to fully evaluate the importance of source sampling on the sediment source fingerprinting approach.

How to cite: Luna, M., Koiter, A., and Lobb, D.: Effect of Sampling Design on Characterizing Surface Soil Fingerprinting Properties., EGU General Assembly 2024, Vienna, Austria, 14–19 Apr 2024, EGU24-20, https://doi.org/10.5194/egusphere-egu24-20, 2024.

EGU24-1585 | ECS | Orals | HS9.2

Understanding spatial and temporal functioning of temporary storage areas to improve their flood mitigation effectiveness 

Martyn T. Roberts, Josie Geris, Paul D. Hallett, and Mark E. Wilkinson

Temporary Storage Areas (TSAs), such as bunds, offline ponds and leaky barriers represent a nature-based solution that can offer additional storage during storm events. They are designed to intercept and attenuate surface runoff, thereby addressing various catchment challenges, including flooding, water scarcity, and soil erosion. Soil infiltration is a key TSA outflow, particularly for more common small to medium storm events, meaning TSA functioning may vary between sites with different soil properties and be time-variable due to the dynamic nature of soil structure. The lack of understanding of TSA functioning in space and time represents a major knowledge gap and acts as a limiting factor for the widespread implementation of TSAs. To address these challenges, there is a need for a TSA analysis approach that allows for the systematic evaluation of TSA functioning.  The overall aim of this study was to enhance understanding of TSA functioning and explore variability in functioning with space and time. Specifically, the objectives were to: (i) develop a systematic data-based method for characterising the functioning of various TSA types; and (ii) assess the effect of spatial and temporal soil variability on TSA functioning and flood mitigation effectiveness.


Here we present the TSA Drainage Rate Analysis tool (TSA-DRA tool), a new data-based mechanistic approach that utilises only rainfall and water level to characterise drainage of individual TSAs. Results from a multi-site TSA assessment in the UK revealed time-variable functioning, especially at lower levels when soil infiltration is the dominant outflow. We explored this further by assessing changes in soil physical properties (bulk density, macroporosity and saturated hydraulic conductivity) at two TSA sites. These sites shared the same TSA type (bund) and had similar volumes (~250 m3) and soils (Cambisols). However, they differed in land use (winter wheat vs spring barley and blackcurrants) and TSA surface area (800 m2 vs 2800 m2). Soil cores were taken across three spatial zones: (1) TSA active zone (<10% full) – inundated for the longest time; (2) full zone (>50% full) – active during large storms; and (3) Field zone – field control points outside the wetted footprint. This assessment was then repeated for significant temporal events e.g., post-harvest, growing season and post-flood. Results show significant soil structure variations over time and space, with degradation more pronounced in soils within the TSA wetted footprint due to inundation. While tillage effectively reset topsoil structure at one site, its impact was negligible at the other site due to variations in land management, coupled with high sedimentation post-flooding, altering near-surface soil texture. Results from a modelling exercise suggest that well-structured soils with higher infiltration rates can improve TSA effectiveness during a large storm event by reducing the volume and frequency of overflow compared to a degraded soil. Gaining insights into spatial and temporal variations in TSA functioning is crucial for optimising both current and future TSA designs and maintenance regimes.

How to cite: Roberts, M. T., Geris, J., Hallett, P. D., and Wilkinson, M. E.: Understanding spatial and temporal functioning of temporary storage areas to improve their flood mitigation effectiveness, EGU General Assembly 2024, Vienna, Austria, 14–19 Apr 2024, EGU24-1585, https://doi.org/10.5194/egusphere-egu24-1585, 2024.

This study examined the sediment characteristics of areas where landslides occurred due to heavy rains between 2014 and 2019. A total of 5 types of geology in two geographic regions in Japan were examined using LiDAR LP topography data before and after the disasters occurred to estimate the changes in elevation. In addition, the volume of sediment runoff for each case was estimated for watershed areas ranging from 0.01 up to 0.1 km2. The influence of geological differences on the sediment runoff volume within the basin using indicators such as the density of landslide occurrence, landslide volume, and watershed erosion intensity was also assessed. The results showed that, for all geology types, as the watershed area increases, the relief ratio decreases and the sediment runoff volume increases; however, the magnitude of this increase in sediment runoff volume differs depending on the underlying geology. In addition, the density of landslide occurrence was high in plutonic and metamorphic rocks. The landslide volume and the total eroded sediment volume within a watershed can be regressed using the linear equation y=ax. Since the average total eroded sediment volume within a watershed is approximately twice that of the landslide volume, there is a proportional relationship of 1:2. The relationship between the relief ratio and watershed erosion intensity shows that the watershed erosion intensity increases gradually as the relief ratio increases, and the rate of increase is larger in plutonic rocks (granite and granodiorite) than in the other groups. Metamorphic rocks had a relatively low watershed erosion intensity; these geological differences are reflected in differences in the degree of erosion of stream beds and banks by flood flows.

How to cite: Akita, H.: Comparison and analysis of the influence of geological differences on sediment runoff volumes from watersheds -case study of plutonic and metamorphic rocks in two sediment disasters in Japan-, EGU General Assembly 2024, Vienna, Austria, 14–19 Apr 2024, EGU24-1808, https://doi.org/10.5194/egusphere-egu24-1808, 2024.

EGU24-1817 | Posters on site | HS9.2

TRACING 2021-2024 – Feedback on international events to develop novel strategies of sediment tracing in catchments and river systems 

Olivier Evrard and the TRACING Event organisers and participants

Several innovative techniques have been developed recently opening up new avenues to establish the assessment of sediment flux in the critical zone. These innovative techniques include the tracing or “fingerprinting” methods to identify the sources and quantify the dynamics of sediment and particle-bound contaminants. However, the use of these techniques is often associated with several methodological and statistical limitations, that are often reported although rarely addressed in the framework of concerted actions taken at the level of the international scientific community.

This presentation will present the main outcomes of the Thematic School organised in 2024 and the Scientific Meeting Days organised in 2022 and 2023 as a follow-up of a first training week organised in 2021 to bring together international experts working on these topics together. Based on the publication of an opinion paper (https://link.springer.com/article/10.1007/s11368-022-03203-1), new strategies to publish and disseminate sediment tracing databases will be presented. An example of formatted dataset will be given, with the objective to test research hypotheses based on multiple datasets adopting the same format of data/meta-data. Other perspectives regarding improvements of the sediment fingerprinting method in terms of modelling, tracer options and selection will also be presented.

How to cite: Evrard, O. and the TRACING Event organisers and participants: TRACING 2021-2024 – Feedback on international events to develop novel strategies of sediment tracing in catchments and river systems, EGU General Assembly 2024, Vienna, Austria, 14–19 Apr 2024, EGU24-1817, https://doi.org/10.5194/egusphere-egu24-1817, 2024.

EGU24-3919 | ECS | Orals | HS9.2

Exploring the sediment redistribution dynamics of a data-scarce catchment in southwestern Ethiopia using the USPED model and gully erosion threshold indices 

Haftu Yemane, Bart Vermeulen, Berhane Grum, Jantine Baartman, Ton Hoitink, and Martine van der Ploeg

Soil erosion has on– and off-site detrimental effects, including decreased soil quality and sediment buildup in reservoirs. Predicting and monitoring soil erosion is challenging due to the spatio-temporal variation of its triggering factors. Therefore, developing and successfully implementing appropriate intervention measures requires a thorough understanding of its redistribution at the catchment scale. However, many previous soil erosion prediction models have been calibrated/validated based on sediment yield at catchment outlets. This approach does not provide any insight into the sources and sinks of erosion and deposition within the catchments. Furthermore, this approach has limited applicability in regions with no (limited) measured data. Therefore, exploring spatial patterns of erosion and deposition using the recent advances in remote sensing and GIS technologies is advisable. This research integrates the semi-distributed Unit Stream Erosion Deposition (USPED) model, and gully erosion threshold indices, described by stream power index (SPI) and topographic wetness index (TWI), to evaluate the sediment redistribution dynamics of a sub-humid catchment located in Omo-basin in southwestern Ethiopia. The catchment (~77 km2) has a rugged topography with an average slope of 35.8 %. It consists of four primary types of land use and cover (LUC): rangelands (20%), forest areas (19%), built-up areas (7%) and cultivated lands (54%). The (preliminary) results revealed that the gentle and mild slopes contribute more (53%) to the overall annual catchment soil loss (42.5 t.ha-1) from the hillslope. This is because the sediment deposited in the downstream sinks remobilizes, shifting an erosion-limited to a transport-limited system. Moreover, the total contribution of rangelands and forest areas is comparable to that of cultivated lands. Therefore, by focusing our management efforts on these areas, instead of the steeper slopes, we can make a greater impact on the overall sustainability of the catchment.

How to cite: Yemane, H., Vermeulen, B., Grum, B., Baartman, J., Hoitink, T., and van der Ploeg, M.: Exploring the sediment redistribution dynamics of a data-scarce catchment in southwestern Ethiopia using the USPED model and gully erosion threshold indices, EGU General Assembly 2024, Vienna, Austria, 14–19 Apr 2024, EGU24-3919, https://doi.org/10.5194/egusphere-egu24-3919, 2024.

EGU24-4719 | Posters on site | HS9.2

An approach for the reduction of the sediment volume transported by debris flow from the high-sloping reach of a debris-flow channel 

Carlo Gregoretti, Matteo Barbini, Martino Bernard, Mauro Boreggio, Sandival Lopez, and Massimiliano Schiavo

Usual works for the reduction of the sediment volume transported by debris flows are the retention basins. Retention basins are usually built on the intermediate and low-sloping reaches of the debris-flow channels or at their end, where the terrain slope is usually not high. When the space required for trapping all the sediment volume is not available or the upper part of the basin must be protected deposition areas can be used. The deposition area is a retention basin without the downstream berm, to be placed in the high-sloping reach of a debris-flow channel. Therefore, it is proposed an approach for the progressive reduction of the sediment volume transported by debris flow: an in-series combination of deposition areas in the high-sloping reaches of the channel, and retention basins in the intermediate low-sloping reaches of the flow path.

An application of such approach is shown for the design of the control works on Ru Secco Creek at the purpose of defending the resort area and the village of San Vito di Cadore (Northeast Italian Alps).

How to cite: Gregoretti, C., Barbini, M., Bernard, M., Boreggio, M., Lopez, S., and Schiavo, M.: An approach for the reduction of the sediment volume transported by debris flow from the high-sloping reach of a debris-flow channel, EGU General Assembly 2024, Vienna, Austria, 14–19 Apr 2024, EGU24-4719, https://doi.org/10.5194/egusphere-egu24-4719, 2024.

EGU24-5507 | Posters on site | HS9.2

Impacts of rainfall variability on river discharges and suspended discharges : A Case Study in Chenyulan Watershed, Taiwan 

Wen-Shun Huang, Jinn-Chyi Chen, Kuo-Hua Chien, Yue-Ting Lia, and Fan Wu

In this study, the variations of rainfall, river discharges and suspended sediment discharges were analyzed in the Chenyulan watershed in Nantou County, central Taiwan. The hydrological data, such as rainfall, daily discharges and daily suspended sediment discharges, was collected based on Neimaopu hydrology station during the period from 1972 to 2020. The yearly costs of structure conservation to prevent sediment disasters and slope hazard events were implemented in the watershed between 1999 and 2020 as well. The Rating Curve Method with the formula Qs=aQb is adopted to estimate sediment discharges with the corresponding discharge events. The impact factors that caused the variation of discharges and suspended sediment discharges were also analyzed to provide the references for the influence of geological and hydrological changes on sediment yielded on slope and following suspended sediment discharges in the rivers in the watershed. The analyzed results show that the suspended sediment discharges in 1972-1989 are less than the average value in 1990-2009 at the same discharges. The suspended sediment discharges in 2010-2020 are gradually reverted to that in 1972-1989. The causes of decreasing the suspended sediment discharges in last decade are analyzed, including: 1. The variations of rainfall were gradually calmed in last decade; 2. the loose soil on slopes in the watershed caused by Chi-Chi earthquake became concreted with time; 3. the landslide and debris flow disasters obviously decreased in last decade and the soil yield from slopes has slowed down; 4. the local government involved a lot of money to build the conservation structures in upstream creeks to trap the loose soil and control the volume of sediments from flowing into rivers.

How to cite: Huang, W.-S., Chen, J.-C., Chien, K.-H., Lia, Y.-T., and Wu, F.: Impacts of rainfall variability on river discharges and suspended discharges : A Case Study in Chenyulan Watershed, Taiwan, EGU General Assembly 2024, Vienna, Austria, 14–19 Apr 2024, EGU24-5507, https://doi.org/10.5194/egusphere-egu24-5507, 2024.

EGU24-5559 | ECS | Posters on site | HS9.2

Impact of dam construction on suspended sediment load alteration 

Zahra Karimidastenaei, Hamid Darabi, and Ali Torabi Haghighi

Impact of dam construction on suspended sediment load alteration

Zahra Karimidastenaei a*, Hamid Darabi b, Ali Torabi Haghighi a


a Water, Energy and Environmental Engineering Research Unit, University of Oulu, P.O. Box 4300, FIN-90014 Oulu, Finland.

bDepartment of Geosciences and Geography, University of Helsinki, Helsinki, Finland

*Corresponding author: Email: zahra.karimidastenaei@gmail.com


Abstract

Climate change and human activities have always impacted the fluvial processes, encompassing floods, soil erosion, sedimentation, and sediment transport in rivers, resulting in huge environmental concerns. Dynamics analysis of suspended sediment concentration (SSC) is a determining factor in the sediment budgets, and it has an important role in water resources management. In the current research, the relationship of the suspended sediment (SS) with precipitation (R) and flow discharge (Q) has been analyzed to assess the impact of Saveh Dam on the SSC during 1971-1982 and 1983-1994 as pre and 1995-2006 and 2007-2018 as post-impact periods in the Ghareh-chay basin, Iran. To quantify the spatio-temporal variation of SSC (due to climate change and anthropogenic activities such as dam construction and land use changes), a new measure Δα-based approach was introduced. The newly developed approach, referred to as the Δα-based method, was formulated by calculating the angle between (or the change in the slope of) the optimal Precipitation-Sediment (P-S) and Flow-Sediment (F-S) fit lines. This calculation is conducted spatially, encompassing both upstream and downstream locations, and temporally, by comparing data from different periods. The findings showed that Δα for the Precipitation-Sediment (P-S) relationship between upstream and downstream increased significantly after the Saveh dam commissioning. Initially, Δα was measured at 2.69 degrees and 1.35 degrees for the two pre-impact periods upstream and downstream, respectively. However, these values rose to 5.65 degrees and 9.39 degrees in the corresponding post-impact periods. Based on these results, it is evident that the notable changes in Δα for the Precipitation-Sediment relationship between upstream and downstream indicate the dam's impact on the Suspended Sediment Concentration (SSC) patterns in the Ghareh-chay river. The relatively short distance between the upstream and downstream gauge stations further supports the conclusion that these observed changes in Δα are directly attributable to the dam's influence, significantly altering sediment dynamics in the river system.

Keywords: Saveh dam; dynamics analysis; pre- and post-impacted; quantitative approach, sediment rating curve


Fig. 1. Location of the study area

How to cite: Karimidastenaei, Z., Darabi, H., and Torabi Haghighi, A.: Impact of dam construction on suspended sediment load alteration, EGU General Assembly 2024, Vienna, Austria, 14–19 Apr 2024, EGU24-5559, https://doi.org/10.5194/egusphere-egu24-5559, 2024.

EGU24-5752 | ECS | Posters on site | HS9.2

Exploring Remote Sensing Methodologies for River Bed Grain Size: Insights from a Mountainous Watershed Study in Val Camonica, Italy 

Matteo Benetti, Payam Heidarian, Riccardo Bonomelli, and Marco Pilotti

The measurement of river bed grain size has become an integral aspect of fieldwork in river geomorphology and regional ecology. Over the past years, various authors have proposed remote sensing methodologies to assess grain size based on ground and aerial images. With the burgeoning applications of small unmanned aerial systems (SUAS) in geomorphology, there is a burgeoning interest in leveraging these remote sensing granulometry methods for SUAS imagery. However, a dearth of studies exists that systematically investigate spatially consecutive images yielding grading curves or specifications over extensive areas within mountainous watersheds.

This study focuses on the granulometry of the mountainous watershed in Val Camonica, located in northern Italy, employing a drone for initial photographic documentation. The study incorporates the BaseGrain software for importing drone spatially consecutive images and extracting granulation curves from the photographed areas. Additionally, the study encompasses the utilization of Structure-from-Motion (SfM) photogrammetry within a Ground Control Points (GCP) workflow to scale the drone-acquired photos. The precision of this scaling is systematically validated by comparing photos with scaling images including meter using BaseGrain software. The precision of AGISOFT software, employed in the SfM-photogrammetry process, is also critically evaluated by itself with different numbers of benchmarks.

Results indicate that, despite the non-professional nature of the instrumentation, the acquisition of high-resolution images is feasible. These images enable the generation of Digital Elevation Models (DEMs) with accuracies ranging between 2 and 3 cm, contingent upon the number of ground control points. The granulation curve, extracted through BaseGrain, exhibits acceptable accuracy within meter-scale resolution. This research contributes valuable insights into the potential of SUAS-based remote sensing granulometry for mountainous watersheds and underscores the importance of methodological precision for reliable results in river geomorphology studies.

How to cite: Benetti, M., Heidarian, P., Bonomelli, R., and Pilotti, M.: Exploring Remote Sensing Methodologies for River Bed Grain Size: Insights from a Mountainous Watershed Study in Val Camonica, Italy, EGU General Assembly 2024, Vienna, Austria, 14–19 Apr 2024, EGU24-5752, https://doi.org/10.5194/egusphere-egu24-5752, 2024.

EGU24-7560 | ECS | Posters on site | HS9.2

Impact Analysis of Series of Groundsills on the Fluvial Stability and Geomorpholog 

Pohsuan Lin, Tsungyu Hsieh, Kuowei Liao, Kailun Wei, and Guanyu Lin

To mitigate riverbed erosion both longitudinally and transversely, control water flow, and stabilize riverbanks, the use of groundsills has become a widely adopted engineering method. For large conservation areas, using a series of groundsills is standard practice. However, the sediment transport in rivers is a dynamic process, and the implementation of series groundsills can cause discontinuities in the longitudinal corridor of the river, leading to damage to the ecological environment and landscape. Although there is considerable consensus on various aspects of series of groundsills, current research primarily focuses on the influence of the configuration of groundsills (such as height and width) on sediment downstream. Therefore, this project aims to estimate the trends in sediment transport through scaled experiments and numerical simulations. Results shown that according to the analysis results, neither the Q5 nor Q95 criteria are met in the proposed plan for the complete removal of the groundsills. This project believes that the complete removal of the groundsills may have a drastic impact on the environment, potentially leading to unstable conditions, and thus requires careful evaluation. The design of openings in the groundsills is an effective ecological adjustment project. Regarding the design of the opening height, this project suggests considering two factors: one is to reduce the similar damming effect caused by lowering the elevation, and the other is the gathering of water flow. It is a trade-off between these two factors. Increasing the depth of the opening may benefit the ecology but could lead to unintended erosion due to concentrated water flow, and vice versa.According to the analysis results, neither the Q5 nor Q95 criteria are met in the proposed plan for the complete removal of the fixed-bed structure. This project believes that the complete removal of the fixed-bed structure may have a drastic impact on the environment, potentially leading to unstable conditions, and thus requires careful evaluation. The design of openings in the fixed-bed structure is an effective ecological adjustment project. Regarding the design of the opening height, this project suggests considering two factors: one is to reduce the similar damming effect caused by lowering the elevation, and the other is the gathering of water flow. It is a trade-off between these two factors. Increasing the depth of the opening may benefit the ecology but could lead to unintended erosion due to concentrated water flow, and vice versa. he proposed plans can optimize benefits for both upstream and downstream water conservation, and protect downstream objectives by managing sediment transport.

Keywords: series groundsill, ecology, sustainable management, sediment transport

How to cite: Lin, P., Hsieh, T., Liao, K., Wei, K., and Lin, G.: Impact Analysis of Series of Groundsills on the Fluvial Stability and Geomorpholog, EGU General Assembly 2024, Vienna, Austria, 14–19 Apr 2024, EGU24-7560, https://doi.org/10.5194/egusphere-egu24-7560, 2024.

EGU24-7827 | Orals | HS9.2

Impacts of check dams: a monitoring experience along a mountain watercourse 

Alessio Cislaghi, Dario Bellingeri, Vito Sacchetti, Emanuele Morlotti, and Gian Battista Bischetti

Torrential dynamic is a complex combination of natural processes along a mountain watercourse, including sediment deposition and erosion that cause cross-section occlusions and streambank failure, respectively. Thus, monitoring and managing sediments are fundamental activities for the maintenance in mountain watersheds. To regulate the sediment transport, a common countermeasure is the check dam, designed to control the sediment movement along the watercourse (Piton et al., 2017). Building check dams is complex and expensive, especially in mountain watercourse. These structures largely modify the surrounding environment and landscape; however, if well designed, check dams are very effective solutions to mitigate the potential losses due to flood, debris flood, and debris flow.

This study presents the monitoring of a stretch of a mountain watercourse over several years in an Alpine environment. The observed dominant process was the sediment deposition that has been countered by the construction of a slot check dam. The torrential dynamic has been strongly influenced by this in-channel structure, exacerbating the change of cross-sectional and longitudinal profiles (width and depth of the cross-sections, longitudinal profile, and bed granulometry) not only in proximity of the structure, but also along the observed overall stretch (downstream and upstream). The monitoring consists in measuring the hydrological response during rainfall events and assessing the geomorphic change using digital elevation models differencing (2010, 2014, 2021, 2023). The last topographic surveys were conducted immediately after the construction of the slot check dam and immediately after the first severe debris flood occurred several months later.

The results of monitoring show a clear geomorphic evolution along the observed stretch, contrary to the previously detected tendency of sediment dynamics and, moreover, a different hydrological response at downstream of the structure. As expected, sediments were trapped upstream of the structure, whereas a severe erosion removed the armoring layer bringing to light several bed sills at downstream.

This study underlines how artificial works have a spatially distributed effects on geomorphological change, on hydraulic behaviour, and in some cases on the flood hazards (also far from the structure). Thus, the prediction of geomorphological change, even if qualitative, is extremely important to improve the effectiveness of the check dam in managing sediment dynamics. In addition, sharing this information is essential to support designers (showing practical examples) in planning works not only focusing on the structural and hydraulic perspectives, but also from a geomorphological point of view, which is often neglected.

Piton, G., Carladous, S., Recking, A., Tacnet, J.M., Liébault, F., Kuss, D., Quefféléan, Y., Marco, O., 2017. Why do we build check dams in Alpine streams? An historical perspective from the French experience: A Review of the Subtle Knowledge of 19th Century Torrent-Control-Engineers. Earth Surf. Process. Landforms 42, 91–108. https://doi.org/10.1002/esp.3967

How to cite: Cislaghi, A., Bellingeri, D., Sacchetti, V., Morlotti, E., and Bischetti, G. B.: Impacts of check dams: a monitoring experience along a mountain watercourse, EGU General Assembly 2024, Vienna, Austria, 14–19 Apr 2024, EGU24-7827, https://doi.org/10.5194/egusphere-egu24-7827, 2024.

EGU24-8068 | ECS | Posters on site | HS9.2

The new Austrian standard ÖNORM B4800 for torrent control work 

Georg Nagl, Johannes Hübl, and Jürgen Suda

Austria has a wide variety of protection structures at different condition levels due to the long tradition of torrent control works in the Austrian Alps. This has resulted in a large stock of protection structures and load models. In order to standardise the design of technical structures based on the Eurocode, including torrential processes, snow avalanches and rock fall, an interdisciplinary working group (ON-K-256) was established. The standardisation for torrential processes covers the definition and classification, the impact on structures, the design of structures, and the operation, monitoring and maintenance. These parts are based on and interact with EN 1990 (the basis of structural design), EN 1992-1-1 (the design of concrete structures), EN 1997-7 (geotechnical design) and the related documents for the Austrian national specifications. For torrential mass wasting processes with high variability in the concentration of solids, modern protection concepts are scenario-oriented. To optimize the mitigation measures for a multi-stage system, a functional chain must be implemented. This chain should have different structures to perform various functions such as dosing, filtering, and energy dissipation. When designing these torrential mitigation structures, it is necessary to simplify the model parameters, stress model, and load distribution. For debris flows, a standardized stress model combines the static and dynamic loads of debris flow impact on structures. This model was calibrated using available impact measurements of real debris flows and is in good agreement with common engineering design methods in Austria for debris flow impact on torrential barriers. The proposed method enables practitioners to design debris flow countermeasures with limited data availability.

How to cite: Nagl, G., Hübl, J., and Suda, J.: The new Austrian standard ÖNORM B4800 for torrent control work, EGU General Assembly 2024, Vienna, Austria, 14–19 Apr 2024, EGU24-8068, https://doi.org/10.5194/egusphere-egu24-8068, 2024.

EGU24-8164 | ECS | Posters on site | HS9.2 | Highlight

Reconstructing the Flood History of Nan Ancient City: Insights from Sedimentary Analysis 

Prapawadee Srisunthon, Alex Berger, Alex Fuelling, Mubarak Abdulkarim, Damien Ertlen, Daniela Mueller, Jakob Wilk, Meike Reubold, and Frank Preusser

Monsoon-induced floods have played a pivotal role in shaping the fortunes of Asian civilizations and communities over the millennia, and their far-reaching consequences persist to this day. This study delves into the floodplain east of Nan ancient city, a city during Lan Na period in northern Thailand dating back to the 13th century AD. Our primary objective was to unravel the source direction of a catastrophic flood event in 1818 AD, which ultimately led to the city's relocation. Our sedimentological analyses revealed a diverse range of deposition. An innovative provenance study using mid-infrared spectroscopy (MIRS), conducted for the first time in this region, indicated a significant contribution from eastern tributaries not from the Nan River. Only two of the nine sediment cores (WTR and HH2) presented evidence of Nan River sediment. Optically stimulated luminescence (OSL) dating revealed a striking pattern: modern floods dominated the shallow depths (ca. 0-1.10 m) of all cores, while deeper layers exhibited unexpectedly older ages, exceeding 11,000 years. This finding aligns with climate data from multiple proxies, suggesting that Nan ancient city, akin to neighboring e.g. Kingdom of Angkor, endured a dry period. Based on these comprehensive findings, we postulate that the 1818 AD flood catastrophe originated from the east. The deluge may have been triggered by rainfall during an extended dry spell, when the parched and compacted soil's permeability was severely diminished. This sudden surge of water swiftly transported the sediment, ultimately inundating and devastating the city. The insights gained from this study are a reminder of the profound impact of monsoon-related floods on human settlements in Asia. By understanding the conceptions between sedimentology, provenance, and climate, we can better comprehend the historical and ongoing challenges posed by these natural disasters and advance strategies for sustainable development in vulnerable regions.

Keywords: flood sediment, monsoon, Southeast Asia,  provenance analysis, OSL dating, Lan Na, Nan, Thailand

How to cite: Srisunthon, P., Berger, A., Fuelling, A., Abdulkarim, M., Ertlen, D., Mueller, D., Wilk, J., Reubold, M., and Preusser, F.: Reconstructing the Flood History of Nan Ancient City: Insights from Sedimentary Analysis, EGU General Assembly 2024, Vienna, Austria, 14–19 Apr 2024, EGU24-8164, https://doi.org/10.5194/egusphere-egu24-8164, 2024.

EGU24-8675 | ECS | Posters on site | HS9.2

Assessment of flash flood impacts in a mountain basin: an integrated approach for the management of channel control works 

Francesco Piccinin, Lorenzo Martini, Sara Cucchiaro, Giacomo Pellegrini, Eleonora Maset, Alberto Beinat, Tommaso Baggio, Federico Cazorzi, and Lorenzo Picco

In mountain basins, the predominant approach to control the supply and transport of large volumes of sediment involves the installation of hydraulic structures within the channel network. While torrent control works are fundamental in reducing flash flood impacts, their effectiveness during time need regular monitoring and maintenance. However, few studies have proposed a workflow based on simple factors and criteria collected in the field to prioritize management interventions of torrent control works in a mountain basin. In this work, the aims are to assess the effectiveness of the hydraulic structures and to quantify their impact on sediment continuity in the Vegliato mountain basin (Italy), affected by a flash flood event occurred on the 30th July 2021. First, rainfall data from 2019 to 2022 are analyzed to detect and characterize the event that caused the flash flood. The assessment of post-event status and functionality of the control works is done using a novel Maintenance Priority index (MPi), distinguishing the structures that no longer fulfil their role and providing an overview on the maintenance and re-planning of the management system. These results integrate the analysis of multi-temporal High Resolution Topography (HRT) data deriving from LiDAR surveys. DEMs of Difference (DoDs) are generated to map the geomorphic changes occurred during the event, quantifying the sediment fluxes impacting on the control works and viceversa. The role of torrent control works is also analyzed in terms of continuity of the sediment cascade applying a novel parameter, the Sediment (dis)Continuity Ratio (SCR), which assesses the capability of the torrent control works system in intercepting and storing a sediment mass fraction constituting the cascade (obtained by DoD) and identifies the hydraulic structures that contribute or limit the sediment (dis)continuity along the channel network.

The application of the MPi indicates that the 16% of the control works should be given the highest maintenance priority (MPi = 1). The 45% of the hydraulic structures exhibit 0.63 ≤ MPi ≤ 0.88 and are in need of intervention to ensure the durability of the structures themselves. On the other hand, 12% of the control works require re-planning operations (0.25 ≤ MPi ≤ 0.50) due to their good structural condition but low functionality. Eventually, the 25% of the structures show MPi = 0 and are in the lowest range of priority for the interventions. These results were also corroborated by the DoD results, which supported the MPi. The analysis of the SCR shows how several torrent control works, especially the ones located in the upper part of the catchment, promote continuity (SCR from -100 to -0.1). On the other hand, several structures in the middle part of the main channel show positive SCR values, therefore promoting discontinuity. The highest values of SCR are found in the downstream and wider part of the main channel.

Finally, the workflow composed of different methodologies adopted in this work provides a detailed overview of the interaction between sediment dynamics and torrent control works and represent a useful tool to develop effective management decisions and plans.

How to cite: Piccinin, F., Martini, L., Cucchiaro, S., Pellegrini, G., Maset, E., Beinat, A., Baggio, T., Cazorzi, F., and Picco, L.: Assessment of flash flood impacts in a mountain basin: an integrated approach for the management of channel control works, EGU General Assembly 2024, Vienna, Austria, 14–19 Apr 2024, EGU24-8675, https://doi.org/10.5194/egusphere-egu24-8675, 2024.

EGU24-9330 | Orals | HS9.2

(Dis)connected mountain headwaters: advocating for a paradigm shift in sediment management strategies 

Tomáš Galia, Václav Škarpich, and Tereza Macurová

Beyond land-use alterations at the catchment scale, numerous mountain catchments across Europe have experienced significant morphological changes and shifts in sediment transport dynamics over the past two centuries, largely attributable to the implementation of torrent control structures. A notable example is the mountainous part of the Czech Carpathians, where a comprehensive sediment management regime was introduced at the turn of the 19th and 20th centuries. This approach, based on methodologies established in the Austrian Alps, encompassed the installation of check dams and artificial bank stabilizations. Such practices have remained predominant in these areas, with certain catchments smaller than 25 km² exhibiting substantial portions of their stream lengths stabilized through sequences of consolidation check dams, bed sills, and riprap bank stabilizations.

However, it is crucial to consider the distinct nature of external factors influencing rainfall-runoff processes and sediment supply in the 19th century. This period was marked by the end of the Little Ice Age and a higher prevalence of deforested areas, linked with active gully development. Given the contemporary context of extensive reforestation and subtly altered hydroclimatic conditions, the appropriateness of continuing such 'hard and intensive' management strategies for local streams warrants reassessment.

Consequently, a sediment deficit in both mountain channels and foothill gravel-bed rivers has been observed. It resulted in channel transformation with sediment coarsening, the loss of gravel bars (as vital habitats), and, in some instances, channel incision into the bedrock. This situation necessitates a reconsideration of sediment-control strategies within the frameworks of fluvial continuum and sediment (dis)connectivity, particularly since these headwaters function as primary sediment sources. Without modifying these management approaches, enhancing the hydromorphological state of streams and rivers in the Czech Carpathians remains a formidable challenge.

How to cite: Galia, T., Škarpich, V., and Macurová, T.: (Dis)connected mountain headwaters: advocating for a paradigm shift in sediment management strategies, EGU General Assembly 2024, Vienna, Austria, 14–19 Apr 2024, EGU24-9330, https://doi.org/10.5194/egusphere-egu24-9330, 2024.

EGU24-9807 | ECS | Posters on site | HS9.2

Quantifying Sediment Dynamics in an Alpine River Catchment using a 10Be Tracing Method  

Chantal Schmidt, David Mair, Fritz Schlunegger, Brian McArdell, Marcus Christl, and Naki Akçar

In this study, we quantify the spatial variation in sediment generation for the c. 12 km2 large Gürbe catchment situated at the northern margin of the Swiss Alps. We particularly trace the sediment transfer from the hillslope to the channel network in the headwaters, and finally to the depositional fan at the downstream end of the catchment. Mapping shows that sediment production in the Gürbe catchment occurs through three primary mechanisms: (1) overland flow erosion generating sand and silt, contributing to the generation of suspension loads; (2) shallow and deep-seated landslides linked to the main channel, both supplying a mixture of gravel, boulders, and silt/sand during floods, thus generating sediment for both the bedload and suspension load of the Gürbe River; and (3) incision of the river into glacial till in the upper headwaters and into landslides farther downstream. The bedrock of the Gürbe catchment comprises Molasse, Flysch, and Quaternary deposits, posing challenges in tracing the origin of the material and estimating the relative importance of the various processes for sediment generation.  However, previous research has shown that the cosmogenic 10Be concentration can differ for various sediment sources (Cruz Nunes et al. 2015; e.g.). Therefore, we measured 10Be concentrations in the sand fraction (0.25 – 2 mm) in the main channel and in the tributaries, aiming to capture suspension load signals generated through overland flow erosion and landslides. As a novel approach, we also determined the bulk 10Be concentration of gravels (2 – 10 cm) collected from the same sampling locations in the Gürbe channel, in the three tributaries as well as from the landslide tongues reaching into the Gürbe. The results point to three different conclusions: First, there exists a clear difference between the signals measured in the sand fraction and the gravel samples. In particular, the 10Be concentrations in the sand fraction are two to four times higher than those measured in the gravel at the same sites. This grain size dependence aligns with previous findings by Puchol et al. (2014). Second, the sand samples in the main channel show a downstream decrease in 10Be concentration, thereby reflecting the supply of material from the tributaries and particularly from the landslides with low 10Be concentrations. Third, bulk gravel samples reveal a larger variability in 10Be concentrations than the sand samples at the same locations. This suggests that the supply and downstream transport of the coarse-grained bedload material occurs more episodic than the generation and transfer of the suspension load. 


REFERENCES 

Cruz Nunes, F., Delunel, R., Schlunegger, F., Akçar, N., & Kubik, P. (2015): Bedrock bedding, landsliding and erosional budgets in the Central European Alps. Terra Nova, 27(5), 370-378.

Puchol, Nicolas; Lavé, Jérôme; Lupker, Maarten; Blard, Pierre-Henri; Gallo, Florian; France-Lanord, Christian (2014): Grain-size dependent concentration of cosmogenic 10Be and erosion dynamics in a landslide-dominated Himalayan watershed. In: Geomorphology 224, S. 55–68.

How to cite: Schmidt, C., Mair, D., Schlunegger, F., McArdell, B., Christl, M., and Akçar, N.: Quantifying Sediment Dynamics in an Alpine River Catchment using a 10Be Tracing Method , EGU General Assembly 2024, Vienna, Austria, 14–19 Apr 2024, EGU24-9807, https://doi.org/10.5194/egusphere-egu24-9807, 2024.

Land-use specific sediment source apportionment using compound specific isotopic tracers occurs with challenges from both contributions from aquatic  and particulate organic matter sources. Additionally, compound specific tracers have often occurred with co-linearity. Challenging our current understanding of erosion processes, previous studies using compound-specific isotopic tracers regularly indicate forests as the dominant source of sediment. We hypothesized that this estimation may be attributed to misclassifying particulate organic matter as a sediment contribution from forests.

This study is based in Lake Baldegg (Lucerne, Switzerland) and utilizes the δ13C values of lignin-derived methoxy groups and alkane average chain length as an additional land-use-specific tracer to δ13C fatty acids. Three Suess corrections using different tracer residence times are applied to constrain the changing δ13C values of CO2 in the atmosphere over the last 130 years. To identify changes in sediment sources over the last 130 years, contributions of particulate organic matter are determined, and subsequently removed to apportion only the mineral associated soil fraction. To determine the confidence which can be applied to the model’s output, the model's performance is evaluated with 300 mathematical mixtures. The potential misclassification of forest contributions is investigated by merging particulate organic matter and forest sources to simulate tracers which are unable to discriminate between these two sources.

The incorporation of δ13C values of lignin methoxy groups and alkane average chain length as additional tracers successfully expands the problematic one-dimensional mixing line.  Mathematical mixtures demonstrate the improvement of the model’s performance when using both the average chain length and δ13C values of lignin-derived methoxy groups as an additional tracer. Furthermore, they also demonstrate an underestimation of arable contribution. Changes in dominant sediment sources (Forest: pre-1990, Pasture: 1910-1940, Arable: post-1940) highlight the influence of policy-induced land-use changes. Additionally, the study reveals a 37% overestimation of forest contributions to the sediment core due to the inability to discriminate between particulate organic matter and forest sources.

The use of δ13C values of lignin methoxy groups as an additional tracer enables the identification of critical points in the 130-year sediment history of Lake Baldegg. We emphasize the importance of incorporating multiple Suess corrections to constrain the effect of multiple turnover times of tracers. While merging forest and particulate organic matter sources did not alter the dominant source over the last 130 years, it highlighted the need of separating these sources for more accurate apportionment. The study contributes valuable insights to sediment dynamics and land-use impacts, offering guidance for environmental management strategies.

How to cite: Cox, T., Laceby, P., Greule, M., Keppler, F., and Alewell, C.: Using stable carbon isotopes of lignin derived methoxy groups to investigate the impact of historical land use change on sediment/particulate matter dynamics , EGU General Assembly 2024, Vienna, Austria, 14–19 Apr 2024, EGU24-10471, https://doi.org/10.5194/egusphere-egu24-10471, 2024.

EGU24-16053 | ECS | Posters virtual | HS9.2

Hydrological and Sediment Transport Regime on Rivers in the Balkans: The Case of the Seman River in Albania 

Alban Doko, Axel Bronstert, and Till Francke

Hydrological and sediment transport regime are important in water resource management. Aim of this study is to identify the flow regime and the suspended sediment transport in a Mediterranean River Basin. Precipitation, temperature, soil, land use, discharges and suspended sediment concentration are used to quantify runoff and sediment yields at daily scales. WASA-SED (Water Availability in Semi-Arid environments – SEDiments) a spatially semi distributed model it is developed to simulate the flow and sediment transport in Seman Basin. Sediment deposits in Seman Basin contribute to a significant annual loss in the water storage capacity of the dams. Runoff and suspended sediments in Mediterranean hill slopes are closely related to rainfall intensities and land surface cover. This study gives a valuable approach in improving the prediction of flow and sediment transport in Mediterranean River Basin.

Keywords:
Flow, Sediment transport, WASA-SED, Mediterranean River Basin

How to cite: Doko, A., Bronstert, A., and Francke, T.: Hydrological and Sediment Transport Regime on Rivers in the Balkans: The Case of the Seman River in Albania, EGU General Assembly 2024, Vienna, Austria, 14–19 Apr 2024, EGU24-16053, https://doi.org/10.5194/egusphere-egu24-16053, 2024.

EGU24-16690 | ECS | Orals | HS9.2

Sediment Source Identification in a Southern Brazilian Watershed: Utilizing Geochemical Properties and Spectral Signatures with Mixing Models 

Mélory Araujo, Gema Guzmán, José Alfonso Gómez, Alexander Koiter, Stefan Nachtigall, and Pablo Miguel


One of the main impacts of water erosion within a watershed is the downstream deposition of sediments in watercourses and decrease in water quality, esigning and implementing effective soil and water conservation practices to address these impacts requires a soil conservation practices. Increasingly, researchers are using sediment source fingerprinting methods which use physical, biological, and geochemical attributes of the soil and sediments as tracers (Tiecher et al., 2015). Identifying sediment sources enables targeted corrective measures, but tracer selection and fingerprinting feasibility are ongoing debates among experts (Lizaga et al., 2020; Owens et al., 2022).

This study focuses on identifying sediment sources to develop erosion mitigation plans in a 33.3 km² rural river basin, in southern Brazil, crucial for supplying the municipality of Pelotas. Three primary sediment sources were identified: annual crops, perennial forage (pastures), and gutters (river channels). Samples were collected from the surface horizon (0-20 cm) of agricultural land and perennial pastures. Gutter samples were collected from the underground horizon, where active erosion processes were taking place. In total, 116 source samples were obtained. Nine sediment samples were collected from six sites across the study area every two months during 2021-2022, forming three collections for each sub-area of the river basin (A1, A2, and A3). Traditional fingerprinting methods, utilizing geochemical tracers, total organic carbon, and color coefficient tracers in the visible spectrum, were employed to analyze the soil of the contributing area and the sediments. The FingerPro (v1.1; Lizaga, 2018) mixture model was applied to evaluate the contributions of sediment sources to the collected sediment.

This communication presents preliminary results of 37 tracers: 22 geochemical elements, 14 color coefficients, and total organic carbon. Data processing, using FingerPro, was conducted separately by sub-area and sediment collection. Tracer selection involved a-two sequential statistical tests: 1) Kruskal-Wallis (KW) selects tracers with significant differences between at least two sources and 2) Discriminant Function Analysis (DFA) selects optimal tracers that effectively discriminate between the three sediment sources.

The results obtained demonstrated that the selected tracers for each sub-area varied considerably. For example, the tracer selection procedure for sub-area A1 resulted only in total organic carbon as a viable tracer while the number tracers selected for the other two sub-areas were seven and five, for A2 and A3, respectively. Notably, the varying sets of tracers being selected for each sub-area indicate that the heterogeneity in soil properties is an important consideration in sediment source fingerprinting studies. Combining samples from the whole river basin may distort sediment dynamics. Tailored approaches are crucial for accurate understanding and management.

Acknowledgements

This study was made possible by the generous support of Brazil-CAPES through a doctoral scholarship (Finance Code 001).

References

Lizaga et al. 2020. Consensus ranking as a method to identify non-conservative and dissenting tracers in fingerprinting studies

Lizaga. 2018. fingerPro 1.1.

Owens, P. N. 2022. Sediment source fingerprinting: are we going in the right direction?.

Tiecher et al. 2015. Combining visible-based-color parameters and geochemical tracers to improve sediment source discrimination and apportionment 

How to cite: Araujo, M., Guzmán, G., Gómez, J. A., Koiter, A., Nachtigall, S., and Miguel, P.: Sediment Source Identification in a Southern Brazilian Watershed: Utilizing Geochemical Properties and Spectral Signatures with Mixing Models, EGU General Assembly 2024, Vienna, Austria, 14–19 Apr 2024, EGU24-16690, https://doi.org/10.5194/egusphere-egu24-16690, 2024.

EGU24-16692 | Posters on site | HS9.2

Pre-event conditions and rainfall–runoff characteristics drive suspended sediment source variability 

Núria Martínez-Carreras, Jean François Iffly, and Laurent Pfister

Most of the total sediment load transported in river systems is carried in suspension. Therefore, if we are to reduce soil erosion and sediment export, it is essential to determine suspended sediment sources and the drivers of its mobilisation into the river network. In this study, we combined the monitoring of suspended sediment fluxes and the sediment fingerprinting approach to test if pre-event conditions and rainfall-runoff characteristics drive suspended sediment source variability in catchments under a semi-oceanic climate. The sedimentological response to storm runoff events was studied in seven nested sub-catchments of the Attert River basin (0.4 - 245 km2), which have contrasting geological bedrock (sandstone, marls and shale) and land uses (forest, cropland and grassland). We collected stream water samples during storm runoff events (~30 events per catchment) using automatic water samplers to measure suspended sediment fluxes. In parallel, time-integrated suspended sediment and sediment sources samples (i.e., from different land use types) were collected and analysed in the laboratory (geochemistry, colour and organic properties) to determine the sediment origin using the sediment fingerprinting approach. Each sampled event was parameterized to describe rainfall, runoff, sediment transport and the relative contribution of each land use type to the sampled suspended sediment. Next, we assessed the relationships between variables. We found higher significant correlations between suspended sediment loads and runoff parameters (i.e., peak discharge and event runoff) than between suspended sediment loads and rainfall parameters (i.e., event precipitation, antecedent rainfall, and maximum rainfall intensity). Peak discharge for single events was found to be the best predictor of sediment loads in the studied catchments. We show that most events exhibit clockwise hysteretic loops between discharge and suspended sediment concentration in all studied catchments. We attribute this finding to the erosion or remobilization of sediment previously deposited on the channel bed or an adjacent area. During most of these events with clockwise hysteretic loops, sediment source apportionment presented a consistent pattern.

How to cite: Martínez-Carreras, N., Iffly, J. F., and Pfister, L.: Pre-event conditions and rainfall–runoff characteristics drive suspended sediment source variability, EGU General Assembly 2024, Vienna, Austria, 14–19 Apr 2024, EGU24-16692, https://doi.org/10.5194/egusphere-egu24-16692, 2024.

EGU24-17307 | ECS | Orals | HS9.2

Sediment contribution of shallow landslides and flux connectivity of transfer paths in mountainous areas under climate change projections. A case study for the Saldes River basin (Pyrenees, Spain) 

Stephania Rodriguez, Marcel Hürlimann, Vicente Medina, Ona Torra, Raül Oorthuis, and Càrol Puig Polo

In the context of soil erosion modeling, coarse-grained sediments present considerable challenges, particularly concerning sediment production and quantification. This study proposes a module-based quantification approach that integrates different coarse-grained production processes, where one of the main outputs is the source area delimitation and the quantification of mobilizable sediment.

The present study focuses on analyzing shallow landslides and various scenarios of sediment transport to the nearest fluvial system, by implementing the newly developed “Random Connect” code. This code calculates the accumulated volume that travels from the source areas into the fluvial system based on the connectivity index. The chosen case study is the Saldes River basin in the Pyrenees (Spain) The outlet point of this basin is La Baells water reservoir, presently facing siltation challenges arising from sediment transport across the entire drainage area. Reported by CEDEX (2002), the sediment yield delivered to a La Baells Reservoir from the entire drainage area was 4.54 Mg ha−1yr−1 in 2002. In this sense, this water reservoir is utilized for calibrating and validating our model. The quantification of sediment in water reservoirs does not allow to separate the contributions of the different erosive processes at the basin, thus highlighting the importance of the study of the river section to better understand the sediment production.

For model calibration, field surveys were conducted to ascertain the connectivity index to the main river, identify (dis)connectivity factors, and measure fluvial and sediment grain characteristics. Comparing model output with field data enables determination of sediment transport potential and the maximum sediment quantity that can reach the main river. Depending on the connectivity threshold, the results of sediment reaching the main river for a critical rainfall event can vary between 250000 to 10000 m3.

Assessing sediment at the river cross-section helps in defining the principal coarse-grained production phenomena, such as shallow landslides, rock falls and debris flows. Grain characterization of sediment is necessary to study sediment mobilization through a hydrological-driven module. The main objective is to track coarse-grained sediment until it reaches the water reservoir and identify the meteorological and physical factors that trigger the process.

A historical baseline of sediment production has been determined for the Saldes River basin, based on historical landslide inventories, previous triggering events, and meteorological scenarios for the current climate. The assessment considers the impact of climate change in Spain at different timelines based on return periods. The rate of sediment production is determined by analyzing critical climate change scenarios, resulting in values below and above the baseline. This analysis places special emphasis on extreme climate events and the projection of mean annual precipitation.

How to cite: Rodriguez, S., Hürlimann, M., Medina, V., Torra, O., Oorthuis, R., and Puig Polo, C.: Sediment contribution of shallow landslides and flux connectivity of transfer paths in mountainous areas under climate change projections. A case study for the Saldes River basin (Pyrenees, Spain), EGU General Assembly 2024, Vienna, Austria, 14–19 Apr 2024, EGU24-17307, https://doi.org/10.5194/egusphere-egu24-17307, 2024.

EGU24-20102 | ECS | Posters on site | HS9.2

Deglaciation and debris flow dynamics: how does the glacier retreat affect debris flow activity in High Mountain Asia?  

Varvara Bazilova, Leon Duurkoop, Jacob Hirschberg, Tjalling de Haas, and Walter Immerzeel

Debris flows are fast-moving masses of rock, soil, and water, which occur in mountain areas all over the world. Debris flows achieve maximum discharges that are many times greater than those associated with floods and are therefore often hazardous to people and infrastructure. Contrary to the general expectations that climate change will increase the magnitude and frequency of the debris flows, recent assessments have shown that under certain conditions future climate may increase the sediment transport capacity, but could also favor a reduction of the sediment supply and, therefore, reduce debris-flow activity.  The impact of glacier retreat together with future climate conditions on debris-flow catchments is not yet fully understood, but it is expected to increase due to uncovered glacial till, increased hillslope instabilities and an increase in peak rainfall intensities. We aim to quantify the effect of the changes in water availability (changes in precipitation regime, but also glacier meltwater) together with the subsequent landscape changes in climatically contrasting catchments in High Mountain Asia (HMA) on the frequency and magnitude of debris flows. We address it by further extending the sediment cascade model (SedCas), expanding the available hydrological response units to bedrock, vegetated and glaciated parts of the catchment. We further investigate (1) how sediment yield and debris flow magnitude-frequency change over time, and (2) how deglaciation and catchment greening (changes of land cover) affect debris flow activity for different climate regions across High Mountain Asia. We find that in the case study of sediment-unlimited catchments, from 1950 to 2022, glacier retreat increases the water supply. That, in combination with the warming temperatures (and therefore the change in the partitioning of the solid and liquid precipitation) and the decrease in number of extreme precipitation events, results in a decrease in the debris-flow activity. These preliminary results show that changes are not consistent across HMA and highly depend on the climatic regime and elevation. Our findings shed light on the debris flow and flood hazard in the data-scarce areas of HMA and highlight the importance of considering regional climate conditions for hazard assessment in addition to region-wide estimation of glacier retreat. The future development will investigate the sediment-limited conditions. 


How to cite: Bazilova, V., Duurkoop, L., Hirschberg, J., de Haas, T., and Immerzeel, W.: Deglaciation and debris flow dynamics: how does the glacier retreat affect debris flow activity in High Mountain Asia? , EGU General Assembly 2024, Vienna, Austria, 14–19 Apr 2024, EGU24-20102, https://doi.org/10.5194/egusphere-egu24-20102, 2024.

EGU24-20399 | Orals | HS9.2

Accumulation of water and sediments upstream of Tuscan check dams 

Federico Preti, Sara Pini, Giorgio Cassiani, Andrea Dani, Yamuna Giambastiani, Luca Peruzzo, and Luigi Piemontese

Faced with a decline in water resources due to precipitation reduction and variability, it is fundamental to identify potential natural "reservoirs" and quantify their water retention capacity. This study examined approaches to estimate the water content rapidly and systematically in the sediment upstream of check dams at different scales, even with limited input data.

The study was conducted in the northern part of Tuscany, with a specific focus on the Casentino Valley. After gathering the necessary databases and information, an estimation model was developed using QGIS Model Designer, and geophysical surveys were performed using Electrical Resistivity Tomography (ERT).

The QGIS-based model relies on limited input data, including the geographical positioning of weirs, the hydrographic network, and a Digital Terrain Model (DTM) of the study area. This method provides useful initial approximate estimates of the water resources in the study area. The ERT surveys revealed varying patterns depending on the lithology of different areas, but a clear discontinuity between the sediment wedge and the original riverbed was observed, confirming the effectiveness of this tool in analyzing each individual structure. With the data obtained through the databases, it was also possible to conduct an analysis on the relationship between the original slope and the compensation slope of sediment wedges, and the distance between check dams located on the same river reach.

In the perspective of utilizing these natural reservoirs, possible maintenance interventions are proposed, especially on the existing spillways, to make a portion of the available water usable, accompanied by an assessment of potential implications. In the future, implementing the outlined procedures and integrating them with other tools could provide support for evaluating and utilizing these "hidden water resources."

How to cite: Preti, F., Pini, S., Cassiani, G., Dani, A., Giambastiani, Y., Peruzzo, L., and Piemontese, L.: Accumulation of water and sediments upstream of Tuscan check dams, EGU General Assembly 2024, Vienna, Austria, 14–19 Apr 2024, EGU24-20399, https://doi.org/10.5194/egusphere-egu24-20399, 2024.

EGU24-20482 | Posters on site | HS9.2

Advancing sediment fingerprinting techniques: The importance of considering sediment mixtures data in tracer selection 

Leticia Gaspar, Borja Latorre, Ivan Lizaga, and Ana Navas

Sediment fingerprinting has become a key tool to identify and quantify sediment sources within a catchment. The technique involves statistical testing of a range of properties of source materials to identify a set of tracers that can effectively discriminate between different potential sources before estimating the source contributions with unmixing models. However, despite its increasing popularity among researchers, there is a lack of standardized procedures for tracer selection, which is crucial to estimating a reliable contribution of sediment sources. The most widespread methodology consisted of an initial mass conservation test, usually termed range test (RT), followed by the use of Kruskal-Wallis (KW) and discriminant function analysis (DFA) tests. However, KW and DFA even though identifies the best combination of tracers that provide the maximum discrimination between sources, do not incorporate the information of the sediment mixtures in the analysis. Novel methods highlight the importance of selecting the right tracers for each individual mixture and avoid the inclusion of tracers out of consensus or with non-conservative behavior by using consensus ranking (CR) and consistent tracer selection (CTS) methods. This contribution addresses the role of selecting appropriate tracers, demonstrating their impact on the results of the unmixing model. The main objectives are to emphasize the importance of considering the information provided by the sediment mixture in the selection of tracers and to pay attention to the impact of having sediment mixtures with values below the detection limit of the tracer being selected for source discrimination. A set of experimental and real sediment mixtures were selected to explore the different tracer selection methods, comparing the tracers selected and the contribution of sources obtained using the FingerPro unmixing model. We present the results of rigorously testing methodologies with the aim of understanding and assessing the suitability of each tracer selection method to select a combination of statistical and process-based criteria to select appropriate sediment properties for the unmixing models. Our findings highlight the importance of considering the information on the sediment mixture information for the selection of potential tracers, an aspect often neglected by conventional methods. This oversight can result in biased findings due to the use of tracers that are either not coherent or not conservative.

How to cite: Gaspar, L., Latorre, B., Lizaga, I., and Navas, A.: Advancing sediment fingerprinting techniques: The importance of considering sediment mixtures data in tracer selection, EGU General Assembly 2024, Vienna, Austria, 14–19 Apr 2024, EGU24-20482, https://doi.org/10.5194/egusphere-egu24-20482, 2024.

EGU24-21734 | Orals | HS9.2

Measures to mitigate torrential hazards in a typical alpine catchment area in Slovenia 

Jost Sodnik, Matjaž Mikoš, and Nejc Bezak

Various sediment-related disasters such as flash floods, debris flows and landslides can occur in an alpine torrential catchment area. To protect infrastructure and human life, various structural and non-structural (grey, green and hybrid infrastructure) protection measures can be used to mitigate torrential risks. An overview is given of the protective measures constructed near the Krvavec ski resort in north-western Slovenia (Central Europe). In May 2018, an extreme debris flood occurred in this area, causing considerable economic damage. After the event in May 2018, various field investigations (e.g. geological and topographical surveys) and modeling applications (e.g. hydrological modeling, debris flow) were carried out to prepare the necessary input data for the design of protective measures against such disasters in the future — due to climate change, further disasters are expected in this torrential catchment area. Compensatory measures include the engineering works of local streams, the construction of a large silt check dam for sediment retention, the construction of several smaller retention dams and the construction of 16 flexible net barriers with an estimated retention volume of ~8000 m3 to control erosion. A comprehensive monitoring system was also set up in the study area to observe and monitor potential future extreme events. This monitoring system includes measurements of corrosion of flexible nets, estimation of concrete abrasion on retention dams, regular geodetic surveys with small drones (UAV) and hydro-meteorological measurements with rain gauges and water level sensors. The recent extreme floods of August 2023 also hit this part of Slovenia, and this combination of technical countermeasures withstood the event and prevented large amounts of coarse debris from being transported to the downstream section and destroying infrastructure, as was the case in a less extreme event in May 2018. Therefore, such mitigation measures can also be used in other torrential catchment areas in the alpine environment.

How to cite: Sodnik, J., Mikoš, M., and Bezak, N.: Measures to mitigate torrential hazards in a typical alpine catchment area in Slovenia, EGU General Assembly 2024, Vienna, Austria, 14–19 Apr 2024, EGU24-21734, https://doi.org/10.5194/egusphere-egu24-21734, 2024.

EGU24-1796 | Orals | HS9.3

Assessing the impact of soil decontamination on radiocesium and sediment transfers in a catchment affected by Fukushima nuclear accident, Japan, using a reservoir sediment core. 

Thomas Chalaux-Clergue, Pierre-Alexis Chaboche, Sylvain Huon, Seiji Hayashi, Hideki Tsuji, Yoshifumi Wakiyama, Atsushi Nakao, and Olivier Evrard

Significant quantities of radionuclides including a majority of 137Cs have been deposited onto Fukushima landscapes following the accident of Fukushima Dai-ichi Power Plant in March 2011. Starting from late 2013, the Japanese government initiated a large-scale decontamination programme for cropland, residential areas, grassland and forest borders, which was conducted on 12% of the catchment area (8.2 km2) while forest, which is the dominant land use (88%), was not decontaminated. The surface layer of cropland and residential soils (~5 cm) concentrating radiocesium (134Cs, 137Cs) was removed and substituted with a fresh soil -composed of saprolite layer mined at local quarries- which represent 3% of the catchment area (1.8 km2). Thirteen years after the accident, questions remain regarding the fate of residual particle-bound 137Cs across terrestrial environments in response to extreme precipitation (e.g. tropical storm, typhoon, extra-tropical cyclone) and associated erosion events. In particular, there is a need to identify and quantify the sources delivering sediment and associated 137Cs to the water bodies, to reconstruct and evaluate the impact of decontamination on sediment and radiocesium transfers. To conduct this project, one sediment core was collected in undisturbed condition in June 2021 at a downstream location of the Mano Dam reservoir, which drains an early decontaminated catchment (67 km2) (2014–2016). Elemental geochemistry, organic matter, visible colorimetry, particle size, and radiocesium analyses were conducted on the sediment core, with depth increments of 1 cm. These analyses were used to provide multiple lines of evidence to define and interpret the major precipitation events recorded by the sedimentary sequence. Then, the sediment source fingerprinting technique allowed, with a multiple modelling approach (MixSIAR and BMM), to identify changes in sediment sources with variable contributions from forest, cropland, and subsoil (e.g. channel bank, fresh soil) throughout time. During abandonment (2011–2016), the contribution from cropland sharply decreased (from ~50% to 30-35%) while forest increased (from ~40% to 60-65%). Nevertheless, after the completion of decontamination, in late 2016, a significant increase of cropland contributions was observed, returning to the pre-accidental level in the most recently deposited sediment (~55%). It occurred concomitantly with that of sediment originating from the freshly-added soil (i.e. granite saprolite; from about 5% to 25%), reflecting the impact of decontamination. During abandonment, the 137Cs activity in sediment was reduced by 40%, such as the 137Cs flux per extreme event, which was reduced by 20%. After the completion of decontamination, although a strong decrease in 137Cs activity in sediment was observed (up to -60%), it was not associated with such a significant decrease as 137Cs flux per extreme event (0% to -20%). This suggests that the reduction in 137Cs activity in the sediment following decontamination may result from a dilution of contaminated sediments originating from forest with sediment originating from decontaminated cropland fresh soil rather than the removal of contaminated soil in designated areas. To understand the impact of natural soil protection against erosion through revegetation on 137Cs flux over a longer abandonment time, studying sediment cores from lately decontaminated catchment would be useful.

How to cite: Chalaux-Clergue, T., Chaboche, P.-A., Huon, S., Hayashi, S., Tsuji, H., Wakiyama, Y., Nakao, A., and Evrard, O.: Assessing the impact of soil decontamination on radiocesium and sediment transfers in a catchment affected by Fukushima nuclear accident, Japan, using a reservoir sediment core., EGU General Assembly 2024, Vienna, Austria, 14–19 Apr 2024, EGU24-1796, https://doi.org/10.5194/egusphere-egu24-1796, 2024.

EGU24-1821 | ECS | Orals | HS9.3

Impact of soil erosion on chlordecone insecticide transfers in a tropical volcanic cultivated subcatchment 

Rémi Bizeul, Oriane Lajoie, Olivier Cerdan, Lai-Ting Pak, and Olivier Evrard

Between 1972 and 1993, in the French West Indies, chlordecone – a toxic organochlorine insecticide – was applied to control the banana weevil. In the late 1990s, the intensification of agricultural practices (i.e. intensive ploughing, herbicide application) under banana plantations is expected to have led to accelerated soil erosion and sediment transfers (Bizeul et al., 2023) to aquatic systems and, ultimately, to marine environments (Sabatier et al., 2021). Due to the high affinity of chlordecone for organic matter and its hydrophobicity, these sediment transfers are associated with chlordecone remobilization (Mottes et al., 2021) and pesticide transfers along the land-to-sea continuum. Nevertheless, the links between soil erosion, sediment and chlordecone transfers are not well understood. The investigation of these processes is therefore essential to manage chlordecone transfers along the land-to-sea continuum.

To this end, three sediment cores were collected in an agricultural reservoir (Saint-Esprit, Martinique) and five soil cores (one-meter depth) were sampled along a transect in a banana plantation draining to the reservoir.

Regarding sediment cores, age-depth models were drawn for each core using short-lived radionuclide activities (Bruel et Sabatier, 2020). Furthermore, dry bulk density was measured to calculate mass accumulation rates. Moreover, chlordecone and organic carbon contents were measured on three cores. Overall, results show a correspondence between the increase of sediment supply to the reservoir and that of chlordecone and organic carbon fluxes. In particular, chlordecone fluxes showed an increase since 1999 (± 4 years, depending on the cores) from 200 µg.kg-1 to 600-750 µg.kg-1.

Regarding soil cores, radiocesium activities were measured in 5-cm increments and chlordecone contents were measured in a selection of 2 cores (uplslope and downslope of the transect). On the upper hillslope part, chlordecone contents showed a strong increase at 20 cm, from 255 µg.kg-1 to 591 µg.kg-1, in line with radiocesium activity increase, from 0.5 Bq.kg-1 to 1.4 Bq.kg-1. On the lowest hillslope part, chlordecone contents showed a strong increase at 70 cm, from 520 µg.kg-1 to 1220 µg.kg-1. Based on these results, we assume that chlordecone distribution follows erosion pathways and can accumulate on the foot slope of this banana plantation. Furthermore, in contrast, constant chlordecone contents observed in the upper part of the profile in each core (i.e. 20 and 70 cm) suggest an homogenization of the soil profile, probably due to ploughing operations carried out every 6-8 years for cyclical banana re-plantation.

Overall, these results confirm the transfer of chlordecone with soil particles along a cultivated hillslope and, ultimately, in the sediment deposited in the reservoir. We assume that these processes also reflect land use changes and the occurrence of erosive tropical climatic events. Further work is needed to confirm the validity of these results to other cultivated catchments across the French West Indies.

How to cite: Bizeul, R., Lajoie, O., Cerdan, O., Pak, L.-T., and Evrard, O.: Impact of soil erosion on chlordecone insecticide transfers in a tropical volcanic cultivated subcatchment, EGU General Assembly 2024, Vienna, Austria, 14–19 Apr 2024, EGU24-1821, https://doi.org/10.5194/egusphere-egu24-1821, 2024.

EGU24-3464 | Posters on site | HS9.3

Reservoir sediments in central Europe as archives of human-environmental interaction during the past 115 years - the example of the Urft Reservoir 

Georg Stauch, Lukas Dörwald, Alexander Esch, Eberhard Andreas Kümmerle, Frank Lehmkuhl, Philipp Schulte, Christina Schwanen, and Janek Walk

The mid-European landscape has been influenced by humans since several millennia. In the Eifel Mountains in western Germany, mining and ore processing in combination with land-use changes considerably altered sediment composition and sediment fluxes. While there have been frequent studies to reconstruct changes in sediment fluxes on the long term, considerably less research focused on the past century. To decipher the recent human influence on the landscape, the sediments of the Urft Reservoir in the northern Eifel Mountains were analysed. The Reservoir started operation in 1905, and was the largest reservoir in Europe at this time. In November in 2020 the reservoir was drained for construction works, offering the unique possibility to analyse sediment volume and composition.

A high resolution sediment budget for the past century was calculated using topographical maps with a scale of 1:1000 created prior to the construction of the reservoir. For the most recent topography the entire lake area was photogrammetrically surveyed using an uncrewed aerial system (UAS). Mean accumulation in the whole reservoir was around 1.54 m and regionally above 6 m.

Additionally, 24 cores were retrieved from the bottom of the reservoir. A range of different sedimentological proxies including grain-size, heavy metals, geochemical ratios, sediment colour and microplastics were analysed. An absolute chronology was established based on 137Cs dating. Up to four different sedimentary units could be distinguished in the cores. The upper two units consist of reservoir sediments and were deposited between 1905 and 2020. The heavy metals content in these sediments show a strong connection to historical changes in the ore industry in the Urft valley. The decline of the metal processing industry as well as stricter environmental protection laws resulted in a reduced input of lead, copper and zinc from the 1960s to the 1980s. Since that time the content has remained relatively constant. Microplastic particles appear in the sediments since the mid-1960s. Furthermore, a distinct layer of high microplastic content was recorded in the cores. This event-layer could be traced back to a major fire in a glassworks and plastics factory in 1991 in the upper Urft catchment.

In summer 2021, the northern Eifel Mountains were impacted by a catastrophic flooding event, resulting in massive destructions in the catchment of the Urft and strong relocation of sediments in the floodplain. To assess these geomorphologic changes in the Urft reservoir, the water level was lowered again in December 2021 and an additional UAS survey was conducted. Furthermore, additional sediment samples were taken. However, we could neither observe any significant changes in the heavy metal content in the flood sediment nor asses the sediment input by the flooding event. The topographic changes due to the flood were generally to low and within the error margins of our method (0.5 m).

How to cite: Stauch, G., Dörwald, L., Esch, A., Kümmerle, E. A., Lehmkuhl, F., Schulte, P., Schwanen, C., and Walk, J.: Reservoir sediments in central Europe as archives of human-environmental interaction during the past 115 years - the example of the Urft Reservoir, EGU General Assembly 2024, Vienna, Austria, 14–19 Apr 2024, EGU24-3464, https://doi.org/10.5194/egusphere-egu24-3464, 2024.

EGU24-3953 | Orals | HS9.3

Can beavers clean our streams? A study from three agricultural catchments in south-west England 

Gareth Bradbury, Alan Puttock, Gemma Coxon, Stewart Clarke, and Rich Brazier

In common with many European streams, most streams in south-west England have failed to reach Good Ecological Status under the Water Framework Directive. The landscape comprises mainly pastoral and arable fields, from which rainwater can run off, carrying huge quantities of sediment and surplus fertiliser. The receiving streams, often highly modified through channelisation, are degraded from the physical, chemical and biological effects of these pollutant loads, most notably high nutrient and fine sediment inputs leading to eutrophication. 


After an absence of 400 years, Eurasian beavers Castor fiber are now being re-introduced into some of these landscapes, or are colonising naturally from nearby introductions. Through the building of their dams and creation of diverse, ponded wetland environments, beavers have been shown to deliver multiple ecosystem services, including flow moderation, habitat provision and water quality improvements.

 
Encompassing highly productive, vegetation-rich shallow areas and deeper, oxygen-limited areas with different nutrient-cycling pathways, beaver wetlands have the potential to improve water quality through the settling out of solids and uptake and cycling of nutrients. By contrast there are periodic releases of solids and nutrients due to burrow and canal excavations, dam breaches and nutrient inputs from the beavers themselves and the diverse fauna and flora supported in their wetlands.

 
To examine the potentially dynamic effects of beavers on the transfer of sediments and contaminants (nutrients) in catchments, this study used fortnightly water sampling at the inflow, outflow and upstream and downstream of three beaver re-introduction enclosures over two years. In addition, automated samplers were deployed to investigate finer temporal resolution responses to rainfall events. 


For each site, suspended solids, nitrogen, carbon and phosphorus concentrations and loads were determined. Sediment storage dynamics were revealed through the novel use of sonar monitoring in ponds and continuous in-situ turbidity sensor measurements at the inflow and outflow.

 
Results demonstrate the dynamic nature of sediment and nutrient reduction in beaver-engineered wetlands, with switches between source and sink states depending on inflow conditions and pond-specific factors. Beaver wetlands were shown to remove nutrient pollution where inflow loads were high and the mixed temporal and spatial dimensions of this study help resolve differences in results between previously published studies.

How to cite: Bradbury, G., Puttock, A., Coxon, G., Clarke, S., and Brazier, R.: Can beavers clean our streams? A study from three agricultural catchments in south-west England, EGU General Assembly 2024, Vienna, Austria, 14–19 Apr 2024, EGU24-3953, https://doi.org/10.5194/egusphere-egu24-3953, 2024.

EGU24-6153 | ECS | Posters on site | HS9.3

Robust River load estimation of micropollutants: Method validation on an extended micropollutants dataset 

Nikolaus Weber, Steffen Kittlaus, Radmila Milacic, Jörg Krampe, Ottavia Zoboli, and Matthias Zessner

Many anthropogenic sources discharge thousands of micropollutants into surface waters, which can pose a risk to human health and the environment. Monitoring provides a better understanding of the occurrence and transport dynamics of these pollutants and is the basis for mitigation measures as well as valuable validation loads for pollution transport models. As conventional monitoring methods do not provide the full picture in terms of transport dynamics (Weber, 2023), there is a need for more specific monitoring methods.

To prove this statement, a one-year monitoring program was established at two Austrian rivers, namely the Wulka and one of its tributaries. The locations are strategically located to capture different catchment properties. This monitoring program consists of monitoring stations at each river equipped with automatic samplers and online measurements of flow, turbidity, and conductivity. The monitoring is carried out by a one-year sampling program to cover the variability of micropollutants over a whole year by taking both volume-proportional composites and grab samples at a biweekly interval. The samples are then analyzed in labs and for total suspended solids (TSS) and various micropollutants from the group of heavy metal, pharmaceuticals, pesticides and PFAS.

Turbidity events are an important transport factor for many micropollutants and therefor need to be considered for annual load calculation (Weber, 2023). We therefor integrated online turbidity data with the pollutant measurements to enhance accuracy of current load calculation methods. Those calculated annual load were validated on the monitoring data from the monitoring campaign to ensure robust results. The biweekly resolution of the monitoring data allowed for detailed analysis to reveal patterns, trends and anomalies that could impacted the load estimation. This led to a comparison of the methods and suggestions to improve their robustness.

This research helps to understand river transport dynamics of TSS and micropollutants towards robust estimation of annual micropollutant loads in rivers to improve future monitoring campaigns and annual load calculation for pollution transport model validation.

How to cite: Weber, N., Kittlaus, S., Milacic, R., Krampe, J., Zoboli, O., and Zessner, M.: Robust River load estimation of micropollutants: Method validation on an extended micropollutants dataset, EGU General Assembly 2024, Vienna, Austria, 14–19 Apr 2024, EGU24-6153, https://doi.org/10.5194/egusphere-egu24-6153, 2024.

EGU24-6366 | ECS | Posters on site | HS9.3

Environmental and physical factors controlling the distribution of 137Cs in lake sediments in the Southern Hemisphere: a meta-analysis 

Floriane Guillevic, Olivier Evrard, Pierre Sabatier, Anthony Foucher, Gerald Dicen, and Christine Alewell

For decades the artificial radionuclide 137Cs has been used as an independent time marker to ascertain the 210Pb chronology to date recent sediments from the Anthropocene period (<150 years). The distribution and depositional timing of man-made fallout radionuclides (FRN) are well constrained in the Northern Hemisphere, where most nuclear weapon test sites were located. The maximum deposition year of 1963 is usually marked by a 137Cs peak. Although the major nuclear powers stopped testing in 1963, France continued to test atmospheric nuclear bombs (1966-1974) in French Polynesia in the Pacific (Moruroa and Fangataufa atolls). This later and prolonged period of French bomb testing in the Southern Hemisphere may have resulted in a wider distribution with higher FRN levels in depth profiles of environmental archives, such as lake sediment cores.

To test this hypothesis, a literature review was conducted (n=124), in which 137Cs data were collected from lake sediments (including dam reservoirs and lagoons) across the Southern hemisphere. Decay-corrected 137Cs activities, 137Cs inventories (where available) and parameters of the 137Cs profile shape have been reported for many countries and latitudinal bands. In addition, environmental and physical parameters were reported for each lake site. Global parameters influence the atmospheric distribution and deposition of FRN such as the distance from the nuclear test site, the wind distribution (relative to the Intertropical Convergence Zone position), the wind direction (westerlies vs trade winds) and the annual precipitation. Conversely, local scale parameters such as sedimentation rate, catchment to lake area ratio, and maximum elevation difference will influence the depositional processes of FRN in lake sediments. A meta-analysis of these parameters will help to identify parameters that are crucial for understanding the 137Cs distribution across the Southern Hemisphere. Based on these results, we selected the new sampling sites, which are likely to reflect mainly FRN atmospheric input, for further reconstruction of fallout radionuclide chronologies in the Southern Hemisphere.

How to cite: Guillevic, F., Evrard, O., Sabatier, P., Foucher, A., Dicen, G., and Alewell, C.: Environmental and physical factors controlling the distribution of 137Cs in lake sediments in the Southern Hemisphere: a meta-analysis, EGU General Assembly 2024, Vienna, Austria, 14–19 Apr 2024, EGU24-6366, https://doi.org/10.5194/egusphere-egu24-6366, 2024.

Suspended sediment is closely linked to nutrients, pollutants, and heavy metals, profoundly affecting aquatic ecosystems and widely recognized as a vital indicator of inland water health. Consequently, Suspended sediment concentration (SSC) can affect the growth of aquatic organisms in fish ponds, posing a substantial threat to aquaculture production. However, research on the long-term spatial and temporal dynamics of SSC, along with its response to various natural and anthropogenic factors in small water bodies like fish ponds, remains relatively scarce. This study aims to recalibrate current unified models using measured data to derive a more applicable SSC retrieval model specifically for the Guangdong-Hong Kong-Macao Greater Bay Area (GBA). Using Landsat top-of-atmosphere reflectance data from Google Earth Engine (GEE), the recalibrated model was utilized to generate SSC data for fish ponds in GBA spanning from 1986 to 2019.The results indicate that SSC in GBA fish ponds is significantly elevated during spring and summer compared to autumn and winter, with spring SSC recording the highest levels in most years. In the last 34 years, there has been a substantial overall decline in SSC in fish ponds, with an almost 50% reduction in the annual average SSC. Notably, this reduction was most pronounced in the northern, western, and eastern regions, resulting in a spatial pattern of higher SSC concentrations in the central and southern areas and lower concentrations in the surrounding regions. Correlation analysis unveiled substantial relationships (P < 0.01) between SSC interannual variations and factors like wind, speed, river sediment load, and NDVI, except for precipitation (P > 0.05). The surrounding land use of fish ponds and their proximity to rivers emerged as critical determinants influencing the spatial distribution of SSC. Furthermore, diverse aquaculture activities, such as the pond's farming cycle and production, play a significant role in regulating SSC, thereby influencing its temporal and spatial variations. GBA is one of China's highly developed aquaculture regions with dense populations, thus rendering the findings of this study valuable from both economic and ecological perspectives.

How to cite: Zhou, T. and Yang, X.: Response of suspended sediment to natural and anthropogenic factors in the Guangdong-Hong Kong-Macao Greater Bay Area’s fish ponds over the Past 40 Years, EGU General Assembly 2024, Vienna, Austria, 14–19 Apr 2024, EGU24-7807, https://doi.org/10.5194/egusphere-egu24-7807, 2024.

EGU24-9548 | Orals | HS9.3

Mobilisation and transport dynamics of potential toxic elements during high flow events in a small river catchment 

Steffen Kittlaus, Radmila Milačič, Katarina Marković, Nikolaus Weber, Matthias Zessner, and Ottavia Zoboli

Export of potential toxic elements and other particle bound pollutants from catchments is highly dependent on the flow regime. The main driver is the higher mobilisation and transport capacity for suspended particulate matter (SPM) during high flow events.  But are there further dynamics in the concentrations which are not purely driven by the SPM transport?

To answer this question, we investigated the dynamics of the concentrations of potential toxic elements, several other elements and total suspended solids during high flow events by automated sampling and subsequent analysis of dissolved and total concentrations by ICP-MS after microwave assisted acid digestion. At 3 river monitoring sites 3 high flow events were sampled with 3-6 samples per event and site, covering different parts of the flow and turbidity peaks, which were recorded by online-measurements. To complement the river monitoring with data about potential sediment sources, landuse-stratified soil sampling in the catchment and river bed sediment sampling were conducted.

Our case study was the Wulka river in eastern Austria with a catchment area of 384 km2 and two if its tributaries, one with a very high share of treated waste water and the other with no permanent input of waste water. With a mean annual precipitation of 695 mm and a mean elevation of 256 m a.s.l. the river can be classified as a low land river. The landuse is dominated by agriculture including significant share of viniculture.

A first explorative principal component analysis showed, that several elements are strongly related with each other and the suspended sediment concentration. As this was expected, we used the SPM concentration to normalize the elemental concentrations and therefore taking out the variability caused by the suspended solids dynamics for further analysis. The remaining variability will be investigated regarding temporal and spatial patterns and correlation with the sediment and soil concentrations which can give indications about the emission pathways and sources.

To characterize the sampled high flow events, a hysteresis index was calculated from the discharge and turbidity signal which revealed different types of hysteresis, some clockwise hysteresis, several complex hysteresis patterns with different directions of the hysteresis during different times of the event and one small event with anticlockwise hysteresis. Different types of hysteresis can give indications about the distance of the sediment source to the observation location, further contributing to the exploration of SPM sources.

How to cite: Kittlaus, S., Milačič, R., Marković, K., Weber, N., Zessner, M., and Zoboli, O.: Mobilisation and transport dynamics of potential toxic elements during high flow events in a small river catchment, EGU General Assembly 2024, Vienna, Austria, 14–19 Apr 2024, EGU24-9548, https://doi.org/10.5194/egusphere-egu24-9548, 2024.

EGU24-10712 | Posters on site | HS9.3

Retro-observations of terrestrial and aquatic ecosystem degradation associated with agricultural intensification in South America using sedimentary archives 

Anthony Foucher, Amaury Bardelle, Jean Paolo Gomes Minella, Marcos Tassano, Guillermo Chalar, Mirel Cabrera, and Olivier Evrard

Since the mid-1980s, agriculture in South America has intensified and expanded significantly. For example, Brazilian census data show that cultivated land increased by 80% between 1996 and 2006, mainly in ecologically fragile areas (e.g., the Amazon, Cerrado, and Pampa). While agriculture plays a critical role in the socio-economic life of South America's agricultural regions, it also has negative environmental impacts, including land-use change, biodiversity loss, soil erosion and agrochemical contamination. To mitigate the negative effects of accelerated sediment transport, conservation practices such as no-tillage were adopted in the 2000s. Despite the advantage of not tilling the soil, the no-till system has a significant potential for soil and water degradation, both because of the high amount of inputs (pesticides and nutrients) added to the soil surface and because of the susceptibility to surface runoff formation and related processes.

Agricultural expansion and intensification are expected to continue in South America in the coming decades to meet growing food demand. However, the long-term (>40 years) responses of terrestrial and aquatic ecosystems to these anthropogenic pressures and conservation practices remain poorly documented due to a lack of multi-decadal monitoring stations or field measurements. Sedimentary archives collected in rivers and lakes draining South American regions affected by this agricultural expansion/intensification provide a unique opportunity to reconstruct the magnitude of these environmental impacts. In this study, we propose a synthesis of sedimentary archives published in Brazil, Uruguay, and Argentina, with a focus on the post-1950 period. These studies, which report on sediment dynamics and sediment characteristics (such as organic matter, phosphorus, accumulation rate), will be used to reconstruct the regional trajectory of terrestrial and aquatic ecological degradation related to these increasing human pressures. These trajectories will be compared with existing data on land use change, agricultural inputs, etc. to understand the response of the system to these perturbations and to better anticipate potential future degradation in line with expected trends in the coming years.

How to cite: Foucher, A., Bardelle, A., Minella, J. P. G., Tassano, M., Chalar, G., Cabrera, M., and Evrard, O.: Retro-observations of terrestrial and aquatic ecosystem degradation associated with agricultural intensification in South America using sedimentary archives, EGU General Assembly 2024, Vienna, Austria, 14–19 Apr 2024, EGU24-10712, https://doi.org/10.5194/egusphere-egu24-10712, 2024.

EGU24-11245 | ECS | Orals | HS9.3

Spatio-temporal evolution and source tracking of arsenic in surface waters of an old mining district (Orbiel Valley, France) 

Marie Heydon, Eléonore Resongles, Corinne Casiot-Marouani, Eva Schreck, Philippe Behra, Rémi Freydier, Mylène Marie, Carole Causserand, Sophie Delpoux, Martin Roddaz, Alain Pages, and Jérôme Viers

Past mining activities in the Orbiel Valley pose a significant risk of As contamination to its ecosystems and inhabitants. Approximately 12 million tons of tailings from last century's As and Au mining operations remain on site. Rehabilitation works have been implemented to store mining wastes and treat leaching waters. However recent studies have revealed that contamination is still present in water and sediments (Khaska et al., 2015; Delplace et al., 2022). The complexity of the area and previous findings have shown the importance of a more in-depth study of As sources and fate in the watershed, including 1/ characterizing As contamination levels in the Orbiel River and its tributaries during different hydrological periods, 2/ identifying the main sources of As and 3/ distinguishing the natural geochemical baseline from anthropogenic inputs.

Water samples (<0.22 µm) were collected in the Orbiel River and its tributaries from 2018 to 2022, representing a total of 170 samples, to analyze major element and metal(loid) concentrations, alkalinity, dissolved organic carbon, Sr isotope ratio, and As redox speciation in the dissolved fraction. Rock samples representative of the different geological formations were collected to compare the natural and anthropogenic evolution of the Sr isotope along the Orbiel Valley.

Upstream the mining district, in Orbiel River, the dissolved As concentration was about 2 µg/L and increased downstream near the main waste storage area to 7 – 71 µg/L (min-max, depending on the period) with a high proportion of As(III) (> 52 %). The anthropogenic origin of this contamination was confirmed by the 87Sr/86Sr ratio, which is less radiogenic than in the upstream pristine area, in relation with lime treatment implemented in the mine waste area. However, some valley limestones exhibit a Ca-arsenate-like isotopic ratio, highlighting the need to use complementary tracers to distinguish between anthropogenic and lithological sources. Finally, the mining-impacted tributaries are identified as significant contributors of As to the Orbiel River.

The present study will serve as a reference to interpret the origin, transport, and fate of metal(loid)s during future extreme flood events characteristic of this Mediterranean river.


Delplace, G., Viers, J., Schreck, E., Oliva, P., Behra, P., 2022. Pedo-geochemical background and sediment contamination of metal(loid)s in the old mining-district of Salsigne (Orbiel valley, France). Chemosphere 287 (2).

Khaska, M., Le Gal La Salle, C., Verdoux, P., Boutin, R., 2015. Tracking natural and anthropogenic origins of dissolved arsenic during surface and groundwater interaction in a post-closure mining context: isotopic constraints. J. Contaminant Hydrol. 177–178, 122–135.

How to cite: Heydon, M., Resongles, E., Casiot-Marouani, C., Schreck, E., Behra, P., Freydier, R., Marie, M., Causserand, C., Delpoux, S., Roddaz, M., Pages, A., and Viers, J.: Spatio-temporal evolution and source tracking of arsenic in surface waters of an old mining district (Orbiel Valley, France), EGU General Assembly 2024, Vienna, Austria, 14–19 Apr 2024, EGU24-11245, https://doi.org/10.5194/egusphere-egu24-11245, 2024.

EGU24-11268 | Orals | HS9.3

Integrating lacustrine and coastal sediment records of environmental change in Northern Spain during the Anthropocene 

Mario Morellón, Juan Remondo, Víctor Villasante-Marcos, César Morales-Molino, Jon Gardoki, José Ezequiel Gómez-Arozamena, Jaime Bonachea, Victoria Rivas, Manel Leira, Francisco Javier Ezquerra, Pablo Cruz-Hernández, Pablo Valenzuela, María Luisa Canales, Mario Puente-Sierra, Sandra Yamile Hernández, Artur Stachnik, Carlos Sierra-Fernández, Willy Tinner, and Javier Martín-Chivelet

Reconstructing past environmental changes and identifying their main drivers is essential to predict the future response of natural systems to climate change under ever increasing anthropogenic pressure. To achieve this goal and understand the natural variability (prior to human disturbance) of the main processes involved, it is necessary to extend our temporal records back in time to pre-industrial conditions through the analysis of natural archives. 
The Cantabrian region (Northern Spain) constitutes an excellent natural laboratory to analyze and evaluate the magnitude of recent environmental change because of: i) its particular location, near to the boundary between Eurosiberian and Mediterranean biogeographic regions; ii) its strong elevation (from sea level to >2600 m asl) and climate (oceanic to continental mediterranean) gradients; and iii) the strong human impact to which this region has been subjected during the past few centuries. This research aims at understanding how recent (19th to 21st centuries CE) warming and increasing human land use have affected the geomorphological and geochemical dynamics of Northern Spanish watersheds, in the context of the environmental changes occurred during the last millennia. We use a multi-site approach, integrating high-resolution lake sediment records (Valle, Ausente, Isoba, Pozo Curavacas, Pozo Tremeo and Antuzanos) located along a West to East transect with a strong altitudinal gradient (17—1800 m asl), covering a wide range of climatic conditions and land management. To quantify the contributions of human and climate drivers to the recorded environmental changes, we use a multidisciplinary approach , involving geomorphological and paleolimnological proxies. We particularly focus on three main components of watershed dynamics: i) sediment delivery and depositional dynamics, ii) heavy metal loads, and iii) carbon fluxes. 
The multiproxy analysis of lake sediment cores (sedimentology, geochemistry, environmental magnetism, pollen and diatoms) dated by radiometric techniques (210Pb, 137Cs and 14C) reveals a dominant climate forcing at millennial to centennial timescales on depositional processes, in agreement with speleothem records. This signal has been modulated locally by changing anthropogenic landscape transformations driven by arable and pastoral farming as revealed by biological and geochemical proxies. In contrast, human-driven, abrupt increases in watershed erosion, heavy metal concentrations and nutrient loads occurred since the early to mid-20th century CE, coinciding with the Great Acceleration, in agreement with estuarine records along the Central and Eastern Cantabrian Sea coast analyzed by our research team and collaborators. According to available erosion models, this increase in sediment production has been influenced by a warmer and drier climate, with increasing flood frequency. This environmental change has been particularly intense at low-elevation sites subject to higher anthropogenic pressure, but it has been attenuated during the last two decades in high-elevation areas as a consequence of changing land use and environmental management. 
This research demonstrates the importance of combining different natural archives and methodologies to achieve a comprehensive understanding of the nature, timing, spatial variability, and consequences of the synergistic effects of human activities and climate change on watershed and regional scales. This is a contribution to CALACLIMP project (PID2021-122854OB-I00).

How to cite: Morellón, M., Remondo, J., Villasante-Marcos, V., Morales-Molino, C., Gardoki, J., Gómez-Arozamena, J. E., Bonachea, J., Rivas, V., Leira, M., Ezquerra, F. J., Cruz-Hernández, P., Valenzuela, P., Canales, M. L., Puente-Sierra, M., Hernández, S. Y., Stachnik, A., Sierra-Fernández, C., Tinner, W., and Martín-Chivelet, J.: Integrating lacustrine and coastal sediment records of environmental change in Northern Spain during the Anthropocene, EGU General Assembly 2024, Vienna, Austria, 14–19 Apr 2024, EGU24-11268, https://doi.org/10.5194/egusphere-egu24-11268, 2024.

Historic metal mining and smelting have greatly enhanced the levels and fluxes of heavy metals in and through the fluvial system of the Geul river, a nearly 60 km long transboundary meandering stream in the northeast of Belgium and southeast of the Netherlands. In this study, we examined the long-term (> 1 year) effects of the extreme June 2021 flood on the transfer of sediments and heavy metals through the Geul river system. For this, we quantified the volumetric sediment budget of the channel belt of Dutch part of the Geul river using 0.5 m resolution Lidar-derived DEMs (Algemeen Hoogtebestand Nederland - AHN) for the 2018-2022 period and compared that to the similarly derived sediment budget for the 2012-2018 period. Furthermore, samples of fine sediment from the river bed and the top of the point bars were collected at more or less regular downstream intervals in 2022 and 2023, respectively. These sediment samples were analysed for total zinc and lead concentrations.

During the 2012-2018 period, the sediment of the channel belt was generally negative with an average net erosion rate of about 130 m3 km-1 y-1. This implies that during this period, river cut-bank erosion was not fully compensated by pointbar accretion and that the surface level of the newly formed point bars of the meandering Geul river was in general lower than the former floodplain surface. During the 2018-2022 period, the sediment budget was close to zero in the first 22 km of the Dutch reach downstream from the Belgian-Dutch border. However, in the downstream portion of the channel belt, the net deposition rate increased strongly with an average of about 380 m3 km-1 y-1. This positive sediment budget indicates strong aggradation of the point bars, which can most likely be attributed to backwater effects during the 2021 flood event, which upstream from a culvert underneath a canal close to the confluence of the Geul river into the Meuse river.

The zinc and lead concentrations in the fine fractions of the bed sediments shows a gradually decreasing trend in downstream direction which can be attributed to dilution from less contaminated sediment inputs from soil erosion on the upstream hillslopes and bank erosion. This pattern cannot be directly linked to the June 2021 flood event. In the reach where the sediment budget was close to zero during the 2018-2022 period, the zinc and lead concentrations in the point bar sediments are comparable to those in the fine bed sediments and show similar decreasing downstream trend. However, in the downstream reach, where net aggradation occurred during the 2018-2022 period, the metal concentrations in the point bar sediments deviate from the generally decreasing trend and increase again by a factor of about four. This downstream pattern in metal concentrations denotes that during the 2021 flood event, sediments originating from the contaminated upstream reaches of the Geul river skipped a substantial reach the Geul channel belt and were mainly deposited in the downstream portion of the channel belt.

How to cite: van der Perk, M. and Walcott, D.: Downstream transfer of metal-contaminated sediments in the Geul river as a result of the extreme June 2021 flood event, EGU General Assembly 2024, Vienna, Austria, 14–19 Apr 2024, EGU24-12652, https://doi.org/10.5194/egusphere-egu24-12652, 2024.

EGU24-13348 | Orals | HS9.3

The varved sediment succession of Crawford Lake, Ontario, Canada: GSSP for the proposed Anthropocene Epoch  

R Timothy Patterson, Francine MG McCarthy, Martin J Head, Carling R Walsh, Nicholas L Riddick, Brian F Cumming, Paul B Hamilton, Michael FJ Pisaric, A Cale Gushulak, Peter R Leavitt, Krysten M Lafond, Brendan Llew-Williams, Autumn Heyde, Paul M Pilkington, Joshua Moraal, Nawaf A Nasser, Monica Garvie, Sarah Roberts, Neil L Rose, and Helen M Roe

The Crawford Lake sedimentary sequence in Milton, Ontario, Canada, has been chosen as the Global Boundary Stratotype Section and Point (GSSP) for the proposed Anthropocene Series/Epoch, with its inception occurring at 1952 CE in the mid-20th century. This sequence consists of seasonally deposited layers of organic matter capped by summer-deposited calcite, forming in alkaline surface waters when pH and temperature rise above 7.76 and ~15°C, respectively. These sediments preserve a range of proxies that mirror environmental shifts spanning from local, to regional, global scale, indicative of the Anthropocene's onset. Notably, a significant uptick in industrial fossil fuel combustion in the early 1950s is recorded by increased spheroidal carbonaceous particles and a shift in the sediment's nitrogen isotope composition. During the 1960s, the ratios of 239Pu:240Pu and 14C:12C peak, aligning with heightened radioactive fallout from atmospheric nuclear weapons testing, counterbalancing the old carbon effect in Crawford Lake's dolomitic basin. Post-World War II industrial growth in the Great Lakes region, part of the so-called Great Acceleration, led to acid rain that diminished calcite deposition and impacted primary productivity in the lake. This change is reflected in thinner calcite layers concurrent with the proposed GSSP. These varve thickness variations correlate with climate patterns and lake productivity trends, influenced by cycles like the Quasi-biennial Oscillation, El Nino-Southern Oscillation, the 11-year Schwabe sunspot cycle, and the Pacific Decadal Oscillation. The absence of pigments from anaerobic purple sulfur bacteria suggested an oxygen-rich monimolimnion but with elevated bottom-water salinities that was subsequently confirmed by water property data collected through the modern lake water column in all seasons.  Such an aerobic depositional environment is highly atypical for a meromictic lake and it was the elevated alkalinity and higher salinity conditions that resulted in preservation of varves. The oxygenated bottom waters serendipitously prevented the mobilization of 239Pu in the lake sediments, a key primary stratigraphic marker for the Anthropocene.

How to cite: Patterson, R. T., McCarthy, F. M., Head, M. J., Walsh, C. R., Riddick, N. L., Cumming, B. F., Hamilton, P. B., Pisaric, M. F., Gushulak, A. C., Leavitt, P. R., Lafond, K. M., Llew-Williams, B., Heyde, A., Pilkington, P. M., Moraal, J., Nasser, N. A., Garvie, M., Roberts, S., Rose, N. L., and Roe, H. M.: The varved sediment succession of Crawford Lake, Ontario, Canada: GSSP for the proposed Anthropocene Epoch , EGU General Assembly 2024, Vienna, Austria, 14–19 Apr 2024, EGU24-13348, https://doi.org/10.5194/egusphere-egu24-13348, 2024.

EGU24-14030 | ECS | Posters virtual | HS9.3

Secondary Flow and Turbulent Kinetic Energy in a Dredged Channel with Riverbank 

Sukhjeet Arora, Harish Kumar Patel, Abhijit Dilip Lade, and Bimlesh Kumar

Sand dredging from the rivers has become an uncontrolled practice that harms the river's ecology. It affects the flow structure of the river, leading to further deterioration of the river's morphology. Several field investigations and experimental studies have conformed to the erosive effects of sand mining pits upstream and downstream of mining locations. We conducted laboratory-scale flume experiments to study the impact of a mining pit on the secondary flow structure across a riverbank cross-section. Three bank slopes were tested, namely, 25°,31°, and 40°, and gravity flow experiments were conducted with and without a mining pit. Turbulent velocity data across the cross-section was analyzed to study the transverse and velocity distribution across the riverbank for both with-pit and without-mining-pit cases. Results show that dredging an upstream mining pit significantly affects the transverse and vertical velocities, especially on the bank slopes and near the bed in the main channel portion. The turbulent kinetic energy in the flow region on the bank slope and near the bed in the main channel portion significantly increases because of the pit excavation. These alterations in the secondary flow within the riverbank can lead to morphological changes and may affect the bank stability of rivers.

Keywords: Sand Mining, Turbulent kinetic energy, turbulence

How to cite: Arora, S., Kumar Patel, H., Dilip Lade, A., and Kumar, B.: Secondary Flow and Turbulent Kinetic Energy in a Dredged Channel with Riverbank, EGU General Assembly 2024, Vienna, Austria, 14–19 Apr 2024, EGU24-14030, https://doi.org/10.5194/egusphere-egu24-14030, 2024.

EGU24-15753 | Posters on site | HS9.3

Seasonal Retrieval of Suspended Sediment in the Pearl River Estuary Based on Measured Data 

Shirong Cai and Xiankun Yang

Suspended sediment is an important water quality parameter that plays an important role in regulating water and sediment dynamics in estuaries and shaping landform patterns. As one of China's important shipping channels, the sediment transport laws in the Pearl River Estuary (PRE) are very complex, which affects the water quality monitoring, pollutant transport, and offshore environmental and ecological protection of the PRE. This study takes the Pearl River Estuary as the study area, combines Landsat 8 images and measured data to construct suspended sediment inversion models in four seasons, and explores the seasonal patterns of suspended sediment concentration (SSC), to gain a deeper understanding of the transport mechanisms of suspended sediment in the PRE. The results show that: (1) From 2013 to 2021, there were significant seasonal differences in SSC. SSC was generally low during autumn and winter, and was higher during the dry season compared to the wet season. (2) At the interannual scale, SSC in the PRE exhibited a stable decrease. The suspended sediment is mainly concentrated at the estuary, and the spatial distribution pattern shows a distribution trend of higher on the west coast and lower on the east coast. (3) The suspended sediment in this region is influenced by various factors, such as upstream dam construction, seasonal rainfall changes, and land use changes. The findings of this study provide scientific insights for the sustainable development and ecological environment protection of the Pearl River Estuary, as well as suggestions for navigation safety and the security of infrastructure on both coasts.

How to cite: Cai, S. and Yang, X.: Seasonal Retrieval of Suspended Sediment in the Pearl River Estuary Based on Measured Data, EGU General Assembly 2024, Vienna, Austria, 14–19 Apr 2024, EGU24-15753, https://doi.org/10.5194/egusphere-egu24-15753, 2024.

EGU24-17267 | ECS | Orals | HS9.3

Tracing the eutrophication history of Lake Baldegg using diatom-bound nitrogen isotopes 

Jules Millet, Nathalie Dubois, Moritz F. Lehmann, and Anja S. Studer

Diatom frustules are well-preserved in marine and lacustrine sediments over hundreds or even thousands of years. In addition, although only in very small amounts, they also contain organic matter within their siliceous structure. Previous applications have shown that the 15N/14N ratio of the organic nitrogen contained in diatom frustules (diatom-bound δ15N, or δ15NDB) can be used as a proxy for nutrient cycling in the polar oceans, and that it is not affected by diagenetic effects. However, the applicability of this paleo-proxy to lacustrine sediments has never been tested. Here, we explore the use of δ15NDB to reconstruct the history of nitrogen dynamics in Lake Baldegg (Switzerland) over the past 300 years. This lake was heavily eutrophied due to anthropogenic activities during the 20th century, before the implementation of lake restoration measures (i.e., artificial aeration of the lake bottom since 1982). Using a multi-proxy approach (e.g., reflectance-inferred chlorophyll a and organic carbon accumulation rates, XRF sulfur counts, bulk isotopic composition, C:N ratio), we identified two distinct eutrophication phases (1880-1950 and 1950-1980) that were characterised by an increase in organic matter accumulation and primary productivity, the occurrence of bottom water anoxia, and a change in the origin of the bulk organic matter. The implementation of re-oligotrophication measures has led to the disappearance of anoxic conditions at the bottom of the lake after 1995, and a decrease in phosphorus concentrations in the lake (the latter observed in the monitoring data), which seems to have mitigated primary productivity and organic matter accumulation. δ15NDB increased during the first phase of eutrophication, which could be due to extended denitrification in the water column in an expanding anoxic water column zone, and/or limiting N concentrations for phytoplankton growth, leading to increased nitrate utilization. During the second phase, δ15NDB decreased, probably because fixed N in surface waters was no longer limiting for phytoplankton. After the implementation of re-oligotrophication measures, δ15NDB increased again, possibly the isotopic imprint of external N inputs with a high δ15N signature, such as organic fertilizers (e.g. animal manure, compost). Additionally, the δ15N of hand-picked Daphnia ephippia are lower than, and show no consistent offset to, δ15NDB, suggesting that the N isotope signal of δ15NDB is not transferred to the upper trophic level in that lake. Finally, we measured the offset between δ15NDB and δ15NBULK providing insight into the effects of early diagenesis on the N isotopic composition of bulk sediments. In Lake Baldegg, the offset reversed after the lake was artificially oxygenated, indicating a role of sediment oxygenation in the diagenetic alteration on δ15NBULK.

How to cite: Millet, J., Dubois, N., Lehmann, M. F., and Studer, A. S.: Tracing the eutrophication history of Lake Baldegg using diatom-bound nitrogen isotopes, EGU General Assembly 2024, Vienna, Austria, 14–19 Apr 2024, EGU24-17267, https://doi.org/10.5194/egusphere-egu24-17267, 2024.

EGU24-17656 | ECS | Orals | HS9.3

Unravelling the mechanisms behind the spatial and temporal trends of suspended sediment in the Rhine basin  

Jana Cox, Tatjana Edler, Marcel van der Perk, and Hans Middelkoop

River deltas are reliant on upstream fluvial sediment delivery for their survival. The ultimate sediment delivery to deltas and the changing bed dynamics of river channels are strongly dependent on climate and anthropogenic changes within the entire river basin that control the increase (due to e.g. increased erosion, climate change) or decrease (due to e.g. sand mining, dam construction) of sediment supply. In the case of the Rhine-Meuse basin, suspended sediment delivery to the delta apex at Lobith has decreased since the 1950s. Therefore, we investigated changes in suspended sediment concentrations (SSC) and suspended sediment loads (SSL) over time along the main Rhine branch and its major tributaries (the Aare, Main, Mosel and Neckar) to determine the cause of the decline. We hypothesis and mathematically demonstrate that the spatial pattern in the temporal change can explain and determine specific mechanisms that are causing the decline.

Using collated SSC data of varying frequency from 1997-2014, we explored the suspended sediment transport within and along branches using the rating curve method & discharge-suspended sediment relations for a total of 26 measurements stations in the basin. These were compared with bed level data from Ylla-Arbós et al. (2021), to examine the interaction of SSC with bed dynamics.

A clear spatial trend emerged: the decrease in SSC strongly increases in an upstream direction. In the Alpine Rhine SSC has increased. There is negligible change in the upper basin/impounded section of the Rhine. However, SSC decreases emerge after the confluences with the Main and Mosel branches and this decrease becomes stronger moving towards the delta.

We find that contrary to many other river basins which are showing declining fluvial sediment delivery to deltas due to upstream dams or sediment management activities, in the Rhine-Meuse basin  the cause is actually the changing retention of channels and differing erosion rates from the river bed. Since the 19th century there have been activities to straighten and narrow the Rhine river to embank and fix the river course for navigation. This created high amounts of incision in the river bed in the early 20th century, but as proven by Ylla-Arbós et al. (2021) and others, this incision is now decreasing. These changes in suspended sediment supply from the river bed can be correlated to the changing supply at the delta apex. Since the 1980s efforts have been made to stabilize bed erosion and this ‘fixing’ of the river beds has led ultimately to a declining suspended sediment supply to the delta apex. This suggests that response to human interventions is not only relevant at a centurial timescale but is likely to be a defining feature of sediment supply for the coming century.  


References

Ylla Arbós, C., Blom, A., Viparelli, E., Reneerkens, M., Frings, R. M., & Schielen, R. M. J. (2021). River response to anthropogenic modification: Channel steepening and gravel front fading in an incising river. Geophysical Research Letters, 48(4), e2020GL091338.

How to cite: Cox, J., Edler, T., van der Perk, M., and Middelkoop, H.: Unravelling the mechanisms behind the spatial and temporal trends of suspended sediment in the Rhine basin , EGU General Assembly 2024, Vienna, Austria, 14–19 Apr 2024, EGU24-17656, https://doi.org/10.5194/egusphere-egu24-17656, 2024.

EGU24-18246 | ECS | Posters on site | HS9.3

Suspended sediment and pollutant transport during heavy rain events: A case study of the Moselle river 

Liza-Marie Beckers, Magdalena Uber, Simon Terweh, Thomas Hoffmann, Arne Wick, and Gudrun Hillebrand

Extreme weather events pose major challenges for water managers and will likely increase in the future due to climate change. Heavy rain events potentially lead to short-term, but extraordinary changes in the composition of organic micropollutants (OMPs) e.g., via increased surface runoff and the input of untreated wastewater, as well as high inputs of suspended sediment into water bodies.

This study aims to unravel precipitation-related pollution patterns (including OMPs and suspended sediment) in the Moselle River and identify relevant sources and pathways relevant for rain-related emission. We used monitoring data of suspended sediment, which are derived using 15 min turbidity measurements or work-daily water sampling at seven stations starting in 1974. Furthermore, daily composite samples were collected by automatic samplers at two stations located along the German part of the Moselle River since April 2021. The chemical analyses included nontarget screening as well as target screening for selected fungicides.

From April 2021 to November 2021, 35 daily composite samples were selected for chemical analysis. Only one extreme rain event from July 12th- 14th, 2021 affected the water quality concerning suspended sediment concentrations and OMP mixture composition dramatically. During the event, 75 mm rainfall within 3 days lead to a flood with a return period of approximately five years. The estimated suspended sediment load of 141,000 tons during this event corresponds to approximately 13 times the long-term mean for the entire month of July and 23 % of the average annual load. A clockwise hysteresis pattern was observed, indicating instream remobilization of sediment and soil erosion in close proximity of the river. Concerning OMPs, three pollution patterns were identified. These patterns represented a) wastewater-related compounds diluted with increasing water level (e.g., pharmaceutical valsartan) as well as direct surface runoff from immediate surroundings of the river (e.g., fungicide fluopicolide), b) compounds introduced via increased groundwater discharge (e.g., pesticide metabolite metolachlor ESA) and c) compounds likely related to surface runoff in the catchment (e.g., herbicide terbuthylazine). While for the latter, the maximum intensity correlated with the maximum discharge and turbidity, the pattern related to groundwater input was characterized by a delay in maximum feature intensity relative to the maximum water level (i.e., kinematic wave effect).

Other, less extreme rain events that occurred since April 2021, did not show such pronounced OMP dynamics and such a strong hydro-sedimentary response in the Moselle river. This study supports our understanding of heavy rain induced OMP and suspended sediment emissions to a large river. With expected higher frequency and intensities of heavy rain events due to climate change, these emissions might gain in relevance in the future.

How to cite: Beckers, L.-M., Uber, M., Terweh, S., Hoffmann, T., Wick, A., and Hillebrand, G.: Suspended sediment and pollutant transport during heavy rain events: A case study of the Moselle river, EGU General Assembly 2024, Vienna, Austria, 14–19 Apr 2024, EGU24-18246, https://doi.org/10.5194/egusphere-egu24-18246, 2024.

EGU24-19408 | ECS | Posters on site | HS9.3

A Lagrangian Stochastic Approach with Embedded Ornstein-Uhlenbeck Processes for Suspended Sediment Transport 

Yin-Yen Peng and Christina W. Tsai

This study aims to develop a Lagrangian stochastic (LS) model for simulating suspended sediment transport in open channels. The model incorporates three physical levels, namely, position, velocity, and acceleration, to describe sediment movement precisely. Without using any approximations, this approach is intrinsically stochastic and differentiable. It can reproduce different scale motions in turbulent flow for any Reynolds number. We will introduce the Lagrangian turbulent velocity theory into the random term of the sediment transport force balance equation. The random term, describing random particle movements, is usually represented by the Weiner process (i.e., Brownian motion), which is nowhere differentiable. Building upon prior research on stochastic turbulence models, we adopt an 'embedded' Ornstein-Uhlenbeck process to replace the Weiner process in this study. This embedded structure is defined through a set of coupled stochastic ordinary differential equations (ODEs), resulting in a multi-layered equation system. These different levels are interconnected through differentials and integrals. We introduce specific time scales and parameters tailored to different flow conditions to enhance their applicability to sediment transport scenarios. After we build these LS models, we have to validate with data or even calibrate the parameters in the model. We usually use two types of data: DNS data and experimental data. We will extract the details of isotropic turbulent flow in DNS data (such as the Kolmogorov time scale and Lagrangian velocity). The mean flow velocity profile will be determined from the experimental data. One-way coupling might be a reasonable assumption for the suspended sediment transport. However, when the gravitational force acts on the particles, the inter-particle interactions dominate the bed region due to the high particle concentration. A more appropriate resuspension mechanism must be identified so the particle concentrations can be more accurately quantified.

How to cite: Peng, Y.-Y. and Tsai, C. W.: A Lagrangian Stochastic Approach with Embedded Ornstein-Uhlenbeck Processes for Suspended Sediment Transport, EGU General Assembly 2024, Vienna, Austria, 14–19 Apr 2024, EGU24-19408, https://doi.org/10.5194/egusphere-egu24-19408, 2024.

EGU24-20737 | Posters on site | HS9.3

Lake organic and inorganic carbon cycle decoupling in response to historical watershed activities in Yunnan, China 

Aubrey Hillman, Daniel Bain, and Mark Abbott

As anthropogenic impacts to both the climate system and freshwater resources continue unabated and are expected to intensify in coming decades, an increasing number of lakes will experience carbon cycle perturbations. Lakes that have been experiencing such perturbations for millennia can clarify the nature and severity of carbon cycle disturbances as well as recoveries. In lakes with authigenic carbonate material, the use of both inorganic and organic carbon isotopes to detect the decoupling of the inorganic and organic carbon cycles has been underutilized. We summarize here the application of these methods to three lakes in Yunnan, China, which have been impacted by human activities for the last 1,500 years.  Further we compare the results from this time period to the middle and late Holocene, both periods characterized by minimal anthropogenic influence. Decreased precipitation, increased evaporation, and changes in landscape vegetation drive changes observed in sediment carbon isotope compositions from 5,500 to 3,500 years BP. Stabilization of these factors from 3,500 to 1,500 years BP resulted in fairly consistent within-lake nutrient cycling. Following anthropogenic manipulation of lake levels after 1,500 years BP and despite differences in the magnitude of such activities, a pervasive feature in all of these lakes is the decoupling of the inorganic and organic carbon cycles, primarily driven by an influx of oxidized organic carbon from the watershed and/or the respiration of lake sediment organic matter. Carbon cycle decoupling persists into present-day for some lakes, illustrating the importance of considering historical, legacy activities.

How to cite: Hillman, A., Bain, D., and Abbott, M.: Lake organic and inorganic carbon cycle decoupling in response to historical watershed activities in Yunnan, China, EGU General Assembly 2024, Vienna, Austria, 14–19 Apr 2024, EGU24-20737, https://doi.org/10.5194/egusphere-egu24-20737, 2024.

EGU24-824 | ECS | Posters on site | HS9.6

Critical Submergence for Lateral Rectangular Intakes: A CFD Study 

Bhagwan Das, Zulfequar Ahmad, and Pramod Kumar Sharma

The formation of an air-entraining vortex in the vicinity of an intake is considered a severe problem for intakes. An intake is a short or long pipe with more than three times its diameter connected to the face of an orifice, which is provided in the side or bottom of a vessel or channel. The depth of water at which the tail of a free surface vortex core just reaches the tip of an intake, causing air entrainment, is referred to as critical submergence for that intake. Few studies have been reported in the literature on rectangular intakes for the computation of critical submergence compared to circular or square intake configurations. The present study discusses the numerical investigation of critical submergence for rectangular intakes placed laterally on the side wall of an open channel under uniform flow conditions. A series of numerical simulations were performed to compute the critical submergence for rectangular intakes. A three-dimensional multiphase CFD model was developed to simulate critical submergence at intakes. Reynolds-averaged Navier–Stokes (RANS) equation with SST k-ω turbulence model was used to simulate the fluid flow inside the computational domain. These models, together with the volume of fluid (VOF) two-phase (water-air) model, were found well capable to simulate the flow at critical submergence. Surface streamlines and phase volume fraction analysis studies were used to identify the air-entraining vortex at critical conditions. Multiphase CFD study assisted in understanding the flow structure and turbulence characteristics of the vortex flow at the vicinity of intakes. The approach Froude number and intake Froude number play a vital role in computing critical submergence with CFD simulations.

How to cite: Das, B., Ahmad, Z., and Sharma, P. K.: Critical Submergence for Lateral Rectangular Intakes: A CFD Study, EGU General Assembly 2024, Vienna, Austria, 14–19 Apr 2024, EGU24-824, https://doi.org/10.5194/egusphere-egu24-824, 2024.

EGU24-840 | ECS | Orals | HS9.6

Effect of bedload shape on the signal characteristics of a hybrid impact plate  

Bidhan Kumar Sahu and Pranab Kumar Mohapatra

Understanding bedload dynamics is critical for insights into erosion, sedimentation, and channel evolution of river systems. Designing hydraulic structures and validating existing sediment transport models need accurate bedload data. Bedload measurement is done using direct methods involving physical samplers or indirect devices with various acoustic sensors. One widely used indirect method is the impact plate system, which houses an acoustic sensor under it to detect bedload particles. Impact plate systems have been tested under varying velocity, bed roughness and bedload grain sizes. However, the influence of bedload particle shape on the signal characteristics in impact plate systems has yet to be investigated in detail. In the present study, an impact plate system with a hybrid sensor (accelerometer and geophone) attached to the plate's underside is used to understand the role of the shape of the bedload in an experimental flume. Five different particle sizes (4 to 40 mm) are grouped into three classes based on their sphericity index (0.45-0.6, 0.6-0.75, and 0.75-0.9), creating a total of fifteen classes. Ten bedload particles from each class are manually released over the impact plate for 20 runs, and the signals are recorded. It is found that the bedload shape significantly affects the signal characteristics, and with increasing sphericity, the mean maximum amplitude of the signal increases while the centroid frequency decreases. A calibration equation is thus developed between the signal parameters and the sphericity of the bedload grains.

How to cite: Sahu, B. K. and Mohapatra, P. K.: Effect of bedload shape on the signal characteristics of a hybrid impact plate , EGU General Assembly 2024, Vienna, Austria, 14–19 Apr 2024, EGU24-840, https://doi.org/10.5194/egusphere-egu24-840, 2024.

EGU24-2084 | ECS | Orals | HS9.6

Determination of spatial-temporal distribution of bedload transport areas in physical model  

Bowen Yu, Paul Demuth, Volker Weitbrecht, and Li Chen

Bedload transport is leading to erosion and deposition processes that shape the rivers morphology. Detecting areas of active bedload transport in rivers is essential for understanding morphodynamic processes within river systems. Previous research has employed various methods to determine sediment transport both in field and in laboratory settings. Field measurements are often limited due to difficult and non-predictable boundary conditions. Laboratory experiments provide opportunities to study sediment transport in a controlled environment with reproducible boundary conditions. However, it remains challenging to non-intrusively detect bedload transport areas across different temporal and spatial scales. In this context, we explore the efficacy of an image processing method to detect bedload transport areas within physical models through the water surface.

The measurements were carried out in a flume with mobile bed, approximately 30 m long and 3.6 m wide, with a longitudinal slope of 0.003. The mobile bed and the feed material consist of the same grain size distribution and represent a well-graded gravel bed river (Dm = 1.50 mm and D90 = 3.06 mm). The simulated hydrographs varied between a HQ2 flood (Q = 36.4 l/s) and a HQ5 flood (Q = 49.4 l/s). The discharge was kept constant during the measurement period (approximately 10 minutes). Three cameras were mounted approximately 3 m above the flume covering and area of approximately 18 m x 3.6 m.

The three cameras continuously recorded pictures of the physical model at different temporal resolutions (0.033 Hz – 1 Hz) with a spatial resolution of 1 px/mm2. By subtracting the intensity values of consecutive images, spatial values indicating sediment transport intensity could be obtained. The comparison between bedload transport areas identified from image processing and those discerned through visual observation reveals a strong alignment, suggesting the potential of image processing to reflect in-stream bedload transport areas accurately.

Through a combination of image processing methods, visual discrimination, and measurements in the physical model, two threshold values can be depicted. Values in subtracted images exceeding the lower threshold value indicate the initial signs of sediment transport, while values surpassing the larger threshold, signify full sediment transport.

The chosen time interval of image recording requires careful consideration, because it significantly influences the resulting threshold values. A prolonged time (30 seconds) interval with the analysis of many images facilitates the determination of average sediment transport over time, while shorter intervals (1 second), provide a snapshot insight into the distribution of bedload transport areas.

The results of this study reveal the potential of using image processing techniques in laboratory experiments to identify bedload transport areas. With further calibration, these methods hold promise for measuring bedload transport quantity and other more intricate parameters at different temporal and spatial scales.

How to cite: Yu, B., Demuth, P., Weitbrecht, V., and Chen, L.: Determination of spatial-temporal distribution of bedload transport areas in physical model , EGU General Assembly 2024, Vienna, Austria, 14–19 Apr 2024, EGU24-2084, https://doi.org/10.5194/egusphere-egu24-2084, 2024.

EGU24-2123 | ECS | Posters virtual | HS9.6

A novel modeling approaches to understand the fate and transport of microplastics in aquatic environment 

Sadashiv Chaturvedi, Liu Min, Amit Kumar, and Zeng Wenfan

The pervasive presence of microplastics (MPs) in natural waters presents a global threat to aquatic ecosystems and human well-being. While field monitoring is extensive, the focus has primarily been on characterizing MPs types, occurrences, and distributions, with limited attention has been made on modeling, because of the unavailability of datasets, inadequacy of the methodologies, and site-specific studies. This gap prompted to build the advocating of hybrid models that integrate hydrodynamics with process-based for categorization, transportation, and transformation, and further know the potential risks of ecological, climatic and human health so that associated risks could be mitigated. Additionally, standardizing data calibration and validation is essential to enhance the comparability of modeling results with field investigations, critical for informed decision-making in addressing the global challenge of MPs pollution. Thus, addressing this gap in understanding microplastic activities, dynamics, and their interactions within aquatic environments is pivotal in the global scientific fraternity. A new numerical framework, CaMPSim-3D, integrates a Lagrangian particle-tracking model (PTM) with a Eulerian-based hydrodynamic system (TELEMAC) is applied to simulate microplastics' fate and transport. This innovative model considers various advection schemes, revealing significant differences in predictions, with the Third Order Total Variation Diminishing (TVD3) Runge-Kutta method showing promise by providing accurate results at lower computational costs.

How to cite: Chaturvedi, S., Min, L., Kumar, A., and Wenfan, Z.: A novel modeling approaches to understand the fate and transport of microplastics in aquatic environment, EGU General Assembly 2024, Vienna, Austria, 14–19 Apr 2024, EGU24-2123, https://doi.org/10.5194/egusphere-egu24-2123, 2024.

EGU24-2704 | Posters virtual | HS9.6

Optimizing Spur Dike Orientation for Scour Control in Downward Seepage Scenarios 

Harish Kumar Patel, Sukhjeet Arora, and Bimlesh Kumar

In hydraulic river engineering, river bank protection is crucial to preserving natural rivers, lands, and bridges. As erosion-protective structures, spur dikes protrude outward from the riverbank in different directions to divert the flow away from the bank. The present study examines temporal variation in bed morphology and scours around rectangular-shaped spur dikes with orientations such as 60°, 90°, and 120°. In addition, the formation of maximum scour depth is compared to the condition when downward seepage is applied. The experiments investigated different configurations of spur dike orientation to assess their suitability and the scour progression over time, specifically observing intervals at 2, 12, and 24 hours and comparing them with a 24-hour duration focused on seepage. Findings indicated that a 90º orientation angle produced the most substantial scour depth, while an angle of 120º resulted in the shallowest scour depth. The downward seepage enhanced sediment particle movement, leading to increased particle detachment and deeper scour formations. Scour depth initially starts at the tip of the spur dike and reaches its maximum there. Sand particles were deposited downstream, creating a dune-like structure near the second spur dike.

Keywords: Temporal scour variation, Bed morphology, Oriented spur dikes, Downward seepage.

How to cite: Patel, H. K., Arora, S., and Kumar, B.: Optimizing Spur Dike Orientation for Scour Control in Downward Seepage Scenarios, EGU General Assembly 2024, Vienna, Austria, 14–19 Apr 2024, EGU24-2704, https://doi.org/10.5194/egusphere-egu24-2704, 2024.

EGU24-2769 | ECS | Posters virtual | HS9.6

Exploring the Mechanisms and Vegetative Influence on River Bank Migration in Sinuous Channels 

Om Prakash Maurya, Dr. Suresh Modalavalasa, Saikat Das, Pranay Barman, Arpita Das, Dr. Ketan Kumar Nandi, and Prof. Subashisa Dutta

The migration of alluvial river banks plays a crucial role in the degradation of fertile agricultural land and the displacement of floodplain communities. This study aims to investigate the mechanisms driving riverbank migration in sinuous channels, as well as the protective role of vegetation along the river banks. To comprehend these mechanisms, we conducted experimental studies at the IIT Guwahati fluvial laboratory and numerical simulations using Flow3D. For assessing the impact of vegetation, field observations and satellite imagery analyses were carried out. In examining vegetation influence, a critical stretch of the Nagavali River near Belmam village was identified. Upstream of the village, the outer river bank, lacking vegetation, migrated 100 meters over 12 years, while the downstream vegetated outer bank experienced negligible migration. A similar analysis was conducted on the Kaw River in different regions, revealing that non-vegetative banks migrated nearly 100% of the entire river width over 22 years. To unravel the mechanism behind bank migration, flume experiments and numerical simulations of sinuous channels were conducted. The findings indicated that at the outer bank, secondary currents dominated, emerging as a significant factor in migration. While the numerical study offered a detailed qualitative understanding of the mechanism, it exhibited an error ranging from 22% to 37% from the inner bank to the outer bank. This study extends its focus to a quantitative exploration of floodplain vegetation's role in riverbank protection and proposes a nature-inspired solution, against riverbank migration.

How to cite: Maurya, O. P., Modalavalasa, Dr. S., Das, S., Barman, P., Das, A., Nandi, Dr. K. K., and Dutta, P. S.: Exploring the Mechanisms and Vegetative Influence on River Bank Migration in Sinuous Channels, EGU General Assembly 2024, Vienna, Austria, 14–19 Apr 2024, EGU24-2769, https://doi.org/10.5194/egusphere-egu24-2769, 2024.

EGU24-4113 | Orals | HS9.6

Predicting global change effects on reservoir sedimentation 

Stefan Haun, Kilian Mouris, Sebastian Schwindt, and Silke Wieprecht

Water availability is not uniformly distributed, and water is not available on demand in many areas of the world. Thus, artificial storage of water is essential for the sustainable management of water resources. However, reservoirs are transport-limited systems due to low flow velocities, resulting in sedimentation. Additionally, global change amplifies sedimentation because of altered hydrological conditions and sediment production of river basins. Preparedness for global change necessitates decades-long forecasting of these complex phenomena, which is computationally challenging. Sediment depositions reduce not only the available storage volume over time but may create severe safety issues, such as blockage of bottom outlets or increased flood risk. Therefore, it is essential to understand not only the trapping efficiency of a reservoir and its temporal variations but also the spatial distribution of expected sediment accumulations. To generate these insights, long-term predictions based on three-dimensional (3d) hydro-morphological models considering the changing climate are required.

The Banja reservoir, located in southeast Albania, was investigated in this study to investigate the effects of global change on reservoir sedimentation. Simulations were performed up to 90 years into the future to model characteristic sedimentation stages and to test for differences between several emission scenarios, combined with socioeconomic and climate scenarios. A 3d numerical model simulated hydrodynamics, suspended sediment transport, and sedimentation processes, considering the Devoll River as the main tributary and three smaller tributaries. To enable long-term simulations, an adaptive grid with a spatial resolution of 50 m x 50 m in the x- and y-direction, respectively, as well as up to 10 cells in the z-direction was used. Due to an implicit time discretization a time step of 5,400 seconds was chosen to achieve reasonable computational times.

The model results showed a decrease in the trapping efficiency by 2100 for all scenarios, which is associated with storage loss over time. In the high and medium emission scenarios, the reservoir experiences a substantial loss of storage volume due to increasing sediment yields. The model also showed the formation of a delta at the head of the reservoir and the progressive movement of the delta further into the reservoir. These spatial and temporal insights into future sediment deposition patterns are crucial for developing sustainable management strategies to account for global change.

How to cite: Haun, S., Mouris, K., Schwindt, S., and Wieprecht, S.: Predicting global change effects on reservoir sedimentation, EGU General Assembly 2024, Vienna, Austria, 14–19 Apr 2024, EGU24-4113, https://doi.org/10.5194/egusphere-egu24-4113, 2024.

EGU24-4253 | ECS | Orals | HS9.6 | Highlight

Navigating reservoir sedimentation through hydro-suction 

Akash Jaiswal, Zulfequar Ahmad, and Surendra Kumar Mishra

Reservoir sedimentation is a significant global challenge, including in India, for the sustainable management of vital hydraulic structures, impacting storage capacity, water demands, and ecological balances. The United Nations University - Institute on Water Environment and Health (UNU-INWEH) study has revealed that out of 47,403 large dams in 150 countries, the initial global storage of 6,316 billion cubic meters (BCM) is projected to decline to 4,665 BCM by 2050. This loss of 1,650 BCM is equivalent to the annual water use of India, China, Indonesia, France, and Canada combined. The report highlights the alarming decline in storage capacity across the globe.

The current study delves into the effectiveness of hydro-suction as a solution for reservoir desilting, exploring its applications through success stories and experimental investigations. Hydro-suction is a proven efficient method for sediment removal, avoiding disruptions to ecosystems and structures. This method utilizes suction forces to remove the sediment from the bed surface without interfering with the processing of the connecting structures such as irrigation canals and hydropower plants.

The study presents successful global applications of hydro-suction in desilting reservoirs, showcasing its effectiveness in real-world cases. The global success stories highlight diverse implementations and positive outcomes of the hydro-suction sediment removal method. In Djidiouia Reservoir, hydro-suction effectively removed 1.4×10⁶ m³ of silt and clay over two years, addressing rapid silting. Rioumajou Dam's hydro-suction system prevented sediment buildup, discharging 1 m³/s and paying off installation costs within a year. Tianjiawan Reservoir's hydro-suction system reclaimed storage capacity, removing 0.32×10⁶ m³ of sediment with a mean concentration of 15.6%. In Xiao Hua-shan Reservoir, sediment removal enhanced reservoir storage, hydropower generation, and downstream cropland topsoil quality. The Geolidro technique in Alpine reservoirs effectively removed over 5×10⁶ m³ of sediment in a span of 20 years. Further case studies include Alonia Lake's cost-effective sediment removal, California Reservoir's proposed hydro-suction system, Billings Lake's prevention of hydropower loss, and Palagnedra Reservoir's successful sediment removal despite limitations.

Along with the success stories, the current study also presents the interpretations from the experimental study done at the Indian Institute of Technology (IIT) Roorkee. The study systematically studied the area of influence of the suction force generated below the suction pipe during the hydro-suction by strategically changing the effective parameters, including suction pipe diameter, suction inlet height, suction discharge, and sediment median size, studied. A total of 252 experimental runs provide insights into the diameter and depth of influence below the suction pipe during hydro-suction. The analysis of diameter and depth of influence during hydro-suction experiments emphasizes the significance of suction inlet height and suction discharge. A Whisker's plot suggests an anticipated range of 2D to 3.5D for the diameter of influence and 0.5D to 0.8D for the depth of influence during hydro-suction sediment removal.

The case histories demonstrate the adaptability of hydro-suction in addressing sedimentation challenges across different regions. The experimental investigation would help plan and design the system for area-specific sedimentation removal. Hydro-suction can be a viable and environmentally friendly strategy for managing reservoir sedimentation.

How to cite: Jaiswal, A., Ahmad, Z., and Mishra, S. K.: Navigating reservoir sedimentation through hydro-suction, EGU General Assembly 2024, Vienna, Austria, 14–19 Apr 2024, EGU24-4253, https://doi.org/10.5194/egusphere-egu24-4253, 2024.

EGU24-4601 | Posters on site | HS9.6 | Highlight

Integration of Automated River Fow Discharge and Sediment Observation Systems and Applications 

Shenghsueh Yang, Renkai Jhong, Iyu Wu, Jialin Ma, Kehchia Yeh, and Chihcheng Weng

The widespread application of IoT observation technology has further improved and timely applied river monitoring technology, especially during floods, providing instant judgment and disaster prevention applications. However, real-time sediment observations often lack data due to considerations such as river water sampling and personnel safety during river floods. Therefore, it is necessary to integrate various observation instruments for observation. The river flow discharge part includes radar water level gauges, river surface current meters and CCTV (Closed-circuit television) images for recording, and combined with cross-section measurement data, real-time river flow discharge estimation can be achieved. The sediment observation part includes the observation of river suspended load and river bed load. The river suspended load is installed on the bridge foundation to directly measure the sediment concentration through optical concentration monitoring. The river bed load flux is monitored through microseismic wave instruments to obtain the bottom of the river bed load movement. The bed material load flux measure migration produces a large number of microseismic and collision frequencies, and the river bed load flux is estimated through frequency intensity spectrum analysis. Finally, based on the observation time of each monitoring instrument and cloud database records and back-end analysis and calculation, the hydrological observation web page integration and real-time water level, flow and sediment content integrated display and value-added applications such as embankment safety and bridge scour safety settings were carried out.

How to cite: Yang, S., Jhong, R., Wu, I., Ma, J., Yeh, K., and Weng, C.: Integration of Automated River Fow Discharge and Sediment Observation Systems and Applications, EGU General Assembly 2024, Vienna, Austria, 14–19 Apr 2024, EGU24-4601, https://doi.org/10.5194/egusphere-egu24-4601, 2024.

EGU24-5276 | ECS | Posters on site | HS9.6

Numerical simulations of sediment yield and terrain changes by water erosion using a processed-based model 

Jia-Tsung Wang, Kao-Hua Chang, and Yung-Chieh Wang

This research presents numerical simulations of small-scale rainfall simulator experiments using a process-based physical model. The model utilizes fundamental physical equations and analyzes the phenomena of surface runoff and water erosion. The adopted physical model is primarily composed of the shallow-water wave equation, Green-Ampt infiltration formula, and Hairsine-Rose equation. In the model, processes including water infiltration, splash erosion caused by rainfall, sediment entrainment carried by surface runoff, and sediment deposition are considered, aiming to simulate surface runoff, cumulative sediment yield, and eroded-terrain changes caused by water erosion. To assess the effectiveness of the numerical simulation results, the Nash-Sutcliffe efficiency coefficient (NSE) is used as the evaluation criterion. The laboratory rainfall simulator experiments using the same rainfall intensity (加入強雨強度) of three different slopes (10°、20° and 30°) were used as the studied cases Results of the simulations show that NSE values for runoff simulation reached 0.927 during the parameter calibration phase and exceeded 0.883 and 0.913 in the validation phases, respectively. The NSE for cumulative sediment yield simulation achieved 0.849 during parameter calibration and reached 0.997 and 0.983 in the validation phases. For cross-sectional microtopography simulation, the NSE attained 0.378 in the parameter calibration phase and achieveds 0.359 and 0.737 in the validation phases. In the case of longitudinal microtopography simulation, the NSE reached 0.937 during parameter calibration and attained 0.838 and 0.439 in the validation phase. This study presents the feasibility of the processed-based model in simulating surface runoff, sediment yield and eroded-terrain by water erosion.

(Key Words: Surface runoff, Soil erosion, Shallow-water equation, Green-Ampt infiltration formula, Hairsine-Rose equation)

How to cite: Wang, J.-T., Chang, K.-H., and Wang, Y.-C.: Numerical simulations of sediment yield and terrain changes by water erosion using a processed-based model, EGU General Assembly 2024, Vienna, Austria, 14–19 Apr 2024, EGU24-5276, https://doi.org/10.5194/egusphere-egu24-5276, 2024.

EGU24-5588 | ECS | Orals | HS9.6

Performance of Through-Water Structure-from-Motion Photogrammetry in Gravel-Bed Rivers: An Experimental Investigation 

Chendi Zhang, Wenqi Li, Marwan Hassan, Ao'ran Sun, and Chao Qin

Structure-from-Motion (SfM) photogrammetry has become an efficient approach in acquiring high-resolution three-dimensional topographic data in geosciences and can be used for measuring submerged riverbed surfaces in shallow and clear water systems. However, the performance of through-water SfM photogrammetry has not been fully evaluated for gravel-bed surfaces, which limits its application to the morphodynamics of gravel-bed rivers in both field investigations and flume experiments. The measurement quality includes: (i) accuracy and precision of the measured underwater bed surface elevations; and (ii) statistical properties (first four moments and structural functions) of the bed surface elevation distributions.

In order to evaluate the influence of bed texture, flow rate, ground control point (GCP) layout, and refraction correction (RC) on the measurement quality of through-water SfM photogrammetry, we conducted a series of experiments in a 70 m-long and 7 m-wide flume with a straight artificial channel under strictly controlled conditions. The channel size was comparable to a small natural stream so that the results could provide insights for not only flume experiments but also for UAV-based field investigations. Bed surfaces with strongly contrasting textures (fine sand cover vs. gravel cover) in two 4 m-long reaches were measured under five constant flows with three GCP layouts, including both dry and underwater GCPs. All the submerged surface models were compared with the corresponding dry bed surfaces to quantify their errors in elevations, moments, and outcomes of structural functions.

The results illustrated that the poorly sorted gravel-bed led to smaller elevation errors than the bed covered by fine sand. The use of underwater GCPs made significant improvements to the elevation accuracy of direct through-water SfM photogrammetry, but counteracted with RC. The elevation errors of the submerged models linearly increased with water depth for all the tested conditions of bed textures, GCP layouts, and discharges in the uncorrected models, but the increasing slopes varied with bed texture. Fine sediment transport caused significant elevation errors, while the static sand dunes and grain clusters did not lead to noticeable errors in the corrected models with dry GCPs. The movement of fine sediment at high flows also led to significant errors in the second to fourth moments, horizontal correlation scales, Hurst exponents, and the errors in statistical properties for both uncorrected and corrected submerged models. The results show that through-water SfM photogrammetry is promising in capturing the topographic and statistical properties of underwater gravel-bed surfaces if fine sediment transport is carefully addressed.

Keywords: Topographic measurement; Structure-from-Motion (SfM); through-water photogrammetry; gravel-bed river; refraction correction

How to cite: Zhang, C., Li, W., Hassan, M., Sun, A., and Qin, C.: Performance of Through-Water Structure-from-Motion Photogrammetry in Gravel-Bed Rivers: An Experimental Investigation, EGU General Assembly 2024, Vienna, Austria, 14–19 Apr 2024, EGU24-5588, https://doi.org/10.5194/egusphere-egu24-5588, 2024.

EGU24-6538 | ECS | Orals | HS9.6

Eddy-resolving CFD modelling of a river flow at a full-scale, multi-pier bridge over naturally-deformed bathymetry 

Tommaso Lazzarin, George Constantinescu, and Daniele Viero

Numerical simulations are conducted to evaluate the three-dimensional flow field and the bed shear stress in the vicinity of a multiple-pier bridge located in the Po river (Italy), considering the naturally-deformed bathymetry. The use of Detached Eddy Simulations (DES) allows to explicitly resolve the unsteady motion of the energetically important turbulent eddies, and the Volume of Fluid (VoF) method is used to consider the deformations of the free-surface. Simulations are conducted in different hydrodynamic regimes, including free-surface flow and pressure flow that generates in case of deck overtopping. The objective is to investigate the applicability of the DES approach and the VoF technique for simulating the flow dynamics in a full-scale river reach with irregular geometry and a man-made structure on the riverbed. The complex interplays among the river flow, the deformed bathymetry, and the bridge structure are explicitly accounted for, with a precision that far exceeds the typical level of detail achieved through standard methods used for the simulation of river flows (e.g., two-dimensional depth averaged models).

In the case of free-surface flow, the deformed bathymetry, typical of natural rivers, as well as the non-zero angle of attack and the complex shape of the bridge piers, influence the flow field at the bridge site and the distributions of bed shear stresses. This aspect highlights some limitations that arise when canonical cases (i.e., piers of regular shape and angle of attack of 0° over a flat bed) are considered in place of real complex geometries. The impact of the lateral flow contraction on the flow fields and on the potential of sediment erosion is limited in the present case due to the reduced width of the piers and the large distance between them, resulting in a low blocking ratio.

Transitioning to the pressure-flow regime increases the free surface elevation upstream of the bridge and induces the formation of a high-velocity orifice flow beneath the deck, with regions of high velocity extending far downstream. Recirculation regions are observed below and downstream of the deck. Compared to an equivalent free-surface case with the same discharge and stage, pressure-flow induces much higher bed shear stresses at the bridge site, entailing an increased erosion potential. In these conditions, the flow acceleration around the piers and the lateral flow contraction have a lower impact on the erosive capacity, as confirmed by a pressure-flow simulation conducted by removing the piers.

How to cite: Lazzarin, T., Constantinescu, G., and Viero, D.: Eddy-resolving CFD modelling of a river flow at a full-scale, multi-pier bridge over naturally-deformed bathymetry, EGU General Assembly 2024, Vienna, Austria, 14–19 Apr 2024, EGU24-6538, https://doi.org/10.5194/egusphere-egu24-6538, 2024.

EGU24-9321 | ECS | Orals | HS9.6

Quantifying seasonal bedload transport rates in a sub-arctic river using image velocimetry methods 

Juha-Matti Välimäki, Eliisa Lotsari, Anette Eltner, and Tuure Takala

The bedload transport rate is the quantified amount of sediment being transported in the active layer of the riverbed. Traditional measuring methods involving laborious mechanical equipment are unable to capture the spatial and temporal fluctuations of bedload transport rate and measurements done with these methods have large uncertainties caused by the disturbance of the hydraulic conditions of the riverbed by the equipment itself. Computer vision-based particle image velocimetry methods have been previously successfully applied to quantify bedload transport rates from video data sets in laboratory conditions, but not in ice-covered and open channel field conditions.

The aims of this study are to 1) to apply image velocimetry methods to underwater video data sets to quantify seasonal bedload transport rates in different types of flow conditions and 2) understand the seasonal variation in bedload transport amounts based on both mechanical and image velocimetry methods.

The study is based on field data, measured at sub-arctic Pulmanki river, located in northern Finland (~70°N latitude) and draining towards the Arctic Sea. The data has been gathered over 2021-2023 during winter (ice-covered, low flow), spring (open channel, high flow), and autumn (open channel, low flow) seasons to cover different possible sediment transport conditions. The preliminary results are presented. They show that the method is promising in enhancing the understanding of sediment transport processes and the seasonal transported amounts in sub-arctic river conditions.

How to cite: Välimäki, J.-M., Lotsari, E., Eltner, A., and Takala, T.: Quantifying seasonal bedload transport rates in a sub-arctic river using image velocimetry methods, EGU General Assembly 2024, Vienna, Austria, 14–19 Apr 2024, EGU24-9321, https://doi.org/10.5194/egusphere-egu24-9321, 2024.

EGU24-9542 | ECS | Posters on site | HS9.6

Slender Wood Jamming at bridge piers: Finite-infinite retention time regimes 

Muhammad Iqbal Pratama, Ingo Schnauder, and Koen Blanckaert

Wood accumulating at bridge piers is a safety risk as it leads to accelerated scour and flow blockage. Wood accumulation starts with a first wood element and the (retention) time that this element is retained controls if a jam accumulation further develops or not.

In flume experiments, we investigated the parameters and processes that determine the retention time of a single wood and developed a parameter-based predictive model for it. The experiments were based on eccentricity (the lateral distance between the centre of the wood and the centre of the pier) tests, measuring the retention time for varying eccentricities of the arriving element relative to the pier.

The experiments revealed that the accumulation of single wood element can be categorized into three different phases: impact, rotation, and separation. The first impact phase starts when the wood hits the bridge pier. In the subsequent rotation phase, the wood element rotates around the bridge pier and possible also slides. Finally, the wood element separates from the bridge pier.

A distinction can be made between an infinite and a finite regime. In the infinite regime, the rotation phase lasts very long and the wood element is in a metastable state. The diverging flow field around the bridge pier is key to the metastability since it causes stabilizing compensatory movements of the wood element around the bridge pier that include rotational swaying, vertical dipping or bouncing, and vibrations related to vortex shedding. The compensatory movements correlate with the Richardson number (the ratio of buoyancy force over inertia force), which is defined as the behaviour of the wood during a collision around bridge pier. The infinite regime only occurs for low eccentricities, i.e., eccentricities below one-third of the wood length.

In the finite regime, the rotation phase is rather short, and the wood element separates from the bridge pier after a short time. The finite regime is controlled by the friction between the wood element and the bridge pier, flow velocity and eccentricity

This study provides a conceptualization of the retention time of wood elements and a quantitative estimation of the retention time in the finite regime. These findings provide a step forward in explaining and predicting the processes and phenomena of wood jamming at bridge piers. The developed concept and will be further developed for the wood jamming involving multiple interacting wood elements.

How to cite: Pratama, M. I., Schnauder, I., and Blanckaert, K.: Slender Wood Jamming at bridge piers: Finite-infinite retention time regimes, EGU General Assembly 2024, Vienna, Austria, 14–19 Apr 2024, EGU24-9542, https://doi.org/10.5194/egusphere-egu24-9542, 2024.

EGU24-9582 | Posters on site | HS9.6

Monitoring of selected hydro-morphological elements on natural rivers in Slovakia depending on river scale 

Tomas Boraros, Katarina Melova, and Daniel Kostal

Sedimentary processes in aquatic environments are very important parts of monitoring and describing the hydrological regime. In our study, we are dealing partially with analyses of hydro-morphological processes in natural rivers. Natural river is described by almost complete absence of anthropogenic pressure, in this case, the results of our monitoring are used to evaluate the ecological status of the water bodies in accordance with Water framework directive. We identify changes in river channel from historical point of view (f.e. shortening), monitor bedforms (bars, islands, riffles etc.), sediment types (bedrock, boulders, sand, etc.), however, dealing with the quantification of the sediment regime is out of our scope. According to the river scale, we use partly different measurement techniques, and in case of different river types, some elements could be irrelevant for some of them. In this study, we explain the type specific elements for the selected river types.

How to cite: Boraros, T., Melova, K., and Kostal, D.: Monitoring of selected hydro-morphological elements on natural rivers in Slovakia depending on river scale, EGU General Assembly 2024, Vienna, Austria, 14–19 Apr 2024, EGU24-9582, https://doi.org/10.5194/egusphere-egu24-9582, 2024.

EGU24-10175 | Orals | HS9.6 | Highlight

Defrosting river banks: morphodynamics and sediment flux 

Eliisa Lotsari, Marijke de Vet, Brendan Murphy, Stuart McLelland, and Daniel Parsons

Climate warming is projected to impact hydrology and change ice-cover periods within river channels in polar and permafrost regions. These changes will impact the duration of freezing, frozen, thawing and unfrozen periods, and will affect sediment transport fluxes, notably through riverbank erosion. However, at present, it is difficult to quantify the long-term combined impacts of soil moisture dynamics, changing ambient air, water and ground temperatures and the subsequent rates of thawing and freezing on the fluvial bank erosion processes.


Herein we present a series of 130 laboratory experiments conducted in a novel cryolab morphology facility using a small-scale Friedkin channel. These cryolab flume experiments aim to assess the influence of flow velocity, soil moisture content and temperature of the sediment on riverbank stability with varying ambient air and water temperatures and flow discharges. The riverbank characteristics in the experiments, including sediment grain size, soil moisture and soil temperature, are based on observations from the sub-artic River Pulmankijoki (Finland) during different seasons. The sediment bank blocks (2 cm high) were prepared for each experiment the day before and kept in the cryolab facility overnight to match ambient air temperatures. The topography was measured before and after each experiment, using an array of images collected via a semi-automatic Canon camera. Surface models were produced with structure from motion and volumetric changes were calculated. GoPro cameras filmed videos of bank evolution to determine higher temporal records of bank edge retreat through the experiments. Buoyant sequins were seeded at the start and end of each experiment in order to calculate the surface flow velocities using a particle tracking velocimetry method. A FLIR A655 infrared thermal camera was used to aid understanding the thermal transfers between the flow and the bank.


Results show that the water level had more impact on bank erosion than flow velocities, as at low discharges the full bank height of the channel was less exposed to flow shear. Most critically, the volumetric erosion rate was found to have a non-linear correlation with the air temperature, being highest with an air temperature of 7.0°C (water temperature 7.2°C) and second highest with an air temperature of -2.1°C (water temperature 3.2°C). Conversely the lowest erosion rates occurred at an ambient temperature of -15°C. Erosion occurred as chucks at +1.7 – +3.2°C water temperatures, if the moisture content was high enough, i.e. 18.9% or more, for the sediment block to be frozen. High moisture contents also slowed the heating effect of the flowing water, which propagated through the bank at a lower rate. With the lower soil moisture conditions of 1.1–10.0%, there was not sufficient water within the block to allow it to freeze as a unit. Under such conditions the block acts as loose sediment, and as a consequence water and ambient temperatures have less influence on the erosion rate. These findings have a suite of implications for morphodynamic responses of river channels across defrosting landscapes, which will alter hydrology and sediment fluxes in highly sensitive environments as climate warms into the future.

How to cite: Lotsari, E., de Vet, M., Murphy, B., McLelland, S., and Parsons, D.: Defrosting river banks: morphodynamics and sediment flux, EGU General Assembly 2024, Vienna, Austria, 14–19 Apr 2024, EGU24-10175, https://doi.org/10.5194/egusphere-egu24-10175, 2024.

Overland flow is a critical aspect of the hydrological cycle, and understanding its dynamics is crucial for managing water-related issues such as flooding and soil erosion. This paper investigates the impact of various roughness estimation methods on simulating overland flow during intense rain events, with a specific focus on the influence of vegetation height. The study assesses various approaches to vary roughness as a function of water sheet thickness and vegetation height, including two different constant Manning's coefficients, a simple linear approach, an exponential function, a power law function, an empirical formula, and a physics-based approach.

The investigation emphasizes the importance of accurate roughness estimation for improving the reliability of hydrological models and enhancing flood prediction capabilities. Experimental data from artificial rainfall experiments on 22 different natural hillslopes in Germany are used to calibrate the OpenLISEM hydrological model, adjusting parameters such as saturated hydraulic conductivity and soil suction at the wetting front.

Subsequently, various Manning's coefficient estimation methods are applied, and the model's performance is evaluated numerically. Preliminary results indicate satisfactory calibration outcomes, with NSE values ranging from 0.75 to 0.95 in most cases for various sites. To validate the models, 100 different experimental rainfall events are used for each roughness method.

Validation findings suggest that the physics-based approach, the linear function, and constant Manning roughness, demonstrate the best performance based on NSE values. According to our results, areas with more vegetation coverage demonstrate higher saturated hydraulic conductivity value, indicating that, for two sites with the same soil type, the locations with dense vegetation exhibit higher infiltration parameters. Consequently, it is crucial to evaluate the influence of vegetation on runoff, considering not only its effects on Manning's coefficient but also on saturated hydraulic conductivity.

This research contributes valuable insights into the selection of roughness estimation methods for enhancing the reliability of hydrological models, emphasizing the importance of vegetation cover in infiltration parameters.

How to cite: Masoodi, A. and Kraft, P.: Evaluating Vegetation-Influenced Roughness Estimation Methods to Improve Hydrological Modelling, EGU General Assembly 2024, Vienna, Austria, 14–19 Apr 2024, EGU24-10368, https://doi.org/10.5194/egusphere-egu24-10368, 2024.

EGU24-10441 | ECS | Orals | HS9.6

Impact of Halting Dam Operations on Downstream Flow: A Modern Modelling Approach 

Amin Sadeqi, Elina Kasvi, Hannu Marttila, and Petteri Alho

Europe confronts a critical environmental challenge, with only one-third of its rivers meeting the “good ecological status” criteria of the EU Water Framework Directive as many river systems are impacted by damming and regulation. Our research focuses on the Myllykoski hydropower dam on Kuusinkijoki River, which has been operational since 1957. The hydropower dam is set to cease operations, marking a transformative step to restore the natural riverine environment. The cessation plan involves diverting water back to the long-unused Piilijoki River, reinstating its ecological role and improve the ecological status of the main Kuusinkijoki River that was disrupted post-dam construction. Our data collection strategy employed field campaigns, capturing high-flow conditions in spring, and low-flow conditions in autumn. Cutting-edge sensors were employed in this endeavour, utilizing the Otter Unmanned Surface Vehicle (USV) for underwater topography scans, Acoustic Doppler Current Profiler (ADCP) for flow characteristic measurements, and water level data loggers for monitoring water level time series. The collected data is then used to create a highly accurate seamless 3D map of the river channel and floodplain. Leveraging this intricate map, we deploy an advanced hydraulic model to comprehensively analyse hydraulic processes and assess flow characteristics following the planned halting of the Myllykoski hydropower dam. Our study's multifaceted objectives include evaluating the spatio-temporal variability of downstream flow in three distinct study sites: (a) an unused natural channel alongside the dam, (b) a man-made channel downstream, and (c) a natural channel downstream, including the riverine lake along the course of the Kuusinkijoki River. Furthermore, we aim to investigate the influence of various flow scenarios on downstream river flow characteristics, analyse spatio-temporal trends in flow dynamics, and identify any significant changes in response to the cessation of dam operations. A crucial aspect of our study involves evaluating the influence of dam halting on river hydrodynamics and ecology using modern sensors and analytical tools.

How to cite: Sadeqi, A., Kasvi, E., Marttila, H., and Alho, P.: Impact of Halting Dam Operations on Downstream Flow: A Modern Modelling Approach, EGU General Assembly 2024, Vienna, Austria, 14–19 Apr 2024, EGU24-10441, https://doi.org/10.5194/egusphere-egu24-10441, 2024.

EGU24-10751 | ECS | Posters on site | HS9.6

Assessment of different vegetation friction approaches in numerical hydrodynamic modeling 

Antonia Dallmeier, Rebekka Kopmann, Frederik Folke, and Nils Ruether

The correct representation of the interaction between flow and vegetation in numerical hydrodynamic modeling has been of growing importance in recent years. As conventional roughness approaches like Manning-Strickler or Nikuradse fail to represent the hydraulic resistance of vegetation for various hydraulic conditions in depth-averaged models, vegetation approaches must be applied. These approaches calculate the time-variable hydraulic resistance of plants according to the plants' characteristics and the hydraulic conditions within the numerical hydrodynamic simulation. In the open-source numerical modeling software openTELEMAC-MASCARET, eight vegetation approaches are implemented. These approaches account for flexible and rigid plants in emergent and submerged conditions. In addition, a biomorphodynamic model was integrated into openTELEMAC-MASCARET. This biomorphodynamic model uses a drag force approach combined with Stone and Shen's (2002) approach to calculate the flow velocity in submerged flow conditions to account for the hydraulic resistance of plants. In this study, we compare the representation of vegetation in numerical modeling as a drag force according to the biomorphodynamic model with the implementation as a friction approach. This way of implementation also allows a comparison with the above-mentioned vegetation friction approaches. Additionally, Stone and Shen (2002) have developed an approach for calculating the hydraulic resistance, which we also implement to compare the performance of this approach. Therefore, we first convert the drag force approach of the biomorphodynamic model into a friction approach according to existing approaches. The resulting approach and the original hydraulic resistance approach of Stone and Shen (2002) are then implemented in openTELEMAC-MASCARET. In order to evaluate the performance of these two approaches, we compare the resulting Darcy-Weisbach friction factors to those of the existing approaches. Using a simplified test case within openTELEMAC-MASCARET, we calculate the bed shear stress in vegetated areas and compare it with the results of the biomorphodynamic model. The results indicate a good agreement between the newly implemented vegetation approaches and the existing ones and the biomorphodynamic model. This study thus lays the foundation for further numerical investigations using vegetation approaches, especially concerning the interaction between vegetation, sediment, and flow.

How to cite: Dallmeier, A., Kopmann, R., Folke, F., and Ruether, N.: Assessment of different vegetation friction approaches in numerical hydrodynamic modeling, EGU General Assembly 2024, Vienna, Austria, 14–19 Apr 2024, EGU24-10751, https://doi.org/10.5194/egusphere-egu24-10751, 2024.

Mega reservoirs, such as the Three Gorges Reservoir on the Yangtze River, have garnered significant attention due to their environmental impacts. However, the ecological ramifications of upstream Cascade Reservoirs remain understudied, despite their potential influence on the Yangtze River ecosystem. This study delves into the phytoplankton community and environmental factors of the Xiangjiaba Reservoir (XJB), a significant reservoir on the Yangtze River mainstream. Field surveys and laboratory analysis were conducted to identify factors driving algae distribution and temporal shifts. The phytoplankton exhibited dominance changes among different phyla. Bacillariophyta and Chlorophyta dominated throughout the year, while Cryptophyta prevailed in spring and Xanthophyta peaked in autumn, indicating a unique feature of the area. The water quality in XJB was moderate. The average chlorophyll-a exhibited significant spatial-temporal variations, peaking at 26 ug/L at the mainstream-tributary confluence. Since the reservoir's construction in 2006, an overall tenfold increase in algae density and a shift from Bacillariophyta-dominated system to a more diverse multi-phylum-dominance have been observed. Hydrodynamic conditions played a pivotal role, with water stratification favoring flagellated algae like Chlorophyta and Cryptophyta. Differences in phytoplankton composition between XJB and the Three Gorgeous Reservoir were linked to the latter's pronounced vertical mixing. The study underscores the swift hydrodynamic adaptations post-construction, juxtaposed with the slower biological (phytoplankton) responses, emphasizing the need for sustained monitoring to ensure the reservoir's ecological balance. This research offers insights into the ecological impacts of reservoir construction, highlighting the role of hydrodynamics in reservoir ecosystems and aiding in understanding reservoir functioning, water quality management, and biodiversity conservation.

How to cite: Wang, X., Sun, J., and Lin, B.: From River to Reservoir: Exploring Phytoplankton Dynamics and Its Environmental Correlates in the Xiangjiaba Channel-Type Reservoir, EGU General Assembly 2024, Vienna, Austria, 14–19 Apr 2024, EGU24-13827, https://doi.org/10.5194/egusphere-egu24-13827, 2024.

EGU24-14936 | Posters on site | HS9.6

LSPIV analysis of large wood effect on the direction and velocity of surface flow in meandering river 

Veronika Kapustová, Tomáš Galia, Pavel Sedláček, and Andrea Kovaříková

Large in-channel wood, typically present in meandering rivers, serves as an obstacle in the water course, affecting hydraulics of the water flow. It is an important but so far overlooked agent in river morphodynamics. One of the challenges in predicting the hydraulic impact of large wood is the scarcity of field data; this issue is typically explored through laboratory flume experiments. To analyse the effect of large wood on the distribution and velocity of water flow we conducted LSPIV analysis on selected channel segments of meandering Odra River (Czechia). Large Scale Particle Image Velocimetry (LSPIV) is a remote image-based technique, enabling monitoring of the direction and velocity of surface flow in a river channel segment. LSPIV employs a method of tracking surface particles visible in sequential images extracted from video recordings of river water levels. These recordings are captured from an aerial perspective, either oblique or vertical. For our study, we utilized UAV to record 30-second vertical video segments of river sections during periods of both low and high discharge. Additionally, we implemented ground control points and reference scales along the river banks to enhance the accuracy and scale of our measurements. For the LSPIV analysis, we used free Fudaa-LSPIV software (INRAe). As we anticipated, our findings indicate that the impact of large wood on surface flow is contingent on two primary factors: the size of the wood and its position within the channel. However, we observed that this effect significantly varies across different flow stages. We observed that large wood effectively redirects water flow. According to its position in the channel cross-section, it is either preventing the erosional banks from lateral erosion, or accelerating the flow towards the bank and supporting lateral erosion. As discharge increases and large wood becomes submerged, its effect diminishes. During low discharges, stabilization effect of large wood is more important, creating calm water areas and supporting sediment accumulation. Our research offers a comprehensive framework for advancing the qualitative and quantitative evaluation of the hydraulic and morphodynamic effects of large wood in meandering rivers. Such insights are crucial for guiding sustainable river management and informing river restoration projects.

How to cite: Kapustová, V., Galia, T., Sedláček, P., and Kovaříková, A.: LSPIV analysis of large wood effect on the direction and velocity of surface flow in meandering river, EGU General Assembly 2024, Vienna, Austria, 14–19 Apr 2024, EGU24-14936, https://doi.org/10.5194/egusphere-egu24-14936, 2024.

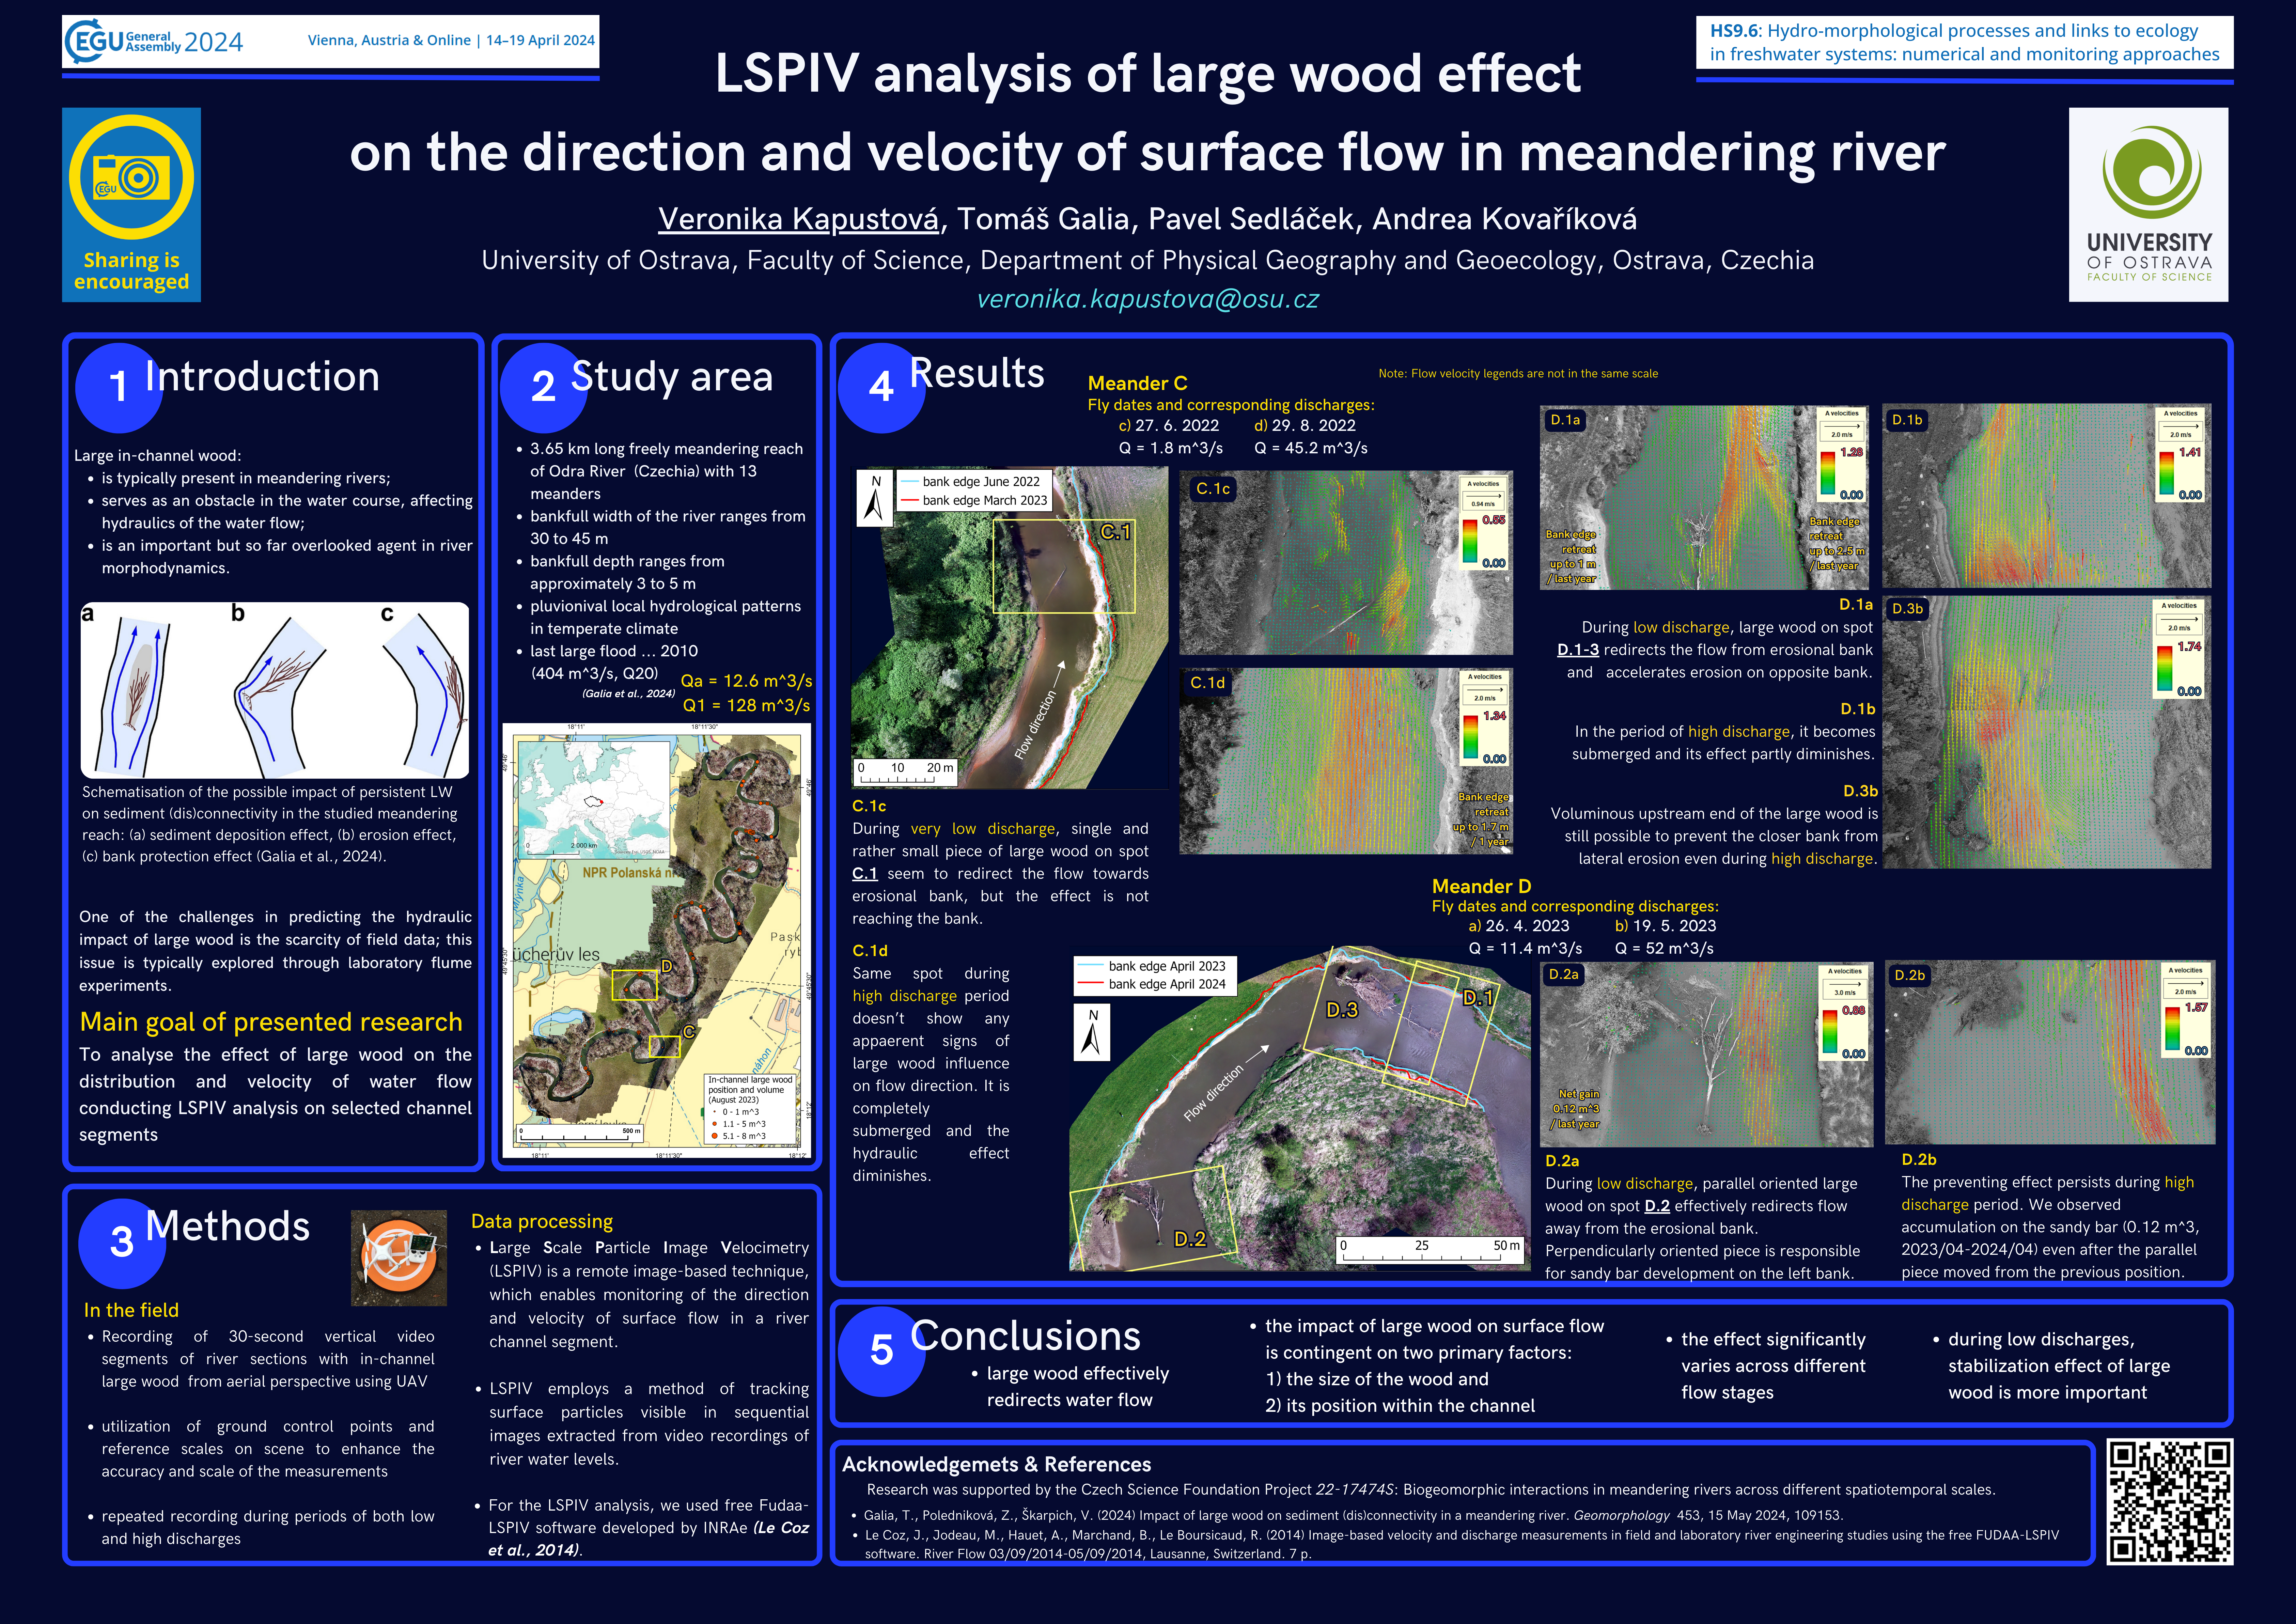
EGU24-15025 | ECS | Posters on site | HS9.6

Comparative analysis of effectiveness of I Head, L Head and T Head Groyne 

Priyanka and Chandra Shekhar Prasad Ojha

In the present scenario of changing hydrological patterns due to natural and human-induced reasons, the need for effective management of the river system has become more pronounced than ever. This emphasises the necessity to construct river training structures to mitigate the effect of floods and riverbank erosion. Groynes are river training structures provided to protect and stabilise the riverbanks. Most of the previous studies on these structures focused on studying the flow pattern around I Head groyne in the sand bed. Limited research has been done on L Head Groyne (LHG) and T Head Groyne (THG). This study compares bed morphology and flow pattern around three types of groyne: IHG, LHG, and THG in gravel bed. Experiments were conducted to study and compare the flow characteristics around these groynes under similar flow conditions. The flow depth was maintained at 0.136 m, and the Froude number was kept at 0.61. The maximum scour depth observed for LHG and THG is around 38 % more than that of IHG. The normalized velocity distribution is also compared for the three. It is observed that the reduction in streamwise velocity is maximum for the LHG. The study offers insights into the bank protection capability of the three types of groynes and distinguishes the role of these structures in achieving the different objectives of rivertraining works.

How to cite: Priyanka, and Ojha, C. S. P.: Comparative analysis of effectiveness of I Head, L Head and T Head Groyne, EGU General Assembly 2024, Vienna, Austria, 14–19 Apr 2024, EGU24-15025, https://doi.org/10.5194/egusphere-egu24-15025, 2024.

EGU24-16337 | ECS | Posters on site | HS9.6

An experimental set-up for the spatio-temporal quantification of fine particle infiltration in porous beds 

Cyril Gadal, Matthieu Mercier, and Laurent Lacaze
Suspended load is a major part of the solid fluxes transported by rivers, mostly made of fine particles. They eventually settle and, when reaching the bottom, may infiltrate the porous medium forming the riverbed, often made of larger sediments. This can clog the riverbed up to various points, hence disturbing the various processes occurring at this interface, the hyporheic zone, such as the exchange of water, nutrients, and other chemical species. Studying this infiltration process in the field is challenging because performing the measurements is difficult, but also because many processes are likely to affect this clogging mechanism, such as bioclogging or unsteady and complex flow conditions. Hence, many studies have used idealized analogue experimental setups to characterize this mechanism. Unfortunately, accessing the temporal dynamics is particularly challenging as the porous beds, usually made of glass beads, sand or gravel, are optically opaque and prevent as such from following the infiltration of fine particles [1].
 
Here, we present a flume experiment allowing for the spatio-temporal monitoring of the fine particle infiltration within the underlying porous medium. The key point consists in using hydrogel beads, which have a refractive index close to that of water, to build the riverbed. By using a camera, we can follow the intrusion of fine particles within the porous bed by light attenuation. In addition, we also use ultrasound backscattering measurements to characterize the overlying flow and suspension. In this set-up, we can vary the properties of the suspension (size, density), the flow (height, velocity profile) and the porous bed (porosity, heterogeneity) systematically and in a controlled way. Hence, in the future, this set-up will be able to map systematically the parameter space and relate clogging situations and their spatio-temporal dynamics to the corresponding external parameters.


                                       Figure 1: Snapshot of an experiment. The dotted orange line indicates the separation between the suspension
                                                                                      flow (above, from right to left), and the porous bed (below).

References     
[1] Romain Dubuis and Giovanni De Cesare. The clogging of riverbeds: A review of the physical processes. Earth-Science Reviews, 239:104374, apr 2023.

How to cite: Gadal, C., Mercier, M., and Lacaze, L.: An experimental set-up for the spatio-temporal quantification of fine particle infiltration in porous beds, EGU General Assembly 2024, Vienna, Austria, 14–19 Apr 2024, EGU24-16337, https://doi.org/10.5194/egusphere-egu24-16337, 2024.

EGU24-16582 | ECS | Posters on site | HS9.6

Suspended sediment transport in a river network: testing signal propagation and modelling approaches 

Ludovico Agostini, Sophia Demmel, Sofia Garipova, Scott Sinclair, Fritz Schlunegger, and Peter Molnar

The AlpRhineS2S project, a collaboration between ETH Zürich and the University of Bern, researches the interplay of geological, geomorphological and hydrological processes within the sedimentary system of the Alpine Rhine in the canton of Grisons, Switzerland. Distributed river network hydrology-sediment models are being used in Alpine basins for the prediction of source activation and transport rates, for both fine and course sediment. Fine sediment input in such models may be generated by hillslope mass movements in hotspots of erosion (Demmel et al., 2024) which can be tracked, facilitating the development of sediment budgets (Garipova et al., 2024). However, despite the utility of hydrology-sediment models, the propagation of the sediment signal along channels is rarely tested against exact solutions and observations.

In this contribution, we investigate the propagation of suspended sediment signals along channels and compare modelling simplifications with observations and theory. Averaged over long timescales, suspended sediment load represents the erosion rates of the catchment. At shorter timescales, from seasonal to hourly, sediment fluxes can describe the spatial distribution and activation of sediment sources and sinks across the basin. Active sediment sources and sinks constitute points of discontinuity in the basin, which create turbidity signals along the river network. Here we ask the questions: To what extent can channel flood wave propagation describe the sediment dynamics? Do current modelling approximations capture the richness of turbidity signals carried across the river network?

The observation data used here are retrieved from flushing events and environmental flow releases across selected Alpine rivers. The turbidity signal properties of the different events are compared in non-dimensional terms, and synthetic common properties across the samples are determined. Modelling is compared through a successive approximation approach starting with a 1D solution for unsteady flow with the model 1D BASEMENT (Vanzo et al., 2021) for a range of channel geometries and slopes. Then the sediment propagation is analysed with the steady flow assumption of the parabolic and kinematic flood wave, in analytical form and in the TOPKAPI-ETH model, which we plan to use in the AlpRhineS2S Project for sediment fluxes and sediment source identification (Battista et al., 2020).

Results highlight the extent to which numerical models can represent the channel sediment dynamics and what is consecutively missing from the introduced approximations. Findings also show that the suspended sediment propagation, even during controlled release events, cannot be described as a boundary condition problem: the interplay of deposition and resuspension along with local morphology and vegetation also play a fundamental role in the signal description.


References

Battista, G., Schlunegger, F., Burlando, P., Molnar, P. (2020): Modelling localized sources of sediment in mountain catchments for provenance studies, https://doi.org/10.1002/esp.4979.

Demmel, S., Agostini, L., Garipova, S., Leonarduzzi, E., Schlunegger, F., Molnar, P. (2024): Climatic triggering of landslide sediment supply in the Alpine Rhine, EGU24.

Garipova, S., Mair, D., Demmel, S., Agostini, L., Akçar, N., Molnar, P., Schlunegger, F. (2024): Source-to-Sink Sediment Tracing in the Glogn River Catchment, EGU24.

Vanzo, Davide, et al. "BASEMENT v3: A modular freeware for river process modelling over multiple computational backends." (2021)

How to cite: Agostini, L., Demmel, S., Garipova, S., Sinclair, S., Schlunegger, F., and Molnar, P.: Suspended sediment transport in a river network: testing signal propagation and modelling approaches, EGU General Assembly 2024, Vienna, Austria, 14–19 Apr 2024, EGU24-16582, https://doi.org/10.5194/egusphere-egu24-16582, 2024.

Estimations of sediment transport capacities and sediment connectivity are of high importance for water management at the catchment scale. Large-scale modelling techniques are helpful tools to give insights of such sediment budgets. However, these modelling techniques often require locally obtained characteristic values of the river sections, such as discharge measurements or river width values. Obtaining such information by in situ measurements or remote sensing data can get time- and cost-intensive, especially in remote and mountainous regions. Instead, several geospatial datasets with global coverage exist and can fill these gaps, if used adequately. We, therefore, adjusted the CASCADE model toolbox to work with freely available geospatial datasets as input parameters and exemplarily applied it to the Naryn River in Central Asia, which includes five artificial dam structures. The river characteristics such as slope and width were taken from the SWORD river database, and the hydrological information was taken from the Flo1K dataset. With the adjusted CASCADE model, we obtained information on sediment transport capacities in the catchment at the reach scale. As the model also accounts for sediment connectivity, we identified deposition- and erosion-prone areas and, therefore, localized sediment sinks and sediment sources in the catchment. The results showed that the large dams in the catchment influence the sediment budget significantly, for example by reducing the sediment transport capacities upstream, by trapping sediments in their reservoirs and by increasing the sediment entrainment downstream. Since sediment connectivity is an important parameter for ecosystem health and sustainable river management, such qualitative assessments of the sediment connectivity within large catchments can be helpful for prioritizing sediment management measures and be a basis for informed planning of more sustainable hydropower plants.

How to cite: Schwedhelm, H. and Rüther, N.: Analyzing Large-Scale Sediment Connectivity in a Central Asian Catchment Using Geospatial Datasets, EGU General Assembly 2024, Vienna, Austria, 14–19 Apr 2024, EGU24-17002, https://doi.org/10.5194/egusphere-egu24-17002, 2024.

EGU24-17212 | ECS | Orals | HS9.6

Assessment of the Accuracy of Numerical Morphological Models based on Reduced Saint-Venant Equations 

Hermjan Barneveld, Erik Mosselman, Victor Chavarrias, and Ton Hoitink

Sustainable river management often requires long-term morphological simulations. As the future is unknown, uncertainty needs to be accounted for, which may require probabilistic simulations covering a large parameter domain. Even for one-dimensional models, simulation times can be long. One of the acceleration strategies is simplification of models by neglecting terms in the governing hydrodynamic equations. Examples are the quasi-steady model and the diffusive wave model, both widely used by scientists and practitioners. We established under which conditions these simplified models are accurate.

Based on results of linear stability analyses of the St. Venant-Exner equations, we assessed migration celerities and damping of infinitesimal, but long riverbed perturbations. We did this for the full dynamic model, i.e. no terms neglected, as well as for the simplified models. The accuracy of the simplified models was obtained from comparison between the characteristics of the riverbed perturbations for simplified models and the full dynamic model.

We executed a spatial-mode and a temporal-mode linear analysis and compared the results with numerical modelling results for the full dynamic and simplified models, for very small and large bed waves. The numerical results match best with the temporal-mode linear analysis. We show that the quasi-steady model is highly accurate for Froude numbers up to 0.7, probably even for long river reaches with large flood wave damping. Although the diffusive wave model accurately predicts flood wave migration and damping, key morphological metrics deviate more than 5% (10%) from the full dynamic model when Froude numbers exceed 0.2 (0.3).

How to cite: Barneveld, H., Mosselman, E., Chavarrias, V., and Hoitink, T.: Assessment of the Accuracy of Numerical Morphological Models based on Reduced Saint-Venant Equations, EGU General Assembly 2024, Vienna, Austria, 14–19 Apr 2024, EGU24-17212, https://doi.org/10.5194/egusphere-egu24-17212, 2024.

The Shields parameter, dimensionless time-averaged bed shear stress, has been widely used to predict the onset of bed load particle motion and the magnitude of time-averaged bed load sediment flux in open channel flows. Nevertheless, the limitation of a time-averaged approach becomes evident when addressing near-threshold transport problems, potentially leading to the neglect of critical factors. Studies reported that the impulse criterion (force times its duration) is more effective than the Shields criterion under low-shear conditions.

This study focuses on developing an impulse-based entrainment mechanism, incorporating turbulent fluctuation, bed load transport intermittency, and force duration from an instantaneous viewpoint. We characterized the random impulse events time series, covering random intensity, random event duration, and random arrival time, as the energy imparted to particles by turbulent flow. The joint probability density function (PDF) models the event intensity and duration, while the Poisson process governs the random arrivals of impulse events. The essential parameters are extracted from a Direct Numerical Simulation (DNS) data set. A work-based criterion is applied to determine whether a particle will be entrained by the energy it receives. The time-averaged bed load sediment flux is obtained through an existing linkage between impulse events and the sediment flux. The model will be validated using the stress transport relation, where the time-averaged sediment flux is expected to be proportional to the 16th power of time-averaged shear stress at low shear conditions and the 1.5th power of time-averaged shear stress at high shear conditions.

This study offers valuable insights into near-threshold transport problems from various perspectives in a stochastic manner. For instance, statistical properties of impulse event duration, intensity, and mean arrival rate that transit from high to low shear conditions are investigated. Furthermore, from a macroscopic and time-averaged view, the stress-transport relation with the uncertainty of time-averaged sediment flux is obtained, showing an increased variability when near the critical threshold. Moreover, from a microscopic and instantaneous view, this study developed a physical-based approach to address particle resting time from a Lagrangian viewpoint. The impulse event random process can be applied as the entrainment mechanism to a Lagrangian stochastic bed load particle tracking model (PTM) to predict the local inception of particles at any instant. The statistical properties of near-bed particle dynamics, such as the particle hopping distance, resting time, and anomalous advection and diffusion, can be comprehensively investigated once a bed load PTM is equipped with the proposed model that considers a physical-based intermittent entrainment random process.

How to cite: Chang, C.-H. and Tsai, C.: Developing an Impulse-Based Intermittent Particle Entrainment Mechanism in Turbulent Flows Using a Multivariate Random Process, EGU General Assembly 2024, Vienna, Austria, 14–19 Apr 2024, EGU24-17368, https://doi.org/10.5194/egusphere-egu24-17368, 2024.

EGU24-18138 | ECS | Posters virtual | HS9.6

Effects of Width Ratio and Offtake Angle on the Morphological Characteristics of an Offtake Channel 

Md Saiduzzaman and A. T. M. Hasan Zobeyer

River channel bifurcations play a crucial role in shaping fluvial systems, yet their morphological behavior remains a significant challenge in water resource engineering.  The present study is an attempt to investigate the effects of different off-taking angles (15, 30, 45, 60, 75, and 90 degrees) and width ratios (0.2, 0.4, 0.6, and 0.8) on the morphological behavior of offtake channels through a numerical modeling approach using SRH-2D. To comprehensively understand the morphological behavior of the offtake channel, the discharge ratio and the size of the flow separation area were also analyzed.  The result shows that the discharge ratio increases with an increase of offtake angle up to 75 degrees and the length of the separation zone decreases with the increase of offtake angle for any width ratio. The morphological analysis showed the presence of deposition dominance along the offtake channel for all offtake angle and width ratios. Erosion-deposition patterns varied along different sections of the offtake channel depending on the width ratio. These findings significantly contribute to the understanding of morphological characteristics in offtake channels of river channel bifurcations.

How to cite: Saiduzzaman, M. and Zobeyer, A. T. M. H.: Effects of Width Ratio and Offtake Angle on the Morphological Characteristics of an Offtake Channel, EGU General Assembly 2024, Vienna, Austria, 14–19 Apr 2024, EGU24-18138, https://doi.org/10.5194/egusphere-egu24-18138, 2024.

EGU24-18159 | ECS | Orals | HS9.6

Dynamics of the Karnali River Bifurcation in Nepal  

Kshitiz Gautam, Marijn Wolf, Rahil Ahmad, Thom Bogaard, and Astrid Blom

The Karnali River in Nepal bifurcates into two major branches (i.e., the eastern Geruwa branch and the western Kauriala branch), as it flows out from the Himalayan foothills onto a low relief area in southern Nepal, where it has created an alluvial fan of order 1000 km2. Its dynamics are governed by the natural geomorphological processes of an alluvial fan. The eastern Geruwa branch, which until 2009 used to be the dominant branch regarding its share of the upstream water discharge, now receives a minor share of the water discharge. The reducing discharge in the Geruwa branch has decreased heterogeneity and suitability of wildlife habitat in its floodplains, which constitutes a significant area of Bardiya National Park. The dynamic river branches exhibit a high level of braiding, switching of the dominant channel, and an uneven discharge partitioning between the bifurcates. Our objective is to provide insight on how the system is affected by and will respond to anthropogenic interventions, especially the discharge distribution between the Geruwa and Kauriala branches. The switch in the flow partitioning since 2009 seems to be associated with an intense monsoon season. Besides this, embankments along the Kauriala branch, discharge intakes for irrigation, and unmanaged sediment mining may have affected the partitioning of flow and sediment flux over the Karnali River bifurcates. Furthermore, plans to develop multiple hydropower projects upstream will likely affect the system in the future. We study the impact of these factors on the discharge partitioning between the Geruwa and Kauriala branches, and in particular the flow rate in the eastern Geruwa branch, as the latter is the lifeline for wildlife in the Bardiya National Park, using field surveying/monitoring and numerical models. For this purpose, we have performed an intensive field campaign for data collection and have set up numerical models of various levels of complexity. We have measured cross-sectional profiles and spatial variation of the bed surface grain size distribution. Our observations reveal that bed level in the upstream Geruwa branch is higher than that of the upstream Kauriala branch. Furthermore, we observe river bend sorting in the bifurcation region, which results in a larger bed surface grain size in the upstream Geruwa branch. We have set up a one-dimensional hydrodynamic model to simulate the effects of interventions on the flow partitioning at the Karnali River bifurcation, as well as a two-dimensional hydro-morphodynamic model to study the impact of bend sorting and other two-dimensional aspects on the flow partitioning, as well as sediment deposition in and possible closure of the Geruwa branch.

How to cite: Gautam, K., Wolf, M., Ahmad, R., Bogaard, T., and Blom, A.: Dynamics of the Karnali River Bifurcation in Nepal , EGU General Assembly 2024, Vienna, Austria, 14–19 Apr 2024, EGU24-18159, https://doi.org/10.5194/egusphere-egu24-18159, 2024.

EGU24-18252 | ECS | Orals | HS9.6 | Highlight

A robust, user-friendly tool for accurate fluvial grain-size/substrate class estimation 

Tulio Soto Parra, David Farò, and Guido Zolezzi

Accurate estimation of sediment size and substrate classes in fluvial remote sensing is pivotal for habitat modeling and hydrodynamic applications. While recent advancements have adopted computer vision based approaches (i.e. deep learning), the complexity of setting up these algorithms, along with the requirement of dedicated hardware, and the lack of readily available tools, hinder their wider adoption. This study presents a novel, user-friendly two-step tool tailored for precise substrate class estimation in clear-water river environments from ultra high-resolution orthoimagery, typically coming from UAVs. Leveraging image texture properties (evaluated with the co-occurrence matrix), image color channels (typically Red, Blue, and Green bands) and machine learning classificators (i.e. Random Forest, Support Vector Machine), the proposed methodology is able to accurately identify substrate classes ranging from fine sediments (e.g. sand and lime), various size gravel and cobbles, and boulders, both submerged (wet) and above water. It is a 2-step methodology that involves (a) manual labeling of homogeneous substrate class patches within any Geographic Information System (GIS) platform, followed by (b) streamlined data input. Validation across three reaches of gravel-bed rivers —Aurino, Piave, and Brenta rivers in NE Italy— with differing sizes and morphologies, and substrate ranging from fine sediments to boulders, yielded F1 scores of 0.86, 0.97, and 0.938, respectively. Some challenges still arise when classifying substrate in areas where visibility and light conditions are significantly altered, such as in very deep water, within tree canopy shadows, or due to strong sun reflections. Finally, this tool enables easy and accurate substrate class estimations in riverine environments, offering a significant contribution to fluvial studies and applications.

How to cite: Soto Parra, T., Farò, D., and Zolezzi, G.: A robust, user-friendly tool for accurate fluvial grain-size/substrate class estimation, EGU General Assembly 2024, Vienna, Austria, 14–19 Apr 2024, EGU24-18252, https://doi.org/10.5194/egusphere-egu24-18252, 2024.

EGU24-18917 | Orals | HS9.6

Large wood recruitment and transport during a severe flash flood in Central Spain, September 2023. 

Ana Lucía, K. Patricia Sandoval-Rincón, Daniel Vázquez-Tarrío, Julio Garrote, Mario Hernández-Ruiz, María Ángeles Perucha, Amalia Romero, and Andrés Díez-Herrero

In the face of escalating climate change and an expected increase in extreme precipitation events leading to extreme floods, this work addresses the understudied but critical aspect of woody material in river systems. We aim to understand the dynamics of large woody debris during a severe flood and the evolution of floodplain vegetation in the periods between floods.

The study area is the River Alberche and its tributary, the River Perales (Tagus Basin, Central Iberian Peninsula). These were affected by an exceptional cut-off low weather situation (DANA in Spanish) in September 2023 producing heavy precipitation (up to 200 l/m2) and flash floods. This event flooded urban areas, damaged or destroyed four bridges, and resulting in two deaths. One of the damaged bridges had retained a significant deposit of large and fine woody material. After the flood, as usual, critical voices emerged from the affected population calling for the removal of woody material from the riverbeds. However, there are positive contributions of wood in rivers, enhancing hydro-morphological diversity and serving as a source of organic matter. Nevertheless, uncertainties remain regarding the dynamics and amounts of woody material, which warrant a comprehensive investigation.

This research aims to fill existing gaps by investigating the dynamics of woody material transport under these exceptional flow conditions through a post-event forensic survey. In addition, it aims to understand river bed vegetation during non-extreme flood periods. The knowledge generated will contribute to the development of basin-scale models that integrate woody material, thereby improving the accuracy of flood risk assessments and enabling the formulation of effective mitigation strategies.

How to cite: Lucía, A., Sandoval-Rincón, K. P., Vázquez-Tarrío, D., Garrote, J., Hernández-Ruiz, M., Perucha, M. Á., Romero, A., and Díez-Herrero, A.: Large wood recruitment and transport during a severe flash flood in Central Spain, September 2023., EGU General Assembly 2024, Vienna, Austria, 14–19 Apr 2024, EGU24-18917, https://doi.org/10.5194/egusphere-egu24-18917, 2024.

EGU24-19028 | ECS | Posters on site | HS9.6 | Highlight

Hydro-ecologically based operation of run-of-river reservoirs for effective sediment management and energy production 

Klaudija Lebar, Simon Rusjan, Tamara Kuzmanić, Gašper Rak, Andrej Kryžanowski, Matjaž Mikoš, Andrej Vidmar, and Mateja Klun

Here we present the main activities of an ongoing project aiming at effective sediment management in run-of-river reservoirs. Climate change is reflected mainly in a gradual increase of temperatures, which result in longer dry periods, frequently followed by heavy rainfalls, causing increased intensity and occurrence of floods and erosion processes. The changed hydrological conditions require proper adjustments of water management practices. Construction of water reservoirs, used for hydropower generation, offers the possibility to adapt to changed hydrological conditions, especially in terms of multipurpose water use. However, hydropower plant reservoirs disrupt the dynamics of sediment transport and may have a negative impact on the riverine environment and water organisms.  Sediment management under changing hydrological conditions is a challenge of global proportions, existing sediment management practices in water reservoirs worldwide are mostly unsustainable and lead to the loss of the multifunctional role of such facilities, such as loss of water availability for different uses and reduction of the riparian space, which worsen habitat conditions and self-cleaning capacity of the water body. Advanced, holistic sediment management strategy, which includes all elements of the natural sedimentation cycle and environmental concerns related to potential sediment pollution offers sustainable management solutions. In the presented project, a novel, active river sediment management strategy in hydropower reservoirs of the HPPs on the lower Sava, where 5 dams were built in a cascading system between 1993 and 2017, under changing hydrological conditions, will be developed. The strategy will assure to the highest possible extent of the restoration of natural dynamics of sediment transport, also considering the environmental status of sediments. To establish the presented management strategy, a holistic, interdisciplinary approach, which includes a detailed analysis of hydraulic conditions in the reservoirs and associated sedimentation processes, as well as analysis of pollutants trapped in the deposited sediment layers, will be applied. Based on the gathered data, it will be possible to further define potential measures related to the removal of sediments and the alternatives of their disposal or re-use. The developed sediment management plan for the chain of HPP on the lower Sava River will contribute to the restoration of sediment connectivity along the river course and the improvement of the river channel's ecological role. The authors acknowledge that the research is financially supported by the Slovenian Research and Innovation Agency, research core funding No. P2-0180, and research projects No. L7-50097 and by the HESS d. o. o. Hidroelektrarne na Spodnji Savi.

How to cite: Lebar, K., Rusjan, S., Kuzmanić, T., Rak, G., Kryžanowski, A., Mikoš, M., Vidmar, A., and Klun, M.: Hydro-ecologically based operation of run-of-river reservoirs for effective sediment management and energy production, EGU General Assembly 2024, Vienna, Austria, 14–19 Apr 2024, EGU24-19028, https://doi.org/10.5194/egusphere-egu24-19028, 2024.

EGU24-19462 | ECS | Orals | HS9.6 | Highlight

Optimization of direct bedload measurements using ADCP Bottom Tracking 

Pauline Onjira, Gudrun Hillebrand, Axel Winterscheid, and Julius Reich

Cross-channel variability in bedload transport is a predominant phenomenon in gravel-bed rivers, and is attributed to various aspects, including flow conditions, variations in grain-size distribution, boundary shear stress and channel morphology. These variations need to be considered during direct bedload measurements such that the entirety of collected samples is representative of the transport pattern. As a result, the measurement strategies developed and implemented over decades involve sampling at several positions at a cross-section. The distribution of the sampling points across the channel in large rivers has been implemented in various ways: 1) A given number of sampling points distributed at equal intervals along the channel cross-section; 2) One sampling point located on each transport lane; 3) A-priori approaches which allow for evaluations based on the degree of cross-channel variability of bedload transport.

The first approach is still prone to uncertainties to some degree, since it is still unknown whether transport rates in between two sampling locations can produce significant difference in bedload estimations. The second approach is limited to cross-sections where transport patterns are well known and probably not prone to changes. In addition, it would still be uncertain whether any further variations on the transport lanes may be present. Despite considering cross-channel variability, the third method is difficult to implement when bedload is conveyed through a very small section of the river width, since in such case, the method can lead to overly-numerous sampling points that can be relatively difficult to implement in a measurement campaign.

ADCP Bottom Tracking (BT) is an indirect bedload measurement method that utilizes acoustics to detect movement of bed material. At a given point in time, ADCP sensors record properties of acoustic signals emitted and reflected off the mobile bed.  Bedload transport rates are derived from the BT signal using various approaches described by (Conevski, Winterscheid, Ruther, Guerrero, & Rennie, 2018). The continuous recording of an entire cross-section allows the identification of significant variations in transport and hence the derivation of transport lanes and the effective bedload transport width. This method is still under research but its capability to acquire continuous measurements in high-resolution can be harnessed and used to optimize direct sampling.

The current research proposes to complement direct bedload measurements using ADCP-BT measurements, such that the measurements obtained using the latter approach will be utilized in-situ in a-priori assessment of cross-channel variations in transport. The assessment can then be used to adapt the direct sampling strategy. An approach to auto-detect the “appropriate” sampling locations will be developed with the aim to optimally allocate only few sampling points while retaining the original shape of the bedload curve from ADCP-BT measurements. This approach has the potential to reduce uncertainties in the measurements and also provide the possibility of only sampling at sections that are relevant for bedload calculations and thus providing a time-efficient measurement strategy.

How to cite: Onjira, P., Hillebrand, G., Winterscheid, A., and Reich, J.: Optimization of direct bedload measurements using ADCP Bottom Tracking, EGU General Assembly 2024, Vienna, Austria, 14–19 Apr 2024, EGU24-19462, https://doi.org/10.5194/egusphere-egu24-19462, 2024.

EGU24-20292 | ECS | Orals | HS9.6

Using machine learning approaches for predicting suspended sediments in alpine catchments – uncertainties and limitations 

Thomas Frasnelli, Johannes Schöber, Maria Pesci, Kristian Förster, and Stefan Achleitner

Hydropower generation and the associated sediment management is one out of different water related services that are subjected to hydrological changes over time. Thus, the assessment and prediction of the sediment transported from catchments at varying temporal and spatial scales was and is an important task in hydraulic engineering. In this study, we focus on alpine catchments feeding a reservoir for hydropower production. Aim was to simulate and predict the suspended sediment input, which accounts for the vast majority of sediment loads.

The selected catchments, Pitzbach and Fagge, are part of the hydropower system Kaunertal Valley (Tyrol/Austria), operated by the TIWAG. The available measurements include discharges and turbidity/suspended solids contributing to the sedimentation of the Gepatsch reservoir. The discharge time series cover several decades, whereas turbidity was only measured during the recent years.

A combination of a process-based water balance modelling and a data driven approach to simulate sediment fluxes was combined to simulate extreme events and years as well as past periods where no material transport was measured.

For the two sub-catchments, different machine learning approaches were used to mimic suspended sediment transport, based on an available 11-year (2008-2018) long timeseries. Specifically, feed-forward neuronal networks (FFNN) and long short-term memory networks (LSTM), were tested and compared using different input combinations to identify the most suitable models for the respective catchment area.

For further validations the models were exanimated on a short “future” period (2019-2022), which was not part of the calibration. The model performance was evaluated for this time series, having a special focus on periods with exceptionally high transported sediment loads. For past periods (back until 1970), only discharge and reduced number of meteorological stations are available. Similarly, the models were applied to these periods in order to calculate sediment transport time series. On the one hand, a solely data driven approach using measured discharge and meteorological time series was tested. Beyond that, results from a process based hydrological model were used, aiming to cover also periods with gaps in the discharge data.

Overall, the simulations allowed to quantify the uncertainties associated to such modelling chains, when using them to describe sediment fluxes at different temporal scales.

How to cite: Frasnelli, T., Schöber, J., Pesci, M., Förster, K., and Achleitner, S.: Using machine learning approaches for predicting suspended sediments in alpine catchments – uncertainties and limitations, EGU General Assembly 2024, Vienna, Austria, 14–19 Apr 2024, EGU24-20292, https://doi.org/10.5194/egusphere-egu24-20292, 2024.

EGU24-20793 | ECS | Posters virtual | HS9.6

The Geometry of Three-Dimensional River Dunes 

Sree Sai Prasad Bodapati and Venu Chandra

Dunes are ubiquitous in river, marine, desert and Martian environments. The fluid flow over mobile beds results in the evolution of dunes of different sizes and shapes. The literature on dunes concentrates more on 2D dunes, whereas dunes in natural rivers tend to be more three-dimensional complex shapes. The shape of the dune has a vital role in sediment transport. Bed load transport is estimated by assuming the dune shape as a triangle, which is inconsistent with field data. The typical profile of a 2D dune consists of stoss height, stoss angle, lee height, lee angle, and brink point. In three-dimensional dunes, crest line curvature also increases the complexity along with previously mentioned parameters. In the present study, the Parana river bed survey dataset is collected online (BedformsATM download SourceForge.net). The dataset contains bed profiles of Parana river surveyed in an area of 370 m x 1028 m with a spatial resolution of 1 m in each direction. Then, the bed profiles are de-trended such that dune geometry parameters can be determined accurately. The obtained dune dimensions are compared with predicted dune dimensions from different models available in the literature. It is observed that most of the models underpredicted the dune dimensions as their equations have simple relations with flow depth. The bed elevation profiles are decomposed using Empirical Method Decomposition methods to delineate the hierarchies. Further, a single dune in the Parana river dataset is isolated, and the data is used to fit the equation for a 3D dune shape. The dune generated from the equation correlates well with the original river dune. This equation will help us analyse the influence of 3D dune geometry on the flow field. Thus, it can be concluded that there is an increased need to study the flow over 3D dunes and their implications on turbulence and sediment transport.   

Keywords: River dunes, 3D dunes, Dune Shape, EMD.

How to cite: Bodapati, S. S. P. and Chandra, V.: The Geometry of Three-Dimensional River Dunes, EGU General Assembly 2024, Vienna, Austria, 14–19 Apr 2024, EGU24-20793, https://doi.org/10.5194/egusphere-egu24-20793, 2024.

EGU24-20869 | Orals | HS9.6

Hydropeaking on fish physiological stress 

Maria Dolores Bejarano, Raul Hernández-Marchena, Álvaro De la Llave-Propín, Paola Bianucci, and Khosro Fazelpoor

Research on impacts of hydropeaking on river ecosystems has increased in the last years. For fish, much literature reports stranding and behavior changes, but physiological stress is less understood. In this study, we simulated a natural-flow scenario and five hydropeaking operating scenarios varying in frequency, duration and fall rate of the inundations, and water velocity and level in our Greenchannel facility, which is a mesocosm of fluvial ecosystem. 15 different rainbow trouts (Oncorhynchus mykiss) each time were subject to a scenario during 24 hours, measuring several physiological parameters at the end of the trials: Cortisol, CPK (Creatine Phosphokinase), LDH (Lactate Dehydrogenase), Triglycerides, Lactate, NEFA (Free Fatty Acids) and skin color. Results show how levels of these parameters change significantly in response to higher intensities of hydropeaking, which may lead to bad performance or death in the long term.

How to cite: Bejarano, M. D., Hernández-Marchena, R., De la Llave-Propín, Á., Bianucci, P., and Fazelpoor, K.: Hydropeaking on fish physiological stress, EGU General Assembly 2024, Vienna, Austria, 14–19 Apr 2024, EGU24-20869, https://doi.org/10.5194/egusphere-egu24-20869, 2024.

HS10 – Ecohydrology, wetlands and estuaries: aquatic and terrestrial processes and interlinkages

A major concern for revegetated desert ecosystem is accounting for the evapotranspiration dynamics which is influenced by the carrying capacity of the soil moisture content. Most field observations indicate that soil moisture at certain depth varies with the stochastically occurrence of rainfall events, and the evapotranspiration at community level also varies with the total of annual precipitation. Based on a study of the long-term field observation on the revegetated desert ecosystem, we find that the evapotranspiration of the shrub community correlates closely to the availability of soil moisture, and it can be quantified by analytical description of the stationary and transient joint behavior of plant evapotranspiration and soil moisture. The experimental results indicate that the size and diversity of plant species in water-limited ecosystem can be determined by plant evapotranspiration, which is a comprehensive indicator for plant water resource competition. These results suggest that revegetating large sandy areas with desert shrubs could reduce soil water storage by transpiration, which could significantly change groundwater recharge conditions. However, from a viewpoint of desert ecosystem reconstruction, it appears that natural rainfall can sustain desert shrubs which would reduce erosion loss of sand.

How to cite: Wang, X.: Variation among desert shrub patches in evapotranspiration, EGU General Assembly 2024, Vienna, Austria, 14–19 Apr 2024, EGU24-1517, https://doi.org/10.5194/egusphere-egu24-1517, 2024.

Vegetation plays a crucial role in river hydrodynamic processes, and the accurate prediction of vegetation drag force is essential for effective river management and ecosystem protection. The interactions within the vegetation canopy must be quantified to understand their impact on drag force. This study delves into the canopy interaction mechanisms of rigid emergent aquatic vegetation, with a specific focus on blockage and sheltering effects. Through a series of flume experiments, we systematically explored various combinations of lateral and longitudinal spacing, including special single row and single column arrangements. Our experimental design includes various combinations of lateral and longitudinal spacing, as well as special single row and single column arrangements. This allowed us to provide a more precise understanding of how lateral and longitudinal spacing affect the blockage and sheltering effects. Furthermore, we introduced a unified reference velocity that combines two effects, based on which we have established a widely applicable drag model that can predict drag under various density conditions. Additionally, we propose a critical characteristic value for quantifying drag, shedding light on the ultimate performance of drag under different spacing arrangements. These findings offer a reliable framework for predicting drag in rigid emergent vegetation canopies, significantly advancing our comprehension of vegetation's influence on hydrodynamic processes. The established drag model serves as a practical tool for river management and ecosystem protection, providing valuable guidance for sustainable environmental practices.

How to cite: Wang, P. and Liu, Y.: Drag in Vegetation Canopy: Considering Sheltering and Blockage Effects, EGU General Assembly 2024, Vienna, Austria, 14–19 Apr 2024, EGU24-2069, https://doi.org/10.5194/egusphere-egu24-2069, 2024.

EGU24-2234 | ECS | Orals | HS10.1

Velocity profile in steady flow with submerged flexible vegetation 

Zekun Meng and Ping Wang

Flexible submerged vegetation plays a pivotal role in ecosystem. Exploring the relationship between flexible vegetation deformation and flow velocity distribution is essential due to the complex disturbance caused by the bending characteristics of vegetation in water flow. Previous studies have typically relied on constant drag coefficients to predict vertical velocity distribution. However, the broad range of drag coefficient variability in flexible vegetation presents challenges in coefficient selection. In this paper, the developed prediction model of velocity profile based on multi-factor-dependent drag coefficient is derived by cantilever beam theory, dual-layer averaged velocity model and the relationship between the averaged inclination angle and Cauchy number, and the application of this prediction model is highly favorable. Meanwhile, a new analytical expression for depth-averaged drag coefficient of submerged vegetation with deformation angle and Reynolds number is proposed. These equations can reflect the influence of submergence as well. The findings of this study may provide valuable insights into the variability of drag coefficients and the flow structure with submerged flexible vegetation. And it can serve as a foundational basis for the restoration and management of freshwater ecosystems.

How to cite: Meng, Z. and Wang, P.: Velocity profile in steady flow with submerged flexible vegetation, EGU General Assembly 2024, Vienna, Austria, 14–19 Apr 2024, EGU24-2234, https://doi.org/10.5194/egusphere-egu24-2234, 2024.

EGU24-4112 | ECS | Orals | HS10.1

Drivers and effects of drying terrestrial water storage on ecosystem carbon uptake 

Yuanhang Yang, Jiabo Yin, Louise Slater, and Pan Liu

Terrestrial water storage (TWS) is a crucial component in regulating global water and energy budgets, exerting significant impacts on the ecosystem carbon cycle. However, the physical mechanisms behind changes in TWS and its causal relationship with terrestrial carbon uptake remain elusive. Here, we explore water-heat-carbon dynamics using a convergent cross mapping method based on eddy-covariance flux measurements. Then, we employ a supervised machine learning model and path analysis to evaluate the effects of drying TWS on vegetation photosynthesis and respiration. Finally, we project future TWS and drought conditions as well as their impacts on ecosystem vegetation productivity at the global scale. We find that temperature, soil moisture, and radiation are dominant factors regulating carbon update. In most regions of the globe, soil moisture influences vegetation photosynthesis, while the Leaf area index (LAI) plays a dominant role in humid and hyper-dry regions. Our cascade model chain projects that future drought events may have severe negative impacts on vegetation productivity. Terrestrial productivity is projected to be constrained over a growing proportion of global land surface, from the historical period (65.36%) to SSP126 (68.5%), SSP370 (67.4%) and SSP585 (70.67%). As drought severity escalates from moderate to severe, gross primary productivity (GPP) anomalies decrease from -3.53 to -8.4 , suggesting that higher water stress lowers the terrestrial carbon sink. Our results highlight the urgency of enhancing ecosystem resilience to increasingly severe drought conditions.

How to cite: Yang, Y., Yin, J., Slater, L., and Liu, P.: Drivers and effects of drying terrestrial water storage on ecosystem carbon uptake, EGU General Assembly 2024, Vienna, Austria, 14–19 Apr 2024, EGU24-4112, https://doi.org/10.5194/egusphere-egu24-4112, 2024.

The effects of water on vegetation have always been a concern. It is an important support as well as a major limiting factor with respect to vegetation growth. By analyzing the spatiotemporal changes and correlations between precipitation (PRE), soil moisture (SM), vapor pressure deficit (VPD), and normalized difference vegetation index (NDVI) in the Yellow River Basin, we explored the different effects of different water elements on vegetation. Our findings reveal the following: (1) NDVI and the three water elements report an increasing trend in the Yellow River Basin, with NDVI increasing most significantly. (2) The changes in vegetation are closely related to arid and humid zoning of the Yellow River Basin. NDVI of arid regions is significantly lower than that of humid regions; additionally, NDVI of natural vegetation in arid regions is lower than that of crops planted in irrigation areas, whereas the opposite is true in humid regions. (3) 92.1% of the Yellow River Basin showed an increase in NDVI, and 76.4% showed a significant increase. The proportions with trends of increasing in PRE, SM, and VPD were 75.40%, 51.88%, and 49.71%, with significant increases of 4.5%, 9.5%, 17.9%, respectively; (4) Vegetation in the Yellow River Basin was most positively affected by PRE, followed by SM and VPD. PRE mainly affected the natural vegetation on both sides of the boundary between the arid and semi-arid regions and the semi-humid regions. SM mainly affected the natural vegetation in the arid and semi-arid regions, whereas VPD mainly affected the crops in the irrigation areas, and the irrigation areas in arid regions were affected the most. These findings contribute to a deeper understanding of the relationship between water elements and vegetation, as well as the formulation of strategies for the healthy development of regional natural vegetation and crops in areas of irrigation.

How to cite: Jin, X.: Different effects of Multiple Water Elements on Vegetation: A Case Study of the Yellow River Basin, EGU General Assembly 2024, Vienna, Austria, 14–19 Apr 2024, EGU24-4624, https://doi.org/10.5194/egusphere-egu24-4624, 2024.

EGU24-4869 | ECS | Posters virtual | HS10.1

Satellite-Based Inundation Modelling for Large-Scale Wetland Restoration in Semi-Arid Australia 

Jan Kreibich, Gilad Bino, William Glamore, and Richard Kingsford

Wetlands, among the world’s most biodiverse and productive ecosystems, face severe threats from flow regime alterations, unsustainable water management, land-use conversion, increasingly exacerbated by climate change. Reduced connectivity between river channels and their floodplain habitats is often a consequence of subsequent drying, significantly degrading ecological health. We investigated the impacts of a century of river regulation and upstream water abstractions on the Lowbidgee Floodplain in semi-arid Australia - a nationally important wetland ecosystem on the lower Murrumbidgee River within the Murray-Darling Basin. This floodplain, which includes the indigenous-managed Gayini Wetlands and Yanga National Park, has a rich Aboriginal cultural heritage and supports a range of threatened and endangered native Australian species. We utilized Landsat and Sentinel satellite data to map wetland inundation patterns from 1988 to the present. Through the analysis of discharge data from the floodplain’s river gauges, we modelled the extent and frequency of wetland inundation under variable water availability scenarios, resulting from river regulation and climate change. Additionally, we evaluated the effects of altered flow and flood regimes on the health of flood-dependent vegetation, using remote sensing-derived vegetation indices such as the NDVI and Fractional Vegetation Cover (FVC). Our study aims to inform environmental flow management for large-scale river and wetland restoration efforts. It also provides the indigenous landowners, the Nari Nari Tribal Council, with crucial data to support their land and water management.

How to cite: Kreibich, J., Bino, G., Glamore, W., and Kingsford, R.: Satellite-Based Inundation Modelling for Large-Scale Wetland Restoration in Semi-Arid Australia, EGU General Assembly 2024, Vienna, Austria, 14–19 Apr 2024, EGU24-4869, https://doi.org/10.5194/egusphere-egu24-4869, 2024.

EGU24-8204 | ECS | Posters on site | HS10.1

Factors influencing the kinetic energy of throughfall drops 

Katarina Zabret, Lana Radulović, Mark Bryan Alivio, Nejc Bezak, and Mojca Šraj

The rainfall erosivity influences the detachment of soil particles, movement and washing away the surface soil layers, which affects soil degradation and leads to various environmental problems. It depends primarily on the kinetic energy of raindrops, determined by the size and velocity of raindrops. However, rainfall microstructure (size, velocity and number of raindrops) is significantly changed during the process of rainfall interception. Precipitation, that is not intercepted by the vegetation, reaches the ground as throughfall (falling directly through the gaps in the canopy or dripping from the leaves and branches) or stemflow (flowing down the branches and stem). Therefore, the kinetic energy of throughfall under the vegetation is different than kinetic energy of open rainfall.

In the urban park located in Ljubljana, Slovenia, we have monitored the rainfall microstructure in the open and underneath the deciduous (Betula pendula Roth.) and coniferous (Pinus nigra Arnold) trees between 12 July 2022 and 19 July 2023. We have analysed the differences between rainfall microstructure and kinetic energy of raindrops in the open and underneath the trees.

The observed average number of raindrops per event under both trees was lower than the number of raindrops in the open. Also, the average kinetic energy of drops per event was significantly lower under the trees than in the open. Additionally, an analysis of factors influencing the kinetic energy of throughfall drops underneath the both trees was performed using the boosted regression trees and random forest models. Both models identified rainfall amount as the most influencing factor.

Acknowledgments: Results are part of the research programme P2-0180 and research projects J2-4489, N2-0313 and J6-4628, financed by the Slovenian Research Agency (ARIS).

How to cite: Zabret, K., Radulović, L., Alivio, M. B., Bezak, N., and Šraj, M.: Factors influencing the kinetic energy of throughfall drops, EGU General Assembly 2024, Vienna, Austria, 14–19 Apr 2024, EGU24-8204, https://doi.org/10.5194/egusphere-egu24-8204, 2024.

EGU24-8990 | ECS | Posters on site | HS10.1

Assessing the Mitigation of Uranium and Heavy Toxic Elements with Physicochemical and Hydrogeochemical properties of groundwater in the Malwa Region of Punjab, India 

Neeraj Chauhan, Stefan Krause, Jaswant Singh, Amrit Pal Toor, and Alok Srivastava

The escalating levels of uranium in groundwater present a critical challenge to public health and environmental sustainability in the Malwa region of Punjab, India. This study addresses the dearth of understanding regarding uranium contamination by investigating its hydrogeochemical behavior in the hot, sub-tropical steppe, semi-arid Malwa region. Our research aims to unravel the controlling factors influencing uranium mobility and distribution in groundwater. Ion chromatography was employed for the comprehensive determination of cations (Na+, K+, Li+, Ba+) and anions (F-, Cl-, Br-, NO3-, SO42-, PO4-). Inductive-coupled plasma mass spectrometry was utilized for the quantification of heavy elements including strontium (Sr), cadmium (Cd), lead (Pb), uranium (U), aluminium (Al), chromium (Cr), manganese (Mn), iron (Fe), copper (Cu), cobalt (Co), zinc (Zn), arsenic (As), and selenium (Se) concentrations in groundwater samples. Results indicate alarming uranium levels ranging from 1.13 to 299.40 µg/L with mean of 54.03 µg/L. 73% to 92% of samples surpassing Bureau of Indian Standards (BIS) and World Health Organization (WHO) guidelines. Groundwater is primarily of Mg-HCO3 type which exhibited alkaline characteristics attributed to silicate weathering, ion exchange, and carbonate weathering in semi-arid conditions. Cluster analysis grouped uranium with nitrate, sodium and potassium, emphasizing their interconnected behavior. Spearman correlation analysis revealed a close association between uranium concentrations and various parameters including electrical conductivity, total dissolved solids (TDS), alkalinity, nitrate, sulfate, Na, and K. TDS, nitrate, and alkalinity exhibited high correlations with uranium which indicates that salt-induced competition among ions is the primary cause of uranium mobilization. This is evident in increased uranium levels with mixed water species (Mg-Cl, Na-HCO3). Furthermore, concerning levels of arsenic and selenium exceeding BIS and WHO limits underscore additional health concerns. This research underscores the urgent need for understanding and managing uranium contamination in the Malwa region. The broader implications for public health and environmental sustainability necessitate immediate attention and comprehensive remediation strategies.

How to cite: Chauhan, N., Krause, S., Singh, J., Toor, A. P., and Srivastava, A.: Assessing the Mitigation of Uranium and Heavy Toxic Elements with Physicochemical and Hydrogeochemical properties of groundwater in the Malwa Region of Punjab, India, EGU General Assembly 2024, Vienna, Austria, 14–19 Apr 2024, EGU24-8990, https://doi.org/10.5194/egusphere-egu24-8990, 2024.

EGU24-10150 | Orals | HS10.1

Attributing the streamflow variation by incorporating glacier mass balance and frozen ground into the Budyko framework in alpine rivers 

Linshan Yang, Xiaohu Wen, Zhenliang Yin, Tingting Ning, and Tuo Han

The remarkable climate change has profound impact on the alpine hydrology, it remains unclear to date on the role of the changes in glacier and frozen ground degradation to the regional streamflow variation. Here, we incorporated the glacier mass balance and frozen ground degradation into the Budyko framework and used the elasticity method to attribute the variation of annual streamflow for 22 rivers in Qilian Mountains (QLM) from 1982 to 2015. The results indicates the simulated annual streamflow that considering glacier mass balance and frozen ground can explain more than 90% of observed streamflow at a significance of p < 0.01, especially for the rivers with high glacier coverage. The elasticity method revealed the simulated streamflow variation can explain more than 91% of variation in respect to the detected streamflow variation. It indicates the robust of the elasticity method and highlights the ability of capture the variation in streamflow with the Budyko framework that incorporated glacier mass balance and frozen ground. There were 3 classifications was clustered and the contribution of precipitation to streamflow variation in the 3 classifications were consistency to the streamflow variation in the 22 rivers of QLM. The precipitation play as a dominant role for the streamflow increased rivers, and ET0 play as a dominant role for the streamflow decreased rivers in QLM. The impact of vegetation on streamflow variation illustrated the strong regional divergence with the contribution varied between -34.55% and 36.79%. The contribution of glacier and frozen ground degradation on streamflow variation were moderate with negative contributions of frozen ground degradation to the streamflow decrease varying between -31.09% and -0.43%, while the contribution of glacier mass balance to variation in streamflow varied between -2.42% and 11.63% in QLM. The results can utilize for understanding the impacts of climate change on alpine hydrological processes and provide the perspective of water resource management.

How to cite: Yang, L., Wen, X., Yin, Z., Ning, T., and Han, T.: Attributing the streamflow variation by incorporating glacier mass balance and frozen ground into the Budyko framework in alpine rivers, EGU General Assembly 2024, Vienna, Austria, 14–19 Apr 2024, EGU24-10150, https://doi.org/10.5194/egusphere-egu24-10150, 2024.

EGU24-11298 | ECS | Orals | HS10.1

Ecohydrological modelling to assist decision making for land- and water management: applications from The Netherlands 

Sharon Clevers, Camiel Aggenbach, Ruud Bartholomeus, and Jelmer Nijp

Ecohydrological modelling to assist decision making for land- and water management: applications from The Netherlands

Biodiversity in nature areas is severely declining on both global and European levels. Many species and ecosystems are threatened by climate change, desiccation due to lowering groundwater levels and high nitrogen deposition. The Natura 2000 Network, a European-wide network of nature conservation areas, has been created to preserve and restore biodiversity. Ecohydrological processes are a key factor in the conservation of vegetation in nature areas. The relative impact of hydrological measures on biodiversity and vulnerable species is poorly understood in these nature areas, especially when uncertainty associated with climate change is taken into account. This knowledge gap delays decision making for land and water management. This study demonstrates a ecohydrological modelling approach to quantify the impact of hydrological changes on  vegetation.

In recent years, research has been done at KWR Water Research Institute in collaboration with several partners [1] to construct ecohydrological models that include the process-based relationships between water-related habitat factors and vegetation types. These models are currently applied at various spatial scales (local to national) to support decision making. The Water Vision Nature (WWN, in Dutch: Waterwijzer Natuur) is a tool including the model PROBE (PRObability-Based Ecological target model) to simulate the impact of water management, climate change and nitrogen deposition on terrestrial vegetation. PROBE uses the waterlevel output of a groundwater model to calculate the important habitat factors oxygen and transpiration stresses of the vegetation. Additionally, the habitat factors nutrient availability and acidity are derived from output of the hydroloigical model and soil factors. Next, these values are translated into vegetation indicator values for moisture, nutrients and acidity, respectively, by using empirical relationships. PROBE uses these values to predict the occurrence of vegetation types and the botanical nature value of these vegetation types.

To analyse the potential impact of the ecohydrological outlined approach on decision making in land and water management, WWN has been applied to evaluate local restoration and management plans of Natura 2000 areas in the Netherlands. These studies show that the process-based ecohydrological model PROBE is a useful method to analyse future management scenarios in nature areas by taking into account both water management measures and climate change scenarios.

[1] Wageningen University en Research , Stowa, Nutrient Management Institute (NMI) and Hoefsloot Spatial Solutions (HSS)

How to cite: Clevers, S., Aggenbach, C., Bartholomeus, R., and Nijp, J.: Ecohydrological modelling to assist decision making for land- and water management: applications from The Netherlands, EGU General Assembly 2024, Vienna, Austria, 14–19 Apr 2024, EGU24-11298, https://doi.org/10.5194/egusphere-egu24-11298, 2024.

EGU24-11709 | ECS | Orals | HS10.1

Spatio temporal variation of root water uptake in a mixed deciduous forest and a grassland 

Gökben Demir, Ruth-Kristina Magh, Janett Filipzik, Viktor Schreier, Johanna Clara Metzger, Beate Michalzik, and Anke Hildebrandt

Vegetation relies on soil water to meet transpiration demands. Furthermore, the canopy intercepts precipitation and introduces spatial heterogeneity in water entering the soil not only in forests but also in grasslands. Some studies showed that in mixed forests, trees tap water from deeper layers in response to long dry spells to compensate transpiration demands. In contrast, recent observations indicate that water uptake from deeper layers is almost negligible, which may be the main reason for the drought susceptibility of many forests in Central Europe. Moreover, canopy induced variability in precipitation distribution at the ground could influence water uptake patterns, which is rarely considered in forests and not investigated in grasslands. Therefore, we examined root water uptake and soil water patterns considering the impact of canopy-driven heterogeneity in subsurface processes through field observations. The research site consists of a mixed deciduous forest (1 ha) and an adjacent grassland (0.045 ha) site in Hainich Critical Zone Observatory, Thuringia, Germany. The forest site is dominated by European beech and hosts other species such as sycamore maple, European ash, while the plant community in the grassland is characterized by different functional plant groups such as graminoids, legumes and herbs. Both sites were equipped with closely paired (within 1 m) throughfall and soil moisture measurements (nforest = 34, ngrassland = 22). We sampled throughfall weekly at both sites in 2019 (March-August) and 2022 (May-September) along with gross precipitation and grass height measurements. At both sites, we derived root water uptake from diurnal fluctuations in soil water content at two depths during rain-free periods.

The growing season in 2022 was drier than in 2019 (Pgross, cum,2019 < 200 mm), resulting in less than 100 mm of cumulative gross precipitation within the sampling period. In addition, dry spells were longer and more frequent in the 2022 growing season. At the forest site, the topsoil layer held more water than the deeper layer throughout the sampling period in 2019 and early in the season 2022. In the grassland plot, the topsoil layer stored precedingly less water in both years through the growing season, especially after summer mowing, which is probably due to preferential flow. In the forest, the average water uptake depth systematically shifted to deeper layers in the dry growing season of 2022, so that after mid-July roots mostly tapped water from deeper layers. In 2019, the relatively wetter growing season, changes in uptake depths were also related to tree size. The average daily transpiration reached 3 mm in 2019 while it decreased to less than 2.5 mm in 2022 despite the higher evapotranspiration demand, indicating a strong drought effect. In the grassland plot, in both years, the deeper soil layer facilitated higher water uptake over the growing season in line with grass development and remained so even after summer mowing. Our results suggest that severe droughts can alter water uptake strategies in mixed species forest and grassland sites.

How to cite: Demir, G., Magh, R.-K., Filipzik, J., Schreier, V., Metzger, J. C., Michalzik, B., and Hildebrandt, A.: Spatio temporal variation of root water uptake in a mixed deciduous forest and a grassland, EGU General Assembly 2024, Vienna, Austria, 14–19 Apr 2024, EGU24-11709, https://doi.org/10.5194/egusphere-egu24-11709, 2024.

EGU24-13181 | ECS | Posters on site | HS10.1

Patterns, controls and predictions of water and land resources nexus in a typical inland river basina: A green-blue water perspective 

Meng Zhu, Qi Feng, Wei Liu, Chengqi Zhang, and Jutao Zhang

The underlying surface structure is being reshaped by climate change and human activities, which in turn affects the hydrological processes in inland river basins, with significant consequences for coupling patterns of water and land resources in inland river basins of arid and semi-arid regions. However, current studies of coupling pattern of water and land resources analysis focus on available water and visible land resources in the districts, so that there is an urgent need for research on the simulation and prediction for water and land resources coupling of the micro-scale. Therefore, this study firstly evaluated and predicted the land resources by MCE-CA-Markov model and soil quality index function with environment factors and socio-economic factors, then generalized and simulated the water resources by SWAT, and construct the Water-Land Nexus Model for water conservation and water consumption zones to clear the impact mechanisms of water and land resources nexus in inland river basins. The results show that the nexus index of water and land resources present a decreasing distribution from water conservation area to water consumption area of the Shiyang River Basin, with that being lower than 0.1 (mainly in the water consumption area). The coupling index of water and land resources of Shiyang River Basin decreases from 0.1105 in 1980 to 0.1071 in 2000. In 2020-2050, the water conservation area exhibit an increasing trend, but that of the water consumption area is decreasing. The Geo-detector results show that soil quality index, blue water resource and DEM are the main factors influencing the coupling of water and land resources in Shiyang River Basin, follow by precipitation, temperature and green water resource, and the effects of POP and GDP could be negligible. Furthermore, the interactions between natural and socio-economic factors are stronger than the ones within each other, indicating that natural factors are the main influences on water-land nexus and it is important to consider the interactions of nature along with the human activities.

How to cite: Zhu, M., Feng, Q., Liu, W., Zhang, C., and Zhang, J.: Patterns, controls and predictions of water and land resources nexus in a typical inland river basina: A green-blue water perspective, EGU General Assembly 2024, Vienna, Austria, 14–19 Apr 2024, EGU24-13181, https://doi.org/10.5194/egusphere-egu24-13181, 2024.

EGU24-13561 | Posters on site | HS10.1

Relationship and determinants of water and carbon dioxide (CO2) exchange in desert ecosystem, China  

Tengfei Yu, Tuo Han, Haiyang Xi, and Baofeng Li

Knowledge on relationship and determinants of water and carbon dioxide (CO2) exchange is crucial to land managers and policy makers especially for the desertified land restoration. However, it remains highly uncertain in terms of water use and carbon sequestration for artificial plantation in desert. Here, the continuous water and carbon fluxes were measured using eddy covariance (EC) in conjunction with hydrometeorological measurements over an artificial C4 shrub, Haloxylon ammodendron (C. A. Mey.) Bunge, from July 2020 to 2021 in Tengger Desert, China. In the entirely 2021, evapotranspiration (ET) was 189.5 mm, of which 85% (150 mm) occurred during growing season, that was comparable with precipitation (132.2 mm) plus dew (33.5 mm) and potential other sources (e.g. deep subsoil water). This ecosystem was a strong carbon sink with net ecosystem production (NEP) up to 446.4 g C m-2 yr-1, which was much higher than surrounding sites. Gross primary production (GPP, 598.7 g C m-2 yr-1) was comparable with other shrubs but ecosystem respiration (Re, 152.3 g C m-2 yr-1) was lower. Random Forest showed that environmental factors can explain 71.56% and 80.07% variation of GPP and ET, respectively. However, environmental factors have divergent effect on water and carbon exchange, of which soil hydrothermic factors (e. g. soil moisture content and soil temperature) determine the magnitude and seasonal pattern of ET and Re, while aerodynamics factors (e.g., net radiation, atmospheric temperature and wind speed) determine GPP and NEP. As such, divergent response of abiotic factors resulted in the decoupling of water and carbon exchange. Our results suggest that H. ammodendron was a suitable species for large-scale afforestation in desert or desertification-prone region given its low water use but high carbon sequestration. Therefore, we concluded that artificial planting H. ammodendron in dryland could provide an opportunity for climate change mitigation, however, the long-term time series data would be needed to confirm it.

How to cite: Yu, T., Han, T., Xi, H., and Li, B.: Relationship and determinants of water and carbon dioxide (CO2) exchange in desert ecosystem, China , EGU General Assembly 2024, Vienna, Austria, 14–19 Apr 2024, EGU24-13561, https://doi.org/10.5194/egusphere-egu24-13561, 2024.

The impacts of alternating dry and wet conditions on water production and carbon uptake at different scales remain unclear, which limits the integrated management of water and carbon. We quantified the response of runoff efficiency (RE) and plant water-use efficiency (PWUE) to a typical shift from dry to wet episode of 2003–2014 in Australia's Murray-Darling basin using good and specific data products for local application, including Australian Water Availability Project, Penman-Monteith-Leuning Evapotranspiration V2 product, MODIS MCD12Q1 V6 Land Cover Type and MODIS MOD17A3 V055 GPP product. The results show that there are significant power function relationships between RE and precipitation for basin and all ecosystems, while the PWUE had a negative quadratic correlation with precipitation and satisfied the significance levels of 0.05 for basin and the ecosystems except the grassland and cropland. The shrubs can achieve the best water production and carbon uptake under dry conditions, while the evergreen broadleaf trees and evergreen needleleaf trees can obtain the best water production and carbon uptake in wet conditions, respectively. These findings help integrated basin management for balancing water resource production and climate change mitigation.

How to cite: Lu, Z., Feng, Q., and Xie, J.: Basin management inspiration from impacts of alternating dry and wet conditions on water production and carbon uptake in arid region, EGU General Assembly 2024, Vienna, Austria, 14–19 Apr 2024, EGU24-13757, https://doi.org/10.5194/egusphere-egu24-13757, 2024.

EGU24-13909 | ECS | Posters on site | HS10.1

Long-term hydrological budget over urban areas: approaches and challenges 

Yexia Lin Xu, Naika Meili, and Simone Fatichi

Urbanisation substantially alters the permeability of the land surface and modifies the vegetation cover extent and type. These landcover changes profoundly affect the hydrological and energy budget. While the role of urbanization on the local flood response has been extensively studied, its effect on the long-term hydrological budget is much less known as computing the latent heat flux (evapotranspiration) in urban areas is still challenging. However, knowledge on the urban hydrological budget is important as many cities are planning water sensitive urban designs and water harvesting could be key to support an increasing amount of urban vegetation.

This study quantifies how urbanization changed the long-term hydrological budget of the island city state Singapore for the period between 1982 to 2021. To do so, we use two state-of-the-art mechanistic models which include all the major hydrological components such as runoff, soil and interception water storage, transpiration, and evaporation. The first is Tethys-Chloris (T&C), which is a mechanistic ecohydrological model that can resolve the water, carbon and energy budgets at high spatio-temporal resolutions but considers the urban effects in a simplistic way by only modifying the impervious fraction of the land surface and its roughness. The second is its urban counterpart, Urban Tethys-Chloris (UT&C), which explicitly resolves shading and radiation reflection within an urban canyon accounting for different urban vegetation types and configurations and explicitly resolves the local urban climate and hydrology. UT&C is however too computationally costly to simulate an entire city at high spatial resolution. Hence, a machine learning approach, where a multimodal neural network comprising a Conv1D layer followed by LSTM layers for dynamic meteorological inputs and Dense layers for static inputs such as urban properties, is used to re-map UT&C outputs over the entire city based on a few selected covariates.

By cross comparing the different approaches to compute the long-term water budget over urban areas, we highlight the involved uncertainties, and we can gain insights into the impact of urban development on modifying the water availability in Singapore. The island city-state relies on water harvesting as one source of water supply for households and knowledge of water availability is extremely important for long-term water management purposes.

How to cite: Lin Xu, Y., Meili, N., and Fatichi, S.: Long-term hydrological budget over urban areas: approaches and challenges, EGU General Assembly 2024, Vienna, Austria, 14–19 Apr 2024, EGU24-13909, https://doi.org/10.5194/egusphere-egu24-13909, 2024.

Overexploitation of water resources has led to severe ecological degradation and even desertification in many terminal wetlands in arid inland river basins, northwestern China. To restore the degraded vegetation ecosystem, ecological water conveyance projects (EWCPs) have become an important measure. Scientific assessment of the ecological stability of restored vegetation is of great importance for formulating reasonable ecological water management. Considering this, a systematic study was conducted in a typical terminal wetland of the Qingtu Lake Wetland (QLW) in Shiyang River Basin, northwestern China. The pixel-scale restored vegetation area (RVA) each year since the start of EWCP was extracted based on remotely sensed vegetation index. RVA increased dramatically in the first five years and became stable from 2016. The time lag of the response of RVA increase to ecological water conveyance was about 2 years. A bell-shaped function between RVA and groundwater depth was obtained based on the micro terrain of QLW via UAV. Five groundwater depth thresholds were then determined. The optimal groundwater depth in the hydrometric station was 2.91±0.09 m for the maximal RVA (17.08±3.25 km2). The optimal ecological water volume into Qingtu Lake was further estimated (the volume is 2224.4×104 m3) for the maximal RVA by a polynomial function between ecological water volume and groundwater depth. With the help of remotely sensed soil salinization and water surface, the vegetation restored during the first few years of EWCP in the southwest, west and north of QLW was found to degrade again due to the aggravation of soil salinization in these regions since 2019. Soil salinization was accelerated by the low groundwater depth with high mineralization and high evaporation capacity of climate without adequate inundation of ecological water by the unreasonable water allocation strategy. Under current simple and lax ecological water management in QLW, soil salinization will intensify and vegetation will further degrade. In other words, the ecological status of restored vegetation in QLW is unstable. Based on the optimal ecological water volume, even distribution of ecological water is helpful to maintain the stability of restored vegetation.

How to cite: Hu, S. and Zhao, Q.: The ecological stability of restored vegetation by ecological water conveyance project in a typical terminal wetland in an arid inland river basin, northwestern China, EGU General Assembly 2024, Vienna, Austria, 14–19 Apr 2024, EGU24-15124, https://doi.org/10.5194/egusphere-egu24-15124, 2024.

EGU24-16608 | Posters on site | HS10.1

Using freshwater mussel valvometry data as a real-time biological warning system for aquatic ecosystems 

Sebastiano Piccolroaz, Ashkan Pilbala, Nicoletta Riccardi, Nina Benistati, Vanessa Modesto, Donatella Termini, Dario Manca, Augusto Benigni, Cristiano Corradini, Tommaso Lazzarin, Tommaso Moramarco, and Luigi Fraccarollo

Quantifying the effects of external climatic and anthropogenic stressors on aquatic ecosystems is an important task for scientific and management progress in the field of water resources. In this study, we propose an innovative use of biotic communities as real-time indicators, which offers a promising solution for directly quantifying the impact of these external stressors on aquatic ecosystems. Specifically, we investigated the influence of natural river floods on biotic communities using freshwater mussels (FMs) as reliable bioindicators. Using a well-established valvometry technique, we measured the valve-opening behaviour of FMs, considering both amplitude and frequency. The valve gap movement of the FMs was monitored by installing a magnet on one valve and a Hall effect sensor on the other valve and recording the magnetic field between the magnet and the sensor itself using an Arduino board, which changes according to the distance between the two valves. The recorded data was then analysed using the Continuous Wavelet Transform (CWT) analysis to study the time-dependent frequency of the signals. The experiments were carried out in a laboratory flume and in the River Paglia (Italy). The laboratory experiments were carried out with FMs in two configurations: freely moving or immobilised on vertical bars. The immobilised configuration was necessary for the field application to prevent the FRMs from packing against the downstream wall of the protection cage during floods. These experiments allowed us to verify that immobilised mussels show similar responses to abrupt increases in flow conditions as free mussels, but produce more consistent and interpretable signals than free mussels due to the reduced number of features resulting from movement constraints. We then analysed the response of thirteen immobilised mussels in real river conditions during a moderate flood on 31 March 2022.  The FMs in the field showed a rapid and significant change in valve gap frequency as the flood escalated, confirming the laboratory results. These results highlight the effectiveness of using FMs as bioindicators for assessing flood impacts on aquatic ecosystems, and emphasise the utility of CWT as a powerful signal processing tool for analysing valvometric time series. The study proposes the integration of FM valvometry and CWT for the development of operational real-time Biological Early Warning Systems (BEWS) aimed to monitor and protect aquatic ecosystems.

How to cite: Piccolroaz, S., Pilbala, A., Riccardi, N., Benistati, N., Modesto, V., Termini, D., Manca, D., Benigni, A., Corradini, C., Lazzarin, T., Moramarco, T., and Fraccarollo, L.: Using freshwater mussel valvometry data as a real-time biological warning system for aquatic ecosystems, EGU General Assembly 2024, Vienna, Austria, 14–19 Apr 2024, EGU24-16608, https://doi.org/10.5194/egusphere-egu24-16608, 2024.

EGU24-16875 | ECS | Posters on site | HS10.1

The influence of environmental factors on the actual evapotranspiration of Artemisia ordosica  

Zaiyong Zhang, Qi Feng, Chengcheng Gong, Meng Zhu, Wei Liu, Jutao Zhang, and Anyuan Li

Artemisia ordosica can prevent desertification and increase carbon sequestration, and it has been extensively planted in the Mu Us Desert, China. Evapotranspiration (ET) plays an important role in the survival of Artemisia ordosica. However, the controlling factors of ET remain unknown. To investigate the influencing factors on the actual evapotranspiration, we set up a weighing lysimeter with Artemisia ordosica in the Mu Us Desert. We collected data of air temperature (Ta), net radiation (Rn), wind speed (WS), soil moisture (θ), vapor pressure deficit (VPD), and heat flux (HF). The multiple linear regression model was used to quantify the influence of the six environmental factors on the ET. In addition, we applied the boosted regression tree (BRT) method to quantify the relative contribution of these environmental factors to ET. Our results show that annual ET was 444.46 mm, which was mainly influenced by the VPD during the dry season and Rn during the rainy season. This is different from the previous results which emphasized the importance of θ and Ta. The BRT results show that VPD and Rn are the most contributors to ET in the research area. In addition, ET significantly decreased when the soil moisture was less than 0.063 cm3/cm3. ET can increase by an average of 90% after a rainfall event. Our results have significance for the hydrological cycle and ecological environment protection.

How to cite: Zhang, Z., Feng, Q., Gong, C., Zhu, M., Liu, W., Zhang, J., and Li, A.: The influence of environmental factors on the actual evapotranspiration of Artemisia ordosica , EGU General Assembly 2024, Vienna, Austria, 14–19 Apr 2024, EGU24-16875, https://doi.org/10.5194/egusphere-egu24-16875, 2024.

EGU24-17131 | ECS | Orals | HS10.1

The role of soil nutrient limitations on terrestrial carbon cycle in the Swiss Alps under climate change 

Fuxiao Jiang, Simone Fatichi, Gianalberto Losapio, and Nadav Peleg

Mountain regions, and the European Alps in particular, are warming faster than other land areas or the global average. The Alps are among the most sensitive terrestrial systems and have rapid and substantial responses to climate change. Consequently, the carbon cycle in high Alpine regions is expected to be significantly impacted by changes in vegetation cover and dynamics. Only a few studies offer insights into how vegetation types and carbon dynamics evolve at high elevation, considering changes in climate and soil conditions. We investigated changes in climate and soil nutrient development due to changes in vegetation type and cover amount using an ecohydrological model (T&C) and focused on the impacts of the changes on the carbon cycle in the Swiss Alps, where extensive glacier retreat is expected. Specifically, we used the Advanced Weather GENerator (AWE-GEN) model to simulate future realizations of climate at the hourly scale with ten RCM realizations under both low (RCP 4.5) and high (RCP 8.5) greenhouse gas emission scenarios. These future realizations drove the T&C model which reproduces all essential components of the hydrological cycle, vegetation dynamics, and soil biogeochemistry to simulate the carbon cycle dynamics over the 21st century. Our study will examine whether the increase in vegetation in glacier forefields is shifting the carbon cycle (e.g., from the carbon sources to carbon sinks). We will present the results of numerical modeling and discuss whether vegetation growth might be restricted despite increased warming by soil nutrient limitations, thereby reducing the rate of CO2 uptake. This study highlights the impact of soil nutrients on vegetation pattern changes and terrestrial carbon cycle dynamics in high-elevation environments.

How to cite: Jiang, F., Fatichi, S., Losapio, G., and Peleg, N.: The role of soil nutrient limitations on terrestrial carbon cycle in the Swiss Alps under climate change, EGU General Assembly 2024, Vienna, Austria, 14–19 Apr 2024, EGU24-17131, https://doi.org/10.5194/egusphere-egu24-17131, 2024.

EGU24-18264 | ECS | Posters on site | HS10.1

Assessing the Universality of Habitat Suitability Indexes (HSI) for brown trout (Salmo trutta L.) in Relation to Ecohydraulic Variables 

Francesca Padoan, Giulio Calvani, Giovanni de Cesare, and Paolo Perona

The purpose of this work is to present the results of a literature data re-analysis of HSI and demonstrate the existence of a universal level of similarity in the ranges of hydraulic variables for the considered species.

The decline in biodiversity within freshwater ecosystems is a critical issue influenced by many factors, including the increasing pollution levels and the proliferation of invasive species. Globally, river management strategies have increasingly incorporated river restoration efforts and actions aimed at preserving freshwater species, such as the brown trout (Salmo trutta L.). From a quantitative point of view, the efficiency of proposed restoration measures on river ecomorphology is assessed via the HSI, whose use is widely embraced by aquatic ecologists, river scientists, and engineers. For the specific case of the brown trout, the HSI takes into account several environmental factors, including flow velocity, water depth, and substrate type, which directly represent the environmental characteristics of the habitat. Despite variations in HSI curves based on geographical location and other incidental factors, a notable degree of similarity and shared dependence on flow discharge is observed among data in the literature. This prompts a crucial question about the extent of similarity in these curves for a particular species concerning ecohydraulic variables.

This work aims to address this query by considering literature data of HSIs measured in different worldwide locations and by various authors, all focused on the same fish species (i.e., the brown trout). The dependence of the HSI on particular ecohydraulic variables, such as water depth, velocity, temperature, and substrate are analysed by attributing the range of optimal values to the recommendations of the related authors. Histograms indicating the level of goodness of each range are then built and eventually smoothed by using fitting functions to reveal the universal characteristics of HSIs among worldwide rivers for the species being considered.  

How to cite: Padoan, F., Calvani, G., de Cesare, G., and Perona, P.: Assessing the Universality of Habitat Suitability Indexes (HSI) for brown trout (Salmo trutta L.) in Relation to Ecohydraulic Variables, EGU General Assembly 2024, Vienna, Austria, 14–19 Apr 2024, EGU24-18264, https://doi.org/10.5194/egusphere-egu24-18264, 2024.

EGU24-18767 | ECS | Posters on site | HS10.1

Encroachment analysis of the invasive tree species Ailanthus altissima in Sicily (Italy) through an ecohydrological cellular automata model  

Francesco Alongi, Emilio Badalamenti, Fulvio Capodici, Dario De Caro, Giuseppe Ciraolo, Tommaso La Mantia, Dario Pumo, and Leonardo Valerio Noto

Plant species diversity is fundamental for the stability and resilience of ecosystems, and the well-being of the entire planet. Healthy and diverse ecosystems also contribute to air and water pollution removal, climate regulation and flood prevention. In the last century, plant biodiversity has been facing severe threats, such as habitat destruction and fragmentation due to increasing urbanization, deforestation, agricultural expansion, wildfires, and pollution. In addition, changes in climate pose significant threats to plants biodiversity conservation and native species preservation. All these natural and anthropic disturbance factors are profoundly modifying the competitive dynamics among plant species, often favouring the establishment and spread of some invasive plants, and exacerbating the biodiversity loss of native ecosystems.

A well-known invasive alien species is Ailanthus altissima, a tree native to East Asia and introduced to various regions around the world, including North America and Europe. It is characterized by rapid growth, high reproductive capacity, and ability to thrive in a wide range of environmental conditions, where it can significantly modify ecosystems by altering soil characteristics, releasing allelopathic chemicals that may inhibit the growth of other plants, and forming dense thickets that reduce the space available and development chance of native vegetation. Ailanthus has been recognized as the most widespread and invasive alien tree species in Sicily (Italy), with a capillary presence over the entire regional territory, where it poses a serious threat to the biodiversity of the local Mediterranean ecosystems.

Ecohydrological models can simulate vegetation dynamics and predict Ailanthus encroachment mechanisms also in presence of disturbance effects and under climate change. In this work, the CATGraSS, an ecohydrological Cellular Automata model (Zhou et al., 2013), has been used for simulating spatio-temporal dynamics of Ailanthus altissima in a specific site of “Vallone di Piano della Corte” Nature Reserve, in the Erei mountains in central Sicily (Italy). The study area has a surface of approximately 1 km2 and it is characterized by a relevant nucleus of Ailanthus that has been growing rapidly in recent years. The study aims to reconstruct Ailanthus altissima spatio-temporal evolution in the study area over the last century. The model has been calibrated using the current Ailanthus distribution maps, obtained by classifying high-quality satellite images, collected by PlanetScope constellation, exploiting modern remote sensing techniques, together with field surveys.

How to cite: Alongi, F., Badalamenti, E., Capodici, F., De Caro, D., Ciraolo, G., La Mantia, T., Pumo, D., and Noto, L. V.: Encroachment analysis of the invasive tree species Ailanthus altissima in Sicily (Italy) through an ecohydrological cellular automata model , EGU General Assembly 2024, Vienna, Austria, 14–19 Apr 2024, EGU24-18767, https://doi.org/10.5194/egusphere-egu24-18767, 2024.

EGU24-19109 | ECS | Orals | HS10.1

Elementary mathematics sheds light on the transpiration budget 

Concetta D'Amato and Riccardo Rigon

This contribution aims to present a concise and effective methodology for accurately characterizing transpiration, a crucial component of the hydrological cycle. Rather than delving into intricate derivations of transpiration formulas, we employ simplifications, such as a century-old turbulence model, principles from Lord Kelvin's thermodynamics, and an energy budget overlooking thermal leaf capacity. Despite these simplifications, we assert the general validity of our approach in identifying primary mechanisms underlying transpiration.

Our methodology initiates with a treatment of five equations, including the mass budget, outlining the procedure: Clausius-Clapeyron equation, water vapor transport, turbulence-induced thermal energy transport, and stationary energy budget with radiative feedback. Initially, we introduce a simplified approach excluding the water budget, followed by its inclusion to demonstrate that adhering to the water budget is sufficient without imposing artificial constraints. Utilizing a linearized form of the Clausius-Clapeyron equation, we establish the Penman Formula, a well-regarded solution for estimating temperature (T), air vapor content (e), and thermal heat transport (H). Through water mass balance, we reveal that leaf pressure potential is dynamically influenced by atmospheric evaporation demand and soil moisture content, challenging the notion of capillarity as the sole determinant. Building on Schymanski and Or's (2017) research, we extend it by explicitly incorporating the canopy. Even within the "big leaf" approach (Bonan et al., 2021), we introduce a dependency on leaf area index (Lc) in formulas to accurately consider the canopy's impact. Additionally, we provide a detailed treatment of radiation, accounting for the canopy's influence, following Ryu et al. (2011) and de Pury (1995) methodologies.

In the realm of canopy analysis, our contribution reveals discrepancies compared to common simplistic approaches, shedding light on unique aspects of the subject matter.

How to cite: D'Amato, C. and Rigon, R.: Elementary mathematics sheds light on the transpiration budget, EGU General Assembly 2024, Vienna, Austria, 14–19 Apr 2024, EGU24-19109, https://doi.org/10.5194/egusphere-egu24-19109, 2024.

EGU24-19281 | Posters on site | HS10.1

Attribution and Response of Water Use Efficiency to Future Changes  in the Yellow River Basin 

Siwei Chen, Yueping Xu, and Yuxue Guo

Ecosystem water use efficiency (WUE, defined as the ratio of primary productivity to evapotranspiration) has garnered significant attention in recent years for its role as a vital indicator of the interplay between carbon and water cycles. Numerous studies have underscored the substantial impact of elevated CO2 concentrations on WUE through changes in climate and land surface properties. However, the relative contributions of these factors and their interrelations remain less clear. This study delves into the linkage between WUE and the water-energy exchange dynamics within the Yellow River Basin, employing the Budyko framework model as a foundation. We propose and validate a linear Budyko model tailored to WUE, demonstrating satisfactory physical performance (R2 = 0.60-0.73). Building on this, we construct an attribution framework for WUE, grounded in the Budyko model and global climate models (GCMs), to quantitatively disentangle the impacts of climate and land use change, as well as to elucidate the mechanisms underlying CO2-induced radiative and biogeochemical effects on WUE. Our attribution analysis suggests that the WUE of the Yellow River Basin is anticipated to increase by 0.36-0.84 (g C/kg H2O) in future scenarios, with climate change being the predominant driving force (77.9%-101.4%). The study also uncovers variations in the response of WUE to different drought conditions within the basin. Specifically, we observe an increase in WUE under moderate drought conditions, whereas a decline is noted in most areas as drought severity escalates. Under high emissions scenarios, WUE exhibits a more pronounced sensitivity to drought, particularly under extreme conditions. The outcomes of this research contribute to our understanding of how future CO2 concentration increments, under varying scenarios, may induce changes in WUE in the Yellow River Basin. Moreover, they reveal the prospective response mechanisms of vegetation to drought events within the basin, offering a scientific basis for the formulation of regional ecological strategies and water management practices.


How to cite: Chen, S., Xu, Y., and Guo, Y.: Attribution and Response of Water Use Efficiency to Future Changes  in the Yellow River Basin, EGU General Assembly 2024, Vienna, Austria, 14–19 Apr 2024, EGU24-19281, https://doi.org/10.5194/egusphere-egu24-19281, 2024.

Dryland ecosystems are widely spread all around the world, and are characterized by their sensitivity to meteorological seasonal and decadal changes, which impacts water availability and ecosystem sustainability. For instance, in Mediterranean dryland ecosystems climate change occurred with an increase of air temperature and a decrease (mainly in wet seasons) of precipitation, which are key atmospheric forcing for grass and tree growths. Climate predictions of future scenarios of the Intergovernmental Panel on Climate Change (IPCC) are even worse, affecting, for instance, the central Mediterranean basin with a further decrease of rainfall in wet months and an increase of air temperature. The case study is a typical Mediterranean ecosystem in Sardinia, where wild olives and seasonal grass species grow on thin surface soil layer overlaying a fractured rock sublayer, and for which a long-term dataset of micrometeorological, tree transpiration, remote sensing data and soil water content measurements is available. Our objectives are: 1) detect trends and changes on the evolution of tree cover spatial distribution related to changes on climate conditions, and investigate the impact on soil water and evapotranspiration using a long ecohydrological database of a typical water-limited ecosystem; 2) develop an ecohydrological model for long-term predictions able to capture the evolution of tree cover spatial distribution, vegetation dynamics, and soil water balance interactions; 3) investigate the impact of future climate scenarios with increase of CO2 on soil water balance and tree hydrological sustainability of a Mediterranean dryland ecosystem. The Sardinian field site is characterized by a very attractive long database of almost 60 years of data, with micrometeorological and meteorological measurements, remote sensing data and aerial photography images, providing a unique opportunity to analyze the response of the tree-grass ecosystem to the historical climate and land cover changes. The proposed model was able to reproduce well the soil, vegetation and atmosphere interactions and dynamics, and their long-term evolution. The proposed update of the model was accurate for predicting the long-term dynamics of the tree cover fraction evolution, which have been reduced drastically (0.10) by a human induced fire almost 60 years ago, and restored naturally in almost 20 years, reaching the equilibrium value (0.33). The Sardinian tree-grass ecosystem suffered an historically significant reduction of the rain and a significant increase of air temperature in the last century, which produced dryer conditions but with a recent mean annual precipitation (MAP) still above 600 mm, apparently enough for sustain the tree growth. The GCM future scenarios are even worse, predicting a further decrease of MAP up to 400 mm, and an increase of air temperature up to +10 °C, which will cause a reduction of the tree cover fraction up to 0.10, and a strong decrease of the tree LAI. The soil water balance is predicted being drier, with also less grass and vegetation in general, with consequences on the landscape aspect, becoming more and more a savanna-like ecosystem. Water resources and environmental planning strategies need to be consider for increasing the resilience of the tree-grass ecosystems to the climate changes.

How to cite: Montaldo, N. and Corona, R.: Hydrologic Sustainability of a Dryland Tree-Grass Ecosystem in the Mediterranean Region Under Climate Change, EGU General Assembly 2024, Vienna, Austria, 14–19 Apr 2024, EGU24-19296, https://doi.org/10.5194/egusphere-egu24-19296, 2024.

The Yellow River basin (YRB), as a crucial ecological corridor in the northern part of China, has experienced profound changes in multiple eco-hydrological processes. However, there is still lack of a global view on the variations and causal interactions in the complex hydro-ecological system of YRB. In this study, a set of eco-hydrological variables, regarding water resources (surface water, soil water, groundwater) and ecological environment (vegetation growth, productivity, water use efficiency) are used to represent the main characteristics of the eco-hydrological system in different sub-regions of YRB. The objective of this study is three-fold. Firstly, the individual variation of each eco-hydrological variable was unraveled using trend analysis. Secondly, network analysis was used to analyze the synergistic variations among variables. Finally, an advanced causal discovery tool incorporating prior knowledge was used to investigate the potential causal interactions in eco-hydrological system. The results indicate the decrease of terrestrial water storage anomalies (TWSA) in most parts of the YRB, which is mostly due to the substantial depletions in ground water. The vegetation growth and productivity have noticed prominent increasing trends in YRB, and such increase in the source region is largely due to the warmer climate condition and in the middle reaches is mainly because of the large-scale vegetation restoration. However, the ecosystem water use efficiency (WUE) is not very optimistic, especially in the source region. The causal discovery method captures the inhibitory effect of evapotranspiration on WUE in the upper and some parts of the middle reaches of YRB. Our study provides a new perspective to recognize the complicated eco-hydrological conditions and their variations in YRB during 2001-2019, as well as the potential mechanisms driving these variations.


How to cite: Xu, Y., Wang, L., Gu, H., and Liu, L.: Variations and causal interactions in the eco-hydrological system of Yellow River basin, China: A Network Perspective, EGU General Assembly 2024, Vienna, Austria, 14–19 Apr 2024, EGU24-19628, https://doi.org/10.5194/egusphere-egu24-19628, 2024.

EGU24-19734 | ECS | Posters on site | HS10.1

How anthropogenic modification of riverscapes reduce the resilience of floodplain waters to drought 

Luisa Coder, Olaf Büttner, Kay Knöller, Pia Marie Kronsbein, Andreas Musollf, and Jörg Tittel

Central Europe has experienced an extreme drought over the last five summers, which has led to a deficit in precipitation and discharge unlikely to be replenished quickly. Due to climate change, extreme weather events and accompanying droughts are likely to occur more frequently in the future putting pressure on aquatic ecosystems. In addition, rivers have been significantly modified over the years, with channelization and the construction of dams drastically altering the natural flow of the river. Floodplains have been cut off and natural habitats have been lost. This underlines the need to investigate the interactions of climate change and antropogenic alterations to rivers and to establish a safe operating space for floodplain areas to ensure their ecological function. To achieve this, we investigated 36 floodplain lakes near the Elbe River in Magdeburg, Germany, with varying connectivity to the main river and different characteristics of each lake. Water samples were taken from the lakes, the main river and the groundwater. Major ions and isotopes to determine the origin of the water. Further, chlorophyll a was sampled and parameters such as oxygen and hydrogen sulfide were taken. Along with recorded fish kills and measured water level, a scoring system was established to determine the degree of impairment and habitat loss of each lake. Connectivity, defined here as the frequency of an existing surface connection of the lake to the main river, was determined to provide a measure of the impact of anthropogenic modification and channelization of the river bed. The difference in deuterium excess between fall and spring served as a measure of evaporation and thus of the influence of climate change during the sampling campaign. Critical chlorophyll a concentrations were measured in surface waters in lakes with less than 50 % connectivity, critical oxygen concentrations in lakes with less than 10 % connectivity. Fish kills, hydrogen sulfide, siltation and dry-out occurred predominantly in lakes with a low connectivity. Finally, lakes with a small perimeter by area were found to exhibit fewer signs of degradation and habitat loss. Our results suggest that lakes that are connected to the main river are better able to respond to drought stress caused by climate change. Therefore, better connectivity to the main river may help to reduce habitat degradation or loss in the floodplain ecosystem.

How to cite: Coder, L., Büttner, O., Knöller, K., Kronsbein, P. M., Musollf, A., and Tittel, J.: How anthropogenic modification of riverscapes reduce the resilience of floodplain waters to drought, EGU General Assembly 2024, Vienna, Austria, 14–19 Apr 2024, EGU24-19734, https://doi.org/10.5194/egusphere-egu24-19734, 2024.

EGU24-20738 | Posters virtual | HS10.1

The response of Groundwater-Dependent Ecosystems to drought in central Chile 

Iongel Duran-Llacer, Francisco Zambrano, Víctor Gómez-Escalonilla Canales, Pedro Martínez Santos, Marcelo Aliagada Alvarado, Lien Rodríguez-López, Rebeca Martínez-Retureta, and José Luis Arumí

Drought is considered the main climate limitation that affects the hydrological cycle, agriculture, people, and ecosystems. Since 2010, central Chile has been experiencing an uninterrupted sequence of dry years that has been classified as a megadrought, which has conditioned major social problems. This problem can't only affect agriculture, people, and access to drinking water in Chilean basins, but it can also affect the ecological integrity of ecosystems, particularly those known as groundwater-dependent ecosystems (GDE). The main objective of this research is to examine the relationship between groundwater-dependent ecosystems and drought using satellite data in the Aconcagua basin in central Chile.

Standardized Precipitation Index (SPI), Standardized Evapotranspiration Index (SPEI), Normalized Difference Vegetation Index (NDVI) and Land Surface Temperature (LST) were calculated to analyses relationship between groundwater-dependent ecosystem and drought. In addition, these parameters were analysed throughout the basin. To obtain and process these indicators between the years 2002 and 2022, the Google Earth Engine platform and the R environment were used. Subsequently, statistical analysis of the time series was performed, including Pearson correlation, Mann Kendall test, and Sen slope estimator. The results show that the SPI-SPEI at 12-24 months had a moderate correlation with the NDVI in much of the basin (>4) and high in the GDEs (>0.5). The slope of the Sen was more pronounced in the GDE zones, and the trend was decreasing with respect to the NDVI. LST and SPEI increased in the GDEs. In conclusion, the GDE zones were affected by drought processes, which demonstrates the need for sustainable management of these important ecosystems.

How to cite: Duran-Llacer, I., Zambrano, F., Gómez-Escalonilla Canales, V., Martínez Santos, P., Aliagada Alvarado, M., Rodríguez-López, L., Martínez-Retureta, R., and Arumí, J. L.: The response of Groundwater-Dependent Ecosystems to drought in central Chile, EGU General Assembly 2024, Vienna, Austria, 14–19 Apr 2024, EGU24-20738, https://doi.org/10.5194/egusphere-egu24-20738, 2024.

EGU24-562 | ECS | Posters on site | HS10.3 | Highlight

After the flames: Post-wildfire heavy metal mobilisation in a contaminated temperate peatland 

Abbey L. Marcotte, Juul Limpens, Emma L. Shuttleworth, Gareth Clay, João Pedro Nunes, Cristina Santín, Stefan H. Doer, Jonay Neris, Jeff Warburton, Richard C. Chiverrell, and Nicholas Kettridge

Intact peatlands are key resources for freshwater that contribute to multiple hydrological ecosystem services. They retain rainwater and regulate water quality downstream by storing contaminants in the peat profile. The release of heavy metals and nutrients, through burning or erosion of near-surface deposits, has the potential to provide a persistent source of legacy contamination, namely metal contamination, to downstream drinking water supplies. With future climate change increasing the frequency and severity of wildfires in summer and heavy rainfall in winter, the risk of contaminant release from high-latitude peat regions and downstream impact is uncertain.

In June 2018, a major wildfire affected an area of upland moorland (Saddleworth Moor, UK), which contains peat deposits contaminated with atmospherically derived metal deposits. We assessed potential water quality impacts from hillslope contaminant source to the fluvial system by monitoring of heavy metals in the catchment, namely lead (Pb), zinc (Zn), copper (Cu) and nickel (Ni). Specifically, we quantified the (1) metal concentrations in ash deposits resulting from contrasting burn severities; (2) dissolution and erosion of ash and peat deposits under intense rainstorm events; and (3) their transport via the stream network to the receiving reservoir. Ash and peat samples obtained following the wildfire were analysed for total elemental concentration and leaching potential. We calculated ash loads at different burn severities and hillslope erosion was monitored through a series of sediment fences. Heavy metal concentrations in five rainstorm runoff events were measured at the stream outlet of a small catchment within the burn perimeter in the year following the wildfire.

Both ash and peat samples had elevated total heavy metal concentrations, which varied spatially across the study site. The spatial variability was partly associated with different burn severities and ash loads. In extreme burn severity areas, ash loads reached nearly 40 t ha-1 and Pb concentrations in ash, for example, were as high as 2650 µg g-1, indicating particularly high potential for contamination of water sources. Conversely, the maximum concentration of dissolved heavy metals in the stream-flow were much lower during the initial post-wildfire storm events (Pb 0.77 µg g-1; Zn 38.67 µg g-1; Cu 5.05 µg g-1; Ni 0.26 µg g-1).

The low solubility of heavy metals in both ash and peat samples likely constrains mobilisation by dissolution during storm events, suggesting low acute risk to drinking water quality post-wildfire. Instead, we hypothesise that metals likely remain bound to peat and ash particles, and are subsequently transported downstream in particulate form. Further quantification of heavy metals in sediment cores from sink zones will test if the metal contaminants pose a future chronic threat to drinking water quality.

How to cite: Marcotte, A. L., Limpens, J., Shuttleworth, E. L., Clay, G., Nunes, J. P., Santín, C., Doer, S. H., Neris, J., Warburton, J., Chiverrell, R. C., and Kettridge, N.: After the flames: Post-wildfire heavy metal mobilisation in a contaminated temperate peatland, EGU General Assembly 2024, Vienna, Austria, 14–19 Apr 2024, EGU24-562, https://doi.org/10.5194/egusphere-egu24-562, 2024.

EGU24-2007 | ECS | Orals | HS10.3

Modelling post-restoration spatiotemporal changes in peatland water table with optical satellite imagery 

Aleksi Isoaho, Lauri Ikkala, Lassi Päkkilä, Hannu Marttila, Santtu Kareksela, and Aleksi Räsänen

Remote sensing (RS) has been suggested as a tool for peatland monitoring. However, there have been only a few studies in which post-restoration hydrological changes have been quantified with RS-based modelling. To address this gap, we developed an approach to assess post-restoration spatiotemporal changes in the peatland water table (WT) with optical Sentinel-2 and Landsat imagery. We tested the approach in eleven northern boreal peatlands (six restored, and five control sites) impacted by forestry drainage in northern Finland using Google Earth Engine cloud computing capabilities. We constructed a random forest regression model with spatiotemporal field-measured WT data as a dependent variable and satellite imagery features as independent variables. To assess the spatiotemporal changes, we constructed representative maps for situations before and after restoration, separately for early summer wet and midsummer dry conditions. To further quantify temporal changes during 2013–2023, and to test statistical significance of restoration, we conducted a bootstrap hypothesis test for the areas near the restoration measures and similar areas in the control sites. The regression model had a relatively good fit and explanatory capacity (R2 = 0.61, RMSE = 6.98 cm). The WT maps showed that the post-restoration changes were not uniform and concentrated near the restoration measures. The bootstrap test showed that the WT increased more in the restored areas (5.8–9.4 cm) than in the control areas (0.1–4.5 cm). Our results indicate that restoration impact on surface hydrology can be quantified with optical satellite imagery and a machine learning approach in treeless peatlands.

How to cite: Isoaho, A., Ikkala, L., Päkkilä, L., Marttila, H., Kareksela, S., and Räsänen, A.: Modelling post-restoration spatiotemporal changes in peatland water table with optical satellite imagery, EGU General Assembly 2024, Vienna, Austria, 14–19 Apr 2024, EGU24-2007, https://doi.org/10.5194/egusphere-egu24-2007, 2024.

EGU24-2388 | ECS | Orals | HS10.3 | Highlight

Harmful effluents from a degraded peatland catchment following rainstorms 

Lipe Renato Dantas Mendes, Catharine Pschenyckyj, Behzad Mozafari, Michael Bruen, Fiachra O'Loughlin, and Florence Renou-Wilson

Peatlands are a large store of carbon and nutrients. In Ireland, these cover 21% of the country’s area and have been extensively drained mainly for peat extraction (both industrial and domestic). This has intensified decomposition and water flow from peat-dominated catchments. Consequently, there has been an increase in the discharge of harmful contaminants downstream that may violate the EU Water Framework Directive requirements for good ecological status of surface waters, and ultimately disturb aquatic ecosystems. Climate variations also affect the water quality by mediating the release of nutrients and modifying flows. Mitigation measures that overcome the resulting regulatory, ecological and climate challenges are warranted. For industrial peat extraction in Ireland, ponds have been excavated at the edge-of-field to provide treatment of outflows. However, little is known about the dynamics of the contaminants, and the efficiency of currently implemented measures.

We hypothesize that the quality of water from degraded peatland catchments is highly dynamic and is harmful to surface waters all year round. Prolonging the hydraulic retention time on site with ponds is not sufficient for good treatment due to high proportion of soluble nutrients and unfavorable biogeochemical conditions. We show this with an experiment at the edge of an Irish degraded raised bog subjected to peat extraction where a drainage network allowed water to flow through ponds at the edge-of-field. A monitoring station was installed at the outlet with an automatic sampler which captured water samples during 14 storm events. Moreover, a one-year grab sampling campaign was conducted at the pond inlet and outlet. The samples were analysed for pH, electrical conductivity, and nutrient and ion concentrations. The station also directly measured water quality parameters and flow, for one and a half years. Both meters were then moved to the pond inlet for another year while a flow was monitored at the pond outlet. The amount of sediment deposited in the pond was estimated by counting the number of filled excavator buckets to clean it and then accounting for sediment moisture.

Nutrients in effluents were mostly in soluble forms and varied greatly between storm events. These were particularly high at low flows suggesting a dilution effect. Large nutrient exports occurred only momentarily during extreme high flows. All water quality parameters varied widely throughout the seasons showing significant differences (p < 0.05). pH, nitrate and total ammonia often exceeded environmental water quality standards. Flow and temperature significantly explained the variability of nearly all water quality parameters, and temperature had a greater effect. These had inverse (generally monotonic) and direct (generally linear) relationships, respectively, with water quality parameters, except that flow was directly and linearly related to turbidity. Therefore, warm periods appear to produce nutrient and ion-rich effluents, whereas cold and rainy periods appear to produce acidic and turbid effluents. The dissolved water quality at the pond outlet was similar to the inlet indicating minimal treatment by the pond. However, it retained around 23 L of sediment per day. The results corroborate our hypotheses highlighting the need for more appropriate mitigation measures.

How to cite: Dantas Mendes, L. R., Pschenyckyj, C., Mozafari, B., Bruen, M., O'Loughlin, F., and Renou-Wilson, F.: Harmful effluents from a degraded peatland catchment following rainstorms, EGU General Assembly 2024, Vienna, Austria, 14–19 Apr 2024, EGU24-2388, https://doi.org/10.5194/egusphere-egu24-2388, 2024.

EGU24-3993 | ECS | Orals | HS10.3

Integrated hydrological modelling for predicting spatiotemporal variability of water table depths in Danish peatlands 

Tanja Denager, Raphael Schneider, Thea Quistgaard, Jesper Riis Christiansen, Peter L. Langen, and Simon Stisen

It is well known that artificially drained peatlands are net greenhouse gas (GHG) sources to the atmosphere. In peatlands, the depth of the groundwater table i.e. the water table depth (WTD), is an important driver of carbon dioxide (CO2) and methane (CH4) emissions.

Integrated hydrological models simulating transient unsaturated and saturated subsurface flow in peatlands, allow mapping of the spatiotemporal variability of WTD and thereby the impact on GHG on daily, seasonal, and inter-annual timescales. Thereby, hydrological modelling of peatlands has the potential to assist more accurate estimates of GHG emissions compared to the simple default IPCC emission factors and/or long-term average WTD estimates used in prevalent national GHG inventories.

Here we apply physically-based 3D modelling of the WTD to a highly monitored peatland, as a case-study representing common drained and degraded peatland soils in Denmark. The catchment scale model is based on an advancement of the National Hydrological Model of Denmark running in the numerical simulation tool MIKE-SHE/MIKE-Hydro.

We identify the main processes governing peatland WTD dynamics in the model and develop a novel parameter calibration scheme focusing on WTD dynamics. We use objective functions tailored to timeseries of WTD by combining individual components of a modified version of the Kling-Gupta Efficient (KGE) with low- and highpass filters to separate the WTD signal into seasonal patterns and short-term precipitation responses. Using the Pareto Archived Dynamically Dimensioned Search (PADDS) algorithm to obtain the pareto front enables post-weighting of objective functions for optimal tradeoff analysis. The model is calibrated at 100m scale and a forward run with the optimal parameter values demonstrate mapping of WTD dynamics and statistics for potential use in GHG inventories at 20m scale.

Those achievements will lead to more robust representation of peatland hydrology in hydrological models and will facilitate analysis of hotspots and hot moments in GHG emissions and enable scenario-based analysis of climate change and management impacts on WTD dynamics in peatlands. This will support the Danish rewetting strategies and better upscaling of GHG emissions for the national inventories.

How to cite: Denager, T., Schneider, R., Quistgaard, T., Riis Christiansen, J., L. Langen, P., and Stisen, S.: Integrated hydrological modelling for predicting spatiotemporal variability of water table depths in Danish peatlands, EGU General Assembly 2024, Vienna, Austria, 14–19 Apr 2024, EGU24-3993, https://doi.org/10.5194/egusphere-egu24-3993, 2024.

EGU24-4250 | ECS | Posters on site | HS10.3

Hydrology in differently drained agricultural peatlands in Norway  

Miyuru Gunathilake, Mounir Takiriti, Hannu Marttilla, Synnøve Rivedal, and Bjørn Kløve

High water content and poor trafficability are typical challenges of cultivation on peatlands. Draining of peatlands is necessary for cultivation which results in peat degradation and emission of Green House Gases (GHGs). The primary aim of this ongoing study is to understand the hydrology of “peat inversion” used as an alternative to other drainage systems in Norway. In the peat inversion method, the mineral soil layer underlying the peat soil is excavated and placed on top of the peat to provide a cover layer to limit further decomposition of peat and GHG emissions. To better understand drainage effects on hydrology, Carbon balances and GHG emissions in agricultural peatlands in Norway, we study different drainage systems located in different climatic settings. Water table behavior and the relationship with precipitation is investigated at four cultivated peatland sites: Farstad (Western Norway, wet, mild climates), Våler (Southeast Norway, dry, cold winter dominated), Sortland (Northwest Norway, mild climate), Pasvik (Northern Norway, dry, cold winter dominated). Different drainage settings including pipe drainage, surface grading and peat inversion exist in these fields.

How to cite: Gunathilake, M., Takiriti, M., Marttilla, H., Rivedal, S., and Kløve, B.: Hydrology in differently drained agricultural peatlands in Norway , EGU General Assembly 2024, Vienna, Austria, 14–19 Apr 2024, EGU24-4250, https://doi.org/10.5194/egusphere-egu24-4250, 2024.

EGU24-4331 | Orals | HS10.3

Evaluating the thermal effects of peatland restoration using UAV monitoring 

Jakub Langhammer, Theodora Lendzioch, and Oleksandr Hordiienko

Mid-latitude montane peatlands have undergone extensive anthropogenic modifications in past decades. Projects aimed at their restoration represent critical ecological interventions, reinstating their hydrological regime, preserving biodiversity, and mitigating the effects of climate change.

This research aims to investigate the effect of mid-latitude montane peatland restoration on the responses in land surface temperature (LST) and wetness using multispectral and thermal UAVs supported by instrumental monitoring. We aimed to test the hypothesis that peatland restoration should have a cooling effect on LST due to increased wetness, enhanced evapotranspiration, and latent heat flux.

Multispectral and thermal UAV monitoring, coupled with in-situ instrumental monitoring, was used to acquire data on spatial, quantitative, and qualitative changes in peatland response to restoration aimed at plugging the drains built in the past decades. In particular, we investigated: (i) the change in total surface water extent after peatland restoration, (ii) the LST response of restoration dikes, and (iii) the distribution of LST in restored peatlands.

The study was conducted in the montane peat bog of Rokytka in the Šumava Mountains, one of Central Europe's largest montane peatland complexes. The monitoring covered the vegetation seasons from 2018 to 2023, a period of extensive restoration activities in the peatland headwaters, allowing assessment of both pre-and post-restoration conditions.

The very high spatial resolution of the spatial data allowed us to analyze changes in peatland area in terms of canopy structure, wetness, and thermal response. The results showed a significant expansion of the waterlogged surface of the peatland due to the clogging of the former drains. However, the land surface temperature analysis indicates that the newly constructed dike systems have only a limited cooling effect compared to the thermal regime of the natural peatland vegetation. Furthermore, the analysis of new and old dike systems showed a continuous decrease of their positive effect.

The study proved that UAV monitoring is a unique monitoring technique that allows obtaining objective information on the thermal effects of peatland restoration, separating their effects from the properties of the surrounding environment, and objectively assessing their impact on the peatland thermal regime.

How to cite: Langhammer, J., Lendzioch, T., and Hordiienko, O.: Evaluating the thermal effects of peatland restoration using UAV monitoring, EGU General Assembly 2024, Vienna, Austria, 14–19 Apr 2024, EGU24-4331, https://doi.org/10.5194/egusphere-egu24-4331, 2024.

EGU24-4553 | ECS | Posters on site | HS10.3

The Effect of Underground Pipe Drainage and Consequent Site Restoration by Drainage Inactivation on the Ability of Soils to Retain Water. 

Jimmy Clifford Oppong, Jana Macháčková, and Jan Frouz

Drainage is often used to increase agriculture production, but it has adverse effects on biodiversity and water retention. Here, the effect of
subsurface pipe drainage on peat meadows near Senotín (Czechia), which were drained from the mid-1980s to 1990s, was studied. Attempts
were made to restore the peat meadows by damming drainage pipes using clay-filled trenches in 1996. In this case study, the effect on the
depth of the water table, soil water retention, infiltration, and soil temperature were recorded. Measurements of the original peat meadow
(undrained site), drained meadow (drained site), and restored meadow (restored site) before restoration and two decades after restoration
were recorded. The water table in undrained areas was higher than at drained and restored sites, indicating that drainage had a lasting effect
on drained and restored sites. Infiltration was lowest at the undrained site, greater at the drained site, and highest at the restored sites. Field
water capacity was lowest at the restored site, greater at the drained site, and highest at the undrained site. Soil water content at maximum
saturation was lowest at the restored site, greater at the drained site, and highest at the undrained site. Soil temperature was highest at the
restored site with no significant difference between the undrained and drained sites. Soil moisture levels were highest at the undrained site
and lowest at the drained site. In addition, the undrained and restored sites did not differ significantly in soil moisture content. In conclusion,
restoration did not have a significant effect on the level of the water table, initiation of peat formation, or ability of soil to hold water.

How to cite: Oppong, J. C., Macháčková, J., and Frouz, J.: The Effect of Underground Pipe Drainage and Consequent Site Restoration by Drainage Inactivation on the Ability of Soils to Retain Water., EGU General Assembly 2024, Vienna, Austria, 14–19 Apr 2024, EGU24-4553, https://doi.org/10.5194/egusphere-egu24-4553, 2024.

EGU24-5026 | ECS | Posters on site | HS10.3

Drop penetration dynamics of rhamnolipid biosurfactant on peat 

ReddyPrasanna Duggireddy and Gilboa Arye

Peat and peat-based growing media continue to serve as the major constituents in soil-less cultivation due to their favorable physical and hydraulic characteristics. However, the substrate’s inherent high organic nature, and the intensive dehydration  process employed to compact peat into bales for cost effective transportation , results in the substrate development of water repellency. Consequently, this alters the media's optimal physical and hydraulic characteristics and reducing productivity in cultivation systems. Efforts to ameliorate substrate water repellency have predominantly involved the application of wetting agents, primarily focusing on their effect on various plant growth parameters. Synthetic surfactants were proposed to treat the substrate’s water repellency, but given the environmental concerns, alternative strategies become imperative. Biosurfactants, particularly rhamnolipids, have emerged as intriguing compounds at the scientific and commercial levels. Nonetheless, comprehensive quantitative investigations on the rate and extent of wetting and spreading behaviors of aqueous biosurfactant solutions which is essential for understanding drop penetration dynamics on peat, are currently inadequate. In this regard, the main objective of this study is to quantify the drop penetration dynamics of biosurfactants on peat porous substrate under different initial moisture conditions and on peat pellet compressed at different pressures to account for different densities and surface roughness. The study involved measurements of contact angle (CA), drop height, base diameter, and volume of aqueous biosurfactant solutions on prewetted peat with water and biosurfactant and peat pellets using optical tensiometer (OCA-15, Data Physics, Germany). The results demonstrate the relative degree of water repellency with the droplet dynamics of water exhibiting a CA of ~1200 and relatively constant drop height and base diameter. Conversely, biosurfactant droplets reduced drop height and volume, and the CA of 1200-800 was dependent on prewetting conditions. Furthermore, drop penetration dynamics into pellet peat highlighted the role of surface roughness with higher CA at lower compression pressure (69 bars) relative to higher one (517 bars). Furthermore, the study revealed a pronounced dependence on biosurfactant solution surface tension (ϒlv), with negligible CA changes within the higher ϒlv ( from 72 down to 41mN/m) domain and significant alterations within the lower ϒlv (down to 33 mN/m) domain. These outcomes underscore the effectiveness of rhamnolipid biosurfactant in aiding drop infiltration into initially hydrophobic peat, implying its role in aiding to peat wettability.

Keywords: Peat, Pellets, water repellency, contact angle, surface tension, rhamnolipid biosurfactant, droplet dynamics.

How to cite: Duggireddy, R. and Arye, G.: Drop penetration dynamics of rhamnolipid biosurfactant on peat, EGU General Assembly 2024, Vienna, Austria, 14–19 Apr 2024, EGU24-5026, https://doi.org/10.5194/egusphere-egu24-5026, 2024.

EGU24-5066 | ECS | Posters on site | HS10.3

Soil Shrinkage Characteristics of Peat and Other Organic Soils  

Ronny Seidel, Ullrich Dettmann, and Bärbel Tiemeyer

Shrinkage is the volume reduction of a soil due to desiccation and decreasing pore pressure. This is important for the determination of volume based physical and hydraulic soil properties in the laboratory e.g., bulk density, volumetric moisture and water retention functions. Furthermore, it leads to changing surface elevation and crack formation at the field scale.

There are two types of shrinking soils, clayey soils and organic soils, which are defined here as soils having a soil organic carbon content (SOC) above 7.5%. Clayey and organic soils differ strongly in their shrinkage behavior.  Furthermore, only few shrinkage studies differentiate between different organic soils. Parameters of existing shrinkage models are fully empiric and not directly linked to soil properties as dry bulk density, SOC, botanical composition and degree of decomposition.

To determine the soil shrinkage characteristics (SSC i.e., relationship between moisture ratio and void ratio) of a variety of organic soils, we determined sample volumes with a three-dimensional (3D) structured light scanner at different moisture states from full saturation to dryness. We sampled 33 horizons (n = 4 replicates each) covering a wide range of botanical composition, development stages and degree of decompositions. Desiccation was performed by suction plates up to pressure heads of -200 hPa, followed by evaporation and oven-drying at 105°C. Volume and height of the 3D models created this way were determined by 3D graphic software and R, respectively. The volumetric moisture was determined by weighing the sample before and after scanning. Afterwards, volume and volumetric moisture were converted to moisture ratio and void ratio with the volume of solid particles. Due to small differences in particle volume between the replicates, both, moisture and void ratio were normalized by dividing them by the value at saturation. This normalization led to congruent results for the replicates.

The shape of the SSCs strongly depended on the botanical composition and degree of decomposition. Peat consisting of slightly decomposed Sphagnum remains showed a supernormal shrinkage phase, i.e., volume reduction exceeds lost water volume at the dry end of the SSC and a relatively large range where volume reduction is (much) smaller than lost water volume, i.e., subnormal or structural shrinkage phase, at the wet end. The latter behavior was also shown by amorphous top soils. With increasing degree of decomposition or complete absence of Sphagnum remains the SSC flattened and tended to show a (near-) normal shrinkage phase, i.e., volume reduction equals lost water volume.

The results showed that rigid Sphagnum remains strongly influence the shrinkage behavior of organic soils by stabilizing the matrix during desiccation until the large pores collapse rapidly when soil moisture and tension undercut a certain level. The SSC of organic soils without rigid fibers were more similar to SSCs of clayey soils.

How to cite: Seidel, R., Dettmann, U., and Tiemeyer, B.: Soil Shrinkage Characteristics of Peat and Other Organic Soils , EGU General Assembly 2024, Vienna, Austria, 14–19 Apr 2024, EGU24-5066, https://doi.org/10.5194/egusphere-egu24-5066, 2024.

Peatlands have a major role in the global carbon cycle. While the gaseous export of carbon from peatlands has already been well-recognized, the dissolved organic carbon (DOC) fraction has not been equally noticed. Despite covering a small area (less than 3%), peatlands contribute from 12% to 20% of the DOC being released to oceans. The DOC dynamics in streams draining peatlands are highly variable, both on seasonal and event scales, and the corresponding drivers are still under discussion, particularly differing between disturbed and pristine peatlands. The objective of this study is to determine the DOC dynamics at the outlet of a rewetted coastal peatland and assess the effects of discharge and salinity. The study area is the nature reserve “Heiligensee and Hütelmoor” on the German Baltic Sea coast with an area of 350 ha. Here, high-frequency time series of discharge and DOC concentrations (complemented with regular samplings) are measured at the drainage/ditch system outlet, and consequently, the DOC export is calculated. According to the results, DOC concentrations demonstrate a seasonal trend and seem to be diluted during higher discharges by rainfall. However, they show no evident correlation with salinity. Moreover, the high‑frequency DOC concentrations, although available only for a limited period, indicate high variabilities following rainfall/discharge events. The discharge exhibits seasonal variabilities with an increase throughout winter, and then, a continuous decrease, and is highly responsive to rainfall events. The DOC exports are strongly linked with the discharge and thus show a similar pattern with the highest values in winter and spring. Our results highlight the necessity of high-frequency fluvial DOC monitoring with respect to extreme flow events in rewetted peatlands and a deeper investigation of the hydroclimatological controls through time-series/statistical analyses. This could provide valuable insights into mitigating excessive DOC export from rewetted peatlands.

How to cite: Meidani, H. and Janssen, M.: Temporal Dynamics of Dissolved Organic Carbon at the Outlet of a Rewetted Coastal Peatland, EGU General Assembly 2024, Vienna, Austria, 14–19 Apr 2024, EGU24-6071, https://doi.org/10.5194/egusphere-egu24-6071, 2024.

EGU24-7097 | ECS | Posters on site | HS10.3

Hydrological dynamics of a Northern cultivated peatland and implications for management 

Tung Pham, Hannu Marttila, Maarit Liimatainen, Timo Lötjönen, Jarkko Kekkonen, Miika Läpikivi, and Bjørn Kløve

Cultivated peatlands play a significant role in grass and dairy production, particularly in Northern regions. However, agricultural activities on these organic soils often lead to undesirable environmental effects, namely increased nutrient leaching and greenhouse gas (GHG) emissions. The hydrological characteristics and dynamics of cultivated peatlands significantly influence the formation of leachable nutrients and GHGs. Currently, there is a gap in the comprehensive understanding of hydrological responses in these cultivated areas. To address this gap, the NorPeat research platform at Ruukki research station, managed by the Natural Resources Institute Finland (Luke), has been established in Northern Ostrobothnia, Finland. The site features varying peat thickness (10-80 cm) over a mineral subsoil and a subsurface drainage system consisting of perforated pipes installed within the mineral layer at a depth of 120-130 cm from the surface. Continuous hydrological monitoring of key parameters such as groundwater table, soil moisture, drainage discharge, precipitation, and soil temperature has been ongoing on the platform since 2016. In this study, we focus on the dynamics of the groundwater table and soil moisture in response to seasonal variations, soil structure, and land management; to establish a comprehensive water balance quantifying water fluxes (evapotranspiration, drain flow, overland flow) to the adjacent stream; and to develop a hydrological conceptual model of the field. The outcomes of this research are expected to improve our understanding of cultivated peatland hydrology, inform future studies on environmental impacts, and provide valuable data for both farmers and policymakers.

How to cite: Pham, T., Marttila, H., Liimatainen, M., Lötjönen, T., Kekkonen, J., Läpikivi, M., and Kløve, B.: Hydrological dynamics of a Northern cultivated peatland and implications for management, EGU General Assembly 2024, Vienna, Austria, 14–19 Apr 2024, EGU24-7097, https://doi.org/10.5194/egusphere-egu24-7097, 2024.

EGU24-8124 | Orals | HS10.3

Physical parameters of peat and other organic soils can be derived from properties described in the field 

Ullrich Dettmann, Bärbel Tiemeyer, Sebastian Heller, Arndt Piayda, Bernd Schemschat, and Stefan Frank

Knowledge about the bulk density and porosity of peat and other organic soils is of major importance, as both parameters directly or indirectly effect hydrological conditions (e.g., soil moisture, water level fluctuation), soil physical processes (e.g., shrinkage, swelling, subsidence) and biological processes (e.g., peat mineralization, peat growth). The agricultural usability (e.g., trafficability, plant growth, yield) and the rewetting and oscillation capacity of peatlands also strongly depend on soil hydraulic properties and, thus, on bulk density and porosity. Additionally, knowledge of bulk density is necessary to convert concentrations (e.g., soil organic carbon content) into volume-related quantities. Bulk density and porosity depend on the botanical origin of the peat, the degree of decomposition and other pedogenetic processes. These soil characteristics can be identified directly during soil examinations in the field. In contrast, the determination of bulk density and porosity requires volume-based sampling and subsequent laboratory analyses.

Here, we present pedotransfer functions for peat and other organic soils to derive bulk density and porosity using random forest models. Based on a dataset from approximately 600 horizons from 100 peatland sites in Germany and other European countries, we built a set of different pedotransfer functions combining predictor variables determined in the field. These included the degree of decomposition, peat type (e.g., Sphagnum peat, Carex peat, amorphous peat), horizon characteristics (e.g., aggregated, oxidized, permanently saturated, ploughed), average horizon depth, rooting intensity (no roots to extremely dense, estimated from root proportion per cm²), admixture of mineral compounds and the occurrence of carbonate (estimated using 10% hydrochloric acid). Further pedotransfer functions were built, using soil organic carbon content as an additional predictor variable.

The results show that bulk density and porosity can be predicted using only a few predictor variables (3-7) with a low bias and high coefficient of determination. Adding soil organic carbon content as an additional predictor variable further improved the pedotransfer functions. Depending on the combination of the predictor variables, root mean square errors (5-fold cross validation) varied between 0.069 to 0.099 g cm-3 for the bulk density and 3.8 to 4.7% for the porosity pedotransfer functions.

How to cite: Dettmann, U., Tiemeyer, B., Heller, S., Piayda, A., Schemschat, B., and Frank, S.: Physical parameters of peat and other organic soils can be derived from properties described in the field, EGU General Assembly 2024, Vienna, Austria, 14–19 Apr 2024, EGU24-8124, https://doi.org/10.5194/egusphere-egu24-8124, 2024.

EGU24-11745 | ECS | Posters on site | HS10.3

High-Resolution Monitoring of Eco-hydrological Changes Following Rewetting of European Peatlands – Bridging Earth Observation and Restoration Practices 

Laura Giese, Marvin Renken, Marvin Ludwig, Anna Bartel, Jan Lehmann, Klaus-Holger Knorr, and Hanna Meyer

In Europe, approximately 52 % of former peatland area is strongly degraded due to human exploitation. This makes the EU the worlds’ second largest emitter of greenhouse gases from drained peatlands. Rewetting of drained peatland sites has therefore a great climate change mitigation potential, as net greenhouse gas emissions can be strongly reduced in the long term. To assess the success of rewetting actions, there is a strong demand for cost-effective and unified monitoring techniques. With the aid of cloud-based remote sensing, the field of earth observation has quickly improved in terms of data accessability and handling, which facilitates the development of individual open-access solutions for environmental monitoring, and may therefore provide suitable tools to monitor peatland rewetting.

We developed a tool to assess the status and changes of peatlands in terms of vegetation and moisture conditions. Therefore, time-series of vegetation and moisture indices (such as NDVI, NDWI) based on freely available satellite data (such as Landsat) were compiled, which provide spatially and temporally continuous information on changes in peatland ecosystems for the last decades.
Anomalies were calculated with reference to the known pre-rewetting time period of selected peatlands, and pre- and post-rewetting trends were analyzed. This provides a spatio-temporal overview of eco-hydrologic changes at individual user-defined peatland sites, which allows deriving information even for remote locations and inaccessable or protected areas. In this contribution we exemplary focus on a rewetted peatland in Northwestern Germany (Neustaedter Moor) for which we could show a clear signal in NDWI anomalies following a rewetting measure in 2013, indicating that these measures have indeed been effective.

We intend to test the application further at multiple sites in cooperation with practitioners and to assess the analysis by comparing results to field-specific data. The fully automatized multi-index approach is provided as a web-based application, which can be used to summarize and compare the advances in peatland restoration at continental scale also in the future. We aim to provide opportunities for new insights by creating synergies between earth observation and restoration practice in European Peatlands.

This research was funded through the 2020-2021 Biodiversa+ and Water JPI joint call for research projects, under the BiodivRestore ERA-NET Cofund (GA N°101003777), with the EU and the funding organisations DFG (Germany), FWF (Austria), NSC (Poland) and the LNV (The Netherlands)

How to cite: Giese, L., Renken, M., Ludwig, M., Bartel, A., Lehmann, J., Knorr, K.-H., and Meyer, H.: High-Resolution Monitoring of Eco-hydrological Changes Following Rewetting of European Peatlands – Bridging Earth Observation and Restoration Practices, EGU General Assembly 2024, Vienna, Austria, 14–19 Apr 2024, EGU24-11745, https://doi.org/10.5194/egusphere-egu24-11745, 2024.

EGU24-11756 | ECS | Orals | HS10.3

Integrating Microtopography and Vegetation Influences: A Landscape-Level Approach to Estimating CO2 Emissions in Tropical Peatlands 

Rasis Putra Ritonga, Adibtya Asyhari, Jennifer C. Bowen, Gusti Z. Anshari, Adi Gangga, Eko Yuono, and Nisa Novita

Groundwater level (GWL) and soil temperature are critical parameters for estimating CO2 emissions from tropical peatlands. However, scaling CO2 emissions to the landscape level remains challenging because of the heterogeneity of canopy coverage on different land use types that influence soil temperature and the irregularity of peat surface microtopography that regulates water accumulation and drainage. This study aims to address this gap by (1) capturing high-frequency measurements of GWL and soil temperature under varying vegetation canopy covers and microtopographic conditions within the same land use type, and (2) using those measurements along with remote sensing approaches to model CO2 emissions at landscape level. This work was carried out in a secondary swamp forest (SF) and an oil palm (OP) site in Anjongan Dalam Village, Mempawah, West Kalimantan, Indonesia.  These sites were selected as they represent the predominant land use types in the country’s peatlands. Solinst Levelogger® 5 were installed along with custom-made multi-depth soil temperature sensors at six locations within each site that accounted for varying canopy covers (sparse and dense) in both land use types. To establish a GHG baseline model, we also conducted biweekly monitoring of soil CO2 flux using LiCOR LI-7810 Trace Gas Analyzer in both land use types.

In the first-quarter of our measurements (September-December 2023), we made three central observations. Firstly, all twelve plots exhibited similar GWL fluctuation patterns in response to wet and inter-storm (no rain) periods, but the magnitude of these fluctuations varied within measurement points in SF and OP (max. discrepancy = 18.6 and 38.5 cm, respectively). LiDAR observations revealed that microtopography controlled these water levels, suggesting that elevation variations influence the magnitude of GWL. Secondly, a comparison of daytime soil temperatures between sparse and dense canopy cover within each land use type revealed differing magnitudes: sparse vegetation areas, likely due to more open canopies, registered significantly higher near surface soil temperatures for SF (mean = 27.3 and 26.8 °C) and OP (mean = 29.6 and 29.4 °C; p-value < 0.01). Thirdly, our findings imply GWL and soil temperature in SF (R2 = 0.66 and 0.32) and OP (R2 = 0.61 and 0.65, respectively) significantly influence CO2 emissions. Taken together, these three observations demonstrate how variations in GWL and soil temperature within the same land use may lead to considerable shifts in the resulting CO2 emission factors. Still, continued monitoring during the dry season is crucial to further elucidate the impacts of microtopography and vegetation cover on CO2 emissions. The next phase of our research will be focusing on developing our landscape-level GHG model that will incorporate microtopography and canopy covers. Integrating our distributed ground monitoring data with spatiotemporal remote sensing information will be pivotal in introducing new methodology for improving emission factors for other peatlands following our environmental settings.

How to cite: Ritonga, R. P., Asyhari, A., Bowen, J. C., Anshari, G. Z., Gangga, A., Yuono, E., and Novita, N.: Integrating Microtopography and Vegetation Influences: A Landscape-Level Approach to Estimating CO2 Emissions in Tropical Peatlands, EGU General Assembly 2024, Vienna, Austria, 14–19 Apr 2024, EGU24-11756, https://doi.org/10.5194/egusphere-egu24-11756, 2024.

EGU24-12338 | ECS | Posters on site | HS10.3

Dissolved Nutrients in Natural and Rewetted Peatlands: A Comparative Analysis 

Nimisha Krishnankutty, Bo Iversen, Goswin Heckrath, Hans Christian Hansen, and Dominik Zak

Intensive agriculture and artificial drainage have transformed natural peatlands into significant sources of greenhouse gas emissions as well as phosphorus and nitrogen pollution, the latter leading to an increased risk of eutrophication of adjacent water bodies. To address this issue and comply with the EU Water Framework Directive, restoring peatlands is a key strategy involving widespread rewetting to re-establish their roles as nutrient and carbon sinks. To achieve restoration objectives, it is essential to analyse and understand the temporal and spatial variability in porewater composition within natural and rewetted peatlands, with a specific focus on the influence of peatland type (bog or fen) and peat degradation status. Hence, an extensive international field survey of soil water and bulk soil was conducted from 1997 to 2017 on 60 natural and rewetted peatlands (both bogs and fens) in Germany, Poland, Estonia, Sweden, and the United Kingdom. The anoxic porewater samples were collected from water-saturated soil layers between 0 and 0.6 m depth. To quantify the concentrations of various chemical compounds in porewater at each location, at least three samples were taken using dialysis samplers within a spatial range of 5 to 10 meters. Selected sites were monitored for seasonal changes over a post-wetting period of 10 to 20 years. The results show significant differences in peat characteristics of upper soil layers from rewetted peatlands and natural peatlands, with the lowest values for nutrient contents, particularly in bogs. Notably, rewetted peatlands did not consistently display higher pore water concentrations of dissolved compounds compared to natural peatlands. However, in heavily drained and rewetted fens, anoxic pore waters exhibited concentrations of soluble reactive phosphorus (SRP), ammonium, and dissolved organic carbon one to two orders of magnitude higher than those in their natural counterparts. For example, SRP concentration in highly degraded peatlands ranged from 0.54 mg/L to 18.9 mg/L compared to 0.01 mg/L to and 3.6 mg/L in the natural peatlands. Weakly drained peatlands had, in some cases, slightly higher concentrations of dissolved substances compared to natural peatlands, but the differences were not statistically significant. Therefore, the research highlights the importance of porewater composition concerning the type of peatland, its degradation status, and spatial-temporal fluctuations in restored peatlands.

How to cite: Krishnankutty, N., Iversen, B., Heckrath, G., Hansen, H. C., and Zak, D.: Dissolved Nutrients in Natural and Rewetted Peatlands: A Comparative Analysis, EGU General Assembly 2024, Vienna, Austria, 14–19 Apr 2024, EGU24-12338, https://doi.org/10.5194/egusphere-egu24-12338, 2024.

EGU24-13481 | Posters on site | HS10.3

Impact of changing groundwater flow paths on CO2 and CH4 dynamics in the groundwater of temperate-to-arctic mires 

Anna Sieczko, Hanna Silvennoinen, Anders Lyngstad, Marta Stachowicz, Paweł Osuch, Robert Michałowski, Paweł Trandziuk, and Mateusz Grygoruk

Mires are one of the systems, which are highly affected by climate change. At the same time, they are main sources of greenhouse gases (GHG) such as methane (CH4) and carbon dioxide (CO2). Considering that hydrological patterns remain major factors affecting these emissions and they are likely to be affected by climate change, GHG fluxes may be altered as well. Whereas majority of the studies focused on direct GHG emissions from the peat or mire surface waters, less in known about the processes of groundwater flow especially in relation to transfer of GHG-rich groundwater to the mire ecosystems.

The main objective of this study was to assess how dynamics of CO2 and CH4 in groundwater of mires is likely to be affected due to changed paths of groundwater flow.

The study was conducted from May 2023 till October 2023 in four mires located along latitudinal gradient from subarctic Norway to temperate areas in Poland, which serve as examples of systems exposed to abrupt climate change. They include Nordic permafrost and bog-like systems in Norway through bog-lake system in Poland. The study used the set of gas piezometers (gas-equilibrators) located towards-to-lake transect, where concentrations of CO2 and CH4 were measured in vertical profiles (2 m, 1m, 0.1m). Simultaneously, water levels were measured with automatic pressure transducers in a 3-h interval. We also documented electric conductivity of groundwater along the transects in which the dynamics of CO2 and CH4 were assessed.

We determined the amounts of CO2 and CH4 transported by groundwater to the mires. Our results demonstrate high vertical and temporal variability of GHG concentrations in groundwater of mires, which has implications for determination of future carbon balance in such areas.  Additionally, our findings imply that groundwater is an important GHG source to the mire and need to be considered in the light of climate change as increasing sources of GHG into the atmosphere. Changes in groundwater flow caused by global warming (e.g., palsa mires decomposition, increase of evapotranspiration in temperate mires) can have significant influence on emissions of GHG in the future.

How to cite: Sieczko, A., Silvennoinen, H., Lyngstad, A., Stachowicz, M., Osuch, P., Michałowski, R., Trandziuk, P., and Grygoruk, M.: Impact of changing groundwater flow paths on CO2 and CH4 dynamics in the groundwater of temperate-to-arctic mires, EGU General Assembly 2024, Vienna, Austria, 14–19 Apr 2024, EGU24-13481, https://doi.org/10.5194/egusphere-egu24-13481, 2024.

EGU24-13729 | ECS | Posters on site | HS10.3

Modeling the Influence of Subsurface Geology on Northern Peatland Hydrology 

Victoria Niedzinski, Andrew Reeve, Lee Slater, and Xavier Comas

Peatlands are complex wetlands that play an important role in global carbon cycling as both carbon sinks and sources. They contain over one-third of all global soil carbon but cover <3% of all land surfaces. The hydrology of a peatland exerts a significant control on overall carbon cycling as the position of the water table directly impacts carbon sequestration and emission while circulation within the peat basin will influence nutrient availability. Hydro-geophysical studies of northern peatlands over the last two decades have identified the presence of eskers buried beneath some peat deposits in Maine. These studies have hypothesized that eskers drive vertical groundwater flow within these systems and may act as hotspots for methane emissions. However, only conceptual hydrologic models have been developed to support this claim. Using the results of these studies along with new hydrologic and geophysical datasets, a USGS MODFLOW 6, finite-difference groundwater flow model was developed for Caribou Bog near Bangor, ME. Caribou Bog is a multi-unit, ombrotrophic, domed bog with a patterned pool system. Groundwater flow simulations were run at regional and local scales by inserting a fine-scale model encompassing a single peat unit into a coarser-grid, watershed area. The PEST parameter estimation package was used to calibrate the model and MODPATH 7 was used to identify flow paths within the model. Simulation results show that these esker deposits enhance vertical flow through the peat and potentially connect the peatland to the regional aquifer system. These results challenge the traditional viewpoint that ombrotrophic peat systems in boreal regions are relatively disconnected from groundwater flow. Furthermore, they may provide insights into the spatial variability of carbon cycling within peatlands, particularly to assess hydrologic response caused by changing precipitation patterns and warming temperatures expected due to climate change.

How to cite: Niedzinski, V., Reeve, A., Slater, L., and Comas, X.: Modeling the Influence of Subsurface Geology on Northern Peatland Hydrology, EGU General Assembly 2024, Vienna, Austria, 14–19 Apr 2024, EGU24-13729, https://doi.org/10.5194/egusphere-egu24-13729, 2024.

EGU24-15862 | ECS | Posters on site | HS10.3

Can peatland restoration enhance drought and flood resilience in boreal forests? 

Sara Camiolo, Claudia Teutschbein, Gustaf Granath, and Thomas Grabs

Peatlands, unique wetlands where peat forms because waterlogging inhibits decomposing organisms, are predominantly found in the boreal region. In Sweden, nearly 18% of the land surface is covered by forested peatlands.  However, many of these areas have experienced severe anthropogenic disturbances in the 20th century. Drainage, a common practice to improve soil conditions for agriculture and forestry, along with commercial peat harvesting, has exerted considerable pressure on these ecosystems. In recent years, peatlands have been recognized for their value in climate-change mitigation, serving as crucial ecosystems that can store carbon and water. Peatland restoration, often referred to as rewetting, is considered an effective nature-based solution to reinstate hydrological, ecological, and biogeochemical conditions essential for various ecosystem services. Global and national policies actively promote peatland restoration, positioning it as a highly effective measure to build resilience against climate-change impacts. Following a series of extreme summers in Sweden, especially the mitigation of hydroclimatic extreme events, such as floods and droughts, is a widely claimed benefit. However, assessing the success of restoration efforts is difficult due to diverse hydroclimatic conditions, a wide range of catchment properties, long response times to restoration measures, and a limited number of long-term monitored restoration case studies. Specifically, restoration impacts on hydrological functioning, including water storage, flood control, groundwater recharge, and drought buffering, remain poorly understood. To strengthen the scientific basis and provide comprehensive insights for decision-makers, we conducted a literature review synthesizing existing empirical evidence on how rewetting boreal peatlands influences hydrological feedbacks. Our focus was particularly on the role of peatlands during drought and flood events, how their location and the time elapsed after restoration affects drought and flood vulnerability, and how peatlands themselves might be impacted by such extreme events. Our results represent a crucial initial step towards understanding the hydrological mechanisms regulating peatlands over time and under various hydroclimatic conditions, which is pivotal in guiding future conservation, rewetting and sustainable use of peatlands as nature-based solutions.

How to cite: Camiolo, S., Teutschbein, C., Granath, G., and Grabs, T.: Can peatland restoration enhance drought and flood resilience in boreal forests?, EGU General Assembly 2024, Vienna, Austria, 14–19 Apr 2024, EGU24-15862, https://doi.org/10.5194/egusphere-egu24-15862, 2024.

EGU24-16791 | Orals | HS10.3

Lessons learned from Hydrological Modelling of Northern Temperate Peatlands 

Fiachra O'Loughlin, Behzad Mozafari, Michael Bruen, Shane Donohue, and Florence Renou-Wilson

Hydrological modelling of peatlands requires capturing the complex interactions between overland and subsurface processes along with any anthropogenic impacts, such as artificial drainage for peat extraction and agriculture. To date there has been limited intercomparison studies evaluating the hydrological performance of multiple rainfall-runoff models. 

Here, we present the results of two different modelling comparison studies for three raised peatlands located in Ireland. These peatlands have all being heavily impacted by artificial drainage for peat extraction; however, peat extraction activities have halted, and one has been rewetted. The first study compares 47 conceptual rainfall-runoff models included in the MARRMoT toolbox at all three sites, while the second study uses a more process-based framework, SUMMA, to represent the different processes at a drained site with various model configurations.

Results from the first study show that there is a significant drop in the ability to simulate the rewetted peatland compared to the drained peatland sites. This study also indicate that the while no single model can outperform others, multi-model ensemble approaches offer better performances. The results from the SUMMA framework highlight the importance of representing the artificial drainage component in simulating the hydrology of drained peatlands. Performance increased significantly once we coded this component into the SUMMA framework.

How to cite: O'Loughlin, F., Mozafari, B., Bruen, M., Donohue, S., and Renou-Wilson, F.: Lessons learned from Hydrological Modelling of Northern Temperate Peatlands, EGU General Assembly 2024, Vienna, Austria, 14–19 Apr 2024, EGU24-16791, https://doi.org/10.5194/egusphere-egu24-16791, 2024.

EGU24-21369 | Posters on site | HS10.3 | Highlight

Climate and hydrology control apparent rates of peat accumulation across Europe 

Graeme T. Swindles, Donal J. Mullan, Neil T. Brannigan, Thomas G. Sim, Angela Gallego-Sala, Maarten Blaauw, Mariusz Lamentowicz Lamentowicz, Sophie M. Green, Thomas P. Roland, and Richard Fewster and the European peatland research group

Peat accumulates when there is a positive mass balance between plant productivity inputs and litter/peat decomposition losses. Here we examine apparent peat accumulation rates (aPAR) during the last two millennia from 28 well-dated European peatlands and find them to range between 0.005 and 0.448 cm yr-1 (mean = 0.118 cm yr-1). Our work provides important context for the commonplace assertion that peatlands accumulate at ~1mm per year. We find that relationships between aPAR and climatic variables are generally weak – summer temperature is the only significant climatic control on aPAR across our European sites. aPAR tends to be higher when water-table depth (reconstructed from testate-amoeba subfossils) is within 5-10 cm of the peatland surface. When a Generalized Additive Model and Gaussian Response Curve are fitted to the data, both methods show that the optimal water-table depth for highest aPAR is ~10 cm.  aPAR is generally lower when water table depths are <0 cm (standing water) or >25 cm, which may relate to a decrease in plant productivity and increased decomposition losses, respectively. These findings corroborate contemporary experimental studies which examined the relationship between peatland water-table depth, or the thickness of the aerobic surface layer (the ‘acrotelm’), and the rate of peat formation. Our work suggests that for European peat bogs, an average water-table depth of ~10 cm is optimal to enable rapid peat growth and therefore carbon sequestration in the long term. This has important implications for peatland restoration and rewetting strategies, in our global efforts to mitigate climate change.

How to cite: Swindles, G. T., Mullan, D. J., Brannigan, N. T., Sim, T. G., Gallego-Sala, A., Blaauw, M., Lamentowicz, M. L., Green, S. M., Roland, T. P., and Fewster, R. and the European peatland research group: Climate and hydrology control apparent rates of peat accumulation across Europe, EGU General Assembly 2024, Vienna, Austria, 14–19 Apr 2024, EGU24-21369, https://doi.org/10.5194/egusphere-egu24-21369, 2024.

EGU24-22192 | Orals | HS10.3

Hydrology, water chemistry and organic matter in peatland pools and headwater streams 

Cat Moody, Joseph Holden, Pippa Chapman, Nicholle Bell, Logan Mackay, and Ezra Kitson
 

Peatland pools that result from human activities (e.g. disturbance from building roads, or rewetting) have different hydrology to pools that have formed naturally. This impacts on biogeochemical processes within the pool. Studies of peatland pools in the Flow Country (Scotland, UK) showed artificial pools had a smaller surface area than natural pools, but natural pools were shallower and had less variable depth than artificial pools. During storm events, the artificial pools had a significantly larger response to rainfall input. The site with artificial peat pools had more variable water table depths within the peat than the site with natural pools. There were also differences in biogeochemistry between the natural and artificial pools: natural pools had lower organic carbon (OC) and dissolved CO2 concentration than artificial pools, and there was a higher carbon turnover in natural pools.

Similar to peatland pools, small headwater streams are hotspots for OC processing. In a study of 200 small peatland water bodies across the UK (headwaters, streams and pools, with catchment area less than 1 km2 and at least 70% peat cover), the mean dissolved OC (DOC) concentration was 24 mg C L-1 (95% CI: 21-27), but in pools, the mean DOC concentration was higher, 34 mg C L-1. Dissolved organic matter (DOM) elemental composition was also significantly different from pools, headwaters and small streams.

As a result of these studies, two samples of DOM (one from natural and one from an artificial pool) were analysed using FT-ICR MS. There were 11,424 molecular formulae identified in the two samples. There were 6,167 individual compounds in DOM from the artificial pool, of which 29% were unique to that pool (not found in the natural pool); there were 5,257 compounds in the natural pool DOM, of which 17% were unique to that pool. There were differences in structural indicators (e.g. double bond equivalent) and average size (e.g. m/z) of DOM compounds unique to each pool.

These studies have shown how catchment-scale peatland condition is detectable on the molecular level, causing differences in organic matter structure, which will have implications for carbon turnover, processing and transport, and GHG emissions from peatland water.

How to cite: Moody, C., Holden, J., Chapman, P., Bell, N., Mackay, L., and Kitson, E.: Hydrology, water chemistry and organic matter in peatland pools and headwater streams, EGU General Assembly 2024, Vienna, Austria, 14–19 Apr 2024, EGU24-22192, https://doi.org/10.5194/egusphere-egu24-22192, 2024.

EGU24-50 | Posters on site | HS10.5 | Highlight

Trace organic compounds in wastewater-loaded lowland River Erpe – Key findings from 12 years of research 

Jörg Lewandowski, Anja Höhne, Anna Jäger, Anna Lena Kronsbein, Karin Meinikmann, Birgit M. Müller, Malte Posselt, Christoph J. Reith, Jonas Schaper, Hanna Schulz, Maria Alejandra Villa Arroyave, Shai Arnon, Marcus A. Horn, Stefan Krause, James L. McCallum, Gunnar Nützmann, Anke Putschew, and Stephanie Spahr

Increasing concentrations of trace organic compounds (TrOCs) in water bodies worldwide are of great concern. In addition to a general load reduction and a better understanding of the ecotoxicological effects of TrOC cocktails, it is important to better understand the pathways and fate of this large group of compounds in the environment. The lowland River Erpe (Berlin/Brandenburg, Germany), which receives treated wastewater from an urban wastewater treatment plant, is an excellent site for such research, as TrOC concentrations are exceptionally high compared to other German rivers, allowing reliable process studies without much analytical effort such as prior enrichment steps of water samples. In addition, the river system offers a variety of reaches that differ in hydrology and streambed morphology, allowing for different types of investigations. Over the past 12 years, more than 100 researchers have been involved in several large and numerous smaller studies on the River Erpe. Topics have included the role of hyporheic zones in the self-purification capacity of streams with respect to TrOCs, seasonal changes, interactions between easily degradable organic matter and TrOC attenuation, the importance of identifying flow paths for understanding biogeochemical processes, the effects of management actions such as macrophyte removal on the fate of TrOCs, the effects of losing conditions on TrOC input to aquifers and bank filtration systems, the effects of discharge of treated effluent from a large new industrial site on river water composition, and the identification of microbial key players associated with TrOC removal, and much more. Ongoing research includes topics such as bioremediation, the effects of migrating bedforms on the fate of TrOCs, and the effects of droughts on water quality at bathing sites in the receiving River Spree. Research highlights and future directions are presented.

How to cite: Lewandowski, J., Höhne, A., Jäger, A., Kronsbein, A. L., Meinikmann, K., Müller, B. M., Posselt, M., Reith, C. J., Schaper, J., Schulz, H., Villa Arroyave, M. A., Arnon, S., Horn, M. A., Krause, S., McCallum, J. L., Nützmann, G., Putschew, A., and Spahr, S.: Trace organic compounds in wastewater-loaded lowland River Erpe – Key findings from 12 years of research, EGU General Assembly 2024, Vienna, Austria, 14–19 Apr 2024, EGU24-50, https://doi.org/10.5194/egusphere-egu24-50, 2024.

EGU24-1037 | ECS | Posters on site | HS10.5

On the value of slug tracer injections and the naturally occurring radon for observing hyporheic exchange 

Mortimer Bacher, Julian Klaus, Adam Ward, Jasmine Krause, Catalina Segura, and Clarissa Glaser

The exchange of stream water and groundwater (hyporheic exchange) plays an important role in hydrological and biogeochemical processes in rivers. Hyporheic flow comprises a distribution of subsurface flow paths characterized by distinct transit times and flow path lengths. Much of the previous research relied on the interpretation of slug tracer experiments that only capture a portion of the overall hyporheic exchange, given their relatively short (minutes to hours) duration. Therefore, there is a need to go beyond the characterization of shorter flow paths in hyporheic research to understand flow paths of the entire transit time distribution. We hypothesize that environmental tracers provide complementary information into longer hyporheic flow paths. Here we derive and compare commonly used transport metrics for hyporheic exchange derived from radon and slug tracer injections and aim to identify combinations of model parameters that predict the concentrations of both tracers along experimental stream reaches. For this purpose, we measured the environmental tracer radon (222Rn), that increases with time along hyporheic flow paths, at several stream sections along Oak Creek, Oregon (USA). We conducted slug tracer (sodium chloride) injections at the same stream sections. We employed a transient storage model that includes radon specific processes such as radioactive decay to ensure comparability in the information acquired on hyporheic exchange from radon and the typically applied slug tracer experiments. We calibrated final stream discharge and hyporheic exchange metrics through a global identifiability analysis and subsequently calculated relevant transport metrics using the refined parameters. Results with the field data will be obtained soon. Hence, this study will contribute to a more holistic understanding of hyporheic flow paths and related processes, such as the biogeochemical turnover processes in rivers.

How to cite: Bacher, M., Klaus, J., Ward, A., Krause, J., Segura, C., and Glaser, C.: On the value of slug tracer injections and the naturally occurring radon for observing hyporheic exchange, EGU General Assembly 2024, Vienna, Austria, 14–19 Apr 2024, EGU24-1037, https://doi.org/10.5194/egusphere-egu24-1037, 2024.

EGU24-1154 | ECS | Posters on site | HS10.5

Understanding Hyporheic exchange flows around a meandering section of pristine Himalayan headwaters 

P Kedarnath Reddy and Sumit Sen

River systems, such as the Himalayan, consist of three zones: source (high mountains, glaciers), transition (lower mountains, agriculture), and floodplain. About 800 million people in the highlands and Indo-Gangetic plains depend on the Himalayas, hence called the "Water towers of Asia," for freshwater (Kulkarni et al., 2021). While the transition zone contains lower mountains and sustains agricultural activities, the source zone has severe gradients, high peaks, and deep valleys (Nepal et al., 2014). Hence, it is imperative to understand the river systems. It is important to explore methods that have the potential to increase the water quality by inherent natural processes of lotic systems that can assimilate contaminants. One such process is Hyporheic exchange (HE). Keeping in mind the expenses associated with field testing and with the goal of facilitating the development of a deeper understanding over a greater spatial extent, a cost-effective approach is sought. Thus, my study aims to develop a preliminary understanding of hyporheic exchange in the pristine Himalayan headwaters over a meandering section of the Ringali gad stream flowing through the Mussoorie Wildlife Sanctuary. Wherein mini drive point piezometers were used to measure vertical hydraulic gradient (VHG) variations in response to rainfall events over a period of 30 days, and it is observed that the downwelling zones that were giving VHG values of around -0.1 also converted to upwelling zones with VHG values of around +0.1.

How to cite: Reddy, P. K. and Sen, S.: Understanding Hyporheic exchange flows around a meandering section of pristine Himalayan headwaters, EGU General Assembly 2024, Vienna, Austria, 14–19 Apr 2024, EGU24-1154, https://doi.org/10.5194/egusphere-egu24-1154, 2024.

EGU24-2581 | Posters on site | HS10.5

The Bredehoeft Problem: Verifying Accuracy of Linearized Salvage Evaluation in Water Table Aquifers due to Groundwater Pumping 

Vitaly Zlotnik, Avinoam Rabinovich, and Michael Cardiff

In water table aquifers, evapotranspiration can be reduced due to the groundwater pumping. These changes must be evaluated to assess how much water can be used for groundwater withdrawals. Although this salvage phenomenon was well understood a long time ago since pioneering studies of Theis and Bredehoeft, the models always applied numerical techniques to treat their non-linearity, most commonly using MODFLOW. However, in cases of limitations on watershed data properties, analytical methods were used successfully for practical evaluation of water balance components (e.g., stream depletion rates). Previously we made a breakthrough in solving the Bredehoeft problem analytically by linearization. This solution permits evaluating stream depletion and loss of storage in addition to salvage. Using compiled ranges of input parameters, the detailed analysis of solution using the COMSOL software indicates that linear approximation of the problem has good accuracy in practical ranges. Diagrams for evaluation of accuracy for broad ranges of parameters defining stream-aquifer connection and evapotranspiration are presented. Results can be used for analyses of the watershed water balances.

How to cite: Zlotnik, V., Rabinovich, A., and Cardiff, M.: The Bredehoeft Problem: Verifying Accuracy of Linearized Salvage Evaluation in Water Table Aquifers due to Groundwater Pumping, EGU General Assembly 2024, Vienna, Austria, 14–19 Apr 2024, EGU24-2581, https://doi.org/10.5194/egusphere-egu24-2581, 2024.

EGU24-4767 | ECS | Orals | HS10.5 | Highlight

Groundwater recharge from ephemeral rivers of the Canterbury Plains (New-Zealand): historical reconstruction using satellite imagery and environmental implications 

Antoine Di Ciacca, Maxime Brand, L. Guinevere Knight, and Patrick Durney

In numerous regions, surface water courses provide essential recharge to aquifers, particularly in times of increased aridity. In the Canterbury Plains (New Zealand), gravel-bed rivers are a major source of groundwater recharge to the aquifers, which are intensively pumped for irrigation but also sustain a number of groundwater-dependent ecosystems. Some of these rivers lose so much of their water to the underlying aquifers that they are ephemeral.

In this study, a recently developed method has been employed to estimate transmission losses in the upper Selwyn and Orari Rivers using the extensive Planet Monitoring satellite image collection (2010-2023). Using a simple linear modelling approach, we have converted the transmission losses to total groundwater recharge and extended the record to the 1980s. This dataset unveils historical variations in groundwater recharge from these rivers.

The findings indicate an average annual groundwater recharge of approximately 50 million m³/y from the upper Selwyn and about 183 million m³/y from the upper Orari. Notably, the influence of climate is evident through significant interannual fluctuations (up to 100%) correlated with precipitation, tied to broader climatic phenomena such as El Niño/La Niña and the Interdecadal Pacific Oscillation. However, no distinct impact of longer-term climate change has been observed in this context.

Moreover, this study delves into the environmental implications of these recharge sources. Notably, the upper Selwyn River sustains a critical groundwater-dependent ecosystem, supporting the endangered Kōwaro (Canterbury mudfish) in springs downstream of the studied losing reach. The analysis reveals that recharge from the upper Selwyn maintains adequate water levels and flows in these springs. However, during dry periods, when the seasonal average recharge rate drops below 2 m³/s, groundwater levels are insufficient to reach the springs, potentially causing harmful effects on this ecosystem.

Ongoing research focuses on further exploring the environmental implications of groundwater recharge from the upper Selwyn and Orari Rivers and explaining the differences observed between the two river systems.

How to cite: Di Ciacca, A., Brand, M., Knight, L. G., and Durney, P.: Groundwater recharge from ephemeral rivers of the Canterbury Plains (New-Zealand): historical reconstruction using satellite imagery and environmental implications, EGU General Assembly 2024, Vienna, Austria, 14–19 Apr 2024, EGU24-4767, https://doi.org/10.5194/egusphere-egu24-4767, 2024.

Predicting in-stream transport and transient storage processes is crucial for determining biogeochemical turnover and protecting stream ecosystems. One common way to study these processes consists in analysing slug injections of artificial tracers into the stream. The explanatory power of processes inferred from these experiments depends on the quality and completeness of the recorded tracer signal, i.e., the breakthrough curve (BTC). The stream settings strongly influence the explanatory power of the BTC. For instance, an increase in transient storage zones can result in a more pronounced tailing of the BTC. It is well-known that different tracers such as sodium chloride or dye tracers exhibit different detection limits. However, limited guidance exists if and how the choice of the selected tracer or the stream settings biases the conclusion drawn from tracer experiments. To address this research gap, we carried out numerical experiments generating BTCs from slug injections through 10,000 randomly selected parameter combinations mimicking stream conditions. We employed these randomly selected parameter combinations from a predefined range for the dispersion parameter, flow velocity, cross-sectional area, and with and without consideration of transient storage exchange processes. The BTCs were truncated based on the detection limits for sodium chloride and the dye tracer uranine. We calculated transport metrics such as the temporal moments of BTCs and the transient storage index (TSI) to identify differences between the BTCs truncated based on the detection limits of both tracers. We found that the different tracers resulted in clearly different transport metrics. Specifically, the BTCs of the dye tracer exhibited higher TSI values compared to those resulting from BTCs derived from the salt tracer. The absolute and relative differences between the transport metrics of both tracers increased with higher values for the transient storage parameters, particularly for higher flow velocity and a higher dispersion coefficients representative for small streams. Our results revealed that analyzing BTCs from small streams is clearly biased when relying on sodium chloride in the experiments. These finding raise caution considering the importance of the choice of tracer, and we recommend the use of dye tracers over salt tracers for small streams where a high impact of transient storage processes is expected.

How to cite: Glaser, C. and Klaus, J.: Different tracers result in different storage and transport parameters in transient storage models , EGU General Assembly 2024, Vienna, Austria, 14–19 Apr 2024, EGU24-6022, https://doi.org/10.5194/egusphere-egu24-6022, 2024.

EGU24-6843 | Posters on site | HS10.5 | Highlight

Impact of river management on groundwater recharge from braided rivers 

Scott Wilson, Richard Measures, Jo Hoyle, Guglielmo Stecca, Patrick Durney, Antoine Di Ciacca, and Thomas Woehling

A new conceptualisation describing surface water-groundwater exchange for braided rivers and their associated alluvial aquifers has been developed (Wilson et al., 2023 Preprint). This conceptualisation recognises that braided rivers create their own high-permeability shallow aquifer system through the process of mobilising bed sediments during flood events. A braided river can therefore be considered a “river system” consisting of surface channels and an intrinsically linked subsurface gravel reservoir, the “braidplain aquifer”. This conceptualisation implies that for settings where the river system is hydraulically disconnected to the regional aquifer, groundwater recharge is largely governed by braidplain aquifer width. Additionally, for settings where the river system is hydraulically connected to the regional aquifer, river bed levels will have a large control on recharge rates since they determine the hydraulic gradient. Depending on the hydraulic status, groundwater recharge can be compromised by narrowing the active braidplain, and bed degradation caused by extracting gravel from the braidplain aquifer at a rate that exceeds natural replenishment. To test the impact of river management on groundwater recharge, long-term records of river mean bed level from surveyed cross sections were compared to groundwater levels for the Wairau and Ngaruroro rivers in New Zealand. Scenario testing for different river system widths and elevations was also conducted in MODFLOW based on shorter term monitoring records.

In New Zealand, groundwater monitoring commenced after the river flood engineering schemes of the 1960’s, so the impact of river narrowing is not captured by groundwater records. However, hydraulically connected recharge reaches of the Wairau and Ngaruroro river systems have both been subject to more recent bed degradation caused by gravel extraction. The long-term groundwater level decline in the regional aquifers clearly mimics the drop in mean bed levels in the recharge reaches of the rivers. The drop in river bed elevations can also account for the decline in groundwater levels in MODFLOW scenario modelling.

Observation data for the Wairau and Ngaruroro systems show that the dynamic component of recharge pulses from flood flows propagate rapidly through their associated highly transmissive alluvial aquifers. For both hydraulically connected and disconnected braidplain aquifer-regional aquifer settings, maintaining a steady rate of recharge is therefore most beneficial for sustaining groundwater levels throughout the year. The observation data and modelling results confirm that gravel extraction in the braidplain aquifer is having the largest impact on the hydrological function of the regional aquifer in the two hydraulically connected systems studied here. In both cases, the decline in bed levels offsets the benefit of recharge sourced from flood flow events.

Wilson, S., Hoyle, J., Measures, R., Di Ciacca, A., Morgan, L. K., Banks, E. W., Robb, L., and Wöhling, T.: Conceptualising surface water-groundwater exchange in braided river systems, EGUsphere [preprint], https://doi.org/10.5194/egusphere-2023-2767, 2023.

How to cite: Wilson, S., Measures, R., Hoyle, J., Stecca, G., Durney, P., Di Ciacca, A., and Woehling, T.: Impact of river management on groundwater recharge from braided rivers, EGU General Assembly 2024, Vienna, Austria, 14–19 Apr 2024, EGU24-6843, https://doi.org/10.5194/egusphere-egu24-6843, 2024.

The hyporheic zone at the surface water-groundwater interface is an important compartment of stream ecosystems. It is a hotspot of aquatic biodiversity and key to functional processes, especially in relation to nutrient cycling and retention as well as the self-cleaning ability of streams. The core objective of this study was to understand the complex and heterogeneous role of hyporheic exchange on nutrient cycling and transport over different spatial and temporal scales in relation to anthropogenic land use and sediment dynamics. We assessed sediment dynamics, redox potentials and interstitial habitat quality in conjunction with ion-and nutrient concentrations in the open water and the interstitial zone across a range of silicate stream systems of varying intensities of catchment use and under different discharge conditions. Snow melt events were highly important for the mobilization of fine sediments and stream bed cleaning. In contrast, strong rain events caused high additional fine sediment deposition rates. Fine sediment inputs from small catchment elements like fish ponds strongly depended on pond management. Spatial patterns in hyporheic nutrient concentrations differed from surface water nutrient concentrations, and hyporheic exchange flow varied for different compounds. Intensively and extensively used streams varied strongly in surface water nutrient concentrations while differences in interstitial ion concentrations were much lower. Waterborne denitrification was mostly found in intensively used catchments with elevated fine sediment deposition rates and in fish ponds. Increased fine sediment deposition on the stream bed resulting from excessive erosion input and resulting colmation were regularly observed in intensively used catchments. They can impair the exchange of surface water with the interstitial zone, in turn affecting hyporheic processes. Such knowledge on the potential impact of hyporheic processes on surface water nutrient dynamics along land use gradients is needed to guide future management of catchments and waterbodies to reduce anthropogenic pressures on aquatic ecosystems.

How to cite: Hoess, R. and Geist, J.: Spatiotemporal variation in hyporheic nutrient concentrations and interstitial water quality in relation to land use and sediment dynamics, EGU General Assembly 2024, Vienna, Austria, 14–19 Apr 2024, EGU24-7701, https://doi.org/10.5194/egusphere-egu24-7701, 2024.

EGU24-11321 | ECS | Orals | HS10.5

Local head differences and topography-driven groundwater flow to robustly identify gaining and losing streams 

Xiaohua Huang, Pia Ebeling, Guodong Liu, Jan Fleckenstein, and Christian Schmidt

Interactions between groundwater (GW) and surface water (SW) play a pivotal role in influencing water quantity, quality, and associated biogeochemical and ecological processes in stream networks. Understanding the spatial pattern of gaining and losing rivers is crucial for managing water resources at catchment scale. Each method to identify losing and gaining rivers, from point to reach to catchment scale, has distinct advantages and limitations. These limitations can potentially be mitigated by combining different approaches.

In this study, we combined local information from hydraulic head differences between GW and SW with the regional information derived from topography-driven groundwater flow to robustly identify and characterize the spatial pattern of gaining and losing rivers in two study areas located at Central Germany –the Bode catchment and Free State of Thuringia. Central Germany has faced a drought period in the last five years, which has impacted groundwater levels. To evaluate local head differences, we compared the measured averaged groundwater levels (GWLs) and estimated surface levels (SWLs). The GWL data were obtained from 49 and 826 groundwater monitoring wells within a 1500 m distance from rivers in the Bode catchment and Thuringia, respectively. We developed a method for estimating SWLs across river networks by correcting a coarse DEM (25 m) based on the river bed elevations and river water depths recorded at gauging stations and river network topology. Uncertainties of SWL were also estimated and considered in the classification of gaining and losing rivers. Topography-driven discharge (gaining rivers) and recharge (losing rivers) areas are derived from groundwater upward and downward flow directions according to a 3D spectral solution.

The analysis of head differences reveals a widespread occurrence of losing rivers. However, when combining the losing and gaining classifications from topographical-driven groundwater flow with the classifications from head differences, the fraction of river segments having the same classification from both methods is relatively low (around 50% in both study areas). Many river segments showed contradictory classifications from the two methods, with a notable observation being that rivers have losing classifications from head differences but gaining classifications from topographic analyses. Specifically, 41% of river segments in Thuringia and 7 out of 9 (78%) in the Bode catchment fall into this category. This mismatch typically occurred in urban and mining areas, indicating anthropogenically lowered GWLs.

By combining local and regional scale methods, our study contributes to a more robust representation of patterns of gaining and losing rivers. Our analysis reveals the prominence of losing rivers despite the topographical classification of a gaining river highlights the anthropogenic impacts on local groundwater levels.

How to cite: Huang, X., Ebeling, P., Liu, G., Fleckenstein, J., and Schmidt, C.: Local head differences and topography-driven groundwater flow to robustly identify gaining and losing streams, EGU General Assembly 2024, Vienna, Austria, 14–19 Apr 2024, EGU24-11321, https://doi.org/10.5194/egusphere-egu24-11321, 2024.

EGU24-13172 | Orals | HS10.5

Anomalous subsurface phosphorus transport from field to stream in a tile drained landscape: Tracer experiment and models 

Audrey Sawyer, Lauren Decker, Susan Welch, Junfeng Zhu, Andrew Binley, Hannah Field, Brittany Hanrahan, and Kevin King

In agricultural areas with poorly drained soils, subsurface tile drains are commonly installed to improve drainage but also serve as conduits that deliver excess nutrients to adjacent streams. Our goal was to understand the transport of phosphorus (P) along these flow paths by applying a novel mixture of tracers (including 866 g of conservative chloride (Cl), 3.4 g of potassium phosphate, and approximately 3.6x10¹¹ fluorescent micrometer-sized particles, or 49.5 g) to a farm field and sampling their breakthrough curves at the outlet to a stream, approximately 30 meters away. Simultaneously, we performed a 26-hour time-lapse electrical resistivity tomography (ERT) survey to monitor the saline tracer migration in three dimensions every 0.5 to 1 hour. The initial pulse of tracers had a mean arrival time of 21 minutes and transported 262 g of added Cl (28%), 0.65 g of dissolved P (17%), and 1.4x10¹⁰ particles (4%) to the tile drain outlet. A stochastic mobile-immobile model fit the anomalous (non-Fickian) solute breakthrough curves, where the mobile zone represents the macropore and tile drain network, and the immobile zone represents the soil matrix. Residence times in the immobile zone exhibited a heavy (power-law) tail. ERT images confirmed the retention of tracer mixture in soils after concentrations were no longer measurable at the tile drain outlet. Core samples suggest that 96% of particles and 21% of dissolved P were retained within 10.5 cm of the application location. Solutes and particles were remobilized over longer timescales during three successive storms. Exported masses of Cl and dissolved P at the tile drain outlet ranged from 1,490-12,300 g and 25.7-65.2 g, respectively, indicating flushing of older Cl and P stored in soils before the tracer experiment. Less than 0.01% of the added fluorescent particles were flushed during these storm events. This study indicates the wide range of P travel times through the subsurface in tile drained landscapes and the need to incorporate non-Fickian transport behavior in models.

How to cite: Sawyer, A., Decker, L., Welch, S., Zhu, J., Binley, A., Field, H., Hanrahan, B., and King, K.: Anomalous subsurface phosphorus transport from field to stream in a tile drained landscape: Tracer experiment and models, EGU General Assembly 2024, Vienna, Austria, 14–19 Apr 2024, EGU24-13172, https://doi.org/10.5194/egusphere-egu24-13172, 2024.

Large in-stream structures such as dams can regulate the dynamic of the river stage, which potentially alters the patterns of hyporheic exchange flow (HEF) and mass transfer between the river and adjacent aquifer. However, current studies haven’t focused on how a large dam affects the evolution of HEF and residence time distribution (RTD), especially in the upstream area. In this study, we conducted the geophysical survey and groundwater stage monitoring of three monitoring transects around the XingLong Water Conservancy Dam (XLD) in China, which covers both upstream and downstream riparian areas. Based on these field data, a two-dimensional, horizontal numerical model was built to assess the spatiotemporal evolutions of lateral HEF, hyporheic zone (HZ) and groundwater RTD under the regulation of the XLD. The monitoring and simulation outcomes highlighted the different impact patterns of the XLD in upstream and downstream regions. For instance, the groundwater in the regions upstream of the dam was found to be recharged for the most of time, while the groundwater immediately downstream of the dam was significantly discharged. As the river stage fluctuates, the XLD significantly enhanced the HZ along the upstream river boundary whereas substantial HZ downstream was mainly observed in response to rising or high river stage. Furthermore, the XLD resulted in flow paths around the XLD with short lengths and high flow velocity, which consequently resulted in a significant HZ in the perimeter surrounding the XLD. Results of RTD show that water in the HZ downstream of the XLD was rejuvenated, whereas the HZ upstream of the XLD comprises a mix of aged and rejuvenated waters. These findings emphasized the need for full consideration of river stage dynamics surrounding the dam in analytical or numerical analysis when aiming to assess the bank storage and the aquatic environment in a dam-regulated river corridor aquifer, and have potential implications for the decision of the construction or removal of the dam, river restoration and purification of pollutants in aquifer.

How to cite: Li, Y., Wen, Z., Schneidewind, U., Liu, H., and Krause, S.: Field monitoring and numerical investigation on the regulation of a large dam structure on the patterns of lateral hyporheic exchange and residence time distributions - The Xinglong Water Conservancy Dam, China, EGU General Assembly 2024, Vienna, Austria, 14–19 Apr 2024, EGU24-14520, https://doi.org/10.5194/egusphere-egu24-14520, 2024.

The coupling transformation of iron and phosphorus in the riparian zone is of great significance on the biogeochemical cycle of iron and pollutants in surface water-groundwater interaction system. However, the spatial and temporal distribution, biochemical transformation and its pollution interception in the interaction zone is poorly understood. In this study, we used the sand tank experiment to investigate the migration and the transformation of iron and phosphorus under the redox fluctuation forced by the river stage in the riparian zone. Results show that there is a good correlation between the changes of Fe/Al coupled P and amorphous total Fe. Additionally, more attention should be paid to the effect of organic carbon rather than dissolved oxygen on the redox condition in the underground environment. It was also found that aqueous phosphorus usually accumulates in the transition area of the riparian zone regardless of the recharge or discharge relationship between river and groundwater. This study thus revealed the distribution, migration and transformation mechanism of iron and phosphorus in the typical fine sandy riparian zone, providing theoretical support for tracing and controlling the source of phosphorus pollution in riparian aquifer.

How to cite: Guo, Z., Wen, Z., Bu, X., Liu, H., and Yuan, S.: A sand tank experimental study of distribution, migration and transformation mechanism of iron and phosphorus species under redox fluctuation in a simulated riparian zone, EGU General Assembly 2024, Vienna, Austria, 14–19 Apr 2024, EGU24-14653, https://doi.org/10.5194/egusphere-egu24-14653, 2024.

EGU24-14846 | Orals | HS10.5

Estimating and Predicting Bedform-Induced Head Gradients Using Dye Tracer Tests 

Yoni Teitelbaum, Edwin Saavedra Cifuentes, Aaron Packman, Shai Arnon, and Scott K. Hansen

Head induced by bedforms at the sediment-water interface (SWI) is typically represented in one of two ways: either by solving the RANS equations for the water column, or by a sinusoidal boundary condition defined by Elliott and Brooks (1997). Both of these methods have been used to model bedform-induced hyporheic exchange flux (HEF) on domains of constant shape. Under sufficiently fast flow conditions, however, bedform shape is irregular and evolves over time. For these conditions, neither method is fully appropriate: RANS is too computationally intensive, while the Elliott and Brooks boundary condition is based on measurements taken using rigid bedforms of an idealized triangular shape (Fehlman, 1985). We present a procedure for estimating head induced by arbitrarily-shaped bedforms using timelapse photos of dye tracer tests. At a given time t, an initial guess of head along the SWI is generated. The predicted evolution of the dye plume observed in the photo at time t is calculated using the model of Teitelbaum et al. (2022). The predicted dye plume location is compared against the observed plume location from the next photo. This comparison is used as the objective criterion in an optimization procedure, which is run until the estimate of head at the SWI converges. Results show agreement with experimental observations from dye tracer tests. The estimated head is used as input data to predict head distribution based solely on SWI shape. This work provides a new way to estimate head under arbitrary SWI shape. Thus, it constitutes an important advance in realistic modeling of bedform-induced hyporheic exchange flux.

How to cite: Teitelbaum, Y., Saavedra Cifuentes, E., Packman, A., Arnon, S., and Hansen, S. K.: Estimating and Predicting Bedform-Induced Head Gradients Using Dye Tracer Tests, EGU General Assembly 2024, Vienna, Austria, 14–19 Apr 2024, EGU24-14846, https://doi.org/10.5194/egusphere-egu24-14846, 2024.

EGU24-15043 | ECS | Posters on site | HS10.5

Bedform migration’s impact on streambed oxygen distribution: A novel field experiment 

Alejandra Villa, Hanna Schulz, Stephanie Spahr, Shai Arnon, and Jörg Lewandowski

Several studies have investigated the high reactivity of the hyporheic zone (HZ) and the interactions between moving bedforms and biogeochemical processes. However, the impact of bedform migration on the attenuation of trace organic compounds in the streambed has not yet been investigated. The oxygen distribution and dynamics in the HZ play a major role in this regard. So far, there have been no in-situ measurements of two-dimensional oxygen distributions in the HZ. To address this gap, we developed a novel device and tested it for the first time in the Erpe River, Germany. Our setup included a planar optode installed in the streambed to visualize the redox zonation within the HZ. Additionally, we tested five different stream flow velocities (from 10 to 50 cm/s) to investigate typical bedform celerities in lowland streams more thoroughly. By repeatedly sampling the surface and pore water, our aim was to determine how dynamic flow patterns and variable bedform celerities in sandy streams influence water constituents. The field experiment confirmed that changes in flow conditions can non-linearly influence bed movement and oxygen consumption, thereby affecting the fate of trace organic compounds.

Keywords: Biogeochemical processes, bedform celerity, in situ measurements, field experiments, redox zonation, hyporheic zone, oxygen distribution, planar optode.

How to cite: Villa, A., Schulz, H., Spahr, S., Arnon, S., and Lewandowski, J.: Bedform migration’s impact on streambed oxygen distribution: A novel field experiment, EGU General Assembly 2024, Vienna, Austria, 14–19 Apr 2024, EGU24-15043, https://doi.org/10.5194/egusphere-egu24-15043, 2024.

EGU24-15766 | Orals | HS10.5

A semi-analytical approach to characterize the effects of unsteadiness and dune migration on microplastics fate 

Alessandra Marzadri, Nerea Portillo de Arbeloa, and Daniele Tonina

Streams and rivers, together with their bed (i.e. benthic) and subsurface (i.e. hyporheic zone) environments represents the natural connectors between terrestrial and aquatic environments through which transport and transformation processes control the fate of a multitude of elements, including nutrients and contaminants, commonly produced by human activities. In recent years, particular attention was given to a new class of pollutants known as Contaminants of Emerging Concern (CECs) that include, among others, microplastics. Microplastics enter the streams and rivers after escaping degradation from wastewater treatment plants (WWTPs) and during the time they spend within the riverine environments they may have potential adverse effects on human and freshwater ecosystems. Among the different processes that affect their fate, burial within the streambed sediments is still the subject of current research; especially considering that under some hydrodynamics conditions small scale bedforms (i.e. dunes and ripples) can migrate causing hyporheic exchange to depend on both bedform migration, called turnover, and near-bed pressure gradients, called pumping. Here, we analyze the effects of turnover and pumping in sand-bedded streams with mobile dunes by proposing an analytical solution of the process. The proposed analytical solution allows us to determine: i) the pressure head distribution, ii) the velocity field and iii) the residence time distribution within a homogeneous stream bed sediment under transient conditions of the stream flows. The solution allows to characterize and quantify the penetration depth and the release (i.e. the resuspension process) of microplastics due to the trapping-releases successions as hyporheic pathways (connecting downwelling and upwelling zones) change in time.

How to cite: Marzadri, A., Portillo de Arbeloa, N., and Tonina, D.: A semi-analytical approach to characterize the effects of unsteadiness and dune migration on microplastics fate, EGU General Assembly 2024, Vienna, Austria, 14–19 Apr 2024, EGU24-15766, https://doi.org/10.5194/egusphere-egu24-15766, 2024.

EGU24-17004 | ECS | Orals | HS10.5

Life below the City – Impacts of urbanization and subsurface heat islands on groundwater fauna in the city of Vienna 

Constanze Englisch, Eva Kaminsky, Cornelia Steiner, Eszter Nyéki, Christine Stumpp, and Christian Griebler

Groundwater is one of our most important and heavily utilized resources. However, it is also home to a variety of microbes and fauna, that have adapted to a dark, cold, and typically energy-poor environment for thousands of years. Therefore, groundwater is a habitat with high numbers of endemic and cryptic species as well as hidden biodiversity hotspots. These highly specialised animals, while assumed to provide vital ecosystem services including water purification, are susceptible to intermediate-term (years to decades) changes in environmental conditions. In urban areas, a multitude of pressures like increased temperatures, extensive surface sealing and pollution are impacting groundwater ecosystems with deteriorating effects on biodiversity and groundwater quality. Aiming to reveal key factors of spatio-temporal biodiversity patterns, fauna community composition and links between subsurface urban heat islands, species richness and water quality, 150 groundwater wells in the city of Vienna were sampled in autumn 2021 and in spring 2022 to include seasonal variability. Focusing on subsurface heat accumulation as a main driver, a large set of biotic and abiotic variables was analysed as part of the project “Heat below the City”. The results show that the mean groundwater temperature of 14°C in Vienna is about 2 K above the natural background, with anthropogenic heat sources having an impact on the degree of warming and groundwater fauna composition. The absence of dissolved oxygen (DO) and NO3- as well as the presence of dissolved Fe2+, HS- and CH4 hint at zones with reducing conditions correlated with low faunal biodiversity. The application and comparison of several groundwater ecosystem health indices as well as the development of a robust habitat suitability assessment for groundwater fauna contribute to the establishment of an integrative groundwater management strategy, combining groundwater quality aspects, its sustainable use as source for drinking water, heating and cooling, and conservation strategies for groundwater biodiversity in the future.

How to cite: Englisch, C., Kaminsky, E., Steiner, C., Nyéki, E., Stumpp, C., and Griebler, C.: Life below the City – Impacts of urbanization and subsurface heat islands on groundwater fauna in the city of Vienna, EGU General Assembly 2024, Vienna, Austria, 14–19 Apr 2024, EGU24-17004, https://doi.org/10.5194/egusphere-egu24-17004, 2024.

EGU24-17630 | ECS | Posters virtual | HS10.5

Assessing the variations in hyporheic flow exchange by isotopic and chemical analysis  

Amani Mahindawansha and Matthias Gassmann

The hyporheic zone plays a critical role in nutrient cycling, biogeochemical processes, and overall stream ecosystem health. Variation of physical and chemical properties in the hyporheic zone affects the quality and quantity of the exchange process. To gain a depth-oriented insight into the hyporheic functioning, isotopic (18O and 2H) and chemical analysis (major ions such as K+, Na+, Mg2+, Ca2+, Cl-, SO42-, NO3-) was carried out focusing on the differences between upstream and downstream conditions. Multi-level interstitial probes were used to take subsurface water samples up to 0.6 m depth from two streams named Ahna and Losse in North Hesse, Germany.

Fast downward flow and higher mixing rates were observed for Losse compared to Ahna and no differences were detected between the two locations in Losse. In Ahna, due to changes in effective porosities and the hydraulic conductivities, the water extraction rates were decreased along the depth. Downstream water was more isotopically enriched than upstream being subject to more evaporation and mixing with other waters. Higher concentrations of  K+, Na+, Mg2+, Cl-, and NO3- were found in downstream than the upstream due to the addition of wastewater, agricultural runoff, pollutants, and road salt while flowing. Denitrification and thus decrease in nitrate and increase in nitrite concentrations were more dominant in the upstream due to the high oxygen consumption. By combining isotopic and chemical analyses with detailed hydrogeological measurements, this study can provide valuable insights into the spatial dynamics of hyporheic flow exchange in a stream ecosystem.

How to cite: Mahindawansha, A. and Gassmann, M.: Assessing the variations in hyporheic flow exchange by isotopic and chemical analysis , EGU General Assembly 2024, Vienna, Austria, 14–19 Apr 2024, EGU24-17630, https://doi.org/10.5194/egusphere-egu24-17630, 2024.

EGU24-18397 | ECS | Posters on site | HS10.5

Characterization of biogeochemical self-purification processes in the Vjosa River network focusing on different spatial and temporal scales 

Sonja Hoxha, Christian Griebler, Clemens Karwautz, Gabriel Singer, and Sajmir Beqiraj

The Vjosa River and its tributaries represent a large and dynamic river network characterized by a near natural flow regime and largely undisturbed hydromorphological dynamics. Due to the high connectivity (e.g. the lack of dams and regulation in the main river stem), the Vjosa River is a hotspot of natural biodiversity and may serve as an ecological reference system.

The self-purification potential of an ecosystem describes the resistance and resilience to contamination (disturbances). In rivers, the contaminants are attenuated and degraded not only in the visible river channels, but most importantly in the hyporheic zone and the riparian corridor. The subsurface is a vital bioreactor, that hosts an immense river- and groundwater-borne biodiversity.

Here we target the key biogeochemical processes involved in the cycling of carbon and nutrients in a qualitative and quantitative manner. The spatio-temporal distribution and transformation of different carbon (e.g. DOC, DIC, CO2, CH4), nitrogen (e.g. NO3-, NO2-, NH4+), and phosphorus (e.g. PO43-, Ptot) species are studied in detail at different spatial scales. Extrapolation from flow-through sediment microcosms to natural river sections of various dimensions (mesoscale to macroscale) will allow a good estimation of material import, transformation, attenuation, and export. The role of the microbial community, in the water and attached to the sediments, will be analyzed via high throughout sequencing to determine its composition and functions.

The outcome of this study will help to better understand the functioning river ecosystems from the micro to the catchment scale as a basis for in-depth evaluation of future sustainable management options. The Vjosa River has been proclaimed a national park recently, and options for ecotourism are currently developed by its management authorities. In the light of global change, the Vjosa River network shall serve as a reference system for other rivers in Europe and a unique field laboratory for assessing biogeochemical processes in an intact environment.

How to cite: Hoxha, S., Griebler, C., Karwautz, C., Singer, G., and Beqiraj, S.: Characterization of biogeochemical self-purification processes in the Vjosa River network focusing on different spatial and temporal scales, EGU General Assembly 2024, Vienna, Austria, 14–19 Apr 2024, EGU24-18397, https://doi.org/10.5194/egusphere-egu24-18397, 2024.

EGU24-18662 | ECS | Posters on site | HS10.5

Comparing different field methods to quantify surface-groundwater interaction 

Daniel Glaser, Alexander Krämer, Jens Lange, and Markus Weiler

Surface-groundwater interaction is an important link between hydrology and hydrogeology and can contribute considerably to groundwater recharge. However, quantification and continuous observation of water flows is challenging in practice. This may explain why surface-groundwater interaction is disregarded in many hydrogeological models so far.     
In this work we test several field methods in three medium-sized streams (average discharge at outlet: 1.9-10.9 m³/s) close to the city of Freiburg, south-west Germany. We subdivide the streams into sections and monitor gains and losses by a combination of different methods. Continuous discharge data is obtained by capacitance water level recorders combined with repeated runoff measurements by electromagnetic current meter. As an alternative, we apply particle tracking algorithms to drone footage and compute surface velocities and discharge volumes. Here we also analyse different types of seeding material. Additionally, thermal drone images show surface temperature anomalies which we combine with discharge measurements to estimate groundwater intrusion. Our first data shows that continuous data collection under field conditions is challenging and can suffer from drawbacks such as flooding or tree fall. We therefore recommend redundant methods. Discharge measurements via electromagnetic current meter are generally robust but limited to medium flow conditions. Here, remote sensing via drones can provide labour-efficient alternatives. With their help, discharge measurements are possible also during high flow periods but in turn limited to areas with little or no tree cover, whereas thermal imagery is more efficient during low flow periods. Then it is well suited to locate point sources of groundwater inflow, particularly during times of strong temperature gradients between rivers and aquifers in summer or winter. Quantification of these inflows remains uncertain, though.

How to cite: Glaser, D., Krämer, A., Lange, J., and Weiler, M.: Comparing different field methods to quantify surface-groundwater interaction, EGU General Assembly 2024, Vienna, Austria, 14–19 Apr 2024, EGU24-18662, https://doi.org/10.5194/egusphere-egu24-18662, 2024.

Changes in population and agricultural development are increasing demands on available water resources in the Transboundary Rio Grande (TRG), an area defined by the Rio Grande River and the Mesilla aquifer between New Mexico, Texas, and Mexico. Due to the continued drought, surface water availability is continuously declining, increasing the reliance on groundwater to satisfy the water demands (mainly for agriculture and domestic uses). To simulate the conjunctive use and management of the surface water and groundwater in the TRG, a groundwater flow model implemented on Modflow-OWHM called the Rio Grande Transboundary Integrated Hydrologic Model (RGTIHM) has been previously developed. In this study, the RGTIHM model is used to assess the historical conditions and to project climate change driven scenarios on the water budget variables related to conjunctive use of surface water and groundwater in the TRG. The historical conditions were simulated from 1940-2014, while the future scenarios were simulated for the period 2015-2065 considering: i) inputs of precipitation and temperature from global climate change models, ii) management scenarios of land use and water demands for agriculture. The historical period of the model shows that due to the aquifer depletion, the river is permanently becoming a losing stream and at the same time is becoming a source of recharge for aquifer storage, the recharge from irrigated fields has a significant weight in the total recharge, and the diffuse recharge from precipitation is a small source compared to the previous two. The future period shows that maximum and minimum temperatures tend to increase, as well as the real evapotranspiration; precipitation does not change significantly, diffuse recharge decreases, and runoff increases. Water availability in the Rio Grande River decreases due to reduced snowpack in the Rocky Mountains, increasing the reliance on groundwater and posing uncertainty in future water supply management in the TRG.

How to cite: Perez, K. and Fernald, A.: Potential influence of climate change in the water budget variables related to the conjunctive use in the Transboundary Rio Grande , EGU General Assembly 2024, Vienna, Austria, 14–19 Apr 2024, EGU24-21404, https://doi.org/10.5194/egusphere-egu24-21404, 2024.

EGU24-21406 | ECS | Orals | HS10.5

Differences of denitrification potential between straight and meandering pool-riffle streams with riparian zones 

Shijie Zhu, Peng Huang, and Ting Fong May Chui

The hyporheic zone (HZ), an interstitial space immediately beneath and adjacent to streams, is characterized by frequent exchanges between groundwater and surface water, and by transformations of energy, organics, and solutes. Our previous studies on HZ (Huang and Chui, 2021, https://doi.org/10.1029/2020wr029182, 2022, https://doi.org/10.1029/2022WR032221) have shown that stream morphology, such as meanders and pool-riffle bedforms, significantly complicates subsurface flow patterns and increases the flowrate and scale of the hyporheic exchange (HE), leading to a hypothesis of a more dynamic and complex biogeochemical regime in both vertical and lateral extents of the HZ.

In this study, we focused on the biogeochemical reactions associated with stream nitrogen cycling, including aerobic respiration (AR) and denitrification (DN) in both straight and meandering pool-riffle streams — due to their significant effects on stream ecology improvement. We also compared how stream morphology influences redox zonation and denitrification potential on a spatial-temporal scale. Using the physical pool-riffle stream model built in our previous study, we conducted tracer experiments with the conservative material NaCl. A three-dimensional (3D) model that couples with hyporheic flow and biogeochemical reactions was developed to investigate AR and DN processes. The groundwater reaction model was calibrated using the measured concentration curves at downwelling and upwelling regions of the HZ, assuming reaction rate was zero. Our preliminary results from the numerical simulation showed that 1) both straight and meandering pool-riffle streams with riparian zones exhibit significant nitrate transfer zones in the anoxic regions beneath the streambed and in the riparian area, which is dominated by advection. 2) the interbank of meandering streams may contain multiple DN hotspots, which is significantly affected by the local HEs. Ignoring the riparian zone may lead to an underestimation of the denitrification potential in the HZ. Further studies are needed to comprehensively investigate biogeochemical reactions in 3D meandering streams and their responses to morphologic factors (e.g., sinuosity), hydrological factors (e.g. stream discharge and groundwater flow) and environmental factors (e.g. diurnal and seasonal temperature variations).

How to cite: Zhu, S., Huang, P., and May Chui, T. F.: Differences of denitrification potential between straight and meandering pool-riffle streams with riparian zones, EGU General Assembly 2024, Vienna, Austria, 14–19 Apr 2024, EGU24-21406, https://doi.org/10.5194/egusphere-egu24-21406, 2024.

EGU24-22010 | Orals | HS10.5 | Highlight

Representing multicompartment stream transport utilising exposure time 

James L. McCallum, Tim Ginn, and Anja Hoehne

The fate of compounds in natural streams is heavily dependent on their exposure to different biogeochemical conditions during transport. Classifying biogeochemical conditions and the fate of contaminants in stream sediment studies allows for controls to be determined at point scale; however, the total contribution of exchange with sediments containing specific conditions at the reach scale remains challenging as the magnitude of exchange can be highly heterogeneous, and the overall contribution of the time spent in specific biogeochemical conditions   relative to the total transport time is unknown. To overcome the issues of upscaling point studies we present an exposure time-based modelling approach following Ginn (1999).  The approach allows for exposure velocities to control how the solute is tracked in the system; a velocity of one suggests that the exposure time to a certain biogeochemical condition increases at a rate of 1/time. The transport characteristics of the system are then identified by applying exposure velocities of zero or 1 to obtain the distribution of times spent in individual components of the stream-sediment system. These can be aggregated through convolution to give the total residence time, or individual components may be first modified to represent sorption and removed prior to aggregation after Höhne et al. (2021). We present a model that contains three zones – stream, benthic (shallow sediment) and hyporheic (deep sediment) zones under steady flow conditions and interpret a multi-tracer study from the Erpe River to demonstrate the utility of the model. The presented approach offers insights into the contribution of key individual components to stream transport, greatly improving our understanding of the controls on stream transport and contaminant removal.

References

Ginn, Timothy R. 1999. ‘On the Distribution of Multicomponent Mixtures over Generalized Exposure Time in Subsurface Flow and Reactive Transport: Foundations, and Formulations for Groundwater Age, Chemical Heterogeneity, and Biodegradation’. Water Resources Research 35 (5): 1395–1407. https://doi.org/10.1029/1999WR900013.

Höhne, Anja, Jörg Lewandowski, Jonas L. Schaper, and James L. McCallum. 2021. ‘Determining Hyporheic Removal Rates of Trace Organic Compounds Using Non-Parametric Conservative Transport with Multiple Sorption Models’. Water Research 206 (November). https://doi.org/10.1016/j.watres.2021.117750.

How to cite: McCallum, J. L., Ginn, T., and Hoehne, A.: Representing multicompartment stream transport utilising exposure time, EGU General Assembly 2024, Vienna, Austria, 14–19 Apr 2024, EGU24-22010, https://doi.org/10.5194/egusphere-egu24-22010, 2024.

EGU24-403 | Posters on site | HS10.6

The effects of salinity and river runoff on idealized brackish ice-covered lakes  

Fatemeh Sadat Sharifi, Reinhard Hinkelmann, Tore Hattermann, and Georgiy Kirillin

The effects of freshwater river runoff on dynamics of ice-covered brackish lakes have not been adequately studied to date. Compared to freshwater lakes, the circulation patterns in brackish lakes are complicated by non-linear effects of temperature and salinity on density stratification and mixing, and as a result on the ice melt. Quantifying these effects is essential for understanding circulation of large endorheic lakes in cold regions and their ecological and physical characteristics. We present modeling results on circulation caused by river runoff in a typical ice-covered brackish lake obtained with the Regional Ocean Modeling System (ROMS). The lake water salinity was set to 14 practical salinity units (PSU). In the initial state, the water temperature increased linearly from the freezing point at the surface to the temperature of maximum density, at the bottom, both accounting for the water salinity. Mixing of cold freshwater river inflow with the warmer saline waters produces negative buoyancy and downslope flow of dense currents near the river inlets with a secondary geostrophically-balanced circulation throughout the lake. We use the modeling results to quantify the contribution of this circulation mechanism on deep lake circulation and ventilation of the near-bottom waters.

How to cite: Sharifi, F. S., Hinkelmann, R., Hattermann, T., and Kirillin, G.: The effects of salinity and river runoff on idealized brackish ice-covered lakes , EGU General Assembly 2024, Vienna, Austria, 14–19 Apr 2024, EGU24-403, https://doi.org/10.5194/egusphere-egu24-403, 2024.

EGU24-742 | ECS | Posters on site | HS10.6

Impact of human and natural causes on shrinking Burdur Lake in the semi-arid Mediterranean region of Turkiye 

Hatice Kılıç Germeç and Hasan Yazıcıgil

Lakes are valuable natural indicators, providing insights into the impacts of natural and artificial interventions on the hydrologic system. In arid and semi-arid climates, the global interest in monitoring shrinking lakes is growing to quantitatively reveal the impacts of such interventions. The internationally important Burdur Lake (Ramsar site no. 658), located in the semi-arid Mediterranean region of Turkey, stands out as a noteworthy example, with its water levels decreasing by nearly 17 m since the early 1970s. This study aims to investigate the reasons for the continual decrease in Burdur Lake levels over time and to assess the future impacts of various factors on the lake system, utilizing a 3-D numerical groundwater flow model developed with MODFLOW. The modeling process includes three years of transient calibrations for both initial (1969-1971) and current conditions (2014-2016) by simulating the lake with an incorporated lake package. The successfully calibrated model was then simulated with the future climate change scenarios over a 46-year period. Future climatic data derived from the RCP 4.5 and RCP 8.5 scenarios of the CORDEX Regional Climate Models were incorporated into the simulations to assess the impacts of change in natural climatic conditions. The first scenario was created to assess the impacts of climate change on the lake, whereas the second scenario was simulated to investigate the effects of excessive groundwater pumping under the influence of climate change. The third scenario was generated to simulate the cumulative effects of climate change and the decrease in flows of the streams feeding the lake as a result of the reservoirs constructed. The results indicate that climate change was not the primary driver behind the drop in the lake levels until the end of 2018. However, it may exacerbate the situation in the future, amplifying the negative effects of anthropogenic activities by imposing stress on the lake. An anticipated decline of up to 7 m in Burdur Lake level is projected due to the cumulative effects of climatic variations and excessive pumping. Conversely, despite the influence of climate change, an increase of up to 3 m is expected with the release of surface water flows. These findings underscore the need for a dynamic lake management plan to maintain desired conditions in Burdur Lake and its watershed, ensuring the sustainable management of this vital surface water resource.

How to cite: Kılıç Germeç, H. and Yazıcıgil, H.: Impact of human and natural causes on shrinking Burdur Lake in the semi-arid Mediterranean region of Turkiye, EGU General Assembly 2024, Vienna, Austria, 14–19 Apr 2024, EGU24-742, https://doi.org/10.5194/egusphere-egu24-742, 2024.

Lake Tanganyika, one of the world’s largest freshwater body and located in East Africa, is under threat from both anthropogenic activities and climate change. The region strongly depends on it as a vital resource for water and food for the surrounding populations while pollution is increasing and fish catches and size are decreasing.

The characterization of Lake Tanganyika’s hydrodynamics, surface primary productivity and their changes over the past decades has not often benefited from remote sensing observations. In this study, we use satellite-derived estimates of surface chlorophyll-a concentration from ESA’s CCI Lakes dataset to enhance our understanding of Lake Tanganyika's hydrodynamics and more particularly the seasonal spatial patterns. Then, we focus on the analysis of the spatiotemporal changes of this variable over the past two decades with a subsequent effort to discern the underlying factors contributing to these observed changes.

After applying the DINEOF method for spatiotemporal interpolation, we comprehensively described the seasonal dynamics in surface chlorophyll-a concentration. We showed that the main patterns are the contrasting dynamics in the coastal and pelagic regions of the lake, explaining nearly 80% of the variance. The observed 20-year trends in primary productivity confirmed the hypothesis that primary productivity is decreasing in the pelagic regions of Lake Tanganyika, as asserted by earlier studies. This phenomenon can be attributed to the impact of climate change on air temperature and wind velocities in the region. These negative trends were found most dominant between March and June, and amount to around -0.5 mg.m-3.decade-1. We also showed a relative sharp increase in primary productivity (+0.5 to 2 mg.m-3.decade-1) in coastal regions near urban centres and river mouths, most notably in the North near Bujumbura and the outlet of the Ruzizi river. This most certainly illustrates the growing impact of the surrounding populations on the lake’s water quality.

How to cite: Toussaint, F., Alonso, A., and Vanclooster, M.: Assessing the Ecological Dynamics of Lake Tanganyika: Remote Sensing Insights into Seasonal Hydrodynamics and Human or Climate-Induced Changes, EGU General Assembly 2024, Vienna, Austria, 14–19 Apr 2024, EGU24-923, https://doi.org/10.5194/egusphere-egu24-923, 2024.

EGU24-2386 | Orals | HS10.6

Impact of a severe dust intrusion on surface water temperature in subtropical Lake Kinneret 

Pavel Kishcha, Yury Lechinsky, and Boris Starobinets

Climate model predictions have shown that Lake Kinneret could disappear by the end of the 21st century due to decreasing precipitation and increasing evaporation. Kinneret surface water temperature (SWT) is one of the main factors determining evaporation. During the last several decades, observations and model data showed increasing desert dust pollution over the Eastern Mediterranean. Generally, dust impact on lake SWT has not yet been discussed in previous publications.

    We investigated the impact of an extreme dust intrusion on the diurnal behaviour of SWT in Lake Kinneret, which appeared from September 7 – 9, 2015, when dust aerosol optical depth (AOD) ranged from 0.2 to 1.5. This was carried out using METEOSAT and in-situ observations of SWT. In the presence of dust, METEOSAT showed that SWT decreased along with increasing dust pollution, both in the daytime and nighttime. This contradicted in-situ measurements of SWT at a depth of 20 cm which showed an increase up to 1.2 °C in the daytime and up to 1 °C in the nighttime: this was in comparison to daytime and nighttime SWT on clear-sky Sept. 6. This in-situ SWT was in line with in-situ radiometer measurements of upwelling longwave radiation (ULWR) which is determined by actual SWT. This led us to the conclusion that, in the presence of dust, in-situ SWT measurements were capable of reproducing Kinneret SWT.

    In the daytime, an observed increase in air temperature (Tair) on dusty days Sept. 7 and 9 contributed to an increase in daytime Kinneret SWT. However, a decrease in daytime Tair on Sept. 8 (in the presence of maximal dust pollution) contributed to a decrease in daytime Kinneret SWT.

    As for the nighttime on dusty days Sept. 7–9, in-situ measurements showed that an increase in Tair up to 4.3 °C was accompanied by an increase in SWT up to 1 °C, compared to nighttime Tair and SWT on clear-sky Sept. 6. This was in line with ULWR measurements, which showed that nighttime ULWR on each dusty day under study was higher than nighttime ULWR on clear-sky Sept. 6. This is evidence that dust pollution reflects part of ULWR back to the surface of the lake, leading to a noticeable increase in nighttime SWT.

    During the dust intrusion, a noticeable increase in absolute atmospheric humidity (ρv) over the lake was observed: ρv reached 30%, 20%, and 15% in the presence of maximum, intermediate, and low dust pollution on Sept. 8, 9, and 7 respectively: this was in comparison to ρv on clear-sky Sept. 6. The maximal increase in ρv on Sept. 8 was observed in the absence of moisture advection: this indicates that dust intrusion can cause additional evaporation from Lake Kinneret. This finding implies the following significant point: increasing desert dust pollution over the Eastern Mediterranean can intensify the drying up of Lake Kinneret.


Reference: Kishcha et al., Remote Sensing 2023, https://doi.org/10.3390/rs15225297 

How to cite: Kishcha, P., Lechinsky, Y., and Starobinets, B.: Impact of a severe dust intrusion on surface water temperature in subtropical Lake Kinneret, EGU General Assembly 2024, Vienna, Austria, 14–19 Apr 2024, EGU24-2386, https://doi.org/10.5194/egusphere-egu24-2386, 2024.

EGU24-2505 | ECS | Orals | HS10.6

Vertical mixing and horizontal transport determine bloom dynamics in a large riverine reservoir 

Bo Gai, Jian Sun, Binliang Lin, Yuanyi Li, Chenxi Mi, and Tom Shatwell

Phytoplankton blooms in lakes and reservoirs are sensitive to hydrodynamics. Bulk metrics of hydrodynamics are often used to investigate bloom formation, but they may not adequately represent the synergistic hydrodynamic processes in large riverine reservoirs caused by dam operation. Here we examine how complex three-dimensional hydrodynamic processes trigger blooms in Xiangxi Bay, a typical tributary bay of the Three Gorges Reservoir, China, which has suffered phytoplankton blooms of different scales in recent years. We used a 3D ecological-hydrodynamic model, which integrated hydrodynamics with the abiotic factors that limit phytoplankton growth to simulate one whole year (2010). By implementing a scaling criterion, we quantified the contribution of local phytoplankton growth and hydrodynamic processes, including advection transport and vertical mixing, on bloom dynamics. Results indicated vertical mixing was the main process inhibiting blooms in colder months (from October to February) but horizontal advection, which flushed and diluted blooms, was dominant in warmer months (from May to July) when stratification was intense and nutrients were replete. Accordingly, blooms occurred when both vertical mixing and horizontal advection were low. We suggested a potential dam operation strategy to mitigate blooms during stratification, which involves withdrawing the warm surface water from upstream reservoirs to increase horizontal flows in the surface layer. Extending the critical turbulence model, our study shows that not only the rate of vertical mixing, but also horizontal advection controls blooms in highly dynamic riverine systems.

How to cite: Gai, B., Sun, J., Lin, B., Li, Y., Mi, C., and Shatwell, T.: Vertical mixing and horizontal transport determine bloom dynamics in a large riverine reservoir, EGU General Assembly 2024, Vienna, Austria, 14–19 Apr 2024, EGU24-2505, https://doi.org/10.5194/egusphere-egu24-2505, 2024.

EGU24-3036 | ECS | Orals | HS10.6 | Highlight

Climate change drives rapid warming and increasing heatwaves of lakes 

Xiwen Wang, Kun Shi, Yunlin Zhang, Boqiang Qin, Yibo Zhang, Weijia Wang, R. Iestyn Woolway, Shilong Piao, and Erik Jeppesen

Climate change could seriously threaten global lake ecosystems by warming lake surface water and increasing the occurrence of lake heatwaves. Yet, there are great uncertainties in quantifying lake temperature changes globally due to a lack of accurate large-scale model simulations. Here, we integrated satellite observations and a numerical model to improve lake temperature modeling and explore the multifaceted characteristics of trends in surface temperatures and lake heatwave occurrence in Chinese lakes from 1980 to 2100. Our model-data integration approach revealed that the lake surface waters have warmed at a rate of 0.11 °C 10a-1 during the period 1980–2021, being only half of the pure model-based estimate. Moreover, our analysis suggested that an asymmetric seasonal warming rate has led to a reduced temperature seasonality in eastern plain lakes but an amplified one in alpine lakes. The durations of lake heatwaves have also increased at a rate of 7.7 d 10a-1. Under the high-greenhouse-gas-emission scenario, lake surface temperature and lake heatwave duration were projected to increase by 2.2 °C and 197 d at the end of the 21st century, respectively. Such drastic changes would worsen the environmental conditions of lakes subjected to high and increasing anthropogenic pressures, posing great threats to aquatic biodiversity and human health.

How to cite: Wang, X., Shi, K., Zhang, Y., Qin, B., Zhang, Y., Wang, W., Woolway, R. I., Piao, S., and Jeppesen, E.: Climate change drives rapid warming and increasing heatwaves of lakes, EGU General Assembly 2024, Vienna, Austria, 14–19 Apr 2024, EGU24-3036, https://doi.org/10.5194/egusphere-egu24-3036, 2024.

EGU24-3051 | Orals | HS10.6

A novel high-resolution in situ tool for studying biogeochemical processes in aquatic systems: The Lake Aiguebelette case study 

Roberto Grilli, Tonya DelSontro, Josette Garnier, Frederick Jacob, and Julien Némery

Inland waters are a significant source of atmospheric methane (CH4), a greenhouse gas (GHG) 34-85 times stronger than carbon dioxide (on 100 to 20-yr timescales) and responsible for ~23% of global radiative forcing. Of the GHGs produced by inland waters (i.e., carbon dioxide, CH4 and nitrous oxide), CH4 is responsible for ~75% of the climatic impact of aquatic GHG emissions with aquatic CH4 emissions comparable to the largest global CH4 emitters - wetlands and agriculture. Considering that aquatic systems contribute up to half of global CH4 emissions and that CH4 is predominantly formed in anoxic environments such as lake sediments, the source and quantification of ubiquitous surface CH4 observed in most aquatic systems are a question of global importance.

In this work we present the first deployment of a novel membrane inlet laser spectrometer (MILS) instrument, composed of a mid-infrared spectrometer for simultaneous detection of CH4, C2H6 and  d13CH4 coupled with a fast response (t90 < 30sec) membrane extraction system. During a 1-day field campaign, we performed a 2D mapping of dissolved CH4, C2H6 and d13CH4 of surface water of Lake Aiguebelette (France) highlighting the advantages of continuous high-resolution mapping of dissolved gases.

The results showed the presence of CH4 sources less enriched in 13C in the littoral zone (presumably the littoral anoxic sediments). The CH4 pool became more enriched in 13C with distance from shore, suggesting that oxidation processes prevailed over epilimnetic CH4 production. The data obtained were in line with recent multi-lake studies.

How to cite: Grilli, R., DelSontro, T., Garnier, J., Jacob, F., and Némery, J.: A novel high-resolution in situ tool for studying biogeochemical processes in aquatic systems: The Lake Aiguebelette case study, EGU General Assembly 2024, Vienna, Austria, 14–19 Apr 2024, EGU24-3051, https://doi.org/10.5194/egusphere-egu24-3051, 2024.

EGU24-3661 | Orals | HS10.6

Surface geochemistry controls 'hot-spots' of dust emission at Etosha Pan, Namibia 

Giles Wiggs, Natasha Wallum, Robert Bryant, and Richard Reynolds

Dust emissions from ephemeral playas are characterized by considerable spatiotemporal variability.  It has proven extremely difficult to resolve the complex dynamics between climatic conditions and surface crust characteristics that control aeolian dust emissivity.  In this study we used multitemporal satellite remote sensing and model reanalysis data to determine the climatic environments, surface sediment mineralogy, and hydrological context associated with the formation of ‘hot-spots’ of dust emission at Etosha Pan, Namibia. A twenty-year record (2000–2022) of dust source locations was established from MSG-SEVIRI and MODIS data, which enabled the identification of clusters of dust sources (‘hot-spots’). Using a time-series of Landsat 8-9 data we identified the surface mineralogical characteristics associated with the development of these ‘hot-spots’ of dust emission. These analyses were validated using reflectance spectroscopy and XRD analyses of sediment samples collected from the field. Linear spectral unmixing was applied to map the relative proportions of identified evaporite and clay mineral spectral endmembers from pixel spectra of Landsat image time-series. Results show that the development of emissive ‘hot-spot’ dust sources are associated with the formation of evaporite mineral crusts through the process of salt efflorescence initiated by wet season flooding events. Field experimentation using a portable wind tunnel combined with remote sensing analysis demonstrates that high winds in the dry season can break down this mineral crust exposing large quantities of fine and highly emissive sediments that are extremely susceptible to aeolian entrainment. Surface crust geochemistry, influenced by flooding history, therefore offers a first-order control on the development of ‘hot-spots’ of dust emission (Figure 1). The approach described here could be used at other ephemeral playas that are significant dust sources to elucidate hydrological and mineralogical controls on aeolian dust emission and to enhance regional-scale dust emissions modelling.

Figure 1. Landsat 8 OLI image time-series and linear spectral unmixing model outputs showing changes in crust mineralogy (abundance of saponite, montmorillonite, and thenardite) influenced by the flooding history of the surface and determining the location of emissive ‘hot-spots’ of dust emission (outlined) at Etosha Pan for the 2018 winter dust season (May to September).


How to cite: Wiggs, G., Wallum, N., Bryant, R., and Reynolds, R.: Surface geochemistry controls 'hot-spots' of dust emission at Etosha Pan, Namibia, EGU General Assembly 2024, Vienna, Austria, 14–19 Apr 2024, EGU24-3661, https://doi.org/10.5194/egusphere-egu24-3661, 2024.

EGU24-4013 | Orals | HS10.6

Unraveling the hydrological dynamics of Lake Urmia: A comprehensive analysis of the impact of climatic changes and agricultural water extraction on lake level decline 

Stephan Schulz, Sahand Darehshouri, Tanja Schröder, Elmira Hassanzadeh, and Christoph Schüth

Lake Urmia, one of the largest hypersaline lakes on earth, known for its unique biodiversity, has experienced a profound and alarming decline in water levels over the last two decades, posing a huge threat to the lake's complex ecosystems. The causes of this decline are subject to controversy and vary between blaming mismanagement of water resources and attributing it to climate change. In order to find out the reasons for the drying up of Lake Urmia, we have conducted a series of studies to quantify the water balance components of Lake Urmia and analyze their temporal evolution and interaction over the last five decades. These studies encompass various methods, including the development of an improved bathymetric model using remote sensing data (Schröder et al., 2022), laboratory experiments to estimate the evaporation of the dried-up lake bed (Darehshouri et al., 2020, 2023) as well as setting up a water balance model, accompanied by a statistical analysis of lake inflow and meteorological variables (Schulz et al., 2020). Our results show that the fluctuations in the water levels of Lake Urmia during the study period are mainly related to weather conditions. Nevertheless, scenario simulations also revealed that agricultural water extraction, which has even exceeded the residual lake inflow in recent years, is also a decisive factor. The influence of irrigation water withdrawal on the volume of the lake can thus either strengthen the stability of the lake or accelerate its collapse. This differentiated understanding is essential for informed decision-making and sustainable management strategies to preserve or restore the ecological functioning of Lake Urmia.

Darehshouri, S., Michelsen, N., Schüth, C., and Schulz, S.: A low‐cost environmental chamber to simulate warm climatic conditions, Vadose Zone Journal, 19, https://doi.org/10.1002/vzj2.20023, 2020.

Darehshouri, S., Michelsen, N., Schüth, C., Tajrishy, M., and Schulz, S.: Evaporation from the dried-up lake bed of Lake Urmia, Iran, Science of The Total Environment, 858, 159960, https://doi.org/10.1016/j.scitotenv.2022.159960, 2023.

Schröder, T., Hassanzadeh, E., Darehshouri, S., Tajrishy, M., and Schulz, S.: Satellite based lake bed elevation model of Lake Urmia using time series of Landsat imagery, Journal of Great Lakes Research, 48, 1710–1717, https://doi.org/10.1016/j.jglr.2022.08.016, 2022.

Schulz, S., Darehshouri, S., Hassanzadeh, E., Tajrishy, M., and Schüth, C.: Climate change or irrigated agriculture – what drives the water level decline of Lake Urmia, Scientific Reports, 10, 236, https://doi.org/10.1038/s41598-019-57150-y, 2020.

How to cite: Schulz, S., Darehshouri, S., Schröder, T., Hassanzadeh, E., and Schüth, C.: Unraveling the hydrological dynamics of Lake Urmia: A comprehensive analysis of the impact of climatic changes and agricultural water extraction on lake level decline, EGU General Assembly 2024, Vienna, Austria, 14–19 Apr 2024, EGU24-4013, https://doi.org/10.5194/egusphere-egu24-4013, 2024.

Under threat from climate change Türkiye's alkaline lakes are alarming

Lakes district of Turkey, located in the southwest, host the majority of the Turkish lakes. These lakes (Acıgol, Yarisli, Burdur and Salda) are not only valuable for their unique water chemistry but also for their role in supporting biodiversity and serving as important habitats for various species, especially birds. The impact of climate change, alongside human activities like uncontrolled land use and agriculture, is visibly altering these crucial ecosystems. The decrease in annual precipitation in the Aegean and Mediterranean regions, coupled with overall global climate changes, is directly affecting the water levels of the lakes. The drying out of approximately 1.5 million hectares of Turkish wetlands over the last century highlights the severity of the situation. Preserving these lakes is crucial not only for their ecological significance but also for their potential analogs, like Lake Salda, which offer invaluable insights into understanding geological landscapes similar to those found on other planets, such as Mars. Addressing these challenges requires urgent action. Strategies to mitigate the impact of climate change and implementing sustainable land use practices, are essential. Additionally, regulate and manage anthropogenic activities (e.g., agriculture and land use) around the lakes can help alleviate the pressure on these fragile ecosystems. Conservation efforts, combined with public awareness and policy changes, can play a vital role in protecting these lakes and preventing further deterioration.


How to cite: Balci, N.: Under threat from climate change Türkiye's alkaline lakes are alarming, EGU General Assembly 2024, Vienna, Austria, 14–19 Apr 2024, EGU24-5047, https://doi.org/10.5194/egusphere-egu24-5047, 2024.

EGU24-5434 | ECS | Orals | HS10.6 | Highlight

The impact of extreme heat on lake warming in China 

Weijia Wang, Kun Shi, and Iestyn Woolway

Global lake ecosystems are subjected to an increased occurrence of heat extremes, yet their impact on lake warming remains poorly understood. In this study, we employed a hybrid physically-based/statistical model to assess the contribution of heat extremes to variations in surface water temperature of 2260 lakes in China from 1985 to 2022. Our study indicates that heat extremes are increasing at a rate of about 2.08 days/decade and an intensity of about 0.03 °C/ day·decade in China. The warming rate of lake surface water temperature decreases from 0.16 °C/decade to 0.13 °C/decade after removing heat extremes. Heat extremes exert a considerable influence on long-term lake surface temperature changes, contributing 36.5% of the warming trends within the studied lakes. Given the important influence of heat extremes on the mean warming of lake surface waters, it is imperative that they are adequately accounted for in climate impact studies.

How to cite: Wang, W., Shi, K., and Woolway, I.: The impact of extreme heat on lake warming in China, EGU General Assembly 2024, Vienna, Austria, 14–19 Apr 2024, EGU24-5434, https://doi.org/10.5194/egusphere-egu24-5434, 2024.

EGU24-5495 | ECS | Orals | HS10.6

Improvements of Radiative Transfer Processes in CoLM-Lake based on applications in in-situ lake simulations 

Xueqi Cao, Nan Wei, Zhongwang Wei, and Xingjie Lu

Lakes play an important role in the context of climate change response, necessitating accurate simulation of their thermal states to address associated challenges. Despite the progress in lake modeling, the description of several processes within current models require improvement. Traditional 1-D models often neglect the extinction effect of lake ice and oversimplify the extinction coefficient of lake water with a parameterized schemes. Moreover, the radiative transfer scheme adheres to the conventional Beer law. This study aims to enhance the radiative transfer process within the CoLM-Lake (The Common Land Model – Lake scheme). Implementation steps involve integrating observed water extinction coefficients for individual lakes, introducing the ice extinction coefficient, distinguishing radiation calculations between the visible light and infrared band, and replacing the traditional Beer law with a two-stream approximation scheme. The research analyzes simulation results regarding to freeze-thaw cycles, latent heat flux, sensible heat flux, lake surface temperature, and vertical temperature profiles. Results indicate that the simulated European lake surface temperatures driven by ERA5-LAND outperforms those for American lakes by CoLM-Lake. Incorporating observed water extinction coefficients, adding ice extinction, and employing the two-stream approximation scheme results in slight changes to the freeze-thaw date, but significant variations in ice thickness. For lakes with greater depths, the simulated latent and sensible heat flux exhibit substantial improvements, with more consistency with observed data. Validation of vertical temperature profiles for Nam Co (92m) and Sparkling (18m), two representative lakes, reveals that the original CoLM-Lake scheme overestimates/underestimates the upper lake temperature of Nam Co during summer/winter, and underestimates the winter upper temperature and summer lower temperature of Lake Sparkling. However, considering ice extinction and implementing the two-stream approximation mitigates these simulation errors. The study further incorporates ice dynamic processes into CoLM-Lake, distinguishes lake ice ages, and differentiates ice between blue and white ice, with subsequent evaluation. In conclusion, adopting the proposed scheme enhances the physical processes within CoLM-Lake, resulting in improved simulation performance.

How to cite: Cao, X., Wei, N., Wei, Z., and Lu, X.: Improvements of Radiative Transfer Processes in CoLM-Lake based on applications in in-situ lake simulations, EGU General Assembly 2024, Vienna, Austria, 14–19 Apr 2024, EGU24-5495, https://doi.org/10.5194/egusphere-egu24-5495, 2024.

The Caspian Sea and Black Sea are the two earth's largest inland seas. Projections of their temperature, circulation and water balance responses to greenhouse warming remain largely uncertain. We investigated hydrodynamic changes of the two water bodies in a high-resolution CESM1 simulation, in which both the Caspian Sea and Black Sea are simulated by the ocean model (POP2). It turns out the mean surface water temperature of the two seas will increase by about 2.5°C in response to CO2 doubling in the atmosphere. Meanwhile, reduction of wind stress curl will lead to a spin-down of the main gyre circulations particularly in the Black Sea, which was also evidenced by a two-dimensional ocean model with joint effect of baroclinicity and bottom relief being considered. Our results also show that future evaporation enhancement due to surface warming will lead to a negative water balance for both seas, which is equivalent to a mean sea level trend of -0.1 m/year when CO2 concentration in the atmosphere doubles. These hydrodynamic changes are likely to exert large impacts on the aquatic ecosystems, fisheries, and human societies in the coastal areas.

How to cite: Huang, L., Timmermann, A., and Lee, S.-S.: Hydrodynamic responses of the Caspian Sea and Black Sea to greenhouse warming in a high-resolution ocean-atmosphere coupled climate model, EGU General Assembly 2024, Vienna, Austria, 14–19 Apr 2024, EGU24-7193, https://doi.org/10.5194/egusphere-egu24-7193, 2024.

EGU24-8316 | ECS | Posters on site | HS10.6

Dissolved Oxygen Dynamics in Arctic and Boreal Lakes in Late Winter 

Ezgi Asirok, Georgiy Kirillin, Hans-Peter Grossart, and Tobias Goldhammer

Arctic and boreal lakes in the Northern Hemisphere experience annual ice cover lasting 4 to 7 months. Freshwater lakes in cold regions are sensitive to subtle environmental changes and influenced by various physical and biogeochemical factors. Our study focuses on comparative analysis of under-ice metabolism shaped by the thermal and oxygen dynamics of Arctic Lake Kilpisjarvi and Boreal Lake Paajarvi during the late winter. We aim to understand the effect of different trophic levels and light regimes on lake metabolism within cold regions by using high-frequency data on temperature, dissolved oxygen, and solar radiation for Lake Kilpisjarvi in 2019 and 2020, and Lake Paajarvi in 2022. Besides the long-term data, we compared the phytoplankton biomass and chemical parameters obtained from water samples collected from different depths. We studied the changes in the vertical distribution of lake metabolism by diel cycles by considering the strength and influence of internal motions on temperature and oxygen data.

Our results demonstrate that following prolonged darkness, a significant increase in dissolved oxygen occurs in the upper water column of Lake Kilpisjarvi. The depth of the mixed layer increases with depth, ranging from 1.1 m/day to 2.3 m/day for 2019 and 2020 in Kilpisjarvi. In contrast, Lake Paajarvi has a slower and steady rate of deepening at 0.55 m/day, resulting in a comparatively shallow mixed layer.


How to cite: Asirok, E., Kirillin, G., Grossart, H.-P., and Goldhammer, T.: Dissolved Oxygen Dynamics in Arctic and Boreal Lakes in Late Winter, EGU General Assembly 2024, Vienna, Austria, 14–19 Apr 2024, EGU24-8316, https://doi.org/10.5194/egusphere-egu24-8316, 2024.

EGU24-8417 | Orals | HS10.6

Understanding the performance of three 1-D lake models over Yangtze River Basin 

Omarjan Obulkasim, Shulei Zhang, and Yongjiu Dai

Lake thermal processes greatly impact the local climate and environment and are sensitive to climate change and human interference. The Yangtze River Basin has the highest lake density in China, boasting diverse natural and artificial water bodies; however, there is still a lack of comprehensive understanding and effective simulation approaches for the thermal processes of the various lakes in this area. This study, utilizing observed lake surface temperatures, thermal stratification data, and evaporation data from lakes in the region, provides key parameters for three one-dimensional lake models (namely, Simstrat, CoLM-Lake, and Flake) and comprehensively assesses their performance in the region. The findings indicate that all three models demonstrate robust accuracy in simulating shallow lakes (primarily natural lakes) but show substantial differences in performance when simulating deep lakes (mainly reservoir water bodies). Specifically, Simstrat excels in reproducing the thermal stratification of deep lake. It also demonstrates good performance in simulating lake surface temperature and evaporation, which is primarily attributed to the integration of Monin-Obukhov similarity theory into Simstrat. However, its ability to model temperature diffusion during the colder seasons requires further improvement. CoLM-Lake, while capable of simulating thermal stratifications, shows limitations in maintaining stability in deeper stratifications. Flake, on the other hand, encounters substantial challenges in accurately estimating turbulence effects in deeper lakes, particularly in autumn and winter. This study provides valuable insights for improving the simulation of lake thermal processes, particularly for deep artificial water bodies, which will enhance our understanding of lake thermal changes and their impacts in the Yangtze River Basin.

How to cite: Obulkasim, O., Zhang, S., and Dai, Y.: Understanding the performance of three 1-D lake models over Yangtze River Basin, EGU General Assembly 2024, Vienna, Austria, 14–19 Apr 2024, EGU24-8417, https://doi.org/10.5194/egusphere-egu24-8417, 2024.

EGU24-8991 | Orals | HS10.6 | Highlight

Sudden disappearance of winter ice from Caldera Lake Öskjuvatn, Iceland 

Jon Olafsson, Solveig Olafsdottir, and Ingibjörg Jónsdóttir

The caldera Lake Öskjuvatn lies in the remote Dyngjufjöll Mountains in Iceland´s interior. The lake is at 1050 m elevation, it is 11 km2 and 217 m deep. The lake developed after an eruption in 1875. From 1921 to 1926 there were volcanic eruptions in and around the lake. The lake is cold but thermal activity at has been observed at 80 m depth which generally maintains a small opening in the winter ice. There are furthermore several warm marginal springs and seeps (Ólafsson 1980). In February 2012 remote sensing data unexpectedly revealed progressively disappearing ice cover which resulted in Lake Öskjuvatn being totally ice-free by late March. This normally occurs in late June.  We investigated the ice-free lake in early April 2012 and again when the lake was ice covered in April 2013.Using SeaBird Sea Cat CTD instrument and Niskin bottles for water sampling we acquired data to compare the state of the lake under ice-free and ice-covered conditions. From April 2012 to July 2014, we had a moored string of Star-Oddi recording temperature sensors from surface to 60 m depth at a location in the deepest part of the lake. We examined the lake water chemical composition for evidence of active volcanism. The differences in the temperature structure 2012 and 2013 yield signs of circulation and the moored temperature recorders illustrate seasonal variations.  With this data combined we seek to explain why the lake became ice free in 2012 but was mostly covered with 80 cm thick ice at the same time the following year.

Ólafsson, J. (1980). "Temperature structure and water chemistry of the caldera Lake Öskjuvatn, Iceland." Limnology and Oceanography 25: 779-788.

How to cite: Olafsson, J., Olafsdottir, S., and Jónsdóttir, I.: Sudden disappearance of winter ice from Caldera Lake Öskjuvatn, Iceland, EGU General Assembly 2024, Vienna, Austria, 14–19 Apr 2024, EGU24-8991, https://doi.org/10.5194/egusphere-egu24-8991, 2024.

Many terminal lakes in Central Asia have witnessed concerning rates of shrinkage in recent decades. These lakes are particularly sensitive to both climate change and human water withdrawals. Although human water withdrawals are acknowledged as a major factor influencing long-term lake changes, previous studies often fail to distinguish the specific contributions of different sectors such as irrigation, livestock, industry, and domestic water usage. This knowledge gap is largely due to the absence of observed multi-sectoral water withdrawals. Recognizing the value of machine learning methods in predicting water withdrawals through complex, non-linear relationships between water uses and potential explanatory factors, we developed an innovative approach that integrates a hydrological model and a machine learning-based water use model. This methodology was applied to simulate the long-term changes in the area of Ebinur Lake, a large terminal lake in Central Asia. Water withdrawals estimated by Random Forest based on meteorological (temperature and precipitation) and socio-economic data (e.g., population, multi-sectoral GDP, per capita income, etc.) and allocated by irrigated area and population were extracted from the river route in the hydrological model which in turn affects the inflow into the lake. Finally, integrated model simulations were validated using remotely sensed lake areas and streamflow data from mountain hydrologic stations. Several experiments, including and excluding different sectoral water uses, were conducted to isolate factors influencing lake dynamics. The results indicated irrigation water withdrawal not only caused lake shrinkage, but also increased seasonal variability, thereby increasing the uncertainty of water supply to lake ecosystems. The proposed modelling approach provided a framework for quantifying the responses of terminal lake area changes to different sectoral water withdrawals in arid basins, especially in the absence of specific water withdrawal data.

How to cite: Deng, H., Flörke, M., Lei, K., and Tang, Q.: Estimating Multi-sectoral Water Withdrawals Through Machine Learning for Attribution in an Ungauged Terminal Lake Basin in Central Asia, EGU General Assembly 2024, Vienna, Austria, 14–19 Apr 2024, EGU24-10921, https://doi.org/10.5194/egusphere-egu24-10921, 2024.

EGU24-12006 | ECS | Orals | HS10.6

Integrated water balance reveals that Lake Titicaca is driven by extreme climate variability 

Nilo Lima, Denis Ruelland, Marisa Escobar, Antoine Rabatel, Waldo Lavado, and Thomas Condom

For decision making, it is crucial to provide an estimate of the main water balance fluxes to help understand trends and drivers of lake fluctuation in the past and in the future. However, the quantification of fluxes is a complicated task due to the scarcity of hydro-climatic data in space and over time, which hampers addressing all the local and regional hydrological processes at play, notably in the face of multi-decadal climatic and anthropogenic changes. These challenges are addressed at the scale of the Lake Titicaca hydro-system (57000 km2). Lake Titicaca (8400 km2) is located at 3812 m a.s.l. in the Altiplano of South America. Lake water levels measured since the beginning of the last century show extreme fluctuations within a range of approximately 6 m. This study presents an approach to disentangle the climatic and anthropogenic drivers of past  fluctuation of Lake Titicaca. For this, we implemented a conceptual integrated modeling chain that represents the following components: (i) production and routing processes based on a precipitation-runoff model including snow and glacier as well as net water consumption from irrigation in order to estimate lake inflows; and (ii) lake basic functioning according to inflows, direct precipitation and evaporation, bathymetry and outflows. The modeling chain was implemented in the Water Evaluation and Planning System (WEAP) platform at a daily time step over a 30-year period (1985–2015) and was driven by climate inputs derived from ground station data and ERA5 reanalysis. Model calibration and evaluation was based on geodetic mass balance, catchment streamflow, and lake water levels. The results indicate that the estimated annual water balance in the upstream catchments shows that the climate regime is mainly dominated by rainfall since snowfall only represents 1% of total precipitation (716 mm). Ice melt also accounts for 1% of total precipitation. The simulated actual evapotranspiration represents on average 565 mm year-1, of which 3% correspond to net irrigation consumption. Runoff is approximately 173 mm year-1. By scaling this runoff to the lake area, upstream inflow represents 53% of the total inflows into the lake (1818 mm year-1), the remaining 47% corresponding to direct precipitation over the lake. Evaporation losses from the lake are estimated to mean annual value of 1718 mm and downstream outflows 142 mm. Then, the Lake Titicaca is primarily driven by interannual variations in precipitation. The evaporation rate can exacerbate conditions in dry years. The integrated modeling chain will later be used to assess how water levels could be altered by climate change and management options such as water withdrawals and lake releases.

How to cite: Lima, N., Ruelland, D., Escobar, M., Rabatel, A., Lavado, W., and Condom, T.: Integrated water balance reveals that Lake Titicaca is driven by extreme climate variability, EGU General Assembly 2024, Vienna, Austria, 14–19 Apr 2024, EGU24-12006, https://doi.org/10.5194/egusphere-egu24-12006, 2024.

Climate change is an inevitable phenomenon that has a great impact on the physical, chemical, and biological effects on water bodies, among which water temperature is a key parameter that needs to be closely monitored. As the largest lake in Central Europe, Lake Balaton provides important recreational and ecological values that could be affected by global warming and anthropogenic activities, which lacks comprehensive spatiotemporal analysis. Our study leverages multisource data on Google Earth Engine (GEE) to conduct a temperature variation analysis over two decades and detailed spatial variations across different parts of the lake, with in-situ data serving as both auxiliary and validation source. With an accuracy of 1.6 °C and a seasonal quantile difference within 1 °C, the satellite-based observations are in good agreement with the in-situ measurements. In the inter-annual analysis, water temperature increases at 0.7 ℃/decade, closely paralleling the 0.6 ℃/decade rise in air temperature, with more notable warming in annual minimum and winter temperatures, particularly in the shallowest basin. For intra-annual temperature analysis, we propose a cumulative temperature anomaly method to examine temperature variations in each month, which shows distinct change patterns between different basins. This implies that during warmer months, the western, shallower regions exhibit relatively higher temperatures, while in cooler months, the deeper, eastern areas show elevated temperatures. Water depth has high correlations with seasonal temperature of the entire lake. In near-coast areas, windspeed induces cooling effects, while artificial surfaces contribute to water warming. The GEE user interface provides easy access for scientists and the public, and the open-source code can be readily customized to other lakes.

How to cite: Li, H.: Unveiling Spatio-Temporal Patterns of Water Temperature in Lake Balaton Through Remote Sensing Data Analysis, EGU General Assembly 2024, Vienna, Austria, 14–19 Apr 2024, EGU24-12120, https://doi.org/10.5194/egusphere-egu24-12120, 2024.

EGU24-12193 | ECS | Posters on site | HS10.6

Reconstructing and modelling lake mixing regimes in southern Finland 

Leeza Pickering, Emma Hocking, Paul Mann, Leanne Wake, Saija Saarni, Timo Saarinen, and Maarten van Hardenbroek van Ammerstol

By 2100AD, it is predicted that approximately 16% of lakes worldwide will experience less frequent mixing and become permanently stratified (meromictic) as a result of climate change. Within the Arctic and subarctic, it is anticipated that increases in global air temperature will be magnified leading to strong feedback effects on the climate system, drastic changes in ecologically sensitive aquatic systems and increasing carbon emissions from lakes. Finland contains a dense network of lakes of differing mixing regimes, including meromictic lakes, enabling the opportunity to understand their response to warming temperatures. Hydroclimatic reconstructions have been undertaken, however they have not been focused on mixing regime changes and they have not been combined with modelling efforts to fully understand changes across past, present, and future timescales. Here, we present preliminary results from reconstructions of lake mixing regimes from sediment cores and initial modelling results from five lakes in the Evo National Park, southern Finland. We take a multi-proxy approach to reconstruct lake mixing regimes, including analysis of geochemistry (micro-XRF), chironomids, bacterial pigments, radiocarbon dating and varve counting. Ultimately understanding how lakes have responded to past changes in climate will enable baselines to be established against which to assess any future changes and will also enable models projecting future mixing regime changes to have appropriate boundary conditions set. The General Lake Model, forced with field data provided by Lammi Biological Research Station and from two fieldwork seasons in 2023, is used to understand contemporary and predict future mixing regimes. This research provides a full chronology of lake mixing regimes from the mid Holocene until 2100 linking climatic events with mixing regime changes through combining palaeoenvironmental reconstructions and modelling efforts.

How to cite: Pickering, L., Hocking, E., Mann, P., Wake, L., Saarni, S., Saarinen, T., and van Hardenbroek van Ammerstol, M.: Reconstructing and modelling lake mixing regimes in southern Finland, EGU General Assembly 2024, Vienna, Austria, 14–19 Apr 2024, EGU24-12193, https://doi.org/10.5194/egusphere-egu24-12193, 2024.

EGU24-12409 | ECS | Posters on site | HS10.6

New insights into alien aquatic plants ecology - response model to an elevated water temperatures 

Mateusz Draga, Maciej Gąbka, Ewa Szczęśniak, Stanisław Rosadziński, Daniel Lisek, and Łukasz Bryl

Freshwater ecosystems are widely recognized as a significant global biodiversity hotspot. Unfortunately, they are also highly vulnerable to the expansion of invasive aquatic species, whose spread is considered among the top threats to these ecosystems. Especially problematic are alien aquatic plants species whose rapid growth often disrupts local communities and may even alter physicochemical conditions of a given freshwater ecosystem. Since most of invasive aquatic plants are native to tropical regions of the world, their occurrence in some Central and Eastern Europe countries was, until relatively recently limited by cold winters typical for this part of the continent. However, in the last two decades, we have observed a sharp increase in these species abundances in this part of Europe, which can be linked to the warmer winters resulting from the ongoing climate change. In our study, we examine the effects of temperature changes resulting from global warming on the development and occurrence of several aquatic alien plant species. Our analysis is based on our unique data base that contains extensive information about all currently known alien vascular aquatic plant species present in Poland as well as their precise location. This data is notable for being the first such database summarizing the current status of aquatic plant invasions for this country. Based on it, as well as temperature data from the last several years, we created generalized additive models (GAM) for temperature response for each of 15 aquatic alien plant species known for Poland. Our results show a strong relationship between rising temperatures and the spread of certain species, i.e. Azolla filiculoides. Furthermore, spread of such species as Elodea nuttallii and Lemna turionifera in Poland does not rely strongly on temperature. Presence of some species was found to be highly dependent on highly thermally altered or thermally contaminated waters, i.e. Vallisneria spiralis, Hygrophila polysperma, and  thus their occurrence is still limited only to such locations. Our results confirm the major role of elevated temperatures and thermal modification of waters in the distribution of alien aquatic plants.

How to cite: Draga, M., Gąbka, M., Szczęśniak, E., Rosadziński, S., Lisek, D., and Bryl, Ł.: New insights into alien aquatic plants ecology - response model to an elevated water temperatures, EGU General Assembly 2024, Vienna, Austria, 14–19 Apr 2024, EGU24-12409, https://doi.org/10.5194/egusphere-egu24-12409, 2024.

EGU24-12466 | ECS | Orals | HS10.6

Varying lake surface cover for reanalysis application 

Margarita Choulga, Gianpaolo Balsamo, Souhail Boussetta, Tom Kimpson, Ekaterina Kurzeneva, Elena Shevnina, and Patricia de Rosnay

Lakes modify the structure of the atmospheric boundary layer. They can intensify winter snowstorms, increase/decrease surface temperature and amount of precipitation. It has been shown that monthly varying lake surface cover has a significant positive impact over regions with prolong rain and dry seasons, especially over Malaysia, Indonesia and Papua New Guinea (see Kimpson et al., 2023).

At European Centre for Medium-Range Weather Forecasts (ECMWF) current lake mask is constant over time and represent permanent water over the period 1984-2018. To meet reanalysis requirements of monthly varying high-resolution lake mask outlined in CERISE project the Joint Research Centre (JRC) Global Surface Water Explorer (GSWE) dataset (Pekel et al., 2016) was used. Applied methodology, its advantages and drawbacks, as well as first results of monthly lake surface cover maps will be presented.

How to cite: Choulga, M., Balsamo, G., Boussetta, S., Kimpson, T., Kurzeneva, E., Shevnina, E., and de Rosnay, P.: Varying lake surface cover for reanalysis application, EGU General Assembly 2024, Vienna, Austria, 14–19 Apr 2024, EGU24-12466, https://doi.org/10.5194/egusphere-egu24-12466, 2024.

Desiccating arid lakes are a global problem in the face of dwindling water supplies through climate-induced droughts and intensified human activities, including damming, agriculture, and urban expansion. The deleterious consequences of declining water supplies are exacerbated by anthropogenic pollution, which increases rates of ecosystem collapse. The Salton Sea, California’s largest lake with a current maximum depth of only 10 meters, is suffering in these ways. Despite significant investments in the creation of wetlands and planning in-basin restructuring to combat salinity increases, the lake's primary purpose, as stated in the Water Quality Control Plan for the Colorado River Basin, remains drainage collection from irrigated cropland. This long-standing policy allowed unchecked inputs of nutrient-rich agricultural runoff for the last century. Because surface flow from tributaries and agricultural canals is the primary input to this terminal lake, extreme eutrophication results in ecosystem challenges made worse by declining lake level. For example, eutrophication via excessive nitrogen and phosphorus influx and evapoconcentration trigger algal blooms and concomitant suboxia/anoxia and sulfidic conditions in deeper waters. These conditions threaten aquatic life as well as human health through likely pathogen production.

Data spanning the past two decades reveal critical patterns of nutrient cycling and related consequences for basin chemistry and ecologies. Summer is marked by an overall decrease in total phosphate and nitrate concentrations due to increased primary production, which is sustained by the combination of enhanced release of phosphorus from sediments during summer anoxia and surface water inputs. Year-round N:P molar ratios in the water column exceed 50:1 to 100:1, deviating from the Redfield ratio of 16:1. However, phosphorus, which is persistently loaded through surface runoff and release from sediments, is never strongly depleted in the water column, challenging previous studies in the Salton Sea that suggest phosphorus limitation. Rapidly declining lake levels show significant changes in thermo- and chemo- stratification of the water column, including declines in dissolved oxygen and changing seasonal redox patterns. These trends suggest that the Salton Sea will become increasingly unsuitable for wildlife due to worsening water quality, which could undermine at least some habitat restoration efforts planned or already underway, such as those focused primarily on controlling salinity. As such, the more effective approach will require dramatic reduction in nutrient loading, necessitating the establishment and enforcement of Total Maximum Daily Loads (TMDLs) maintained via wetlands and/or treatment facilities at tributary mouths. Beyond regional concerns, the Salton Sea serves as an important example of the many interwoven threats to ecology, regional public health, and overall quality of life for those living in the basins of drying lakes. These are system experiencing complex chemical evolutions driven by direct human activities, such as agricultural runoff, and indirectly through anthropogenic climate change. The Salton Sea serves as an important case study for the importance of comprehensive integration of an atypically broad range of chemical, biological, and physical data and interpretations in policy decisions.

How to cite: Hung, C., Diamond, C., and Lyons, T.: Water quality decline in California’s drying Salton Sea: Relationships between nutrient pollution, water column redox, and regional ecosystem health , EGU General Assembly 2024, Vienna, Austria, 14–19 Apr 2024, EGU24-13820, https://doi.org/10.5194/egusphere-egu24-13820, 2024.

EGU24-13897 | ECS | Posters on site | HS10.6

The thermal response of lake surface water temperature to atmospheric heatwave 

Yulu Li, Gang Zhao, and Qiuhong Tang

The sensitivity of lake surface water temperature (LSWT) to atmospheric warming has been well-established due to rapid sensible heat exchange. However, the specific impact of discrete heatwave events on LSWT dynamics, including their magnitude and persistence, remains poorly understood. To address this gap, we comprehensively analyze changes in LSWT during atmospheric heatwave events across a global network of 16,609 lakes. LSWT data are derived from Landsat 5, 7, 8, and 9 satellite imagery spanning 1985 to 2021, while heatwave intensity is quantified using hourly air temperature data from the ERA5-Land reanalysis. Our analysis identifies and characterizes heatwave events and their associated LSWT changes for each lake during the study period. Key findings reveal: (1) A widespread increase in both heatwave intensity and LSWT change across the majority of lakes, highlighting a concerning intensification of coupled air-water warming trends. (2) Significant spatial heterogeneity in LSWT sensitivity to heatwaves is observed. Notably, a pronounced memory effect is detected in LSWT response to heatwaves, suggesting a lingering influence of atmospheric heat events on lake energy balance, with implications for ecosystem stability and resilience.

How to cite: Li, Y., Zhao, G., and Tang, Q.: The thermal response of lake surface water temperature to atmospheric heatwave, EGU General Assembly 2024, Vienna, Austria, 14–19 Apr 2024, EGU24-13897, https://doi.org/10.5194/egusphere-egu24-13897, 2024.

EGU24-13918 | ECS | Orals | HS10.6

Tidal responses in the semi-enclosed Bohai Sea to the delta intrusion of a high sediment-laden river 

Jiayue Sun, Jianjun Zhou, and Man Zhang

The Yellow River Delta (YRD) in the Bohai Sea (BS) is one of the most rapidly expanding deltas worldwide, owing to a giant sediment load of 1.2 Bt/a in pre-damming years that emptied into a weak tidal semi-enclosed shallow sea, with 70% of the sediment deposited within the estuarine area. Since 1855, the delta has experienced a land accretion of 20 km2/a, and the channel extends seaward at a rate of 2~3 km/a. These morphological changes have raised the base level of the river, approaching 1 m for every 10 km of the channel elongation. It constitutes one of the two key factors for the peached lower Yellow River. Nevertheless, it is not clear about the impact on the tidal regime under the delta expansion in the BS. Consequently, the long-term sedimentation evolution of the YRD under various tidal dynamics is still not well understood. In this study, tidal responses to the delta evolution were investigated using a hydrodynamic model based on Delft 3D, covering the entire BS and parts of the adjacent Yellow Sea. The historical conditions were simulated with topographic survey data (circa 1855, 1962, 1981, 2003, and 2015), and the future scenarios over the next 200 years were predicted with sediment load data. The results indicate that the main tidal amplitude (M2 tide) has changed by -1.1~3.8 mm/a, which is larger than the mean sea-level rising rate of 2 mm/a, and the flow velocity has changed by -0.42~0.55 m/s. As the YRD protruded seaward, the flow velocity along the delta increased while the increasing rate decelerated over time, historically maintaining maximum flow velocities below 0.86~0.9 m/s. In future scenarios, it gradually increased to a peak of 1.2 m/s, followed by a 10% decrease. The estuarine sediment transport capacity, which is proportional to the cube of the flow velocity, would remain limited or even diminished by around 30%, exacerbating the sedimentation in the delta estuary. With accelerated sea-level rise and limited lifespan of sand control projects, it could be more challenging to sustain the safe development of the river and delta.

How to cite: Sun, J., Zhou, J., and Zhang, M.: Tidal responses in the semi-enclosed Bohai Sea to the delta intrusion of a high sediment-laden river, EGU General Assembly 2024, Vienna, Austria, 14–19 Apr 2024, EGU24-13918, https://doi.org/10.5194/egusphere-egu24-13918, 2024.

Windblown dust has long been an air quality and public health concern among residents living around California’s Salton Sea, a region characterized by serious socioeconomic and health outcome disparities. Dropping water levels and unique biogeochemistry within the Salton Sea water itself have raised concerns regarding the human health impacts of drying sediments exposed on shrinking shorelines, as well as potential lake spray emissions from the water surface. As particles emitted from different surface types can differ greatly in terms of composition, size distribution, and other properties, variability in the resulting health impacts of particulates reaching communities in the region may likewise be source dependent. Here I will share analyses of surface-specific health outcomes associated with windblown coarse PM around the region, as well as attempts to better understand and mitigate the unique issues linked to these emissions across the basin. I will further explore similarities and differences connecting evaporating inland lakes and seas worldwide, as well as some of the opportunities for sharing knowledge and tools to address air quality changes in the increasingly dry, dusty future facing the Salton Sea basin and other analogous regions.

How to cite: Porter, W. and Miao, Y.: Tracking dust sources and human health impacts around California's shrinking Salton Sea, EGU General Assembly 2024, Vienna, Austria, 14–19 Apr 2024, EGU24-14078, https://doi.org/10.5194/egusphere-egu24-14078, 2024.

EGU24-14427 | ECS | Orals | HS10.6

Potential of greenhouse gas emissions from urban lakes recharged with STP effluent 

Amit Singh, Sanjeev Kumar Prajapati, and Attila Bai

In the past few decade’s urbanization, changing rainfall patterns, and inadequate precipitation are a few of the major reasons for dried urban lakes. Many such lakes are successfully revived using effluent from nearby sewage treatment plants. However, high nutrient loading and concentrated surface flow leads to problems like eutrophication followed by high greenhouse gas emissions (GHG). Majority of these lakes are shallow which has higher GHG emissions compared to the deeper lakes. India’s urban lakes are suffering from the similar fate. Study conducted in South Delhi, India reflects high phosphate and nitrate concentrations in the lake. Due to this, lakes are highly eutrophic and biomass concentration varies between 2 - 4.5 gL-1. Considering volume and biomass concentration, carbon dioxide sequestration comes out to be 1.2 Kg CO2/Kg of biomass. It was also seen that the average methane yield from microalgae is around 56%. It was found that total GHG potential was 5.856 Kg CO2-equivalent/ Kg of biomass which makes eutrophication a serious environmental issue. It is worth noting that microalgae in lakes decreases CO2, simultaneously increasing CH4 emissionswhich has 27-30 global warming potential (GWP) and relatively harmful for environment. In the past few decades studies reflected CH4 is responsible for 72 % of the climatic change (in CO2-equivalents) from lakes and inland waterbodies. The current study highlights the consequences of eutrophication in urban lakes with treated domestic discharge and suggests proper lake water quality management. Nevertheless, microalgae harvesting, and anaerobic digestion can be used to mitigate GHG and recover energy for a better and sustainable future.

How to cite: Singh, A., Kumar Prajapati, S., and Bai, A.: Potential of greenhouse gas emissions from urban lakes recharged with STP effluent, EGU General Assembly 2024, Vienna, Austria, 14–19 Apr 2024, EGU24-14427, https://doi.org/10.5194/egusphere-egu24-14427, 2024.

EGU24-14480 | ECS | Orals | HS10.6

Primary production and dinitrogen fixation in a subtropical inland saline environment 

Ajayeta Rathi, Siddhartha Sarkar, Abdur Rahman, and Sanjeev Kumar

For over half a century, scientists have endeavoured to measure the rates of primary production (PP) and dinitrogen (N2) fixation in a diverse range of inland waters, spanning from freshwater to saline. There is nearly an equivalent portion of the saline as well as fresh in the world's inland waters, emphasizing their significance within our continental landscapes. Lakes play crucial role in global biogeochemical processes and are fundamental for essential ecosystem functions and services. Nonetheless, swift alterations in lakes have been recognized (i.e., salinization of freshwater ecosystems) on a global scale due to shifts in climate and increasing human interventions, posing risks to the valuable services these habitats offer. While considerable research on saline lakes has occurred in the past years across Africa, Australia, and North America, there remains a substantial amount to explore in Asian lakes and beyond, necessitating investigation into these unique ecosystems worldwide.

            The current study explores rates of PP and N2 fixation within a subtropical saline lake (Sambhar, India) along with its neighbouring brine reservoir and salt pans. Incubation experiments were performed to estimate the PP and N2 fixation rates using 13C and 15N tracer techniques. The study reveals that PP and N2 fixation rates were higher in the lake than the adjacent brine reservoir. Concentrations of particulate and dissolved forms of carbon and nitrogen were also higher in the lake than the brine reservoir. However, salt pans showed huge variation in PP, but N2 fixation rates were quite low. The highest concentration of particulate and dissolved forms of carbon and nitrogen were also found in the salt pans. The high uptake rates in the lake and salt pan may be attributed to high biomass and high nutrient concentrations than the brine reservoir. The difference in the rates is possibly due to variation in salinity, temperature, nutrient concentrations, and runoff to the lake, which can affect primary producers and potentially leading to shifts in community structure and biodiversity in different systems. This study provides insights into the complex interactions of PP and N2 fixation rates with environmental parameters in a subtropical saline environment.

How to cite: Rathi, A., Sarkar, S., Rahman, A., and Kumar, S.: Primary production and dinitrogen fixation in a subtropical inland saline environment, EGU General Assembly 2024, Vienna, Austria, 14–19 Apr 2024, EGU24-14480, https://doi.org/10.5194/egusphere-egu24-14480, 2024.

EGU24-14564 | Posters on site | HS10.6

Modeling Study of Phytoplankton Responses in Lake Michigan to a Changing Climate 

Pengfei Xue, Xing Zhou, Mark Rowe, Peter Alsip, David Bunnell, Tomas Höök, Spencer Gardner, Edward Rutherford, and Paris Collingsworth

Physical factors such as water temperature, water column mixing, and light are crucial for the phytoplankton abundance and primary production in Lake Michigan. The potential impacts of climate change on these factors could significantly affect the dynamics of Lake Michigan's phytoplankton. In this study, we employed an integrated modeling framework to project the impact of climate change. This framework included a two-way coupled 3D lake-ice–climate system (GLARM), a hydrodynamic model (FVCOM), and a nutrient-phytoplankton-zooplankton-detritus (NPZD) model, further enhanced by a compartment representing the invasive quagga mussel (Dreissena rostriformis bugensis). Our approach encompassed historical simulations for the period 2005–2014, as well as two sets of future projections for the mid-21st century (2041–2049) and the late 21st century (2091–2099), utilizing the Representative Concentration Pathway (RCP) 8.5 scenario. Our findings indicate that changes in water temperature and water column mixing significantly influence the seasonal patterns of phytoplankton abundance and primary production. These changes notably alter the timing and magnitude of the winter-spring phytoplankton bloom and the depth of the chlorophyll layer. Furthermore, the model predicts an increase in primary production under the projected climate scenarios, with significant variations in both spatial and seasonal patterns.

How to cite: Xue, P., Zhou, X., Rowe, M., Alsip, P., Bunnell, D., Höök, T., Gardner, S., Rutherford, E., and Collingsworth, P.: Modeling Study of Phytoplankton Responses in Lake Michigan to a Changing Climate, EGU General Assembly 2024, Vienna, Austria, 14–19 Apr 2024, EGU24-14564, https://doi.org/10.5194/egusphere-egu24-14564, 2024.

EGU24-14682 | ECS | Posters on site | HS10.6

Human activity has decoupled surface water storage from precipitation in global drylands 

Gang Zhao, Huilin Gao, Yao Li, Qiuhong Tang, Iestyn Woolway, Julian Merder, Lorenzo Rosa, and Anna Michalak

The availability of surface water in global drylands is essential for local populations and ecosystems. However, the long-term changes in surface water storage and their underlying causes, particularly from anthropogenic activities, remain largely unknown. Here we utilized optical and altimetric remote sensing data to create monthly time series of storage changes between 1985 and 2020 for 105,400 lakes and reservoirs in global drylands. Our analysis reveals that surface water storage in global drylands has been increasing at a rate of 2.20 km3 per year, primarily due to the addition of new reservoirs. For lakes and older reservoirs constructed before 1983, their long-term storage changes are mainly attributed to anthropogenic activities, including human-induced warming and water management, rather than changes in precipitation. These observation-based findings highlight that anthropogenic activities have decoupled surface water storage from precipitation in global drylands, with significant implications for the sustainability of local society and ecosystems.

How to cite: Zhao, G., Gao, H., Li, Y., Tang, Q., Woolway, I., Merder, J., Rosa, L., and Michalak, A.: Human activity has decoupled surface water storage from precipitation in global drylands, EGU General Assembly 2024, Vienna, Austria, 14–19 Apr 2024, EGU24-14682, https://doi.org/10.5194/egusphere-egu24-14682, 2024.

EGU24-15301 | ECS | Orals | HS10.6

Historic changes and future projections of surface water temperature in Lake Titicaca 

Dieu Anh Dinh, R. Iestyn Woolway, Eleanor Jennings, and Valerie McCarthy

Lake Surface Water Temperature (LSWT) plays a crucial role in aquatic ecosystems, influencing lake physical and biogeochemical processes. LSWT serves as a critical measure of the effects of climate change on lakes. Therefore, analysing LSWT variability is vital for understanding lake response to a warming climate. Lake Titicaca, the largest lake in South America and one of the highest lakes in the world, served as an important water resource in Peru-Bolivia. However, Lake Titicaca is also affected by climate change and anthropogenic activities. In this study, we investigate the historical and future change in LSWT of Lake Titicaca at different timescales (diel, seasonal, and annual). This research used the Global LAke Surface water Temperature (GLAST) dataset for the historical period of 1981-2020 and the future projected period of 2021-2099 for SWT of Lake Titicaca. Model projections were validated with LSWT from the ESA CCI Lakes dataset (2000-2020). The results showed that (1) LSWT has an increasing trend of  +0.16 K decade-1 annually and of +0.01 K decade-1 in diel range from 1981 to 2020, (2) LSWT is expected to warm at a rate of 1-4 K under future climate change scenarios. This finding gives an insight into LSWT and diel temperature range in Lake Titicaca, and LSWT changes in historical and future under climate change. This study could be beneficial for water resource managers and decision-makers to adapt and mitigate the climate change impacts.

How to cite: Dinh, D. A., Woolway, R. I., Jennings, E., and McCarthy, V.: Historic changes and future projections of surface water temperature in Lake Titicaca, EGU General Assembly 2024, Vienna, Austria, 14–19 Apr 2024, EGU24-15301, https://doi.org/10.5194/egusphere-egu24-15301, 2024.

EGU24-15850 | Posters on site | HS10.6

Spatiotemporal Changes in Lake Water Extents in the Lakes Region (Türkiye) and the Role of Climateand Land Cover Parameters 

Çağdaş Sağır, Emin Atabey Peker, Koray Kamil Yılmaz, and Mehmet Lütfi Süzen

The impacts of global climate change extend to population dynamics, food security, agricultural activities, and water demand, thus presenting complex and urgent challenges associated particularly with the water resources. Türkiye's Lakes Region is situated in the Mediterranean region, which is recognized as a climate change hotspot and further stressed by ever-increasing water demand arising from rapid population growth. Due to the convergence of these factors, the lakes in the Lakes Region face significant challenges with the phenomenon of shrinking lakes.

This study examines the spatio-temporal changes in lake waters in Türkiye's Lakes Region, consisting of sixteen lakes. Using Landsat 5, 8, 9, and Sentinel-2 satellite images, the surface area changes were analyzed via NDWI in the Google Earth Engine environment from April 1984 to April 2023. To assess hydrological/hydrogeological conditions accurately, water volume calculations were performed in lakes having in-situ bathymetry and water level measurements. We analyzed MODIS Terra Land Cover dataset and climatic variables such as precipitation, and evaporation-transpiration to understand the degree of anthropogenic and climatic drivers effecting the study lakes.

Our results indicated that, for large lakes such as Burdur, Beyşehir and Eğirdir, the period of influence of climatic parameters is close to two years. The effect period varies based on lake bathymetry, size, and hydrodynamic characteristics of the recharge basin. Lake water losses were primarily attributed to climatic factors, with clear links to climatic parameters until 2016. After 2016, a shift of precipitation to the summer season significantly impacted the hydrological system, intensifying the shrinking in the lakes. We conclude that the dominant driver for the shrinking lakes is the climatic effects and the anthropogenic effects for the whole-time interval has been found negligible. Of the lakes considered in this study, only Lake Akşehir should be excluded from this assessment. Lake Akşehir was found to be the only lake where human impact was clearly predominant.

How to cite: Sağır, Ç., Peker, E. A., Yılmaz, K. K., and Süzen, M. L.: Spatiotemporal Changes in Lake Water Extents in the Lakes Region (Türkiye) and the Role of Climateand Land Cover Parameters, EGU General Assembly 2024, Vienna, Austria, 14–19 Apr 2024, EGU24-15850, https://doi.org/10.5194/egusphere-egu24-15850, 2024.

EGU24-16200 | Posters on site | HS10.6

Kinetic energy and anisotropy of  convective turbulence under lake ice 

Georgiy Kirillin, Sergey Bogdanov, and Galina Zdorovennova

Convective turbulence driven by gravitational instability is a fundamental mixing mechanism in geophysical flows, but in situ estimation of its characteristics is obscured by the background flows and the relatively slow temporal scales. We present characteristics of the full Reynolds tensor from a convective surface boundary layer of an ice-covered lake. The results were obtained by using an original method of measuring the full set of turbulent stresses by a combined use of two ADCPs. The strong horizontal shear stress was revealed as a characteristic feature of free convection differing from the  "conventional"  turbulent boundary flows. The ratio of normal stresses along vertical and horizontal axes remained below 1/4, demonstrating anisotropic character of turbulence asymptotically approaching the axisymmetric two-component “pancake” form. The vertical r.m.s. velocity fluctuations obeyed the buoyancy flux scaling with the coefficient of 1/3, which is at the lower boundary of previously reported values, while horizontal fluctuations followed the same scaling with a unity coefficient

How to cite: Kirillin, G., Bogdanov, S., and Zdorovennova, G.: Kinetic energy and anisotropy of  convective turbulence under lake ice, EGU General Assembly 2024, Vienna, Austria, 14–19 Apr 2024, EGU24-16200, https://doi.org/10.5194/egusphere-egu24-16200, 2024.

EGU24-16484 | Orals | HS10.6 | Highlight

An overview of Lake Urmia: a dying lake in Iran 

Namdar Baghaei-Yazdi, Ali Mohseni, and Esmaeil Fallahi

This paper is a literature review of published papers on Lake Urmia. The authors have conducted a literature search on the status of this dying lake, causation of failure, and potential of recovery.

Lake Urmia (LU) is as the largest endorheic and hypersaline lake in Iran and one of the largest saltwater lakes in the world. Anthropogenic drought, along with natural resources mismanagement based on political ideology of Islamic Republic of Iran are the preeminent factors behind the disappearance of LU.

There is a growing interest in restoration of saline lakes around the world. Eco-conscious people around the world have been concern with drying lakes of the world. Likewise in Iran the number of concern scientists and Eco-conscious public has been increasing as well. The outcry for restoration of the drying lakes inundated the scientific communities for restoration of the drying lakes. The published data indicate that LU had the least recorded shrinkage between 1987 to 2000 with less than 2% of the lake surface water area. From 2000 to 2010 LU started shrinking with rapid pace to 28% of the surface area and from 2010 to 2014. The 2 chief contributing factors to the LU shrinkage are the construction of 30 operating dams and 16 more under construction by the IRI government and the second factor is licensing the drilling of 88000 water wells in and around the lake Urmia. After years of the public outcry, finally the Government sanctioned the restoration of LU in 2014. As a part of the restoration process, the researchers using the spatio-temporal technology to detect the land cover changes and salinization progress in Urmia Lake Basin (ULB) during  2014 to 2019. The available data indicates that the area of irrigated lands around the lake increased from 1265 km2 in 1975 to 5525 km2 in 2011, resulting in disappearing of the water surface area of UL from 5982 km2 in 1995 to 586 km2 in 2014 with increased salinization in the basin of LU.  

According to most of the published investigative studies to the cause and effect of the shrinkage of the LU, the natural drought and climate changes were not the main causes of the lake LU shrinkage. We believe, restoration of the lake Urmia demands a multidisciplinary approach through integration of marine biologists, ecologists, botanists, agricultural scientists, engineers, epidemiologists, chemists, geologists, management and governmental policies experts, under the supervision and inspection of the United Nations Environmental agencies.

How to cite: Baghaei-Yazdi, N., Mohseni, A., and Fallahi, E.: An overview of Lake Urmia: a dying lake in Iran, EGU General Assembly 2024, Vienna, Austria, 14–19 Apr 2024, EGU24-16484, https://doi.org/10.5194/egusphere-egu24-16484, 2024.

Dead zones are commonly associated with marine coastal areas where rivers deposit excessive nutrients leading to local anoxia sometimes stretching for hundreds of kilometers. Marine dead zones are well-recognized for their adverse effects on ecosystems, fisheries, and coastal communities. But in contrast, the global extent and drivers of dead zone formation near inflowing rivers to the world’s lakes remains uncertain despite the importance of lakes for drinking water supplies, recreation, and biodiversity. Here, I used 742 million bias-corrected chlorophyll-a (chl-a) estimates merged over 6 satellite sensors (daily, 1 to 4 km resolution) to map dead zones at the mouths of major inflowing rivers in more than 100 large lakes and asses their changes from 1997 to 2020. Dead zones were present in lakes across geographic and climatic gradients and were associated with a combination of urban and agricultural activities in lake watersheds. Dead zones expanded in some lakes even as water quality offshore improved. This spatiotemporal complexity demonstrates the value of moderate resolution mapping of lake dead zones to inform water management decision-making and to determine the local ecological consequences of human activity. 

How to cite: Kraemer, B.: Global drivers of lake dead zone formation at the mouths of major rivers, EGU General Assembly 2024, Vienna, Austria, 14–19 Apr 2024, EGU24-17387, https://doi.org/10.5194/egusphere-egu24-17387, 2024.

EGU24-17634 | ECS | Orals | HS10.6

Vertical characterization of particles in stratified lakes 

Hossein Amini, Hossein Masigol, Georgiy Kirillin, and Hans-Peter Grossart

Density stratification is a distinctive feature of lakes characterized by a less dense layer (epilimnion) on top of a denser water (hypolimnion) separated by a strong density jump (pycnocline) between them. While the main driver of thermal lake stratification is temperature, this phenomenon changes the vertical particles distribution, which in turn may affect lake stratification, when suspended particles (including both non-organic and organic ones) cause an overall increase in water column density. Sinking of particles to denser layers changes the sinking rates and may produce particle accumulation at the density interface (pycnocline) having important consequences for organic matter turnover. To investigate the interaction of the physical water properties and distribution of particles as a consequence of the stratification, we used in this study the particle tracking system UVP 6 (Under Vision Profiler) for particle characterization in a stratified Lake Stechlin, Berlin, Germany. The preliminary results, as expected, show that the particle abundance changes in concordance with temperature, which proves the dependency of particle characteristics (size and concentration) on the vertical temperature distribution.

How to cite: Amini, H., Masigol, H., Kirillin, G., and Grossart, H.-P.: Vertical characterization of particles in stratified lakes, EGU General Assembly 2024, Vienna, Austria, 14–19 Apr 2024, EGU24-17634, https://doi.org/10.5194/egusphere-egu24-17634, 2024.

EGU24-19062 | Posters on site | HS10.6 | Highlight

Lakes amplify nitrogen and phosphorus imbalances in inflows 

Tom Shatwell, Daniel Graeber, Jantsje M. van Loon-Steensma, and Annette Janssen

Lakes are a global sink for nutrients and thus supply an important ecosystem service in the form of nutrient retention. However, it is unclear how the relative availability of nitrogen (N) and phosphorus (P) affects nutrient retention. To address this, we performed experiments with the lake model PCLakePlus on 9 lake archetypes that represent lakes of different mixing regimes (mono-, di-, and polymictic) in different climates. We forced the model with stochastically generated inflows and N and P loads to examine how the N:P ratio in inflow affects the N:P ratio in the lake outflow. In these model experiments, lakes tended to amplify imbalances between N and P in the inflow. At intermediate inflow N:P (~30), the outflow N:P was similar. However, at low inflow N:P, the outflow N:P was equal or lower, and at high inflow N:P, the outflow N:P was equal or higher. This amplification effect was most sensitive to high N input loads. This suggests that lakes either maintain or amplify N:P imbalances rather than buffering or compensating them. We explain these differences in nutrient retention with the lake phytoplankton and sedimentation dynamics. When input N:P is imbalanced, the phytoplankton biomass is generally limited by the nutrient in shortest supply, which limits the phytoplankton’s capacity to uptake the non-limiting nutrient. Consequently the nutrient in shortest supply is retained most efficiently, amplifying any stoichiometric imbalances. Since phytoplankton have a higher capacity to uptake and store excess P than excess N, high N:P ratios were amplified more than low N:P ratios. We further analysed a global dataset from the Global River Water Quality Archive and BasinATLAS, using boosted regression trees to identify the effect of different drivers and catchment characteristics on the molar TN:TP ratio in river and stream water. This showed that drivers and catchment characteristics associated with human impact increased N:P ratios, with a stronger effect at high N:P. The lake model subsequently showed that lakes further amplified this anthropogenic increase in N:P ratios, so that human induced stoichiometric imbalances from N pollution resonate through the landscape. These results shed light on the mechanisms behind the widespread phenomenon that lakes retain P preferentially over N. The successful management of P inputs into waterways has probably decreased N retention efficiency. Our research suggests that managers should reduce N inputs, for instance by employing nature-based solutions, to maintain a stoichiometric balance and protect sensitive downstream ecosystems and coastal zones. 

How to cite: Shatwell, T., Graeber, D., van Loon-Steensma, J. M., and Janssen, A.: Lakes amplify nitrogen and phosphorus imbalances in inflows, EGU General Assembly 2024, Vienna, Austria, 14–19 Apr 2024, EGU24-19062, https://doi.org/10.5194/egusphere-egu24-19062, 2024.

EGU24-19117 | Posters on site | HS10.6

Assessing Impacts of Climate Change on surface water temperatures in semi-arid alpine basins 

Javier Herrero, Antonio Collados-Lara, Matilde García-Valdecasas, Antonio Sánchez-Membrives, Cintia Ramón, María Jesús Esteban-Parra, David Pulido-Velázquez, and Francisco Rueda

Temperature plays a critical role in the functioning of inland aquatic ecosystems. The metabolic rates of aquatic organisms, their productivity, and, more broadly, the rates of biogeochemical processes are largely determined by water temperature. Hence, understanding the processes that govern temperature in water bodies in response to external factors across daily to multi-year scales is essential. This is particularly urgent in alpine semi-arid basins with substantial human impact and strong influence of snow dynamics, and, especially within the context of global change, where ecosystem integrity is at risk. A process-based model has been developed to simulate water temperature in lakes and rivers at a regional (watershed) scale. The simulation algorithms are tested in the small alpine watershed of the River Genil, upstream of the city of Granada, which includes two water-supply reservoirs (Canales and Quéntar). Urban water demand largely determines withdrawal rates from these reservoirs, thus affecting the thermal dynamics in the water column and downstream reaches. Autonomous temperature sensors have been deployed at different sites and programmed to record hourly data. The model is forced with climate databases (reanalysis, regional climate simulation, and measured data sets) and used in hindcast/forecast exercises to assess the impact of climate change on the thermal regime of inland waters.

How to cite: Herrero, J., Collados-Lara, A., García-Valdecasas, M., Sánchez-Membrives, A., Ramón, C., Esteban-Parra, M. J., Pulido-Velázquez, D., and Rueda, F.: Assessing Impacts of Climate Change on surface water temperatures in semi-arid alpine basins, EGU General Assembly 2024, Vienna, Austria, 14–19 Apr 2024, EGU24-19117, https://doi.org/10.5194/egusphere-egu24-19117, 2024.

EGU24-20529 | ECS | Orals | HS10.6

Interactions and Connectivity between Large Inland Lakes, Coastal Wetlands and Groundwater 

Brent Heerspink and Anthony Kendall

Changing climate conditions have altered sea and inland lake levels around the globe, including in the world's largest inland lake system, North America's Laurentian Great Lakes. These five lakes span the border between the United States and Canada, holding ~23,000 km3 of freshwater, including ~4,000 km3 of groundwater, which represents ~21% of the world's available freshwater. Rapid interannual changes in lake elevation of 1-2m over the last 25 years have occurred due to changing climatic conditions including precipitation, lake surface temperature and the extent of winter ice cover. Significant effort has been invested to develop predictive models for climate, runoff and lake levels in the Great Lakes region. Recent hydrologic modeling efforts have also investigated interactions between the Great Lakes and the adjacent groundwater aquifers, with a focus on groundwater as a source or sink of water to the lakes. Yet little attention has been given to the coastal hydrologic processes that control the feedback between lake levels and groundwater response. Here, we investigate the effects of lake level changes on terrestrial groundwater elevations with a coupled surface and groundwater hydrology model encompassing the entire State of Michigan, using the Landscape Hydrology Model (LHM). LHM is a gridded, process-based surface and shallow subsurface water balance model coupled to USGS MODFLOW which simulates saturated groundwater processes. We tested the effect of lake levels on terrestrial groundway by running a set of model experiments using consistent climate forcing data and different lake elevations as groundwater model boundary conditions. Results indicate the changing lake levels drive changes in terrestrial groundwater elevations of up to 2m and as far as 20 km inland. Here, we extend this study to consider how these lake-level induced changes in groundwater elevation affect the hydrologic connectivity of coastal wetlands. We explicitly consider both surface connectivity and groundwater connectivity, and how those vary in space and time. Given the predicted impacts of climate change on sea and lake levels globally, it is important to understand how feedbacks between surface and groundwater in coastal regions affect the connectivity of and ecosystem services provided by coastal wetlands. 

How to cite: Heerspink, B. and Kendall, A.: Interactions and Connectivity between Large Inland Lakes, Coastal Wetlands and Groundwater, EGU General Assembly 2024, Vienna, Austria, 14–19 Apr 2024, EGU24-20529, https://doi.org/10.5194/egusphere-egu24-20529, 2024.

EGU24-21413 | Orals | HS10.6

Fine characterization of wind drag force in shallow lakes based on the wind-wave-flow mutual feedback model 

Gao Ang, Shiqiang Wu, Xiufeng Wu, Jiangyu Dai, and Fangfang Wang

Water environment pollution and water ecological degradation are the common problems in lake. As the dynamic basis of lake system, lake hydrodynamics has a decisive influence on lake water environment and water ecology. The numerical simulation is an important means to study the characteristics of lake hydrodynamics, water environment and water ecology. For numerical simulation of lakes driven by wind, the drag force of airflow on water is usually represented by wind drag coefficient ( Cd ). Cd reflects the momentum transfer efficiency between water and airflow, and is closely related to the characteristics of wind,waves,flow and their mutual feedback mode, and is the most critical parameter to determine whether the numerical simulation results are reasonable. However, the expression methods of wind drag coefficient widely used at present are mostly proposed based on the ocean. The characteristics of ocean wind, wave, flow and their mutual feedback mode are less affected by the blowing range and water depth. Cd is mainly restricted by wind speed ( u10 ) without considering the influence of the blowing range ( F ) and water depth( d ), which has poor adaptability in lakes.

In this study, theoretical analysis, wind tunnel experiment, in-situ monitoring and numerical simulation were used to propose a model of wind-water interaction in finite water area considering the wind-wave-flow mutual feedback model. Two dimensionless numbers, u10/(gF)0.5and u10F/νw, which can be used to describe the comprehensive strength of wind-wave and wind-flow interaction in finite water area were constructed. A new expression of wind stress coefficient considering wind speed, blow distance and water depth is proposed (expression (1) ), which improves the limitation of the traditional expression considering wind speed only, overcomes the limitation of its application in limited blow distance and water depth, and maintains the overall consistency with the existing expression. When the wind speed is greater than 5m/s, the wind stress coefficient is positively correlated with u10 and F, and negatively correlated with d,the sensitivity of the three factors to the Cd is 0.92, 0.22 and 0.14, respectively. The results of the three dimensional hydrodynamic mathematical model of Lake Tai show that the simulation results of the wind stress coefficient considering the influence of three factors are more consistent with the measured results.

How to cite: Ang, G., Wu, S., Wu, X., Dai, J., and Wang, F.: Fine characterization of wind drag force in shallow lakes based on the wind-wave-flow mutual feedback model, EGU General Assembly 2024, Vienna, Austria, 14–19 Apr 2024, EGU24-21413, https://doi.org/10.5194/egusphere-egu24-21413, 2024.

EGU24-22100 | ECS | Posters on site | HS10.6

Eutrophication and Trace Metal Cycling in the Salton Sea: A Century of Industrial Impact 

Charles Diamond, Caroline Hung, and Timothy Lyons

The Salton Sea is California’s largest lake, covering almost 330 square miles of low-lying, inland desert in the Imperial and Eastern Coachella Valleys. Despite the enormous surface area of the lake, it has a maximum depth of only 10.5 meters (an aspect ratio almost identical to that of a sheet of A4 paper), and the region is subject to extreme heat in the summer. Functioning more like an industrial evaporation table, the lake would be very small if not for agricultural and municipal wastewater. Combined, these sources represent the overwhelming majority of annual inflows, with agricultural return flow making the largest contribution by far. This has remained the case for over a century, leading to a host of devastating and predictable consequences—all exacerbated by the fact that the Salton Sea is a closed basin.

Over the past hundred years, the salinity of the Salton Sea has risen steadily, while the lake level has experienced significant fluctuations, both up and down. Due to the extremely low angle of the lakebed, small changes in water level lead to dramatic shifts in the location of the shoreline. Over the past five years, for example, tens of thousands of acres of lakebed have been exposed due to water transfer agreements between local water authorities that have reduced inflow. In addition to the ecological devastation that has occurred as the lake has become saltier, the recent exposure of vast areas of lakebed has created an ongoing public health crisis linked to dust emission.

Hypereutrophication has been a persistent feature of the lake over time, as the primary source of inflow is unchecked agricultural runoff. Coupled with intense thermal stratification in the summer, high rates of algal and bacterial production in the upper meters drive respiration and anoxia below, leading to efficient recycling of nutrients and a host of consequences for the cycling of sulfur, iron, and redox-sensitive trace metals. Sulfate levels in the Salton Sea are very high (~300 mM), and the water column regularly becomes sulfidic. Most of the iron that enters the basin is sequestered into sediments as iron-oxides within the river deltas. The small amount of iron that makes it beyond quickly precipitates as iron-sulfides, leaving sediments throughout the vast interior of the lake very low in iron. Concentrations of redox-sensitive trace metals within sediments vary spatially and with depth in ways that reflect the redox stratification and overall geometry of the lake, the distribution of iron, and the history of accumulation and sequestration that has ocurred over time within a closed basin. This study explores these relationships through the integration of geochemical data from sediment cores and water samples from multiple transects within the basin, as well as major tributaries, building toward a comprehensive model of trace-metal cycling within the lake prior to and since the influence of agriculture and industry in the region began. 

How to cite: Diamond, C., Hung, C., and Lyons, T.: Eutrophication and Trace Metal Cycling in the Salton Sea: A Century of Industrial Impact, EGU General Assembly 2024, Vienna, Austria, 14–19 Apr 2024, EGU24-22100, https://doi.org/10.5194/egusphere-egu24-22100, 2024.

EGU24-383 | ECS | Orals | HS10.8 | Highlight

Characterizing changing stream flow components and hydroclimate interactions in cities – implications for future management and restoration of urban ecosystems 

Maria Magdalena Warter, Dörthe Tetzlaff, Christian Marx, and Chris Soulsby

In urbanized areas the natural flow paradigm from river management is being increasingly challenged by hydroclimatic changes and marked anthropogenic influences on flow regulation. Although the impacts of urbanization, increased runoff and reduced baseflow are increasingly well quantified; the characteristics of flow regimes that are sustainable and wanted for urban streams to preserve or restore their hydrologic and ecological integrity in the face of future climate change and rapid urbanization, remain less well understood.

To that end, we conducted a paired catchment study of two streams, both sub-catchments of the Spree catchment – a more natural intermittent rural agricultural stream in Brandenburg (Demnitzer Mill Creek) and an anthropogenically impacted urban stream in Berlin (Panke).  We characterized contrasts in inter- and intra-annual streamflow variability, storm period responses, water ages and mixing processes. Through tracer-based analyses, using stable water isotopes, we identified the physical processes (sources, flow paths and age) sustaining stream flow over multiple years (2018-2023), and broadly linking them to biological dynamics obtained through environmental DNA, in order to estimate resilience to future hydroclimate interactions and land use changes. The higher specific discharge of the urban stream emerges as a clear artefact of artificially increased baseflow due to discharge of wastewater, while reacting primarily to convective summer storms with strong runoff reactions and short discharge peaks. In contrast, the rural stream shows a characteristically intermittent behavior with longer periods without baseflow and only limited runoff reactions with only temporary superficial accumulation of water after heavy rainfall. Water ages reflected the respective runoff contributions and mixing processes, with a low contribution of young water observed in the urban stream and a higher, more variable contribution of young water in the rural stream. The strong dichotomy of runoff responses and unmistakable influence of baseflow manipulation on streamflow dynamics and biological processes point to major uncertainties in the suitability of different approaches for the restoration of urban and management of naturally intermittent rivers. Effective stakeholder engagement will be necessary in seeking to manage flow regimes to maintain ecohydrological connectivity and future resilience in the face of urban growth and climate change.

How to cite: Warter, M. M., Tetzlaff, D., Marx, C., and Soulsby, C.: Characterizing changing stream flow components and hydroclimate interactions in cities – implications for future management and restoration of urban ecosystems, EGU General Assembly 2024, Vienna, Austria, 14–19 Apr 2024, EGU24-383, https://doi.org/10.5194/egusphere-egu24-383, 2024.

The isotopic composition of water in plant xylem in comparison to the soil water isotopic composition is often used to investigate the plant water uptake patterns (e.g., Gessler et al. 2022), drought effects on plants (e.g., Lehmann et al. 2023, in review) and the water exchange through the river, soil, vegetation and atmosphere continuum (e.g., Brooks et al. 2010). Several studies have shown that there is a difference in the isotopic composition between the water source and the xylem water in trees. However, the source of this difference is subject to current scientific debates. Two-water-world hypothesis (Brooks et al. 2010), fractionation during root-water uptake (Vargas et al. 2017), bias due to cryogenic water distillation (Chen et al. 2020; Barbeta et al. 2022), Fractionation during movement of water between different tree tissues (Barbeta et al. 2022) are among the hypotheses proposed in the literature as the origin of the isotopic difference between source water and xylem water. 

Here we used several water extraction and isotope analysis methods to shed light on the isotope-based methods in tracking water movement in the soil-vegetation-atmosphere continuum. Our study site is a scots pine forest stand in the long-term drought experimental site, Pfynwald, Switzerland where the forest is exposed to a range of moisture conditions by irrigation.  

To extract xylem water, we used the Scholander Pressure Bomb, cryogenic vacuum distillation, and the vapor equilibrium method. For the soil water extraction, the equilibrium vapor extraction and cryogenic vacuum distillation method is used for different depths. Furthermore, we used the isotope ratio laser spectrometer and isotope ratio mass spectrometer to analyse extracted water samples.

With this work, we aim to answer the following questions: a) Is there a difference in the isotopic composition of water extracted with the equilibrium vapor method (in-situ, bulk stem water), Scholander pressure bomb (sap flow water) and the cryogenic vacuum distillation method (bulk stem water)? b) How are the observed isotopic differences between xylem and soil water related to the available moisture conditions?


References

Barbeta et al. (2022). Evidence for distinct isotopic compositions of sap and tissue water in tree stems: consequences for plant water source identification. https://doi.org/10.1111/nph.17857.

Brooks et al. (2010). Ecohydrologic separation of water between trees and streams in a Mediterranean climate. https://doi.org/10.1038/ngeo722.

Chen et al. (2020). Stem water cryogenic extraction biases estimation in deuterium isotope composition of plant source water. https://doi.org/10.1073/PNAS.2014422117.

Gessler et al. (2022). Drought reduces water uptake in beech from the drying topsoil, but no compensatory uptake occurs from deeper soil layers. https://doi.org/10.1111/nph.17767.

Lehmann et al. (2023, in review). Hydrogen isotopes in leaf and tree-ring organic matter as potential indicators of drought-induced tree mortality. https://doi.org/10.22541/AU.168167196.63741053/V1.

Vargas et al. (2017). Testing plant use of mobile vs immobile soil water sources using stable isotope experiments. https://doi.org/10.1111/nph.14616.

How to cite: Villiger, M. N. and Freund, E.: Forest Water Uptake Dynamics in the Long-Term Drought Experimental Site, Pfynwald – Intercomparison of Water Extraction and Isotope Analysis Methods, EGU General Assembly 2024, Vienna, Austria, 14–19 Apr 2024, EGU24-759, https://doi.org/10.5194/egusphere-egu24-759, 2024.

EGU24-6181 | ECS | Orals | HS10.8

Using stable water isotopes to trace cereal water use in agricultural co-cropping systems under contrasting hydro-climatological conditions 

Oludare Durodola, Youri Rothfuss, Cathy Hawes, Jo Smith, Tracy Valentine, and Josie Geris

Agricultural co-cropping, which is the cultivation of two or more crops simultaneously on the same field, is gaining rapid attention in temperate agroecosystems as a viable nature-based solution to improve agricultural productivity. However, relatively little is known about plant water use patterns in temperate agricultural co-cropping systems. Specifically, the functioning and resilience of these systems compared to their equivalent monocultures is likely to depend on whether water use is complementary for the different crops and how this might change during the growing season and under different hydro-climatological conditions.

This study focused on addressing these knowledge gaps by using water stable isotopes to trace the sources of vegetation water uptake (shallow or deep soil water) in 5 different cereal-legume co-cropping systems and 4 of their respective cereal monocultures under field conditions in North-East Scotland. For each treatment, we extracted vegetation water, and soil water from 5 different depths for analysis of isotopic composition. We then performed MixSIAR end-member mixing modelling to explore proportional water uptake patterns for cereal vegetation throughout the growing season and under wet and dry conditions.

The results showed that cereals in all the monocultures and co-cropping systems predominantly used shallow soil water (upper 5 cm), regardless of growth stage and hydro-climatological conditions. Cereal water uptake patterns in monocultures and co-cropping systems were comparable during wet hydrological conditions. However, the analyses revealed that cereals in co-cropping systems exhibited plasticity and increased their water uptake up from deeper soil water (5 – 30 cm) compared to cereals in monocultures during dry conditions. Furthermore, during dry conditions, we found different seasonal responses in the co-cropping systems between cereal genotypes traits. Understanding of plant water use patterns for different cropping systems could inform the design of resilient and sustainable water management practices and agricultural policies. The plasticity observed in co-cropping systems could potentially contribute to optimised water use under climate change.

How to cite: Durodola, O., Rothfuss, Y., Hawes, C., Smith, J., Valentine, T., and Geris, J.: Using stable water isotopes to trace cereal water use in agricultural co-cropping systems under contrasting hydro-climatological conditions, EGU General Assembly 2024, Vienna, Austria, 14–19 Apr 2024, EGU24-6181, https://doi.org/10.5194/egusphere-egu24-6181, 2024.

EGU24-8308 | ECS | Orals | HS10.8 | Highlight

The influence of topography on beech water use: evidence from a comparative study 

Ginevra Fabiani, Julian Klaus, Laurent Pfister, and Daniele Penna

The ongoing climate change is significantly impacting forest ecosystems, intensifying environmental extremes such as droughts and heatwaves. The increased atmospheric evaporative demand, coupled with reduced soil water availability, poses a risk of water deficit to trees, threatening their health status. These extremes can amplify the thermal and hydrologic gradients along hillslopes, driving spatially variable thermal and hydraulic stress for trees. Until now, site-specific case studies have offered only a limited understanding of how hydrological processes at the hillslope scale influence tree water use. Comparative studies hold the potential to offer a more generalized understating of how trees growing in complex terrains respond to spatially varying growing conditions.

To address this, we set up a comparative study on two forested hillslopes located in the Weierbach catchment (Luxembourg) and the Lecciona catchment in Tuscany (Italy), respectively. The investigated sites differ in steepness, climate, geology, and soil characteristics, but both are dominated by beech (Fagus sylvatica L.) trees. We combined sap velocity, isotope measures, and wood moisture content with environmental monitoring (soil moisture, groundwater level, and hydro-meteorological variables) at different locations to capture beech trees’ water response to heterogeneous environmental conditions. This combination of measurements allowed us to link the transpiration response of trees to water availability along the two investigated hillslopes over the 2019 and 2020 growing seasons in the Weierbach catchment and over the 2021 growing season in the Lecciona catchment.

We observed that surface topography and hillslope structure result in differing sap velocities in response to environmental controls (i.e., vapor pressure deficit and relative extractable water), but not consistently across our study sites. In the Weierbach catchment, we noted a uniform physiological response to environmental controls among trees, even during the drier conditions of 2020, compared to 2019. We attribute this consistency to the homogeneous growing conditions across the slope. On the contrary, in the Lecciona catchment, trees located upslope displayed a more conservative hydraulic behaviour compared to the footslope location. This finding suggests a stronger edaphic and environmental gradient across the hillslope topography. Here, water redistribution through shallow subsurface flow results in more favourable growing conditions and longer growing seasons for trees at the footslope location, compared to the rather uniform growing season observed in the Weierbach catchment. These contrasting results between the two investigated hillslopes suggest that in landscapes where the hydraulic and climatic gradients are stronger, the physiological response among locations will be more spatially variable.

How to cite: Fabiani, G., Klaus, J., Pfister, L., and Penna, D.: The influence of topography on beech water use: evidence from a comparative study, EGU General Assembly 2024, Vienna, Austria, 14–19 Apr 2024, EGU24-8308, https://doi.org/10.5194/egusphere-egu24-8308, 2024.

EGU24-9015 | Posters on site | HS10.8

A comparative study to analyze O and H water isotopes in organic enriched solutions 

Christophe Hissler, Julian Klaus, François Barnich, Cédric Guignard, Loïc Louis, Giulia Zuecco, and Nicolas Angeli

The stable isotopes of hydrogen and oxygen of the water molecule are widely used in ecohydrological-process studies to understand water uptake, redistribution by plants or to partition evaporation and transpiration. In this regard, within the last decade, the demands for a high spatio-temporal resolution of stable isotope data from xylem water has risen to better understand the water interactions between the Critical Zone compartments.

The arrival of isotope ratio infrared spectroscopy (IRIS) for analysing stable water isotopes based on the different adsorption spectra of water molecules with different isotopic composition allowed much faster sampling processing, in-situ measurements in the field, and lower costs per sample. Currently two IRIS instruments are available on the market with measurement technology based on i) off-axis integrated cavity output spectroscopy (OA-ICOS) and ii) wavelength scanned cavity ring-down spectroscopy (WS-CRDS). However, IRIS measurements of water samples can be seriously compromised by interference of some specific organic compounds in the sample with the absorption spectrum of water isotopologues. The impact of contamination issue by organic compounds on the IRIS measured isotopic composition has led to a range of measures to support usability of IRIS instruments in ecohydrological studies.

Until recently isotope ratio mass spectrometry (IRMS) was the standard in isotope hydrology studies and it is still considered as the reference in ecohydrology to mitigate the effects of organic contamination. However, IRMS analysis of water samples include the oxygen and hydrogen isotopes of organic compounds that are present in the water before entering the furnace of the spectrometer. Those compounds are burned at the same time as the oxygen and hydrogen of the water molecule and can dissipate together with those resulting in joint signal detection in the mass spectrometer analysis. This contribution to the measured oxygen and hydrogen isotopic composition from the organic compounds has the potential to compromise the IRMS results depending on the concentration, species, and the isotopic composition of the organic compounds present in the water sample.

In this study, we assess the type and concentration of organic compounds in extracted xylem water and evaluate their impact on stable water isotope analysis with IRMS and IRIS. Our working hypothesis is that samples that are currently analysed in ecohydrology, such as xylem samples heavily enriched in organic compounds, decrease more the analytical precision of IRMS than that of IRIS. We perform an intercomparison study between IRMS and two IRIS instruments with different configurations (with and without combustion module; old and new catalyst) on water without organic compounds, water spiked using different organic molecules (glucose, ethanol, methanol) and beech sap samples.

How to cite: Hissler, C., Klaus, J., Barnich, F., Guignard, C., Louis, L., Zuecco, G., and Angeli, N.: A comparative study to analyze O and H water isotopes in organic enriched solutions, EGU General Assembly 2024, Vienna, Austria, 14–19 Apr 2024, EGU24-9015, https://doi.org/10.5194/egusphere-egu24-9015, 2024.

EGU24-9150 | ECS | Posters on site | HS10.8

Uncovering Sugar Beet Water Uptake Through Stable Water Isotope Analysis 

Sabrina Santos Pires, Gernot Bodner, and Christine Stumpp

The impact of climate change on crop production, marked by increased drought and heat stress, poses significant challenges to agricultural productivity. To overcome these challenges, it is essential to understand how crops take up water through their roots. Sugar beet farming holds immense importance in Austria, especially in the eastern region, where limited water supply constrains crop production. Consequently, strategies need to be developed to enhance water resource utilization and improve plant resilience against drought for sustainable sugar beet production. Therefore, in controlled laboratory experiments, a new method was developed to determine the distribution of water uptake by plant roots in response to dry topsoil conditions and variations in root depth for different sugar beet cultivars. Stable water isotope techniques were used to trace labelled water in rhizobox experiments from the soil to plant transpiration. The water-vapor equilibration technique, commonly used for soil samples, was adapted to measure water-stable isotopes in transpired water on live plants. Leaves were placed in Ziploc bags, inflated with dry air, and allowed to stabilize for at least 16 hours. After equilibration, the bag was punctured, and the equilibrated air and transpired vapor were directed to a laser spectrometer for stable water isotope analysis (2H/1H, 18O/16O). These isotopic ratios provided insights into the depth of root water uptake, aiding in the selection of crop varieties with effective water extraction from deep soil layers. Results indicate that sugar beets develop long roots capable of taking up water from deeper soil layers and adjusting their water uptake mechanisms when topsoil water is scarce. In summary, this study explores the crucial issue of water uptake in sugar beet cultivation, particularly in the context of climate change and water limitations. The findings will inform more efficient agricultural practices, enhance crop resilience, and support sustainable water resource management.

How to cite: Santos Pires, S., Bodner, G., and Stumpp, C.: Uncovering Sugar Beet Water Uptake Through Stable Water Isotope Analysis, EGU General Assembly 2024, Vienna, Austria, 14–19 Apr 2024, EGU24-9150, https://doi.org/10.5194/egusphere-egu24-9150, 2024.

EGU24-11966 | Orals | HS10.8

A process-based water stable isotope mixing model for plant water sourcing 

Bing Si, Eric Si, and Han Fu

Stable isotopes of hydrogen and oxygen in water are common tools for investigating water uptake apportionment, but many of the existing methods rely on simple linear mixing approaches that do not mechanistically incorporate additional information about site physical properties and conditions. Here, we develop a 'physically based root water uptake isotope mixing estimation' model (PRIME) that combines a continuous and parametric probability density function for root water uptake with site physical data in a process-based linear mixing framework. To demonstrate the application of PRIME, water uptake patterns of boreal forest Pinus banksiana trees were estimated on four dates in 2019. To aid in validation, estimates were compared with that of the Bayesian linear mixing model framework, MixSIAR. The two approaches provided similar results, but due to its continuous and parametric nature, PRIME provided estimates of superior resolution, certainty, and model parsimony. Although both models incorporate additional physical information into their mixing frameworks , PRIME does so in a mechanistic manner, thereby reflecting the relevant hydrological processes more effectively than the purely empirical approach taken by MixSIAR. Furthermore, because PRIME uses a continuous function to describe the predicted uptake pattern, it allows users to quantify water uptake with essentially infinite resolution, through integration over the desired depth ranges. These findings demonstrate the advantages of utilizing a continuous, parametric, and process-based mixing model to estimate root water uptake apportionment, thus providing a relatively simple yet powerful tool with which to approach plant water sourcing. 

How to cite: Si, B., Si, E., and Fu, H.: A process-based water stable isotope mixing model for plant water sourcing, EGU General Assembly 2024, Vienna, Austria, 14–19 Apr 2024, EGU24-11966, https://doi.org/10.5194/egusphere-egu24-11966, 2024.

Stable isotopes are essential tools for tracing water and nutrient fluxes in terrestrial ecosystems.  In recent years, studies of the soil-plant-atmosphere continuum have yielded impressive volumes of stable isotope tracer data at previously unattainable precision and spatiotemporal resolution.  These emerging data sets facilitate new methods of analysis that promise new insights into transport, storage and mixing.  For decades, end-member mixing analysis (EMMA) has been the standard workhorse for interpreting tracer data, but new methods can overcome some of its limitations and facilitate new inferences into ecosystem processes. 


At the catchment scale, for example, end-member mixing has been widely used to quantify streamflow as a mixture of isotopically distinct sources, but knowing where streamwater comes from is not the same as knowing where precipitation goes, for which one needs end-member splitting (Kirchner and Allen, 2020) instead.  End-member splitting allows summer and winter precipitation to be partitioned between evapotranspiration, summer streamflow, and winter streamflow, without direct measurements of evapotranspiration water fluxes or their isotopic composition. 


At the hillslope and plot scale, end-member mixing has been widely used to quantify the relative contributions of isotopically distinct sources to soils and xylem waters.  If any end-members are missing or their tracer distributions overlap, however, conventional mixing models become unusable.  These constraints can be overcome by exploiting the information contained in tracer time-series using ensemble end-member mixing analysis (EEMMA; Kirchner, 2023).  EEMMA can potentially quantify many sources using a single tracer, even if their mean concentrations are indistinguishable. EEMMA can also quantify source contributions when some sources are unknown, and even infer the tracer time series of a missing source. 


These new methods will be demonstrated using benchmark data, and proof-of-concept applications will be presented.

How to cite: Kirchner, J.: New methods for studying the soil-plant-atmosphere continuum with stable isotope data, EGU General Assembly 2024, Vienna, Austria, 14–19 Apr 2024, EGU24-12264, https://doi.org/10.5194/egusphere-egu24-12264, 2024.

EGU24-12737 | Posters on site | HS10.8

Investigating the seasonal origin of soil and xylem water in Italian mountain catchments 

Giulia Zuecco, Alessio Gentile, Paolo Nasta, Stefano Brighenti, Carolina Allocca, Giacomo Bertoldi, Davide Canone, Francesco Comiti, Ginevra Fabiani, Stefano Ferraris, Francesca Manca di Villahermosa, Chiara Marchina, Fabio Marzaioli, Daniele Penna, Maurizio Previati, Nunzio Romano, Luisa Stellato, Diego Todini-Zicavo, and Marco Borga

Stable isotopes of hydrogen and oxygen are useful tracers for investigating the water sources exploited by plants for transpiration. Recent studies focused on the analysis of the temporal origin of soil and xylem water, and showed that many plant species, during the growing season, tend to take up water originating from winter rainfall events. However, the climate and biophysical factors controlling the temporal origin of soil and xylem water are still unclear. Given this background, this study aims to i) evaluate the seasonal origin of soil and xylem water by using the so-called Seasonal Origin Index (SOI), and ii) investigate the climate drivers and biophysical controls influencing the seasonal origin of xylem water.

For this, we used isotopic data in precipitation, soil and xylem water along an Italian climate and topographic transect, including four Alpine and pre-Alpine catchments (Dora del Nivolet, Grangia dell'Alpe, Matsch/Mazia, and Ressi) in northern Italy, and two Apennine catchments in central (Re della Pietra) and southern Italy (Gorga). Soil samples at different depths up to a maximum depth of 1 m and vegetation samples were collected fortnightly during the growing seasons in the period 2020-2022, whereas bulk precipitation was collected fortnightly or monthly throughout the year. Vegetation samples included lignified twigs or wooden cores from different tree species (i.e., beech, chestnut, and larch) as well as roots from shrub species typical of Alpine grasslands.


The dual-isotope plot evidenced a marked isotopic variability in water samples among the different sites, particularly for precipitation. Soil water reflected the seasonal variability observed in precipitation in all study sites, although the isotopic signal was affected by evaporative processes, particularly marked in the shallow soil layers. The isotopic composition of xylem water showed that in most study areas these samples had predominantly a spring and summer origin, except for soil and xylem water in the two Apennine catchments which had a strong winter (Re della Pietra) and summer origin (Gorga). So far, no clear relations between the average SOI for soil water and xylem water and climatic indicators (e.g., rainfall seasonal index) were detected. Further analyses will include other indicators which better characterize vegetation characteristics, soil properties, and terrain features.


Keywords

Xylem water, soil water, stable isotopes of hydrogen and oxygen, seasonal origin index

How to cite: Zuecco, G., Gentile, A., Nasta, P., Brighenti, S., Allocca, C., Bertoldi, G., Canone, D., Comiti, F., Fabiani, G., Ferraris, S., Manca di Villahermosa, F., Marchina, C., Marzaioli, F., Penna, D., Previati, M., Romano, N., Stellato, L., Todini-Zicavo, D., and Borga, M.: Investigating the seasonal origin of soil and xylem water in Italian mountain catchments, EGU General Assembly 2024, Vienna, Austria, 14–19 Apr 2024, EGU24-12737, https://doi.org/10.5194/egusphere-egu24-12737, 2024.

EGU24-13937 | Posters on site | HS10.8

Tracing the complementary and competitive water use patterns in a Theobroma cacao (cocoa) agroforestry system: A stable isotope approach 

Kegan Farrick, Josie Geris, Priya Ramjohn, Oludare Durodola, and Jeffrey McDonnell

In cocoa agroforesty systems, shade trees are used to create climate conditions that benefit cocoa growth and survival. However, the benefits may be offset by competition between shade trees and cocoa for water, especially in a changing climate.  Here we use stable isotope tracers to quantify  the patterns and depths of water uptake among shade timber trees, cocoa, and banana for a tropical agroforestry system in Trinidad. Rainfall was collected from August 2021 to September 2023. Three field campaigns were carried out at an upslope and downslope location representing different hydro-climatological conditions and at different times in the crop cycle. During each campaign and at each slope position, soil was collected from three pits at depths of 5, 15, 25, 50 and 75 cm below the surface, while up to 10 xylem cores were collected from the different plant species. Additional soil texture and soil moisture data were also collected. Cryogenic vacuum extraction was used to extract water from the soil and vegetation samples, while an Elementar Isoprime isotope ratio mass spectrometer was used to determine the δ2H and δ18O of the extracted water. These data were subsequently used for MixSIAR endmember mixing modelling. Our results suggest that cocoa and banana plants primarily use shallow soil water (0 – 10 cm below the surface), while shade and timber trees like Immortelle (Erythrina poeppigiana) and Cedar (Cedrela odorata) use water from deeper sources (20 – 50 cm below the surface). Spatially, plants located in upslope areas appear to use water from slightly deeper soil depths than downslope locations. Soils in the valley bottom were also wetter and had relatively higher clay content. This study indicates that shade trees do not compete with cocoa for water; however, bananas likely compete with cocoa making managing that co-cropping important.

How to cite: Farrick, K., Geris, J., Ramjohn, P., Durodola, O., and McDonnell, J.: Tracing the complementary and competitive water use patterns in a Theobroma cacao (cocoa) agroforestry system: A stable isotope approach, EGU General Assembly 2024, Vienna, Austria, 14–19 Apr 2024, EGU24-13937, https://doi.org/10.5194/egusphere-egu24-13937, 2024.

EGU24-14819 | Orals | HS10.8 | Highlight

Investigating Large-Scale Variation in Plant Water Uptake Across European Climates and Vegetation Types – a WATSON Cost Action Initiative 

Katrin Meusburger, Josie Geris, Daniele Penna, Youri Rothfuss, Ilja van Meerveld, and Marco Lehmann

The COST Action WATer isotopeS in the critical zONe (WATSON; https://watson-cost.eu/) aims to elucidate the interactions between groundwater recharge, soil water storage, and vegetation transpiration across various climatic settings. Within this framework, root water uptake by trees is crucial for understanding water partitioning and forest resilience to drought. While isotopic approaches have successfully revealed root water uptake strategies for different species, a comprehensive assessment across different climates and vegetation types is still missing (Beyer and Penna, 2021).

To address this research gap, we executed a synchronized, participatory sampling campaign by WATSON Action members in late spring and summer of 2023. Soil and vegetation samples were taken across 39 well-distributed forest sites encompassing 17 European countries. The samples were analyzed for the stable isotopes of oxygen and hydrogen at the WSL laboratory in Switzerland. The data enable us to investigate the spatial and temporal (spring vs summer) variability of root water uptake of the shallower-rooted spruce (Picea abies) and deeper-rooted beech (Fagus sylvatica) trees. We expect beech to exhibit a more pronounced shift to deeper water sources during summer than spruce due to its deeper rooting system. We also expect that the dominant root water uptake depth is influenced by site-specific factors (climate, elevation, latitude, soil type, level of understory cover) and tree characteristics (tree height, stem diameter). This presentation will describe the sampling campaign and the preliminary results on root water uptake for both species across Europe.

How to cite: Meusburger, K., Geris, J., Penna, D., Rothfuss, Y., van Meerveld, I., and Lehmann, M.: Investigating Large-Scale Variation in Plant Water Uptake Across European Climates and Vegetation Types – a WATSON Cost Action Initiative, EGU General Assembly 2024, Vienna, Austria, 14–19 Apr 2024, EGU24-14819, https://doi.org/10.5194/egusphere-egu24-14819, 2024.

EGU24-15354 | Orals | HS10.8

Scots pine response to short-term dry conditions after long-term soil moisture manipulation experiment   

Elham R. Freund, Maurus Villiger, Marco M. Lehmann, Zhaoyong Hu, Katrin Meusburger, and Arthur Gessler

Transpiration fluxes from land to the atmosphere hinge significantly on the degree to which trees opt to open their stomata to trade off water for CO2. Yet, the terrestrial ecosystem response to the changes in the atmosphere (CO2, VPD, etc.) and the redistribution of water on land in an era of change are largely unknown. In addition, the effects of such long-term changes in trees’ adaptation strategies and resilience under short-term dry conditions are not yet fully understood. To address this issue we determined stable water isotopologues within a long-term (20-year) irrigation experiment in a drought-prone Scots pine-dominated forest in one of the driest areas of Switzerland, Pfynwald. Our sampling included plots with trees growing under naturally dry conditions (control), irrigated (from 2003 to present), and previously irrigated (irrigation stop; irrigated from 2003–2013; control condition since 2014). We have installed an in-situ high-frequency isotope measurement system in the field to sample stable water isotopologues (2H and 18O) in different soil depths, tree xylem, and in the atmosphere and to track tree water uptake dynamics at the control, irrigated, and irrigation stop plots. The sampling was complimented with manual extraction of soil and xylem water samples at the three treatment plots for isotope analysis in the lab. Our preliminary findings support the hypothesis that pine forests adjust their carbon allocation strategies during long-term wet periods, establishing a deeper rooting system to access deeper water sources. This adaptive mechanism enhances their resilience during short-term dry periods.

How to cite: R. Freund, E., Villiger, M., M. Lehmann, M., Hu, Z., Meusburger, K., and Gessler, A.: Scots pine response to short-term dry conditions after long-term soil moisture manipulation experiment  , EGU General Assembly 2024, Vienna, Austria, 14–19 Apr 2024, EGU24-15354, https://doi.org/10.5194/egusphere-egu24-15354, 2024.

EGU24-15927 | ECS | Posters on site | HS10.8

Ecohydrological investigation of a karstic vineyard in Ceroglie (Italy)    

Mirco Peschiutta, Martina Tomasella, Giuliano Dreossi, Mauro Masiol, Barbara Stenni, Luca Zini, Carlotta Musso, Vittoria Posocco, Chiara Calligaris, Paolo Sivilotti, and Klemen Lisjak

Due to climate change, southern European viticulture will experience lower and more variable yields and an use of irrigation will be necessary. In the cross-border area between Italy and Slovenia, grapevines are also grown in karst environments on shallow soils developed over limestone bedrock. In this environment the use of irrigation is very limited due to the scarcity of water sources and the ruggedness of the terrain.

In the framework of the Interreg Ita-Slo Acquavitis project we conducted an ecohydrological investigation over two consecutive growing seasons on a Vitis vinifera cv. Refošk vineyard on a shallow (50 ÷ 100 cm) karstic red soil in Ceroglie (Friuli Venezia-Giulia, Italy) to: (I) understand the water dynamics in the soil, (II) monitor the vines water status and (III) assess the depth of root water uptake. We also investigated the possibility of vines to exploit water reserves in caves, fractures, and matrix of the karstic system. Monthly precipitations were sampled from July 2020 to December 2021, and single precipitation events from February 2021 to June 2022. A first sampling campaign for soil, xylem sap and water potentials was conducted in 2020, with three sampling dates during the summer. In the following season 2021, the second campaign was conducted with a sampling frequency of ca 15 days from March to October for soil and from June to September for xylem sap . Sampling of dripping water and cave-soil were carried out in a nearby cave up to a depth of approximately 7 m.

Oxygen and hydrogen stable water isotope composition was analysed in precipitation and dripping waters from the cave using an IRMS; an IRIS-IM technique was used to extract and analyse soil water and to analyse xylem sap extracted with a vacuum system in the field. We also measured soil water content, soil water potential,

Summer 2020 was particularly rainy while 2021 showed heavier rainfall in spring followed by a drier summer. Results from the soil water and xylem sap isotopic values suggested that in this vineyard the vines relied mainly on shallow (above 50 cm) water and precipitation of late spring and summer. Soil water isotopic data showed a high variability in the upper soil while below 40 cm the δ2H values varied by only 10‰, while xylem saps showed an even slighter variability. Cave-soil water isotopic values were within the variability range of the vineyard ones, as such we could not discriminate whether the vines used also this water resource matrices.

Based on the water potential data of the two growing seasons, the availability of water in the vineyard soil was sufficient for the vines and it seems unlikely that under similar conditions, water resources from the karstic system would be utilised. In the event of severe drought conditions, as occurred in 2022, however, these additional water resources could be exploited by the vines, contributing to a better resilience of the karstic vineyards.

How to cite: Peschiutta, M., Tomasella, M., Dreossi, G., Masiol, M., Stenni, B., Zini, L., Musso, C., Posocco, V., Calligaris, C., Sivilotti, P., and Lisjak, K.: Ecohydrological investigation of a karstic vineyard in Ceroglie (Italy)   , EGU General Assembly 2024, Vienna, Austria, 14–19 Apr 2024, EGU24-15927, https://doi.org/10.5194/egusphere-egu24-15927, 2024.

EGU24-15966 | ECS | Orals | HS10.8

Investigating the impact on water fluxes and physiological development of the combination of contrasted root wheat cultivars from isotopic analysis 

Samuel le Gall, Dagmar van Duschoten, Adrian Lattacher, Mona Giraud, Moritz Harings, Paulina Deseano Diaz, Ahmet Sircan, Christian Poll, Guillaume Lobet, Mathieu Javaux, and Youri Rothfuss

Farmers are increasingly adopting practices that add more biodiversity to agro-ecosystems for improving crop yield level and stability. These practices include co-croping, that is the cultivation of different phenotypes (or cultivars) in the same field. However, we are missing clear criteria for the selection of the cultivars as well as a quantified assessment of the effect of the combination on water use and partitioning.

In our study, we proposed to focus on the association of two wheat cultivars having contrasted root systems. We further aimed at evaluating the effect of such an association on water flow by monitoring root water uptake vertical patterns from isotopic analyses.

In a control environment, we ran experiments on soil columns (silty-clay) (diam=11cm, height=80cm) each planted with two wheat cultivars (“shallow-rooted” vs “deep-rooted”) until ear emergence. Six different modalities were tested, i.e., 3 crop types (2 shallow-rooted individuals / 2 deep-rooted individuals / combination of 1 shallow-rooted individual and 1 deep-rooted individual) x 2 treatments (well-watered conditions or water stress). We repeated the experiment six times to test all the different modalities mentioned above in triplicate. Profiles of root water uptake (RWU) relative fractions were statistically evaluated (with a Bayesian mixture model) at cm to dm vertical resolution from soil water and transpiration flux isotope data non-destructively using gas-permeable membranes and gas chambers coupled to a laser spectrometer. Plants were also monitored physiologically during the experiment (e.g., leaf area, chlorophyll content, root architecture by magnetic resonance imaging) and destructively (e.g., above-ground and below-ground biomass, root area, stomatal density).

We will present our observations on how the RWU profile are affected by soil water status, wheat phenotype and associated plant identity. Surprisingly, the deep-rooted phenotype individuals - which uptake more water than the shallow-rooted individuals at soil depth between 40cm and 80cm under water deficit condition - are also the most physiologically sensitive (reduction in leaf area, significant change in shoot/root biomass ratio) at the first reproductive stages. On the field scale, this could have later a negative impact on the yield of the deep-rooted phenotype monoculture, but this should be moderate in co-cropping situations, where the sensitivity of the whole is lower.

How to cite: le Gall, S., van Duschoten, D., Lattacher, A., Giraud, M., Harings, M., Deseano Diaz, P., Sircan, A., Poll, C., Lobet, G., Javaux, M., and Rothfuss, Y.: Investigating the impact on water fluxes and physiological development of the combination of contrasted root wheat cultivars from isotopic analysis, EGU General Assembly 2024, Vienna, Austria, 14–19 Apr 2024, EGU24-15966, https://doi.org/10.5194/egusphere-egu24-15966, 2024.

EGU24-17277 | ECS | Posters on site | HS10.8

Groundwater recharge quantity and timing across land covers in a managed agricultural landscape in NE Germany: insights using stable water isotope approaches and water storage measurements 

Katya Dimitrova-Petrova, Christine Stumpp, Lena Scheiffele, Karoline Kny, and Sascha Oswald

Improving groundwater recharge flux (GWR) estimation is key for effective or sustainable groundwater resource management. Yet, GWR assessment is challenging as direct measurements are usually limited to the point scale and specific depths of the vadose zone . In agricultural settings, the spatial variability introduced by land use management may further complicate the assessment. Tracer studies in the vadose zone, combining stable isotopes (δ2H and δ18O) in soil water and water storage measurements can aid such assessment in agriculturally managed landscapes. The stable water isotope signal can provide insights into the timing of the soil water transport while traditional water storage measurements (i.e. soil moisture, groundwater levels) can provide complementary information allowing for comparison or alignment.

In this study, we aim to provide an integrative estimate of GWR under various agricultural land covers at the field scale. For that, we combine dedicated measurements of soil water stable isotope and continuous water storage observations spanning the soil profile from topsoil to groundwater table. The study was conducted in a highly instrumented research site near Potsdam, Brandenburg, situated on a gentle hillslope and covered by a variety of agricultural plots.

During two sampling campaigns in spring (May) 2023 and winter (January) 2024, we collected bulk soil water from various soil profiles (0-150 cm) along with monthly groundwater samples and analysed them for stable water isotopes (δ2H and δ18O). By integrating isotope data with soil moisture observations, we trace GWR using the peak shift method. Complementary GWR estimates are derived from timeseries of tensiometers and groundwater level fluctuations.

We present an overview of the experimental set up and preliminary GWR estimates. Our aim is to offer a complementary perspective on the key processes governing vertical water fluxes within the vadose zone across different depths, land covers, and hillslope positions, advancing our understanding of GWR dynamics at this managed agricultural site.

How to cite: Dimitrova-Petrova, K., Stumpp, C., Scheiffele, L., Kny, K., and Oswald, S.: Groundwater recharge quantity and timing across land covers in a managed agricultural landscape in NE Germany: insights using stable water isotope approaches and water storage measurements, EGU General Assembly 2024, Vienna, Austria, 14–19 Apr 2024, EGU24-17277, https://doi.org/10.5194/egusphere-egu24-17277, 2024.

IS SAMPLING INFLUENTIAL ON VARIATIONS IN 13C STABLE ISOTOPE WHILST SCREENING FOR DROUGHT STRESS IN COFFEE

           Janice Nakamya1,2, Roel Merks3, Rebbeca Hood-Nowtry2, Gerd Dercon1Jeremiah Mwangi4, Silas Makune4

1 Soil and Water Management & Crop Nutrition Laboratory, Joint FAO/IAEA Centre of Nuclear Techniques in Food and Agriculture, Department of Nuclear Sciences and Applications, International Atomic Energy Agency, 2444 Seibersdorf, Austria

2University of Natural Resources and Life Sciences Vienna, Peter-Jordan-Straße 82, 1190 Vienna

3 Division of Soil and Water Management, Faculty of Bioscience, KU Leuven, Kasteelpark Arenberg 20, 3001 Heverlee, Belgium

4 Kaweri Coffee Plantation, Plot 1 Kitemba 264, Mubende Uganda

An enormous coffee yield gap and subsequent decline in income has been realised from drought, triggering a need for faster screening tool for water stress and estimation of water use efficiency for the commonly grown coffee varieties. However, determining the critical thresholds of drought stress in perennial crops especially in coffee is challenging. Stable isotope measurement of coffee leaves could avail instantaneous measurements as they track the changes at leaf level, there has been limited use of isotopes to monitor drought stress in coffee. Furthermore, using punch leaf samples instead of bulk leaf samples would be faster and cheaper by eliminating grinding.  The method requires homogenous sampling to provide representative samples and ensure quality results, suggesting detailed understanding of variations in d13C at coffee leaf level.  The study was conducted on commonly grown 6 old clones’ varieties of Robusta coffee, each in a 16-year-old 15 by 15m trail plot at Kaweri Coffee plantation Mubende, Central Uganda. With a specific aim of establishing (1) Whether d13C varies within the different leaf ages, leaf symmetry and sample position on the leaf (Fig.1). Separate punch leaf samples were obtained on young fully grown, below, and old pair of leaves on the left and right side of the apex, middle and rare of the lamina.  The results reveal a significant variation in d13C between young and old leaves but not with the pair in between them. Furthermore, a leaf pair is not the same in terms of d13C but it does not matter which position on the leaf the punched sample is obtained from.  Implying, for the best representation, coffee punch sample would be from any position of an old leaf.   

How to cite: Nakamya, J.:  Is sampling influential on the variations in 13C stable isotopes whilst screening for drought stress in coffee?, EGU General Assembly 2024, Vienna, Austria, 14–19 Apr 2024, EGU24-17534, https://doi.org/10.5194/egusphere-egu24-17534, 2024.

EGU24-19346 | ECS | Orals | HS10.8

How beech trees use isotopically heavier precipitation because of seasonality 

Fabian Bernhard, Marco M. Lehmann, Arthur Gessler, and Katrin Meusburger

Soil-vegetation systems partition incoming precipitation into either the freshwater system ("blue water") or back to the atmosphere as evapotranspiration ("green water"). The isotope signatures of these fluxes are observed to be distinct. We investigate the partitioning of precipitation and illustrate one potential mechanism for this "apparent" isotopic fractionation of root water uptake by means of an isotope-enabled mechanistic water balance model [1].

Stable water isotope signatures were collected at a Swiss forest site dominated by beech trees (>60 cm DBH, 37m stand height) with a mean annual precipitation of ~1050 mm/year, at 800 m.a.s.l throughout two vegetation seasons. Up to bi-weekly samples of xylem and mobile soil water and six bulk soil water campaigns (down to 150 cm) were combined with continuous hydrometric measurements (down to 200 cm) to constrain modelled water fluxes such as preferential infiltration patterns and seasonal patterns of root water uptake.

During the model validation period in 2022, the model faithfully reproduced seasonal and vertical patterns in isotope signatures. The goodness of fits of time series showed δ18O RMSE smaller than 0.4‰ for mobile soil water at 50cm or 80cm or smaller than 1.0‰ for stem xylem water at breast height, while the goodness of fits of vertical profiles had δ18O RMSE smaller than 1.7‰ for bulk soil water profiles down to 150cm. Reduced soil water availability in the topsoil during the summer of 2021 led to a downward shift of the flux-weighted average water uptake depths of beech trees. However, while the relative contribution to water uptake of soil layers below 80 cm increased during the summer of 2021, their absolute contribution did not increase sufficiently to compensate the water missing in the topsoil layers where most roots are located. 

Modelled infiltration pathways and root water uptake illustrate how seasonal and vertical selectivity of root water uptake leads to distinct isotope signatures in the modelled green and blue water fluxes. This behaviour is obtained at this site without a two-domain representation of the soil domain nor preferential flow to deeper layers. Further, simulations with synthetic seasonal isotope patterns in precipitation demonstrate how this "apparent" fractionation factor depends on the timing of transpiration together with the seasonality of the precipitation isotope signature. In conclusion, this study highlights that the soil-vegetation system may fractionate heavier precipitation for the green water fluxes mainly because of the seasonal patterns in precipitation isotope signatures and transpiration rates.

[1] Fabian Bernhard. (2024). fabern/LWFBrook90.jl: v0.9.8 (v0.9.8). Zenodo. https://doi.org/10.5281/zenodo.10463109

How to cite: Bernhard, F., Lehmann, M. M., Gessler, A., and Meusburger, K.: How beech trees use isotopically heavier precipitation because of seasonality, EGU General Assembly 2024, Vienna, Austria, 14–19 Apr 2024, EGU24-19346, https://doi.org/10.5194/egusphere-egu24-19346, 2024.

EGU24-19455 | ECS | Orals | HS10.8 | Highlight

Water uptake depth of European beech, Douglas fir and Norway spruce – species-specific patterns, seasonal dynamics and mixture effects 

Christina Hackmann, Sharath Paligi, Martina Mund, Dirk Hölscher, and Christian Ammer

Trees are major regulators of the forest water balance. To stay vital, water loss via transpiration has to be compensated by root water uptake. However, it is often not clear where exactly the trees get their water from. This has become particularly relevant in central Europe, as forests are facing more frequent and intense droughts with climate change. It is known that water uptake strategies are species-specific, influenced by environmental conditions and, potentially, neighboring species. Yet, knowledge about species-specific patterns of water uptake depth and how it is affected by tree-species mixture is scarce. Stable water isotopes present a valuable tool to elucidate these belowground processes.

For our study, we selected mixtures of European beech (Fagus sylvatica), the dominant broadleaved tree species in central Europe, with native, but drought-prone Norway spruce (Picea abies), and non-native, but supposedly more drought-resistant Douglas fir (Pseudotsuga menziesii), as well as the respective pure stands. We aimed to uncover the effect of (1) species identity, (2) species mixture and (3) environmental conditions on water uptake depth.  

To achieve this, we conducted two sampling campaigns in climatically contrasting years: a natural abundance campaign in relatively wet 2021, covering 20 plots on 4 sites, and a tracer experiment focused on European beech and Douglas fir on a subset of plots, including weekly sampling of 12 trees throughout the drought summer 2022. 

We found species-specific patterns of water uptake depth, where Norway spruce tended to use the greatest share of shallow water, followed by European beech and Douglas fir. Within species, the data indicated differences in water uptake depth between pure and mixed stands, however, we did not detect a spatial differentiation between co-occurring species. Dry conditions tended to shift water uptake to deeper layers, with beech responding stronger than Douglas fir.

Our results corroborate that species-specific traits have to be considered when assessing forest water pathways, especially in mixed forests and under drought. Considering central Europe, our data supports the assumption that Douglas fir may be more drought resistant than Norway spruce by tapping deeper water sources. In mixture, both European beech and Douglas fir seem to exploit similar soil depths, while none of the species is limited to the drought-prone topsoil.      

How to cite: Hackmann, C., Paligi, S., Mund, M., Hölscher, D., and Ammer, C.: Water uptake depth of European beech, Douglas fir and Norway spruce – species-specific patterns, seasonal dynamics and mixture effects, EGU General Assembly 2024, Vienna, Austria, 14–19 Apr 2024, EGU24-19455, https://doi.org/10.5194/egusphere-egu24-19455, 2024.

EGU24-21290 | ECS | Posters on site | HS10.8

Seasonality of tree water uptake explained by amount and timing of soil water refill 

Harsh Beria, Marius G. Floriancic, and James W. Kirchner

The hydrologic cycle in Switzerland relies on inputs from winter precipitation, whereby snowmelt plays an important role replenishing soil water, streams and aquifers. Previous studies found that plant water uptake during the summer growing season is dominated by winter precipitation. Here we use stable water isotope data of xylem and soil water from four experimental catchments and from two snapshot sampling campaigns during the growing season to assess what drives seasonal patterns in xylem water signatures.

We unveil divergent trends in the seasonal origin of waters used by trees compared to water flowing into nearby streams and aquifers. In low-elevation catchments characterized by little snowfall, summer precipitation predominantly refills streams and aquifers, while winter precipitation feeds vegetation water uptake. Conversely, higher-elevation catchments exhibit an opposite pattern, where winter precipitation primarily recharges streams and aquifers, and vegetation water uptake is driven by summer precipitation. We propose a theoretical framework to elucidate the divergence in vegetation water uptake from stream and groundwater recharge. This framework offers insights into the intricate relationships governing water availability in terrestrial ecosystems in different elevations across the Swiss Alps.

How to cite: Beria, H., Floriancic, M. G., and Kirchner, J. W.: Seasonality of tree water uptake explained by amount and timing of soil water refill, EGU General Assembly 2024, Vienna, Austria, 14–19 Apr 2024, EGU24-21290, https://doi.org/10.5194/egusphere-egu24-21290, 2024.

EGU24-647 | ECS | Orals | HS10.9

Connecting the Carbon and Water Cycles through Vegetation    

Akash Verma and Subimal Ghosh

Socioeconomic growth in India has resulted in a substantial increase in carbon dioxide (CO2) emissions. Despite this, India emerges as the second-largest contributor to global greening, as revealed by remote sensing datasets. These conflicting factors pose a unique challenge in understanding the variability of atmospheric CO2 and its implications for global warming. The present study aims to address this research gap by presenting the first analysis of climate controls on carbon flux variability in India. Our key objectives are (1) to identify the climate drivers influencing the variability of vegetation productivity in agriculture-dominated India and (2) to understand the implications of increased plant growth on water availability by analyzing the CO2 fertilization effect. Unlike previous studies, we have not used simplistic estimates like partial correlation for causality; instead, we employed a recent tool, PCMCI, designed explicitly for detecting causality. In contrast to global studies, we find no causal connection between terrestrial water storage and vegetation productivity. Our results suggest that precipitation plays a significant role in the Indian region rather than deep groundwater, due to its immediate impact on shallow-rooted vegetation. Our findings highlight the significance of land use, land cover, and distinct irrigation practices— aspects often overlooked in current land surface models. Furthermore, we are investigating the response of soil moisture to CO2 fertilization via two pathways: increased leaf area index (LAI) and enhanced water use efficiency (WUE) using state-of-the-art CMIP6 simulations. We are evaluating whether WUE can ameliorate plant water stress, especially when the LAI can counteract its impact by increasing transpiration. The present study adopts a holistic approach to demonstrate the critical interaction and feedback between climate controls, vegetation, and CO2 fertilization, thereby significantly improving our understanding of land-atmosphere interaction.

Keywords: Climate controls, CO2 fertilization, Soil moisture, Vegetation productivity, Causal discovery

How to cite: Verma, A. and Ghosh, S.: Connecting the Carbon and Water Cycles through Vegetation   , EGU General Assembly 2024, Vienna, Austria, 14–19 Apr 2024, EGU24-647, https://doi.org/10.5194/egusphere-egu24-647, 2024.

EGU24-2261 | Orals | HS10.9

Enhanced effects of declining precipitation on the water yield and ecosystem sustainability  

Dan Yakir, Eyal Rotenberg, Fyodor Tatarinov, and Jonathan Muller

Climate change is predicted to change precipitation (P) and evapotranspiration (ET) over most land areas, imposing substantial pressure on water supply in some parts, while increasing flooding in others. Our global dataset shows that ET from ecosystems displays a conservative ‘saturation effect’ at ~460±190 mm across climates with P range of ~4000 mm. This implies that changes in P are preferentially reflected in the residual ecosystem water yield (WY=P-ET). Consequently, changes in WY are greatly enhanced compared with those in P both in observations and in model-based future projections. In drying regions, ecosystems will reach the unsustainable state of WY<0 faster than expected based on predicted changes in P alone, imposing land cover changes, and impacting water availability for ecological and societal needs.

How to cite: Yakir, D., Rotenberg, E., Tatarinov, F., and Muller, J.: Enhanced effects of declining precipitation on the water yield and ecosystem sustainability , EGU General Assembly 2024, Vienna, Austria, 14–19 Apr 2024, EGU24-2261, https://doi.org/10.5194/egusphere-egu24-2261, 2024.

EGU24-2670 | Orals | HS10.9

Towards a coupled crop-climate seasonal prediction system for dry-land wheat grain yield in Israel 

Ehud Strobach, Roi Ben-David, Avimanyu ray, and Yotam Menachem

Wheat production accounts for the largest portion of agricultural land in Israel, and it is the 2nd most productive crop worldwide after Maize. Spring wheat which is mostly grown under rain-fed conditions, is highly susceptible to changes in climate conditions. As a result, wheat grain yields (GY) are suffering from high climate-dependent year-to-year variability, particularly under changes in precipitation patterns. This large variability stresses the need for accurate seasonal predictions of wheat yield, which may assist farmers in better agro-system planning, making the right management decisions (crop rotation, sowing dates and application of irrigation), and the right varietal choice. As a widespread crop, wheat also has the potential to impact regional climate conditions through an interactive feedback loop by exchanging heat and water with the land surface and the atmosphere above. Yet, current seasonal crop yield prediction systems do not account for climate-crop feedback, and their prediction skill is lacking.

The current study hypothesizes that using a high-resolution regional climate model (WRF) coupled with a crop model (Noah-MP-Crop) may increase seasonal crop yield prediction skill, providing a practical tool for farmers to increase their revenues and increase food security. To confirm this hypothesis, we have adapted the Noah-MP-Crop model for the spring wheat cultivars grown in Israel and conducted coupled simulations using the updated observed crop model parameters. In this presentation, the in-situ calibration process of the crop model to the spring wheat cultivars grown in Israel will be presented together with several simulated results from the calibrated coupled crop-climate model. A focus will be put on the exchange of heat, water, and carbon between the land surface and the lower atmosphere.

How to cite: Strobach, E., Ben-David, R., ray, A., and Menachem, Y.: Towards a coupled crop-climate seasonal prediction system for dry-land wheat grain yield in Israel, EGU General Assembly 2024, Vienna, Austria, 14–19 Apr 2024, EGU24-2670, https://doi.org/10.5194/egusphere-egu24-2670, 2024.

The soil freeze-thaw process has undergone significant changes on the Tibetan Plateau (TP) in the context of global change, resulting in the changes of soil physical and chemical properties, thereby affecting the vegetation phenology and photosynthesis through affecting the utilization capacity of CO2 and light by vegetation. However, little is known about how soil temperature (ST) and soil moisture (SM) affect the gross primary productivity (GPP) on the TP at different seasons and elevations. In this study, the spatiotemporal variation patterns of GPP, ST, and SM were analyzed based on the Community Land Model version 5.0 (CLM5.0) simulations in order to illustrate the impacts of ST and SM in surface (0–10 cm) and root zone soil (0–100 cm) on GPP between 1979 and 2020. The results showed that the CLM5.0-based GPP and ST were in good agreement with in situ observations. ST, SM and GPP increased at the rates of 0.04 ℃ a−1, 2.4 × 10⁻⁴ mm3 mm−3 a−1, and 5.36 g C m−2 a−2, respectively. SM dominated the variations of GPP in winter (64.3%), while ST almost was the dominant factor in other periods, especially spring (99.9%) and autumn (94.7%). The explanatory power of ST and SM for GPP increased with elevation, especially for ST. The relative contributions of ST and SM to GPP at different time scales in root zone soil were similar to those in surface soil. This study provided a new understanding of how soil freeze-thaw affected GPP changes on the TP in the context of the intensification of warming and humidification.

How to cite: Jia, B. and Peng, Q.: Increasing gross primary productivity under soil warming and wettingon the Tibetan Plateau, EGU General Assembly 2024, Vienna, Austria, 14–19 Apr 2024, EGU24-3306, https://doi.org/10.5194/egusphere-egu24-3306, 2024.

EGU24-3593 | Posters on site | HS10.9

Recent intensification of the negative physiological effect of CO2 on terrestrial evaporation 

Haiyang Qian, Weiguang Wang, Zefeng Chen, Akash Koppa, Guoshuai Liu, and Diego Miralles

The net physiological effect of rising atmospheric carbon dioxide (aCO2) on terrestrial evaporation (ET) is highly uncertain. While increased CO2 fertilization elevates ET through more biomass production, the reduction in stomatal conductance (gs) that it downregulates ET. Here, using satellite-based estimates of ET and dynamic vegetation models, we investigate the physiological influence of aCO2 on ET, and isolate the respective contribution of biomass increase and gs reduction. Our results indicate that the CO2 fertilization had a net negative effect of –4.4±0.3×10⁻² mm ppm–1 on ET over 1982–2018. The negative physiological effect tends to intensify with increasing aCO2, particularly in warm and humid forests. The high sensitivity of ET to gs may attenuate the expected water cycle acceleration over land, although the future evolution of these two competing physiological processes remains uncertain.

How to cite: Qian, H., Wang, W., Chen, Z., Koppa, A., Liu, G., and Miralles, D.: Recent intensification of the negative physiological effect of CO2 on terrestrial evaporation, EGU General Assembly 2024, Vienna, Austria, 14–19 Apr 2024, EGU24-3593, https://doi.org/10.5194/egusphere-egu24-3593, 2024.

EGU24-5887 | ECS | Posters on site | HS10.9

Water use efficiency and carbon use efficiency response differently to greening on the Loess Plateau in China 

Yue Wang, Guangyao Gao, Yanzhang Huang, and Zhuangzhuang Wang

Water use efficiency (WUE) and carbon use efficiency (CUE) in dryland ecosystems are highly sensitive to complex climate and CO2 changes, which may cause imbalance between carbon and water cycles in terrestrial ecosystems. However, the mechanism of the systematic effects of multiple factors on WUE and CUE remains unclear. Here, we examined the trends in WUE and CUE in China’s Loess Plateau during 2001-2020 and assessed the underlying drivers using PML_V2 products and satellite-based data by employing the spatial random forest (SRF) method. Our analysis identified a significantly increasing trend in WUE and a slightly downward trend in CUE. In space, NDVI was the most important factor affecting the spatial variation of WUE and CUE, but WUE had a significant positive response to NDVI, while CUE had a significant negative response to NDVI. Precipitation and CO2 concentration were the most important environmental factors driving spatial variability in WUE and CUE, respectively. However, vapor pressure deficit was the most important factor driving CUE annual variation controlling most areas of the greening region. Our research revealed that despite the improvement in water utilization, the greening of vegetation did not enhance carbon sequestration potential in the Loess Plateau. Furthermore, we demonstrated that vegetation was the most important factor causing WUE spatiotemporal variation and CUE spatial variation, while atmospheric drought inhibiting vegetation growth was the most important factor causing CUE temporal variation, reflecting the interactivity and complexity of the driving factors behind the spatial and temporal variability of WUE and CUE. Our study provides new insights into the driving characteristics of WUE and CUE spatiotemporal variability and enhances the knowledge of how the carbon-water coupling process induced by vegetation greening responds to environmental changes in arid and semi-arid regions in the backdrop of climate change, contributing to ecological restoration practices and sustainable management in the dryland.

How to cite: Wang, Y., Gao, G., Huang, Y., and Wang, Z.: Water use efficiency and carbon use efficiency response differently to greening on the Loess Plateau in China, EGU General Assembly 2024, Vienna, Austria, 14–19 Apr 2024, EGU24-5887, https://doi.org/10.5194/egusphere-egu24-5887, 2024.

Ecological Restoration (ER) measures can achieve considerable carbon benefits and reduce sediment loads, concurrently resulting in unintended hydrological consequences. The Middle Yellow River Basin (MYRB), with intensive large-scale ER implementation during the past decades, serves as an excellent case to investigate the concomitant water-carbon-sediment synergies and trade-offs. This study combined a vegetation dynamics simulation scheme and a distributed hydrological model with explicit ER representation to investigate the water-sediment-carbon changes in response to ER in the MYRB. According to the results, ER promoted synergies between carbon sequestration and sediment control and led to improved water use efficiency (WUE). The actual Leaf Area Index and Gross Primary Productivity (GPP) showed improvements in region-averaged values by +0.56 m2 m-2 yr-1 (+7.4%) and +52 gC m-2 yr-1 (+10.9%) compared to those under natural conditions. In the Toudaoguai-Tongguan section which suffered the most serious soil erosion, ER decreased the sediment loads by 11.3×10⁸ ton yr-1 (71.1% of the natural level). Furthermore, WUE changes indicated higher GPP gain per unit evapotranspiration. Meanwhile, trade-offs were also found when taking account of the water yield reduction. During 1982-2019, ER led to significant increases in actual evapotranspiration (+8.3 mm yr-1; +2.2%) and decreases in runoff (-7.6 mm yr-1; -12.7%). Two indicators evaluating the cost-effectiveness of ER, i.e., carbon sequestration and sediment settlement at the cost of per unit runoff decline, remained positive with the average values of 6.12 kgC m-3H2O yr-1 and 0.22 ton m-3H2O yr-1 during 2000-2019, respectively. Nevertheless, both indicators showed downward trends, indicating decreasing marginal benefits brought by ER measures which could have approached the optimal scale in the MYRB.

How to cite: Yan, Z., Wang, T., and Yang, D.: Water-carbon-sediment synergies and trade-offs: multi-faceted impacts of large-scale ecological restoration in the Middle Yellow River Basin, EGU General Assembly 2024, Vienna, Austria, 14–19 Apr 2024, EGU24-6713, https://doi.org/10.5194/egusphere-egu24-6713, 2024.

EGU24-7198 | ECS | Posters on site | HS10.9

Investigating evapotranspiration calculations within conceptual hydrological models: an intercomparison among models.  

Gabrielle Burns, Keirnan Fowler, Clare Stephens, and Murray Peel

Hydrological models, ranging from conceptual frameworks to complex physical representations, play a pivotal role in diverse applications including climate change projections and characterising floods and droughts. One crucial aspect of these models is the incorporation of vegetation dynamics, often achieved through links to evapotranspiration and interception. Our study will delve into the critical role of evapotranspiration in the terrestrial water cycle, and how this intricate relationship is simplified across various hydrological models.

Despite the versatility of hydrological models, a common limitation is the static representation of vegetation over time. This limitation becomes particularly significant under climate change, where the consequences of altered vegetation behaviour might not be accurately reflected in the model results. Our research will address this gap by exploring numerous evapotranspiration equations utilised by conceptual rainfall-runoff models, by employing a novel rainfall-runoff model comparison toolbox (MARRMoT), and integrating flux tower measurements into the calibration processes.

By examining how different evapotranspiration equations are utilised across the models and integrating flux tower measurements into the hydrological modelling processes, we seek to improve the models' adaptability to changing environmental conditions. We will do this by interchanging the numerous evapotranspiration equations, whilst keeping all other aspects of the hydrological model constant to explore potential benefits and differences among methods. Further, we will include in-situ measurements by calibrating the model outputted actual-evapotranspiration to flux tower evapotranspiration data, as well as the traditionally calibrated streamflow data.

This research contributes to advancing the accuracy of hydrological predictions and improving the reliability of models in forecasting catchment responses to future climatic shifts.

How to cite: Burns, G., Fowler, K., Stephens, C., and Peel, M.: Investigating evapotranspiration calculations within conceptual hydrological models: an intercomparison among models. , EGU General Assembly 2024, Vienna, Austria, 14–19 Apr 2024, EGU24-7198, https://doi.org/10.5194/egusphere-egu24-7198, 2024.

EGU24-9401 | Orals | HS10.9

Quantifying cross-scale hydrodynamic effects of root ecophysiology 

Martin Bouda, Jan Vanderborght, Valentin Couvreur, Václav Šípek, and Mathieu Javaux

Mechanistic representation of soil-root hydrodynamics is necessary to make robust predictions of canopy fluxes (transpiration, photosynthesis) under water limitation. Soil water limitation can arise at a range of characteristic scales down to millimetres but its effects can be felt across entire landscapes. This mismatch between the scales of cause and effect makes representing water limitation a central challenge in Earth System Models (ESM) and a key source of uncertainty in the terrestrial carbon cycle. We aim to unify the description of soil-root water flows across scales to bridge this gap and to demonstrate cross-scale effects of root ecophysiological mechanisms on the water and carbon cycles.

We developed a new model formulation from analytical solutions to the differential equations for flows on root networks. By formulating the integrals in terms of mean water potentials over arbitrary root segments, we obtain a linear system directly without introducing a numerical approximation. Partial Gaussian elimination then yields a system of exact equations for mean water potentials in the absorbing roots at any chosen scale.

The upscaled equations reproduce exact solutions for water potentials and flows on a single plant at any scale under set boundary conditions. Fitted to explicit stand-scale simulations, the model shows non-increasing error with the addition of further plants to the explicit simulation set. Proof-of-concept results show improved agreement with field data during a seasonal drought over previous models. The computational cost of these calculations is lower or equal to methods present in ESM and other upscaling methods. Code for producing the upscaled equations for any root hydraulic architecture is available online for beta testing.

We will use this model formulation to connect observations of plant hydrodynamic functioning across scales. We are currently collecting data on root growth, turnover, and soil-plant hydrodynamics at six instrumented forest sites. We will supplement these observations with lab-based measurements at root and plant scale. By using the model to bridge across the scales of observation, we expect to quantify the cross-scale effects of individual mechanisms, such as the effect of root phenology on the seasonal variation in land-atmosphere hydrodynamics. This will be an important step towards reducing uncertainties in the plant-mediated processes that link the terrestrial carbon and water cycles.

How to cite: Bouda, M., Vanderborght, J., Couvreur, V., Šípek, V., and Javaux, M.: Quantifying cross-scale hydrodynamic effects of root ecophysiology, EGU General Assembly 2024, Vienna, Austria, 14–19 Apr 2024, EGU24-9401, https://doi.org/10.5194/egusphere-egu24-9401, 2024.

EGU24-10072 | ECS | Posters on site | HS10.9

Coupled simulation of phreatic groundwater and surface fluxes from the terrestrial biosphere in Belgium 

Jan De Pue, Simon Munier, José Miguel Barrios, Alirio Arboleda, Pierre Baguis, Rafiq Hamdi, and Françoise Meulenberghs

Phreatic groundwater hydrology has a well-documented influence on the land water/energy/carbon cycles. To capture the resilience of the biosphere to dry spells in land surface models, it is particularly crucial to incorporate groundwater dynamics. With the ISBA-CTRIP land surface system, it is possible to perform a coupled simulation of the land surface fluxes and groundwater hydrology. Here, we evaluate this model configuration over Belgium, and focus on the quality of the simulated groundwater dynamics, soil moisture and resulting surface fluxes. A network of piezometer and eddy covariance towers is used to validate the model outcomes. Furthermore, the sensitivity of the model parametrization is analyzed (considering different pedotransfer functions), and the impact of groundwater coupling on the surface fluxes is quantified.

How to cite: De Pue, J., Munier, S., Barrios, J. M., Arboleda, A., Baguis, P., Hamdi, R., and Meulenberghs, F.: Coupled simulation of phreatic groundwater and surface fluxes from the terrestrial biosphere in Belgium, EGU General Assembly 2024, Vienna, Austria, 14–19 Apr 2024, EGU24-10072, https://doi.org/10.5194/egusphere-egu24-10072, 2024.

EGU24-14210 | ECS | Posters on site | HS10.9

Combining mechanistic modelling and observations to characterize carbon and water fluxes in mainland Southeast Asia 

Jianning Ren, Zhaoyang Luo, Stefano Galelli, and Simone Fatichi

Tropical forests account for approximately one-fourth of the global terrestrial carbon sink, playing an important role in the Earth’s carbon cycle. Importantly, mainland Southeast Asia has the densest vegetation surface but its ecohydrology is historically understudied due to the paucity of field observations and modelling studies. Leveraging on existing flux tower data, remote sensing products, and the mechanistic ecohydrological model T&C, we provide an enhanced understanding of carbon and water exchanges in mainland Southeast Asia. The T&C model is tested to reproduce various ecosystem types of Southeast Asia, including tropical evergreen forests, subtropical deciduous forests, savannas, rubber plantations, and rice fields. The flux tower data including gross primary productivity (GPP) and evapotranspiration (ET) along with remote sensing data of leaf area index and other vegetation indexes, allow us to better refine and constrain model simulations.  With the integration of data and model, we provide a comprehensive picture of spatiotemporal patterns and key drivers of carbon and water fluxes in mainland Southeast Asia. Our findings highlight a strong latitudinal gradient in carbon fluxes and ET associated with seasonality of rainfall as well as an important role of vapour pressure deficit (VPD) and soil moisture content with different responses in wet and dry years. Direct effects of temperature and precipitation are relatively smaller when compared to VPD and soil moisture in driving changes of carbon and water fluxes. These findings, combined with our model framework, pave the road to more accurate predictions of ecohydrological variables in the relatively understudied region of mainland Southeast Asia.

How to cite: Ren, J., Luo, Z., Galelli, S., and Fatichi, S.: Combining mechanistic modelling and observations to characterize carbon and water fluxes in mainland Southeast Asia, EGU General Assembly 2024, Vienna, Austria, 14–19 Apr 2024, EGU24-14210, https://doi.org/10.5194/egusphere-egu24-14210, 2024.

EGU24-16184 | ECS | Orals | HS10.9

Modelling Water and Biodiversity: Coupling a dynamic eco-evolution trait-based vegetation model with a community water model  

Elisa Stefaniak, Jens de Bruijn, Mikhail Smilovic, Silvia Artuso, Juliette Martin, Tania Maxwell, Jaideep Joshi, and Florian Hofhansl

The recently developed Plant-FATE (Plant Functional Acclimation and Trait Evolution) model is a trait-size-structured eco-evolutionary population model derived from the ‘Plant’ model. It includes a McKendrick-von Foerster partial differential equation (PDE) describing how the size distribution of each species evolves through time. The trait structure allows for modelling functional diversity and adaptations, whereas size structure allows for modelling competition for light. Plant-FATE also includes a new P-hydro model for optimal photosynthesis, the ‘perfect plasticity approximation’ for modelling optimal crown placement, and an extended version of the T-model for biomass allocation. Forced with climatic variables and soil-water availability, Plant-FATE can predict emergent species compositions, size-distributions, and ecosystem services such as leaf area, productivity, evapotranspiration, living biomass, and seed output. 

Plant-FATE currently predicts vegetation properties and associated ecosystem functions of areas under forest cover. To analyse the -water-biodiversity nexus, it is necessary to cover additional aspects of areas under different land-use, such as croplands, plantations, and urban areas. To that end, we have coupled PlantFATE with a Community Water Model (CWatM) that captures ground water discharge and simulates basin-wide water circulation. CWatM is an open-source model to examine how future water demand will evolve in response to socioeconomic change and how water availability will change in response to climate.  

As a case study, we apply this coupled model to the Bhima Basin to examine the feedback between forest management and land-use. This coupling will enable us to better represent nexus issues, such as the feedback between biodiversity and ecosystem functioning that affect vegetation carbon storage and water provisioning under future land-use and projected climate change scenarios.

How to cite: Stefaniak, E., de Bruijn, J., Smilovic, M., Artuso, S., Martin, J., Maxwell, T., Joshi, J., and Hofhansl, F.: Modelling Water and Biodiversity: Coupling a dynamic eco-evolution trait-based vegetation model with a community water model , EGU General Assembly 2024, Vienna, Austria, 14–19 Apr 2024, EGU24-16184, https://doi.org/10.5194/egusphere-egu24-16184, 2024.

EGU24-16625 | Posters on site | HS10.9

Detecting forest drought stress from above and from below 

Stan Schymanski, Martin Schlerf, Richard Keim, and Jean François Iffly

Connecting environmental conditions with plant growth and stress is an important part of ecosystem management in the context of a rapidly changing climate. Our understanding of how varying growing conditions (e.g., soil water availability, meteorological conditions) translate into plant stress and recovery continues to be thwarted by technical limitations in the monitoring of environmental conditions at the appropriate spatio-temporal scale and signs of stress and recovery at the plant and ecosystem scale.

One of the most limiting factors to plant growth is water availability and an important stressor is drought. During drought, physiological changes induce a reduction in photosynthesis and thus plant growth. However, intensity and duration of water stress conditions determine the plant’s physiological response. Under mild water stress, plant regulation of water loss and uptake still allows the plant to maintain its water status with little change in photosynthetic efficiency. However, severe water stress leads to effects ranging from inhibition of photosynthesis and growth to xylem embolism, leaf wilting and loss of key pigments and thus irreversible damage to the photosynthetic and water transport machinery.

Several in situ measurements and remote sensing technologies have been developed to quantify plant stress and ecophysiological response to drought, each with their own strengths and limitations. For example, dendrometers can measure very small changes in stem diameter and thus record daily growth rates and water status variations , while sap flux measurements help quantifying the amount of transpired water. While these techniques are useful for quantifying individual tree responses to stress in terms of mass fluxes and plant water status, they are difficult to apply to whole forests or agricultural fields. Quantifying radiation budgets is another approach for measuring plant stress and response to droughts. Thermal infrared (TIR) and hyperspectral (visible, near-, and shortwave infrared reflectance (VNIR)/SWIR) approaches (besides sun-induced fluorescence) are widely used remote sensing techniques for the detection of plant water stress. An important advantage of remote sensing is that it can be applied to a broader spatial scale. However, the spatial resolution is often coarse and the interpretation in relation to in-situ processes can be complicated by phenological dynamics.

Here we present results from a European beech stand in Luxembourg, where we analysed continuous in situ measurements of dendrometer, sap flux, TIR canopy temperature, meteorological variables and soil moisture. We compare water stress indices derived from sap flux and dendrometer data with a TIR-based crop water stress index (CWSI) recently developed for crops (Ekinzog et al. 2022). Results are put into context with a leaf and canopy energy balance model and implications of drought stress for short and long-term carbon and water fluxes are discussed.

Literature:

Ekinzog, E. K., Schlerf, M., Kraft, M., Werner, F., Riedel, A., Rock, G., and Mallick, K.: Revisiting crop water stress index based on potato field experiments in Northern Germany, Agricultural Water Management, 269, 107664, https://doi.org/10.1016/j.agwat.2022.107664, 2022.


How to cite: Schymanski, S., Schlerf, M., Keim, R., and Iffly, J. F.: Detecting forest drought stress from above and from below, EGU General Assembly 2024, Vienna, Austria, 14–19 Apr 2024, EGU24-16625, https://doi.org/10.5194/egusphere-egu24-16625, 2024.

EGU24-18435 | ECS | Posters on site | HS10.9

Using optimality principles to couple terrestrial carbon and water cycles in hydrological models 

Rodolfo Nóbrega, Rodrigo Miranda, David Sandoval, Shen Tan, and Iain Colin Prentice

Hydrology has been guided by establishing empirical relationships between the movement of water through landscapes and the application of the conservation of mass law in catchments. This has resulted in models with complex calibration frameworks that often overlook the physical and biochemical water-related processes linking plants to hydrological cycles. Studies have revealed that some of the empirical relationships in catchments might also reflect a potential ecosystem's coevolution with climate, driving catchments to optimise their supply and demand limits. This agrees with the eco-evolutionary optimality principles used in vegetation modelling that are based on the hypothesis that canopy conductance acclimates to environmental variations by balancing the costs of carbon assimilation and maintenance of transpiration rates. Here, we developed meaningful interfaces between simple models and approaches based on the use of optimality principles in vegetation modelling and hydrology. Our work is based on the application of the P-model to estimate to quantify gross primary productivity and transpiration and the use of a mass-balance approach to quantify the root zone storage. These integrations not only provide a more nuanced understanding of hydrological processes but also pave the way for more accurate and physically-informed models in hydrology. Our findings underscore the potential of using eco-evolutionary principles as a unifying framework in hydrological research, offering new insights for understanding and predicting water movement in catchments under varying climatic and ecological conditions.

How to cite: Nóbrega, R., Miranda, R., Sandoval, D., Tan, S., and Prentice, I. C.: Using optimality principles to couple terrestrial carbon and water cycles in hydrological models, EGU General Assembly 2024, Vienna, Austria, 14–19 Apr 2024, EGU24-18435, https://doi.org/10.5194/egusphere-egu24-18435, 2024.

EGU24-19078 | Orals | HS10.9

Carbon Sequestration and Water Use Efficiency on almond orchards. Towards a remote sensing-based approach to monitor GPP 

Clara Gabaldón-Leal, Álvaro Sánchez-Virosta, Carolina Doña, José González-Piqueras, Juan Manuel Sánchez, and Ramón López-Urrea

Climate change projections indicate a significant increase in greenhouse gas (GHG) emissions, leading to elevated temperatures, extreme weather events, and water scarcity, particularly in regions like southern Europe. Agriculture, forestry, and other land use activities contribute to 22% of these emissions, but they also offer the potential to act as carbon sinks, supporting the transition to a climate-neutral economy as outlined in the Paris Agreement. The concept of carbon offset involves compensating for emissions by reducing, avoiding, or sequestering an equivalent amount of CO2. Practices such as carbon credits could provide new economic incentives through participation in the voluntary carbon market.

Hence, it is crucial to develop reliable methods to quantify carbon dynamics in terrestrial ecosystems, focusing on the relationship between carbon energy parameters; Net Ecosystem Exchange (NEE), Ecosystem Respiration, and Gross Primary Productivity (GPP). In Spain, the rise in irrigated almond orchards, particularly in the La Mancha region, highlights the need to understand ecosystem Water Use Efficiency (WUE) as a crucial parameter for sustainable crop management. The study employs Eddy Covariance (EC) flux towers to measure NEE, ET, and GPP, providing valuable insights into WUE and contributing to carbon cycle assessments and climate change mitigation strategies.

This study spanned six almond growing seasons (2017-2022) in two different drip-irrigated almond orchards locations in Albacete (SE Spain). These orchards, meeting minimum fetch requirements, exhibited a notable carbon-fixing capacity, comparable to other natural and agroecosystems. Seasonal variability and environmental influences were evident throughout the six-year study. In this study, we also modelled WUE as a function of remote sensing vegetation indices, such as the Normalized Difference Vegetation Index (NDVI) and meteorological data.

Seasonal variability, age and density of almond orchards significantly influence on the observed GPP and NEE. Almond orchards captured more CO2 than that released between April and October. The maximum monthly GPP values observed by EC was 263.7 g C m-2. Besides, the combination NDVI and ET proved effective in estimating GPP, with a regression coefficient (R2) of 0.78. Modelled WUE, incorporating 'NDVI, potential evapotranspiration (ETo), and air temperature (Tair),' strikes an optimal balance between explanatory capacity and simplicity. While showing promise with determination coefficients of 0.88 and 0.86, caution is advised due to the limited sample size, necessitating future further validation with larger datasets. Nevertheless, this approach could be a valuable tool for stakeholders addressing efficient water use challenges in agriculture. This study highlights the importance of quantifying carbon uptake and ecosystem water use efficiency by almond orchards as a strategy for mitigating climate change.

How to cite: Gabaldón-Leal, C., Sánchez-Virosta, Á., Doña, C., González-Piqueras, J., Sánchez, J. M., and López-Urrea, R.: Carbon Sequestration and Water Use Efficiency on almond orchards. Towards a remote sensing-based approach to monitor GPP, EGU General Assembly 2024, Vienna, Austria, 14–19 Apr 2024, EGU24-19078, https://doi.org/10.5194/egusphere-egu24-19078, 2024.

EGU24-19929 | Orals | HS10.9

Coupled water-carbon modelling at data-limited sites: a new approach to explore current and future agroforestry scenarios in Scotland 

Salim Goudarzi, Chris Soulsby, Jo Smith, Jamie Stevenson, Alessandro Gimona, Iris Aalto, Steven Hancock, and Josie Geris

Agroforestry has been suggested as a promising Nature-Based Solution (NBS) due to its potential benefits including soil water regulation and carbon storage, both of which are expected to become increasingly more important under current climate projection scenarios. But it is unclear to what degree these benefits: (i) are likely to be realised individually; and (ii) may interact/counteract with one another. While common in the tropics, agroforestry in the UK and other temperate areas is still limited. Especially given the lack of data, predicting adaptability and optimising environmental benefits of agroforestry systems in temperate regions requires a parsimonious and robust coupled water-carbon modelling approach. Soil carbon models typically tend to use simplistic soil moisture accounting (e.g., rainfall minus PET) and could yield considerably different predictions under more realistic soil moisture representations. However, while large-scale surface and above surface satellite datasets are now readily available, below-ground soil moisture datasets are either not available, not as accurate, or not on the same scale. This is particularly an issue in systems involving trees because they impact soils in general, but soil moisture in particular, at depths much greater than those covered by global satellites. Here, we present a new 1D ecohydrological model that encompasses the main soil-tree-atmospheric interactions while only requiring rainfall, potential evapotranspiration and surface soil moisture information for its calibration, making the model well-suited to be applied in conjunction with limited available datasets (e.g., those from satellites). We first demonstrate the ecohydrological model’s performance in profile soil moisture estimation using only surface information in a data-rich site in Scotland. We then couple this new model with the widely used RothC carbon model for an agroforestry site nearby. Our results show that CO2 emission estimates by RothC change considerably when a more realistic soil moisture accounting is incorporated. Finally, we explore these effects under different agroforestry and future (50-year) climate projection scenarios to inform appropriate agroforestry designs.

How to cite: Goudarzi, S., Soulsby, C., Smith, J., Stevenson, J., Gimona, A., Aalto, I., Hancock, S., and Geris, J.: Coupled water-carbon modelling at data-limited sites: a new approach to explore current and future agroforestry scenarios in Scotland, EGU General Assembly 2024, Vienna, Austria, 14–19 Apr 2024, EGU24-19929, https://doi.org/10.5194/egusphere-egu24-19929, 2024.

EGU24-20457 | Posters on site | HS10.9

Can time series of plant water potential constrain carbon cycle dynamics using the CARDAMOM model-data fusion framework? 

David Milodowski, Mathew Williams, Luke Smallman, and Susan Steele-Dunne

Vegetation water content varies in response to the shifting balance between transpiration loss and water supply through the soil--plant--atmosphere continuum. These variations are coupled to carbon dynamics by stomatal regulation of gas exchange, linking transpiration and photosynthesis, and through rootzone soil moisture, determined in part by the allocation and turnover of carbon to roots. Microwave sensors have been demonstrated to be sensitive to variations in vegetation water content and related measures of plant hydraulic status, such as plant water potential (PWP). We use synthetic experiments representative of a European deciduous forest to explore whether time series observations of PWP can constrain an intermediate complexity terrestrial ecosystem model (DALEC) with fully coupled carbon and water balances using a Bayesian model-data fusion framework (CARDAMOM). To generate a synthetic truth, we calibrated DALEC using detailed site-specific inventory data from the Hainich ICOS site (DE-Hai), spanning 2006-2011, from which we generated a synthetic time series of average daily mean PWP. The Hainich forest is a temperate forest dominated by beech and established on clay-rich soil. We used the calibrated model as the basis for a series of synthetic data assimilation experiments under conditions of reduced data availability to represent information typically available from satellites and/or global products (e.g. Leaf Area Index, aboveground biomass, soil characteristics) to assess the potential to constrain C cycle dynamics using information on time varying PWP. We compared the diagnostics to a baseline experiment with no assimilated PWP information. Assimilation of PWP reduced the bias in estimates of GPP and ET relative to the synthetic “truth”, with a small reduction in the width of the 90% confidence range, compared to the baseline experiment. PWP observations provided more notable constraints on model parameters that were connected to plant hydraulics and water supply, including root dynamics. The emergent constraint on root dynamics is significant, because below-ground processes are inherently challenging to observe remotely. Assimilating PWP also constrained within-ensemble covariance between certain parameter pairings, and between fluxes, particularly pairings linked to the water balance, and between the water balance and productivity, highlighting the potential for enhanced constraint through the addition of complementary information. Once the signal noise exceeded 0.20 MPa, there was very limited information transfer into either the model parameters retrieved during the inversion, or the resultant fluxes. Our synthetic experiments demonstrate the potential for satellite estimates of PWP (e.g. through microwave VOD) to provide constraints on carbon-water coupling, that these constraints extend to both fast processes (GPP, ET), and slower processes (root dynamics), and that such observations would be highly complementary to C-cycle information from other EO data streams.

How to cite: Milodowski, D., Williams, M., Smallman, L., and Steele-Dunne, S.: Can time series of plant water potential constrain carbon cycle dynamics using the CARDAMOM model-data fusion framework?, EGU General Assembly 2024, Vienna, Austria, 14–19 Apr 2024, EGU24-20457, https://doi.org/10.5194/egusphere-egu24-20457, 2024.

HS11 – Short Courses of specific interest to Hydrological Sciences

HS12 – Inter- and transdisciplinary sessions (ITS) related to Hydrological Sciences

EGU24-363 | Orals | ITS3.15/HS12.3 | Highlight

Water-Energy-Food-Ecosystem Nexus Transition through the Responsible Research and Innovation Roadmap - Lessons learned from four Mediterranean countries. 

Xenia Schneider, Leonor Rodriguez-Sinobas, Daniel Alberto Segovia Cardozo, Mohamed Bahnassy, Basma Hassank, Sendianah Hamdy Khamis Shahin, Rasha Badereldin, Fethi Abdelli, Rudy Rosetto, and Fernando Nardi

Climate change mitigation is becoming increasingly important for curbing severe hydrological events and at the same time for effectively managing natural resources and ensuring food secutiry. The nexus among water, energy, food, and ecosystem has evolved as a resource-management concept to cope with this interlinked set of resources, their complex interactions, and their effect on the natural, innovation, and social ecosystems. The transitioning towards the Water-Energy-Food-Ecosystem (WEFE) Nexus requires awareness among stakeholders, knowledge exchange and mutual learning, before they are able to co-create their WEFE Nexus transition plan and to adopt it for execution. In this respect, the concept of Responsible Research and Innovation (RRI) and its application through the RRI Roadmap is suitable for facilitating the WEFE-Nexus transition through an action plan. This paper will illustrate the RRI Roadmap application for creating WEFE-Nexus awareness among stakeholders enabling them to co-create their common WEFE-Nexus transition plan. The paper exemplifies the lessons learned for creating stakeholders’ awareness in four Mediterranean countries.

How to cite: Schneider, X., Rodriguez-Sinobas, L., Segovia Cardozo, D. A., Bahnassy, M., Hassank, B., Hamdy Khamis Shahin, S., Badereldin, R., Abdelli, F., Rosetto, R., and Nardi, F.: Water-Energy-Food-Ecosystem Nexus Transition through the Responsible Research and Innovation Roadmap - Lessons learned from four Mediterranean countries., EGU General Assembly 2024, Vienna, Austria, 14–19 Apr 2024, EGU24-363, https://doi.org/10.5194/egusphere-egu24-363, 2024.

EGU24-706 | ECS | Posters on site | ITS3.15/HS12.3

First steps into Water-Energy-Food-Ecosystem Nexus Transition in semiarid depopulated regions: A case of study in the Spanish Duero basin.  

Daniel Alberto Segovia-Cardozo, María Sánchez-Bayo Gonzáles, Mara Vallejos Mihotek, Xenia Schneider, and Leonor Rodriguez-Sinobas

Water scarcity and water stress have become a concern for many countries worldwide, especially to Mediterranean countries like Spain. Which, together with the increase in energy prices, have affected food production and degraded ecosystems. Over the last two decades in Spain, irrigated areas have expanded in the interest of modernizing irrigation systems to cope with increased food consumption and to promote economic development and the maintenance of the rural population. At the same time, managing – rising fertilizer and energy prices and water scarcity have become necessities, but also threatening the natural ecosystem. Until now Water, Energy, Food, and Ecosystems (WEFE) challenges have been traditionally managed independently, contrary to the international community recommendation of treating them together in a WEFE Nexus framework to address their interrelationships and achieve a balance. Considering this framework, two workshops took place in the Duero Basin in Spain with the stakeholders, from the different WEFE entities, aiming at promoting and co-defining WEFE-Nexus transition actions for addressing the WEFE-Nexus challenges and for improving the local WEFE-Nexus conditions. As a first step, the WEFE-Nexus transition requires active engagement and building trust among WEFE stakeholders and as a second step to involve them in a co-creation process with knowledge’s exchange and mutual learning. Thus, the Responsible Research and Innovation (RRI) was applied through the RRI Roadmapãä for co-defining WEFE-Nexus transition actions or plan to improve local WEFE-Nexus conditions and identifying knowledge, technical and scientific gaps and how to bridge them to be successful. The first workshop used storytelling and the participatory method of the World Café to actively engage and motivate the stakeholders. The second workshop was performed from an expert point of view and a NEXUS NESS- Serious Game to foster discussion and create awareness on sustainable management practices; it focused on water-energy resource management, agricultural production, and the impact of climate change.

The methodology and the results from both workshops are presented in this paper.

How to cite: Segovia-Cardozo, D. A., Sánchez-Bayo Gonzáles, M., Vallejos Mihotek, M., Schneider, X., and Rodriguez-Sinobas, L.: First steps into Water-Energy-Food-Ecosystem Nexus Transition in semiarid depopulated regions: A case of study in the Spanish Duero basin. , EGU General Assembly 2024, Vienna, Austria, 14–19 Apr 2024, EGU24-706, https://doi.org/10.5194/egusphere-egu24-706, 2024.

EGU24-2309 | ECS | Orals | ITS3.15/HS12.3

Facilitating the Planning of integrated Water-Energy-Food-Environment Systems through Open Software 

Julian Fleischmann, Werner Platzer, Lars Ribbe, Alexandra Nauditt, and Philipp Blechinger

Addressing climate change, environmental degradation, and resource scarcity while ensuring the 
basic supply of the growing earth population are fundamental global challenges. In this context, 
the integration of water, energy, food, and environment systems for tapping cross-sectoral 
synergies and minimizing trade-offs presents a profound opportunity. However, despite their 
huge potential, integrated water-energy-food-environment systems (iWEFEs) are rarely put 
into practice because of, among others, a lack of site-specific data and open tools to describe, 
model, and plan such integrated infrastructure systems. The project addresses this 
gap through open software developed in a scientific process and applied to respective case studies.
The three main research and software development pillars of the project are the following:
1. Conceptualization of open water, energy, food, and environment modeling framework –
OWEFE enabling the development of an open iWEFEs component database
2. Facilitation and automation of WEFE data collection and analysis - WEFE Site Analyst
3. Development of a software-based configurator for site-tailored iWEFEs – iWEFEs 
Configurator
The open software tools shall support small communities, end-users, and NGOs to improve local
water, energy, and food security while protecting the climate and the environment.

How to cite: Fleischmann, J., Platzer, W., Ribbe, L., Nauditt, A., and Blechinger, P.: Facilitating the Planning of integrated Water-Energy-Food-Environment Systems through Open Software, EGU General Assembly 2024, Vienna, Austria, 14–19 Apr 2024, EGU24-2309, https://doi.org/10.5194/egusphere-egu24-2309, 2024.

EGU24-2345 | Posters on site | ITS3.15/HS12.3

Sustainable Irrigation is Promising for Alleviating Global Water Stress 

Zhipin Ai, Naota Hanasaki, Fadong Li, and Xin Zhao

Irrigation causes serious water stress in a wide range of areas around the world. It remains unknown whether and to what extent global water stress can be alleviated by the sustainable use of water resources for irrigation. Here, we delineated a new distribution of global irrigated croplands via strict conservation of available water resources for crop irrigation using an internally consistent model framework. Then, we compared the differences in global water stress under the conditions of current and re-delineated irrigated croplands, respectively. We demonstrated that irrigation on the re-delineated irrigated croplands can largely alleviate global water stress, particularly for areas currently facing high or very high water stress. The results also indicated that irrigated cropland re-delineation would have a limited negative impact on the production of 4 major crops of maize, wheat, rice, and soybean. Our findings highlight importance of sustainable irrigation water management for food production and its potential benefits for alleviating water stress.

How to cite: Ai, Z., Hanasaki, N., Li, F., and Zhao, X.: Sustainable Irrigation is Promising for Alleviating Global Water Stress, EGU General Assembly 2024, Vienna, Austria, 14–19 Apr 2024, EGU24-2345, https://doi.org/10.5194/egusphere-egu24-2345, 2024.

EGU24-4312 | ECS | Posters on site | ITS3.15/HS12.3

Toward Net Zero in the midst of the Energy and Climate Crises: the Response of Residential Photovoltaic Systems  

Lucia Piazza, Francesco Pietro Colelli, Enrica De Cian, and Wilmer Pasut

This paper aims to provide insights on potential strategies for a sustainable energy transition amidst market fluctuations. We analyze the impact of PV adoption on electricity consumption during a volatile price time span, leveraging high-frequency consumption data of over 10,000 households in Northern Italy during the period of the 2022 energy crisis. Our findings reveal that PV adoption reduces electricity consumption responsiveness during extreme price and temperature events, enhancing energy security and affordability. Also, PV uptake effectively reduces greenhouse gas emissions deriving from electricity consumption in the residential sector. Based on estimated demand, we measure changes in consumer surplus loss, highlighting substantial benefits from PV adoption: the change in the annual consumer welfare due to the 2022 price increase is around minus 300 euros for the median consumer with no PV and minus 133 euros when PV is adopted by a comparable median household. 

This study exploits high-frequency data of households residing in the municipality of Brescia between 2021-2022 to infer the impact of PV adoption and the influence of temperatures on grid electricity consumption, as well as to detect potential differences in price elasticity among different consumption groups and seasons. We find that adopting PV systems significantly reduces grid consumption: by 75% on average and by as much as 100% during sunny hours and warmer seasons. Exploiting the exogenous Russia-Ukraine price shock, we find that households who adopt solar PV are more likely to better manage increased temperatures at higher electricity price levels and price fluctuations. Furthermore, we find that "small" consumers can cope worse with high temperatures and are more sensitive to electricity-prices compared to "medium" and "large" consumers, highlighting electricity as a relevant source of inequality.

How to cite: Piazza, L., Colelli, F. P., De Cian, E., and Pasut, W.: Toward Net Zero in the midst of the Energy and Climate Crises: the Response of Residential Photovoltaic Systems , EGU General Assembly 2024, Vienna, Austria, 14–19 Apr 2024, EGU24-4312, https://doi.org/10.5194/egusphere-egu24-4312, 2024.

EGU24-4559 | ECS | Posters on site | ITS3.15/HS12.3

Dynamics of the water-energy-cropland nexus in China from 2007 to 2017: Implications for the Dual Circulation Strategy 

Ziwen Liu, Deqi Zheng, Xiaoyu Duan, Qingxu Huang, and Shiyu Zhang

Natural resources are fundamental for socioeconomic development and sustainable development. However, our understanding on the dynamic connections of water resources, energy and cropland still remains unclear. This study developed a framework covering multi-sectoral and multi-product water-carbon-cropland nexus, identifying key areas for water, energy and cropland conservation by considering both the resource utilization efficiency and connections between provinces. The new framework revealed that the utilization efficiencies of the three resources improved from 2007 to 2017 in China, with the average values of the direct, indirect, and total coefficients of virtual water consumption, embodied carbon emmisions and virtual cropland use decreasing by 63.3%, 40.6% and 59.2%, respectively. Meanwhile, the inter-provincial connections of water-carbon-cropland nexus have weakened, with a downward trend of pull coefficients. Gansu, Ningxia, and Xinjiang were typical regions with high consumption in water, energy and cropland, with the average value of the total coefficients of the three resources nearly twice the national average. Xinjiang, Ningxia and Inner Mongolia were regions with weak water-energy-cropland connections, and their average pulling coefficient was about 36% of national average. Under the "dual circulation" development pattern of China, it’s necessary to improve resource utilization efficiency in the future by promoting economic cooperation between regions with strong connections and weak connections, and promoting the efficient utilization of resources for regions (e.g., Xinjiang and Gansu) under the help of developed regions (e.g., Beijing and Shanghai). This framework can further capture the food-energy-water nexus (FEW nexus) at urban, provincial and even global scales, and can be used as an important tool to identify the process of multiple sustainable development goals (SDGs 2, 6, 7 and 12).

How to cite: Liu, Z., Zheng, D., Duan, X., Huang, Q., and Zhang, S.: Dynamics of the water-energy-cropland nexus in China from 2007 to 2017: Implications for the Dual Circulation Strategy, EGU General Assembly 2024, Vienna, Austria, 14–19 Apr 2024, EGU24-4559, https://doi.org/10.5194/egusphere-egu24-4559, 2024.

Food, energy and water are essential resources for human survival and development, and they are three elements of the 17 UN Sustainable Development Goals (SDGs). Expansion of human activity and climate warming are exacerbating severe risks of water, energy, and food shortages. How to manage the limited resources in an efficient and synergistic manner is essential to achieving sustainable development. Since there are few studies on the Water-energy-food (WEF) nexus for semi-arid regions in northwest China, we took Xinjiang Uygur Autonomous Region (XUAR) as an example to assess the impacts of climate and policies on the water, energy and food sectors in the context of global warming and identify ways to adapt. Firstly, we developed a non-linear system dynamic model to illustrate the interactions between food, energy and water, then 5 scenarios were set up by mainly change food self-sufficiency rate, clean energy use rate and energy intensity, to figure out the impact of different decisions and strategies on WEF nexus from 2020 to 2060, and provide solutions that are conducive to achieve carbon neutrality goal. Finally, we conducted a multi-objective optimization algorithm to attempt to mitigate the conflict between limited resources, socio-economics and a low-carbon environment. The results showed that: (1) The supply and demand for food and energy resources in XUAR showed an increasing trend between 2000 and 2020, while water resources decrease with greater decline on demand side. (2) For every 10% increase in food self-sufficiency, irrigation water, energy demand and carbon emissions will increase by 3.22%, 0.04% and 0.08%, respectively. And every 10% increase in clean electricity usage will cut down water demand and carbon emissions by 8.21% and 8.84%, respectively. (4) Under future water resources conditions, the feasible scenarios can reduce carbon emissions by 79% and enable a 13% reduction in agricultural water consumption comparing to the baseline scenario. Besides, the water stress will switch from very high to very low, which is a qualitative leap in achieving the Sustainable Development Goals (SDGs), especially SDG6 (Clean water and sanitation). To conclude, by reducing the area of cereals, improving irrigation efficiency and increasing the use of clean energy, we can achieve the goal of carbon peak and carbon neutrality, as well as sustainable development.

How to cite: Huang, Y.: Water-energy-food nexus in Xinjiang Uygur Autonomous Region: Combined Impact of Climate change and Policies, and potential adaptation pathways , EGU General Assembly 2024, Vienna, Austria, 14–19 Apr 2024, EGU24-5223, https://doi.org/10.5194/egusphere-egu24-5223, 2024.

EGU24-5913 | ECS | Posters on site | ITS3.15/HS12.3

Predicting  Carbon-13 (δ13C) signatures as a Indicator of Water Use Effciency (WUE) in Cassava using Mid-Infrared Spectroscopy (MIRS) 

Sarata Darboe, Magdeline Vlasimsky, Jonas Van Laere, Gerd Dercon, Maria Heiling, Margit Drapal, Laura Perez, Luis Augusto Becerra, Michael Gomez Selvaraj, and Paul Fraser

The intricate interplay among plant water dynamics, nutritional content, and soil health is pivotal for unravelling the complexities inherent in plant materials, forging a direct link to the intricate web of the water-energy-food nexus. This investigation aims to find more accessible ways of evaluating the interplay between soil characteristics, water use in agriculture, and plant health, contributing crucial insights to sustainable agricultural practices that align with the SDGs 2030 Agenda for zero hunger, better environment, and enhanced human well-being.

Cassava, as a staple crop in many developing countries is the focal point for this study, aiming for proof of a more affordable and accessible way of accessing the impact of water scarcity and nutrient deficiency. This understanding becomes particularly crucial in the development of effective digital technologies tailored to enhance the sustainability of agricultural practices, fostering a balance within the intersection of water, energy, and food systems.

The core objective of this research is to assess the efficacy of Mid-Infrared Spectroscopy (MIRS) in predicting Carbon-13 (δ13C) signatures in cassava, establishing correlations between MIR spectral features and reference C-13 data obtained through Isotope Ratio Mass Spectrometry (IRMS). While Near-Infrared Spectroscopy (NIRS) and IRMS have demonstrated acceptable accuracy in modelling C-13 content in plant material, the underexplored potential of Mid-Infrared Spectroscopy (MIRS) holds promise, given its proven prediction potential with soil parameters as well as the small, required sample size which make it even more affordable, accessible, and sustainable. By grounding this investigation in the larger objective of managing the resource use efficiently, the calibration and validation process aims to contribute to the development of a broadly applicable methodology, across geographic boundaries and mediums and enhancing the collective understanding of the interdependencies within the water-energy-food nexus. 

Carbon-13 (δ13C) signatures in cassava offer invaluable insights into water use and transpiration efficiency and with a data-driven decision-making approach, not only informs farmers about optimal irrigation levels but also contributes to the broader discourse on sustainable resource management. Leveraging a dataset comprised of more than 700 cassava plant samples, this study employs Mid-Infrared Spectroscopy (MIRS) to predict δ13C content primarily in leaf material, utilizing Partial Least-Squares Regression (PLSR) to develop a robust model. Preliminary findings indicate that the indirect estimation is possible. The model's prediction performance, assessed through accepted statistical metrics such as R2 and RMSE, sheds light on the potential of MIRS for plant parameter prediction as an indicator of best soil and water management practices.

How to cite: Darboe, S., Vlasimsky, M., Van Laere, J., Dercon, G., Heiling, M., Drapal, M., Perez, L., Augusto Becerra, L., Gomez Selvaraj, M., and Fraser, P.: Predicting  Carbon-13 (δ13C) signatures as a Indicator of Water Use Effciency (WUE) in Cassava using Mid-Infrared Spectroscopy (MIRS), EGU General Assembly 2024, Vienna, Austria, 14–19 Apr 2024, EGU24-5913, https://doi.org/10.5194/egusphere-egu24-5913, 2024.

EGU24-6351 | ECS | Orals | ITS3.15/HS12.3

Hydropower Dams and the Human Right to Water: an Operational Transdisciplinary Assessment Framework 

Julie Faure, Marc Muller, Leonardo Bertassello, Elizabeth Dolan, Ellis Adams, Rahman Sulaimanov, Diane Desierto, Portia Chigbu, and Jonathan Pabillore

There is growing urgency for actionable and standardized approach to human rights assessments of hydropower dam constructions and operations that incorporates multiple dimensions of the right to water. Yet, the water issues faced by affected communities are determined by local contexts and therefore challenging to map to universal norms like human rights in a way that is both objective and transferrable. Conversely, the human right to water extends beyond the narrow dimensions of water access and availability and also includes cross cutting obligations (e.g, self-determination and non-discrimination) and inter-related rights (e.g., rights to health, healthy environment and livelihood). The nearly universal scope of human rights with respect to water makes them challenging to apply without an operational framework to systematically diagnose challenges to their implementation in practical settings. The framework that we present addresses both challenges with a procedure to systematically diagnose multiple key dimensions of inadequate water access (e.g, green, blue and economic water scarcity or excess) and governance failures (e.g., power asymmetry or threats to hydrosocial relations). The framework then maps the diagnosed issues to specific challenges to implementation of human rights that account for their multi-dimensional nature. This work is a unique transdisciplinary collaboration between water intensive industries and experts from the fields of hydrology, governance, and human rights law. We apply the framework to representative international hydropower cases (e.g., the Lower Sesan 2 Dam in Cambodia, the Muskrat Falls Dam in Canada) to synthesize key insights on the relationship between human rights and the impacts of hydropower projects on water security and governance.

How to cite: Faure, J., Muller, M., Bertassello, L., Dolan, E., Adams, E., Sulaimanov, R., Desierto, D., Chigbu, P., and Pabillore, J.: Hydropower Dams and the Human Right to Water: an Operational Transdisciplinary Assessment Framework, EGU General Assembly 2024, Vienna, Austria, 14–19 Apr 2024, EGU24-6351, https://doi.org/10.5194/egusphere-egu24-6351, 2024.

EGU24-7799 | Posters on site | ITS3.15/HS12.3

Water hyacinths: Use them or lose them? A holistic approach to a multi-faceted problem 

Marloes Penning de Vries, Timothy Dube, Finn Münch, Mgcini Ncube, Carmen Anthonj, Lisette De Senerpont Domis, Piet Lens, Thomas Marambanyika, Ntandokamlimu Nondo, Frank Osei, Cletah Shoko, and Daphne van der Wal

Lakes in tropical regions around the world suffer from the infestation of water hyacinth. Its proliferation is attributable to the influx of nutrient-rich waters, as rivers feeding the lakes are polluted with wastewater and run-off of fertilizer and manure from surrounding agricultural fields and husbandry within the catchment. The weed clogs waterways and intakes and affects aquatic life, water availability, transportation, fishing, irrigation, and tourism. Water hyacinth infestation has implications for human health, as it may facilitate the spread of water-related diseases. While water hyacinth may pose health risks, they have the potential to benefit human livelihoods when exploited for wastewater treatment, as fertilizer, for biofuel production or, when made into handicrafts, as a source of income.

A sustainable solution to these issues tackles both water quality deterioration and water hyacinth infestation, and “uses” water hyacinth instead of only attempting to “lose” them.  We present a research project that identifies such solutions, applicable and appropriate within the local and cultural context of our study region, Lake Chivero, the main source of drinking water to Harare. The project consists of three main pillars: (1) performing systematic studies of causes and effects of water hyacinth spread based on satellite and empirical data; (2) scientifically investigating water hyacinth exploitation methods, and (3) engaging with stakeholders to co-develop strategies to address the challenges of water quality and water hyacinth. The project’s impacts will be a more healthy and resilient lake ecosystem, improved wellbeing of people depending on the lake, and more resilient communities at Lake Chivero and other lakes in Sub-Saharan Africa. It will thereby contribute to the achievement of the United Nations Sustainable Development Goals (SDG) related to health (SDG 3), drinking water (SDG 6), and sustainable communities (SDG 11). Moreover, the project is in line with the South African National Development Plan 2030 and the African Union Agenda 2063.

How to cite: Penning de Vries, M., Dube, T., Münch, F., Ncube, M., Anthonj, C., De Senerpont Domis, L., Lens, P., Marambanyika, T., Nondo, N., Osei, F., Shoko, C., and van der Wal, D.: Water hyacinths: Use them or lose them? A holistic approach to a multi-faceted problem, EGU General Assembly 2024, Vienna, Austria, 14–19 Apr 2024, EGU24-7799, https://doi.org/10.5194/egusphere-egu24-7799, 2024.

EGU24-9934 | Posters on site | ITS3.15/HS12.3 | Highlight

Hybrid Framework for Water-Energy-Food Nexus Digital Twin Data Collection  

Nagham Saeed, Atiyeh Ardakanian, Leo Choe Peng, and Goh Hui Weng

In our research, we investigate the integration of the water-energy-food (WEF) nexus into a unified system and claim it is a critical step in achieving food security, while minimizing environmental degradation. This approach recognizes the interconnectedness of these essential resources and highlights the importance of a holistic and modern strategy in addressing global sustainability challenges. We facilitate this integration through Digital Twins (DTs), offering a virtual representation of this nexus. A critical step in developing a WEF Nexus DT is the collection of relevant data. Our project demonstrates that a hybrid approach is essential to gather comprehensive data for an effective WEF DT model. While traditional methods remain invaluable, they need to be combined with state-of-the-art technology. For instance, water quality, a key parameter in the WEF DT, is currently best assessed through direct sampling rather than IoT sensors or satellite data. Equally, energy parameters can be effectively monitored via satellite, and food production data can be accurately collected using IoT sensors. This hybrid data collection framework underscores the need for a multi-faceted approach, integrating both conventional and advanced technologies, to build a robust and reliable WEF Nexus DT.

How to cite: Saeed, N., Ardakanian, A., Choe Peng, L., and Hui Weng, G.: Hybrid Framework for Water-Energy-Food Nexus Digital Twin Data Collection , EGU General Assembly 2024, Vienna, Austria, 14–19 Apr 2024, EGU24-9934, https://doi.org/10.5194/egusphere-egu24-9934, 2024.

EGU24-10280 | ECS | Posters on site | ITS3.15/HS12.3 | Highlight

The study on Digital Twins in Managing Water-Energy-Food Sectors in South Africa  

Atiyeh Ardakanian, Nagham Saeed, Hloniphani Moyo, and Rabelani Mudzielwana

The study on Digital Twins (DT) in South Africa emphasizes DT's role in enhancing the efficiency of management and governance within the Water-Energy-Food nexus. By integrating data across energy, agriculture, and water sectors, DT provides a more cohesive and informed approach to decision-making where various stakeholders with multiple interests are involved. This integration enables streamlined governance processes and optimal resource utilization. Currently, governance in South Africa's water, energy, and food sectors is characterized by a mix of state and private involvement. The energy sector is overseen by the Department of Mineral Resources and Energy and includes state-owned entities, alongside private independent power producers and regulatory bodies. In agriculture, the Department of Agriculture, Land Reform and Rural Development plays a key role, with additional input from various agricultural bodies and NGOs. Water rights are state-owned, managed by the Department of Water and Sanitation, and regulated through licenses, with local management by water boards and municipalities. The land is a mix of private and state ownership, with a focus on agricultural development and reform. By understanding the priorities and influences of different groups, anticipating conflicts, and fostering cooperation, through DTs, we can ensure that initiatives for environmental conservation are more widely successful. 

How to cite: Ardakanian, A., Saeed, N., Moyo, H., and Mudzielwana, R.: The study on Digital Twins in Managing Water-Energy-Food Sectors in South Africa , EGU General Assembly 2024, Vienna, Austria, 14–19 Apr 2024, EGU24-10280, https://doi.org/10.5194/egusphere-egu24-10280, 2024.

EGU24-12610 | Orals | ITS3.15/HS12.3

Exploring stakeholder priorities regarding decentralized waste-water treatment in the Brantas river basin using Q-methodology 

Maurits Ertsen, Valeria Martinez Rodriguez, Merle De Kreuk, Schuyler Houser, and Mar Palmeros Parada

Next to the challenges of paramount importance represented by water scarcity, food security, energy transition, and environmental protection issues, the obstacles faced on the matter of water, sanitation, and hygiene (WASH) are immense. WASH interventions are essential to support human health, prosperity, and dignity, as they provide the base for an adequate standard of living. In many low- and middle- income countries, especially in rural and low-income areas, decentralized wastewater treatment systems (DEWATS) can offer a solution to convey, treat, and dispose of or reuse wastewater closer to the source and through smaller conveyance networks. In Indonesia, and as such in the Brantas basin on East Java, focus area of this study, the government has recognized DEWATS as their best available option for improving sanitation in dense low-income urban settings. Although the percentage of households with access to proper sanitation in the province of East Java has been increasing steadily, service coverage and the quality of sanitation systems still need to be increased to reach the desired coverage by 2024. Similar to other fields of application, within WASH and concerning DEWATS, stakeholders engagement, ethics and gender dimension are key topics to develop and strengthen integrated approaches. It is challenging to formulate targeted interventions in the watershed since they depend on the willing support of various stakeholders who may have different priorities (even within their own institutions), having diverse (and sometimes conflicting) viewpoints. This may result in stakeholders strongly contesting the appropriateness of various solutions. An exploration of stakeholder priorities is therefore needed to facilitate the application of wastewater treatment technologies. Due to its participatory approach and the type of interpretation that the method allows, Q-methodology was selected to explore this situation. Q-methodology is a set of techniques which allow for the study of ‘subjectivity’, combining statistics with the depth provided by qualitative data. It is composed of the data collection technique (called Q-sorting) and a data analysis step via correlation and factor analysis. In this contribution, we explore the perspectives and priorities of various stakeholders regarding decentralized wastewater treatment solutions to assess the applicability and acceptability of DEWATS in the Brantas river basin. This allows us to identify context-based criteria and challenges to the implementation of DEWATS in the Brantas watershed. As such, we propose the Q-methodology as a strong methodology to further develop the required transdisciplinary scientific efforts to promote relevant insights and solutions through meaningful, pertinent, and effective stakeholder engagement.

How to cite: Ertsen, M., Martinez Rodriguez, V., De Kreuk, M., Houser, S., and Palmeros Parada, M.: Exploring stakeholder priorities regarding decentralized waste-water treatment in the Brantas river basin using Q-methodology, EGU General Assembly 2024, Vienna, Austria, 14–19 Apr 2024, EGU24-12610, https://doi.org/10.5194/egusphere-egu24-12610, 2024.

EGU24-12757 | ECS | Posters on site | ITS3.15/HS12.3 | Highlight

Integrated technical and governance analysis of the water-energy-food-ecosystems Nexus in a mountain catchment in Northern Italy 

Enrico Lucca, Luigi Piemontese, Janez Sušnik, Sara Masia, Giulio Castelli, and Elena Bresci

The simultaneous achievement of multiple societal, environmental, and economic goals is challenged by the interconnectedness of global and local resources systems (e.g., water for food and energy production, energy for water extraction and treatment), and by the rules and actors that determine the allocation of such resources. The Water-Energy-Food-Ecosystems (WEFE) Nexus promotes a systemic approach to the management and governance of intertwined systems focusing on the mutual interdependence between sectors and emphasising trade-offs and synergies across sectoral goals. Despite these premises, however, assessments of WEFE Nexus systems often do not address in an integrated manner the multiple dimensions under which the interconnections among water, energy, food, and ecosystems emerge, i.e., from the flows of resources across sectors to their socio-economic implications and their institutional context. In our study, we develop a methodological framework to characterise the interlinkages among water, energy, food, and ecosystems both at the biophysical and at the governance level. Through consultation with local stakeholders, we build casual loop diagrams to show physical relationships between processes and activities in the four sectors, while we apply the network of action situations (NAS) approach to assess interactions between venues of decision making and policy formulation. We apply this integrated approach to the Torrente Orco mountain catchment in Northern Italy, where the interlinkages between cereal production, energy generation and the preservation of natural ecosystems are becoming more evident due to the impact of climate change and sectoral developments. To inform the analysis, we used different data collection methods, including interviews with stakeholders, observation of stakeholder meetings, review of local news and analysis of regional plans and regulations. The results reveal that the water deficits experienced more frequently in recent years has led to key trade-offs between water uses, such as the abrogation of environmental flow requirement to meet irrigation water demands, but it also created important synergies, such as the multi-purpose use of hydropower reservoirs during droughts, the shift towards more water-efficient crops and the modernization of irrigation systems. Furthermore, three venues of decision making are highlighted as key opportunities to reconcile the water balance at the catchment scale: the renewal of hydropower concessions, the definition of the environmental flow requirement, and the renewal of irrigation permits.  The proposed approach was proven useful to reach a comprehensive overview of Nexus interconnections, a first crucial step for any further assessment that aims at understanding how the system might evolve in the future and what technical and non-technical interventions could help increase its resilience.

Acknowledgement

We gratefully acknowledge the ‘PON Ricerca e Innovazione 2014-2020: Istruzione e ricerca per il recupero—REACT-EU’ Programme of the Italian Government, through the PhD scholarship Granted to Enrico Lucca (scholarship n. DOT137M5SZ n. 2, 2022–2024)

How to cite: Lucca, E., Piemontese, L., Sušnik, J., Masia, S., Castelli, G., and Bresci, E.: Integrated technical and governance analysis of the water-energy-food-ecosystems Nexus in a mountain catchment in Northern Italy, EGU General Assembly 2024, Vienna, Austria, 14–19 Apr 2024, EGU24-12757, https://doi.org/10.5194/egusphere-egu24-12757, 2024.

EGU24-12900 | Posters on site | ITS3.15/HS12.3

Assessing the capability of SDGs in achieving sustainable development from Nexus and global perspectives concerning water-food security 

Sudeh Dehnavi, Hamideh Nouri, Neda Abbasi, and Marcela Brungnach

While SDGs have become a common ground to address global sustainability systematically, neither the existing synergies and tradeoffs among the different SDGs nor the magnitude of their compound effects at global versus national scales are well understood. Although introducing two indices of Spillover Index and Global Commons Stewardship (GCS) shed light on these issues, the capability of these widely agreed SDGs in fulfilling every nation's needs and dedication to protecting global sustainability is yet questionable. The SDGs' shortcomings are most evident when there are interdependencies and contradictory requirements among SDGs, becoming critical when SDGs at the national level protect one country at the expense of another one. The impact of achieving food security (often in water rich countries) through the import of agricultural products from their trade partner countries (often in water scarce countries) is one of the examples.

Here we aim to understand whether and how lacking a global nexus perspective that takes into account the synergies and tradeoffs among the different SDGs can counteract other nations and SDGs. We investigate the connection between SDG 2 and 6 in the context of water and food security; particularly, the impact of food security strategies of an importing country on the water security of its trade partner countries. The findings present that although neglecting the tight links between SDGs of 2 and 6 may have a positive sectoral effect at a country level, it fails global sustainability as it impacts the involved countries unevenly and often antipodally. it emphasizes the need for a revision of SDG2, as it inadequately captures the perspective of food security from the standpoint of hunger. This study advocates for inclusion of  NEXUS and system thinking in the reformulation of the SDGs, their targets, and the associated indicators.

How to cite: Dehnavi, S., Nouri, H., Abbasi, N., and Brungnach, M.: Assessing the capability of SDGs in achieving sustainable development from Nexus and global perspectives concerning water-food security, EGU General Assembly 2024, Vienna, Austria, 14–19 Apr 2024, EGU24-12900, https://doi.org/10.5194/egusphere-egu24-12900, 2024.

EGU24-12977 | Posters on site | ITS3.15/HS12.3

A Fuzzy Cognitive Mapping approach to support WEFE NEXUS policies and decision-making 

Maite Sanchez-Revuelta, Daniel A. Segovia-Cardozo, Xenia Schneider, and Leonor Rodriguez-Sinobas

Water stress, together with rising energy prices, have become a major concern worldwide, especially for food production (the major water consumer) that leads to ecosystem degradation in arid and semiarid countries such as Spain. The Spanish irrigated area ​​ has been continuously expanding and modernizing in response to the food demant increase and to promote economic development and support the rural areas which are aspects generally considered on an individual basis, against the advice of the international community to achieve a balance in  Water, Energy, Food and Ecosystem (WEFE) Nexus. But also, it is crucial to consider stakeholders' perspectives, understand their experiences and opinions to work together and find more realistic and effective solutions. Participatory modeling, such as Fuzzy Cognitive Mapping (FCM), is frequently used, with satisfactory results, within the WEFE Nexus context to understand the perception of stakeholders for decision making.

This work aims to analyze the perceptions of various stakeholders (researchers, policymakers, environmental groups, farmers' associations, food retailers, consumer organizations, water treatment companies, and water reuse experts) regarding interactions in variables related to the four sectors of the WEFE nexus in the Duero River basin. Understanding the perception of the stakeholders about these topics can help to improve policy, decision making and to enhance scientific research, innovation, and knowledge transfer in the fields related to the WEFE Nexus.

To identify the concepts, three workshops were conducted with 14 participants from different sectors related to WEFE NEXUS areas.  The workshop accomplished  different activities with the purpose of highlighting the main ideas about WEFE in a participative way, that were reinforced in the following workshop, to make sure that we gather the real perception of the stakeholders without leaving any of them aside. As a result, 30 concepts have been identified, simplified and used to develop a FCM, in which stakeholders will identify relations between them, assigning weights to these relationships correlations based on their own perception. Then, the final FCM will be analyzed by Metal Modeler program, which will allow to understand interconnections among variables according to the stakeholders´ perception and study future scenarios obtained as a result of performed workshops. Scenario analysis allows to explore the intricate relationships that exist within a system, and to examine how changes in one variable can influence the dynamics of the entire system. Creating narrative pathways from plausible future developments helps decision-makers assess the potential impact of policies from the perspective of multidisciplinary stakeholders.

How to cite: Sanchez-Revuelta, M., A. Segovia-Cardozo, D., Schneider, X., and Rodriguez-Sinobas, L.: A Fuzzy Cognitive Mapping approach to support WEFE NEXUS policies and decision-making, EGU General Assembly 2024, Vienna, Austria, 14–19 Apr 2024, EGU24-12977, https://doi.org/10.5194/egusphere-egu24-12977, 2024.

Recent hydropower developments in Brazil were accompanied by promises to enhance the quality of life for the local population residing near the construction site of dams. To convince both locals and the broader national and international audience, the argument often centered around the hydropower project being an unparalleled opportunity to elevate deprived populations to a "developed" status, marked by significantly improved living standards. Our study aims to analyze how the residents of the medium-sized town of Altamira in the Brazilian Amazon perceive the impacts of Belo Monte, the country's second-largest hydropower dam built between 2011 and 2015, on fundamental resources—specifically, water, energy, and food. Additionally, we seek to examine how this perception varies based on sociodemographic characteristics such as age, gender, income, civil status, local or migrant status, ethnicity, and education. We will also explore the spatial distribution of these perceptions within the urban area. Our data consist of a survey based on a probabilistic sample of 500 households conducted across 10 census tracts (50 interviews per tract) in July 2022. Interviews were conducted with the head of the household or another household member aged 18 or over. Eligibility for survey participation required residency in the urban area of Altamira during and after the dam construction. Regarding the impact of Belo Monte on water system provision improvements, our findings suggest that over 59% of respondents indicated a negative impact or no impact. Furthermore, 86.8% of households reported a negative impact on energy prices, indicating that the dam did not contribute to increased energy access; in fact, it had the opposite effect. Lastly, 61% of the sample expressed negative impacts on food, citing high prices during construction that persisted even after completion. Our study also revealed that resettled populations in the urban area of Altamira faced more challenges in accessing water provision, experiencing more shortages compared to the rest of the population (χ² = 25.6401, p-value < 0.05). Additionally, resettled populations perceived energy prices more negatively than the population as a whole (χ² = 9.0392, p-value < 0.05). Our study employs statistical modeling and spatial analysis to investigate the disparities in these perceptions, examining how costs and benefits are unevenly distributed across the socio-spatial landscape, potentially exacerbating existing local inequalities. We advocate for essential interventions aimed at alleviating these disparities, such as subsidizing access to water, energy, and food for the residents of Altamira. Additionally, we provide insights into the unintended consequences of hydropower dam construction, especially in the Global South, where there is a substantial surge in the development of this energy source.

How to cite: Cavallini Johansen, I. and F. Moran, E.: Unfulfilled promises? Investigating the impact of the Belo Monte hydropower dam on water, energy, and food access in the Brazilian Amazon, EGU General Assembly 2024, Vienna, Austria, 14–19 Apr 2024, EGU24-13331, https://doi.org/10.5194/egusphere-egu24-13331, 2024.

EGU24-17304 | Posters on site | ITS3.15/HS12.3

Gender and Climate Change, Analysis in Various Red Cross Intervention Countries 

Javier Sigro, Mercè Cisneros, Jon Olano, Anna Boqué-Ciurana, Caterina Cimolai, Júlia Pastor-Diaz-de-Mera, and Clara Vidal-Bibiloni

Gender inequality and climate change are two major challenges currently confronting the human species. This collaborative project between the Red Cross in Catalonia in collaboration with the Catalan Agency for Development Cooperation and the Center for Climate Change (C3) at the Universitat Rovira i Virgili (URV), Spain, presents a comprehensive summary of the analysis of climate change impacts in diverse intervention countries. The study offers a global perspective on climate change trends, focusing on temperature variations, greenhouse gas concentrations, oceanic changes, cryosphere dynamics, precipitation patterns and, extreme climatic events.

Moving from the global to the regional scale, the report highlights the specific impacts on ecosystems, food systems, hydrological systems, sea levels, and public health. Special attention is given to localized effects in Catalonia, such as wildfires, floods, and water resource challenges.

 The project then explores the nuanced intersection of gender and climate change, emphasizing differentiated impacts and vulnerabilities across demographic groups. An analysis of climate vulnerability evolution with a gender lens includes an examination of international, national, and regional policies and reports.

 Differentiated gender impacts are illustrated through case studies in Guatemala, Colombia, Sahara (Africa), Mozambique (Africa), Afghanistan (Asia), and Iran (Asia). Each case study provides insights into the general context, the intersection of climate change and gender, energy poverty challenges, and the governance and participation of women in climate-related initiatives.

 To ground the analysis in empirical data, the study incorporates an in-depth analysis of the "En Moviment" program's data, covering socio-demographic aspects, climate change perceptions, governance structures, extreme weather events, and access to energy. The abstract concludes with comprehensive insights and recommendations, offering a nuanced understanding of the gendered dimensions of climate change impacts and responses in diverse geographical contexts, suitable for presentation at a congress.

The study delves into the intricate relationship between climate change and gender inequality, underscoring their global significance. The research emphasizes the urgent need for an interdisciplinary approach, exploring how human-induced climate change has escalated atmospheric CO2 levels, altered temperature patterns, and impacted ecosystems. Women, constituting the majority in vulnerable populations, face disproportionate vulnerabilities, exacerbated by gender-based disparities in decision-making, access to resources, and climate-induced poverty. Specific case studies in Catalonia and diverse global regions reveal nuanced gendered impacts, highlighting the crucial role of women in adaptation and mitigation efforts. The study concludes that addressing climate change requires a profound understanding of gender dynamics, advocating for inclusive responses that prioritize gender equality as a cornerstone for building a sustainable and just future.

How to cite: Sigro, J., Cisneros, M., Olano, J., Boqué-Ciurana, A., Cimolai, C., Pastor-Diaz-de-Mera, J., and Vidal-Bibiloni, C.: Gender and Climate Change, Analysis in Various Red Cross Intervention Countries, EGU General Assembly 2024, Vienna, Austria, 14–19 Apr 2024, EGU24-17304, https://doi.org/10.5194/egusphere-egu24-17304, 2024.

EGU24-17756 | ECS | Posters on site | ITS3.15/HS12.3

Evaluating the demand for water for agricultural use for adaptation to climate change at the subbasin level (AGUAGRADA) 

Maite Jimenez-Aguirre, Carmen Galea, Sofía Garde-Cabellos, David Ribas-Tabares, Barbara Soriano, Paloma Esteve-Bengoechea, Irene Blanco-Gutierrez, Jon Lisazo, Carlos H Díaz-Ambrona, David Pérez, Leonor Rodriguez-Sinobas, Margarita Ruiz-Ramos, Isabel Bardají, and Ana M Tarquis

Given the decrease in water availability for agriculture caused by climate change (CC) in Mediterranean environments, it is necessary to use water efficiently in food production. As stated in the PNACC (National Plan for Adaptation to Climate Change), knowing the water demand for agricultural use before and after adaptation to CC is essential. In turn, for this, it is necessary to optimize the monitoring of the basins. To this end, AGUAGRADA proposes a monitoring and modeling system at the sub-basin scale and scalable to higher order basins, capable of quantifying the water demand for agricultural use under different climate, management scenarios (compatible with the CAP), and socio-economic and economic conditions of policies. The results of present and future water demands are expressed in PNACC indicators since the project aims to contribute directly to its implementation.
The general objective of this project is to develop and apply a method for evaluating water demand for agricultural use applicable at the sub-basin and basin scale before and after adaptation to climate change (CC). To achieve this, the following specific objectives are defined:

  • Design an optimal methodology for monitoring water demand for agricultural use applicable at the sub-basin and basin scale using PNACC indicators, replicable and scalable to other regions and even at the national level.
  • Co-create with stakeholders/farmers the selection of agricultural practices and CC adaptation measures to optimize water demand for agricultural use at the sub-basin and basin scale and ensure environmental and socio-economic sustainability. Analyze possible incentives for their inclusion in eco-regimes or CAP agri-environmental programs and study the best implementation routes (multidisciplinary approach).
  • Analyze water demand for agricultural use in the future without and with climate change adaptation.
    The actions as the advances achieved in this project will be explained.

Acknowledgements:
Fundación Biodiversidad del Ministerio para la Transición Ecológica y el Reto Demográfico, a través de la Convocatoria de subvenciones para la realización de proyectos que contribuyan a implementar el Plan Nacional de Adaptación al Cambio Climático (2021-2030) (CBIO230220C063)

How to cite: Jimenez-Aguirre, M., Galea, C., Garde-Cabellos, S., Ribas-Tabares, D., Soriano, B., Esteve-Bengoechea, P., Blanco-Gutierrez, I., Lisazo, J., Díaz-Ambrona, C. H., Pérez, D., Rodriguez-Sinobas, L., Ruiz-Ramos, M., Bardají, I., and Tarquis, A. M.: Evaluating the demand for water for agricultural use for adaptation to climate change at the subbasin level (AGUAGRADA), EGU General Assembly 2024, Vienna, Austria, 14–19 Apr 2024, EGU24-17756, https://doi.org/10.5194/egusphere-egu24-17756, 2024.

EGU24-18064 | ECS | Orals | ITS3.15/HS12.3 | Highlight

Towards sustainable water-energy-food-ecosystems governance: an integrating participatory approach and systems modelling for co-exploring the nexus 

Valentina Monico-Gonzalez, Desamparados Martinez-Domingo, and Eulalia Gomez-Martin

Global trends point to a growing challenge to meet the demand for water, energy, and food in the coming years, exacerbated by population growth, economic development, climate change, and environmental degradation. According to reports such as IPCC and EU Environment, this outlook threatens sustainability and equity in using natural resources. Despite the EU's environmental and energy policy efforts, such as the European Green Pact, the Water Framework Directive, and the Common Agricultural Policy (CAP), challenges persist in water management and the its alignment of with food production and energy policies.
The UN 2030 Agenda addresses these challenges, recognizing the interdependence of the Sustainable Development Goals (SDGs). Highlighting the crucial role of water for population and ecosystems, SDG 6 and 15, which intertwines with others. Achieving the 2030 Agenda requires a thorough understanding of the interconnections between the SDGs and coherent water governance policies at different levels and sectors.

The WEFE NEXUS (Water-Energy-Food-Ecosystems) concept has emerged as a promising tool to address these interdependencies and improve policy coordination. However, effectively translating this concept into effective governance practices remains a challenge. The complexity of the NEXUS requires multidisciplinary and holistic approaches, integrating quantitative and qualitative information at various spatio-temporal scales and institutional boundaries. Including stakeholders throughout the process enriches the diversity of perspectives and fosters the conscious and effective adoption of established measures by a significant portion of the population. The proactive participation of stakeholders not only enhances understanding of the interconnections between the SDGs and NEXUS governance but also contributes to creating more effective and sustainable governance practices. This inclusive approach is essential for achieving sustainable and resilient development that reflects the needs and concerns of the community at large.

This work seeks to develop a guide for implementing NEXUS governance practices and policies, co-created with stakeholders and end-users. The objectives include identifying previous challenges the watershed might face, causal relationships among variables, their polarity and weight (importance within the system) with causal loop diagrams, analyzing the influence of different stakeholder perspectives (assuring WEFE representativeness and avoiding power dynamics among them) on the effectiveness of adaptation measures, and assessing the integration of NEXUS into legislative frameworks such as the CAP. A combined literature review methodology, participatory processes, and system dynamics modeling will be used to achieve these objectives.
This study is being carried out in three case studies in Spain: the Júcar, Tagus and Segura River basins. The combination of interviews, group workshops, and participatory modeling activities highlight the active involvement of stakeholders in the co-creation of governance practices. Conceptual and quantitative system dynamics models have been developed, integrating hydrological, climatic, and socio-economic data.
This project will contribute to integrating local knowledge, promoting the co-production of knowledge and fostering more effective and sustainable governance practices. Proactive stakeholder participation will be vital to addressing the complexity of the NEXUS and achieving sustainable and resilient development.

Acknowledgements: This study has received funding from the European Union’s Horizon 2020 research and innovation programme under the GoNEXUS project (GA No 101003722).

How to cite: Monico-Gonzalez, V., Martinez-Domingo, D., and Gomez-Martin, E.: Towards sustainable water-energy-food-ecosystems governance: an integrating participatory approach and systems modelling for co-exploring the nexus, EGU General Assembly 2024, Vienna, Austria, 14–19 Apr 2024, EGU24-18064, https://doi.org/10.5194/egusphere-egu24-18064, 2024.

EGU24-18213 | Orals | ITS3.15/HS12.3 | Highlight

Inform to involve: women’s contribution to Water-Energy-Food-Ecosystems (WEFE) Nexus transition in Egypt 

Bianca Maria Rizzo, Tommaso Pacetti, Xenia Theodotou Schneider, Sendianah HamdyKhamis Shahin, Basma Hassank, and Enrica Caporali

Local perspectives provide invaluable insights into the intricate relationships between water, energy, and food systems, ensuring that interventions are aligned with community needs. Empowering local stakeholders fosters ownership, enhances resilience, and promotes equitable resource distribution. Community engagement facilitates the integration of traditional knowledge, optimizing the effectiveness of WEFE Nexus strategies. For this, a structured participatory approach based on the RRI Roadmap©™ is necessary to ensure the  interconnectedness of these vital systems, creating a foundation for holistic, locally adapted WEFE Nexus solutions that address the complex challenges at the intersection of water, energy, food, and ecosystems.

Since women and men often have distinct roles, responsibilities, and knowledge concerning resources use, distribution, and conservation, ignoring these gender dynamics may lead to the marginalization of women and the perpetuation of existing power imbalances, as well as a lack of essential information to support the transition towards a WEFE Nexus approach. Incorporating a gender lens enhances the accuracy and effectiveness of participatory processes, ensuring an effective and lasting WEFE Nexus implementation when these diverse needs and priorities of both genders are considered.

Within the activities of the NEXUS-NESS project, women's contribution to WEFE Nexus transition in Egypt has been investigated, organizing a set of workshops with the community of Wadi Nagamish watershed. The Bedouin community in Wadi Naghamish is characterized by its deep-rooted traditions and resilient way of life. Women play a pivotal role, actively contributing to both the household and community dynamics. Despite the arid surroundings, Bedouin women in Wadi Naghamish are skilled in resourceful practices, such as water conservation and traditional crafts. They are often the guardians of cultural heritage, passing down knowledge through generations. While facing challenges, Bedouin women maintain a strong sense of identity, embodying the community's values. Their roles extend beyond the domestic sphere, influencing decision-making processes and contributing significantly to the social fabric of Wadi Naghamish.

According to Bedouin cultural norms, women cannot share a room with men, who are not strictly related to them, and this prevents them from taking part in the first participatory workshop organized to involve stakeholders in the transition towards the WEFE Nexus.

Hence, for not losing womens knowledge sharing and involvement, the NEXUS-NESS workshops held in Wadi Naghamish were structured to enhance women's engagement. Female experts conducted a tailored capacity-building program in designated spaces, fostering a positive atmosphere for Bedouin women to learn WEFE Nexus concepts and devise solutions for prevailing water challenges.

The workshops’ results provide useful insights on the roles of women concerning resource management and consequently allowing to define a gender sensitive strategy for engaging stakeholders in the transition towards a WEFE Nexus approach.

How to cite: Rizzo, B. M., Pacetti, T., Theodotou Schneider, X., HamdyKhamis Shahin, S., Hassank, B., and Caporali, E.: Inform to involve: women’s contribution to Water-Energy-Food-Ecosystems (WEFE) Nexus transition in Egypt, EGU General Assembly 2024, Vienna, Austria, 14–19 Apr 2024, EGU24-18213, https://doi.org/10.5194/egusphere-egu24-18213, 2024.

EGU24-20260 | ECS | Orals | ITS3.15/HS12.3

Data-driven system identification of the WEFE nexus: Challenges and prospects 

Elise Jonsson, Claudia Teutschbein, Malgorzata Blicharska, Andreina Francisco, Andrjiana Todorovic, Janez Sušnik, and Thomas Grabs

The Water-Energy-Food-Ecosystem (WEFE) nexus presents many challenges with regards to modelling. While attempts at conceptual modelling of this nexus have been made, increasing data availability due to electrification, smart infrastructure, and digitization of these sectors encourages a data-driven approach to system identification and control. Data-driven methods have had wide success in disciplines dealing with similar challenges as the WEFE nexus, such as the multiplicity of scales, nonlinearity and chaos, high dimensionality, fuzzy and stochastic social dynamics, as well as rare- or extreme event exposure. Here we provide a brief summary of data-driven methods of system identification that may address these challenges by looking at cross-disciplinary applications and its relevance for the WEFE nexus.

How to cite: Jonsson, E., Teutschbein, C., Blicharska, M., Francisco, A., Todorovic, A., Sušnik, J., and Grabs, T.: Data-driven system identification of the WEFE nexus: Challenges and prospects, EGU General Assembly 2024, Vienna, Austria, 14–19 Apr 2024, EGU24-20260, https://doi.org/10.5194/egusphere-egu24-20260, 2024.

Given current world population, persistence of global diet, and considerable environmental damage related
thereto, food consumption is a major source of concern for environmental sustainability. In relation to these
issues, Greater Geneva agglomeration outlined several legitimate, albeit potentially contrasting set of objectives
for 2050 in its 2022 political commitment for a sustainable transition: preserving and regenerating local
biodiversity, reducing environmental pressures generated by society, while ensuring good health, equity and
inclusion of all its inhabitants, and contributing to the improvement of world population’s well-being. To
arbitrate between these conflicting pledges requires the use of an accounting system able to integrate them
simultaneously. For this purpose, MuSIASEM accounting approach (Multi-Scale Integrated Analysis of Societal
and Ecosystem Metabolism) is applied to the Greater Geneva region and Geneva Canton: it relates information
pertaining to (i) the diet, (ii) the techno-economic performance of the agricultural sector, (iii) environmental
pressures generated by agriculture, (iv) the level of dependence on imports. MuSIASEM allowed to characterize
the region’s food metabolism for a current Swiss diet and a more plant-based diet: with a current Swiss diet,
were Greater Geneva region to internalize all food consumption, it would require considerable increases in the
share of agricultural land and agricultural workers in society. Shifting from an animal to a more plant-based diet
would significantly reduce environmental and social pressures. In addition, viewing Greater Geneva region as
reference political boundary for assessing food security would render the former more environmentally feasible:
thereby making an extension of Geneva Canton’s biodiversity strategy 2030 to Greater Geneva – of protecting
30% of territory for ecological infrastructure – in turn more plausible. This study showed the potential of
MuSIASEM approach in characterizing a region’s food metabolism, yet it could be applied in other domains to
assess a society’s water, energy or human activity metabolism.

How to cite: Folz, A., Lehmann, A., and Giampietro, M.: A tool for governance informed deliberation in Greater Geneva region:impossibility of current circular economy food metabolism, EGU General Assembly 2024, Vienna, Austria, 14–19 Apr 2024, EGU24-21001, https://doi.org/10.5194/egusphere-egu24-21001, 2024.

EGU24-22126 | ECS | Posters virtual | ITS3.15/HS12.3

Integrated Water-Energy Nexus Analysis: Dynamic Simulation of a Combined Hydro-Thermal Power Plant  

maryam siamaki, mohamad Gheibi, Atiyeh Ardakanian, Stanislaw Waclawek, and Kourosh Behzadian

This study presents an integrated water-energy nexus analysis through the dynamic simulation of a combined hydro-thermal power plant, focusing on a case study within the water-scarce region of Iran. The investigation aims to assess the mutual interactions between water resources and energy production, providing valuable insights for sustainable water and energy management practices. The simulation model incorporates system dynamics to capture the complex feedback loops between water availability, energy demand, and the operation of the power plant. The power plant is modeled as a combined hydro-thermal system, where water availability influences both hydroelectric and thermal power generation. The system's response to water availability is further modulated by feedback loops that consider the dynamics of water and energy demand. In the context of the Iranian water plant case study, the simulation is executed over 100-time steps to analyze the dynamic behavior of the system. The water supply response to water availability is characterized by a multiplier, and the energy supply response is modulated by a similar multiplier, reflecting the inherent connection between water and energy in the power generation process. Additionally, the thermal efficiency of the power plant is considered in the simulation to account for the impact of water availability on thermal power generation. The results of the simulation are visually represented through a heat map, providing a comprehensive overview of the temporal evolution of water demand, water supply, and energy supply. The custom colormap enhances visualization, enabling a clear interpretation of the interdependencies within the water-energy nexus [1]. The numerical results derived from the simulation offer valuable insights into the sustainable operation of the combined hydro-thermal power plant. The analysis highlights the importance of considering water availability in energy production decisions, showcasing the impact on both hydroelectric and thermal power generation. Furthermore, the simulation provides quantitative assessments of water shortage and energy shortfall, aiding in the identification of critical time periods and informing strategies for resource allocation and infrastructure planning [2]. By focusing on the Iranian context, where water scarcity is a prevalent concern, this study contributes to the development of region-specific water and energy policies. The findings underscore the need for integrated water and energy management strategies to address the challenges posed by changing water availability patterns and growing energy demands [3]. The presented simulation framework can serve as a valuable tool for policymakers and researchers in optimizing the operation of similar water-energy systems in arid regions, fostering sustainable development in the face of increasing water and energy challenges.

Keywords: Water-Energy Nexus; Power Plants; Programming; Sustainability; Performance assessment

How to cite: siamaki, M., Gheibi, M., Ardakanian, A., Waclawek, S., and Behzadian, K.: Integrated Water-Energy Nexus Analysis: Dynamic Simulation of a Combined Hydro-Thermal Power Plant , EGU General Assembly 2024, Vienna, Austria, 14–19 Apr 2024, EGU24-22126, https://doi.org/10.5194/egusphere-egu24-22126, 2024.

One of the main challenges preventing the sustainable development of the agriculture sector is the lack of a system-thinking approach, which includes economic systems, resource management practices [water and energy], production, and climate change. In Lebanon, the main variables affecting on-farm practices are socio-economic factors and climate change, leading to decreased purchasing power, limiting their access to energy and, thus water for agricultural production. While non-governmental organizations introduced solar power to cut energy costs and enhance water accessibility, they did not account for aquifer depletion resulting from excessive pumping. Additionally, adverse climatic conditions are reducing groundwater recharge, and escalating water demands. Thus, it is crucial to view the agricultural sector as an interconnected system and develop strategic plans for agricultural development where climate, water, energy, and production are collaboratively managed. This paper intertwines the Environmental Nexus and the Sustainable Livelihood Approach (SLA) to study the interlinkages, synergies, and trade-offs between water, energy, food, climate, and livelihood security. To assess on-farm practices and identify farmers' needs, the study employed a bottom-up approach, utilizing surveys, satellite imagery analysis, and interviews. Subsequently, farmers proposed sustainable solutions, which were tested using hydro-climatic models. Analysis of satellite imagery shows a connection between land-use patterns, drought events, and economic shocks. While drought led to economic losses and a subsequent decrease in land cultivation in the following year, the 2021 national economic meltdown in Lebanon had a contrasting effect, leading to an expansion in land cultivation. People sought to secure their food basket or establish a secondary source of income, intensifying competition for natural resources such as water, and increasing market competitiveness. Consequently, there was a substantial decline in farmers’ net revenue by 500-999 USD per dunum, as revealed by survey findings. Many farmers, though receiving aid, remain vulnerable to climate issues, water scarcity, and economic shocks. The modeling exercise, which is based on solutions proposed by farmers and is tested under the SSP3 Climate Change Scenario, indicates transitioning to crops with low water requirements, and high nutritional and economic value—such as 'Triticum turgidum var. durum'—is the most effective approach to reduce vulnerability to climate change and its shocks. While water harvesting and hydropower are considered less effective solutions. Finally, this paper proposes an integration of the Participatory Approach with the Climate-Water-Energy-Food System thinking approach for Socio-economic development.

How to cite: Bou Said, R., Mohtar, R. H., and Moussa, R.: Building Socioeconomic Resilience in a Climate-Pressured Water-Energy-Food System in Underdeveloped Rural Agricultural Farms in Lebanon, EGU General Assembly 2024, Vienna, Austria, 14–19 Apr 2024, EGU24-22390, https://doi.org/10.5194/egusphere-egu24-22390, 2024.

Economic, societal and environmental security are interdependently related to the availability and fair access to natural resources, water, land, food and energy. All four elements (water, food, energy and ecosystems) are 1) highly dependent on each other, 2) crucial for human well-being, and 3) impacting social cohesion and source of geopolitical conflicts. In the Mediterranean region the water scarcity and land degradation do not match sound and sustainable agricultural practices and often the protection of ecosystems is in conflict with economic growth instead of being safeguarded for improving water sources. NEXUS-NESS interlinks consolidated Water-Energy-Food (WEF) Nexus data, knowledge and tools and a three-fold Ecosystem component value (i.e. Environment, Economy and Engagement) to produce a comprehensive WEFE Nexus Service (NNS). State of the art biophysical models, WATNEEDS and FREEWAT, are employed to provide quantitative metrics and geospatial distribution of WEFE nexus parameters and resource-risk scenarios with varying climate, land, crop, energy and socio-environmental variables. The NNS is an analytical geo-service supporting the transferring to Nexus stakeholders and operators of WEFE Nexus models, scenarios and indicators for understanding the benefits of Nexus best practices. The NEXUS-NESS project, funded by Horizon 2020 PRIMA programme, started in 2021 and is ending in 2024, is achieving the following three main objectives:
1) Co-Produce WEFE Nexus management plans for fair and sustainable allocation of resources by applying the NNS into real case conditions through the four Multi-Actor diverse NEXUS Ecosystem Labs (NELs);
2) Operationalize the adoption of the WEFE Nexus by co-defining short to long-term resource management plans and hands-on guidance through application, validation and demonstration actions in the four NELs
3) Enable mindset change for the effective adoption of WEFE Nexus through the implementation of Innovation Ecosystems of private sector, academic, public authorities and citizens in the 4 NELs through the Responsible Research and Innovation (RRI) Roadmap and the six RRI dimensions (public engagement, open science, science education, gender issues, ethics and institutional change through governance).
To achieve these three main objectives, the NEXUS-NESS consortium has specified 4 NELs where multi-actors (stakeholders, private sector, public authorities, academia and citizens) will be engaged in a Living Lab setting by applying the RRI Roadmap. The multi-actors will be identified, motivated and engaged to frame a new WEFE-Nexus vision for their common socio-economic-ecosystem situation, co-design and co-construct WEFE-Nexus management plans and solutions, apply these, measure them, adjust them and intensify them. The NEXUS-NESS 4 NELS are:
1) Coastal Tuscany, Italy: focusing on minimization of groundwater extraction and salinization through non-conventional irrigation via consortia and natural ponds as bioreactors; 2)Rio Daja, Spain: improve agroecosystem and rural life of viticulture and agriculture with improved water-energy use during irrigation. 3) Matrouh Coastal area, Egypt: reduce saline brackish groundwater, increase cultivation through responsible irrigation and apply the WEFE Nexus approach for increasing crop yields.
4) Oued Jir Watershed of Gabes, Tunisia: intensify sustainable agriculture by balancing efficient use of natural resources through novel irrigation and land management by educating the local population of the highly arid area.

How to cite: Nardi, F. and the NEXUS-NESS Consortium: PRIMA NEXUS-NESS: Operationalizing transdisciplinary, stakeholder engagement and biophysical models for co-demonstrating the multiple social, economic and environmental benefits of WEFE Nexus approaches in four Euromed Nexus Ecosystem Labs, EGU General Assembly 2024, Vienna, Austria, 14–19 Apr 2024, EGU24-22567, https://doi.org/10.5194/egusphere-egu24-22567, 2024.

EGU24-768 | ECS | Posters on site | ITS3.18/HS12.4

Comparison of EM38 and Syscal Pro measurements for soil mapping in an agroforestry system 

Marco Carrara, Lorenzo Bonzi, Fatma Hamouda, Mino Sportelli, Angela Puig Sirera, Daniele Antichi, Lorenzo Gabriele Tramacere, Silvia Pampana, and Giovanni Rallo

Abstract: This study aimed to assess and compare the performance of EM38 (Geonics Limited) and Syscal-Pro (Iris instruments) EMI tools in soil spatial heterogeneity mapping. Mainly, the two tools were evaluated for their ability to explain the spatial variability of the soil resistivity, which strongly correlates with the soil’s physical status properties. Moreover, the effect of two surface soil roughness caused by two different tillage modalities has been studied.

The experimental plot (30 m width x 100 m length) consisted of an agroforestry system located in San Piero a Grado (Pisa, Italy, (, 43°41’07” N, 10°20’32” E).  Two 100-meters length deep open drains were located on the edges.  The soil texture is loam, with clay content values from 7.64% to 15.14% and sand content ranging from 22.36% to 49.37%. The intercropping system consisted of wheat (Triticum aestivum L) and pea (Pisum Sativum L) in the inner part of the field, and two rows of poplar (Populus x euramericana Dode Guiner) on the edges experimental plot.

Data were acquired before seed-bed preparation by pulling the two tools over the soil. For the Syscal-pro, 13 cylindrical stainless-steel electrodes were pulled by a tractor, allowing soil resistivity data acquisition according to the reciprocal Wenner-Schlumberger array (Telford, 1976). A total of five transects with 5 m spacing were spanned to the inner field zone, whereas four additional transects allowed to detail the resistivity gradients closed the two deep open drains.

Regarding the EM38 tool, a preliminary laboratory activity allowed the development of a specific data acquisition (DAQ) system for continuous monitoring of the resistivity data recording and spatializing. This DAQ system is based on a CR1000 Data logger (Campbell Scientific, United States), which allows collecting the speed and position of the EM-38 device by carrying it on a specifically designed sled system.

Two Garmin’s GPS (model 79S/SC for Syscal Pro and model GPS16X-HVS for the EM38) enabled georeferencing the collected data.

Preliminary results have shown a range of electrical conductivity values between 30 mS/m and 45 mS/m, spatially distributed according to the pattern obtained by Syscal-Pro. Further investigation is required to better understand the relationship between EM38 and Syscal-Pro measurements, after which the vertical domain explored has been standardised between the two methods.

Keywords: Agroforestry system, EM38, Syscal, soil bulk resistivity, soil bulk conductivity, spatial variability.

How to cite: Carrara, M., Bonzi, L., Hamouda, F., Sportelli, M., Puig Sirera, A., Antichi, D., Tramacere, L. G., Pampana, S., and Rallo, G.: Comparison of EM38 and Syscal Pro measurements for soil mapping in an agroforestry system, EGU General Assembly 2024, Vienna, Austria, 14–19 Apr 2024, EGU24-768, https://doi.org/10.5194/egusphere-egu24-768, 2024.

Accurate estimations of actual crop evapotranspiration are essential to evaluate crop water requirements, to improve water use efficiency in agriculture, and to optimize the use of available freshwater resources. To this aim, several models were developed to allow quantifying crop water requirements based on the knowledge of actual crop evapotranspiration rates, ETa.

The objective of this research was to estimate ETa using a simplified distributed model combining ground and remotely sensed data.

The experiment was carried out in a Mediterranean commercial citrus orchard (C. reticulata cv. Tardivo di Ciaculli) located in the Northwest of Sicily, Italy, during the whole 2019. The experimental layout consisted of: i) a WatchDog 2000 standard weather station (measuring the main climate variables and the precipitation depths, P); ii) a database of irrigation volumes, I, scheduled by the farmer; iii) an Eddy Covariance tower equipped with an open patch gas-analyzer, a three-dimension sonic anemometer, a four-component net radiometer, and a soil heat flux plate iv) a dataset of 75 Sentinel-2 multispectral images, acquired in clear sky condition.

In particular, the daily crop reference evapotranspiration, ETo, was calculated according to the FAO-56 Penman-Montheith equation using the climate variables; the crop coefficient, Kc, the Fractional Vegetation Cover, FVC, and, thus, the potential evapotranspiration, ETp, were computed via the processing of reflectance values in the RED, NIR and SWIR spectral bands. The Available Water, AW, the short-term water stress factor, Cws, and the ETa, were computed by analyzing cumulated ETp and water-supplying values using moving temporal windows characterized by different sizes (from 5 to 400 days).

The validation of the model outputs was carried out by taking into account the ETa of the pixels within the flux tower footprints estimated at each satellite acquisition day (i.e. by selecting the pixels on the basis of the footprint shape and extension). The performance of the model was evaluated for each temporal window size using the following metrics: the Root Mean Square Error, RMSE, the Mean Absolute Error, MAE, the angular coefficient of the regression line forced to the origin, b, and the determination coefficient, R2.

Results suggest that the best temporal window size for this crop is around 85 days allowing to achieve an RMSE of 0.51 mm d-1, a MAE of 0.38 mm d-1, a b value of 0.94 and an R2 of 0.96. The comparison with the model outputs over the whole field (all the pixels within the crop field) revealed that a strong decrease in all the metrics occurs if the validation of the remote sensing products is not properly carried out.

How to cite: De Caro, D., Ippolito, M., Capodici, F., and Ciraolo, G.: Testing the performance of a simplified distributed model to assess actual evapotranspiration in a Mediterranean orchard using ground and remotely sensed data, EGU General Assembly 2024, Vienna, Austria, 14–19 Apr 2024, EGU24-895, https://doi.org/10.5194/egusphere-egu24-895, 2024.

EGU24-1153 | ECS | Posters on site | ITS3.18/HS12.4

Automation of the Atmometer (ETgage) recording by pressure transducers sensors 

Lorenzo Bonzi, Àngela Puig Sirera, Emanuele Dichio, Fatma Hamouda, Andrea Sbrana, Damiano Remorini, and Giovanni Rallo

Abstract. In precision irrigation, it has become imperative to accurately evaluate the crop irrigation needs and return the right amount of water. Concerning to the application of thermodynamic-based models, the crop transpiration  can be determined with the original Penman-Monteith equation (Monteith, 1965) through the so-called "big leaf" approach. According to what was suggested by Jarvis and McNaughton (1986), for its evaluation through sensors, one valid option is the atmometer. This instrument is used to measure the quantity of water evapotranspired in a reference system (ET0), and the actual transpiration (Tc act), is calculated according to the weather-based approach (Allen et al., 1998). The ET0 in the atmometer is evaluated from the variation in the water level of the distilled water source placed inside the instrument tank, hydraulically connected to a porous ceramic capsule  covered with a green fabric (green canvas) which simulates the radiative and resistive behaviour of the reference culture. The most advanced model at present is the model-E with an electronic component for the automatic measurement of ET0 measures. In this model, the evaporated water is based on the emptying of a glass ampoule, with a capacity of 0.25 mm of water, filled automatically through a solenoid valve. Each emptying corresponds to 0.25 mm of evaporated and generates an electrical signal (count) detected by the data logger.

In our study, the atmometer (ETgage) was modified in the device for measuring the relative water level. The modification of the atmometer consists in the insertion of an RS-828-5708 piezoresistive pressure transducer. The pressure transducer returns an analog output in the 4-20 domain (mA) as a function of the hydrostatic head H (cm). The sensor was calibrated on the test bench of the DiSAAA-a AgrHySMo laboratory with paired measurements of hydrostatic head H(cm) and electrical signal read by the datalogger (mV). Therefore, the linear calibration equation between the two measurements was obtained with a slope of 0.3029 m/mV and an intercept of 10.804 m. Finally, the data series were improved thanks to a smoothing process, performed using a 3rd-4th order polynomial function (Savitzky and Golay, 1964) on data clusters equal to 17 points. The improved water level measurement system allows flow measurement at the sub-hourly scale. In open filed, the temporal dynamics of the atmometer were compared with the reference evapotranspiration calculated with the Penman-Monteith. The atmometer measurement showed an improvement compared to the respective estimated with the mathematical analogy, reducing the RMSE from 1.65 to 0.30 mm/day. The first results have demonstrated an accurate performance of the modified atmometer in estimating hourly reference evapotranspiration and its ability for precise irrigation planning based on hourly water consumption.

Keywords. Atmometer, field-instrumentation, sensor and model design, crop water status, precision irrigation.

How to cite: Bonzi, L., Sirera, À. P., Dichio, E., Hamouda, F., Sbrana, A., Remorini, D., and Rallo, G.: Automation of the Atmometer (ETgage) recording by pressure transducers sensors, EGU General Assembly 2024, Vienna, Austria, 14–19 Apr 2024, EGU24-1153, https://doi.org/10.5194/egusphere-egu24-1153, 2024.

Data-driven irrigation planning can optimize crop yield and reduce adverse impacts on surface and ground water quality. We evaluated an irrigation scheduling strategy based on soil matric potentials recorded by wireless Watermark (WM) sensors installed in sandy loam and clay loam soils and soil-water characteristic curve data. Five wireless WM nodes (IRROmesh) were installed at each location, where each node consisted of three WM sensors that were installed at 15, 30, and 60 cm depths in the crop rows. Soil moisture contents, at field capacity and permanent wilting points, were determined from soil-water characteristic curves and were approximately 23% and 11% for a sandy loam, and 35% and 17% for a clay loam, respectively. The field capacity level which occurs shortly after an irrigation event was considered the upper point of soil moisture content, and the lower point was the maximum soil water depletion level at 50% of plant available water capacity in the root zone. The lower thresholds of soil moisture content to trigger an irrigation event were 17% and 26% in the sandy loam and clay loam soils, respectively. The corresponding soil water potential readings from the WM sensors to initiate irrigation events were approximately 60 kPa and 105 kPa for sandy loam, and clay loam soils, respectively. Watermark sensors can be successfully used for irrigation scheduling by simply setting two levels of moisture content using soil-water characteristic curve data. Further, the wireless system can help farmers and irrigators monitor real-time moisture content in the soil root zone of their crops and determine irrigation scheduling remotely without time consuming, manual data logging and frequent visits to the field.

How to cite: Jabro, J. and Stevens, W.: Irrigation Scheduling Based on Wireless Sensors Output and Soil-Water Characteristic Curve in Two Soils , EGU General Assembly 2024, Vienna, Austria, 14–19 Apr 2024, EGU24-1268, https://doi.org/10.5194/egusphere-egu24-1268, 2024.

EGU24-1840 | ECS | Orals | ITS3.18/HS12.4 | Highlight

Irrigatmo: no-moving parts system for feed-back and feed-forward irrigation scheduling  

Emanuele Dichio, Lorenzo Bonzi, Giovanni Rallo, Angela Puig-Sirera, Damiano Remorini, Roberto Di Biase, Alba Nicoletta Mininni, and Rossano Massai
 

Abstract 

The weather-based approach quantifies the crop water requirements (CWR) using a simplified agrohydrological model coupled with meteorological sensors.  The FAO56 model (Allen et al., 1998) is one of the most used bucket models for CWR. In this model, the daily ET0 is usually estimated by the FAO-Penman-Monteith (PM), which needs as inputs standard atmosphere forcings acquired from weather stations, that often are equipped with ordinary mechatronics sensors that require regular maintenance. An atmometer (ETgage) is an accurate sensor with no moving parts that continuously measures the ET0 based on a physical analogy of the crop reference.  

This study aims to design and validate an expert system, named Irrigatmo, to manage irrigation based on the combined application of the feedforward- (FFc) and feedback- (FBc) control irrigation scheduling protocols. The FFc protocol comprises a Kc-based mass balance model with a modified atmometer and FDR sensors for sub-hourly ET0 and soil water content (SWC) measurements. At the same time, the FBc protocol uses the SWC to quantify the critical condition and the crop stress coefficient to adjust the Kcb value used in the bucket model. The system was implemented in proprietary logic (CR300, Campbell Scientific Inc.) and open-source logic (Arduino Mega 2560, Arduino). The core of the system implements a weather-based water balance model, trained by a modified atmometer and soil moisture sensor for sub-hourly scale ET0 and SWC, as well as an infrared thermometer and a contact thermocouple for quantifying the crop water stress index (CWSI). The ETgage was modified by integrating a pressure transducer sensor, calibrated to measure the water level inside the atmometer tank continuously.  

The results showed that Irrigatmo accurately and rapidly detected the changes in atmospheric and soil water conditions. The system can directly calculate the evapotranspiration reduction factor (Ks), estimating the CWSI based on canopy temperature measurements. This could overcome the uncertainty in the models associated with the water stress function based solely on the soil moisture. The system was built and calibrated within the AgrHySMo laboratory of DiSAAA-a and validated on a commercial kiwifruit orchard of Actinidia chinensis var. chinensis 'Zesy002'. The field testing made it possible to validate the system's ability to model the water stress functions of the crop and the sensitivity to identify the critical water status conditions that mark the transition to a limiting condition. Irrigatmo could manage irrigation autonomously, activating or turning off the solenoid valves, and returning to our field the amount of water lost during the evapotranspiration processes. Future perspectives consider the implementation of the proposed system in a wireless sensor network (WSN) and at the interfacing of the WSN nodes with aerial platforms where the edge-computing systems specialized also in the control of IoT-irrigation actuators will be located.  

How to cite: Dichio, E., Bonzi, L., Rallo, G., Puig-Sirera, A., Remorini, D., Di Biase, R., Mininni, A. N., and Massai, R.: Irrigatmo: no-moving parts system for feed-back and feed-forward irrigation scheduling , EGU General Assembly 2024, Vienna, Austria, 14–19 Apr 2024, EGU24-1840, https://doi.org/10.5194/egusphere-egu24-1840, 2024.

Groundwater is a reliable and important source for irrigated agriculture but its use has consequences. In wetter regions, overuse of groundwater can threaten the health of streams that depend on discharge from the groundwater system. In drier regions or when groundwater withdrawals exceed the available groundwater recharge for a long time, groundwater resources will be depleted, and groundwater levels drop. The result is that farmers must extract water from increasingly deeper groundwater wells and incur greater costs for well construction and for the energy required to lift the water to the surface. Ultimately, a farmer can reach the economic limit for groundwater use when the cost of pumping water is larger than the revenue that can be generated with the crop. Farmers should consider this economic limit and adapt their cropping and production methods to safeguard economically sustainable production in the future.

In order to evaluate possible adaptation strategies to avoid or postpone reaching the economic limit we developed a cost-benefit model at the local -farmer’s- level called HELGA (Hydro-Economic Limits as a Global Analysis) balancing the investment costs to deepen the well in the short term against the net present value of added profits from groundwater extraction in the long term. In HELGA, crop water requirements are calculated and satisfied with the available soil water and with irrigation from groundwater to meet the with consideration of the application losses. We include aquifer recharge and other sources of water use (surface water supply to dynamically account for the groundwater requirements of crops. Hence, we place groundwater irrigation within the context of other water resources and consider the groundwater exploitation costs in conjunction with the other costs to produce a crop. To include the impact of groundwater pumping on groundwater depth we couple HELGA to the water resource model PCR-GLOBWB, thus introducing farmer-scale hydro-economic analysis in a global-scale hydrological model with a resolution of 5 arc minutes (~10 x 10 km globally). In this manner, groundwater dynamics and surface hydrology are linked and the competition for groundwater with other sectors included. This coupling allows us to understand globally the implications of groundwater (over) use in the long term and how this defines the solution space from the aggregate farmer’s perspective.

Our results show that farmers eventually reach the economic limit. Energy cost of groundwater pumping is one of the important drivers limiting groundwater use. Additionally, the increasing costs of the water infrastructure (i.e. deeper wells) is an important factor that explains the economic limit. Also, our analysis shows that variations in the irrigation water demand and the groundwater recharge as a result of climate variability strongly influences the profitability of groundwater-fed irrigated agriculture To counteract this, adaptation strategies such as changing the crop mix and increasing irrigation efficiency are effective in increasing the time to reach the economic limit and to extend the lifespan of aquifers. Farmers’ agency towards the management of a depleting resource make a difference in keeping this resource for future generations.

How to cite: Melo Leon, S. F., Van Beek, R., Reinhard, S., and Bierkens, M.: How to avoid or postpone reaching the economic limit of groundwater-fed irrigation? Aggregated analysis for adaptation strategies from the farmer’s perspective., EGU General Assembly 2024, Vienna, Austria, 14–19 Apr 2024, EGU24-2871, https://doi.org/10.5194/egusphere-egu24-2871, 2024.

EGU24-2920 | ECS | Orals | ITS3.18/HS12.4

Assessing crop growth model accuracy under droughts and heatwaves 

Sneha Chevuru, L.P.H. (Rens) van Beek, Michelle T.H. van Vliet, Gambhir Lamsal, Landon Marston, and Marc F.P. Bierkens

Recent droughts and heatwaves have shown major impacts on the agricultural sector by inhibiting crop growth resulting in reduced crop yield. With an expected increase in the frequency and severity of droughts and heat waves due to climate change, accurate projections of crop yields under these hydroclimatic extremes are required. However, there is only limited knowledge on the accuracy of crop growth models under extreme events such as droughts and heatwaves. Understanding the accuracy of crop models under hydroclimatic extremes is a necessary first step to evaluate the significance of projections of crop yields under climate change.

To this end, our study addresses this gap by quantitatively evaluating three crop growth models— WOFOST, PCRGLOBWB2-WOFOST, and AquaCrop— in terms of their ability to simulate crop yield and hydrological fluxes under drought and heatwave conditions. The evaluation focuses on conditions of hydrological stress induced by droughts and heatwaves in the contiguous United States (CONUS) during the period 1981 to 2019. Our methodological framework utilises harmonised input data in terms of consistent climate forcing, cropping calendars and crop areas, to ensure a standardised comparison. Both rainfed and irrigated crops of three crop growth models are compared for the most abundant crop types (i.e. maize, wheat and soybean). 

The multiple output variables of these models are compared with reported data and satellite observations, most notably crop yield (reported on a county basis), irrigation water withdrawal (reported for a number of states) and leaf area index and evapotranspiration (from satellite observations). Additionally, we compare crop water requirements between the models. These methodological steps aim to discern structural differences among the models and identify key factors influencing performance variations, ensuring a thorough and rigorous evaluation. The findings and insights from this evaluation will advance our understanding of the intricate relationship between hydrological stress, crop growth, and sustainable agricultural practices under droughts and heatwaves.

How to cite: Chevuru, S., van Beek, L. P. H. (., van Vliet, M. T. H., Lamsal, G., Marston, L., and Bierkens, M. F. P.: Assessing crop growth model accuracy under droughts and heatwaves, EGU General Assembly 2024, Vienna, Austria, 14–19 Apr 2024, EGU24-2920, https://doi.org/10.5194/egusphere-egu24-2920, 2024.

In the domain of hydrological modeling, accurately determining initial conditions such as soil moisture content is crucial for enhancing simulation efficiency and applying these models effectively in water resource management, flood prediction, and drought forecasting. Traditional methods often rely on a data-intensive warm-up phase to establish these conditions, which diverts valuable data from calibration and validation. Addressing this challenge, our study introduces an innovative methodology that utilizes an alternative global soil moisture dataset to optimize these initial conditions without the conventional warm-up phase, thereby aiming to improve both the accuracy and efficiency of hydrological simulations. We focused on the Block-wise use of the TOPMODEL (BTOP) and ERA5-Land reanalysis data, specifically analyzing three soil moisture variables within the Fuji and Shinano River Basin, Japan. Through a comprehensive correlation analysis, we examined the dynamics between these variables and employed a range of curve-fitting functions alongside advanced techniques, particularly Long Short-Term Memory (LSTM) networks, to establish a robust relationship between BTOP and ERA5-Land soil moisture variables. The LSTM, known for their effectiveness in handling complex time series data, were instrumental in capturing the intricate spatial and temporal correlations between the variables. To validate the efficacy of our proposed methodology, we conducted four hydrological simulation scenarios, meticulously designed to assess the benefits of incorporating ERA5-Land soil moisture data into the model's initial conditions. The results were compelling: simulations using the enhanced initial conditions significantly outperformed those without the warm-up phase and closely approximated the 'optimal' scenario typically reliant on extensive warm-up data. This study not only underscores the potential of using reanalysis soil moisture data to refine initial conditions, thereby revolutionizing water resource management and forecasting practices, but also presents a scalable solution that can be adapted to various hydrological models and scenarios. Consequently, our research contributes significantly to the ongoing discourse on improving environmental modeling and management practices, advocating for more precise, resource-efficient, and adaptable methodologies in hydrological modeling.

How to cite: Zhou, L. and Liu, L.: Enhancing Hydrological Simulation Efficiency by Improving Initial Soil Moisture Conditions through Reanalysis Data, EGU General Assembly 2024, Vienna, Austria, 14–19 Apr 2024, EGU24-5712, https://doi.org/10.5194/egusphere-egu24-5712, 2024.

EGU24-5764 | ECS | Orals | ITS3.18/HS12.4

Harnessing Soil Moisture Data for Enhanced Eco-Hydrological Modeling Precision in Snow-Dominated Catchment in Finland 

Anandharuban Panchanathan, Kedar Ghag, Amir Hossein Ahrari, Björn Klöve, and Mourad Oussalah

Eco-hydrological modeling in water resources management has a pivotal role in the assessment of physical processes at various spatial-temporal scales. However, modeling the hydrological processes intrinsically contains uncertainties. Such uncertainties need to be addressed to develop a reliable hydrological model. In this study, in-situ and remotely sensed soil moisture data are used to enhance the precision of hydrological modeling using the Soil and Water Assessment Tool (SWAT). The objectives of this study are, (i) to assess the uncertainty and their propagation in hydrological modeling using the conventional and multi-source data set, and (ii) to simulate the hydrologic parameters using soil moisture as an indicator to evaluate uncertainties in hydrological forecasting. This study is carried out in the Temmesjoki basin of northern Finland with a basin area of 1190 km2. This region’s land cover is dominated by forest (61%), agricultural lands (18%), and shrubs (13%). The average annual rainfall and annual average temperature in this region are 406.21 mm, and 2.60°C respectively. The mean daily discharge ranges from 0.17 to 34.15 m3/s. The in-situ soil moisture data and Soil Water Index from the Copernicus Global Land Service are used to test the hypotheses. The Sequential Fitting Algorithm (SUFI-2) in R-SWAT was used for sensitivity and uncertainty analysis and calibration of the streamflow and ET. Two conceptual models are built to compare conventional data sources and multi-source data sets for the assessment of uncertainties in the simulation of the hydrological process. Preliminary analysis of hydrologic parameters of the basin reveals higher and non-uniform distribution of rainfall, ET, and discharge during summer months. Furthermore, the application of soil moisture data for the calibration of the SWAT model reveals higher fitness score, and, at the same time, the in-situ soil moisture data are found to reflect more accurately the soil moisture conditions in SWAT model, which results in the reduction of uncertainties. Consequently, the model conceptualized with the multi-source data sets provides a better water budget for the catchment. 

How to cite: Panchanathan, A., Ghag, K., Ahrari, A. H., Klöve, B., and Oussalah, M.: Harnessing Soil Moisture Data for Enhanced Eco-Hydrological Modeling Precision in Snow-Dominated Catchment in Finland, EGU General Assembly 2024, Vienna, Austria, 14–19 Apr 2024, EGU24-5764, https://doi.org/10.5194/egusphere-egu24-5764, 2024.

EGU24-6311 | Posters on site | ITS3.18/HS12.4

Hydrological indicators in an irrigated catchment with different crops in Spain: how research can contribute to fulfilling Sustainable Development Goals (SDG) through the basic indices for FabLabs. 

Blanca Cuadrado-Alarcon, Encarnación V. Taguas, Ignacio Domenech, Luciano Mateos, and Helena Gomez-Macpherson

The core of the 2030 Agenda for Sustainable Development, presents the 17 Sustainable Development Goals (SDGs), which constitute of a vital call for action by all world countries. “Clean water and sanitation”, “Industry, innovation and infrastructure”, “Sustainable cities and communities”, “Responsible consumption and production” and “Climate action”, among others, result a challenging field where scientists, farmers and other stakeholders should cowork to create successful tools and management protocols. FabLab approaches pursue to link scientific and technological elements and participatory actions of farmers, administrative institutions, companies and intermediaries for promoting open innovation environments to make technology-enabled products and practices adapted to local needs.

In this study, different types of hydrological signatures evaluated in a catchment of 303 ha with different type of crops, owner profiles and irrigation patterns, are presented as a base to provide the thresholds for alerts and emergency systems related with floods, herbicide peaks and/or sediment loads. Data series of the values of rainfall, runoff, herbicide and sediments collected in the gauge station of the catchment outlet were checked to quantify the impact of rainfall events of different return periods on the catchment responses. The knowledge of these features and procedures is essential to create innovations along the water cycle and improve the alarm protocols and irrigation management in commercial farms.

How to cite: Cuadrado-Alarcon, B., Taguas, E. V., Domenech, I., Mateos, L., and Gomez-Macpherson, H.: Hydrological indicators in an irrigated catchment with different crops in Spain: how research can contribute to fulfilling Sustainable Development Goals (SDG) through the basic indices for FabLabs., EGU General Assembly 2024, Vienna, Austria, 14–19 Apr 2024, EGU24-6311, https://doi.org/10.5194/egusphere-egu24-6311, 2024.

Root zone soil moisture (RZSM) serves as a crucial metric for assessing water stored in the soil. Modeling approaches are commonly employed in estimating RZSM. However, modelled RZSM often deviate from true RZSM values due to errors from model input data and parameters. Machine learning methods and data fusion techniques can enhance simulation accuracy. In this study, we conducted a comparative analysis of three methods for RZSM data fusion: random forest (RF), extended triple collocation (ETC), and Bayes Three Cornered Hat (BTCH).

Soil moisture observation data from 2018 to 2022 were collected at 2121 sites across China from the China Meteorological Administration (Fig.1). Daily average data were calculated by arithmetically averaging hourly data and used in the analysis. Six RZSM datasets were utilized, including SMAP Level 4, GLDAS-NOAH2.1, GLDAS-Catchment2.2, ERA5, MERRA2, and CRSR. All these data were resampled to 0.25° to maintain the same spatial resolution and were arithmetically averaged as daily averages. Additionally, some parameters related to soil, climate, and vegetation were used to build a machine learning model, specifically a random forest model. 

Fig. 1 Distribution of soil moisture sites and daily soil moisture (m3/m3) at depths ranging from 0–50 cm across China during the period from 2018 to 2019

To investigate the impact of different inputs on the performance of the RF method, three groups of inputs were employed. The specifics of the inputs used for the three methods are outlined in Table 1. The evaluation of the RF method results was carried out using a five-fold cross-validation approach.

Model Inputs
RFmodel1 NOAH, SMAP, ERA5, MERRA2, CFSR, CLSM, LAI, Soil properties, Meteorological data
RFmodel2 NOAH, LAI, Soil properties, Meteorological data
RFmodel3 NOAH, SMAP, ERA5, MERRA2, CFSR, CLSM
BTCH NOAH, SMAP, ERA5, MERRA2, CFSR, CLSM
ETC NOAH, MERRA2, CLSM


The boxplots show RFmodel1 performs best, emphasizing the need for comprehensive information in machine learning models. RFmodel2, superior to RFmodel3, highlights the significance of LAI, soil properties, and meteorological data in RZSM estimation. ETC and BTCH outperform individual RZSM datasets, especially in the absence of true data. The superior performance of ETC over BTCH is attributed to ETC's inputs, namely NOAH, MERRA2, and CLSM, which exhibit better accuracy compared to SMAP, ERA5, and CFSR, the inputs used by BTCH.

Fig.2 Boxplots of the Pearson coefficient (R), Root Mean Square Error (RMSE), and bias between in situ root zone soil moisture (RZSM) and its estimates from the three random forest models, Bayes Three Cornered Hat (BTCH), and Extended Triple Collocation (ETC) methods

In summary, the random forest method outperforms BTCH and ETC in the fusion of root zone soil moisture (RZSM) data, highlighting the importance of including leaf area index (LAI), soil properties, and meteorological data in the construction of the random forest model. Both BTCH and ETC demonstrate utility in enhancing RZSM estimates, making them valuable options when true data is unavailable.

How to cite: Tian, J. and Zhang, Y.: Comparison of Root Zone Soil Moisture Data Fusion Using Machine Learning, Triple Collocation, and Three-Cornered Hat Methods, EGU General Assembly 2024, Vienna, Austria, 14–19 Apr 2024, EGU24-7223, https://doi.org/10.5194/egusphere-egu24-7223, 2024.

EGU24-9299 | ECS | Orals | ITS3.18/HS12.4 | Highlight

Combining Remote Sensing and Low-Cost Sensors for LULC and Irrigation Characterization in the South of France  

Christina Anna Orieschnig and Paul Vandôme

In the face of climate change, Mediterranean regions, such as the South of France, are increasingly struggling with drought, water scarcity, and low groundwater levels. For agricultural regions relying on irrigation systems to guarantee summertime crop productivity, this is a central issue. Consequently, optimizing agricultural water uses and understanding the impact of irrigation systems on local and regional hydrological processes is indispensable. At larger scales, another challenge is to identify crop types as well as cropping and irrigation patterns for irrigation water management, reservoir operation, and real-time resource allocation. In this context, remote sensing provides a promising approach.  

This study focuses on combining land use - land cover (LULC) analyses based on Sentinel-1 and -2 data and in-situ measurements realized using innovative low-cost sensors, to characterize irrigation water use in two Southern French case study areas. The first of these, the Crau area in Provence, is specialized in using gravity irrigation to make the production of high-quality hay possible even during the arid summer months. The second area is a viticultural one, centred around the Canal de Gignac approximately 100 km further West, in which the majority of vines are sustained using drip irrigation, provided consistent water access is possible. In both cases, the study aimed first to identify irrigated plots, and then to further characterize the irrigation practices with regard to agricultural water use efficiency. 

The LULC analysis was carried out in Google Earth Engine, using a Gradient Tree Boosting (GTB) algorithm on combined Sentinel-1 and -2 imagery from which several spectral indices as well as Haralick texture features were calculated. The detection of irrigated grassland plots further relied on a temporal characterization of phenological stages. Subsequently, a comparative implementation of different irrigation monitoring approaches was carried out, using soil moisture estimates derived from Sentinel-1 and different optical spectral indices. Data from low-cost sensors and local water user associations was used for calibration and validation. 

Preliminary results indicate that combining these diverse approaches make an operational detection and monitoring of irrigation practices possible. For the detection of irrigated vineyard and grassland plots during the 2023 growing season, overall accuracies of 92% and 95% respectively were achieved. The comparison of different irrigation monitoring approaches showed that the Normalized Difference Moisture Index (NDMI, p=0.002), the Shortwave Infrared Water Stress Index (SIWSI, p=0.001) and the Specific Leaf Area Vegetation Index (SLAVI, p=0.001) showed the highest potential for accurate irrigation detection.

How to cite: Orieschnig, C. A. and Vandôme, P.: Combining Remote Sensing and Low-Cost Sensors for LULC and Irrigation Characterization in the South of France , EGU General Assembly 2024, Vienna, Austria, 14–19 Apr 2024, EGU24-9299, https://doi.org/10.5194/egusphere-egu24-9299, 2024.

EGU24-10617 | ECS | Orals | ITS3.18/HS12.4

Electrical Resistivity Tomography (ERT) to monitor the efficiency of different irrigation systems in horticulture field 

Agnese Innocenti, Veronica Pazzi, Marco Napoli, Rossano Ciampalini, Simone Orlandini, and Riccardo Fanti

Water management in agricultural systems is essential for optimal crop yields without incurring excessive water costs and wastage. The choice of irrigation method is crucial for better water management and distribution. The drip system appears to be among the best methods in the field of precision agriculture. In addition to the irrigation system, mulching with ridge plastic film to drain excess water is widely used to increase crop yields in terms of plant water availability.

In this study, the time-lapse Electrical Resistivity Tomography (ERT), a not-invasive geophysical technique, is proposed as a simple and reliable method to evaluate the effectiveness of the irrigation systems and to monitor the changes in water content over time and over a volume of soil. ERTs data were compared to moisture one retrieved from sensors that record continuously over time, but punctually. The ERT investigations were conducted in melon-growing lands in southern Tuscany (Italy).

The aim of the work was to evaluate, by means of volumetric measures of the soil conductivity, the effectiveness of three different drip systems and of the mulch ridge: a two-wings drip system and a three-wings drip line with the same flow rate and a three-wings drip lines with a higher flow, in two different seasonal periods (spring and summer). In both the monitored fields the ridge was created in a half portion of the field itself, while in the other part the land was left plat.

The data collected showed that the 2-wing system was particularly ineffective, and that the distribution of irrigation water favoured some areas more than others. While they led to satisfactory results for the 3-wing system and same water flow than two wings and the 3-wing system and highest water flow. The first system has shown that the same quantity of water as the classic irrigations system (two wings) distributed over three wings instead of two leads to a greater concentration of water in the root zone over time, slowly draining downwards. On the contrary, the second system distributes the water uniformly like the first system, but the quantity introduced was excessive, leading the soil to always be positioned above the field capacity and draining a lot of water downwards. The excessive accumulation of water below the root zone represents a waste of water, as this cannot be used by the root system. The tests, in addition to considering which system was optimal, also evaluated the effectiveness of the mulch ridge, leading to the deduction that during the spring season a ridge of height equal to or greater than 20 cm is to be considered better than a ridge of less than 20 cm or absent, as it allows excess water, represented by rainfall, to be drained. However, during the summer period, when rainfall is less if not absent, the presence of a much lower ridge (around 10 cm in height) is much more effective as it allows the irrigation water to be retained at the root system avoiding excessive drainage.

How to cite: Innocenti, A., Pazzi, V., Napoli, M., Ciampalini, R., Orlandini, S., and Fanti, R.: Electrical Resistivity Tomography (ERT) to monitor the efficiency of different irrigation systems in horticulture field, EGU General Assembly 2024, Vienna, Austria, 14–19 Apr 2024, EGU24-10617, https://doi.org/10.5194/egusphere-egu24-10617, 2024.

In the Mediterranean region, agricultural water use accounts for a large share of the water demand and is key for food security and socio-economic stability in rural areas. At the same time, both managing irrigation in farms and managing water distribution to farms are not trivial tasks, since the water requirements by crops are site-specific and vary in time because of weather, agronomic management and other factors. In this context, the availability of EO data opens the opportunity to develop tools for the supervision, management and forecast of irrigation, scalable from farms to districts and basins. Time series of observed biophysical parameters of the vegetation and estimates of actual crop evapotranspiration (ETa) are promising resources for these applications. Those data can be assimilated into digital twins that integrate observations from different sources with models of crop development and soil water balance, enabling assessments of irrigation performance and management decision making. Here we describe a decision-making approach for irrigation district managers that assimilates EO data and simulates the water balance parameters of the soil-crop system at each individual plot. The goal is to obtain a dynamic view of irrigation performance scaling from individual plots to the basin, quantifying at real time the progress of crop growth and seasonal water balance, including forecasts of the forthcoming crop water demands under different meteorological scenarios. This approach has been implemented in the Catalan side of the Ebro basin (Spain), on an area of 2600 km2 covering 105 municipalities. A separate digital twin was defined for each of over 130000 agricultural plots listed in the Land Parcel Identification System. For each plot, the agricultural scenario was set according to open data of EU CAP’s Single Farm Payment and a soil map of the area. This included the list of crops declared from 2015 to 2022, the irrigation system and the soil class. From these basic categoric data, more detailed parameters of the crop, soil and irrigation method were assigned according to the description of actual agricultural scenarios on the area. The development of the crop and its soil water balance at each individual plot is simulated at real time, using a customized model based in a rationale similar to FAO’s AquaCrop, but with additional adaptations to permanent crops, localized irrigation and discontinuous canopies. Simulations are updated every day, using online weather data from the Meteorological Service of Catalonia. In parallel, as soon as new Sentinel-2 images are available, fAPAR and LAI are computed through the Biophysical Processor available in the SNAP software and these parameters are assimilated in the model. The output are maps and time series with the estimated ETa, irrigation amounts and available soil water at each plot, accessible at www.irrilleida.cat. Time series cover the whole year, on a week basis, including the forecasts of crop water demands for the remaining part of the year.

How to cite: Casadesús, J., Pàmies, M., and Bellvert, J.: IrriLand, a digital twin assimilating biophysical parameters of vegetation to assess and forecast site-specific crop water requirements at irrigation district scale, EGU General Assembly 2024, Vienna, Austria, 14–19 Apr 2024, EGU24-11546, https://doi.org/10.5194/egusphere-egu24-11546, 2024.

EGU24-11875 | ECS | Orals | ITS3.18/HS12.4 | Highlight

DL-Driven Precipitation Correction for Enhanced Hydrological Simulations over Central Europe 

Kaveh Patakchi Yousefi, Alexandre Belleflamme, Klaus Goergen, and Stefan Kollet

Integrated hydrologic models are useful for assessing the impact of climate change on water resources and associated risks. The performance of these models strongly depends on the quality of precipitation forcing data, where errors can significantly affect the simulation accuracy. Therefore, methods such as data assimilation (DA) bias adjustments, and data-driven (e.g., deep learning, DL) methods are in use to improve precipitation simulation data. However, given the high spatiotemporal variability of hourly precipitation, challenges such as availability of “ground truth” measurements, data imbalance, and evaluation of the methods affect the applicability and assessment of these methods. In this study, we correct precipitation data for the first 24h obtained from the  ECMWF HRES 10-day deterministic forecast using EUMETSAT H-SAF h61 satellite observations, by learning the errors using a U-Net convolutional neural network (CNN) as a DL technique. Our findings show good agreement between the corrected precipitation data (HRES-C) and the reference data (H-SAF) with roughly about 49%, 33%, and 12% improvement in mean error, root mean square error, and Pearson correlation, respectively. Additionally, we investigate the impact of original HRES, H-SAF, and HRES-C corrected products used as forcing data in high-resolution (~0.6km) integrated hydrologic simulations using ParFlow/CLM over central Europe in daily and monthly scales from April 2020 to December 2022. We choose soil moisture (SM) as a diagnostic variable for our evaluation. SM simulations produced with uncorrected HRES 24h show a better agreement with ESA CCI SM satellite data compared to SM produced with HRES-C. Further comparison of the three products with in-situ rain gauge measurements over the same period shows superiority of HRES 24h in representing the “ground truth” precipitation.  Our study highlights the need for better precipitation reference data, challenging reliance only on satellite observations (H-SAF) for DL-based correction of precipitation forcing data in hydrological simulations.

How to cite: Patakchi Yousefi, K., Belleflamme, A., Goergen, K., and Kollet, S.: DL-Driven Precipitation Correction for Enhanced Hydrological Simulations over Central Europe, EGU General Assembly 2024, Vienna, Austria, 14–19 Apr 2024, EGU24-11875, https://doi.org/10.5194/egusphere-egu24-11875, 2024.

EGU24-12660 | Posters on site | ITS3.18/HS12.4

Machine learning approach for prediction of groundwater levels based on ERA5 reanalysis 

Anna J. Żurek, Radosław Szostak, Przemysław Wachniew, and Mirosław Zimnoch

We have examined the feasibility of ECMWF Reanalysis (ERA5) data for groundwater level prediction for 19 groundwater wells from two neighboring Groundwater Bodies (GWB) comprising around 4000 km2. Groundwater level data were retrieved from monitoring wells operated within the framework of the Polish Hydrogeological Survey.  ERA5 reanalysis data  were averaged for all grid points within the modelling area. Predictions were made using various machine learning regression algorithms incorporating autoregression and exogeneous variables derived from ERA5 reanalysis (precipitation amount, evapotranspiration, runoff, snowmelt). Training sets were extracted from time series of data representing period from November 2001 to November 2022. The applied approach allows for predicting groundwater levels based on current meteorological conditions.

This research was funded by National Science Centre, Poland, project WATERLINE (2020/02/Y/ST10/00065), under the CHISTERA IV programme of the EU Horizon 2020 (Grant no 857925).

How to cite: Żurek, A. J., Szostak, R., Wachniew, P., and Zimnoch, M.: Machine learning approach for prediction of groundwater levels based on ERA5 reanalysis, EGU General Assembly 2024, Vienna, Austria, 14–19 Apr 2024, EGU24-12660, https://doi.org/10.5194/egusphere-egu24-12660, 2024.

EGU24-12808 | ECS | Orals | ITS3.18/HS12.4

Use of Cosmic-ray Neutron Sensing for soil water management 

Markus Köhli, Jannis Weimar, Patrizia Ney, Felix Nieberding, Patrick Stowell, André Torre Netto, Klaus Goergen, Heye Bogena, and Ulrich Schmidt

Accurate soil moisture (SM) monitoring is key in climate modeling, hydrological observations and irrigation as it can greatly improve water use efficiency, the understanding of energy transfer over the land surface and ground water dynamics. Recently, Cosmic-Ray Neutron Sensors (CRNS) have been recognized as a promising tool in SM monitoring due to their large footprint of several hectares and half a meter in depth. Using this technique one can relate the flux density of albedo neutrons generated in cosmic-ray induced air showers to the amount of water in the environment. CRNS have great potential as to the non-invasive nature of the method and the low-maintenance independently operating sensors. In the last years this type of sensor has been integrated into several national and international monitoring networks like COSMOS, COSMOS-UK, ADAPTER and TERENO sites. Initially, CRNS instruments have relied on the use of a scarce material - helium-3. In order to scale up the method and to reduce costs within the CosmicSense research group recently large-scale instruments have been developed using alternative technologies including readout electronics and data acquisition systems. With a more economical operation the initial focus on hydrological research Cosmic-Ray Neutron Sensors are emerging into applied agricultural contexts, for example irrigation management and soil moisture mapping. Examples are the integration of CRNS into the SWAMP (LoRa) or the Nb-IoT network of the German Chamber of Agriculture. This project, called ADAPTER, involves the development and provision of innovative simulation-based information products for weather- and climate-resilient agriculture. These are daily (”soil”) weather and comprehensive long-term climate change information available to the agricultural community and all interested parties as easy-to-use analyses, data products with forecasts, and information interfaces. Still, challenges for CRNS are posed for scenarios especially for irrigated fields with a size smaller than the CRNS footprint or heterogeneous conditions with respect to the biomass distribution.

How to cite: Köhli, M., Weimar, J., Ney, P., Nieberding, F., Stowell, P., Torre Netto, A., Goergen, K., Bogena, H., and Schmidt, U.: Use of Cosmic-ray Neutron Sensing for soil water management, EGU General Assembly 2024, Vienna, Austria, 14–19 Apr 2024, EGU24-12808, https://doi.org/10.5194/egusphere-egu24-12808, 2024.

Across Latin America, floods are one of the major hazards, and their impacts are exacerbated by climate change and poor societal preparedness. The latter is mainly due to the lack of methods that could provide insights about where and when extreme events could happen and what their hydraulic response might be. The data-scarcity and lack of open-source tools are one of the main barriers to improving resilience in the context of flooding. Nonstructural measures such as early warning systems are typically based on empirical approaches relating rainfall thresholds in order to inform about potential floods at country or continental scales. Nevertheless, this ignores the hydraulic behavior and rainfall-runoff mechanics. This research presents the first steps to establish an open-source Early Warning System (EWS) by employing a hydrodynamic model (Hydropol2D) integrated with quasi-global rainfall estimations from PERSIANN PDIR-Now and numerical weather predictions from the Global Forecast System (GFS). The model is capable of running at multiple spatial scales, combining near real-time flood modeling (as a Digital Twin) which shares the current system states as a base scenario for the forecasting system (as an EWS). Additionally, the model features a graphical interface for monitoring current hydraulic conditions and predicting future flooding based on rainfall forecasts. From one year of initial modeling results as a system warm-up, we observed the model's speed viability due to its parallel computing capability. The integration of freely available rainfall data and real-time gauge stations of flow stages and discharge shows the potential of the model as a Digital Twin at a continental scale. However, the model still lacks a recursively parameters updating routine to improve output accuracy, and regular calibration and validation procedures are necessary for each point of interest. Furthermore, the inclusion of evapotranspiration and soil moisture remote sensing data needs to be considered due to their impact on long-term hydrological modeling. These initial steps to combine a Digital Twin and an EWS could strengthen resilience where data is limited, empowering vulnerable communities through participatory adaptation and enhanced capacity. The open-source, customizable platform is accessible for organizations to implement early warning systems within areas with growing risks.

How to cite: Castillo Rápalo, L. M. and Mendiondo, E. M.: Towards establish a continental Early Warning System for flood Preparedness: A study case of South America's data-scarce countries, EGU General Assembly 2024, Vienna, Austria, 14–19 Apr 2024, EGU24-13442, https://doi.org/10.5194/egusphere-egu24-13442, 2024.

EGU24-16164 | ECS | Orals | ITS3.18/HS12.4

Revisiting border irrigation management: benefits of new in-field sensor-based control compared to conventional cutoff times 

Paul Vandôme, Amine Berkaoui, Cedric Guillemin, and Crystele Leauthaud

Surface irrigation is often described as low performing insofar as its practice is labour intensive and involves the use of large water flows that are difficult to quantify and manage. However, this method remains predominant worldwide, and modernisation towards localised irrigation systems is not always feasible or advisable. To support border irrigation management, we previously developed a low-cost sensor for surface irrigation management, which remotely informs the farmer of water arrival downstream of his or her field and therefore of the moment to stop irrigation. The objectives of this study were: i) to determine the optimal position of this sensor lengthwise in the field throughout the season, and ii) to compare the influence of management scenarios (sensor-based or time-based cutoff) on irrigation performance. To this end, an integrated agro-hydraulic model was developed to simulate surface water flow dynamics throughout the season including variations in infiltration and roughness. The model was fed using monitoring data from the border irrigation of a hay field during a whole season. The results showed that the optimal sensor position can change by 10% over the course of the season, depending on inflow rates, initial soil moisture and Manning’s roughness. Sensor-based irrigation control was found to be more efficient than actual practices, and more effective than an optimised cutoff time in limiting performance gaps induced by variability or uncertainty in the initial conditions. The methods and findings should serve as a basis for larger-scale studies integrating the adoption of sensors and real-time data for surface irrigation management.

How to cite: Vandôme, P., Berkaoui, A., Guillemin, C., and Leauthaud, C.: Revisiting border irrigation management: benefits of new in-field sensor-based control compared to conventional cutoff times, EGU General Assembly 2024, Vienna, Austria, 14–19 Apr 2024, EGU24-16164, https://doi.org/10.5194/egusphere-egu24-16164, 2024.

EGU24-16802 | ECS | Orals | ITS3.18/HS12.4

Soil moisture forecast based on gridded historical and forecast datasets 

Mojtaba Saboori, Abolfazl Jalali Shahrood, Kedar Ghag, and Björn Klöve

Continuous monitoring of soil moisture (SM) has become a prevalent approach in precision irrigation control. Fluctuations in SM within the root zone, whether caused by overly wet or dry conditions, can potentially diminish plant transpiration, leading to decreased productivity. Hence, ensuring a timely and appropriate supply of water is essential for effective irrigation management. Though various machine and deep learning models, along with in-situ climate data, have been examined for monitoring SM, the incorporation of gridded historical and forecast climate data into this aspect has not been explored. In this research, we assess forecasting SM by Random Forest (RF) model for the next 7 days using two approaches: A) relying on forecasted data for each day, and B) relying solely on historical data. To this end, the gridded climate data (air temperature, relative humidity, wind speed, precipitation, and reference evapotranspiration-ET0), the soil features (lagged in-situ SM and gridded soil temperature), and vegetation features (Normalized Difference Vegetation Index-NDVI) for different land covers in Oulu, Finland. The findings suggest that using gridded data could be a promising option in places where there is limited data for the SM forecasting. The lagged SM was the most explaining variable, followed by soil temperature, NDVI, and ET0. Furthermore, both scenarios exhibited similar trends, showing a decline in forecasting accuracy as the lead time approached 7 days, and thus scenario B can provide more efficient SM forecasts.

How to cite: Saboori, M., Jalali Shahrood, A., Ghag, K., and Klöve, B.: Soil moisture forecast based on gridded historical and forecast datasets, EGU General Assembly 2024, Vienna, Austria, 14–19 Apr 2024, EGU24-16802, https://doi.org/10.5194/egusphere-egu24-16802, 2024.

EGU24-17122 | Orals | ITS3.18/HS12.4

Spatial and temporal drought analysis in susceptible agroecosystems: the case of Thessaly region, Greece 

Stavros Sakellariou, Marios Spiliotopoulos, Nicolaos Alpanakis, Ioannis Faraslis, Pantelis Sidiropoulos, Georgios Tziatzios, George Karoutsos, Nicolas Dalezios, and Nicholas Dercas

Drought consists one of the most critical environmental hazards for the viability and productive development of crops. This paper is focused on the application of the Standardized Precipitation Index (SPI) for drought analysis and classification. The SPI is a commonly used drought index that calculates the difference between a given time period's precipitation and its long-term average. The objectives of the study are to conduct a spatiotemporal drought analysis, estimate drought severity using the SPI, identify both dry and wet periods, classify drought using the SPI, classify the degree of drought/wetness conditions using a classification scheme for multiple timescales, and calculate and classify SPI12 for each month from 1981-2020. The study area is Thessaly, Greece, which is the country’s largest agricultural productive region facing water availability problems. The innovation of this paper is the spatiotemporal drought analysis through the use of CHIRPS (Climate Hazards Group InfraRed Precipitation with Station data) instead of conventional meteorological data, avoiding the use of a prevailed sparse weather network, and the difficulties arising from that. The study shows that the region has faced two severe years of drought in 1988 and 1989, which led to moderate and extremely drought conditions, respectively. In contrast, extremely wet conditions were observed in 2002-2003, while 2009-2010 experienced moderately wet conditions. In this context, the mapping of spatial and seasonal variability across the study area permits more targeted measures instead of horizontal policies.

Keywords: drought; SPI; CHIRPS; Thessaly; Greece; desertification

How to cite: Sakellariou, S., Spiliotopoulos, M., Alpanakis, N., Faraslis, I., Sidiropoulos, P., Tziatzios, G., Karoutsos, G., Dalezios, N., and Dercas, N.: Spatial and temporal drought analysis in susceptible agroecosystems: the case of Thessaly region, Greece, EGU General Assembly 2024, Vienna, Austria, 14–19 Apr 2024, EGU24-17122, https://doi.org/10.5194/egusphere-egu24-17122, 2024.

EGU24-17532 | ECS | Orals | ITS3.18/HS12.4 | Highlight

Novel assessment and development of land surface modelling for irrigation schemes in Mediterranean apple orchards 

Cosimo Brogi, Olga Dombrowski, Heye Reemt Bogena, Harrie-Jan Hendricks-Franssen, Sean Swenson, Vassilios Pisinaras, and Andreas Panagopoulos

Land-surface models (LSM) that simulate agricultural systems can provide key support for decision makers in precision irrigation and in the management of water resources under different climate scenarios. An accurate representation of irrigation in LSM is also crucial to understand how irrigation practices influence land-atmosphere processes from regional to global scale. Irrigation practices are increasingly integrated into LSM. However, challenges such as lack of data for model development and validation undermine the possibility to evolve current LSM into precision irrigation applications as well as into decision-making tools at the catchment scale and beyond.

In this study, we used the Community Land Model version 5 (CLM5) and assessed the representation of irrigation practices and consequent effect on crop yield in the model using a) the existing irrigation scheme of CLM5 and b) a novel irrigation data stream that allows to directly use observed irrigation data. Additionally, we used CLM5 to investigate irrigation requirements as well as the effect of deficit irrigation on crop yield and crop water use efficiency (CWUE) at the catchment scale (~45 km2). Model validation was supported by two highly instrumented apple orchards located in Agia (Greece) within the Pinios Hydrologic Observatory (PHO). From 2020, an ATMOS41 all-in-one climate station for monitoring meteorological data and a SoilNet sensor network for measuring soil moisture and matrix potential at various depths across 12 locations with SMT100 and TEROS21 sensors were used in both orchards. Additionally, a System SP cosmic-ray neutron sensor (CRNS) was installed in the centre of each field to monitor the field-averaged soil moisture, and several water meters were used to monitor irrigation rates in the orchards. Finally, one field was equipped with six SFM-1 sapflow sensors to estimate whole-tree transpiration and with six SnapShot Cloud 4G remote outdoor cameras.

We found that the novel irrigation data stream outperformed the existing scheme in terms of soil moisture simulation, even when the latter was manually adjusted to better mimic actual irrigation practices. However, both methods resulted in similar harvest predictions. Nonetheless, the fact that the existing scheme lacks the necessary flexibility to represent specific irrigation practices can have important implications for the simulation of infiltration, runoff, and sensible and latent heat fluxes. Furthermore, a 25 % irrigation reduction had negligible effect on simulated yield and CWUE at the catchment scale, while a 50 % reduction negatively affected both yield and CWUE depending on climatic conditions, soil properties, and irrigation timing (on average -30 % and -17 %, respectively). Although further process representations, such as the potential impact of deficit irrigation on crop quality, have yet to be implemented in CLM5, our results clearly show how CLM5 could be utilized for irrigation and water resources management at the field and catchment scales.

How to cite: Brogi, C., Dombrowski, O., Bogena, H. R., Hendricks-Franssen, H.-J., Swenson, S., Pisinaras, V., and Panagopoulos, A.: Novel assessment and development of land surface modelling for irrigation schemes in Mediterranean apple orchards, EGU General Assembly 2024, Vienna, Austria, 14–19 Apr 2024, EGU24-17532, https://doi.org/10.5194/egusphere-egu24-17532, 2024.

EGU24-19565 | Posters on site | ITS3.18/HS12.4

An open-source tool based on Google Earth Engine for spatially explicit crop yield modelling  

lorenzo crecco, sofia bajocco, mara di giulio, and simone bregaglio

Process-based crop models can predict harvested yield by reproducing the effects of the environment on plant phenology and physiology. Accurate yield forecasts are essential to support strategic and tactical actions in public and private sectors. Applications span from detecting critical areas for food security issues to optimizing selling/buying prices of crop products in main producing regions, to informing farmers on the best agricultural management practices. Most crop models are point-based and must be integrated in a spatially explicit environment to provide the yield information in a target area at the desired spatial resolution. Remote sensing (RS) represents an invaluable resource to inform crop models with actual vegetation dynamics based on consistent and timely views of Earth's surface with time and space continuity. The main advantage of incorporating RS data into crop models is hence the representation of the missing spatial information and the reliable description of the crop’s health condition throughout the growing season. This study presents, an open-source tool developed within the Google Earth Engine environment to monitor crop growth and estimate crop yield. It is based on a generic model (SIMPLE) executed over large areas at run-time and is easily adapted to different crops by adjusting a few physiological parameters. SIMPLE algorithmic implementation uses ERA5-Land as weather source and derives the leaf area index (LAI, unitless) and the actual crop evapotranspiration (ETc, mm day-1) using data from the MODIS Normalized Difference Vegetation Index (NDVI). Results show that integrating RS data into the SIMPLE model allowed currently identifying the limits of the growing season and mapping seasonal crop phenology evolution in the Piedmont region. Abiotic stresses have been correctly spotted, and aboveground and yield of winter wheat and maize have aligned with reference data. Our findings have significant implications for improving yield estimations by identifying spatial patterns of crop growth productivity for summer and winter crops. This tool also shows potential for near-real-time monitoring of crop growth dynamics in response to abiotic stresses in sensitive phenological phases.

How to cite: crecco, L., bajocco, S., di giulio, M., and bregaglio, S.: An open-source tool based on Google Earth Engine for spatially explicit crop yield modelling , EGU General Assembly 2024, Vienna, Austria, 14–19 Apr 2024, EGU24-19565, https://doi.org/10.5194/egusphere-egu24-19565, 2024.

EGU24-19905 | ECS | Posters on site | ITS3.18/HS12.4

Testing a novel microtensiometer sensor in a citrus orchard for feedback control irrigation scheduling 

Vincenzo Alagna, Dario Autovino, Mariachiara Fusco, Girolamo Vaccaro, and Massimo Iovino

Monitoring the plant water status is necessary to identify appropriate irrigation scheduling parameters. Stem water potential (Ψstem) is considered the standard measure of crop water status and its measurements have been conducted by using the Scholander pressure chamber (PC) which do not allow continuous monitoring of crop water status. More recently, microtensiometers have been developed to monitor the water potential of the trunk (Ψtrunk) continuously, potentially overcoming the drawbacks of PC-based measurement.

This study was conducted to test the reliability of the new water status indicator, Ψtrunk, measured by microtensiometer, comparing it with Ψstem values measured with a PC in a 30-year-old mandarin trees.

The research was carried out during the 2022 and 2023 irrigation seasons, on three plots, each with a specific irrigation method. In one of the plots, a sprinkler irrigation system is installed and the irrigation is managed by the farmer (Traditional Irrigation, TI). In the other two plots, a subsurface drip irrigation system is implemented and two irrigation strategies are applied: i) Full Irrigation (FI), in which the entire evapotranspiration is returned, and ii) Deficit Irrigation (DI), consisting in the application of a water saving strategy (1 July - 15 August). In each plot, a representative tree was selected and, starting from July, Ψtrunk was monitored using two microtensiometers (FloraPulse, CA, USA) embedded directly in the trunk. Measurements cycles of Ψstem were taken by the PC on two covered stems, from 6:00 am to 6:00 pm every three hours, on TI tree the day after and three days after the irrigation event in both the 2022 and 2023 irrigation seasons. For DI and FI trees, the same measurements cycles days usually precede and follow the irrigation days. In addition, only in 2022 Ψstem were measured weekly at noon.

The Ψtrunk monitored by the microtensiometer was influenced by the irrigation strategies applied. The greatest variations were observed in the TI thesis, where more negative Ψtrunk values were recorded the day before irrigation. In both the FI and DI thesis, the seasonal variation of Ψtrunk was more limited compared to TI. The water potential values on the stem were generally more negative than on the trunk, as would otherwise be expected, but the cycles of daily measurements, carried out with the PC, showed that the most negative values were usually recorded on the stem at 3:00 pm, whereas on the trunk they were recorded from 1 to 4 hours later. The correlations of the averaged values of Ψstem and Ψtrunk showed value of the coefficient of determination R2= 0.43 when all the dataset was considered. However, when the dataset was split according to irrigation strategy, R2 increased for FI and TI trees, R2 =0.64 and R2 =0.60 respectively, while it decreased for DI trees (R2 =0.28).

In conclusion, the FloraPulse microtensiometer demonstrated the possibility of providing a better understanding of crop water potential variations in the SPA system, but it is necessary to identify Ψtrunk thresholds for feedback control irrigation scheduling different from those already well defined in literature for the Ψstem.

How to cite: Alagna, V., Autovino, D., Fusco, M., Vaccaro, G., and Iovino, M.: Testing a novel microtensiometer sensor in a citrus orchard for feedback control irrigation scheduling, EGU General Assembly 2024, Vienna, Austria, 14–19 Apr 2024, EGU24-19905, https://doi.org/10.5194/egusphere-egu24-19905, 2024.

EGU24-20028 | ECS | Orals | ITS3.18/HS12.4 | Highlight

Assessment of crop water needs and its sustainability based on future climate scenarios: the Aude Department (South-West France) 

Andrea Borgo, Antonio Trabucco, Muhammad Faizan Aslam, Sara Masia, Donatella Spano, and Marta Debolini

Since 1970, South-western European regions (Iberian Peninsula and South France) have been subjected to an air temperature increase of almost 2 °C, while generally southern Europe assisted to a 20% drop in annual precipitation. Agriculture is by far the sector with the greatest freshwater withdrawals, and it is essential to perform an accurate assessment of water consumption for irrigation, in order to develop strategies to reduce water abstractions from the ecosystem. In this context, this work aims at modelling water consumption for agriculture in the Aude river basin (South-West France), in order to assess the amount of water needed during the growing season of each crop in the current conditions, and in the future scenarios of climate change, according to different climate models. This project relies on the application of SIMETAW# model (Simulation of Evapotranspiration of Applied Water), which, from a set of climatic and soil data, computes the daily reference, well-watered crop, and actual evapotranspiration (ET0, ETc, ETa), the evapotranspiration of applied water (ETaw), an irrigation schedule, and crop growth and yield for a specific site. For climate inputs, the work relies on the high-resolution data (0.11-degree resolution) supplied by Copernicus Cordex, which provides historical records and future estimations according to RCPs (Representative Concentration Pathways) 2.6, 4.5 and 8.5. In the calculation of the well-known Penman–Monteith ET0 formulation, SIMETAW# also considers the effect of the increase of atmospheric CO2 concentration on stomatal resistance, which plays as a counterbalance with the increase of temperature due to climate change, by reducing stomatal opening for transpiration in plants, determining lower water loss through stomata. The model calculates ETa in both irrigated and rainfed conditions, distinguishing the irrigation methods according to the most relevant crops of the region, namely wine grapes cultivations, forage crops, wheat, olives, vegetables and fruits. Results show that, in Aude basin, the variation of total irrigation demand between 1990 and 2050 is expected to be very low in scenario RCP 2.6 (< 1%), while in RCP 4.5 a 2.5% increase is foreseen. Differently, RCP 8.5 expects a substantial decrease of irrigation requirements (-23%), due to the large increase of CO2 concentration in the atmosphere. Low water-demanding crops, such as winter wheat and wine grapes, are less sensitive to climate variations, thus their irrigation demand is expected to remain rather stable in the future, however summer crops (fruits and vegetables) will require greater irrigation inputs. The study demonstrates that, in some climate scenarios, crop water requirements may decrease due to the reduction of stomatal conductance. Still SIMETAW#, as most of the crop water models currently applied, does not take into account other climate change effects that can be damaging for the vegetation (e.g., heat waves, floods, spread of pathogens, etc.), together with the reduced availability of water supply in the basin, which can also have a consequence on the irrigation scheduling.

How to cite: Borgo, A., Trabucco, A., Aslam, M. F., Masia, S., Spano, D., and Debolini, M.: Assessment of crop water needs and its sustainability based on future climate scenarios: the Aude Department (South-West France), EGU General Assembly 2024, Vienna, Austria, 14–19 Apr 2024, EGU24-20028, https://doi.org/10.5194/egusphere-egu24-20028, 2024.

EGU24-20258 | ECS | Posters on site | ITS3.18/HS12.4

Digital twin development for an irrigation machine 

Guillermo Salvador García Lovera, Rafael González, Emilio Camacho, and Pilar Montesinos

Irrigated agriculture, the main user of water resources, is undergoing a change in its management and use. Therefore, tools such as artificial intelligence or digital twins applied to water management can improve it to maximize water use efficiency. Thus, the main objective of this work focuses on the development and implementation of a digital twin in a mobile irrigation system, specifically a universal irrigation machine. The digital twin, DT, is an accurate, real-time virtual representation of a real element (irrigation system), becoming an advanced decision support system for irrigation management, which can incorporate artificial intelligence tools for the implementation of intelligent precision irrigation. This technology allows, in real time, to simulate and analyze multiple operation scenarios before making decisions that affect the actual system. Thus, several interconnected components have been developed to form the DT of a real irrigation machine, located in southern Spain. It reproduces the machine operation in real time using information obtained from sensors (climatic information, soil moisture probes, pressure transducers and flowmeters) located in the study area and in the irrigation machine itself. The DT is made up of different components: i) the hydraulic model of the machine that provides the pressure and flow rate supplied by the emitters of the irrigation machine; ii) the irrigation programming module that manages the machine operation (at what time and for how long) during the irrigation campaign;  iii) The irrigation machine water distribution model that provides water distribution maps, which will allow adjusting the operation of the machine (for example, forward speed) aimed at that each spatial element of ​​the irrigation plot (conditioned by the parameters soil, climate and stage of development of the irrigated crop) receives the required amount of water; and iv) the communication module with sensors. The DT of the irrigation machine provides the amount of water that each spatial unit of the plot receives in each irrigation event throughout the irrigation campaign for different operation conditions of the irrigation machine. This information can be the input of other DTs such as the crop development DT to create more complex DTs that reproduce the operation of an irrigated farm. Finally, the ability to monitor and simulate irrigation in real time by the DT provides farm managers with valuable data to make correct decisions, especially in periods of water scarcity, adjusting irrigation management to the spatial variability of the plot, taking into account the water availability to maximize crop production.

How to cite: García Lovera, G. S., González, R., Camacho, E., and Montesinos, P.: Digital twin development for an irrigation machine, EGU General Assembly 2024, Vienna, Austria, 14–19 Apr 2024, EGU24-20258, https://doi.org/10.5194/egusphere-egu24-20258, 2024.

EGU24-20336 | Orals | ITS3.18/HS12.4

Modeling crop water demand to support adaptation strategies in Mediterranean environment under climate change 

Muhammad Faizan Aslam, Sara Masia, Donatella Spano, Valentina Mereu, Marta Debolini, Richard L. Snyder, Andrea Borgo, and Antonio Trabucco

Water scarcity is arguably a pressing issue for the 21st century in Mediterranean areas, due to limited water resources, expansion of irrigated area to sustain food security and climate change. Water extraction for agriculture sector account about to 70% of global water use, and this demand peaks to 80% of total water withdrawal in several southern Mediterranean countries. In this study, the impact of climate change on evapotranspiration demand, crop water requirements, and crop yield losses due to water shortage, were assessed by using the Simulation of Evapotranspiration of Applied Water (SIMETAW_GIS) model. This crop-soil-water model was implemented over the Sardinia island, a region with a typical Mediterranean climate and agriculture characteristics, assuming impact of climate change for a whole range of relevant Mediterranean crops (Wheat, Barley, Sugar beet, Potato, Lentil, Almond, Maize, Wine Grape, Table Grape, Tomato, Rice, Artichoke, Alfalfa, Olives, Improved Pasture and Orange). Under present analysis, daily climate data from five Earth System Models dynamically downscaled to a spatial resolution of 0.11-degrees (~11 km) from the  EURO-CORDEX project domain and available from the Copernicus Climate Data service (https://climate.copernicus.eu/) were retrieved and ensembled. The impact of climate change on crop water requirements was evaluated under historical (1976-2005) and future (2036-2065) climate conditions following different Representative Concentration Pathways (RCPs: 2.6, 4.5 and 8.5), representing alternative mitigation policies and future emission scenarios.

In the Sardinia region, results show a variegated increase of crop water demand between future (2036-2065) and historical conditions (1976-2005) for different crops, which may pose a challenge for water resource management, especially considering water use conflicts among different sectors. On average wheat and barley will foresee the most significant increase of crop water requirements, ranging on average by 12 to 14% under different RCPs. Other crops (e.g. almond, maize, wine grape, and pasture) are projected to foresee still significant increases of crop water demand, varying between 4-8%.  This work provides information that can support farmers and decision managers to evaluate climate change adaptation strategies linked to different cropping patterns to increase use efficiency of water resources for a more sustainable agriculture production under climate change.

How to cite: Aslam, M. F., Masia, S., Spano, D., Mereu, V., Debolini, M., Snyder, R. L., Borgo, A., and Trabucco, A.: Modeling crop water demand to support adaptation strategies in Mediterranean environment under climate change, EGU General Assembly 2024, Vienna, Austria, 14–19 Apr 2024, EGU24-20336, https://doi.org/10.5194/egusphere-egu24-20336, 2024.

EGU24-20601 | Orals | ITS3.18/HS12.4

Improving satellite estimation of actual evapotranspiration using field monitoring and crop simulation 

Nicholas Dercas, Georgios Tziatzios, Ioannis Faraslis, Nicolas Dalezios, Nicolas Alpanakis, Marios Spiliotopoulos, Stavros Sakellariou, Pantelis Sidiropoulos, and Vagelis Brissimis

Water is a natural resource that is in shortage in many areas of the planet. This fact will be exacerbated in the context of the climate crisis. Agriculture is the major consumer of water in Greece but at the same time an important polluter of the environment (sea intrusion problem, pollution of aquifers with fertilizers, herbicides, pesticides). these conditions, the need to reduce water consumption and use it more efficiently is imperative, aiming at sustainable water management. Today there is technology available that allows the use of satellite images and the application of an energy balance at crop and ground level to estimate actual evapotranspiration. This method, to give values, close to reality, must be calibrated using ground data. For this reason, cotton, and maize fields in Thessaly (Central Greece) were systematically monitored for soil moisture and final yield. These water consuming plants are widely cultivated in the Thessalian plain even though the area has a negative water balance. The data collected from the monitoring together with the simulation with the AquaCrop model led to the estimation of the actual evapotranspiration. The model results are considered to correspond to real evapotranspiration since water balance application conditions were favourable (runoff and deep percolation had small or zero values). As a resiult, using the estimation of ETA in the plot we were led to improve the satellite estimation of evapotranspiration.

Key words: Evapotranspiration, satellite images, monitoring, AquaCrop

How to cite: Dercas, N., Tziatzios, G., Faraslis, I., Dalezios, N., Alpanakis, N., Spiliotopoulos, M., Sakellariou, S., Sidiropoulos, P., and Brissimis, V.: Improving satellite estimation of actual evapotranspiration using field monitoring and crop simulation, EGU General Assembly 2024, Vienna, Austria, 14–19 Apr 2024, EGU24-20601, https://doi.org/10.5194/egusphere-egu24-20601, 2024.

EGU24-20652 | Orals | ITS3.18/HS12.4

Monitoring crop phenology applying biophysical indices from Sentinel-2 data: the case of Thessaly region in Greece 

NIcolas Dalezios, Ioannis Faraslis, Nicolas Alpanakis, Georgios Tziatzios, Marios Spiliotopoulos, Stavros Sakellariou, Pantelis Sidiropoulos, Nicholas Dercas, and Vagelis Brissimis

The newest Earth Observation optical sensors, such as Sentinel-2, provide global biophysical products and vegetation indices at high spatial (decametric or twentimetric resolution) and temporal resolution (about 5 days retrieval). These biophysical parameters are essential for constant crop status monitoring at local scale. Optimizing the water use for irrigation, the weed mapping, quantifying ground above biomass and crop yield production, are some of the benefits of biophysical parameters in agriculture. This research investigates the crop status during the 2021’s growing season in Thessaly agricultural area in Greece. Thus, in maize, biophysical variables, and vegetation indices, that is, Leaf Area Index (LAI), fraction of absorbed photosynthetically active Radiation (FAPAR), Fraction of Vegetation Cover (FVC), Leaf Chlorophyll content (Cab), Canopy Water Content (CWC), Normalized Difference Vegetation Index (NDVI) and Normalized Difference Red Edge Index (NDRedEdge) are retrieved. The PROSAIL radiative transfer model by artificial neural network approach is employed (available of the free SNAP® software) to retrieve the biophysical parameters from Sentinel-2 multispectral imagery. The monitoring of the abovementioned biophysical variables during the growth period of maize crop shows a uniform behavior. Finally, high consistency among vegetation parameters confirms the usefulness of Sentinel-2 products in agriculture.

Keywords: Biophysical indices; phenological stages; monitoring maize crop; Mediterranean agroecosystems

How to cite: Dalezios, N., Faraslis, I., Alpanakis, N., Tziatzios, G., Spiliotopoulos, M., Sakellariou, S., Sidiropoulos, P., Dercas, N., and Brissimis, V.: Monitoring crop phenology applying biophysical indices from Sentinel-2 data: the case of Thessaly region in Greece, EGU General Assembly 2024, Vienna, Austria, 14–19 Apr 2024, EGU24-20652, https://doi.org/10.5194/egusphere-egu24-20652, 2024.

EGU24-20715 | Posters on site | ITS3.18/HS12.4

Agroclimatic zoning methodology for selection of suitable crop in water limited Mediterranean areas 

Ioannis Faraslis, Nicolas Dalezios, Nicolas Alpanakis, Georgios Tziatzios, Marios Spiliotopoulos, Stavros Sakellariou, Pantelis Sidiropoulos, Nicholas Dercas, and Vagelis Brissimis

The agroclimatic classification identifies zones for efficient use of natural resources leading to optimal crop production. In water limited availability regions, such as the Mediterranean region, one problem is the quantification of water use in agriculture in view of the social problems linked to the performance of irrigated systems. The aim of this paper is the development of agricultural sustainable zones, in a typical water limited Mediterranean region, namely Thessaly in Greece. To achieve this, time series analysis with sophisticated geoinformatics techniques is applied. The agroclimatic classification methodology is based on three-stages: first, the microclimate features of the region are considered using aridity and vegetation health indices leading to water limited growth environment (WLGE) zones based on water availability; second, landform features and soil types are associated to WLGE zones to identify non-crop specific agroclimatic zones (NCSAZ); finally, specific restricted crop parameters, are combined with NCSAZ creating the suitability zones for sustainable agriculture. The results are promising as compared with the current crop production systems of the study area under investigation. Due to climate change, the results indicate that arid and semi-arid regions are also faced with insufficient amounts of precipitation for supporting rainfed annual crops. Finally, the proposed methodology reveals that the combination of Remotely Sensed techniques could be a significant tool for creating, shortly, detailed and up to date agroclimatic zones.

Keywords: Agroclimatic zoning; Hydroclimatic zoning; Non-crop specific zoning; Crop-specific zoning; Agricultural suitability zones, Mediterranean agroecosystems

How to cite: Faraslis, I., Dalezios, N., Alpanakis, N., Tziatzios, G., Spiliotopoulos, M., Sakellariou, S., Sidiropoulos, P., Dercas, N., and Brissimis, V.: Agroclimatic zoning methodology for selection of suitable crop in water limited Mediterranean areas, EGU General Assembly 2024, Vienna, Austria, 14–19 Apr 2024, EGU24-20715, https://doi.org/10.5194/egusphere-egu24-20715, 2024.

EGU24-1526 | Orals | ITS3.13/HS12.5 | Highlight

Leveraging Citizen Science for Flood Hazard Management: Harnessing Local Knowledge and Experience 

Peter Fischer-Stabel and Sascha Nau

Floods pose significant challenges to communities worldwide, necessitating effective hazard management strategies. Citizen science here emerges as a pivotal tool in amassing critical knowledge and experiences from local communities, offering an invaluable resource to bolster flood hazard management initiatives. It is able to serve as a conduit for integrating diverse local perspectives and experiences. Harnessing the collective wisdom of community members, who intimately understand the dynamics of their surroundings, becomes instrumental in comprehending flood patterns, vulnerabilities, and impacts and is able to enrich the database for hydrological and hydraulic modelling in the flood context. Nowadays, the advent of citizen science apps represents a paradigm shift in engaging and mobilizing local communities to actively participate in flood hazard management.

Within the framework of the BMBF R&D – Project “Urban Flood Resilience – Smart Tools (FloReST)” one tool developed was a SmartApp engaging local communities in the collection of flash flood related data and experiences. After the definition of the user requirements in collaboration with the local stakeholders, a first prototype was developed, engaging the citizens in the reference municipalities of the FloReST-project to organize App-Journeys collecting data in the field. Beside a description of the problem to be choosen from a predefined list of flood related grievances (e.g. drain blockages, faulty rakes, building activities changing the draining system), the Geolocation of the position, additional textual information, up to three images and a time stamp is collected and send via the smartphone to a Gesoserver at the Backend. There – located ideally at the responsible organizational unit for flood related activities, e.g. the building or the environmental authority- the incoming messages are stored in a database and visualized on a risk-map with different graphical signatures depending on the category of the problem reported. After having received the report, a notice confirming the reception of the message is automatically send back to the client. The SmartApp now is able to facilitate the data collection on flood occurrences, affected areas, and vulnerabilities. Integration of such data with existing models enhances the accuracy and precision of flood risk assessments, enabling authorities to develop targeted mitigation and response plans.

But, the idea behind this SmartApp is not only the collection of flood related local knowledge, moreover, this citizen science initiative intends to promote community engagement and empowerment, fostering a sense of responsibility among residents towards flood resilience.

However, several challenges exist in the implementation of citizen science for flood hazard management: Quality assurance and data reliability remain concerns, necessitating robust protocols for data validation and verification. In addition, the responsible authorities we discussed with were not very happy with that type of citizen science tools for deficiency reporting, because this will force them to action often not possible in a short time because of a lack in resources.

How to cite: Fischer-Stabel, P. and Nau, S.: Leveraging Citizen Science for Flood Hazard Management: Harnessing Local Knowledge and Experience, EGU General Assembly 2024, Vienna, Austria, 14–19 Apr 2024, EGU24-1526, https://doi.org/10.5194/egusphere-egu24-1526, 2024.

Climate change poses a significant threat to the well-being of humanity, territories, and resources. In the city of Bologna, Italy, environmental, societal, and digital challenges mirror those experienced globally in urban spaces such as air pollution, and intense urban mobility stemming from escalating urbanization. Addressing these issues, the H2020 I-CHANGE project,  "Individual Change of HAbits Needed for Green European transition," aims to demonstrate the potential for collective behavioral change by actively engaging civil society in innovative citizen science initiatives (Goudeseune et al., 2020; Vohland, 2021). University of Bologna established the Bologna Living Lab, involving a broad network of stakeholders based on the Quintuple Helix of Innovation (Carayannis et al., 2012), to enhance awareness of climate change impacts in urban areas and encourage behavioral shifts toward more socially and environmentally sustainable lifestyles.

Despite ongoing scholarly debates surrounding the definition of citizen science and its capacity to generate accessible and democratic knowledge, the I-CHANGE project embraces a participatory approach. The research methodology incorporates serious game techniques, traditionally applied in educational contexts, to augment citizen science activities. These serious games, blending serious objectives with playful elements, create immersive and engaging experiences, motivating participants to actively contribute to scientific endeavors. This integration marks a paradigm shift in citizen science, fostering increased public involvement in data collection, analysis, and discussion of results, ultimately enhancing the identification of climate change-related phenomena (Wiggins and Crowston, 2011; Irwin et al., 2012). 

The Bologna Living Lab adopts a two-step research approach, utilizing surveys and serious game mapping activities. The focus is on urban mobility, with "Mani in Mappa!" initiative, to investigate how mobility strategies can induce behavioral change toward sustainable and low-emission options. Collaborative serious games are utilized to promote awareness of the need for accessible, equal, and fair public transport. This comprehensive research contributes significantly to understanding the multi-level dynamics of mobility systems. It incorporates social, economic, and technological variables and holds the potential to inform and guide sustainable urban development initiatives. Bologna Living Lab and the I-CHANGE project stand for and promote innovative solutions, leveraging citizen science and serious game methodologies to address critical issues and pave the way for a more sustainable future. 

How to cite: Carlone, T. and Tondini, S.: Game-Changing Cities: Toward Sustainable Transportation with Citizen Science in Bologna’s Living Lab , EGU General Assembly 2024, Vienna, Austria, 14–19 Apr 2024, EGU24-1681, https://doi.org/10.5194/egusphere-egu24-1681, 2024.

EGU24-2142 | ECS | Posters on site | ITS3.13/HS12.5

Towards the European Green Deal. Improving awareness through citizen science campaign on extreme temperatures in the I-CHANGE Barcelona Living Lab on Extreme Events  

Paola Barrera Bohórquez, Laura Esbri, Llorenç Puig, Marc Fernàndez, Helena Lasheras, Montserrat Llasat-Botija, and Carmen Llasat

There is a trend of increasing population in urban coastal municipalities in Mediterranean Regions. Particularly, Barcelona, with 160 inhabitants/ha in a surface of 10135,3 ha, can be considered as a Mediterranean coastal megacity.

This huge urban growth in the recent years implies an increase in vulnerability against global warming and climate change. Recent reports had stressed that the annual average temperature of the Mediterranean coast is already 1.5ºC higher than in pre-industrial times. That widespread warming will continue during the 21st century, surpassing the global average by 20% annually and 50% in summer (MedECC 2020). On the other hand, temperatures can vary within cities, influenced by urban morphology, surface cover, materials, structure, and population activity (Aslam & Ahmad Rana, 2022). A better understanding of the effects of those parameters on the city temperature and its thermal comfort is a key to increase the resilience of the citizens against global warming.

The I-CHANGE project seeks to raise awareness and promote changes of habits among citizens to mitigate and better adapt to climate change. It involves the citizens in science activities of collecting and understanding environmental data considering their physical, socioeconomic, and cultural context. The campaign presented here was designed by the Barcelona Living Lab on Extreme Events coordinated by the ICHANGE team of the University of Barcelona. It was scheduled for August 2023 and February 2024. Three citizen volunteers (coauthors in this paper) supervised by the UB team carried out this campaign in Barcelona and two coastal and touristic municipalities (Castelldefels, and Malgrat de Mar) located near the capital.

The volunteers guided by the Barcelona Living Lab technicians worked to design two bicycle routes through their city that they would feel comfortable repeating several times. One route had to be along the coast and the other moving away from it. They used MeteoTrackers on a bicycle to collect temperature, pressure, and humidity data along the transects. Each route was covered on three different days during the summer, one time in the morning and another at night, resulting in a total of 12 transects in each municipality. The routes are expected to be repeated between January and February to collect winter data.

The goal of the campaign is to encourage citizens to reflect on the temperature variation along the Mediterranean coast and the influence of urban characteristics, using urban classifications such as Local Climate Zones. The analysis will also focus on the differences between the three closely located coastal municipalities and the volunteers will have an active role in the data treatment and data visualization process.

The I-CHANGE has received funding from the European Union’s Horizon 2020 research and innovation program under grant agreement 101037193.


References:

Aslam, A., & Ahmad Rana, I. (2022). The use of local climate zones in the urban environment: A systematic review of data sources, methods, and themes. Elsevier.

MedECC 2020. (2020). Resumen de MedECC 2020 para los responsables de la formulación de políticas. Obtenido de https://www.medecc.org/wp-content/uploads/2021/05/MedECC_MAR1_SPM_SPA.pdf

How to cite: Barrera Bohórquez, P., Esbri, L., Puig, L., Fernàndez, M., Lasheras, H., Llasat-Botija, M., and Llasat, C.: Towards the European Green Deal. Improving awareness through citizen science campaign on extreme temperatures in the I-CHANGE Barcelona Living Lab on Extreme Events , EGU General Assembly 2024, Vienna, Austria, 14–19 Apr 2024, EGU24-2142, https://doi.org/10.5194/egusphere-egu24-2142, 2024.

EGU24-4557 | Posters on site | ITS3.13/HS12.5

Challenges in climate change impact and risks in Jerusalem by the I-CHANGE Jerusalem Living Lab citizens science 

Pinhas Alpert, Yoav Rubin, Gabriel Densy Campos1, Konstantin Romantso, Nitsa Haikin, Amnon Stupp, and Pavel Kishcha

The I-CHANGE (Individual Change of HAbits Needed for Green European transition, 2021-2025) project promotes the active participation of citizens to address climate change. It engages citizens and local stakeholders to take part in science initiatives and support more sustainable behaviour. To this aim, a set of Living Labs located in very different eight cities of socio-economic contexts (Amsterdam, Barcelona, Bologna, Dublin, Genova, Hasselt, Jerusalem and Ouagadougou), were chosen. The I-CHANGE Living Labs address different environmental issues comprising: (i) extreme events, mainly focusing on heavy rainfall, and heat waves, (ii) air pollution & linkages with sustainable transport, (iii) the water cycle and (iv) Waste Management.

Here, the implementation plan for JLL (Jerusalem Living Lab) of the eight Living Lab in the project, is presented. In JLL our main expertise is Atmosphere sciences and Commercial Microwave Links (CML), a new tool for environmental monitoring. The major partner is the Jerusalem municipality interested in mapping urban shadow cover especially over the routes children take to school (summer temperatures reach 40+C). Another partner is the Jerusalem Science Museum which has the joint goal with Tel Aviv University to increase the scope to meteorological parameters and air pollution as well as the Discomfort index for the school routes. In addition, Mapping of Jerusalem LL high-resolution abovementioned variables, particularly humidity from both CMLs (Rubin etal, 2023) and Meteotrackers that measure solar insolation (Alpert, BAMS,1991).

Jerusalem City is unique in its diversity of populations with ~million inhabitants and is located at the border of Mediterranean climate with a significant
variability between the coastal area, including Jerusalem City (annual rainfall~200-700 mm) and the most arid zone of the Dead Sea, 20-30 km to the east (annual rainfall ~50 mm). The spatial-temporal variation of rainfall intensity is the main and not well-known driver that generates the majority of flash floods in the nearby Judean Desert. Hence, its monitoring is crucial in this area as in other remote arid areas worldwide.

Recently, extensive research was performed related to global warming potential risks and their effects on rainfall and temperature over the East Mediterranean. Several major risks were pointed out including extreme temperatures, heat waves, colder nights, and floods. Our first super-high-resolution global climate model projections projected that the ancient “Fertile Crescent” considered as the cradle of civilization, will nearly disappear by the year 2100 (Kitoh et al. 2008). Also, Jerusalem temperatures both maximum and minimum, show that significant increases occurred during 1950-2020 (homogenized dataset, Yosef et al., 2019). A fact that led to definition of the Mediterranean as a “Hot Spot” of global warming.

I-CHANGE is funded by EU Horizon 2020 grant 101037193.

References:

Kitoh, A. Yatagai and P. Alpert, Hydrolo. Res. Lett., 2, 1-4, 2008.

Rubin, Y.; Sohn, S.; Alpert, P. High-Resolution Humidity Observations Based on Commercial Microwave Links (CML) Data—Case of Tel Aviv Metropolitan Area. Remote Sens. 2023, 15, 345. https://doi.org/10.3390/rs15020345.

Y. Yosef, E. Aguilar and P. Alpert, "Changes in Extreme Temperature and Precipitation Indices: Using an Innovative Daily Homogenized Database in Israel". International Journal of Climatology, 1–24.  https://doi.org/10.1002/joc.6125‏, 2019.

How to cite: Alpert, P., Rubin, Y., Densy Campos1, G., Romantso, K., Haikin, N., Stupp, A., and Kishcha, P.: Challenges in climate change impact and risks in Jerusalem by the I-CHANGE Jerusalem Living Lab citizens science, EGU General Assembly 2024, Vienna, Austria, 14–19 Apr 2024, EGU24-4557, https://doi.org/10.5194/egusphere-egu24-4557, 2024.

EGU24-6110 | Posters virtual | ITS3.13/HS12.5 | Highlight

Can climate change training promote pro-environmental behavior in the long term? A pilot study with teenagers 

Francesca Munerol, Antonio Parodi, Lara Polo, Massimo Milelli, Nicola Loglisci, Nadia Rania, Fabrizio Bracco, and Ilaria Coppola

Environmental education (EE) programs are critically important. The EE within the EU Project "I-CHANGE" (https://ichange-project.eu/) aims at global citizenship, in order to generate new knowledge and new, more participatory and conscious ways of acting in the environment. The present study aims to verify the effectiveness of a training intervention based on education on the issues of climate change and on the active participation of the subjects in the small psychological group. 309 students participated in the intervention, equally distributed by gender (52.1% males), 64.4% enrolled in primary school and 35.6% enrolled in lower secondary school. A quantitative protocol was administered to evaluate the effectiveness of the intervention. The study shows an increase in pro-environmental behaviors and their stability even after 15-30 days. The intervention appears to be effective in triggering pro-environmental behaviors and maintaining them over time. The results of this study highlight the need to develop environmental education programs in schools to increase levels of knowledge and awareness on the topic of climate change.

How to cite: Munerol, F., Parodi, A., Polo, L., Milelli, M., Loglisci, N., Rania, N., Bracco, F., and Coppola, I.: Can climate change training promote pro-environmental behavior in the long term? A pilot study with teenagers, EGU General Assembly 2024, Vienna, Austria, 14–19 Apr 2024, EGU24-6110, https://doi.org/10.5194/egusphere-egu24-6110, 2024.

EGU24-7305 * | Orals | ITS3.13/HS12.5 | Highlight

Citizen science in schools to take climate action: uneven air pollution concentrations in Barcelona 

Laura Esbri, Yolanda Sola, Paola Barrera Bohórquez, Raül Marcos, Montserrat Llasat-Botija, Laura Ceraldi, and Maria Carmen Llasat

The city of Barcelona, like many urban centres, deals with the multifaceted challenges posed by air pollution. This abstract enlightens the pivotal role of citizen engagement and citizen science initiatives in catalysing awareness, understanding, and action against air pollution while addressing the broader context of climate change mitigation.

Barcelona's air quality is significantly impacted by anthropogenic activities. In 2022, population exposure to PM2.5 and NO2 tripled the health protection guidelines set by the WHO. Particulate matter concentrations returned to pre-pandemic levels and NO2 exceeded the legal limits in one district, averaging 42 µg/m3 annually (Rico et al., 2023). Long-term exposure to those levels is estimated to cause 1,500 deaths, 900 new childhood asthma cases, and 130 new lung cancer cases annually, with associate social costs over 1 billion and healthcare over 5 million euros. These pollutants not only pose immediate health risks but also contribute to the exacerbation of climate change. Urgent and stronger action is needed to reduce air pollution and safeguard public health.

Citizens, as stakeholders, are pivotal agents in effecting meaningful change. Citizen science initiatives, such as participatory monitoring networks and collaborative research endeavours, empower individuals to actively engage in collecting data, analysing trends, and disseminating information on air quality. This engagement not only fosters a deeper understanding of the intricacies of air pollution but also cultivates a sense of ownership and responsibility among citizens towards their environment. This is the goal of I-CHANGE Living Labs, to encourage behavioural changes and promote eco-friendly practices in everyday life, as individual actions to combat climate change and towards more sustainable patterns.

The Barcelona Living Lab on Extreme Events has partnered with schools of different socioeconomic backgrounds in Barcelona (as stakeholders and citizen scientists) to deploy six low-cost air quality sensors (Smart Citizen Kits) and five meteorological stations. This campaign has consisted of several implementation phases where the sensors were installed, teachers were trained, and workshops were carried out to develop curricular material for different primary and secondary school grades. Students work on projects to understand how the sensors work and the collected data. Within these projects, data is gathered for specific days when variations in pollution levels are observed. Differences between various neighbourhoods and districts (whit sensors) are compared. Students use this information to create hypotheses about potential causes and then try to verify them. Then they are encouraged to understand how air quality affects their daily life and what they and their families can do to improve it and become more resilient to climate change. This contribution shows the methodology followed to develop this collaboration and the different campaigns, the difficulties that had been overcame, and the potential of the co-creative process with schools

The I-CHANGE project has received funding from the European Union’s Horizon 2020 research and innovation program under grant agreement 101037193.


References:

Rico M, Font L, Arimon J, Gómez A, Realp E. Avaluació de la qualitat de l'aire a la ciutat de Barcelona 2022. Barcelona: Agència de Salut Pública de Barcelona; 2023 (Catalan).

How to cite: Esbri, L., Sola, Y., Barrera Bohórquez, P., Marcos, R., Llasat-Botija, M., Ceraldi, L., and Llasat, M. C.: Citizen science in schools to take climate action: uneven air pollution concentrations in Barcelona, EGU General Assembly 2024, Vienna, Austria, 14–19 Apr 2024, EGU24-7305, https://doi.org/10.5194/egusphere-egu24-7305, 2024.

EGU24-9460 | ECS | Posters on site | ITS3.13/HS12.5 | Highlight

Will extreme precipitation events like July 2021 become more frequent in the future? Insights from Belgium using MAR  

Josip Brajkovic, Sébastien Doutreloup, Nicolas Ghilain, Pierre Archambeau, Michel Pirotton, Kobe Vandelnotte, Fien Serras, and Xavier Fettweis

The July 2021 rainfall event that affected western Germany, the Netherlands and Belgium was of unprecedented intensity, reaching 170 mm of daily totals in some places. To estimate the probability of such events in the near and far future (up to 2100), the regional climate model MAR is used to run simulations at a resolution of 5 km. For this purpose, MAR is coupled with a set of 4 CMIP6 Earth System Models (ESMs) for 4 IPCC SSP scenarios over an area encompassing Belgium and Luxembourg.

An extreme value analysis is applied to the output for the period 1980-2100 for different rainfall durations (1 to 5 days). Our results show that such extreme precipitation events remain extreme throughout the century, but the probability of their occurrence increases by an order of 10 or more in the most pessimistic scenario. However, our analysis suggests that methodological choices can have a major impact on the results. In particular, the Peak Over Threshold approach shows larger changes in frequency than the Annual Maxima  approach, with less uncertainty in the results due to larger sample sizes of extreme events.


How to cite: Brajkovic, J., Doutreloup, S., Ghilain, N., Archambeau, P., Pirotton, M., Vandelnotte, K., Serras, F., and Fettweis, X.: Will extreme precipitation events like July 2021 become more frequent in the future? Insights from Belgium using MAR , EGU General Assembly 2024, Vienna, Austria, 14–19 Apr 2024, EGU24-9460, https://doi.org/10.5194/egusphere-egu24-9460, 2024.

The Dutch citizen science project Delft Measures (https://bit.ly/DelftMeasures) focuses on the collaboration between citizens, local institutions, and NGOs to map the weather and changing climate in the city of Delft. It has been running for 4 years, during which citizens of Delft measure long-term changes in rainfall patterns, temperature, and now also soil moisture in their private gardens. Currently, there are over 45 of the Alecto WS5500 citizen-science weather stations spread across neighborhoods in Delft, capturing rainfall variability in different urban microclimates. But in the past years, more than 100 different inhabitants have already been engaged and have helped to collect data.

The data is used by a diverse number of organizations like the National Meteorological Institute, the Delft University of Technology and the Delft Municipality, to answer different scientific, engineering, or policy questions. We collaborate with multiple NGOs in project execution. Considering the diverse interests of all stakeholders, the project addresses a variety of goals from education to improving climate adaptation to implementing open science practices.

All in all, the project grew into a successful co-creation between many different partners. Delft Measures has been growing and changing and it managed to reach a consistent base of enthusiastic citizens that support the goals of the project, engaging them in making changes in the city for climate change adaptation. For Delft, as a city below sea level, this means a better drainage network to deal with the larger showers of summer rain, while retaining water during longer periods of drought. By setting up secure collaborations with the municipality and university, the data citizens collect is used as direct input for the (future) efficiency of the municipality’s city-wide sewer and drainage network. For the university, this is valuable for education and research into how city infrastructure influences local weather patterns and the variability of rainfall, to understand better where high-intensity rainfall events will have the highest effect. Currently, such high spatial resolution on rainfall in cities is scarce. Additionally, the project functions as a case study for the university’s Open Science program, aiming to evaluate the implementation of open science practices in local citizen science projects, while NGOs invested in climate change adaptation in the city roll up their sleeves to help citizens make the practical changes needed for our new climate.

We are currently in the process of writing down the ‘recipe’ of Delft Measures, to help other cities implement similar projects and not to have to reinvent the wheel. We would like to share this recipe during this session, where we will answer questions such as how we manage to collect useful information and increase community involvement and awareness, what kind of participatory approaches we implemented to facilitate community involvement, how we tackle legitimate concerns about potential data biases, inaccuracies and how we ensure the long-term sustainability of the project.

How to cite: Vries, S. and Droste, A.: The Delft Measures Recipe: how to implement a similar citizen science project in other cities, EGU General Assembly 2024, Vienna, Austria, 14–19 Apr 2024, EGU24-11306, https://doi.org/10.5194/egusphere-egu24-11306, 2024.

EGU24-12303 | Posters on site | ITS3.13/HS12.5 | Highlight

The Varsom Regobs System: Enhancing Natural Hazard Forecasting, Community Preparedness and Recreational Outdoor Activities through In-situ Crowd-Sourcing Observations  

Solveig Havstad Winsvold, Jørgen Loe Kvalberg, Aron Widforss, Øystein Myhre, Rune Verpe Engeset, and Tore Humstad

The Varsom platform has been a success in Norway for more than a decade, with users from organizations and the public. It fosters a participatory approach encompassing recreational activities, hazard assessments, emergency preparedness, search and rescue, and forecasting. Here, we will present Varsom Regobs (Registering of Observations), an innovative crowd-sourced system within Varsom enabling registration, sharing, querying, and real-time storage and publication of field observations. Varsom Regobs aids decision-making for the warning services on snow avalanches, landslides, lake ice, and floods at the Norwegian Water Resources and Energy Directorate (NVE). Users utilize the Varsom app, website (www.regobs.no), and API to submit and retrieve diverse in-situ observations on the categories snow, ice, water, and soil, tailoring the level of detail. The app has gained widespread recognition within the community, boasting over 120,000 unique visitors between October 2023 and January 2024. In 2023 alone, a total of 22,000 observations across all categories were submitted. The app and website, available in multiple languages, have gained traction in numerous European countries, recording 500 observations outside Norway in 2023 thanks to the open-access policy.

One successful aspect of enhancing natural hazard and hydrology monitoring has been the reciprocal engagement with users, and specific examples showcasing this will be provided. To address trust issues regarding non-academic observers, a star-based quality system has been implemented, aligning with an observer's training courses. Moreover, all users must possess an NVE-account login to submit their observations. Other challenges, such as managing spam-like entries and delicately targeting and engaging specific user groups for each category, will also be highlighted.

Examples demonstrating the combined usage of the in-situ Varsom Regobs component, NVE's forecasting models, and NVE’s operational products derived from Copernicus satellite data will be showcased. The Regobs API v.5 ensures the utilization of observations in scientific projects by research institutes and universities. Varsom Regobs stands as a sustained citizen science initiative due to its integration into Norway's operational warning services, serving as an exemplary model for long-term engagement and collaboration.

How to cite: Winsvold, S. H., Kvalberg, J. L., Widforss, A., Myhre, Ø., Engeset, R. V., and Humstad, T.: The Varsom Regobs System: Enhancing Natural Hazard Forecasting, Community Preparedness and Recreational Outdoor Activities through In-situ Crowd-Sourcing Observations , EGU General Assembly 2024, Vienna, Austria, 14–19 Apr 2024, EGU24-12303, https://doi.org/10.5194/egusphere-egu24-12303, 2024.

EGU24-12308 | Posters on site | ITS3.13/HS12.5

BrantaSae: Sustaining Community-Driven Water Quality Sharing in the Brantas Catchment 

Reza Pramana, Runi Asmaranto, Tri Budi Prayogo, Daru Rini, Schuyler Houser, and Maurits Ertsen

Data scarcity and dispersion are pervasive challenges facing water and environmental managers in many contexts. Such is the case in the Brantas River basin in East Java, Indonesia, where water quality monitoring data and information on pollution sources and attendant management solutions has historically been dispersed and, therefore, challenging to apply in both research and policy analysis. In 2022, a multistakeholder project team launched a citizen science campaign and online data platform, BrantaSae, focusing on water quality monitoring in the Brantas catchment (approximately 12.000 km2). We enabled a local university to host this water quality database. Different communities and students of the local university itself were approached to contribute to this database through training sessions on how to upload, share, and oversee their data. In addition to facilitating the exchange of data, the platform allows communities and researchers to share challenges and solutions related to water quality improvement. BrantaSae serves as a potential clearinghouse for future collaboration and continuous learning amogst universities, communities, and other stakeholders including the local governmental agencies, emphasizing knowledge sharing in fostering a collaborative and informed community. As this research project concludes in 2024, it underscores the ongoing importance of BrantaSae in continuing to map water quality to expand our comprehension of the water quality in the catchment.

How to cite: Pramana, R., Asmaranto, R., Prayogo, T. B., Rini, D., Houser, S., and Ertsen, M.: BrantaSae: Sustaining Community-Driven Water Quality Sharing in the Brantas Catchment, EGU General Assembly 2024, Vienna, Austria, 14–19 Apr 2024, EGU24-12308, https://doi.org/10.5194/egusphere-egu24-12308, 2024.

EGU24-15308 | ECS | Orals | ITS3.13/HS12.5

AGORA as the bridge between local actors and communities: objectives and experiences in the Italian Pilot (the city of Rome) 

Alfredo Reder, Marianna Adinolfi, Marta Ellena, Marina Mattera, Paola Mercogliano, and Edoardo Zanchini Di Castiglionchio

Numerous obstacles hinder societal transformation toward a climate-resilient future, often rooted in underlying assumptions prevalent across various domains, including civil society, the public/private sector, and politics. AGORA is a HORIZON Europe project (Grant agreement ID: 101093921) whose aim is to support communities and regions to overcome these obstacles in climate change adaptation. It started in January 2023 and will have a total duration of 3 years.

This initiative supports the EU Mission on Adaptation to Climate Change through four main pillars:

  • Conduction four Pilots in different countries (i.e., Spain – Zaragoza; Italy – Rome; Sweden – Malmö; and Germany –Dresden), focusing on workshops and implementing co-creation strategies;
  • Developing improved strategies by understanding stakeholders' needs and climate change risks; over 50 cross-disciplinary stakeholders, including followers from non-Pilot countries like Portugal, are interested in applying the lessons learned;
  • Empowering local communities through societal transformation; it assesses learning tool needs, hosts workshops on pressing issues, and creates digital tools like a Digital Agora, two digital Academies, and an App – a challenging game for simultaneous entertainment and learning;
  • Evaluating climate change policies in different countries and designing adaptation strategies using participatory democratic.

In the last year, various activities took place in the four AGORA pilot regions, including inception workshops aimed at bringing together different stakeholders on climate adaptation. These workshops specifically focused on identifying vulnerability, risk drivers, and gaps in local adaptive capacity. The goal was to assess vulnerabilities to expected climate hazards, aligning adaptation priorities with the needs of local communities and fostering community strengthening.

Regarding the city of Rome, the inception workshop aligned with the development activities of the city’s Climate Change Adaptation Strategy. The event aimed to foster a fruitful discussion among various local stakeholders regarding adaptation to the anticipated impacts of climate change across multiple sectors (Water - encompassing resource management, drought, and impacts related to precipitation; urban settlements; networks and infrastructure; cultural heritage; health; socioeconomic system; marine and coastal system; agricultural and livestock system; biodiversity and ecosystems). These sectors were identified as key areas most susceptible to risk during the formulation of the Climate Change Adaptation Strategy. The objective was to define the main socioeconomic, structural, and environmental vulnerabilities, as well as the primary needs and critical issues related to the adaptive capacity of the territory and its citizens for each sector under examination.

Through a multidisciplinary, integrated approach, AGORA is a growing, dynamic, pan-European community that creates and shares advanced digital tools to enhance awareness. Informed citizens can actively participate and contribute to ensure safe and sustainable development. Hence the project is the meeting point where citizens share knowledge, practices, expertise and needs, interacting with sciences to design and build a more resilient Europe through a living dialogue between local communities.

How to cite: Reder, A., Adinolfi, M., Ellena, M., Mattera, M., Mercogliano, P., and Zanchini Di Castiglionchio, E.: AGORA as the bridge between local actors and communities: objectives and experiences in the Italian Pilot (the city of Rome), EGU General Assembly 2024, Vienna, Austria, 14–19 Apr 2024, EGU24-15308, https://doi.org/10.5194/egusphere-egu24-15308, 2024.

EGU24-15715 | Posters on site | ITS3.13/HS12.5

The role of citizen science to assess the spatiotemporal pattern of rainfall events in urban areas: a case study in the city of Genoa, Italy 

Giorgio Boni, Arianna Cauteruccio, Francesco Faccini, Nicola Loglisci, Guido Paliaga, and Antonio Parodi

Short-duration and high-intensity rainfall events in the Mediterranean region, enhanced by climate change, produce floodings in cities characterized by a limited extension of the urban catchment area, a high percentage of impervious surfaces and the inefficiency of the urban drainage system. In the present work the historic center of the city of Genoa (Italy) was assumed as a case study. In this area, the spatial variability of intense rainfall events is significant, even across a limited portion of the territory as demonstrated by analysing five rainfall time series (12 years of data) recorded at high-resolution from authoritative rain gauges.

A specific rainfall event that produced floodings on August 27th - 28th, 2023, is analysed with particular focus on the synoptic and mesoscale analysis and assessing the contribution of citizen science rain gauge stations (provided by Acronet network, see e.g., Fedi et al., 2013) to detect the magnitude and spatial distribution of this event.  The comparison between cumulated rain as recorded by the authoritative and citizen science networks shows that the convective nature of the phenomenon results in extremely diverse effects on the territory with very localized intense showers.

The introduction of citizen science observations allowed a better understanding of the spatiotemporal structure of the investigated rainfall event that caused flooding in the study area. In the future, a more structured use of this information, associated to appropriate validation procedures, can provide a fundamental contribution to risk management in densely urbanized areas such as the historic centers of many Mediterranean coastal cities.

Fedi, A., Ferrari, D., Lima, M., Pintus, F., Versace, C., Boni, G., (2013). The “ACRONET paradigm”, an “open hardware” project. Open Water Journal, 2(1), 7.

This study was carried out within the RETURN Extended Partnership and received funding from the European Union Next-GenerationEU (National Recovery and Resilience Plan – NRRP, Mission 4, Component 2, Investment 1.3 – D.D. 1243 2/8/2022, PE0000005) and from the European Union's Horizon 2020 I-CHANGE project ( https://cordis.europa.eu/project/id/101037193).

How to cite: Boni, G., Cauteruccio, A., Faccini, F., Loglisci, N., Paliaga, G., and Parodi, A.: The role of citizen science to assess the spatiotemporal pattern of rainfall events in urban areas: a case study in the city of Genoa, Italy, EGU General Assembly 2024, Vienna, Austria, 14–19 Apr 2024, EGU24-15715, https://doi.org/10.5194/egusphere-egu24-15715, 2024.

RiverSnap is a citizen science project as part of the joint project “Zukunftslabor Wasser” that transforms smartphones into measuring instruments for monitoring and analyzing river parameters, responsive to water level changes, natural hazards (e.g., floods), and anthropogenic-induced alterations. A robust stainless-steel smartphone frame is strategically located on or near a bridge for convenient public access to capture river images. This frame facilitates precise image positioning, enabling the capture of river scene images of a predefined and referenced river area that can be uploaded to a centralized database, shared on social media, or sent via email. This collaborative endeavor establishes a community-driven repository documenting river changes over time. Due to water's dynamic nature and structural and sky reflections in close-range images, the RiverSnap project utilizes and develops novel Artificial intelligence (AI) algorithms to extract and predict hydrologic parameters and features.

These advanced algorithms are crucial in detecting water lines, determining positions, and mapping various riverine features with scientific precision. Through this sophisticated technology, RiverSnap transforms community snapshots and additional measurements into a valuable resource for scientifically assessing and understanding alterations in the river environment. As the AI models are data-hungry, RiverSnap is diligently creating benchmark datasets for river water, facilitating the development and training of robust machine learning algorithms. These datasets serve as comprehensive references, allowing the AI models to enhance their understanding of various hydrological patterns, ultimately improving the accuracy and effectiveness of river parameter predictions and feature extractions.

Established in 2023 in Hannover, Germany, the RiverSnap station network has observed significant growth, now covering four monitoring locations around Hannover. Recognizing the pivotal role of detecting the water surface area in approximating riverine parameters, we have developed and implemented various advanced Deep Learning (DL) models for water body segmentation. As part of this initiative, a novel river water dataset named RiverSnap.v1, including 1092 images, has been introduced and is constantly updated. Additionally, various methods have been investigated to geo-reference the analyzed results. In a straightforward approach, artificial or natural markers, such as specific locations of objects around the river or on bridges, were measured with geomatics tools like GNSS receivers and total stations. The DL-extracted water surface was then georeferenced based on these markers to obtain results like the water level. A 3D terrain model derived from LiDAR data or photogrammetric techniques like Structure from Motion (SfM) can be utilized for Geo-referencing parameters and results in more advanced scenarios. This allows for automatically assigning absolute coordinates to each image and subsequent camera pose estimation.

Examples of practical applications of RiverSnap include monitoring high-frequency water level and water line changes and morphological changes in rivers, lakes, wetlands, and urban areas. Additionally, RiverSnap is instrumental in monitoring extended flood areas and observing the time sequence of a flooding event, as demonstrated in data of a German flood of 01/2024.

Funding: This study was performed as part of the joint research project „Zukunftslabor Wasser“ funded by the Lower-Saxon Ministry of Research and Culture (FKZ: 11-76251-1873/2022 (ZN3994))

How to cite: Moghimi, A. and Welzel, M.: RiverSnap: A citizen science project to monitor and Analyse riverine hydrological parameters from close-range remote sensing images, EGU General Assembly 2024, Vienna, Austria, 14–19 Apr 2024, EGU24-16082, https://doi.org/10.5194/egusphere-egu24-16082, 2024.

Scientific research around water security and water quality in the Peruvian Andes often excludes local perspective and knowledge, yet local water users not only directly depend on local water sources, but are also sensitive to changes in water availability, quality, and ecosystems over time. Increasing community involvement and representation is essential for improved understanding and more holistic, sustainable water resource management, however more participatory approaches with local communities often have a myriad of logistical and project constraints. Through a small GCRF funded pilot study, as part of an interdisciplinary and international research team we created and rolled out a smartphone photo elicitation app, “Nuestro Rio”, as a novel tool to gather insights into local perceptions of water quality in the Rio Santa basin, Peruivan Andes (2020-2022). Here we consider the ability of technological approaches such as our Nuestro Rio app to help address some key issues and improve research outcomes to the benefit of the research team and local communities, whilst reflecting on the challenges experienced. Sharing the lessons learnt from pilot projects like Nuestro Rio can help contribute to the growing dialogue on citizen science and participatory approaches, whilst also providing support and guidance for those currently planning or exploring similar research tools and projects.

How to cite: Rangecroft, S. and Clason, C.: Lessons from the Nuestro Rio app: Reflections on exploring local perspectives on water quality in the Peruvian Andes, EGU General Assembly 2024, Vienna, Austria, 14–19 Apr 2024, EGU24-17217, https://doi.org/10.5194/egusphere-egu24-17217, 2024.

EGU24-17417 | Posters on site | ITS3.13/HS12.5

Bringing the gap among citizens and ICT tools through storytelling to testify the local impacts of climate change during time 

Paola Salvati, Giuseppe Esposito, Simone Facchinetti, Ivan Marchesini, Umberto Mezzacapo, Simone Sterlacchini, Debora Voltolina, and Antonella Galizia

Citizen science is increasingly used to engage the public in scientific processes to raise awareness and promote actions towards climate change and sustainability. In addition, citizen science initiatives allow the creation of multidisciplinary contexts engaging citizens, and also stakeholders, to foster scientific awareness and active participation to the definition of adaptation actions. With this vision in mind, this abstract describes the citizen science activities set in the municipality of Chiavari (Genoa metropolitan area), where different agreements have been signed with the municipal administration, municipal Civil Protection and two high schools to launch training programs started in May 2023. 
The training activities consider the use of a webapp for landslides and flood reporting to describe past geo-hydrological events. The webapp provides a form aimed at describing the characteristics (speed of the run, height of the water, etc.) a specific phenomenon occurred in a specific date; the output result is a map of the reports. The webapp is based on KoboToolbox, an open source software to create reports and geolocating entities, and students exploit it through their mobiles, and/or the device they prefer. A first field campaign was organized to collect local data and experiences via interviews (and storytelling) with local persons; the campaign was highly impacting for the students since there were also able to reconstruct a local historical memory. In a following meeting, students accessed (via QRcode) videos and/or images of the event with the aim of locate the site observed in the images/videos and compared their map with ARPAL official observation of the event. 
The presentation will outline the entire initiative, from the engagement to the webapp while reporting how the historical local interviews emphasized the actual impact of climate change in our own urban environments. The work is developed within the H2020 projects I-CHANGE (Individual Change of HAbits Needed for Green European transition).

How to cite: Salvati, P., Esposito, G., Facchinetti, S., Marchesini, I., Mezzacapo, U., Sterlacchini, S., Voltolina, D., and Galizia, A.: Bringing the gap among citizens and ICT tools through storytelling to testify the local impacts of climate change during time, EGU General Assembly 2024, Vienna, Austria, 14–19 Apr 2024, EGU24-17417, https://doi.org/10.5194/egusphere-egu24-17417, 2024.

EGU24-19094 | Orals | ITS3.13/HS12.5

Building up a Digital Academy in AGORA project to aware citizens, improve access to and use of climate data supporting adaptation 

Marianna Adinolfi, Alfredo Reder, Paola Mercogliano, Andreas Hoy, Massimo Milelli, and Riccardo Biondi

The AGORA (https://adaptationagora.eu/) project aims to support communities and regions exploiting a broad range of approaches, mechanisms and initiatives to meaningfully and effectively engage citizens, civil society organisations, academics, experts, policy-makers, entrepreneurs, marginalities and other relevant actors in all the transformation steps towards a climate-resilient Europe. Beyond the state-of-the-art, AGORA aims to promote societal transformational processes through transdisciplinary tools and approaches in different social, economic and political contexts.  The ambition is to accelerate and enhance the adaptation process by sharing innovative problem-oriented climate adaptation solutions that could be widely adopted across Europe, considering societal transformations and the awareness that there is no one-size-fits-all solution. A set of pilot regions in Italy, Sweden, Germany, and Spain constitutes the co-production arena to co-design, co-develop, and co-implement climate adaptation solutions through specific-context in-person activities (for engagement, capacity building, governance and tackling disinformation). Regions and Communities joining the Mission on Adaptation will also be involved as followers feeding and learning from the AGORA initiative. A roadmap for transformative change and large-scale citizen engagement will be developed to transfer effective policy instruments and ensure a long-term legacy, promoting climate justice, gender equality and equity. AGORA's legacy will be to increase citizens' adaptive capacity and empowerment to proactively support decision-making processes and transformative potential to anticipate innovative behaviour. The pillar of the AGORA project consists in the Digital AGORA, an online space that supports citizens, local government, municipal services and networks, and communities to play a relevant and conscious role in co-developed decision-making processes. It will host two Digital Academies that will aspire to guide and support the targeted audiences to access and use Climate Data and to monitor Climate Risks, and to oppose Climate Change Disinformation. The main goal of the former Digital Academy is to facilitate access and usage of high quality, open source Climate Data as well as Climate Risks Data. The goal is achieved by mapping existing data, sources and platforms that will be gathered in “ad hoc built” inventories on climate data, adaptation and climate risk hubs. The second goal is to empower citizens, stakeholders and policy makers through technical reports and training documents on how to access and use climate data for adaptation. In this perspective, the Digital Academy is based on courses with key scientific information on the usage of climate data at different level of knowledge (entry, base and advanced level). The last goal is to promote information and initiatives fostering climate adaptation supported by citizen science activities. The Digital Academy to access and use Climate Data and to monitor Climate Risks is co-designed and co-developed in different public events, as ECCA (www.ecca2023.eu) and SISC conference 2023 (www.sisclima.it). Such events allowed to connect climate adaptation practitioners with the scientific community, to gather the users’ requirements and provide suggestions and ideas for the advancements in the building up of the Digital Academy.

How to cite: Adinolfi, M., Reder, A., Mercogliano, P., Hoy, A., Milelli, M., and Biondi, R.: Building up a Digital Academy in AGORA project to aware citizens, improve access to and use of climate data supporting adaptation, EGU General Assembly 2024, Vienna, Austria, 14–19 Apr 2024, EGU24-19094, https://doi.org/10.5194/egusphere-egu24-19094, 2024.

EGU24-19298 | Orals | ITS3.13/HS12.5

Eyes on the Water: Leveraging Citizen Photos and AI for River Health Assessment and Management 

Ho Tin Hung, Daniel Pearce, Li-Pen Wang, Susana Ochoa-Rodriguez, and Amy Jones

River pollution is a global challenge recognized as unacceptable by citizens. Despite increasing awareness and investment in river water quality monitoring worldwide, current monitoring strategies fail to well characterise river health. In particular, the spatial and temporal resolution at which river health is currently monitored is insufficient and falls short to identify e.g., pollution spikes and point pollution sources. At the same time, the rise in citizen engagement in river monitoring, driven by increased awareness and widespread availability of smart phones and other monitoring technologies, has generated opportunities to overcome current monitoring barriers. 


In this paper, we share our experience collaborating with the community group Friends of Bradford’s Becks (FoBB, UK) to use citizen-collected photos for AI-based detection of health indicators, leading to enhanced river health management. More specifically, FoBB has collected around 100,000 photos of the streams that flow through and under Bradford. These images offer insights into the health of the becks, including specific pollution issues such as discharging overflows, sewage litter, discolouration, amongst other things, as well as how pollution has changed in time and space. The number of photos makes analysis challenging. In this project, we used AI models for automatic image labelling and prototyped several landing solutions for embedding the labelling model into a tool usable by citizens.


The project was initially set up in a Hackathon, funded by Natural England, and aimed to develop solutions using AI models. The landing solutions employed classification and object detection deep learning models to assist citizens by offering automatic detection of river health indicators. This not only reduces the cost of reporting but also improves the quality of reporting with comprehensive labels. Through community engagement, high spatio-temporal resolution data can be collected from citizens to fill the data gaps, including pollution levels, natural habitat conditions, and biodiversity. Additionally, while collecting the data, the deep learning models can be further fine-tuned to better assist citizens and managers in river health assessment and management. In summary, the project presents a holistic approach to river health management, combining the strengths of AI with the insights and engagement of local communities. The success of this approach in Bradford offers a template for similar initiatives globally, marking a step towards more informed and responsive river health management strategies.

How to cite: Hung, H. T., Pearce, D., Wang, L.-P., Ochoa-Rodriguez, S., and Jones, A.: Eyes on the Water: Leveraging Citizen Photos and AI for River Health Assessment and Management, EGU General Assembly 2024, Vienna, Austria, 14–19 Apr 2024, EGU24-19298, https://doi.org/10.5194/egusphere-egu24-19298, 2024.

EGU24-20151 | Orals | ITS3.13/HS12.5

Citizen Science in Meteorology: Enhancing weather understanding through innovative instrumentation and community engagement 

Nicola Loglisci, Antonella Galizia, Antonio Parodi, Timoteo Galia, Juri Iurato, and Roberto Monni

Meteorology and climatology have their foundations in the observation of the main meteorological variables. They constitute an essential tool for understanding the meteorological situation in operational forecasting activity, for the construction of the initial conditions for numerical integration in both deterministic and probabilistic models, as well as for the construction of time series for climate analysis.

Moreover, the assimilation of local meteorological observations to the global observational network, plays a crucial role in refining meteorological predictions.

I-CHANGE project offers an in-depth exploration of Citizen Science, emphasizing the use of innovative instrumentation to actively engage citizens in collecting meteorological data. Through the use of advanced sensors, mobile apps, and emerging technologies such as Meteotracker, our project aims to transform individuals into true "citizen scientists," making a significant contribution to the understanding of atmospheric phenomena.

We present a case study illustrating the integration of state-of-the-art instrumentation with community participation in Living Labs, highlighting how Citizen Science can enrich meteorological research. We discuss the challenges and opportunities of this approach, emphasizing the validity of community-collected data and its impact on the accuracy of local weather forecasts.

How to cite: Loglisci, N., Galizia, A., Parodi, A., Galia, T., Iurato, J., and Monni, R.: Citizen Science in Meteorology: Enhancing weather understanding through innovative instrumentation and community engagement, EGU General Assembly 2024, Vienna, Austria, 14–19 Apr 2024, EGU24-20151, https://doi.org/10.5194/egusphere-egu24-20151, 2024.

EGU24-20663 | ECS | Posters on site | ITS3.13/HS12.5

A Freshwater Conservation project: A Joint initiative between academia, environmental associations and companies. 

Alessio Polvani, Amedeo Boldrini, Luisa Galgani, and Steven Arthur Loiselle

Citizen science involves the participation of the public in research projects to enhance scientific knowledge. This kind of activities could bring advantages on the scientific, societal, educational and policy making levels. In the last decade, the breakout of citizen science has raised awareness across all segments of society. Major companies have begun actively participating in public participatory monitoring projects. In this case study, the University of Siena, Legambiente, and the Prada Group joined forces to support a freshwater monitoring project in an industrial area. 

The monitoring is conducted using the FreshWater Watch methodology, a well-established and scientifically validated approach used by citizens worldwide. This approach is based on visual observations and on the analysis of target freshwater parameters like nutrients and turbidity. Additionally, samples are also taken for ICP-MS analysis to provide a spatial coverage of metals presence in freshwaters. 

The project, started in October 2023, has so far proven successful in engaging stakeholders from environmental associations and workers of a renowned fashion brand, thus already providing valuable data from freshwater bodies in an industrial and urbanized area. The surveys, which will last for a year at least, are mostly conducted in the Valdarno region (Tuscany, Italy) on the Arno River and its tributaries and the data collected can be potentially used to support environmental agencies monitoring strategies.

This talk will present analytical methods and results from the surveys up to now (> 100), and will discuss how the data collected are not only scientifically useful, but also demonstrate an important societal impact of the project and an active stewardship of aquatic ecosystems by the participating stakeholders.

How to cite: Polvani, A., Boldrini, A., Galgani, L., and Loiselle, S. A.: A Freshwater Conservation project: A Joint initiative between academia, environmental associations and companies., EGU General Assembly 2024, Vienna, Austria, 14–19 Apr 2024, EGU24-20663, https://doi.org/10.5194/egusphere-egu24-20663, 2024.

The skills, knowledge, values and rules of common resources management, like surface and groundwater in the M’zab valley (Algeria), are transmitted for centuries from one generation to another orally and on the field through observation and participation in the agricultural and water distribution tasks from a very young age. However, the continuity of intergenerational transfer of traditional knowledge faces challenges. Alterations of the water cycle related to climate change, mainly resulted in water scarcity, and technological transformations like the introduction of mechanised individual pumps, have disrupted the traditional collective organisation and challenged the intergenerational transmission of water management knowledge that prevailed in traditional systems. This has caused a loss of interest among the younger generation in their traditional knowledge around the governance of water resources. The participatory visual approach can facilitate community involvement in different citizen science projects. Our work explored how this approach can be used to address traditional knowledge holders’ concern about how to involve the younger generation in the groundwater management. We propose integrating different forms of knowledge- the research and video made by professional researchers, as well as the videos by four local scouts belonging to the M'zab oasis community.

The experience of participatory video enabled the four scouts to achieve three main things. Firstly, their involvement in concrete and practical projects enabled them to seek out information from knowledge holders from different backgrounds, deepen their own knowledge about the community-managed groundwater recharge and use system groundwater recharge and use system, acquire new skills (i.e. audio-visual and editing), express their perception and vision. Secondly, the four scouts used participatory video combining images and narrative to creatively and engagingly denounce two major environmental problems. Finally, the scouts used the potential of video to launch a call to action, building on the power of images and the emotions that those images can elicit.

Moreover, the interaction between research and artistic methods enables knowledge to be co-produced in a more dynamic and creative way. It also enables to overcome academia's bias against non-academic data. In our case study, the co-production of knowledge is crucial to raise awareness among young people. We believe that connecting different knowledge systems, traditional and scientific expertise, and emotions, can contribute to more sustainable governance of common resources like groundwater, by remembering the past, documenting the present and imagining the future.

How to cite: Hamamouche, M. F., Saidani, M. A., and Fantini, E.: Citizen science project in the M’zab valley oases (Algeria): Making groundwater management visible to young generations through the participatory visual approach, EGU General Assembly 2024, Vienna, Austria, 14–19 Apr 2024, EGU24-21142, https://doi.org/10.5194/egusphere-egu24-21142, 2024.

EGU24-22235 | Posters virtual | ITS3.13/HS12.5

Citizen science and Databases in Agriculture 

ஆனந்தராஜா (Anandaraja) நல்லுசாமி (Nallusamy), Julien Malard-Adam, Ponnusamy Murugan Prithivimangalam, Senthilkumar Manivasagam, and Jaisridhar Palanivelan

Data science and information technologies hold great promise for better decision-making in agriculture, from post-harvest management to value addition, market access and exports. Farmers in India can be reached by different ways, including written and voice messages, pre-recorded videos, and online workshops, each of which must be underpinned by diverse datasets and databases in order to be successful.

In the face of climate and environmental change, national and regional governments are currently encouraging the adoption of micro-irrigation for water conservation and the expansion of irrigated areas in India. At the same time, communities in rain-fed areas must use local water bodies and ponds to store and later use water from heavy rainfall for later irrigation. Meaningful participation of rural communities in development programmes, protection of water resources and agricultural technology adoption is crucial to ensuring societal change. At the same time, data collection and appropriate outreach strategies are necessary in order for this level participation to be possible.

Integrated and diverse database technological stacks can therefore be used to reach farmers and provide appropriate recommendations for field management even in regions without reliable internet connections. The approaches used must be simple for agricultural students, officers, and university researchers to reach farmers and the general population, and should include a variety of computer software, cellphone and virtual communication channels.

How to cite: நல்லுசாமி (Nallusamy), ஆ. (., Malard-Adam, J., Prithivimangalam, P. M., Manivasagam, S., and Palanivelan, J.: Citizen science and Databases in Agriculture, EGU General Assembly 2024, Vienna, Austria, 14–19 Apr 2024, EGU24-22235, https://doi.org/10.5194/egusphere-egu24-22235, 2024.

Plastic debris of size < 5mm are considered as microplastics and are serious concern in the present world due to its persistent nature and ubiquitousness in every spheres of the environment. Waste Water Treatment Plants (WWTP) are one of the main point sources of microplastic to the environment. The primary objective of this study was to identify and characterize microplastics present in wastewater from the dairy industry and to suggest effective management practices for their efficient removal before the effluent is discharged into the environment. The samples were collected from the influents to the WWTP, Aeration-tank, Clarifier, Final-effluent and sludge. The microplastic extraction were done by digestion (30%-H2O2) and density separation (NaCl and NaI) method. Micro-Raman spectroscopy, SEM and SEM-EDS techniques were used for the identification and characterization of microplastics. The findings indicated that the sludge from the WWTP contained a significantly higher particle count (2560 particles/g) compared to the water samples (38 particles/L). Microplastics of different shapes were identified in the study, its abundance is in the following order: fragments>films/sheets>pellets> foam. The size of microplastics ranges from 20µm to 2500 µm and the highest abundance observed in the range between 100-500 µm. Most of the microplastics were transparent (46.87 %), white (31.26%) and blue (15.62%) in color. Seven different varieties of microplastic such as Polyamide, Polyethylene, Poly-vinyl-chloride, Polypropylene, Low-density-polyethylene, Polyurethanes, Nylon were identified. Polyethylene is the predominant microplastic found in all the samples (62.49%) followed by Polypropylene (11.72%) and Poly-vinyl-chloride (9.37%) respectively. Polyurethane (7.81%) and Nylon (3.9%) were found only in sludge samples. SEM images showed cracks, pores (480 nm to 998 nm), fractures on the surface and are prone to breakdown. Some of the microplastics exhibit signs of being colonized by microorganisms or particle-like structures within cracks, signifying the presence of high surface area. It would increase the chance to attach contaminants, resistant microbes and other pollutants to microplastic when discharged/exposed to more complex environment and elevate its toxicity. SEM-EDS analysis shows microplastics association with metals (Mg, Al, Na, Si, Ca, Fe, Pd). The economical and expeditious solution for microplastic removal is to improve, the current treatment process instead of finding a new method. Some recommendations to enhance the removal of microplastics include lengthening the retention time in the sedimentation/skimming processes, altering the materials in the filtration-units, and improving the flocculation/coagulation methods. For example, aluminum-based coagulant is more effective in eliminating microplastic than Fe and polyacrylamide-based coagulant to reduce, comparatively high microplastics content in the influent and aeration-tank. The extraction of microplastic in fat-trap stage using grease and subsequent pyrolysis prevents larger particles to enter the system and helping to curb the elevated concentration of microplastic in sludge. Co-pyrolysis with biomass and hydrothermal reactions can also be adopted. Recommendations for efficient microplastics management practices were also proposed.

How to cite: Vilambukattu Appukuttan Pillai, S. and Udayar Pillai, S.: Identification, characterization and the removal of Microplastic, a persistent neo-contaminant from Dairy Waste Water Treatment Plant (WWTP), EGU General Assembly 2024, Vienna, Austria, 14–19 Apr 2024, EGU24-3011, https://doi.org/10.5194/egusphere-egu24-3011, 2024.

EGU24-3193 | ECS | PICO | ITS3.24/HS12.9

Studying the Presence and Distribution of Microplastics in a Norfolk Salt Marsh 

Benjamin Grover and Stefanie Nolte

As a rising global pollution issue, microplastics have been discovered in every major environment around the world. Marine and coastal ecosystems in particular are often highlighted for the presence and impacts of plastic pollution; however, salt marshes are quickly gaining interest, and concern, as potential traps and long-term sinks for microplastics.

Fundamental sedimentation processes within salt marshes are hypothesised to be ideal for microplastic accumulation, as well as potential abundant physical trapping from vegetation. Salt marshes also provide ideal natural conditions that promote the breakdown and degradation of plastic, thus leading to several different incoming sources of microplastic. With several possible plastic inputs, there is the potential for high microplastic concentration in salt marshes, however when compared to other coastal ecosystems, there are very few studies within this habitat and so plastic levels are largely unknown.

As habitats with important ecosystem services such as biodiversity and carbon storage, it is critical that we improve our understanding of the impacts which microplastics may have upon salt marshes. However, to do this we must first understand what the spread of microplastics in this environment is. This project hopes to measure the amount of microplastics in a natural salt marsh, focussing on their spatial distribution throughout the marsh and neighbouring mudflats. From this initial location data, we will then investigate the impact of physical marsh attributes on any distribution trends and see how much the amount of microplastics across the marsh can be explained by these factors.

How to cite: Grover, B. and Nolte, S.: Studying the Presence and Distribution of Microplastics in a Norfolk Salt Marsh, EGU General Assembly 2024, Vienna, Austria, 14–19 Apr 2024, EGU24-3193, https://doi.org/10.5194/egusphere-egu24-3193, 2024.

EGU24-3999 | PICO | ITS3.24/HS12.9

Plastic pollution monitoring in the wrack line: baseline and seasonality trends along several coastlines from Brittany (Erquy, France) 

Sébastien Rohais, Camille Lacroix, Kevin Tallec, Marine Paul, and Silvère André

Plastic pollution is acknowledged across all environmental compartments, ranging from high mountain ranges to the deepest abyssal plains. It has been identified in the lithosphere (sediment), hydrosphere (water bodies), atmosphere (air), and biosphere (living organisms). In this context of ubiquitous pollution, beaches, and in particular the wrack line, are commonly used as monitoring sites for plastic pollution. There are established monitoring programs to track plastic pollution at different scales along beaches, such as the OSPAR beach litter monitoring program at the North-East Atlantic scale or the French monitoring program for meso- and large microplastics on beaches.

This study aims to build upon the expertise and experience gained from existing monitoring programs to provide a comprehensive approach for understanding the processes of plastic influx, accumulation, and impregnation on beaches. Four types of coasts were selected in Brittany (Erquy, France) to represent various configurations: (i) Accreting sandy beach, (ii) Eroding sandy beach, (iii) Protected cliff (iv) Exposed cliff. The study covers a period from August 2022 to August 2023, where bimonthly statements were conducted, resulting in seven dataset collection points (308 measurements). Each of the four sectors, measuring 100 meters along the wrack line, was studied using eleven 40x40 cm quadrats spaced every 10 meters. The top centimeter of sand was collected using a trowel and filtered through a 1mm mesh sieve. Seawater flotation was employed to separate and recover plastics.

Plastics were then classified into three categories: large microplastic (1-5mm, LMP), mesoplastic (5-25mm) and macroplastics (>25mm). Plastics were counted and weighed within each category. Four indicators were quantified to monitor potential sources of plastic pollution: (i) "Pellet" indicator of chronic or accidental losses along the plastic production chain, (ii) "Port" indicator for port and related recreational activities, (iii) "WWTP" indicator for water network management issues, (iv) "Butt" indicator for activities linked to the improper disposal of cigarette butts.

Results are presented in the form of box plots providing rich information illustrating variability, outliers, and the overall distribution of quadrat measurements. The maximum value by quadrat reaches 706 items/m2 of wrack line. The annual survey provides baseline values for different coast types of 106, 39, 39 and 3 items/m2 of wrack line for accreting sandy beach, eroding sandy beach, protected cliff, and exposed cliff, respectively. Out of the total 308 measurements, 82 of them have the smallest value possible, which is 0. Principal Component Analysis (PCA) was finally carried out to understand the importance of various environmental factors (e.g., wind, wave, tidal range) on the influx, accumulation, and distribution of plastics along the wrack line.

By combining surveys across different coastal types in a specific region, this work enhances the understanding of the dynamics of plastic pollution, especially to implement effective environmental monitoring strategies.

How to cite: Rohais, S., Lacroix, C., Tallec, K., Paul, M., and André, S.: Plastic pollution monitoring in the wrack line: baseline and seasonality trends along several coastlines from Brittany (Erquy, France), EGU General Assembly 2024, Vienna, Austria, 14–19 Apr 2024, EGU24-3999, https://doi.org/10.5194/egusphere-egu24-3999, 2024.

EGU24-5250 | ECS | PICO | ITS3.24/HS12.9 | Highlight

Defining Plastic Pollution Hotspots 

Paolo Tasseron, Tim van Emmerik, Paul Vriend, Rahel Hauk, Francesca Alberti, Yvette Mellink, and Martine van der Ploeg

Plastic pollution in the natural environment poses a growing threat to ecosystems and human health, prompting urgent needs for monitoring, prevention and clean-up measures, and new policies. To effectively prioritize resource allocation and mitigation strategies, it is key to identify and define plastic hotspots. UNEP's draft global agreement on plastic pollution mandates prioritizing hotspots, suggesting a potential need for a defined term. Yet, the delineation of hotspots varies considerably across plastic pollution studies, and a definition is often lacking or inconsistent without a clear purpose and boundaries of the term. In this paper, we applied four common hotspot definitions to plastic pollution datasets ranging from urban areas to a global scale. For each scale, hotspots were defined according to 1) values above the average of the dataset, 2) values in the highest interval, 3) outliers, and 4) values exceeding the 90th percentile. Our findings reveal that these hotspot definitions encompass between 0.8% to 93.3% of the total plastic pollution, covering <0.1% to 50.3% of the total locations. Given this wide range of results and the possibility of temporal inconsistency in hotspots, we emphasize the need for fit-for-purpose criteria and a unified approach to defining plastic hotspots. Therefore, we designed a step-wise framework to define hotspots by determining the purpose, units, spatial scale, temporal scale, and threshold values. Incorporating these steps in research and policymaking yields a harmonized definition of hotspots, facilitating the development of effective plastic pollution prevention and reduction measures.

How to cite: Tasseron, P., van Emmerik, T., Vriend, P., Hauk, R., Alberti, F., Mellink, Y., and van der Ploeg, M.: Defining Plastic Pollution Hotspots, EGU General Assembly 2024, Vienna, Austria, 14–19 Apr 2024, EGU24-5250, https://doi.org/10.5194/egusphere-egu24-5250, 2024.

EGU24-5672 | ECS | PICO | ITS3.24/HS12.9

Analysis of the interactions between coastal morphodynamic processes and Beach Litter distribution.  

Angela Rizzo, Angelo Sozio, Giorgio Anfuso, Marco La Salandra, and Corrado Sasso

Beach litter (BL) poses a constant threat to coastal areas and related ecosystems. Standard monitoring techniques used so far for the identification and classification of BL items consist of in situ visual surveys, which are time-consuming and only allow to cover limited coastal stretches. Recently, innovative and multi-disciplinary approaches have attempted to limit these logistic and practical issues. In this context, a growing number of studies are exploiting the use of aero-photogrammetric surveys, coupled with GIS software post-processing tools, for the monitoring of BL-related pollution. To this purpose, Unmanned Aerial Vehicles (UAVs) are often used to acquire images that can be used to evaluate the BL items' density and the relationships between coastal morphodynamic processes and BL distribution along the beach profile. In this study, carried out in the frame of the RETURN Extended Partnership and RiPARTI Project, the results obtained from a monitoring survey carried out along the Torre Guaceto beach (Apulia region, Italy) are shown. In particular, aero-photogrammetric flights were conducted to obtain RGB georeferenced orthomosaics on which manual image screening and morphodynamic analysis were performed to define the recent shoreline evolution and analyze the potential influence of coastal processes in the dispersion and accumulation of BL along the beach profile. The visual screening process was carried out in QGIS software and 382 BL items were identified and categorized. Artificial polymers/plastic (88%) turned out to be the most frequently represented object, followed by glass and textiles (3.4%). Coastal evolution trends were estimated using a specific GIS tool. Results highlighted a general retreat trend of the shoreline, with erosion rates ranging from 1.4 m/yr to 0.18 m/yr. The limit of the fixed vegetation has also been affected by recent retreat processes, up to 3 m. The zone between the embryo dune and the foredune limit, corresponding to the inner section of the investigated beach, gathered the highest density of BL items (1.24 items/m2). This zone is relatively far from marine or aeolic processes along the shoreline so, objects tend to lay for a longer period of time. These can constitute accretion cores for small embryo dunes that, in turn, will tend to increase the risk of burial for BL items. In conclusion, this study highlights that the exploitation of UAV systems facilitates the monitoring of wide coastal sectors and the analysis of beach morphodynamic trends, supporting the identification of hotspot areas for BL accumulation and the definition and planning of tailored clean-up activities.

How to cite: Rizzo, A., Sozio, A., Anfuso, G., La Salandra, M., and Sasso, C.: Analysis of the interactions between coastal morphodynamic processes and Beach Litter distribution. , EGU General Assembly 2024, Vienna, Austria, 14–19 Apr 2024, EGU24-5672, https://doi.org/10.5194/egusphere-egu24-5672, 2024.

EGU24-7368 | ECS | PICO | ITS3.24/HS12.9

AI-driven aerial drones and monitoring app: New developments to facilitate citizen science initiatives on plastic pollution monitoring and clean-ups on beaches 

Javier Delgado, Alae-eddine Barkaoui, Marko Petelin, Andreja Palatinus, and Milica Velimirovic

Due to the geology of the Mediterranean coastline zone and insufficient waste management in many nations, the Mediterranean Sea has become overflowed with plastic litter attributed to its dense population and high level of tourism activity. To mitigate the plastic pollution, protect marine life, and preserve the ecological balance a series of novel approaches for monitoring and detection of marine litter in the Mediterranean sea are needed. The primary objective of this study is to demonstrate the feasibility of using AI-driven aerial drones for the detection of plastic hotspots on beaches, followed by the use of a monitoring app for community-led plastic pollution monitoring and cleanup initiatives that were held at Saidia beach in Morocco in November 2023. For that purpose, artificial intelligence was tested to quantify and identify litter on beaches using drones that flew over the beach being monitored. Specifically, the drone's video stream is processed by an algorithm that first segments (in polygons) the objects in the video stream and then through deep learning (DL) each object is identified to categorise it as plastic or general waste. The acquired images are then used to train the DL algorithm in order to constantly improve the recognition performance of plastic and other generic waste types. This technique will allow the observation in detail of the monitoring area before and after the monitoring/clean up event, and thus, it can serve as a method to validate the grade of execution of the activity and analysis of the monitored/cleaned area. The focus on citizen science is essential to connect the public with the technologies that will allow them to collaborate in the collection of methodical data that can complement the existing data for a more detailed analysis.Together with the drones, another approach is the new app that will include the option to collect data for beach monitoring and for beach clean-ups. Created to function in both IOS and Android operating systems, this smart app for collecting marine litter monitoring data features an intuitive user interface and other advanced tools to enable even non-professional users to properly collect scientific data. The app also is designed to be used simultaneously by multiple users, that is, to collect data from multiple devices and referring to a single monitoring event. At the conclusion of the event, all collected data can be easily reviewed and supplemented with other advanced metadata for subsequent analysis and sharing activities, as well as then shared in the European repository of the EMODnet ML. The compilation of data from these techniques, to be tested on different demo sites, together with the results of future replications in other areas and the input of data from citizens and external organisations, will be the next step to facilitate a more holistic approach to tackle the crucial situation the Mediterranean sea is facing nowadays due the uncontroled discharge of plastics in its waters.


Acknowledgements

The authors acknowledge financial support from the European Union’s HORIZON EUROPE innovation program for the project REMEDIES awarded under Grant Agreement No. 101093964.

How to cite: Delgado, J., Barkaoui, A., Petelin, M., Palatinus, A., and Velimirovic, M.: AI-driven aerial drones and monitoring app: New developments to facilitate citizen science initiatives on plastic pollution monitoring and clean-ups on beaches, EGU General Assembly 2024, Vienna, Austria, 14–19 Apr 2024, EGU24-7368, https://doi.org/10.5194/egusphere-egu24-7368, 2024.

EGU24-9448 | ECS | PICO | ITS3.24/HS12.9

Validating monitoring methods for riverine macroplastic pollution 

Paul Vriend, Sylvia Drok, Nadieh Kamp, Frank Collas, Martina Vijver, and Thijs Bosker

Riverine macroplastic pollution (>0.5 cm) is omnipresent and can negatively impact ecosystems and livelihoods. Monitoring data are crucial for understanding the nature and extent of pollution as well as aiding the design of effective intervention strategies. Recent years have marked the development of methods to collect surveillance data, primarily focusing on the monitoring of floating plastics and plastics deposited on riverbanks. Today, these methods need validation. Criteria that are essential in robust monitoring are the accuracy and precision of collected data, and the minimum observable particle size. Addressing these challenges, we have conducted field experiments aimed to review the most widely employed protocols: the RIMMEL protocol for floating macroplastics and the river-OSPAR protocol for macroplastics deposited on riverbanks. We find that the recovery of larger pieces ranges between 80-90% for both methods, with the accuracy decreasing significantly when considering smaller items sizes, item colour, number of observers, and factoring in external variables such as bridge height or riverbank surface type. The precision, however, varied greatly between the different experiments. These results indicate that the limits & usage of data from different protocols are highly context dependent. It further highlights the urgent need to include these uncertainties in their communication and utilization. Our result show the urgency of standardizing the operating protocol to optimize the accuracy and precision for measuring riverine macroplastics, and of the necessity to quantify uncertainty in studies estimating plastic fluxes using the two protocols.

How to cite: Vriend, P., Drok, S., Kamp, N., Collas, F., Vijver, M., and Bosker, T.: Validating monitoring methods for riverine macroplastic pollution, EGU General Assembly 2024, Vienna, Austria, 14–19 Apr 2024, EGU24-9448, https://doi.org/10.5194/egusphere-egu24-9448, 2024.

EGU24-9691 | ECS | PICO | ITS3.24/HS12.9

Detecting Floating Macroplastic Litter with Semi-Supervised Deep Learning 

Tianlong Jia, Rinze de Vries, Zoran Kapelan, and Riccardo Taormina

Researchers are increasingly utilizing Deep Learning methods for computer vision to identify and quantify floating macroplastic litter. While these methods can provide precise assessments of plastic pollution by automatically processing images and videos, they often rely on the availability of large amount of annotated data for supervised learning (SL). Moreover, the manual labeling work is expensive and time-consuming. This hinders obtaining high model generalization capability, which is essential for the development of robust computer vision systems for structural monitoring.

To overcome this challenge, we propose a two-stage semi-supervised learning (SSL) method for detecting floating macroplastic litter based on the SwAV (Swapping Assignments between multiple Views of the same image) approach. SwAV is a self-supervised learning method that extracts the feature representations of data (such as images with macroplastic litter) without manual annotations. In the first stage of the SSL method, we use SwAV to pre-train a ResNet50 (Residual Neural Network with 50 layers) backbone architecture on more than 100K unlabeled images. In the second stage, we add additional layers to ResNet50 to create a Faster R-CNN (Faster Region-based Convolutional Neural Network) architecture, and fine-tune it for object detection using a limited amount of labeled data (<13K images with 2.6K annotations).

We demonstrate the effectiveness and robustness of our methodology for images collected in canals and waterways of the Netherlands and South East Asia. We conduct a thorough comparison with the conventional SL method using the same Faster R-CNN architecture and ImageNet pre-trained weights. The results suggest that our method improves both in-domain and out-of-domain generalization performances over the SL method. Our findings also demonstrate that feature representations learned by the SwAV pre-training on context-related images outperform those learned from much larger, but unrelated, datasets (e.g., ImageNet).

Based on these results, we suggest stakeholders (e.g., researchers, consultants and governmental organizations) to consider SSL methods to develop more robust systems for targeted long-term floating macroplastics monitoring. Future work should focus on scaling up computations by resorting to much larger (e.g., over 1 million images), yet relatively inexpensive, unlabeled datasets to fully exploit SSL.

How to cite: Jia, T., de Vries, R., Kapelan, Z., and Taormina, R.: Detecting Floating Macroplastic Litter with Semi-Supervised Deep Learning, EGU General Assembly 2024, Vienna, Austria, 14–19 Apr 2024, EGU24-9691, https://doi.org/10.5194/egusphere-egu24-9691, 2024.

EGU24-10185 | ECS | PICO | ITS3.24/HS12.9

Quantifying plastic contributions to different components of the river channel and floodplain 

Louise J. Schreyers, Tim H.M. van Emmerik, Fredrik Huthoff, Frank P.L. Collas, Carolien Wegman, Paul Vriend, Anouk Boon, Winnie de Winter, Stephanie B. Oswald, Magriet M. Schoor, Nicholas Wallerstein, Martine van der Ploeg, and Remko Uijlenhoet

Rivers are one of the main conduits that deliver plastic from land into the sea, and also act as reservoirs for plastic retention. Yet, our understanding of the extent of river exposure to plastic pollution remains limited. In particular, there has been no comprehensive quantification of the contributions from different river compartments, such as the surface, water column, riverbank and floodplain, to the overall river plastic transport and storage. Here, we provide an initial quantification of these contributions. First, we identified the main relevant transport processes for each river compartment considered. We then estimated the transport and storage terms, by harmonizing available observations on surface, suspended and floodplain plastic. This approach was applied to two river sections in the Netherlands, with a focus on macroplastics (≥ 2.5 cm). Our analysis revealed that for the studied river sections, suspended plastics account for over 96% of items transported within the river channel, while their relative contribution to mass transport was only 30-37% (depending on the river section considered). Surface plastics predominantly consisted of heavier items (mean mass: 7.1 g/#), whereas suspended plastics were dominated by lighter fragments (mean mass: 0.1 g/#). Additionally, the majority (98%) of plastic mass was stored within the floodplains, with the river channel accounting for only 2% of the total storage. Our study developed, and demonstrates, a harmonised approach for quantifying plastic transport and storage across different river compartments, providing a replicable methodology  which will be applicable to many different river environments. Our findings emphasize the importance of adopting a systematic monitoring approach, across the range of river compartments encountered, in order to achieve a coherent and  comprehensive understanding of riverine plastic pollution dynamics.

How to cite: Schreyers, L. J., van Emmerik, T. H. M., Huthoff, F., Collas, F. P. L., Wegman, C., Vriend, P., Boon, A., de Winter, W., Oswald, S. B., Schoor, M. M., Wallerstein, N., van der Ploeg, M., and Uijlenhoet, R.: Quantifying plastic contributions to different components of the river channel and floodplain, EGU General Assembly 2024, Vienna, Austria, 14–19 Apr 2024, EGU24-10185, https://doi.org/10.5194/egusphere-egu24-10185, 2024.

EGU24-10583 | ECS | PICO | ITS3.24/HS12.9

Building a Comprehensive Dataset for Training Object Detection Algorithms applied on Plastic Transport Monitoring in Riverine Environments 

Khim Cathleen Saddi, Domenico Miglino, Francesco Isgrò, Paolo Tasseron, Matteo Poggi, Tim H. M. van Emmerik, and Salvatore Manfreda

Plastic monitoring is a challenging task worldwide. Currently, limited plastic measurements are available along the river in coastal areas or in the ocean. Such data from traditional manual monitoring can contribute to describing plastic transport dynamics within river networks, but not extensively in both spatial and time scales. Consequently, it is crucial to advance long-term monitoring within the river corridor in order to properly quantify and characterize  plastic transport and fates.

Recent advances in optical sensing, using commercially available camera systems (e.g. fixed cameras, drones, smartphones) provide huge opportunities in scene monitoring, which has been already successfully integrated in environment-controlled plastic recycling facilities. In this context, image processing techniques can represent a valuable tool, since their use in natural environments introduces a number of difficulties related to light conditions, shadows, and environmental changes (e.g., riparian and submerged vegetation). Therefore, there is a need to build robust methods able to handle such disturbances balancing detection performance with computational cost. 

Considering all these factors, this work utilizes four river plastic datasets (taken from Indonesia, Italy, The Netherlands, and Vietnam) and explores the possibility of tier-based plastic detection, characterization based on different levels of plastic type (from generalized “plastic” to more specific types e.g., plastic, plastic bag, plastic bottle etc.). These datasets represent very different water systems, e.g. urban water systems, natural rivers, tidal rivers, tropical rivers with diverse levels of lighting conditions, water spectra, camera angle, and image resolutions. Different data combinations and augmentation were explored which were used to train base models of YOLOv7 and YOLOv8 (You Only Look Once family of single detectors). Resulting models were compared in terms of transfer learning performance, labor and computational cost.

This work is part of a PRIN funded project, RiverWatch: a citizen-science approach to river pollution monitoring. Preliminary results show that with constant training parameters (batch=16, epoch=100), YOLOv8 performs better than YOLOv7 in river plastic detection. In fact, even though YOLOv7 provides a higher plastic count, this often includes false positives, with generally lower inference scores than YOLOv8. In addition, simple brightness adjustments appear to have a varying effect in improving detection performance depending on plastic types. 

We presented data augmentation methods and techniques in order to improve algorithm detection performance without complicating its network architecture, also in this way the dataset will remain workable with future algorithms. Future work includes the exploration of adding pre-detection localization layers in the test data to enhance local features prior to detection. 

Keywords: river plastic detection, optical remote sensing, YOLO, tier-based plastic characterization, data augmentation

How to cite: Saddi, K. C., Miglino, D., Isgrò, F., Tasseron, P., Poggi, M., van Emmerik, T. H. M., and Manfreda, S.: Building a Comprehensive Dataset for Training Object Detection Algorithms applied on Plastic Transport Monitoring in Riverine Environments, EGU General Assembly 2024, Vienna, Austria, 14–19 Apr 2024, EGU24-10583, https://doi.org/10.5194/egusphere-egu24-10583, 2024.

EGU24-11105 | ECS | PICO | ITS3.24/HS12.9

Monitoring of floating macro litter in the Arctic seas and rivers 

Maria Pogojeva, Igor Zhdanov, Anfisa Berezina, Ekaterina Kotova, Maria Mikusheva, Aleksander Kozhevnikov, Eleanora Danilova, and Evgeniy Yakushev

Among other marine environmental problems, the issue of marine litter accumulation in the World Oceans is of increased interest. It is relevant not only in areas with direct intense anthropogenic pressure, but also in remote and presumably pristine areas, such as the Arctic Sea. As the concentration of plastic waste in the marine environment increases, it can have impacts on various components of the marine ecosystem, at sea, on the seafloor, on the coasts and in particular in accumulation areas, while it also can negatively affect human social and economic activities. To reduce the release of plastic debris into the marine environment, litter occurrence and pathways need to be studied in order to identify litter sources, requiring monitoring studies that provide comparable results. Here we present the results of studies of the level of pollution by marine litter floating at sea and flowing with rivers in the Arctic region. Ship-based visual observations at sea were performed in the period 2019-2021 in the White Sea, the Barents Sea, the Kara Sea, the Laptev Sea and the East Siberian Sea. To assess the floating litter input with rivers, regular observations (2 times a month) were carried out by the trained observers on the Northern Dvina and Onega rivers. In all cases a standardized methodology was applied to obtain a unified data and to record the data a Floating Macro Litter mobile application (JRC) was used. The methodology contains a unified list and classification of observed floating sea/riverine litter items, which simplifies the data processing and analysis and allows to compare the data. For the first time a large scale assessment of litter pollution was performed in these remote Arctic regions. The international methodology confirmed the possibility of collecting unified data in the region and at the same time revealed some regional features.

How to cite: Pogojeva, M., Zhdanov, I., Berezina, A., Kotova, E., Mikusheva, M., Kozhevnikov, A., Danilova, E., and Yakushev, E.: Monitoring of floating macro litter in the Arctic seas and rivers, EGU General Assembly 2024, Vienna, Austria, 14–19 Apr 2024, EGU24-11105, https://doi.org/10.5194/egusphere-egu24-11105, 2024.

EGU24-11311 | PICO | ITS3.24/HS12.9

Anthropogenic factors, not hydrometeorology, explains plastic pollution variability in the Odaw river  

Rose Pinto, Tim van Emmerik, Kwame Duah, Martine van der Ploeg, and Remko Uijlenhoet

Variations in macroplastic transport are often linked to hydrometeorological conditions (wind, precipitation, and discharge). However, due to the predominant focus on these hydrometeorological factors as the main driving forces, most research overlooks the impact of anthropogenic factors, such as mismanaged plastic waste (MPW) on plastic transport variability. Here, we investigate the roles of both hydrometeorological and anthropogenic factors on plastic pollution. We collected field data on floating, riverbank, and land litter (macroplastics) between December 2021 to December 2022 at 10 bridge locations along the Odaw river. We tested seasonality in plastic transport/density with the Mann-Whitney U-test. Furthermore, we used multiple regression analysis to evaluate the combined effect of all the hydrometeorological variables (rainfall, discharge, and windspeed) on macroplastic transport. Additionally, we correlated peaks in plastic to peaks in discharge, wind speed, and rainfall, defined with the 90th percentile of a distribution as the threshold. Finally, we correlated the spatial variation in plastic transport/density with MPW and population density. Contrary to previous studies, our results showed no seasonal differences in plastic pollution within the Odaw catchment. Additionally, only weak to no correlations were found between plastic transport and the hydrometeorological variables. Overall, only 14-18% of the plastic peaks corresponded to the hydrometeorological peaks. More of these plastic peaks were associated to windspeed peaks. However, a strong correlation was observed between MPW and plastic transport and riverbank/land plastic density. Therefore, we hypothesize that anthropogenic factors are more important than hydro meteorological factors in plastic pollution variations. Our study emphasizes the need to holistically study the role of both anthropogenic and hydrometeorological factors in explaining plastic transport and retention dynamics at a river basin scale. This insight is vital for developing effective interventions to address plastic pollution in river catchments.

How to cite: Pinto, R., van Emmerik, T., Duah, K., van der Ploeg, M., and Uijlenhoet, R.: Anthropogenic factors, not hydrometeorology, explains plastic pollution variability in the Odaw river , EGU General Assembly 2024, Vienna, Austria, 14–19 Apr 2024, EGU24-11311, https://doi.org/10.5194/egusphere-egu24-11311, 2024.

EGU24-13346 | PICO | ITS3.24/HS12.9

Emission of microplastics by geosynthetics during Snow Farming 

David Gateuille, Emmanuel Naffrechoux, Mathieu Pin, and Frederic Gillet

Geosynthetics are a wide range of materials used in many fields ranging from civil engineering to agriculture, road transport and environmental protection. Made up of synthetic or natural polymers, these materials are characterized by their strip shape of varying width and length. It is estimated that currently 150 million m² of geosynthetics are used in France (data from the French Geosynthetics Committee). Despite this massive and constantly increasing use in recent years, their impact on the environment and in particular in terms of the emission of plastic particles, has been very little studied. It is therefore crucial (1) to quantify the risk of fragmentation and emission of plastic particles by geosynthetics and (2) to investigate how exposure to environmental conditions or implementation methods of these materials are likely to modify the quantities of particles emitted.

In partnership with the Tignes ski slopes authority, the Grande Motte cable car company and the Cimes Conseil design office, a quantification of the fluxes of plastic particles emitted by geosynthetics used for Snow Farming was set up between 2020 and 2023. In a context of climate change, Snow Farming makes it possible to reduce the melting of snow on sensitive parts of the ski area (e.g. ski lifts), during summer periods and thus to optimize the opening periods of the ski stations. The geosynthetics used in this context are exposed to extreme environmental conditions including strong ultraviolet radiation and significant daily temperature variations. These conditions could lead to the fragmentation of plastics and to the subsequent release of microplastics.

The work carried out in this study focused on vertical (through the snow cover) and horizontal (at the surface) particle fluxes. These fluxes were compared to the atmospheric fallout of microplastic at the scale of the glacier on which the ski area is located. In addition, 3 types of geosynthetics were compared: a waterproof PVC tarpaulin, a permeable polypropylene tarpaulin and a tarpaulin made from natural materials. The work showed very contrasting results between the 3 types of tarpaulins.

Permeable polypropylene tarps showed the greatest fluxes of particles (microplastics and mesoplastics) to the snowpack in terms of mass, with transfers exceeding one meter in depth. PVC tarpaulins showed grater fluxes in terms of number of particles and the transfers were limited to snow directly in contact with the tarpaulins. These differences are probably explained by contrasting emissions processes linked either to environmental exposures or to the handling of the tarpaulins. No plastic contamination could be detected in the tarpaulins of natural origin. On the scale of the glacier, the fluxes emitted annually represent approximately 2.3 kg and are of the same order of magnitude as the atmospheric fallout (about 8 kg) while the tarpaulins only cover 0.44% of the glacier surface.

How to cite: Gateuille, D., Naffrechoux, E., Pin, M., and Gillet, F.: Emission of microplastics by geosynthetics during Snow Farming, EGU General Assembly 2024, Vienna, Austria, 14–19 Apr 2024, EGU24-13346, https://doi.org/10.5194/egusphere-egu24-13346, 2024.

Groundwater plays a critical role as a vital and renewable water resource for drinking, domestic, and agricultural purposes. Unfortunately, it is under threat from various emerging contaminants, including antibiotic resistance genes, per- and poly-fluoroalkyl substances (PFAS), and micro- and nano-plastics (MNPs). MNPs act as agents, transporting trace heavy metals, hydrophobic pollutants, and toxic chemicals into groundwater from terrestrial and aquatic environments through physical, chemical, and biological processes. The transported MNPs have an impact on human health and ecological species. The objectives of this study were to: (1) assess the abundance of microplastics based on hydrogeology and well depth; (2) characterize the properties of aquifer; (3) identify possible sources of microplastics. The study aims to establish a baseline for the area, contribute to databases on microplastic pollution, and may lead to new solutions for this type of pollution. Data were collected from 17 wells of the National Groundwater Monitoring Network in South Korea. Sixteen water quality parameters, as well as the abundance and properties of microplastics, were analyzed based on depth and hydrology groups. As a result, the average number of microplastics (MPs) detected in 17 groundwater wells, each with a volume of 1.5 liters, was 4.8 particles per liter. In the groundwater samples, a total of six polymer types were identified, including PP, PE, PVC, PS, PA, and PU, with PP and PE being the predominant polymer types. There is a trend where the concentration of MPs tends to be higher in groundwater wells with shallower depths. The main source of MP contamination in groundwater is expected to be the transport through groundwater flow from adjacent industrial and agricultural areas with higher energy levels.

How to cite: Jeon, C.-H., Kim, H.-J., and Jeong, D.: Occurrence and Sources of Microplastics in groundwater divided by well depth and Hydrogeology in South Korea, EGU General Assembly 2024, Vienna, Austria, 14–19 Apr 2024, EGU24-13594, https://doi.org/10.5194/egusphere-egu24-13594, 2024.

EGU24-14269 | ECS | PICO | ITS3.24/HS12.9

Uncovering Geospatial Patterns Emphasize the Urgency of Tackling Plastic Pollution at its Source 

Jennifer Mathis, Chintan Maniyar, Deepak Mishra, Brajesh Dubey, and Jenna Jambeck

Urban centers worldwide, especially in rapidly developing nations, grapple with significant challenges in solid waste management (SWM). High waste generation, limited finances, and the influx of plastic material into historically plastic-free waste streams resulted in plastic waste accumulation in the environment (or unsustainable open dumping practices). Environmental challenges extend beyond SWM, impacting human life, infrastructure (e.g., waterway, sewage, stormwater network), and diverse ecosystems (e.g., mudflats, beaches, mangroves) crucial for protecting ecological barriers and preserving marine diversity. The ecological and socio-economic concerns spanning from plastic pollution necessitate a nuanced understanding of its abundance and distribution in urban areas to devise effective and targeted interventions. Investigative efforts on plastic pollution accumulation patterns are mainly conducted in industrialized nations, marine settings, and remote locations, creating a knowledge gap that hinders locally influential strategizing. This study assessed geospatial patterns of prominent plastic accumulation sites in Mumbai, India, considering the interplay of geographical and socioeconomic factors. Sampling methods comprised in-situ observations of 249 plastic accumulation sites across the city from April to May 2022, alongside 241 satellite-based remote observations utilizing spectral properties to analyze a broader range of sites. Sites were geospatially analyzed with urban geographical features. Results showed that more than half the sites fall within 100 meters of a residential or commercial building (283) and informal settlement (434), spanning an area of 335,549 and 493,076 m2. Concerning the correlation between the proportion of plastic waste to feature-based land area coverage, we found an accumulation of roughly 2.2 m2 and 2.0 m2 of plastic waste within 100 meters for every 100 m2 of waterway and railway. Although significant, the land area to plastic waste area proportion was less for coastlines (0.1m2), intertidal zones (0.3m2), and coastally-located mangroves (0.2m2), supporting evidence that most plastic accumulates inland and is transported to the ocean via waterways and other mechanisms. Notably, most plastic accumulation sites were closer to waterbodies, green spaces, railways, and buildings, with only a few near roads. Accessing these sites often required a park-and-walk approach. This illustrative study underscores the advantages of identifying specific locations and patterns of plastic pollution accumulation as a crucial first step in achieving integrative material management. The visually compelling narrative equips communities with vital information for targeted strategies, emphasizing early intervention’s significance in curbing environmental impacts and protecting livelihoods. Visual representation fosters transparency, enhancing accountability for policy changes. This study urges a focus on addressing plastic pollution at its source, emphasizing proactive mitigation’s practicality and effectiveness. It underscores the importance of decisive action, advocating for early intervention as a vital strategy against plastic pollution. Mumbai has introduced a range of initiatives to reduce plastic pollution, including implementing legislation to limit the production and usage of single-use plastic products. Like many cities worldwide, it is a reminder of the pressing need to address social inequalities and environmental sustainability in rapidly growing urban areas. 

How to cite: Mathis, J., Maniyar, C., Mishra, D., Dubey, B., and Jambeck, J.: Uncovering Geospatial Patterns Emphasize the Urgency of Tackling Plastic Pollution at its Source, EGU General Assembly 2024, Vienna, Austria, 14–19 Apr 2024, EGU24-14269, https://doi.org/10.5194/egusphere-egu24-14269, 2024.

In the current discourse of marine science, the issue of anthropogenic plastic pollution poses a growing existential threat to marine ecosystems and their inhabitants. The relentless increase in global plastic production further intensifies this ecological challenge, necessitating the adoption of innovative monitoring approaches for marine debris management. This investigation outlines the effectiveness and precision of remote sensing technologies in documenting and monitoring the distribution of macro plastics in marine and coastal environments. It addresses the intricate difficulties in detecting individual plastics due to their diminutive size and demonstrates how remote sensing can surmount these obstacles by identifying accumulations of plastics, with the assistance of natural oceanographic processes like hydrodynamic fronts and eddies. This study is conducted near the fishing harbor in Tharangambadi, Tamil Nadu, India. Experimental methodologies are employed at depths of approximately ten meters to minimize the impact of bottom reflectance and obtain precise spectral signatures of both water and plastics. Utilizing a Fishing Harbor Jetty as a stable platform for drone operations counters challenges related to drone endurance and operational range. A comprehensive setup, employing High-Density Polyethylene (HDPE) nets, buoyancy aids, and anchoring systems, facilitates the deliberate collection of plastic debris for remote detection.
The research methodology incorporates the aggregation of various distinct polymer categories. The experimental setup features two 30 x 30 meter testbeds where waste plastics are secured to HDPE nets using Ziploc ties. These testbeds are strategically placed to enhance the differentiation between water and plastic reflectance. A designated benchmark site near the operational center ensures accurate georectification of images obtained from Unmanned Aerial Vehicles (UAVs), synchronized with the overpass of Sentinel, Landsat, and Planet Scope satellites. Unlike previous studies that used high-resolution aerial RGB imagery from drones to calculate the percentage of plastic coverage in satellite images, this study employs UAVs equipped with push-broom hyperspectral sensors to capture high-resolution (approximately 3nm) spectral signatures ranging from approximately 400nm to 1000nm of aggregated plastics. This approach confirms the feasibility of using satellites to identify macro plastic conglomerations. Concurrent in-situ measurements of the properties of water and plastics provide essential data on the detection of marine macro plastic contaminants.
A comparative analysis between the radiometric measurements of macro plastics' spectral signatures and the hyperspectral data acquired by the drone was conducted. The results demonstrate a strong correlation, suggesting that drone-based hyperspectral data could effectively replace radiometric measurements in future satellite validation or matchup activities. This research represents a significant stride in the remote monitoring and evaluation of plastic pollution, offering a scalable solution with considerable implications for the conservation of marine ecosystems.

Keywords: Macro Plastics, UAV, Hyperspectral Remote Sensing

How to cite: Shanmugam, V. and Palanisamy, S.: Remote Sensing and In-Situ Monitoring of Macro Plastics in Coastal Waters Using Hyperspectral UAV Imaging: A Comprehensive Study near Tharangambadi, Tamil Nadu, India, EGU General Assembly 2024, Vienna, Austria, 14–19 Apr 2024, EGU24-14490, https://doi.org/10.5194/egusphere-egu24-14490, 2024.

Roads are identified by many researchers as important source of waste emissions into the environment [1][2]. Previous works on this topic have analysed spatial distribution of roadside dumping sites as well as composition and amounts of waste they contain [3][4][5]. Recent work has hypothesized that in the case of populated mountain regions, where roads are preferentially located within relatively flat valley bottoms, roads can be an important source of macrolitter to the fluvial system [6]. In this study, we investigate the scale of this phenomenon in the Kamienica Gorczańska catchment in the Polish Carpathians. During fieldwork conducted in 2023, we determined the amount and composition of macrolitter within 103 plots located along various types of roads in the floodplain area of the studied stream. We have distinguished two types roadside macrolitter emission: dispersed and point one. Within plots representing dispersed emission (74) 1759 macrolitter items were reported, including 845 (48.04%) plastic items. Furthermore glass litter had the largest share in the total weight of the colleted waste (56.3%). Moreover, we found that point sources of macrolitter emission (e.g., illegal dumping sites) are most often located along roads surrounded by forests within a distance of up to 100 m from the nearest buildings. Our results highlight the importance of road systems in delivering household waste to the fluvial systems of mountain rivers, suggesting that roadside areas should be more adequately addressed in future waste management strategies.

Keywords: road system, macroplastic, mountain stream, household waste, waste management, Kamienica Gorczańska stream

The study was completed within the scope of the Research Project 2020/39/D/ST10/01935 financed by the National Science Center of Poland

How to cite: Haska, W., Liro, M., and Gorczyca, E.: Road-related macrolitter input to mountain river: the case of the Kamienica Gorczańska stream in Polish Carpathians, EGU General Assembly 2024, Vienna, Austria, 14–19 Apr 2024, EGU24-14992, https://doi.org/10.5194/egusphere-egu24-14992, 2024.

EGU24-16399 | PICO | ITS3.24/HS12.9

Microplastic pollution in marine caves 

Elena Romano, Luisa Bergamin, Letizia Di Bella, and Claudio Provenzani

Marine caves are mostly formed by dissolution processes in carbonate massifs and may be of karst origin, as the last part of a large terrestrial aquifer, or can originate at the sea level through different processes such as chemical dissolution and mechanical action of sea waves. They are affected by wide spatial and temporal environmental variability and/or extreme values of environmental conditions (light, nutrients, oxygen, pH, hydrodynamic conditions, difficulty of larval dispersion etc.). Despite this seemingly hostile environment, marine caves are biodiversity hotspots and refuge habitats, hosting many crevice-dwelling and deep-water species, but also some obligate cave-dwelling organisms.

Studies on anthropogenic pollution of marine caves, generally believed to be pristine environments, are practically missing. Only recently, the microplastic (MP) pollution in sediments, water, and in some benthic, sediment-dwelling organisms (benthic foraminifera, hard-shelled protozoans) of two Mediterranean marine caves has been recorded. The first one was the Bue Marino cave, a huge karst cave of the Gulf of Orosei (Sardinia, Italy) where microplastic was detected at rather low concentrations of 10-27 items kg-1 and 18-22 items l-1, in sediments and water, respectively. Microplastic was also recognised, through Micro Fourier Transform Infrared Spectroscopy (μFTIR), in the shell of the agglutinated foraminifer Eggerelloides advena. Microplastic was also recorded in sediments of the small Argentarola cave (Tuscan coast, Italy) at concentrations of 5.4-11.9 items kg-1, and in the shell of the agglutinated foraminifer Lagenammina difflugiformis. Polyethylene, the most abundant polymer in sediments of both caves, was the one detected in the foraminiferal shells.

These studies have demonstrated that some foraminiferal species, building their shell by collecting sediment particles, also collect tiny MP fragments of the order of magnitude of a few microns due to a scarce selection ability. Consequently, MPs enter the trophic chain because foraminifera are preyed upon by many marine organisms such as gastropods, scaphopods, fishes, decapods, and polychaetes.

The research carried out in marine caves has demonstrated that MP has reached also these remote and enclosed habitats and that MP deposited in sediments is available to the benthic organism and enters the trophic chain at very low phylogenetic levels. Foraminiferal agglutinated species including MP polymers, even if present at low concentrations, may be considered early indicators of MP pollution. A clear indication to consider MP pollution not only in water but also in sediment, to preserve the ecosystem of marine caves, was a relevant result of this research.

How to cite: Romano, E., Bergamin, L., Di Bella, L., and Provenzani, C.: Microplastic pollution in marine caves, EGU General Assembly 2024, Vienna, Austria, 14–19 Apr 2024, EGU24-16399, https://doi.org/10.5194/egusphere-egu24-16399, 2024.

EGU24-16935 | ECS | PICO | ITS3.24/HS12.9

Conceptual framework for exploring riverine macroplastic fragmentation 

Maciej Liro, Anna Zielonka, and Tim H.M. van Emmerik

     Field-based information on the rates of macroplastic fragmentation in rivers is currently mostly unavailable. However, obtaining such data in future research is crucial to understanding the production of secondary micro- and nanoplastics in rivers, the transfer of these harmful particles throughout the natural environment, and assessing the risks they pose to both biota and human health.
     To support future experimental works addressing this gap we developed a conceptual framework which identifies two types of riverine macroplastic fragmentation controls: intrinsic (resulting from plastic item properties) and extrinsic (resulting from river hydromorphology and climate)[1].  First, based on the existing literature, we identify the intrinsic properties of macroplastic items that make them particularly prone to fragmentation (e.g., film shape, low polymer resistance, previous weathering). Then, we conceptualize how extrinsic controls can modulate the intensity of macroplastic fragmentation in perennial and intermittent rivers. Using our conceptual model, we hypothesize that the inundated parts of perennial river channels—as specific zones exposed to the constant transfer of water and sediments—provide particular conditions that accelerate mechanical fragmentation of macroplastic resulting from its interactions with water, sediments, and riverbeds. The unvegetated areas in the non-inundated parts of perennial river channels provide conditions for biochemical fragmentation via photo-oxidation. In the non-inundated sections of perennial river channels, unvegetated areas create conditions favoring biochemical fragmentation through photo-oxidation. In intermittent rivers, the entire channel zone is hypothesized to support both physical and biochemical fragmentation of macroplastics, with mechanical fragmentation prevailing during periods of water flow.
     Our conceptualization can support planning of future experimental and modelling work aimed at the direct quantification of plastic footprint of macroplastic waste in different types of rivers.

The study was completed within the scope of the Research Project 2020/39/D/ST10/01935 financed by the National Science Center of Poland.
References
1. Liro, M., Zielonka, A., van Emmerik, T.H.M., 2023. Macroplastic fragmentation in rivers. Environment International 180, 108186. https://doi.org/10.1016/j.envint.2023.108186

How to cite: Liro, M., Zielonka, A., and van Emmerik, T. H. M.: Conceptual framework for exploring riverine macroplastic fragmentation, EGU General Assembly 2024, Vienna, Austria, 14–19 Apr 2024, EGU24-16935, https://doi.org/10.5194/egusphere-egu24-16935, 2024.

EGU24-17352 | PICO | ITS3.24/HS12.9

The occurrence and sources of microplastics to Arctic and sub-Arctic beaches: human influence on local microplastic hotspots 

Jonathan Dick, Tesni Lloyd-Jones, Stamatia Galata, Timothy Lane, Eoghan Cunningham, and Konstadinos Kiriakoulakis

Plastic pollution, and in particular, microplastic pollution, is a global environmental concern particularly in marine ecosystems. The small size of these particles (< 5 mm) means they are prone to ingestion and accumulation by organisms across all trophic levels. Beaches are situated on the transition between the terrestrial and oceanic ecosystems, an important habitat for many species, and have long been known to be sinks of other environmental pollutants. However, until recently their importance as sinks for microplastics and the sources involved were relatively unknown.

This study investigates the extent and likely sources of microplastic pollution on beaches in Arctic and sub-Arctic regions, focusing on Svalbard and Iceland. Sediments on beaches at four sites in Svalbard and eleven in Iceland were sampled for microplastics. Subsequent laboratory analyses for microplastic particle ID, size, type, and polymer (using micro-FTIR) was then carried out to estimate abundance and potential uses of the microplastics identified. Statistical analyses of these results, in conjunction with environmental and geographical data, were conducted to identify patterns and potential sources.

The results revealed significant variability in microplastic quantity, types, and polymers across all locations. Sites with the lowest microplastic concentrations were situated in the most remote areas, while those with the highest concentrations were in proximity to areas with intense human activities or higher population densities. Statistical analyses showed a clear relationship between observed data and the proximity to human activities/inhabitation, with environmental conditions such as wind direction and currents also playing a significant contributory role. These findings suggest that the lower microplastic concentrations found in remote areas are background contamination from ocean delivered from more distant densely inhabited regions (notably Western Europe), with the high contamination hotspots linked to local activities. These findings underscore the heightened impact of local human factors in driving elevated microplastic pollution in beach sediments over oceanic controls in remote yet inhabited Arctic and subarctic locations.

How to cite: Dick, J., Lloyd-Jones, T., Galata, S., Lane, T., Cunningham, E., and Kiriakoulakis, K.: The occurrence and sources of microplastics to Arctic and sub-Arctic beaches: human influence on local microplastic hotspots, EGU General Assembly 2024, Vienna, Austria, 14–19 Apr 2024, EGU24-17352, https://doi.org/10.5194/egusphere-egu24-17352, 2024.

EGU24-18285 | PICO | ITS3.24/HS12.9 | Highlight

Large-scale remote monitoring of riverine litter to evaluate effectiveness of clean-up technologies 

Liesbeth De Keukelaere, Els Knaeps, Robrecht Moelans, Marian-Daniel Iordache, Klaas Pauly, and Ils Reusen

In June 2023 the Horizon Europe project INSPIRE kicked off. INSPIRE will fight against the plastic pollution in rivers by introducing 20 scalable technologies to prevent and eliminate litter. The technologies will be demonstrated in 6 rivers across Europe. Monitoring of the plastic load in the river and the riverbanks is essential to develop a baseline and evaluate effectiveness of the technologies. Here we will introduce a camera and drone-based system to monitor plastic flux in the river and macroplastic densities on the riverbanks. The fixed camera system consists of a series of Commercial Of-The-Shelf (COTS) surveillance cameras with housing and real-time datalink. The cameras work autonomous and will provide a continuous feed of data uploaded to the cloud. The drone system consists of a high resolution RGB and multispectral Micasense camera. Specific attention goes to the conversion from the raw drone data into standardized Analysis Ready Data (ARD) including: (1) image alignment of the multispectral camera. (2) Converting raw drone data into reflectance products (using an irradiance sensor) allows the methodology to be applicable in any circumstance (clear, overcast, cloudy conditions) and transferable to other regions. (3) Sensor fusion, to align high spatial resolution RGB with high spectral resolution MicaSense data.


For plastic detection and characterization robust machine learning models are being used including new pre-trained foundation models like Segment Anything. New methods are being tested to transform the camera-based plastic detections into a plastic flux product taking into account the tide effects in the river. This includes feature detection techniques like SIFT (Scale_Invariant Feature Transform), SURF (Speeded-Up Robust Features) or ORB (Oriented FAST and Rotated Binary Robust Independent Elementary Features) in combination with a feature matching algorithm (e.g. FLANN based matcher). Here, we will present the INSPIRE project and its first results demonstrated at the Temse bridge (Belgium) and riverbanks along the Scheldt river (Belgium).

How to cite: De Keukelaere, L., Knaeps, E., Moelans, R., Iordache, M.-D., Pauly, K., and Reusen, I.: Large-scale remote monitoring of riverine litter to evaluate effectiveness of clean-up technologies, EGU General Assembly 2024, Vienna, Austria, 14–19 Apr 2024, EGU24-18285, https://doi.org/10.5194/egusphere-egu24-18285, 2024.

Microplastics are detected in the environment, particularly in oceanic waters, and have adverse effects on marine ecosystems, biota, climate dynamics, and human health, primarily through the induction of marine pollution. The microplastics are introduced into marine ecosystems either as primary particles through direct discharge or as secondary particles resulting from the weathering of macroplastics. For this, a new laboratory optical-based measurement technique using the static light scattering (SLS) instrument was proposed for the detection and quantification of the microplastics size distribution and to mitigate marine pollution. The SLS instrument relies on the Lorenz-Mie scattering and Fraunhofer diffraction theories and a single monochromatic laser beam is passed through the sample and measures the light scattered intensity in all the scattering angles and with one or many detectors. SLS analysis yields information about microplastic samples, including the volume fraction of each size class bin and the cumulative log-normal distribution of particles. The volume fraction calculation will give the microplastics mean diameter () and standard deviation (σ). The microplastics considered in the present study, include polyethylene (PE), polypropylene (PP), polystyrene (PS), and polyvinyl chloride (PVC). The mean size and standard deviation for PE samples are 3 µm and 2 µm and similarly, the mean size and standard deviation for PP are 3.5 µm and 2 µm. In the case of PS samples, the mean size and standard deviation are 3.5 µm and 2 µm, whereas PVC samples demonstrate a mean size and standard deviation of 3 µm and 2 µm. The findings of the SLS data show the and σ values are in the range of 3-3.5 µm and 2 µm, respectively, for all the microplastic types. The results of the present study will be helpful for a comprehensive understanding of microplastic behavior, facilitating the development of targeted methodologies for detection using hyperspectral remote sensing data in marine environment.

How to cite: Sandhani, C. G., Shanmugam, P., and Sannasiraj, S. A.: Comprehensive Investigation of Microplastics size distribution in Marine Environment: Detection, Quantification, and Optical Analysis Using Static Light Scattering (SLS), EGU General Assembly 2024, Vienna, Austria, 14–19 Apr 2024, EGU24-18753, https://doi.org/10.5194/egusphere-egu24-18753, 2024.

EGU24-20324 | PICO | ITS3.24/HS12.9

Debris classification based on detailed spectral observations using micro-satellite 

Yukihiro Takahashi, Shaqeer Mohamed, and Shin-ichiro Kako

Remote sensing observations from satellites have the great advantage of surveying large areas in a short time. On the other hand, the pixel size of satellite-borne camera on the ground is larger than that of drones or ground-based measurements, making it difficult to classify types of litter based on their detailed shape. Detailed spectral measurements using hyperspectral cameras are expected to be effective in classifying plastics and wood floating on the ocean, or litter accumulated on the beach, from vegetation, sand and stones, but the typical ground resolution of existing satellite-borne hyperspectral cameras is about 30 m. It is not easy to discriminate between types of litter and other objects. We have established imaging technology with a bandwidth (FWHM) of 10-20 nm, 1 nm steps at the centre wavelength and ground resolution of 5-120 m in the 0.4-1.0 micron wavelength range by developing and operating a 50 kg class micro-satellite equipped with a liquid crystal tunable filter (LCTF). In order to capture plastic features, it is necessary to observe even longer wavelength ranges. Currently, by developing a new spectral camera and satellite attitude control technologies, we plan to achieve a bandwidth of less than 10 nm and a ground resolution of about 10 m at 0.4-1.6 um. It is also important to build up a spectral library of spectra for different types of litter and plastics based on ground-based measurements. In this presentation, we report on the development of our micro-satellites and on-board cameras, as well as the methodology and status of the construction of the spectral library.

How to cite: Takahashi, Y., Mohamed, S., and Kako, S.: Debris classification based on detailed spectral observations using micro-satellite, EGU General Assembly 2024, Vienna, Austria, 14–19 Apr 2024, EGU24-20324, https://doi.org/10.5194/egusphere-egu24-20324, 2024.

EGU24-20411 | ECS | PICO | ITS3.24/HS12.9 | Highlight

Macroplastic pollution hotspots across global mountain river catchments 

Anna Zielonka and Maciej Liro

Mountain rivers in densely populated areas have recently been reported as substantially polluted by macroplastics [1]. Previous works suggest that macroplastic delivered to mountain river channel can be quickly fragmented to microplastic, because of distinct natural characteristics of  mountain river channel (e.g. high energy of flow, steep gradient, coarse bed sediments).  The produced microplastic (and  related risks) can not only affect mountain rivers but can also be transported downstream to lowland rivers and oceans [2]. The information on local, regional, and global patterns of plastic emission within mountain river catchments is crucial for planning effective mitigation strategies.

Here we combine existing databases of river catchments [3] and mismanaged plastic waste (MPW) emission [4] to calculate flux of plastic waste from global mountain river catchments [t yr-1]. Our results demonstrate the highest plastic emissions in Asian mountain river catchments, with the maximum (total MPW 37111630 t yr-1) detected in Himalayas. Similar values were also observed in mountain river catchments in the Chilean Andes; however, the number of hotspots was lower in this region. Mountain river catchments in Europe (especially northern Europe) and Australia are influenced by three times lower emissions of MPW compared to those in Asia and South America. We identified numerous hotspots of MPW emission in mountain river catchments that coincide with areas of extreme rainfall occurrence (particularly in the Southeast Asia region). This spatial correlation may consequently accelerate microplastic production during extreme events and facilitate its downstream transport. The obtained data provide a unique source of information for future detailed research aimed at mitigating the plastic pollution problem in global mountain rivers and highlight areas that require urgent regulations to address the plastic pollution problem.


The study was completed within the Research Project 2020/39/D/ST10/01935 financed by the National Science Centre of Poland.


References

[1] Liro, M., Mikuś, P., Wyżga, B., 2022. First insight into the macroplastic storage in a mountain river: The role of in-river vegetation cover, wood jams and channel morphology. Sci. Total Environ.838, 156354. https://doi.org/10.1016/j.scitotenv.2022.156354

[2] Liro, M., van Emmerik, T.H.M., Zielonka, A., Gallitelli, L., Mihai, F.C., 2023. The unknown fate of macroplastic in mountain rivers. Sci. Total Environ. 865, 161224. https://doi.org/10.1016/j.scitotenv.2022.161224.

[3] Ouellet, D.C., Lehner, B., Sayre, R., Thieme, M., 2019. A multidisciplinary framework to derive global river reach classifications at high spatial resolution. Environ. Res. Let. 14(2): 024003. https://doi.org/10.1088/1748-9326/aad8e9

[4] Lebreton, L., Andrady, A., 2019. Future scenarios of global plastic waste generation and disposal. Palgrave Commun. 5 (6), 1–11. https://doi.org/10.1057/s41599-018-0212-7

How to cite: Zielonka, A. and Liro, M.: Macroplastic pollution hotspots across global mountain river catchments, EGU General Assembly 2024, Vienna, Austria, 14–19 Apr 2024, EGU24-20411, https://doi.org/10.5194/egusphere-egu24-20411, 2024.

EGU24-20682 | PICO | ITS3.24/HS12.9 | Highlight

Microplastics in the Alpine watercycle – A combination of methods to cover the widest possible size range  

Marcel Liedermann, Sebastian Pessenlehner, Elisabeth Mayerhofer, Wolfgang Schöner, Doris Ribitsch, Georg Gübitz, and Philipp Gmeiner

Plastic waste as a permanent pollutant in the environment is of increasing concern due to its largely unknown long-term effects on biota. The occurrence in rivers, has, compared to research in the oceans, only become the focus of scientific investigations in the last few years. The Austrian Alps in particular are largely unexplored in this respect. Therefore, the Alplast project addresses microplastic transport from the glaciers at the summit over steep mountain torrents to the lowland rivers and aims in conducting a first inventory of the alpine area. Specifically, analyses of microplastic occurrences are being carried out from the Sonnblick glacier via the Rauriser Ache, the Salzach, the Inn and the Danube and are intended to expand the understanding of processes with regard to the behaviour of microplastics in the water cycle from the glacier to the valley. The influence of snowmelt as well as the temporal development, which can be determined from ice cores, are of great interest. In addition, questions regarding the origin and distribution of plastic in flowing waters as well as the possible biological degradation by microorganisms will be clarified.

Since the sampling areas cover entire catchments at different altitudes, different methodologies and devices are used. For the studies on the glaciers, the snow cover as well as ice cores are sampled and analysed. In the rivers a multi-point method is used due to the spatial distribution of plastic particles in the river cross-section. But the net samples at different depths are combined with isokinetic pump sampling in order to detect the widest possible size range. Isokinetically taken pump samples have the great advantage that a weighting process takes place directly during sampling. This means that samples can be taken in different areas (high and low flow velocities) of the cross-section (together with the nets) and then a composite sample can be analysed for the profile. Particle counts, classification and the measurement of concentrations and loads are then used to determine quantities and the most common types of plastics in the alpine environment. The measuring stations were selected in such a way that more and more potential microplastic sources are added in the course of the catchment in order to achieve the best possible process understanding regarding the origin and fate of the plastic waste.

How to cite: Liedermann, M., Pessenlehner, S., Mayerhofer, E., Schöner, W., Ribitsch, D., Gübitz, G., and Gmeiner, P.: Microplastics in the Alpine watercycle – A combination of methods to cover the widest possible size range , EGU General Assembly 2024, Vienna, Austria, 14–19 Apr 2024, EGU24-20682, https://doi.org/10.5194/egusphere-egu24-20682, 2024.

EGU24-365 | Orals | ITS2.9/CL0.1.10

Spatio-temporal patterns of hydrological processes on non-floodplain wetlands in an upstream basin of Pampa Plain (Argentina) during present wet conditions  

Pablo Augusto Cello, Daniela M. Kröhling, Ernesto Brunetto, María Cecilia Zalazar, Reinaldo García, Mauro Nalesso, Jacinto Artigas, and José Rafaél Córdova

This work aims at deepening the knowledge of the mechanisms that govern the response of small temporary non-floodplain wetlands (NFWs) of neotectonic origin in the North Pampa under wet conditions. The study focuses on the Vila-Cululú upstream sub-basin (973 km2), a tributary of the Salado River belonging to the Paraná River basin. The Pampa Plain has been affected by more frequent high-intensity rainfall events during the last five decades giving rise to a steady increase in the water table and a decrease in soil infiltration, leading to flood events that impact both rural and urban environments. Under wet conditions, a flat landscape alters the surface runoff and favors the development of temporary NFWs, increasing flood vulnerability and jeopardizing human activities. Structural depressions with polygonal patterns and a network of Late Pleistocene (ca. 100 ka. BP) parallel ENE-trending fluvial palaeochannels characterize the study area. These palaeochannels were deactivated by neotectonics and covered by loess, Last Glacial Maximum in age. In some sectors, the palaeochannels intercept the small tectonic depressions and significantly restrict the present drainage network (low-order streams and artificial channels).  The research involved an integrated approach, including geomorphic and morphometric analyses based on remotely sensed satellite imagery in a GIS platform and fieldworks, and 2D hydrologic-hydraulic simulations using HydroBID Flood (hydrobidlac.org) to capture the system behavior for an extraordinary rainfall event (December 2016-March 2017). Simulation results show that the model represents hydrodynamics fairly well. The flooded areas were comparable to those obtained from the analysis of satellite images. The dendritic runoff pattern towards the tectonic depressions, the water storage evolution, and the hydraulic connectivity were numerically replicated. In particular, the Vila-Cululú sub-basin points out a significant delay in the hydraulic response downstream since the system must first satisfy groundwater and surface water storage. Once storage capacity is exceeded, the hydraulic behavior results in a dynamic process that involves the spilling and merging of ponds generated in small deflation hollows, generally nested within fluvial palaeochannels. Such a hierarchical structure controls surface runoff towards the shallow tectonic depressions. This mechanism gives rise to the development of NFWs as simulation time evolves. Besides, the surface runoff flow pattern also highlights the poor capacity of both natural and artificial drainage networks, displaying highly lateral mobility and scarce connectivity downstream. However, these NFWs eventually might connect to a more hierarchical drainage network downstream at the final stage of the storm event. The dense network of artificial channels started to develop in the 1940s to evacuate water excess to the outlet. Despite the anthropic interventions, geomorphologic thresholds finally control hydrodynamics adding to surface water storage and limiting channel conveyance. This work is one of the first studies in North Pampa that combines hydrological and geomorphological data to explain the present hydrodynamics. These could be applied to palaeoflood hydrology. Identifying critical geomorphological thresholds adds to the knowledge of different levels of hydrologic connectivity, providing a better assessment of flood hazards on large plains.

How to cite: Cello, P. A., Kröhling, D. M., Brunetto, E., Zalazar, M. C., García, R., Nalesso, M., Artigas, J., and Córdova, J. R.: Spatio-temporal patterns of hydrological processes on non-floodplain wetlands in an upstream basin of Pampa Plain (Argentina) during present wet conditions , EGU General Assembly 2024, Vienna, Austria, 14–19 Apr 2024, EGU24-365, https://doi.org/10.5194/egusphere-egu24-365, 2024.

EGU24-3989 | Orals | ITS2.9/CL0.1.10

Groundwater effects on flood dynamics  

Wouter Berghuijs, Louise Slater, Ross Woods, and Markus Hrachowitz

Fluvial floods are typically the result of large precipitation or snowmelt events, often conditioned by high pre-event soil moisture levels. However, soil moisture represents only a small fraction of the water stored in landscapes. Groundwater, often a much larger water store, may also contribute a significant proportion of river flow but its role in large-scale flood assessments often remains understudied. Here I discuss how (ground)water storage conditions can shape multi-year variability and long-term trends of river flow and flooding across thousands of catchments worldwide. Since often relatively slow groundwater dynamics can affect the much faster and more erratic flood responses, incorporating groundwater may be important to accurately model and analyze these hydrological extremes.

How to cite: Berghuijs, W., Slater, L., Woods, R., and Hrachowitz, M.: Groundwater effects on flood dynamics , EGU General Assembly 2024, Vienna, Austria, 14–19 Apr 2024, EGU24-3989, https://doi.org/10.5194/egusphere-egu24-3989, 2024.

EGU24-4382 | ECS | Posters on site | ITS2.9/CL0.1.10

Effects of Long-Term Wetland Variations on Flood Risks in the Yangtze River Basin  

Ziying Guo, Xiaogang Shi, and Qunshan Zhao

In the Yangtze River Basin (YRB), flooding is the most frequent natural disaster with enormous socio-economic damages. As a critical component in the hydrological cycle, the wetlands along the YRB have been changing during recent decades because of urbanization, intensive farming (e.g., aquaculture and agriculture) and climate change. Due to the lack of a long-term wetland classification dataset with comprehensive wetland categories, however, there’s a noticeable gap in the YRB water management regarding the relative roles of different wetland categories on flood resilience. Therefore, this study aimed to generate a long-term wetland classification dataset for the YRB and further investigate the long-term wetland variations on the YRB flood risk assessments for the period from 1985 to 2021. The dataset named Long-Term Wetland Classification Dataset for YRB (LTWCD_YRB) was created using a Random Forest machine learning classifier on Google Earth Engine with 30m resolution Landsat 5, 7, 8 muti-spectral images. The maps of LTWCD_YRB demonstrated the spatial distribution, annual variability, and seasonal cycle of nine wetland categories in the extent, and the total validation accuracy can reach 85%. The LTWCD_YRB indicated that the total wetland area of the YRB in 2021 was larger than that in 1985, with constantly increased human-made wetlands and fluctuated natural wetlands. Aquaculture ponds expanded the most (4,987 km2); inland marsh in the source region was the wetland category with the most fluctuations. Seasonal changes in wetlands were prominent in the Poyang Lake Basin, Dongting Lake Basin, and YRB source region. The LTWCD_YRB can offer a consistent agreement of wetland area variations with the other satellite-based wetland datasets in the YRB, which is valuable for researchers and stakeholders to better understand the YRB wetlands and would support sustainable wetland management practices. With the LTWCD_YRB data as modelling inputs, a GIS-based spatial multi-index flooding risk assessment model was applied for investigating the long-term implications of wetland variations on flood risks in the YRB. The model results indicate that in the year with large floods and extremely high precipitation, flood risk level increased obviously after adding the wetland factor. For the years with normal precipitation, flood risk level decreased with wetlands expansion and increased with wetlands shrinkage in the YRB. The long-term expansion of aquaculture ponds contributed to a lower flood risk in the Taihu Lake Basin. In contrast, the Poyang Lake Basin experienced an increasing flood risk due to the long-term shrinkage in lake areas resulting from soil erosion and urbanization along the lakeside. This study would be helpful for stakeholders to develop feasible wetland management practices, and to improve flood risk resilience in the YRB.

How to cite: Guo, Z., Shi, X., and Zhao, Q.: Effects of Long-Term Wetland Variations on Flood Risks in the Yangtze River Basin , EGU General Assembly 2024, Vienna, Austria, 14–19 Apr 2024, EGU24-4382, https://doi.org/10.5194/egusphere-egu24-4382, 2024.

EGU24-4543 | ECS | Posters on site | ITS2.9/CL0.1.10

Flood frequency elasticity to extreme precipitation: a practical approach for Climate Change projection of flood probabilities 

Luigi Cafiero, Paola Mazzoglio, Alberto Viglione, and Francesco Laio

Flood risk management institutions and practitioners need  innovative and easy-to-use approaches that incorporate the changing climate conditions into flood predictions in ungauged basins. The traditional approach to regional flood frequency analysis enables the estimation of hydrological variables under stationary conditions. However, it is nowadays crucial to develop innovative techniques that consider the non-stationarity of climate variables. The present work aims at implementing an operative procedure to include the expected variation in precipitation extremes into regional analysis. We compare the Flood Frequency Curves (FFC) and the Intensity-Duration-Frequency (IDF) curves defining a relation between them through the elasticity, an indication of the sensitivity of floods to precipitation extremes. Under the assumption that this relation does not change in time, we obtain modified FFC according to the projections of an ensemble mean of 25 Cordex simulations of CMIP5. This methodology was applied to 227 catchments of the Po River basin in northern Italy. Elasticity values range between 0.5 and 2: the lowest values were found in Valle d'Aosta region, and the highest in the south-western part of Piemonte. Over the Po river basin, the percentage increase of the 100-year floods ranges between 15% and 40%. The most relevant increase of flood discharge is found in the area between Liguria and Emilia-Romagna in the southern part of the Po River basin, where the projected increase of precipitation extremes is the highest.

How to cite: Cafiero, L., Mazzoglio, P., Viglione, A., and Laio, F.: Flood frequency elasticity to extreme precipitation: a practical approach for Climate Change projection of flood probabilities, EGU General Assembly 2024, Vienna, Austria, 14–19 Apr 2024, EGU24-4543, https://doi.org/10.5194/egusphere-egu24-4543, 2024.

Existing research has provided evidence on how culture mediates disasters and exacerbates or mitigates their impact in various contexts but is often concentrated among popular cultural heritage or large scale culture phenomena. The significance of culture belonging to indigenous communities is less studied in mainstream climate change adaptation, despite its importance in helping build local social resilience to climate impacts. An Achang indigenous settlement located in the western part of China's Yunnan Province, where intense flash floods occurred frequently in its history, was used as a case study. The study aims to excavate the flood culture within the Achang community and examine how culture, particularly religion, blood-related organization, indigenous knowledge, and customary law have helped Achang communities for generations to build coping strategies to flood events. Data was gathered using participant observations in community activities, semi-structured interviews, more open thematic conversations, and document review in July 2023. Respondents included survivors for the storytelling, households for the semi-structured interview, and officers of the local authorities for the key informant interviews. The study found that the Achang community has a rich flood culture, which profoundly influences the behavior of the local people during flood events. First, the Achang people are culturally rooted in Buddhist tradition of nature worship and an equanimity view of living, forming an environmentally friendly community and providing a refuge for the spirit. Second, self-organization forms based on geography and kinship plays an important role in responding swiftly and maintaining long-term collaboration in times of flood. Thirdly, the Achang people's acquisition of ecological knowledge from nature has heightened their sensitivity to natural phenomena, enabling them to skillfully leverage their environment for home transformation and effective flood response. Finally, The Achang community is governed by a number of customary laws concerning flood prevention, which call on villagers to preserve forests, conserve soil and water, and contribute to post-disaster reconstruction for the common good. All of above provides an adaptable culture system from values-knowledge-institutions-practice with a strong ecological view and that is flexible enough to accommodate the adjustments needed to respond to changes. The relocation case in the Achang community illustrates that scientific disaster reduction decisions need to consider local flood culture to establish effective interventions in indigenous flood hotspots, further becoming the foundation for community resilience. As such, greater effort should be made by the State to full-scale investigations of these cultural, and the participation of indigenous flood culture in the planning and implementation of disaster risk reduction intervention.

How to cite: Ai, M., Yang, L. E., and Zhou, Q.: Culture system and social resilience to flood impacts - An investigation of Achang communities in Yunnan, China, EGU General Assembly 2024, Vienna, Austria, 14–19 Apr 2024, EGU24-4720, https://doi.org/10.5194/egusphere-egu24-4720, 2024.

EGU24-5195 | Orals | ITS2.9/CL0.1.10 | Highlight

The unique 1432–2013 flood marks from the Děčín Castle Rock, Czech Republic, are scanned in 3D and utilized 

Libor Elleder, Tomáš Kabelka, and Jolana Šírová

Our contribution presents an example of archiving of an invaluable collection of flood marks. With respect to the height of the object carrying these flood marks exceeding 12 metres it is not possible to explore all flood marks in detail in situ. 3D scan, however, offers an excellent possibility how to solve this task. We have analysed the Děčín Castle Rock (further DCR) flood marks in context of their importance, history, recent scanning, reliability check and utilization.  The DCR ranks amongst the most important epigraphic hydrological objects in Europe. Three major reasons for that can be listed as follows: (i) the Děčín town geographical position represents the outflow of the whole Bohemia concentrating the water volume from the upper part of the Elbe river catchment, (ii) the presence of ancient flood marks (the oldest one representing the 1432 flood event) engraved in the sandstone Castle Rock, (iii) the striking relation between the DCR flood marks and the Děčín Hungerstone drought marks situated in its close vicinity  (only some 200 metres apart). It is not the number of flood marks but joint placement of both the flood and drought (low) marks which makes Děčín truly a unique place in European context. The whole flood and drought mark system served as a tool for ancient safe navigation for boats and rafts, and later ships and steamers. We place all these Děčín flood and drought marks in context of other important records in Prague, Litoměřice, and German Pirna, Dresden and Meissen. Furthermore, the oldest water level gauge – estimated to be at least 200 years old - is situated in the same place allowing for direct and easy reading of flood mark heights. Altogether, the Hungerstone drought marks and  DCR flood marks with the old water level  gauge in the Czech town of Děčín  represent an unparalleled complementary system of centennial information for extremely  low and extremely high water levels. Our Map of Extreme Floods (MEF, 2024) application currently offers selected floods the culmination water levels of which are engraved on the DCR, such as July 1432, August 1501, February 1595, February 1682, August 2002 and June 2013, the other will be available sooner (1824, 1890) or later (1771, 1784, 1799, 1830, 1845 and 1862).


Reference:

MEF, 2024.  Available at:

https://chmi.maps.arcgis.com/apps/MapSeries/index.html?appid=dc50b65b4483465cb98c50d4b55df75d.


How to cite: Elleder, L., Kabelka, T., and Šírová, J.: The unique 1432–2013 flood marks from the Děčín Castle Rock, Czech Republic, are scanned in 3D and utilized, EGU General Assembly 2024, Vienna, Austria, 14–19 Apr 2024, EGU24-5195, https://doi.org/10.5194/egusphere-egu24-5195, 2024.

EGU24-9242 | Posters on site | ITS2.9/CL0.1.10

Contextualizing recent extreme floods in the Western Mediterranean region: insights from historical records and paleoflood hydrology 

Juan Antonio Ballesteros-Canovas, Tamir Grodek, Carlos Naharro, Josep Barriendos, Mariano Barriendos, Alicia Medialdea, Alberto Muñoz-Torrero, and Gerardo Benito

The Mediterranean region is expected to experience more extreme rainfall events due to climate change. These extreme weather events, together with the ever-increasing human occupation, could lead to an increase in the risk of flash floods. This situation could be worrying, as wildfires may occur during hotter and drier summers, which might increase the hydrological response. Adaptation and mitigation strategies need to be put in place at the level of water and civil protection authorities. However, this is challenging due to the widely recognised lack of data, the high variability of the Mediterranean hydroclimate, and previous shortcomings in the performance of climate-based models for the region. Here, we combine historical, geological and tree-ring data to provide a compressive multi-century reconstruction of flood frequency and magnitude for the Clariano River, a medium-sized (265 km2) Mediterranean catchment in the Province of Alicante (Spain). A historical flood database was collected from published compilations, documentary sources, photographic archives and newspapers. The Municipal Archive at Ontinyent provided flood evidence since CE 1320 with a continuous flood record since 1500. Slackwater flood deposits were studied in ten stratigraphic profiles on three river reaches, and flood units were dated by radiocarbon and optically stimulated luminescence. Finally, thirty-five scarred trees growing on floodplains in three different river reaches were sampled to record the occurrence of recent floods. In three river reaches, 1D and 2D hydraulic models were implemented on high-resolution topographies to convert palaeostages and historical levels into flood discharge. The multi-source data compilation provides evidence of at least 47 major floods since the 13th Century. Apart from the flood caused by the dam break in 1689, the magnitude of the most recent floods caused by mesoscale convective cells in 2016 and 2019 were similar to or slightly below in magnitude to those experienced during the rich flood period (1850-1895) following the end of the Little Ice Age. This implies that the information on past extreme floods could be used as a scenario-based approach to quantify expectations of recent extreme floods under climate change scenarios. Furthermore, our records have allowed a more accurate estimation of flood frequency in Ontinyent city, which could be used to provide a more robust flood hazard zonation. Throughout this comprehensive study, we show that quantitative historical and palaeoflood hydrology allows the determination of past and recent flood magnitude response to climate variability, reducing the uncertainties in flood hazard and risk assessment in the Mediterranean region.

How to cite: Ballesteros-Canovas, J. A., Grodek, T., Naharro, C., Barriendos, J., Barriendos, M., Medialdea, A., Muñoz-Torrero, A., and Benito, G.: Contextualizing recent extreme floods in the Western Mediterranean region: insights from historical records and paleoflood hydrology, EGU General Assembly 2024, Vienna, Austria, 14–19 Apr 2024, EGU24-9242, https://doi.org/10.5194/egusphere-egu24-9242, 2024.

EGU24-11182 | ECS | Posters on site | ITS2.9/CL0.1.10

Spatial signatures of flooding and blocking are related on the long-term scale 

Diego Hernandez, David Lun, Miriam Bertola, Bodo Ahrens, and Günter Blöschl

Process-based explanations of flood controls have increasingly advanced in the last years along with comprehensive datasets availability. However, the relationship on the long-term scale between floods and large-scale atmospheric drivers remains unclear, hindering the understanding of flood-prone periods and the projections of flood change. The translation of atmospheric blocking (i.e., a persistent mid-latitude high-pressure system that blocks westerly flows) into flooding has not been raised for large samples due to the spatiotemporal complexity of the atmospheric and hydrological response. For the 1950-2010 period, this study analyzes summer flood events from a pan-European database, a gridded binary blocking index derived from ERA20C, and hemispheric fields of four meteorological variables from ERA5. By defining a window of days with flooding (dF) related to precipitation surpluses in central Europe, days with blocking (dB) at three different regions namely North Atlantic (NATL), Europe (EU) and Scandinavia (SCAN), and days with simultaneous flooding and blocking (dFxB), our results indicate spatially similar meteorological signatures for dF and dFxB at NATL, but different patterns between dB and dFxB at NATL, suggesting there is a subset of blocking events at NATL controlling the meteorological signature of flood events in central Europe. Patterns for dB and dFxB at SCAN are similar implying that blocking in the SCAN region has the most direct effect on floods in central Europe. Hence, this research could provide new insights into large-scale atmospheric controls and sources of predictability regarding floods.

How to cite: Hernandez, D., Lun, D., Bertola, M., Ahrens, B., and Blöschl, G.: Spatial signatures of flooding and blocking are related on the long-term scale, EGU General Assembly 2024, Vienna, Austria, 14–19 Apr 2024, EGU24-11182, https://doi.org/10.5194/egusphere-egu24-11182, 2024.

EGU24-11746 | Posters on site | ITS2.9/CL0.1.10

The October 1787 Ebro flood: the biggest flood event of NE Iberian Peninsula in the last 500 years 

Josep Carles Balasch Solanes, Josep Barriendos, Mariano Barriendos, Jordi Tuset, and David Pino

The reconstruction of past flood episodes is of vital importance in the study of river dynamics for assessing the impact of climatic and environmental changes, and evaluating the risk of these disasters on current populations. The main objective of this study is to present a multidisciplinary analysis of the catastrophic flood episode that occurred in the Ebro River basin (85,000 km2) on 8th-9th October 1787.

The methodology includes an extensive research from documentary sources of the damaged locations. By using this data, maps of the extent of the affected area and the temporal evolution of the event have been reconstructed. Then, utilizing the maximum water height (3 flood marks), numerical simulations of hydraulic and hydrological reconstructions have been carried out to obtain the peak flows and the amount of precipitation. The meteorological reconstruction utilizes daily barometric information collected at that time from different observatories in Western Europe to plot surface pressure maps to estimate wind direction and the location of the cyclonic centers.

The results show that this is the most serious episode that has occurred in the northeast of the Iberian Peninsula the last 500 years. There were more than 500 fatalities in the Lower Ebro area, numerous homes and structures were destroyed and the regional economy was damaged for several decades. The affected area was mainly the eastern Ebro basin (with 31 documented points), but it also extended to small areas of coastal basins of the Llobregat and Júcar Rivers (9 affected points). After about 10-12 consecutive days of rain caused by two active low-pressure centers combined with an influx of moist air from the Mediterranean Sea, some of the largest peak flows that the Ebro River has experienced since the beginning of the 16th century occurred. These flows reach to 12,900 m3·s-1 of the Ebro River in Tortosa (mean flow: 428 m3·s-1), 4,500 m3·s-1 of the Ebro in Zaragoza (mean flow: 231 m3·s-1), 4,500 m3·s-1 of the Segre River in Lleida (mean flow: 80 m3·s-1) and about 2,500 m3·s-1 of the Cinca River in Fraga (mean flow: 78 m3·s-1). According to historical accounts, the origin of the flood is purely pluvial without contributions of snow melting in the Pyrenees.

The specific peak flow of the Ebro in Tortosa (0.15 m3·s-1·km-2) exceed the flows of any large European river of the same basin size (Po, Danube, Rhine, Rhône). Therefore, we are facing an event of extreme magnitude that is essential to study and to explain fluvial variability and risk analysis.

How to cite: Balasch Solanes, J. C., Barriendos, J., Barriendos, M., Tuset, J., and Pino, D.: The October 1787 Ebro flood: the biggest flood event of NE Iberian Peninsula in the last 500 years, EGU General Assembly 2024, Vienna, Austria, 14–19 Apr 2024, EGU24-11746, https://doi.org/10.5194/egusphere-egu24-11746, 2024.

EGU24-13047 | Posters on site | ITS2.9/CL0.1.10

Storm Daniel and the timing and magnitude of floods in Northeast Libya 

Chris Hunt, Hwedi El-Rishi, David Brown, and Jon Dick

Storm Daniel caused major flooding throughout much of the Jebel al-Akhdar massif in Northeast Libya, leading to huge damage and loss of life in the city of Derna and widespread damage to infrastructure through the region in September 2023. There is little historical record of significant floods in the region. We conducted dendrogeomorphological and palaeohydrological research in the wadis Kouf and Bottamsa in the Jebel al-Akhdar. Radiocarbon- and tree-ring dated flood return and flood magnitude sequences suggest three major floods during the 17th to 19th centuries AD in the Wadi Kouf and one major flood during the 18th Century in the Wadi Bottamsa, with major flood return intervals of about one per 100 years. The timing of the major floods in these two catchments seem to be different, suggesting the storms that caused them were localised. The major floods in the Wadi Kouf would have been large enough to have caused considerable damage to modern infrastructure, which seems to have been designed to cope with the much smaller floods of the mid-20th Century. Storm Daniel, however, was the product of a much larger weather system than the storms that gave rise to the earlier floods and it caused the largest floods in these wadis in the last 400 years.

How to cite: Hunt, C., El-Rishi, H., Brown, D., and Dick, J.: Storm Daniel and the timing and magnitude of floods in Northeast Libya, EGU General Assembly 2024, Vienna, Austria, 14–19 Apr 2024, EGU24-13047, https://doi.org/10.5194/egusphere-egu24-13047, 2024.

Streamflow has a crucial role in the global water cycle. The demand for long-term daily streamflow observations becomes essential for robust water resources planning, hydroclimatic extremes analysis, and informed ecological assessments. However, there is a lack of availability of this type of dataset, particularly concerning the river basins of South Asia daily. The hydrologic-hydrodynamic model can simulate the streamflow over the domain. However, these models are not well calibrated to provide the locally relevant streamflow simulation daily. In response to this crucial knowledge deficit, in this study, we developed a state-of-the-art hydrological-hydrodynamic model to simulate daily streamflow spanning the years 1949 to 2022 across river basins South Asia by calibrating the model with observed daily streamflow. Leveraging meteorological observations meticulously gathered by the India Meteorological Department (IMD) inside India, and Modern-Era Retrospective Analysis for Research and Applications, Version 2 (MERRA2) outside domain, our model integrates the Noah MP as the land surface model and the HyMAP routing model to generate intricate daily streamflow dynamics within the South Asian sub-continental river basins. We calibrated the model at the 173-gauge stations against observed streamflow over South Asia. The calibration and validation time periods were 3 and 5 years respectively. This process ensures the adaptability and relevance to the local nuances of Basins in the model, aligning the simulated daily streamflow patterns with observed data. A comprehensive examination of the model's performance provides good results, with key metrics such as Kling-Gupta Model Efficiency (KGE), coefficient of determination (R2), and Nash-Sutcliffe efficiency (NSE) consistently exceeding a median threshold of 0.34. Taking our analysis further, we calculated the KGE skill score of the dataset, we found that 83/173 in calibration and 72/173 in validation showed KGE skill score more than 0.08. This extensive reconstruction and evaluation of streamflow dynamics not only contribute significantly to filling the knowledge gap but also lay the foundation for more precise and informed water management strategies in the dynamic landscape of South Asia's river basins.

How to cite: Prakash, V. and Saharia, M.: India Water Model: A Transboundary Water Modeling System Over South Asia and a 75-year Daily Streamflow Reanalysis, EGU General Assembly 2024, Vienna, Austria, 14–19 Apr 2024, EGU24-15063, https://doi.org/10.5194/egusphere-egu24-15063, 2024.

Fluvial ecosystems are among the environments most significantly modified by human activities. Channelization, levee construction, floodplain disconnection from the riverbed, alteration of the fluvial regime and ecosystem, interruption of the sediment dynamics and alteration or destruction of the shape and morphology of the riverbed, are among the main effects of such interventions. Restoring or rehabilitating fluvial environments, including hydrological and geomorphological processes, is currently being undertaken in many river systems of the world given the benefits that these environments provide to mankind. However, depending on the magnitude of the human interventions and their impacts on the river system, reaching a restoration stage before human intervention cannot be fully achieved. In this context, the Congost River is a representative example of the evolution of the morphology of a river channel in the metropolitan area of Barcelona during the 20th and 21st century. The river flows through Granollers, a city of 60,000 inhabitants exposed to flood risk. During the 70s and 80’s the Congost river was channelized, narrowed and disconnected from its floodplain to promote urban and industrial growth.  The river channel was then fixed to avoid lateral migration by constructing sleepers (transversal structures), and fluvial landforms such as secondary channels and gravel bars were intentionally removed from the riverbed to create a drainage channel. However, to recover green riverine areas, sleepers in the peri-urban area of Granollers were demolished, whereas in the urban core area sleepers were conserved.

Analysis of aerial images of 1945, 1956, 1986, 1998, 2009 and 2022 shows the following transformation: the natural braided channel, adapted to slope, flood frequency and sediment load changed after the human intervention to a restrained channel. The result of the restored river stretches showed higher hydro-morphological characteristics than the urban section, but they are still far from the expected outcomes of a fully successful restoration of a braided river. Yet, the channel morphology improves natural river processes. At this point, however, it is not known how the riverbed will evolve in terms of incision or avulsion, and whether further river management measures will be necessary to implement. Monitoring of channel evolution is required to fully understand the human impacts on partially restored urban fluvial systems through time. 

How to cite: Farguell, J., Ferreira, F., Moreno, M., Barriocanal, C., and Schulte, L.: Human-induced alterations to the morphology of an urban Mediterranean watercourse from 1945 to 2022: transitioning from its natural state to phases of correction and restoration. , EGU General Assembly 2024, Vienna, Austria, 14–19 Apr 2024, EGU24-16354, https://doi.org/10.5194/egusphere-egu24-16354, 2024.

EGU24-17027 | ECS | Posters on site | ITS2.9/CL0.1.10

A comprehensive framework for the application of IF and TCIF theoretically derived distributions in Southern Italy 

Martina Ciccone, Andrea Gioia, Vincenzo Totaro, Federica Mesto, Maria Rosaria Margiotta, Salvatore Manfreda, Mauro Fiorentino, and Vito Iacobellis

An increasing amount of evidence is now available for demonstrating how flood series often incorporate data coming from different populations, thus emphasizing the need to understand the physical nature of floods before carrying out their probabilistic analysis. Theoretically derived distributions of floods were introduced by Eagleson (1972) as an alternative, probabilistic and physically based modelling of processes responsible for flood generation. Based on this framework, Iacobellis and Fiorentino (2000) proposed the IF probability model in which the direct contribution to peak flow is obtained as the product of partial contributing area and the discharge per unit of area, both considered as random mutually dependent variables. Moving from the consideration that floods can be triggered by different runoff productions mechanisms, Gioia et al. (2008) introduced the TCIF probability model.  IF and TCIF distributions were successfully applied on a wide area of Southern Italy, which includes Puglia, Basilicata and Calabria regions, providing advances in the understanding of physical phenomenology of flood generation in these areas. In our research we revisited the parametric structure of these theoretically derived distributions applied in the entire Southern Italy, exploiting, among other, the availability of updated rainfall data and previous knowledge developed within the framework of VAPI project. Results showed the good performances of both distributions in fitting annual maxima of flood data, highlighting how IF and TCIF distributions possess a solid background for interpreting the actual underlying flood generation processes. Findings of the study can represent a reliable source of information for supporting model selection activities at both local and regional scales.

How to cite: Ciccone, M., Gioia, A., Totaro, V., Mesto, F., Margiotta, M. R., Manfreda, S., Fiorentino, M., and Iacobellis, V.: A comprehensive framework for the application of IF and TCIF theoretically derived distributions in Southern Italy, EGU General Assembly 2024, Vienna, Austria, 14–19 Apr 2024, EGU24-17027, https://doi.org/10.5194/egusphere-egu24-17027, 2024.

EGU24-17145 | Orals | ITS2.9/CL0.1.10 | Highlight

Can reservoirs and dams effectively reduce flood runoff in river basins? A case study of the Rhine basin 

Ralf Merz, Gustavo Andrei Speckhann, Viet Dung Nguyen, and Bruno Merz

Flood retention basins constitute a pivotal component of flood protection measures. Local studies have unequivocally demonstrated their efficacy in significantly mitigating flood discharges, thereby minimizing potential downstream damage. However, the impact of these retention basins on the reduction of flood discharges at the large river basin scale remains ambiguous.

This study delves into the assessment of the influence wielded by reservoirs and dams on the reduction of flood discharges within the Rhine basin. Employing a spatially distributed version of the HBV model and Nash-cascade routing, daily discharges from 912 sub-catchments spanning the period 1951-2020 were simulated. The modeling approach comprehensively incorporates the influence of 192 reservoirs in the Rhine catchment on daily runoff volumes. Calibration at 200 gauging stations, facilitates a regional parameterization of the model, based on the PASS method.

Through various scenarios, the study explores how large-scale flood discharges would evolve in the absence of reserves for flood protection or if there were alterations to the storage capacity and function of individual reservoirs. Beyond merely assessing the reduction of runoff peaks, the research scrutinizes alterations in the duration of individual flood events and their spatial expansion, taking into account the intricate network of the 192 reservoirs.

In essence, this study not only contributes to the ongoing discourse on the efficacy of flood retention basins but also sheds light on the nuanced dynamics of reservoirs and dams in shaping the hydrological landscape of the Rhine basin. The findings provide valuable insights for optimizing flood protection strategies, encompassing considerations of storage capacities, operational functions, and the broader spatial and temporal dimensions of flood events.

How to cite: Merz, R., Speckhann, G. A., Nguyen, V. D., and Merz, B.: Can reservoirs and dams effectively reduce flood runoff in river basins? A case study of the Rhine basin, EGU General Assembly 2024, Vienna, Austria, 14–19 Apr 2024, EGU24-17145, https://doi.org/10.5194/egusphere-egu24-17145, 2024.

EGU24-17170 | ECS | Posters on site | ITS2.9/CL0.1.10

Decoding spatiotemporal pattern of flood episodes and climatic variability in western and eastern catchments of the Southern Alps, New Zealand. 

Alexander Schulte, Lothar Schulte, Juan Carlos Peña, Ian C. Fuller, Filipe Carvalho, and Sebastian Schulte

In the Northern Hemisphere, the PAGES Floods Working Group database documents 345 paleoflood studies, while in the humid temperate zones of the Southern Hemisphere, studies are limited due to differences in i) continent and ocean distribution, ii) population density, iii) settlement history, and iv) documentary sources. Assessing Southern Hemisphere flood trends becomes a significant goal in the context of Global Change. Our study focuses on spatial-temporal reconstruction and climatic characterization of floods in New Zealand's southern regions (43° – 47°S) from 1862 to 2020 CE.

Due to limitations in generating continuous flood series from the number of flood fatalities or economic losses over the past 160 years, we opted to reconstruct regional indices of historical flood severity and spatial incidence. To accomplish this, we compiled three regional synthetic flood databases from the New Zealand National Institute of Water and Atmospheric Research's catalogue of historical meteorological events. The flood severity matrix integrates various parameters, including numbers of fatalities, witness descriptions of peak flows, flooded areas, geomorphological impacts, losses of livestock, properties, and infrastructure, as well as information on evacuation and mitigation measures. We reanalyzed information from more than 8,000 data entries and reviewed 903 impact points to characterize a total of 295 floods. Additionally, the influence of climatic variability, as inferred from the Principal EOF of the Sea Level Pressure monthly anomalies, was reconstructed using data from the 20th Century Reanalysis Project.

The three flood damage series, comprising 295 floods, reveal several synchronous flood pulses around the years 1878, 1905, 1913, 1957, 1968, 1978, 1999, and 2008 CE. However, other flood pulses are out of phase due to different physiographic settings, catchment size, location on the western (West Coast) or eastern slope of the Southern Alps (Otago and Southland), and exposure to oceans and paths of weather systems.

Notably, in the West Coast Region with very high relief and steep slopes, the most severe floods occurred in spring and summer. Seven out of ten flood pulses recorded from 1862 to 2020 correlate with positive Southern Annular Mode, higher sea surface temperatures (SST), blocking weather types in summer, and lows over the Tasman Sea, resulting in increased humid airflows from the north and northwest.

The larger Otago catchments, comprising humid alpine relief in the northwest, dry basins and ranges in the central area, and humid lowlands in the east, experienced the maximum number of severe floods during summer. Ten out of fourteen pulses occurred during the positive phase of the Southern Oscillation Index (La Niña), characterized by higher SST, blocking types in summer and autumn, and an increase in northeasterly winds.

In contrast, the landforms of Southland, featuring lower ridges, gentler slopes, and large floodplains, saw floods primarily in summer and autumn. Ten out of fourteen pulses in this region correlated with negative phases of the Southern Oscillation Index (El Niño), characterized by lower sea surface temperatures, more zonal flow, and troughs with stronger and more frequent winds from the west in summer and the south in winter.

How to cite: Schulte, A., Schulte, L., Peña, J. C., Fuller, I. C., Carvalho, F., and Schulte, S.: Decoding spatiotemporal pattern of flood episodes and climatic variability in western and eastern catchments of the Southern Alps, New Zealand., EGU General Assembly 2024, Vienna, Austria, 14–19 Apr 2024, EGU24-17170, https://doi.org/10.5194/egusphere-egu24-17170, 2024.

Written mainly in German and partly in Latin, the chamberlain accounts of historical Pozsony/Pressburg (present-day Bratislava), almost continuously available between 1434 and 1595 and 1595, contain daily/weekly resolution data on Danube floods, low flows, ice cover and various weather phenomena. Analysed and presented for the first time, the 176 volumes of the accounts provide systematic, annual accounts of incomes and expenses, with only occasional gaps: flood- and weather-related reports are mainly included in the bridge masters’, the ferrymen’s, the ice-cutters’, the town messengers’, and the road and wall maintenance accounts. Furthermore, water-level related information occasionally was also identified in other sections of the accounts, regarding smaller bridges, river transportation, fishing, meadows and hayfields, woods, and other utilities of the nearby island area. With applying additional information available in the broader Bratislava area and the Carpathian Basin in other contemporary sources such as charters, letters, diaries and other narratives, it is possible to provide unusually high resolution, (quasi-)systematic three-scaled index-based quantitative reconstructions of the frequency, intensity, types (incl. ice-jam floods) and seasonality of Danube floods, and occasionally also of low water-levels.

The greatest floods usually occurred during flood-rich periods; unique great (ice-jam) floods outside of the flood-rich decades happened, for example, in 1454 and 1458. Flood-rich periods were identified during the 1430s-1440s, around the 1480s-1510s and in the mid- and late 16th century – while the first anomaly was also a period of a more frequent water-level variability including memorable low flows, the latter three periods coincide with major European flood-rich periods identified in the last 500 years (see Blöschl et al. 2020). As floods in Bratislava mainly reflect on the hydroclimatic conditions of the Upper-Danube and partly those of the Middle-Danube area, the dataset also provides exceptionally valuable, systematic information to the analysis of 15th-16th century (covering the famous, long Spörer solar minimum) climate variability in Central Europe. Furthermore, major groups of contemporary flood response, prevention and mitigation methods, especially detectable during flood-rich and low-flow periods, are also presented and analysed in the paper in comparison with the available other Middle-Danube (documentary and archaeological data based) evidence, in a broader Danube and Central European context.

How to cite: Kiss, A.: Danube floods, low flows and flood resilience at Bratislava in 1435-1595:Analysis of daily/weekly resolution flood-related evidence in a European context, EGU General Assembly 2024, Vienna, Austria, 14–19 Apr 2024, EGU24-18900, https://doi.org/10.5194/egusphere-egu24-18900, 2024.

EGU24-19193 | Posters virtual | ITS2.9/CL0.1.10 | Highlight

Shaping long-term human-environmental dynamics in a floodplain landscape of the Pannonian Plain (Central Europe) over the last millennium 

Zsolt Pinke, Balázs Pal, Beatrix F. Romhanyi, Csilla Zatyko, and Zsolt Kozma

Aiming at a deeper understanding of long-term feedback and interactions, here we reconstructed the changing socio-ecological system of a 9931 km2 wetland landscape over the last millennium. The study area is situated in the steppe-forest zone representing a major part of World Heritage inland salt grasslands in Europe.

Merging GIS-based historico-geographical and archaeo-topographical records from the 11th–mid-16th centuries, detailed spatiotemporal dynamics of settlement patterns, and random information on vegetation and economic activities were reconstructed. Testing the mean elevation of archaeological remains of settlements (sites) and the average soil agro-suitability in their buffer zones by non-parametric t-tests we found an extensive dispersion of settlements in the fertile deep floodplains at the turn of the 11th and 12th centuries but this reclaimed flood zone had been abandoned by the early 14th century. Statistical test results also suggested that the late medieval (LMA) (14th–mid-16th centuries) group was situated significantly higher than the high medieval (HMA) group (late 10th–13th centuries), and the deserted settlements were situated lower than the permanently settled group. Certain geomorphological formations, floodplain islands, and low fluvial ridges became scenes of settlement abandonment, while a dynamic concentration took place on high ridges. These outcomes suggest that the settlement pattern shrunk and vertically displaced significantly by the 14th-century beginning of the Little Ice Age (LIA) when hydrological challenges emerged all over Europe.

Testing the statistical-based settlement-indicated-flood-zone method in a 237 km2 area by an integrated hydrological model concerning the elevation of sites, we simulated the HMA, LMA, and late 18th-century extension of flood zones.

However, not only climatic conditions but anthropogenic transformation in runoff conditions of the upper catchment may also have triggered hydrological challenges in the low-lying plains. The reconstructed transformation of medieval settlement patterns in the Tisza basin (157000 km²) suggests that tens of thousands of square kilometers of virgin forests could have been destroyed in that age. Adapting to a changing hydro-climatic and socio-economic environment a complex community-based ‘livestock-water-crop farming’ trinity evolved, and livestock breeding and export became the strategic sector in the plain over the next centuries.

The socio-economic basis of mixed farming collapsed by the 18th century. As a response to chronic socio-economic backwardness and emerging hydro-climatic challenges, the aristocratic elite began the biggest river regulation in 19th-century Europe, which transformed the plain into a homogenous agricultural area (1950s cropland covering ~70 %).  However, this adaptation strategy failed, and the land use regime of the plain has fallen into a longstanding crisis today. To demonstrate this transformation between the late 18th century (water cover ~30 %) and today (water cover <5 %), we present a series of land cover reconstructions based on digitalized military maps (1782–1785, 1858, 1940–1944 and 1953–1959) and the Corine2018 dataset. Finally, we digitalized the first known flood map (2246 km²) of the region presenting the inundated areas during the catastrophic flood of 1879, the turning point of the century-long wetland reclamation, when the extension of inundated areas was essentially similar to that of the late 18th-century wetlands.

How to cite: Pinke, Z., Pal, B., F. Romhanyi, B., Zatyko, C., and Kozma, Z.: Shaping long-term human-environmental dynamics in a floodplain landscape of the Pannonian Plain (Central Europe) over the last millennium, EGU General Assembly 2024, Vienna, Austria, 14–19 Apr 2024, EGU24-19193, https://doi.org/10.5194/egusphere-egu24-19193, 2024.

EGU24-19865 | Orals | ITS2.9/CL0.1.10 | Highlight

What contradictory signals in flood trends can tell us about drivers of hydrological change 

Gregor Laaha, Johannes Laimighofer, Nur Banu Özcelik, and Juray Parajka

Flood trends are commonly assessed based on instantaneous peak flows on an hourly timescale, as these are most relevant for flood management. However, when hourly data are missing, it has been suggested to perform flood statistics on daily flood values instead, assuming a scaling relationship that depends on the shape of the flood hydrograph and applies over the entire observation period (e.g. Bartens & Haberlandt, 2021).

In an Austria-wide assessment, recent flood trends show diverging spatial patterns that contradict such a stationarity assumption. Interestingly, an aggravation of the flood situation is mainly observed for the peak flow (IPF), while the high values of the mean daily discharge (MDF) show much smaller and, importantly, less significant trends.

Rather than applying flood statistics corrections (e.g. Beylich et al. 2021), the aim of this contribution is to use flood divergence at different timescales as a mean of inferring likely drivers of flood trends. To this end, we combine several established and innovative indicators, such as a trend divergence index (peak versus daily flood scale), a seasonal trend index (to infer information about flood generation processes), and a seasonal shift index (to infer changes in the relevance of these processes). We show the extent to which these indices can inform us about likely drivers of change, i.e. climate-related vs. anthropogenic changes in the catchment. We discuss how these indicators perform in the light of existing flood scale indices, such as the flood timescale (Gaál et al., 2012) and the peak-volume ratio (Bartens & Haberlandt, 2021). The results suggest that the conflicting space-time patterns contain a wealth of information that is highly informative about changes in flood controls under global change.

References:

Bartens, A. and Haberlandt, U.: Flood frequency analysis using mean daily flows vs. instantaneous peak flows, HESS Discussions, https://doi.org/10.5194/hess-2021-466, 2021.

Beylich, M., Haberlandt, U., and Reinstorf, F.: Daily vs. hourly simulation for estimating future flood peaks in mesoscale catchments, Hydrology Research, 52, 821–833, https://doi.org/10.2166/nh.2021.152, 2021.

Gaál, L., Szolgay, J., Kohnová, S., Parajka, J., Merz, R., Viglione, A., and Blöschl, G.: Flood timescales: Understanding the interplay of climate and catchment processes through comparative hydrology, Water Resources Research, 48, W04511, https://doi.org/doi:10.1029/2011WR011509, 2012.

How to cite: Laaha, G., Laimighofer, J., Özcelik, N. B., and Parajka, J.: What contradictory signals in flood trends can tell us about drivers of hydrological change, EGU General Assembly 2024, Vienna, Austria, 14–19 Apr 2024, EGU24-19865, https://doi.org/10.5194/egusphere-egu24-19865, 2024.

Based on monthly resolved temperature and precipitation indices for Central Europe since 1500, which are derived from the virtual research environment tambora.org, statistical methods are presented to use the drought and moisture indices derived from tree ring data such as the scPDSI by Cook et al. (2015), long historical indexed flood series (Bloeschl et al (2020) as well as local and regional wine quality series to improve and refine periods of high and low water levels. Additionally, it will be demonstrated, how this approach can be used to interpolate climate parameters not only temporally but also spatially.

Therefore Bayesian methods are used to mutually verify and derive existing indices that are available on different scales. Furthermore, the references of indices to text quotes are mapped automatically. This not only makes the direct weather, weather and climate descriptions accessible, but also their immediate causes as well as the consequences and effects on the environment and societies. Overall, with this approach, new text quotes can be automatically analysed and integrated into the data pool. This also creates a bridge between historical and recent data and information.

How to cite: Kahle, M. and Glaser, R.: Statistical approaches to the integration of multi-proxy data for the reconstruction of high and low water episodes in Central Europe of the last millennium, EGU General Assembly 2024, Vienna, Austria, 14–19 Apr 2024, EGU24-20506, https://doi.org/10.5194/egusphere-egu24-20506, 2024.

EGU24-20773 | Orals | ITS2.9/CL0.1.10

Nationwide flood risk assessment using large ensemble climate change dataset and the Rainfall-Runoff-Inundation model 

Takahiro Sayama, Jiachao Chen, Yoshito Sugawara, and Masafumi Yamada

Floods pose significant threats, particularly in the context of climate change. This research focuses on a comprehensive analysis of river flooding nationwide in Japan. We utilize the latest dynamic downscaling data, d4PDF-5km, for the entire country, feeding this information into the Rainfall-Runoff-Inundation (RRI) model with a spatial resolution of 150 meters. The objective is to efficiently estimate the probability discharge of all rivers by developing a new method for extracting rainfall events from long-term ensemble data.

 The proposed method involves extracting heavy rainfall events from 720 years (12 ensembles of 60-year records) of downscaled data for each present, 2K and 4K scenarios and inputting them into the RRI model. This approach allows for the estimation of quantiles by analyzing peak flow as non-annual data with the peak-over-threshold method. When applied to the Shikoku region, the results demonstrate the effectiveness of the method, with the ability to estimate probability flows exhibiting a bias of 10% or less compared to a comprehensive calculation of all rainfall events.

 Furthermore, the research identifies variations in the increase of peak flow under climate change, particularly emphasizing differences between the main river and its tributaries. Notably, smaller rivers in the upper reaches are more significantly influenced by changes in rainfall patterns than the lower reaches of the main river.

 The implications of this research extend beyond hydrologic science. The estimated probability flows and corresponding hydrographs serve as crucial boundary conditions for assessing local flood risk. This information is fundamental for informed river management by governments and local authorities. Additionally, private companies, residents, and other stakeholders can utilize this data for robust risk assessments. In conclusion, our research provides valuable insights and a practical methodology for understanding and mitigating flood risks in Japan, taking into account the complexities introduced by climate change.

How to cite: Sayama, T., Chen, J., Sugawara, Y., and Yamada, M.: Nationwide flood risk assessment using large ensemble climate change dataset and the Rainfall-Runoff-Inundation model, EGU General Assembly 2024, Vienna, Austria, 14–19 Apr 2024, EGU24-20773, https://doi.org/10.5194/egusphere-egu24-20773, 2024.

EGU24-21588 | Posters on site | ITS2.9/CL0.1.10

A 1500-year flood history in Romania using multi-archive reconstructions 

Maria Rădoane, Ioana Perşoiu, Gabriela Florescu, and Aurel Perșoiu

This study integrates documentary, instrumental, archaeological and sedimentological data to reconstruct periods of increased flooding in present-day Romania over the last 1500 years.

We identified 22 flood-rich periods between AD 600-650, 830-930, 990 – 1020, 1060 – 1110, 1136 – 1165, 1195 - 1245, 1304 - 1317 and 1340 – 1373, 1400 – 1440, 1460 – 1470, 1490 – 1540, 1560 – 1580, 1592 – 1622, 1635 – 1657, 1667 - 1675, 1699 - 1731, 1771 - 1793, 1831 – 1864, 1890 - 1920, 1930s, 1970s - 1980s, 1990s – present. Our reconstructions show an increase in the incidence of floods during the Medieval Climate Anomaly and towards the end of the Little Ice Age.

In order to understand the potential causes behind these flooding events, we have used reconstructions of seasonally-distinct air temperature, precipitation amount and atmospheric circulation patterns based on an array of proxy records (e.g., cave ice and speleothem stable isotopes, tree ring-based proxies).

The most extensive floods were recorded between AD 1050-1250, mostly in the extra-Carpathian region, attributed to the advance of humid Eastern Mediterranean air masses. Currently, there is no conclusive information about their magnitude during the Migration Period, although the limited information of fluvial origin supports a reduced flood magnitude compared to the Medieval Climate Anomaly. Over the last 500 years, floods with maximum geomorphological effects occurred at the end of the 18th and 19th centuries (1770 – 1800 and 1880 – 1920) across the entire study area, against the background of an unstable climate, marked by the intensification of westerly Atlantic circulation and frequent northward incursions of Eastern Mediterranean cyclones. These were followed in magnitude by recent events (1990 - present), favored predominantly by warm and humid Eastern Mediterranean air masses, and the intensification of the westerly circulation of Atlantic origin at the onset of the Little Ice Age (1460 – 1470 and 1490 – 1530).

Alongside the climate signal, floods in the last 500 years also exhibit a strong anthropogenic component, accentuated in the last 250 years.

How to cite: Rădoane, M., Perşoiu, I., Florescu, G., and Perșoiu, A.: A 1500-year flood history in Romania using multi-archive reconstructions, EGU General Assembly 2024, Vienna, Austria, 14–19 Apr 2024, EGU24-21588, https://doi.org/10.5194/egusphere-egu24-21588, 2024.

EGU24-21845 | Orals | ITS2.9/CL0.1.10

Reconstructing historical flash flood events in South-Eastern Spain: An integrated approach with multiproxy records and hydrological modeling 

Filipe Carvalho, Lothar Schulte, Carlos Sánchez-García, Antonio Gómez-Bolea, and Juan Carlos Peña

Flash floods in Mediterranean catchments are a significant threat. Over the last decades, research in this area has normally focus on recent events, largely due to the absence of long-range instrumental data. However, alternative sources like historical records and natural archives can offer valuable insights and improve our knowledge of past events. In this study, we conduct a reconstruction of major flash flood events over the past century that have impacted several catchments in the South-Eastern Spain, specifically in the Almanzora, Antas and Aguas catchments.

Our study adopts a multidisciplinary approach for the reconstruction of flash floods. We integrate a variety of instrumental gauge data, historic water level indicators on buildings and bridges, and descriptions of inundated areas and flood heights from historical documents. Additionally, we incorporate biomarkers indicative of flood levels, identified through lichenometric analysis of rock surfaces affected by water flow. This combination of diverse proxy records enables us to estimate the peak flow heights at several crucial locations within the study area. For the reconstruction of the maximum flood discharge, we perform a one-dimensional hydrological model across all study sites and in select smaller areas requiring a detailed understanding of the hydraulic behavior, we apply two-dimensional models.

The findings of this study reveal that, despite the region's characteristic low annual precipitation (less than 300 mm), it is occasionally subjected to extreme rainfall events leading to significantly high peak discharges. Typically, these meteorological episodes are associated with atmospheric circulation patterns involving blocking systems along the Mediterranean coast. Hydraulic modeling has identified peak discharges exceeding 5000 m3 s-1 during a major flash flood event in October 1973. This event stands as the most devastating in the past century, resulting in loss of human lives and extensive damage to numerous settlements in all the studied catchments. While other notable flash flood events occurred in 1924 and 2012, they were of lesser magnitude compared to the 1973 flood. Post the 1973 disaster, various hydraulic modifications to the river system were implemented. These included for instance a channelization of significant portions of the Almanzora's main channel and some tributaries, as well as the construction of a large dam. These interventions have contributed to a reduced flood risk in certain areas of the catchment, particularly in the lower sections near the Mediterranean Sea outlet. Nevertheless, recent land use changes such as extensive agriculture and tourism could contribute to changes in flow regime and increased flood vulnerability.

How to cite: Carvalho, F., Schulte, L., Sánchez-García, C., Gómez-Bolea, A., and Peña, J. C.: Reconstructing historical flash flood events in South-Eastern Spain: An integrated approach with multiproxy records and hydrological modeling, EGU General Assembly 2024, Vienna, Austria, 14–19 Apr 2024, EGU24-21845, https://doi.org/10.5194/egusphere-egu24-21845, 2024.

EGU24-21886 | Posters on site | ITS2.9/CL0.1.10

Wetland restoration and its effects on the hydrological conditions and provisioning ecosystem services – a model-based case study at a Hungarian lowland catchment 

Zsolt Kozma, Tamás Ács, Bence Decsi, Máté Krisztián Kardos, Dóra Hidy, Mátyás Árvai, Péter Kalicz, Zoltán Kern, and Zsolt Pinke

The alluvial character of the Great Hungarian Plain has long determined its land use. Human-environmental interactions and landscale patterns were characterised by adaptation to frequent floods and high water availability. Different socio-economical factors in the 18-19th centuries initiated major drainage works and river regulations. These works aimed to adjust hydrological conditions in the floodplains to meet the demands of a new land use approach. This focused on maximizing crop production as the dominant provisioning ecosystem service (ES) instead of the previous land use practice (e.g utilization a broader range of various ES by adaptition).

Over time, this new land use-water management strategy led to a trajectory of constrains: 1) Water demands of the agricultural landscape are restricted to a much narrower range than natural hydrological conditions, leading to damages during extremely dry or wet conditions; 2) Artificial drainage attempts to ensure this narrow range during wet periods in the protected former floodplain areas; 3) However, drainage increases water scarcity and drought damage during consecutive dry periods, which cannot be compensated by the irrigation system due to its limited capacity.

As a result of this outdated strategy and contemporary processes, Hungarian landscape management is facing a crisis. Climate and hydrological changes, the aging farmer community, agricultural sector profitability, alterations in the land use subsities, preferring greening and afforestation are among the leading factors of this crisis. These factors are likely to drive current land use conditions into a significantly altered riverine landscape scenario in the coming decades. Among the current environmental-economic-regulatory conditions, one of the most feasible alternative scenario focuses on water retention and the corresponding adaptive land use. However, the hydrological impacts of such alternative water management-land use on crop yield remain poorly understood.

We examined this by using hydrological simulations at a 272 km2 study site located next to the River Tisza. Here, the morphology of the heterogeneous terrain offers a remarkable semi-natural storage capacity as it encompasses a deep floodplain area.

We defined six different water governance-land use scenarios. First, three water management scenarios were defined and simulated: reference, excess water retention, and flood retention. Along these scenarios inland excess water (a specific type of flooding) hazard maps were used as an indicator for potentially reclaimable floodplains. Next, an alternative land use map was derived following the prevailing Hungarian landscape planning logic, considering factors such as present location and proportion of current agricultural croplands, grasslands, forests, settlement; soil conditions, water availability (agricultural suitability), and nature conservation status.

An integrated hydrological model was set up with the MIKE SHE software to depict spatio-temporal variations in water resources under present conditions (with an operational drainage system) and for all described alternative cases (without a drainage system). Simulated groundwater levels were a key output used to estimate changes in crop yields at selected pointwise locations. The results indicate significant potential for nature-based hydrological adaptation and co-benefits for provisioning ES.

The project FK20-134547 has been implemented with the support provided from the National Research, Development and Innovation Fund of Hungary.

How to cite: Kozma, Z., Ács, T., Decsi, B., Kardos, M. K., Hidy, D., Árvai, M., Kalicz, P., Kern, Z., and Pinke, Z.: Wetland restoration and its effects on the hydrological conditions and provisioning ecosystem services – a model-based case study at a Hungarian lowland catchment, EGU General Assembly 2024, Vienna, Austria, 14–19 Apr 2024, EGU24-21886, https://doi.org/10.5194/egusphere-egu24-21886, 2024.

HS13 – Further sessions of interest to Hydrological Sciences

EGU24-224 | Posters on site | GM4.2

Assessment of sediments dynamics through the identification of main deposition shapes in large reservoirs  

Jose Luis Molina, Fernando Espejo, Jorge Mongil-Manso, Teresa Diez-Castro, Santiago Zazo, and Carmen Patino-Alonso

Sediment deposition at the bottom of artificial reservoirs have become a worldwide problem that represent a dual problem. First, it is related to the reduction of storage capacity and lifetime. In this sense, associated impacts may comprise a capability reduction to provide water for irrigation, hydropower production and other uses, as well as to intercept floods and regulate the flow. Second, problems come from the threat that the sediment represents for the dam structure. In case the sediment deposits get too close from the structure, they may block the outlets affecting the dam safety. Also, if high-charged water pass through the turbines, it causes abrasion of mechanical equipment. This may generate inefficiencies such as decrease power generating efficiency and ultimately production loss. This primarily stems from the absence of a holistic and integrated strategy for creating a durable and sustainable strategy for managing sedimentation in dams and reservoirs.  In this sense, a whole plan should incorporate a sequential nature that incorporate three chronological phases: preventive, mitigative and corrective measurements. It is clear the lack of preventive actions that have taken during the initial decades of dam/reservoirs functioning. The main objective of this work is to identify the main sediment deposition shapes in large reservoirs that allows inferring the driven processes. Based on the pervious analysis, 6 categories of shapes have been identified based on 4 parameters listed as follows: slope continuity, slope break, absolute and relative slope, and arc configuration. In this sense, categories are:  Flat Areas (FA), SubFlat Areas (SFA), Breaking Lines (BL), Vertical Jumps (VJ), Non-Vertical Jumps (NVJ) and Arc-Shapes. This will allow inferring the main deposition and transport processes that may help to prevent, palliate and/or correct this phenomenon. This research was applied in Rules reservoir (Granada) which is key hydraulic infrastructure with huge sediments issues. Future policies will have to implement a plan route incorporating scientific analysis taking to consideration sediments dynamics.

Keywords: dynamics, bathymetric measurement, dam sedimentation, hydraulic infrastructure, storage capacity

How to cite: Molina, J. L., Espejo, F., Mongil-Manso, J., Diez-Castro, T., Zazo, S., and Patino-Alonso, C.: Assessment of sediments dynamics through the identification of main deposition shapes in large reservoirs , EGU General Assembly 2024, Vienna, Austria, 14–19 Apr 2024, EGU24-224, https://doi.org/10.5194/egusphere-egu24-224, 2024.

EGU24-1049 | ECS | Orals | GM4.2

Exploring Uncertainties Within a Framework for Assessing Extreme Precipitation-Induced Cascading Hazards in the Himalayas  

Sudhanshu Dixit, Srikrishnan Siva Subramanian, and Sumit Sen

The Himalayas are increasingly vulnerable to the impacts of climate change, with recent years experiencing a surge in the frequency of natural hazards. The risk escalates when events unfold in a cascading manner, where a primary hazard triggers a secondary one. Therefore, it is crucial to develop an integrated framework to assess the ramifications of these cascading hazards. This framework plays a pivotal role in providing early warnings, considering the uncertainty introduced by rainfall input. The presented framework simulates the dynamic interplay between intense precipitation events and hill slopes, potentially triggering landslides. It subsequently models the debris flow resulting from the runoff formed by precipitation mixing with landslide deposits, culminating in debris runout. To address data uncertainties, the framework integrates four diverse precipitation data sources: gridded observation datasets, reanalysis data, satellite data, and numerical weather prediction models. The methodology assesses sediment volume originating from hillslopes and anticipates the sediment volume reaching river junctions during extreme events. Additionally, it involves the numerical simulation of the initial stages of the cascading nature of geohazards, specifically the transformation of landslides into debris flows. The framework's validation is conducted using the 2013 North India Floods, an extreme precipitation event that triggered over 6000 landslides and debris flows.

How to cite: Dixit, S., Subramanian, S. S., and Sen, S.: Exploring Uncertainties Within a Framework for Assessing Extreme Precipitation-Induced Cascading Hazards in the Himalayas , EGU General Assembly 2024, Vienna, Austria, 14–19 Apr 2024, EGU24-1049, https://doi.org/10.5194/egusphere-egu24-1049, 2024.

EGU24-1577 | Posters on site | GM4.2

Exploring connections between liquid/solid runoff fractions and water quality in large reservoirs´ catchments through Multivariate statistics  

Jorge Mongil-Manso, Carmen Patino-Alonso, José Nespereira-Jato, José-Luis Molina, Fernando Espejo, María-Teresa Díez-Castro, and Santiago Zazo

In river environments, the interaction between liquid and solid runoff fractions plays a crucial for understanding water flow. The magnitude of liquid runoff is directly influenced by of sediments levels, impacting water resource management and quality. Sediment mobilization by total runoff fundamentally shapes river morphology. The imperative need to comprehensively understand hydrological behavior leads us to examine the relationship between these variables and water chemical aspects. Understanding the intricate dynamics between liquid and solid runoff, influenced by sediment levels and chemical variables, is crucial for the effective sediment management of reservoirs. Multivariate statistics are commonly used to identify factors influencing sediment production during hydrological processes. The objective of this study is to apply Partial Least Squares Regression (PLSR) to identify and understand the relationship between chemical variables as predictors and hydrological processes (liquid and solid runoff), allowing a comprehensive assessment of their influence in river environments.  The case study was conducted in the Rules (Granada), Casasola, and La Viñuela reservoirs (Málaga). The results indicated a positive correlation between sediments (solid runoff) and variables such as pH, Clay (CY), Silt (ST), and Carbonates (CA). This means that as sediment levels increase, these variables also show an increasing tendency. Nevertheless, this study also revealed a negative association between sediments and Dissolved Oxygen (EG) and sand (SD) implying that as sediment levels rise, Dissolved Oxygen and sand content tend to decrease. In terms of liquid runoff, a direct relationship was primarily observed with electrical conductivity (CE), Organic Matter (MO), and Sand Content (SD). This suggests a positive connection between these variables, where higher liquid runoff is associated with higher values of electrical conductivity, organic matter, and sand content. Chemical parameters manifest in two distinct groups: one shows a strong positive relationship with sediments (pH, CY, ST, and CA), while the other (CE, MO, SD, and EG) is associated with liquid runoff. In conclusion, the study underscores the intricate dynamics between liquid runoff, sediments (solid runoff), and chemical variables in river systems, using PLSR to unveil relationships. In summary, this study underscores the crucial connection between total runoff (water and sediments), and chemical variables in river environments. These findings highlight the complexity of interactions in river systems, providing valuable insights for water management and understanding hydrological processes. Furthermore, the interaction between liquid and solid runoff fractions in river environments has direct applications for sediment management in reservoirs, enhancing decision-making knowledge for authorities.

How to cite: Mongil-Manso, J., Patino-Alonso, C., Nespereira-Jato, J., Molina, J.-L., Espejo, F., Díez-Castro, M.-T., and Zazo, S.: Exploring connections between liquid/solid runoff fractions and water quality in large reservoirs´ catchments through Multivariate statistics , EGU General Assembly 2024, Vienna, Austria, 14–19 Apr 2024, EGU24-1577, https://doi.org/10.5194/egusphere-egu24-1577, 2024.

Sediment connectivity is a pivotal concept in geomorphological studies aimed at assessing watershed sediment dynamics. It is expressed through the spatial arrangement and physical linkages of system components (Structural Connectivity, SC) and the actual transfer of water and sediments facilitated by dynamic processes (Functional Connectivity, FC). However, a limited number of studies have simultaneously assessed SC and FC. Moreover, traditionally sediment connectivity studies primarily rely on comparing independent results from GIS modelling, field-based assessments, and mapping. Thus, it remains a common practice to treat geomorphic processes and connectivity as separate variables, often without joining them into an integrated modelling approach.

Accordingly, this research aims to introduce a novel methodology that integrates geomorphological data derived from a detailed mapping approach with SC and FC. In particular, we developed a new GIS-based integrated model named HOTSED, designed to assess potential hotspots of sediment sources and related sediment dynamics at the watershed scale.

We tested our approach in a geomorphologically highly active Mediterranean watershed in the Northern Apennines (Italy), starting with the elaboration of an Inventory Map (IM) of sediment sources through fieldwork, photointerpretation, terrain analysis, and digital mapping. Furthermore, we used IM-derived data to estimate the geomorphic Potential of Sediment Sources (PSS) adopting a relative scoring system. Moreover, we computed Structural Sediment Connectivity (STC) and the Potential for Sediment Transport (PST) by combining terrain and hydrological parameters, land use data, and rainfall erosivity. Subsequently, the integration of PSS, STC, and PST was achieved through a raster-based calculation method, yielding the HOTSED model.

The application of the model in the study area provided a single and intuitive output depicting the location of hotspots of sediment sources. It allowed the derivation of “relative hazard” classes for sediment production and delivery using the fluvial system as target feature. The results show that HOTSED successfully highlighted hotspots associated with active complex and polygenetic geomorphic systems located in areas close to the main channels, as well as linear hotspots corresponding to tributary drainages acting as stream corridor sources. Furthermore, it successfully identified areas prone to store sediments in depositional landforms with low hazard, considering both low geomorphic potential and sediment connectivity. Thus, this study proves that our conceptual model is particularly effective in geomorphologically complex areas such as the Northern Apennines.

How to cite: La Licata, M., Bosino, A., Sadeghi, S. H., and Maerker, M.: Assessing hotspots of sediment sources and related sediment dynamics through the integration of geomorphological data, sediment connectivity and sediment transport modelling – The HOTSED model, EGU General Assembly 2024, Vienna, Austria, 14–19 Apr 2024, EGU24-4101, https://doi.org/10.5194/egusphere-egu24-4101, 2024.

EGU24-4411 | ECS | Posters virtual | GM4.2

Reconstruction of spatial and temporal variability of debris flow in northern Apennines (Italy): Case study of the Alpe di Succiso area 

Muhammad Ahsan Rashid, Giovanni Leonelli, Roberto Tinterri, Roberto Valentino, and Alessandro Chelli

Debris flows are within the most common and extensive natural hazards in mountain areas, where they may impact humans and their assets. On the surroundings of Alpe di Succiso (2000 m a.s.l., Reggio Emilia Province, Italy) multiple debris flows can be found but there is no information about the spatial and temporal variability. To fill the gap, various methods such as geomorphological mapping, geo-mechanical classification of source areas, grain size analysis, dendro-geomorphic method and climate data have been used to assess the spatial extent and the past occurrence of debris-flow events. Here the preliminary results of the analysis performed in the Fossa Lattara Site, NW of Alpe di Succiso, are shown.

The landforms and deposits present in the surroundings of Alpe di Succiso are the product of different morphogenesis (glacial, gravitational, and torrential) which revealed the evolution of the morpho-climatic conditions that have affected the study area over time. Field work has been carried out to identify the morphological features of debris flows revealing distinctive features such as detachment scarps, debris flow cones, lobes, levees, and channels.

To understand the slope stability mechanism of the source area, a discontinuous survey was conducted and it is found that wedge failure is common. Additionally, in both source and depositional areas, grain size analysis was performed by using various methods: direct field measurement was used for particles greater than 16 mm, a sieve analysis covered the range from 2 to 16 mm, and the laser granulometer technique was applied to particles smaller than 2 mm. Notably, the coarser particles were abundant in depositional area than source area.

On forested areas, dendro-geomorphic analysis contributes to detection of trends of debris flow. Dendro-geomorphic technique is based on the identification of growth anomalies recorded by the annual rings of trees disturbed by debris flows. For debris flow dating, identification of reaction wood, abrupt growth changes and eccentric growth are essential.  Trees samples from debris flow area and reference sites (undisturbed areas) have been collected on site to cross date climate influences and debris flow events. According to the dendro-chronological preliminary results, the debris flow was identified in 1989, 2013 and 2017. Further, debris flow events are linked with precipitation events of the study area.

Moreover, daily rainfall depths in the period 1961-2022 have been collected from ARPAE Emilia Romagna database to understand the impact of climate change on debris flow and it is observed that daily precipitation intensity (dpi) has increased from 1961 to 2022. Seasonal variations are also observed. Noticeably, in the months of December, January, and February the sum of dpi has increased by 162 to 220 mm. Future studies will be performed to analyze the effects of climate change on debris flow.

How to cite: Rashid, M. A., Leonelli, G., Tinterri, R., Valentino, R., and Chelli, A.: Reconstruction of spatial and temporal variability of debris flow in northern Apennines (Italy): Case study of the Alpe di Succiso area, EGU General Assembly 2024, Vienna, Austria, 14–19 Apr 2024, EGU24-4411, https://doi.org/10.5194/egusphere-egu24-4411, 2024.

EGU24-5386 | ECS | Orals | GM4.2

How is climate change affecting hydro-meteorological triggering for debris flows? An assessment based on convection-permitting models and a bias-neutral procedure 

Andrea Menapace, Eleonora Dallan, Francesco Marra, Lorenzo Marchi, Michele Larcher, and Marco Borga

Debris-flow activity is expected to change in the future following the expected changes in sub-daily rainfall rates. In this study, we connect high-resolution climate simulations from an ensemble of recently developed convection-permitting models (CPM) and a threshold-based precipitation model for debris-flows triggering. We are considering CPM runs over historical (1996-2005), near future (2041-2050) and far future (2090-2099) decade-long periods. Given the biases affecting the CPM simulations and the desire to avoid bias-correction procedures, which may introduce distortions into the precipitation simulations, we propose a methodology to map the debris-flow threshold into the simulated climates. This is obtained by evaluating the return levels of the threshold precipitation rates at different durations, and mapping these in the climate simulations using the same return levels. The Simplified Metastatistical Extreme Value (SMEV) methodology is exploited for the precipitation statistical analysis. The suitability of the proposed framework is tested on the Moscardo catchment, a small study basin located in the eastern Italian Alps, where the debris flow activity is mainly transport-limited. This case study is particularly remarkable due to the high frequency of debris flows and a monitoring system working since 1990, which has permitted establishing reliable rainfall . The debris-flow triggering precipitation events are assessed by considering changes in their frequency, depth and seasonality. The promising preliminary results support the use of this approach to assess debris flow hazards in a changing climate.

How to cite: Menapace, A., Dallan, E., Marra, F., Marchi, L., Larcher, M., and Borga, M.: How is climate change affecting hydro-meteorological triggering for debris flows? An assessment based on convection-permitting models and a bias-neutral procedure, EGU General Assembly 2024, Vienna, Austria, 14–19 Apr 2024, EGU24-5386, https://doi.org/10.5194/egusphere-egu24-5386, 2024.

EGU24-5581 | ECS | Orals | GM4.2

Quantifying the effects of rainfall temporal variability on landscape evolution processes 

Taiqi Lian, Nadav Peleg, and Sara Bonetti

Rainfall characteristics such as intensity, duration, and frequency are key determinants of the hydro-geomorphological response of a catchment. The presence of non-linear and threshold effects makes the relationship between rainfall variability and geomorphological dynamics difficult to quantify. This is particularly relevant under predicted exacerbated erosion induced by an intensification of hydroclimatic extremes. In this study, we quantify the effects of changes in rainfall temporal variability on catchment morphology and sediment erosion, transport, and deposition across a broad spectrum of grain size distributions and climatic conditions. To this purpose, multiple rainfall realizations are simulated using a numerical rainfall generator, while geomorphic response and soil erosion dynamics are assessed through a landscape evolution model (CAESAR-Lisflood). Virtual catchments are used for the numerical experiments and simulations are conducted over centennial time scales. Simulation results show that higher rainfall temporal variability increases net sediment discharge, domain erosion and deposition volumes, and secondary channel development. Particularly, dry regions respond more actively to rainfall variations and finer grain size configurations amplify the hydro-geomorphological response. We find that changes in erosion rates due to rainfall variations can be expressed as a power-law function of the ratio of rainfall temporal variabilities (quantified here through the Gini index). Results are further supported by long-term observational data and simulations over real catchments. Such quantification of the effects of predicted changes in rainfall patterns on catchment hydro-geomorphic response, as mediated by local soil properties, is crucial to forecasting modifications in sediment dynamics due to climate change.

How to cite: Lian, T., Peleg, N., and Bonetti, S.: Quantifying the effects of rainfall temporal variability on landscape evolution processes, EGU General Assembly 2024, Vienna, Austria, 14–19 Apr 2024, EGU24-5581, https://doi.org/10.5194/egusphere-egu24-5581, 2024.

EGU24-8030 | ECS | Posters on site | GM4.2

The use of normalized difference vegetation index (NDVI) in sediment connectivity analysis: insights for considering land cover changes in Sediment flow Connectivity Index (SfCI) 

Marina Zingaro, Giovanni Scicchitano, Alberto Refice, Alok Kushabaha, Antonella Marsico, Deodato Tapete, Alessandro Ursi, and Domenico Capolongo

Land cover plays a fundamental role in surface dynamics that involve sediment connectivity. The processes of sediment erosion, transport and deposition are strongly conditioned by land coverage types (classes) that physically can mitigate, prevent or increase sediment production and mobility on the surface. In fact, land cover and land use data are required for the computation of some indices and models of sediment connectivity. However, it should be considered that land cover changes can impact these processes, especially if they occur over a short period of time.

This work presents an assessment of land cover changes in three different hydrographic basins (river Severn basin in UK, river Vernazza basin in northwestern Italy and Lama Camaggi basin in southern Italy) in relation to their respective sediment connectivity patterns, described by Sediment flow Connectivity Index (SfCI) in previous works (Zingaro et al., 2019; Zingaro et al., 2020; Zingaro et al., 2023). The main aim is to evaluate the use of normalized difference vegetation index (NDVI) to consider land cover changes in sediment connectivity analysis. The NDVI is computed from satellite multi-spectral images (Sentinel-2) in time period between the reference year of the land cover used in previous SfCI calculation and the last year (2023) in each of study area. The results show that (1) NDVI highlights the occurrence of land cover changes over short time periods in many areas of the basins, (2) the introduction of NDVI in SfCI modifies sediment mobility values also affecting the definition of sediment connectivity pattern.

The use of NDVI can improve the analysis of sediment connectivity by providing more dynamism in the description of sediment pathways on both spatial and temporal scales. The present experimentation gives new insights to consider surface cover changes in SfCI contributing to update the algorithm and to investigate the possibility of its enhancement.

Acknowledgments

Research performed in the framework of the project “GEORES - Applicativo GEOspaziale a supporto del miglioramento della sostenibilità ambientale e RESilienza ai cambiamenti climatici nelle aree urbane”, funded by the Italian Space Agency (ASI), Agreement n. 2023-42-HH.0, as part of ASI’s program “Innovation for Downstream Preparation for Science” (I4DP_SCIENCE).

References

  • Zingaro, M.; Refice, A.; Giachetta, E.; D’Addabbo, A.; Lovergine, F.; De Pasquale, V.; Pepe, G.; Brandolini, P.; Cevasco, A.; Capolongo, D. Sediment Mobility and Connectivity in a Catchment: A New Mapping Approach. Science of The Total Environment 2019, 672, 763–775, doi:10.1016/j.scitotenv.2019.03.461.
  • Zingaro, M.; Refice, A.; D’Addabbo, A.; Hostache, R.; Chini, M.; Capolongo, D. Experimental Application of Sediment Flow Connectivity Index (SCI) in Flood Monitoring. Water 2020, 12, 1857, doi:10.3390/w12071857.
  • Zingaro, M.; Scicchitano, G.; Palmentola, P.; Piscitelli, A.; Refice, A.; Roseto, R.; Scardino, G.; Capolongo, D. Contribution of the Sediment Flow Connectivity Index (SfCI) in Landscape Archaeology Investigations: Test Case of a New Interdisciplinary Approach. Sustainability 2023, 15, 15042, doi:10.3390/su152015042.

How to cite: Zingaro, M., Scicchitano, G., Refice, A., Kushabaha, A., Marsico, A., Tapete, D., Ursi, A., and Capolongo, D.: The use of normalized difference vegetation index (NDVI) in sediment connectivity analysis: insights for considering land cover changes in Sediment flow Connectivity Index (SfCI), EGU General Assembly 2024, Vienna, Austria, 14–19 Apr 2024, EGU24-8030, https://doi.org/10.5194/egusphere-egu24-8030, 2024.

EGU24-10204 | Orals | GM4.2

A stochastic landscape evolution model framework for debris flow and fluvial processes 

Dingzhu Liu, Hui Tang, Jean Braun, and Jens Turowski

Debris flow is an important process that shapes steep landscapes, connecting the hillslopes and fluvial domains. Yet, it is unclear how debris flows quantitatively influence the topography. Here, we propose and develop a new framework considering debris flows as stochastic processes in long-term landscape evolution. We assume that debris flows occur randomly in time with different initial debris flow volumes, which we model using five different distribution functions. Debris flows propagate along the channel and increase their volume by eroding additional material using deterministic equations. The model predicts the slope-area relationship that is generally assumed to be indicative of debris-flow-dominated landscapes. We suggest a new equation to fit the slope-area relationship, including both debris flow and fluvial domains. This equation features a total of five metrics, two of which are power law exponents, two are representative areas, and one representative slope. The topography in the debris flow-dominated domain is sensitive to the properties of the debris flow, e.g., the initial volume of debris flow, frequency, erosion coefficient, Manning coefficient, uplift rate, and channel width and length. The representative slope and area are primarily sensitive to the total initial volumes of the debris flow, and secondarily to the frequency of occurrence of debris flows. The type and shape parameters of distributions and the debris flows’ volume and frequency have limited effects on the slope-area relationship.

How to cite: Liu, D., Tang, H., Braun, J., and Turowski, J.: A stochastic landscape evolution model framework for debris flow and fluvial processes, EGU General Assembly 2024, Vienna, Austria, 14–19 Apr 2024, EGU24-10204, https://doi.org/10.5194/egusphere-egu24-10204, 2024.

Devoting more efforts to understand how arid landscapes respond to extreme rainfall events, given the expected increase in storm frequency in the future due to global warming projections, is of great relevance and therefore needs to be addressed. While local studies of recent storm impacts in drylands have proven to be useful, our understanding of global impacts at local-and-regional-scales over longer time-scales is now more qualitative than quantitative.

Deciphering the effects of erosion runoff processes operating during extreme rainstorm events requires developing practical measuring approaches that assist understanding the temporal and spatial extent of erosion and sediment pathways in the ephemeral drainage networks of bare lands. The advent of Synthetic Aperture Radar (SAR) satellite missions with, for example, the Sentinel 1 constellation from the ESA, has provided a great number of images that can be used to map the areal and temporal extent of erosion during rainstorm events. As a result, we are now able to unravel surface runoff erosion operating in arid areas using InSAR coherence change detection following, for example, the work of Cabré et al. (2020, 2023). Interferometric SAR (InSAR) coherence can be used to decipher the sediment entrainment areas and identify channels and drainages disturbed by the passage of floods. However, the coherence remains a dimensionless parameter with no physical meaning of surface change. Thus, it cannot be used yet to estimate surface change processes in an automatic basis. For this reason, we have explored the areas with surface change identified in InSAR coherence images using SAR amplitude and field calibration data. In the identified surface change areas we have performed grain-size measurements to prove that sediment grain-size diameter (e.g., D84, D50) in ephemeral channels is well correlated (R=0.93 and 0.72, respectively) with SAR amplitude values and therefore can be used to (i) unravel the downstream variations in grain-size by providing valley-floor grain-size maps and, (ii) identify fluvial features (e.g., longitudinal bars) preserved within the ephemeral channels after the passage of a flood. The latter can be of wide application to monitor ungauged ephemeral channels in arid areas worldwide and provide insights about the dryland sedimentary system dynamics during extreme storm events.

How to cite: Cabré, A., Marc, O., Remy, D., and Carretier, S.: Integrating InSAR coherence and SAR amplitude to unravel the surface change processes operating during extreme rainstorm events in the Atacama Desert., EGU General Assembly 2024, Vienna, Austria, 14–19 Apr 2024, EGU24-10362, https://doi.org/10.5194/egusphere-egu24-10362, 2024.

EGU24-10429 | ECS | Orals | GM4.2

Interaction Between Large Wood and Sediment Transport in an Alpine Torrent in the Dolomites 

Marco Martini, Francesco Bettella, and Vincenzo D'Agostino

Large wood (LW), defined as woody pieces exceeding 1 m in length and 10 cm in diameter, significantly shapes channel morphology and ecological habitats within Alpine torrents. Lower-order alpine torrents, with their smaller drainage areas and steeper gradients, are particularly sensitive to LW dynamics. The movement of LW greatly affects channel processes, altering flow patterns and sediment dynamics. LW can retain sediments and form log steps that may reduce bed erosion. Moreover, the accumulation of LW at bridge piers and filters or openings of retention check dams can exacerbate flood hazards, emphasizing the crucial need for its accurate quantification for more effective hazard assessments and protection measure design. Our investigation aims to assess changes in the LW budget in the Ru de Vallaccia catchment (covering 1.72 km2, Melton number 0.97, mean channel slope 45%) in the province of Belluno, Veneto, Italy. Specifically, we explore variations in LW volume before and after a heavy rainstorm event with a return period between 2 and 5 years that occurred between the 30th of October and the 2nd of November 2023. Furthermore, this study examines the correlation between segments of the channel affected by sediment erosion and deposition and changes in both the spatial distribution and volume of LW within the channel. Field surveys coupled with high-resolution topography (HRT) assessments conducted before and after the rainstorm event (July and November 2023) allow for a comprehensive evaluation of sediment and LW budgets. Our methodology involves direct field measurements of LW and photointerpretation using GIS software on orthophotomosaics resulting from HRT surveys. Additionally, we utilize the Digital Elevation Model (DEM) obtained from HRT surveys to analyze channel geomorphological changes through the DEM of Differences (DoD) technique, enabling precise quantification and visualization of sediment alterations related to erosion and deposition phenomena. Preliminary findings reveal pronounced sediment mobility, significant alterations in channel morphology, and notable changes in both the spatial distribution and volume of LW. The results of the study highlight the close link between patterns of erosional or depositional sediment dynamics and alterations in the LW budget, elucidating the intricate interaction between geomorphic processes and the presence and evolution of LW during subsequent flood events in steep mountain basins. In addition, these insights have substantial implications for addressing or guiding periodic monitoring of LW and thereby improving our hazard mitigation strategies against those sediment transport events (bedload, debris flood, and debris flow) capable of encompassing significant amounts of LW.

How to cite: Martini, M., Bettella, F., and D'Agostino, V.: Interaction Between Large Wood and Sediment Transport in an Alpine Torrent in the Dolomites, EGU General Assembly 2024, Vienna, Austria, 14–19 Apr 2024, EGU24-10429, https://doi.org/10.5194/egusphere-egu24-10429, 2024.

EGU24-10776 | Orals | GM4.2

Amplified Risk: How Climate Change is Modifying the Risks from Geological Hazards 

Mary Antonette Beroya-Eitner, Heidi Stenner, Luke Bowman, and Kate Nelson

The global climate is changing, and the effects of these changes on natural hazards are increasingly being felt, particularly by the populations in low- and middle-income countries. Consequently, in the last decades, there has been much research examining the extent of these effects, but the focus has largely been on hydrometeorological hazards. The potential effects of climate change on geological hazards, like earthquakes and volcanic activity, is less studied and deserves greater attention.

Amplified Risk is a four-year program currently being led by the GeoHazards International (GHI), a non-profit committed to saving lives by empowering at-risk communities worldwide to build resilience ahead of disasters and climate impacts. Funded by the United States Agency for International Development (USAID), the overarching goal of the program is to increase collective understanding of how volcanic and earthquake hazards and their societal impacts may be affected by climate change in at-risk low- and middle-income countries.

In line with this, we have thus far explored through literature review and subject matter expert consultations how climate change may alter earthquake and volcanic processes and associated hazards, considering eight climate change signals as the starting point: increased precipitation, decreased precipitation, increased temperature, increased rain-drought cycles, increased free-thaw cycles, increased typhoons, increased wind and sea level rise. Our results show the potential amplifying, cascading, and compounding effects of climate change on geological hazards.   

In general, climate change can affect earthquake and volcanic hazards in two ways: Firstly, it can directly trigger or contribute to directly triggering the hazards as a result of stress regime change following climate-induced variations of loads on the earth surface, mainly due to changes in the volume of ice and water, e.g., glacier melting. Secondly, climate change prepares the ground so that the occurrence of secondary hazards becomes more likely should an earthquake or volcanic eruption occur. For instance, increased precipitation increases soil saturation, making liquefaction more likely in the event of an earthquake.     

In this presentation, we discuss the findings to date in more detail. We also present the flowchart that summarizes our result, which we intend to publish online as an interactive informational tool that may be useful to risk managers, authorities, community leaders, and researchers in appraising the range of effects from climate change on local hazards, and therefore in determining and prioritizing intervention measures.

How to cite: Beroya-Eitner, M. A., Stenner, H., Bowman, L., and Nelson, K.: Amplified Risk: How Climate Change is Modifying the Risks from Geological Hazards, EGU General Assembly 2024, Vienna, Austria, 14–19 Apr 2024, EGU24-10776, https://doi.org/10.5194/egusphere-egu24-10776, 2024.

EGU24-13482 | ECS | Orals | GM4.2

Secondary Lahars Impacting on Building Structures at Chimborazo Volcano: A Retrospective and Scenario-Based Modeling Approach 

Simon Mühlbauer, Theresa Frimberger, and Michael Krautblatter

The intense melting of glacial ice and permafrost can increase the presence of temporarily stored liquid water in dynamic high-alpine environments. A sudden release of this water, especially in volcanic settings, might trigger a process chain of severe consequences. During a period of increased periglacial degradation between 2015 and 2017, several large-volume (> 6.0 × 10⁵ m³), outburst-related secondary lahars damaged local infrastructure on the populated southeastern slopes of Chimborazo volcano in Ecuador. The insufficient understanding of secondary lahars associated with the sudden outburst of water complicates the identification of initiating processes and hinders the ability to decipher the governing mechanisms involved during propagation.

In this study, we present how we (1) identified initiation mechanisms of past secondary lahars at Chimborazo, (2) numerically back-calculated these events, (3) developed future lahar scenarios, and (4) quantified their impact on the local population. We performed a retrospective calibration approach to simulate a secondary lahar using the physics-based model RAMMS::Debris Flow. By introducing a novel two-stage outburst scenario development concept, we were able to predict potential future lahars. Finally, applying a standards-based verification of the structural components of residential development allowed us to evaluate the physical impact of potential lahars on infrastructure. We also assessed how increasing the wall thickness affects high- and low-risk areas.

Our results show that the observed secondary lahars can be numerically reproduced with a set of frictional parameters of µ = 0.028 (Coulomb-type friction) and ξ = 600 ms-2 (turbulent friction). The model shows high agreement with locally obtained data (Vasconez et al., 2021) on total lahar volume, flow distance, discharge, and flooded area (deviation from target value = 20 %). By comparing the climatic and topographical situation of similar events at other study sites with the conditions at Chimborazo, we assume that glacial/periglacial destabilization processes may have accompanied the initiation of past lahars. Through deciphering the past initiation processes, our scenarios resulted in volumes between 2.7 × 10⁵ m³ (high probability) and 10.8 × 105 m³ (very low probability) for a climatically derived reference period of 180 years. The structural validation of the component resistance identified high risk for approximately 24 % of the entire runout area. The adjustment to 11 cm wider bricks reduces this area by 5 %.

Only a precise quantification of the ice content and dynamic behavior within the source region enable to estimate the influence of destabilization processes on lahar initiation. However, this work makes an important contribution to supporting informed decision-making in land use planning by implementing an interdisciplinary methodology for analyzing the impacts of mass movements.

In this study, we showed that a retrospectively calibrated numerical model enables the simulation of future outburst-triggered lahars, and we further provided a quantification of their impact on downstream communities.

Vasconez, F.J., Maisincho, L., Andrade, S.D., Cáceres Correa, B.E., Bernard, B., Argoti, C., Telenchana, E., Almeida, M., Almeida, S. & Lema, V. (2021): Secondary Lahars Triggered by Periglacial Melting at Chimborazo Volcano, Ecuador. – Revista Politécnica, 48: 19–30.https://doi.org/10.33333/rp.vol48n1.02

How to cite: Mühlbauer, S., Frimberger, T., and Krautblatter, M.: Secondary Lahars Impacting on Building Structures at Chimborazo Volcano: A Retrospective and Scenario-Based Modeling Approach, EGU General Assembly 2024, Vienna, Austria, 14–19 Apr 2024, EGU24-13482, https://doi.org/10.5194/egusphere-egu24-13482, 2024.

EGU24-14250 | ECS | Orals | GM4.2 | Highlight

Widespread cascading torrential hazards in tropical regions  

Maria Isabel Arango, Marcel Hürlimann, Edier Aristizábal, and Oliver Korup

Over the past decades, cascading hazards that include landslides, debris flows, and floods have caused several major disasters in tropical mountain regions. Even though such cascading hazards also occur in steep terrain elsewhere, some natural drivers such as very high humidity with associated heavy rainfalls, and deeply weathered soil profiles, may amplify the reach and impacts of these cascades in tropical mountains. There, torrential fans sustaining dense settlements are especially prone to rainfall-triggered hazard cascades but remain largely understudied compared to temperate mountain regions. Challenges in their hazard assessment include a lack of consensus regarding the scientific terminology to describe, analyse, and record these events; and their complexity, given that, combining traditional single hazard assessment fails to capture the amplification of the damages. On the other hand, their occurrence in remote, undeveloped regions where they are poorly or not documented, and their low temporal recurrence, decreases hazard awareness and increases the growth of urban settlements in exposed areas.

The goal of this study is to review widespread cascading torrential hazards in the tropics as a common and destructive interaction of mass-wasting and flow processes. The study has two different steps: the first is a review of existing terminology concerning regional hydrometeorological cascading hazards in different latitudes and environments, as an attempt to clarify the existing gaps and differences in information between tropical and higher latitude areas. The second step is the description of the main morphological and triggering characteristics of such events. For this, we compiled a dozen regional cascading torrential events that occurred between 2017 and 2023 in different tropical regions of the American, Asian, and African continents, caused by different triggering mechanisms, including extreme rainfall and earthquakes, or both. Using high-resolution satellite images, the events were mapped differentiating the extent of landslide initiation, debris flows runout, and floodings. Additionally, we used freely available remote sensing sources to extract information concerning the geomorphology, soil texture, and triggering rainfall of each study area. Using different statistical tools, we analysed the relationship between different morphological features, triggering rainfall and soil texture, to distinguish the main characteristics of such events in both the basin and the sub-process scale.

As preliminary results of this ongoing research, we have found an important gap in information concerning widespread cascading torrential hazards in tropical regions. Furthermore, the analysis of our inventory allowed us to identify key factors that contribute to the triggering, propagation, and connection of hazards, including the very high availability of coarse-textured soils and higher sediment connectivity within affected catchments. Furthermore, we found that the spatial connection of the sub-processes involved in these events (landslides, debris flows, and floods), is given by their overlap within the different process domains of basins.

This initial approach provides a preliminary understanding of the conditions that promote cascading torrential hazards in tropical regions, which can aid in developing more accurate hazard assessment tools and implementing effective strategies to mitigate risks in the tropics, considering its unique multi-hazard and complex setting.

How to cite: Arango, M. I., Hürlimann, M., Aristizábal, E., and Korup, O.: Widespread cascading torrential hazards in tropical regions , EGU General Assembly 2024, Vienna, Austria, 14–19 Apr 2024, EGU24-14250, https://doi.org/10.5194/egusphere-egu24-14250, 2024.

EGU24-14699 | ECS | Posters on site | GM4.2

How will bedload transport respond to climate change in Alpine regions? The "ALTROCLIMA" project 

Felix Pitscheider, Anne-Laure Argentin, Mattia Gianini, Leona Repnik, Simone Bizzi, Stuart Lane, and Francesco Comiti

Alpine regions are among the areas that are the most intensely impacted by climate change. Predictions of how such changes affect meteorological conditions, as well as snow and ice cover and water discharge in mountain regions, are well established. However, how climate change has affected and will affect sediment transport in general and bedload transport in particular in such environments has yet to be studied.

Bedload transport within Alpine rivers is of ecological importance for river systems, impacts the economic efficiency of hydropower and is a critical parameter in assessing hydrogeological risks. This transport is determined by the sediment supplied to the river and the river's capacity to transport these sediments. These complex processes are closely intertwined with climatological conditions within a catchment, particularly in catchments with substantial glacial coverage. However, predicting how bedload transport behaves due to a changing climate is challenging.

This project fills this knowledge gap and investigates the link between bedload transport and rapid climate change in Alpine environments and aims to predict future trends for the current century. To reach this goal, a wide range of objectives has been set. We work towards providing the first reliable, multi-site quantification of past bedload transport changes under warming conditions, as well as to determine the role of geomorphic processes on bedload export in the analysed river networks. Furthermore, we are working on establishing modelling frameworks to predict subglacial and hillslope sediment supply as well as hydrological discharge to create a bedload transport modelling chain. The modelling chain is based upon the D-CASCADE model, which allows quantifying the spatio-temporal bedload (dis)-connectivity in river networks. Supplying the model with climatological and hydrological predictions enables the estimation of future bedload flux and erosion/deposition patterns under different scenarios. The approach for estimating the evolution of bedload transport will be developed and tested in the Solda (Italy) and Navisence (Switzerland) catchments, due to the data availability of the recent bedload transport history. Once validated and calibrated, the approach will be applied to further selected catchments.

In summary, the project aims to provide a decadal-scale quantification of changes in Alpine bedload transport due to climate warming and predict its evolution in the 21st century. We anticipate an initial increase in sediment transport with increasing glacial melt, driven by climate warming. However, this surge may be temporary as diminishing glaciers reduce their contribution to river discharge after a phase of maximum discharge rates. Beyond the academic value of this research, it will offer critical insights for water resource managers in Alpine regions.

How to cite: Pitscheider, F., Argentin, A.-L., Gianini, M., Repnik, L., Bizzi, S., Lane, S., and Comiti, F.: How will bedload transport respond to climate change in Alpine regions? The "ALTROCLIMA" project, EGU General Assembly 2024, Vienna, Austria, 14–19 Apr 2024, EGU24-14699, https://doi.org/10.5194/egusphere-egu24-14699, 2024.

EGU24-15047 | Orals | GM4.2

Assessing slope-river connectivity for evaluating cascading landslide hazards: A case study of Tordera river basin, NE Spain. 

Clàudia Abancó, Marta Guinau, Marta González, Jordi Pinyol, and Rosa M Palau

Landslides and torrential flows are among the most dangerous processes that occur on hillslopes, and they are mostly triggered by intense rainfall events. These phenomena are not only hazardous in themselves, but they can also have a more significant impact downstream when they interact with channels or the river network. When multiple landslides are simultaneously triggered by a rainfall event that affects an extensive area, they can initiate chains of further hazards due to the sudden and massive influx of sediment they bring onto channels and rivers. Therefore, it is crucial to study the connectivity between slopes and the river network to evaluate areas with a potentially higher sediment contribution to the river network. Ultimately, this information will help to assess flood hazards and mitigate risks, as well as assist in the planning of protective structures, drainage works, and other relevant measures.

We conducted a study on the slopes of the Tordera River basin (NE Spain). This river flows from the Montseny (Catalan Coastal range)  into the Mediterranean Sea. The study area was affected by a regional landslide event that occurred in January 2020 during the Gloria Storm (more than 480 mm of rainfall was measured in 96 hours in the region). We employed the index of connectivity, which is based on Borselli et al. (2008), to examine the connectivity between the slopes and the river network. The outcomes of this analysis were subsequently compared to a landslide inventory (more than 1000 mass movements) to determine whether the high amount of sediment present in the lowlands could have originated from landslides in the upper part of the basin.

According to the results of this study, slopes with high connectivity experienced a high density of landslides. The sediment that flowed down the slopes and reached the rivers added to the flood that occurred downstream. This flood carried a considerable amount of sediment which caused the widening of the active channel and the growth of the Tordera delta. The impacts of the Gloria storm on the infrastructure caused significant economic losses.


Borselli, L.;  Cassi, P.;  Torri, D. Prolegomena to sediment and flow connectivity in the landscape: A GIS and field numerical assessment, CATENA, Volume 75, Issue 3, 2008, Pages 268-277, ISSN 0341-8162, https://doi.org/10.1016/j.catena.2008.07.006.

How to cite: Abancó, C., Guinau, M., González, M., Pinyol, J., and Palau, R. M.: Assessing slope-river connectivity for evaluating cascading landslide hazards: A case study of Tordera river basin, NE Spain., EGU General Assembly 2024, Vienna, Austria, 14–19 Apr 2024, EGU24-15047, https://doi.org/10.5194/egusphere-egu24-15047, 2024.

Under the background of global warming, the risk of geo-hazard in the cryosphere has increased with the retreat of glaciers. Several similar large-scale glacial debris flows with high mobility occurred in the southeast Tibet Plateau during the summer season which has drawn the attention of scientists. One typical event occurred on 10 September 2020 near Namcha Barwa Peak. The initial landslide finally changed into a glacial debris flow with high water content and high mobility under the condition of little precipitation. To solve the questions: 1) why is the glacial debris flow in southwest Tibet more prone in the warm season? 2) How is the initiation mechanism of this glacial debris flow with little rainfall? 3) What is the major source of water for this large debris flow? and 4) Which factors dominate the high mobility characteristic of this debris flow event? By conducting field investigation and comparing the satellite images before and after the event, we have revealed a rock-ice avalanche on the ridge above the landslide area to be contemporary with the event. This finding produced the hypothesis on the initiation process: rock-ice avalanche – moraine deposit failure – glacial debris flow, which has been inferred for many other similar events but not quantitatively proved. To test the hypothesis, we conducted thermal-hydraulic-mechanical coupled numerical modeling with the impact of freeze-thaw cycles and rock-ice avalanche on the stability of the moraine deposit. The results demonstrate that the avalanche event triggered the moraine landslide, with freeze-thaw cycles as the control factor. Generally, long-term freeze-thaw cycles alone are insufficient to set off the hazard chain. At the same time, seasonal temperature variation that controls ice-water phase change dominates the stability of moraine deposits under rock-ice avalanche in different seasons. In warm seasons, rock-ice avalanches would trigger moraine deposit failure more easily due to abundant water content that facilitates pore pressure increase, and liquefaction of moraine. By conducting multi-phase modeling of glacial debris flow, we have proven that the initial water content and entrainment of water during the development of the debris flow are the main water sources of this debris flow event. Moreover, the high water content in the initial landslide together with the entrainment process should also account for the high mobility characteristic of glacial debris flow. This work answered the long-lasting scientific questions about the initiation mechanism and dynamics of hyper-mobility glacial debris flow disaster chain under the background of climate change.

How to cite: Wang, T., Huang, T., and Shen, P.: Unravaling the cascading mechanisms of rock-ice avalanche triggering hyper-mobility glacial debris flow in southeast Tibet, EGU General Assembly 2024, Vienna, Austria, 14–19 Apr 2024, EGU24-15190, https://doi.org/10.5194/egusphere-egu24-15190, 2024.

EGU24-16937 | Orals | GM4.2 | Highlight

Cascading Hazards – the challenges to understand interactions 

Margreth Keiler

Cascading hazards come into focus of hazard and risk research in the last 15 years and is strongly connected to studies on multi-hazards and compound hazards. Unexpected cascading events and related casualties and losses of properties draw the attention to consider the possible amplified risks induced by cascading hazards.

The contribution will focus in the first part on key concepts in relation to cascading hazards and will address briefly the challenges which may occur due to the general terminological ambiguity because the term cascading hazards tends to be used interchangeably with multi-hazards, cascading events, cascading disasters, or compound hazards or events. The main focus is on the analyses of different types of interactions which may occur during a cascading hazard events and their dependency on time and space. In the second part, the main question addresses the influence of climate and environmental change on cascading hazards including the occurrence of cascading hazards, changes of types of cascading hazards or interactions within the cascading hazard event. Current challenges regarding the approaches used to analyse and better understand cascading hazards are presented as well as first ideas to answer the questions what is missing, what is needed and how it can be used for hazard and risk analysis/management. 

How to cite: Keiler, M.: Cascading Hazards – the challenges to understand interactions, EGU General Assembly 2024, Vienna, Austria, 14–19 Apr 2024, EGU24-16937, https://doi.org/10.5194/egusphere-egu24-16937, 2024.

EGU24-17658 | ECS | Posters on site | GM4.2

Addressing the 'Black Hole' amidst Sediment Connectivity and Multi-Hazards 

Ishmam Kabir, Bernhard Gems, Martin Rutzinger, and Margreth Keiler

‘Sediment Connectivity’ and ‘Multi-Hazard’ – two booming topics over the last decade; have experienced intensive methodological and conceptual developments. Research so far has acknowledged their interrelationships and established sediment connectivity as a crucial component in the framework of hazard and risk research, but mostly through the so called ‘single-hazard’ approaches. Sediment connectivity referring to the entire assemblage of connectivity network would by definition occupy a significant amount of space, which may often accommodate multiple interactive and interrelated hazards, making a single-hazard approach fairly inadequate and thus leaving a crucial research gap.

The primary aim of this study is to draw the attention of future research on this gap while attempting to address it through developing a new perspective to look into multi-hazard events. In line of that we propose a semi-quantitative index based on the classification of hazard events and their interactions through an inverse event tree approach – assuming a cascading process flow. The event classification is based on the type of interactions (e.g. process-process, triggering, impeding, structure-process, etc.) to facilitate the understanding and inclusion of the connectivity concept. The index would assess each step and the interlinkages of such cascading events and assign weights to them based on their significance from a sediment connectivity viewpoint. Furthermore, it would also address how these weights may alter the probabilities across the event tree. Overall, this study proposes a novel perspective into the inter-connectedness of geomorphic/sediment connectivity and multi-hazard events, in line with the ‘Gaia’ and ‘Systems’ theories. 

How to cite: Kabir, I., Gems, B., Rutzinger, M., and Keiler, M.: Addressing the 'Black Hole' amidst Sediment Connectivity and Multi-Hazards, EGU General Assembly 2024, Vienna, Austria, 14–19 Apr 2024, EGU24-17658, https://doi.org/10.5194/egusphere-egu24-17658, 2024.

EGU24-18379 | Orals | GM4.2

Quantifying surface process dynamics during extreme events from storm characteristics and landslide inventories 

Marin Clark, Ries Plescher, Madeline Hille, Christoff Anderman, Chan-Mao Chen, Deepak Chamlagain, Dimitrios Zekkos, and A. Joshua West

Extreme precipitation events drive landsliding in many regions across the globe and are an important part of the erosional cycle and related hazards. The intensity and frequency of extreme events are likely increasing due to rising global temperatures, causing greater future threat to society and an urgent need to quantify the relationships between surface process dynamics and extreme events. In steep mountain belts, orography also plays a role in focusing precipitation and intensifying erosion. Yet, the influence of orography on the intensity-duration characteristics of extreme precipitation remains a subject of debate because we lack spatially distributed and high time-resolution gauge datasets needed to resolve convective-scale, short-duration storm events and satellite-derived precipitation products struggle to accurately resolve precipitation gradients over areas of high relief and altitude. Annual periods of monsoon-related landsliding in the Himalaya offer a natural laboratory in which to explore relationships between extreme precipitation, orography and landsliding processes. Here we scale the NASA’s Global Precipitation Measurement (GPM) IMERG 30-minute, 0.1x0.1 degree product with local rain gauge data to produce high-temporal resolution records used to characterize extreme rainfall events (EREs) in central Nepal where hundreds of shallow landslides occur each summer. Individual storms from the time series are defined using the average inter-accumulation time as a measure for the minimum dry period between storms and extreme storms are extracted from the series using a 90th percentile threshold for each gauge station. Variability in storm characteristics is defined using paired K-means agglomerative cluster and principal component analyses to evaluate spatial patterns in storm characteristics over a 10 year period compared to annual landslide inventories. Spatial patterns emerge that suggest orography increases the intensity and frequency of storms, which in turn focuses landsliding in specific, and potentially predictable, regions along the steep windward flank of the mountain belt.

How to cite: Clark, M., Plescher, R., Hille, M., Anderman, C., Chen, C.-M., Chamlagain, D., Zekkos, D., and West, A. J.: Quantifying surface process dynamics during extreme events from storm characteristics and landslide inventories, EGU General Assembly 2024, Vienna, Austria, 14–19 Apr 2024, EGU24-18379, https://doi.org/10.5194/egusphere-egu24-18379, 2024.

EGU24-18653 | ECS | Posters on site | GM4.2

Seven decades of debris flow activity. Spatio-temporal observations at connected and disconnected debris flow fans to the Lake Plansee (AT). 

Natalie Barbosa, Carolin Kiefer, Juilson Jubanski, and Michael Krautblatter

Debris flow activity at Lake Plansee, Austria, is evident through numerous debris cones continuously transferring sediment to the lake. Lacustrine sediment records of fan deltas were used to analyze the debris flow activity since 2120 BCE with Kiefer et al. (2021) identifying a drastic increase in debris flow activity since 1920. Furthermore, the photointerpretation of historical aerial imagery combined with modeling of debris flow volumes at the northern slope of Lake Plansee since 1947 suggests an increased trend since the 1980s (Dietrich et al., 2016). Despite the lithological and climatic similarities between the slopes that surround Lake Plansee, debris cones at the northern slope are primarily connected to the lake, while those on the southern slope remain highly active but disconnected.

This contribution aims to advance our understanding of spatio-temporal dynamics on debris flow fans and factors influencing sediment connectivity to the lake. We revise the historical aerial imagery since 1952 to automatically detect ‚active‘ debris channels using image processing and derive time series of photogrammetric Digital Surface Models (DSMs) for change detection.We identified 34 debris catchments with debris flow activity since 1952. Our objectives include (i) analysis of the spatio-temporal patterns of erosion and deposition at each fan to trace their evolution, (ii) quantifying sediment transfer rates from connected fans to lake Plansee in the last 70 years, (iii) identifying the role of vegetation changes in debris fan evolution and (iii) refining our understanding of precipitation and temperature as controlling factors influencing debris flow activity and connectivity or dis-connectivity of active debris channels to lake Plansee. The presented results intend to comprehend the intricate patterns that lead to debris flow exhaustion and increased or decreased activity.


Dietrich, A., & Krautblatter, M. (2017). Evidence for enhanced debris-flow activity in the Northern Calcareous Alps since the 1980s (Plansee, Austria). Geomorphology, 287, 144-158.

Kiefer, C., Oswald, P., Moernaut, J., Fabbri, S. C., Mayr, C., Strasser, M., & Krautblatter, M. (2021). A 4000-year debris flow record based on amphibious investigations of fan delta activity in Plansee (Austria, Eastern Alps). Earth Surface Dynamics, 9(6), 1481-1503.

How to cite: Barbosa, N., Kiefer, C., Jubanski, J., and Krautblatter, M.: Seven decades of debris flow activity. Spatio-temporal observations at connected and disconnected debris flow fans to the Lake Plansee (AT)., EGU General Assembly 2024, Vienna, Austria, 14–19 Apr 2024, EGU24-18653, https://doi.org/10.5194/egusphere-egu24-18653, 2024.

EGU24-19175 | Orals | GM4.2

Non-uniqueness in sediment transport in river network hydrology-sediment modelling 

Peter Molnar, Sascha Meierhans, Giulia Battista, Jacob Hirschberg, Jessica Droujko, and Scott Sinclair

Sediment cascades are a convenient way of conceptualizing the transfer of sediment from hillslope production areas, through the river network, to the river basin outlet. Distributed hydrology-sediment models play an important role in the prediction of these source-to-sink links, because they can explicitly connect water and sediment fluxes along topographically-driven pathways. Here, we provide some examples of such cascade-based hydrology-sediment model applications in alpine environments and some problems related to their use.

In particular, we highlight two critical problems with hydrology-sediment modelling that go beyond trivial model calibration difficulties. These address fundamental issues of (a) non-uniqueness in sediment source mixing, and (b) sediment supply limitations. The first problem of non-uniqueness is known in hydrological modelling as the curse when models perform well at basin outlets for the wrong reasons, misrepresenting hydrological processes within the basin. In geomorphology, this concept has not received the same level of attention. Here we show that even a calibrated physically-distributed hydrology-sediment model can be subject to non-uniqueness, and provide the same suspended sediment yields at the basin outlet with completely different combinations of sediment sources. Including sediment tracers in model validation helps to identify this problem, and it is also helpful to check simulations at sub-basin scales where we are closer to distinct sediment sources. The second problem of sediment supply limitations is a challenge for all models that rely on transport capacity formulas for sediment transport. In our experience, both supply and transport capacity limit sediment transport at the basin scale, and we need to include this in our models. For example, we show that supply limitations can completely change the seasonality of sediment yields and render many climate change impact studies worthless.

Finally, we argue that both problems above, at least for suspended load, can be partially addressed by novel monitoring. For example by low cost smart sensors that allow a distributed sensing of sediment fluxes above and below potential sediment sources at high resolutions, or by high resolution remote sensing to capture space-time variability in river turbidity. This kind of data can dramatically improve our ability to calibrate models, reduce non-uniqueness, and over the long term identify the key signatures of sediment supply in river systems. It is our opinion that improving the predictions of climate and environmental change effects on sediment yields requires both better model validation as well as new data.

How to cite: Molnar, P., Meierhans, S., Battista, G., Hirschberg, J., Droujko, J., and Sinclair, S.: Non-uniqueness in sediment transport in river network hydrology-sediment modelling, EGU General Assembly 2024, Vienna, Austria, 14–19 Apr 2024, EGU24-19175, https://doi.org/10.5194/egusphere-egu24-19175, 2024.

EGU24-19438 | ECS | Posters on site | GM4.2

Post-event forensic survey after a recent catastrophic flash flood in Central Spain: morphosedimentary and hydrodynamic reconstruction 

K. Patricia Sandoval-Rincón, Julio Garrote, Daniel Vázquez-Tarrío, Ana Lucía, Mario Hernández-Ruiz, María Ángeles Perucha, Amalia Romero, José Ortega, and Andrés Díez-Herrero

Catastrophic flash floods are among the deadliest and most damaging natural processes worldwide. Despite this, they are rarely well recorded in instrumental (e.g. rain gauges, gauging stations) and documentary records (archives and newspaper archives). For their analysis and future prevention, it is therefore essential to carry out post-event forensic studies to collect as much information as possible in the field, from which the morphodynamic, hydrological and hydraulic characteristics of these events can be reconstructed.

In early September 2023, an exceptional ‘cut-off low’ weather situation (DANA) crossed the centre of the Iberian Peninsula, causing heavy rainfall and flash floods in several river basins (Alberche, Perales, Grande, Guadarrama). There were seven deaths and hundreds of millions of euros of damage to property and infrastructure.

This work summarises all the post-event forensic analyses and field observations collected after this episode along the Grande-Perales-Alberche river system, consisting of: (i) documentation of the historical morphological changes of these rivers, obtained from old cartographies, geomorphological maps, aerial photographs and recent orthoimages; (ii) compilation of all meteorological (rainfall) and hydrological (flow) information available for the event; (iii) acquisition of aerial images and video recordings using drones; iv) field georeferencing with differential GPS of high water marks (HWM) and paleo-stage indicators (PSI); v) field topographic measurements; vi) detailed measurement of bedform parameters such as wavelength and amplitude of current ripples; vii) grain size and composition sampling of flood deposits.

With all this information and other still being collected (such as orthophotographs and post-event DEMs generated by digital photogrammetry techniques based on images taken by drones), detailed digital elevation models are obtained. All this information will be used as calibration and validation information for 2D hydrodynamic and landscape evolution numerical models that attempt to reproduce and predict this type of event in the study rivers.

How to cite: Sandoval-Rincón, K. P., Garrote, J., Vázquez-Tarrío, D., Lucía, A., Hernández-Ruiz, M., Perucha, M. Á., Romero, A., Ortega, J., and Díez-Herrero, A.: Post-event forensic survey after a recent catastrophic flash flood in Central Spain: morphosedimentary and hydrodynamic reconstruction, EGU General Assembly 2024, Vienna, Austria, 14–19 Apr 2024, EGU24-19438, https://doi.org/10.5194/egusphere-egu24-19438, 2024.

EGU24-20877 | ECS | Posters on site | GM4.2

Snow preparation in landslide scenarios under multi-hazard perspective: experiences from Lake Campotosto (Italy) 

Matteo Ferrarotti, Maria Elena Di Renzo, Gian Marco Marmoni, Carlo Esposito, and Salvatore Martino

Landslides are a natural land-forming process and their interaction with urbanized areas and infrastructures makes them one of the most common geo-hazards. Landslides are controlled by three macro-categories of factors, namely the “predisposing”, “preparatory”, and “triggering” ones. In particular, preparatory factors are time-changing and gradually reduce the slope stability without initiating the movement. Snow melting and accumulation are generally discussed in the literature as triggering factors of landslides, particularly shallow ones, although, the here presented approach focuses on their contribution as preparatory factors. In mountainous areas, snow loading and, especially, snow melting can increase the soil pore water pressure, causing a reduction of available strength. Their influence on soil stability is time-dependent and, in particular, changes cyclically throughout the year. Snow usually begins to fall in the late autumn and accumulates especially in winter, whereas in spring it melts, resulting in water infiltration into the soil and resistance reduction. In seismic areas, where earthquakes can act as triggers for shallow landslides, seismic action might discover different levels of soil weakness throughout the year depending on the season, resulting in distinct landslide scenarios.

This research illustrates some multi-hazard scenarios that consider earthquakes as triggering factor of landslides, varying the degree of saturation of soil covers. The case study is the area around Lake Campotosto (Italy), located in one of the Apennines areas with the highest amount of snowfall per year, is in the near fault sector of one of the most important seismogenic source of the Apennines (Mt. Gorzano Fault System) and is characterized by different sizes and mechanisms landslides.

The approach applied for generating landslide scenarios is the PARSIFAL (Probabilistic Approach for Rating Seismically Induced slope FAiLures), a probabilistic multi-hazard tool that includes a three steps procedure: 1) susceptibility analysis including differentiated approach for rock and earth failure mechanisms; 2) slope stability analysis; 3) synthetic mapping of generated scenarios, based on grid or slope units.

Preliminary research on the stability of soil covers under seismic conditions emphasizes importance of hydraulic conditions during earthquake, which also suggests the relevance of snow loading and, in particular, snow melting in regulating slope stability.

Further research is being done utilizing satellite and meteorological data, and geomorphological features, and then elaborating them using statistical and geostatistical tools, up to advanced computing.

The goal is to generate time-dependent landslide hazard scenarios by weighting the effects of snow precipitation throughout the year as a preparatory factor and adding a related tool to PARSIFAL.

The majority of these concepts are being studied at Sapienza's Department of Earth Sciences in the CN1 (National Centre for HPC, Big Data, and Quantum Computing) – Spoke5 PNRR Linea Tematica 1 (Reconstruction of multi-hazard scenarios from seismic source models to the simulation of seismic-induced instabilities), which aims at generating ground effects scenarios in terms of instabilities induced by nonlinear effects produced by the propagation of seismic waves from the seismogenic source to the surface, also considering geomorphological and geotechnical characteristics of the near subsurface.

How to cite: Ferrarotti, M., Di Renzo, M. E., Marmoni, G. M., Esposito, C., and Martino, S.: Snow preparation in landslide scenarios under multi-hazard perspective: experiences from Lake Campotosto (Italy), EGU General Assembly 2024, Vienna, Austria, 14–19 Apr 2024, EGU24-20877, https://doi.org/10.5194/egusphere-egu24-20877, 2024.

Torrential risk protection works have a long tradition in the Alps, where these measures have allowed more intensive use of the landscape since the twentieth century and form the basis for rational management of the risk of torrential floods. While the maintenance and management of protective works makes it possible to control their inevitable deterioration and to extend their life, the collapse of these systems should be always considered in the frame of the residual risk management. This work aims to i) analyse the catastrophic debris flow occurred on October 2018 in the Rotian river basin (Eastern Italian Alps) during which a series of check dams collapsed magnifying the event and causing a casualty and severe damages, and ii) to identify implications for hazard monitoring and management. The work is based on post-event investigations, witness accounts, remote sensing information and local station data, hydrogeomorphic data and models, and systematically analyses the geo-environment, climate conditions and check dam structural conditions which characterized the geohazard cascade of events. In particular, results from the application of a couple hydrological and hydraulic model for the triggering and propagation of the debris flows event are used to inform the analysis. The results from this work are exploited to inform a discussion about the future of these works, which concerns not only the structural and maintenance aspects of the single work, but also involves the risk management requests of the systems of works which in recent decades have evolved significantly.

How to cite: Marchi, L., Borga, M., Zugliani, D., and Rosatti, G.: Geohazard cascade and mechanism of large debris flows in the Rotian river basin (NE Italy): implications to hazard monitoring and management, EGU General Assembly 2024, Vienna, Austria, 14–19 Apr 2024, EGU24-21166, https://doi.org/10.5194/egusphere-egu24-21166, 2024.

EGU24-728 | ECS | Orals | CR1.5

Characterization of snow mechanical properties using laser ultrasound: Role of snow crystal type 

James McCaslin, Thomas Mikesell, Hans-Peter Marshall, and Zoe Courville

Quantifying the mechanical properties of snow is crucial for various applications, including the assessment of slope stability, vehicle mobility on snow-covered terrain, and the understanding of snowpack evolution. To build our understanding of snowpack evolution, we utilize a novel non-contacting laser ultrasound system (LUS). This system collects ultrasonic wavefield data from tens to hundreds of kilohertz in a controlled cold lab environment, allowing us to interpret acoustic measurements and measure mechanical properties on a microscale and upscale this to the field scale.


 We investigated the relationship between P-wave velocity changes and snow properties such as density, snow crystal type, and metamorphism through sintering. We controlled the density of the snow samples by adjusting the volume while maintaining the same mass. We controlled the microstructure by manipulating the supersaturation and temperature (controlling air and water temperatures within an artificial snow maker) within a cold lab to make artificial snow of a specific crystal type (i.e., Dendritic, plate, column, and needle snow crystals). Homogeneous snow samples, each composed of their own single crystal type, were created and compacted to a density of 250 kilograms per cubic meter.


Over a period of 72 hours, we measured acoustic wave propagation through  these artificial snow samples to periodically observe changes in waves peed during metamorphism. This allowed us to monitor changes in mechanical properties as sintering occurred, for different snow crystal types. We also measured snow microstructure and micromechanical properties with destructive techniques, using the SnowMicroPen and MicroCT. Finally, we examined the relationship between velocity changes and snow crystal types, specifically in terms of sintering time. Our findings suggest that the crystal type, as influenced by time under isothermal temperature conditions, affects the observed bulk mechanical properties and their rate of change.  Observations of ultrasonic wavefields show that snow strengthened by a factor of 1 to 2 within 72 hours, depending on the snow crystal type. 

How to cite: McCaslin, J., Mikesell, T., Marshall, H.-P., and Courville, Z.: Characterization of snow mechanical properties using laser ultrasound: Role of snow crystal type, EGU General Assembly 2024, Vienna, Austria, 14–19 Apr 2024, EGU24-728, https://doi.org/10.5194/egusphere-egu24-728, 2024.

EGU24-1171 | ECS | Posters on site | CR1.5

Debris-covered area increased in the Central Andes of Argentina glaciers over the past four decades 

Juan Cruz Ghilardi Truffa and Lucas Ruiz

In the Central Andes of Argentina, glaciers are crucial components of the mountain hydrological system, as they can provide up to 60% of river flow in the driest season. This region concentrates 82% of the debris-covered glaciers in the country. Most of them are small valley glaciers (< 2 km2). Nevertheless, a few large debris-covered valley glaciers (>10 km2) concentrated the most significant ice volume. Despite their abundance and regional importance, the processes underlying mass exchange and response to climate change in debris-covered glaciers have been little studied.

We process over 60,000 images from Landsat and Sentinel satellites through Google Earth Engine to study changes in the extent of the debris-covered area and Debris Emergence Elevation (DEE) for 128 valley glaciers of the Central Andes of Argentina (42.6% of the debris-covered glacier area). Using an automated classification algorithm, we identified the different surface facies (snow, ice, debris, and water) at each glacier between 1985 and 2022. We validated our classification against the National Glacier Inventory of Argentina, obtaining coincidence in the classifications in more than 94% of the cases.

Assuming there were no changes in glacier extent, we found a 27 ± 15% increase in debris cover along the studied glaciers. Between 1985 and 2009, the debris-covered area had a significant interannual variation, and from 2009 to 2022, there was a substantial increase in the debris-covered area. Indeed, almost 68% of the increase in debris-covered areas occurred in the last decade. During the last four decades, DEE showed a mean increase of 127 ± 109 meters for simple basin valley glaciers. These changes follow a similar pattern but with greater interannual variability than changes in debris-covered area.

The increase of debris-covered area and DEE in the last decade coincides with an extensive drought period and an increase in the glacier mass loss in the Central Andes. Nevertheless, the automated classification algorithm cannot differentiate between debris-covered ice and internal outcrops. Thus, the increase in the debris-covered area includes the expansion of internal rock outcrop due to a loss of ice mass. Furthermore, we hypothesized that hypsometry and glacier morphology control the extent and elevation debris can reach. We found that low-slope glaciers are the ones that increase their debris cover the most. Meanwhile, glaciers with a very steep accumulation area or a strong slope change around the Equilibrium Line Altitude do not significantly change the debris-covered area. Also, due to the expansion of internal rock, the calculation of DEE at large compound or complex-basin glaciers shows more significant dispersion than at simple-basin glaciers. Improving the classification algorithm and assessing the influence of glacier morphology in the changes in debris-covered areas are crucial to better constrain the change in debris-covered glaciers.

How to cite: Ghilardi Truffa, J. C. and Ruiz, L.: Debris-covered area increased in the Central Andes of Argentina glaciers over the past four decades, EGU General Assembly 2024, Vienna, Austria, 14–19 Apr 2024, EGU24-1171, https://doi.org/10.5194/egusphere-egu24-1171, 2024.

EGU24-4137 | ECS | Orals | CR1.5

Comparing multisensor optical-radar approaches for snow water equivalent retrievals 

Jack Tarricone, Ross Palomaki, Karl Rittger, Hans-Peter Marshall, Anne Nolin, and Carrie Vuyovich

No current remote sensing technique can accurately measure snow water equivalent (SWE) from space for mountain hydrologic applications. Optical sensors are robust for measuring the fractional snow-covered area (fSCA) at various spatial and temporal resolutions. Yet, these optical methods are limited by cloud cover and do not provide information on SWE. Synthetic aperture radar (SAR) can penetrate clouds, has a fine spatial resolution, and various algorithms allow us to quantify both SWE magnitude and changes. However, SAR cannot discriminate between snow-free and snow-covered areas when the snow is dry. To address this SWE monitoring challenge, we evaluate a multisensor approach that leverages the strengths of both optical and radar sensors. Our study aims to better understand the variability between common snow cover data products and how that uncertainty propagates into InSAR-based SWE retrieval techniques. We analyzed four UAVSAR InSAR pairs from one flight line over the Sierra Nevada, CA, during the SnowEx 2020 campaign and compared six satellite-based snow cover products. First, we computed InSAR-based SWE change estimates using in situ snowpack data. We then compared the summed SWE change values with a moving window analysis to quantify product variability. Lastly, we tested the volumetric SWE results for statistical differences. Results show that moderate-resolution (375–500 m) NDSI-based products provide broadly similar volumetric SWE change results to those using more complex spectral unmixing and machine learning retrieval methods. This suggests that the readily available moderate-resolution snow cover products from MODIS are adequate for an optical-radar SWE monitoring approach. Future work should focus on understanding how sub-canopy snow in forested regions affects snow cover product accuracy and variability. Furthermore, near-real-time, high-resolution cloud- and gap-filled optically-derived snow cover data will be important for supporting water resources decision-making.

How to cite: Tarricone, J., Palomaki, R., Rittger, K., Marshall, H.-P., Nolin, A., and Vuyovich, C.: Comparing multisensor optical-radar approaches for snow water equivalent retrievals, EGU General Assembly 2024, Vienna, Austria, 14–19 Apr 2024, EGU24-4137, https://doi.org/10.5194/egusphere-egu24-4137, 2024.

EGU24-5825 | ECS | Orals | CR1.5

Tracking high-alpine snow mass evolution using signals of a superconducting gravimeter combined with snowpack modelling and stereo satellite imagery 

Franziska Koch, Simon Gascoin, Korbinian Achmüller, Paul Schattan, Karl-Friedrich Wetzel, Till Rehm, Karsten Schulz, and Christian Voigt

Monitoring the amount of snow, its spatiotemporal distribution as well as the onset and amount of snow-melt induced runoff generation are key challenges in alpine hydrology. Cryo-hydro-gravimetry is a non-invasive method of observing temporal gravity variations after the reduction of all other geophysical signals as the integral of all cryospheric and hydrological mass variations including snow accumulation and ablation. It has an accuracy of up to 9 decimals on a wide spectrum from high temporal resolution of up to 1 min to several years within footprints up to approx. 50 km². At the Zugspitze Geodynamic Observatory Germany (ZUGOG) with its worldwide unique installation of a superconducting gravimeter at a high-alpine summit (2.962 m a.s.l.), this method is applied for the first time on top of a well-instrumented, snow-dominated catchment. We use this instrumental setup in synthesis with in situ measured data, detailed physically-based snowpack modelling with Alpine3D as well as satellite-based snow depth maps derived by stereo photogrammetry. We will give an introduction into the novel sensor setup and will show first results, including the sensitivity of the integrative gravimetric signal regarding the spatially distributed snowpack and the cryo-hydro-gravimetric signal changes since 2019. The amount of the simulated snow water equivalent within the footprint of the gravimeter correlates well with the gravimetric signal (Pearson correlation coefficient r = 0.98). Based on the applied snowpack modelling approach including the snow depth maps for precipitation scaling, topography information as well as Newton’s Law of Gravitation, the gravimetric signal contribution and footprint can be described spatiotemporally over winter periods.

How to cite: Koch, F., Gascoin, S., Achmüller, K., Schattan, P., Wetzel, K.-F., Rehm, T., Schulz, K., and Voigt, C.: Tracking high-alpine snow mass evolution using signals of a superconducting gravimeter combined with snowpack modelling and stereo satellite imagery, EGU General Assembly 2024, Vienna, Austria, 14–19 Apr 2024, EGU24-5825, https://doi.org/10.5194/egusphere-egu24-5825, 2024.

EGU24-6297 | ECS | Orals | CR1.5

Investigating the usage of physically modeled snow cover vs. webcam-based snow cover for driving plant species distribution models 

Andreas Kollert, Kryŝtof Chytrý, Andreas Mayr, Karl Hülber, and Martin Rutzinger

Snow is a crucial factor determining plant species distributions in alpine and arctic environments. Therefore, metrics like the duration of snow cover are important predictors to model plant distributions. Many studies employed snow cover metrics derived from optical satellite image time series. Such satellite-derived observations are easily accessible and highly consistent, making them a viable choice for current and past conditions. However, an inherent limitation is their applicability for future projections of snow cover, which is only possible by establishing statistical relationships to ancillary data sets. Snow cover simulated by a physically-based snow model could circumvent these constraints, but it was rarely employed for predicting alpine plant species distributions. Increasing availability of input data, computational power and data sets for validation nowadays allow for modeling at reasonably high resolutions.

To this end, we report first results of several modeling experiments, to quantify the differences of using snow cover metrics derived from webcam time series and modeled snow data for a study site of approximately 5 km² in the Stubaier Alps (Tyrol, Austria). Melt-out date is one of most commonly used snow metrics in species distribution models. Hence, we derive the melt-out dates from two seasons (2022 and 2023) of webcam-based and modeled snow cover. Subsequently, we modeled the distribution of 79 plant species with the melt-out dates as predictors along with several proxies for topographic heterogeneity at spatial resolutions of 1 m and 20 m in order to account for the small-scale variability of snow cover in alpine landscapes. The study demonstrates how the usage of modeled and observed snow data affects modeling of high-alpine vegetation distribution. These insights are important for appropriately designing species distribution modeling studies based on modeled rather than observed snow data.

Acknowledgements: This work has received funding from the European Research Council (ERC) under the European Union’s Horizon 2020 research and innovation programme (Grant agreement No. 883669).

How to cite: Kollert, A., Chytrý, K., Mayr, A., Hülber, K., and Rutzinger, M.: Investigating the usage of physically modeled snow cover vs. webcam-based snow cover for driving plant species distribution models, EGU General Assembly 2024, Vienna, Austria, 14–19 Apr 2024, EGU24-6297, https://doi.org/10.5194/egusphere-egu24-6297, 2024.

Estimates of glacier accumulation are a vital part of determining annual glacier mass balance. Here, the annual accumulation of the Khumbu Glacier, Nepal, is estimated using data from a dense network of high-altitude weather stations in the Khumbu Valley, extending to the summit of Mount Everest. Observations of precipitation phase are used to refine methods of phase modelling using logistic regression in conjunction with weather station and precipitation gauge data. Seasonal temperature lapse rates and spatio-temporal patterns of precipitation are inferred from weather station data, and observed precipitation is adjusted for snow undercatch based on modelled precipitation phase and wind speed. These methods are then combined and distributed over the glacier surface to produce an overall estimate of seasonal and annual accumulation rates of the Khumbu Glacier. 

How to cite: Graves, B.: Estimating the annual accumulation of the Khumbu Glacier, Nepal, using weather station data, EGU General Assembly 2024, Vienna, Austria, 14–19 Apr 2024, EGU24-6336, https://doi.org/10.5194/egusphere-egu24-6336, 2024.

EGU24-6979 | ECS | Posters on site | CR1.5

QFuego-Patagonia: a comprehensive glacier-related dataset for Patagonia and Tierra del Fuego, South America 

David Farías-Barahona, Marius Schaefer, Matthias Braun, Valentina Peña, and Jorge Hernández and the Team QFuego-Patagonia

Patagonia and Tierra del Fuego (Fuego-Patagonia 45°S to 56°S) comprise large ice fields known as Northern Patagonia Icefield (NPI) and Southern Patagonia Icefield (SPI), as well as other significant glacierized areas such as the Cordillera Darwin (CD), the Isla Santa Inés, Hoste, and hundreds of smaller glaciers. In total, this ice coverage adds up to an approximate area of 22,000 km2, accounting for about 80% of South America's total.

Throughout the 20th century, much of the knowledge about these glaciers was based on in-situ measurements and data extracted from emerging remote sensing techniques. These efforts were primarily undertaken by scientists from Argentina, Chile, Germany, the United States, France, Japan, and the United Kingdom, as well as the ongoing contributions of government institutions in Chile and Argentina.

Due to increased access to new and more precise satellites, optical and radar sensors, geophysical methods, meteorological instruments, and the sophistication of numerical models in the present century, knowledge about glaciers in Patagonia has significantly expanded. In recent decades, there have been regular updates on changes in area, elevation, surface speeds, determination of thickness in more locations, etc. In this work, we present a comprehensive dataset of the glaciers of Patagonia and Tierra del Fuego (QFuego-Patagonia) consolidated in a Geographic Information System (GIS), which will be made available to the community. This database includes elevation changes, GPR measurements, subglacial topography modeling, as well as time series of surface velocities, among others, which serve as the basis for modeling and projecting the future of Patagonian glaciers. We also announce the new QFuego-Patagonia web portal, where some of the data presented here will be available to the scientific community (https://qfuego-patagonia.org/).

How to cite: Farías-Barahona, D., Schaefer, M., Braun, M., Peña, V., and Hernández, J. and the Team QFuego-Patagonia: QFuego-Patagonia: a comprehensive glacier-related dataset for Patagonia and Tierra del Fuego, South America, EGU General Assembly 2024, Vienna, Austria, 14–19 Apr 2024, EGU24-6979, https://doi.org/10.5194/egusphere-egu24-6979, 2024.

EGU24-7043 | ECS | Posters on site | CR1.5

Terrain effects on microwave emission transmission of snowpack and snow depth retrieval 

Tao Che and Liyun Dai

The existing snow depth products have mainly focused on influence of varying snow characteristics and forests, while neglecting the complicated mountainous terrain. Therefore, examining the influence of mountainous terrain on microwave radiation transmission of snowpack is beneficial for improvement of snow depth retrieval algorithms in mountainous areas. In this study, we established microwave emission transfer model of snowpack in Mountainous areas within the framework of MEMLS, thereafter, called MEMLS-T. MEMLS-T considers the influence of complicated terrain on the microwave radiation transmission of snowpack from three perspectives: 1) the varied hill slopes alter the local incidence angle; 2) the diverse hill slopes and aspects induce the polarization rotation; 3) The reduced sky visibility in mountainous regions results in an escalation of downward background radiation reaching the snow surface, as a consequence of the illumination from neighboring slopes. We simulate brightness temperatures at varying sky visibilities, slopes and aspects using MEMLS-T, and find that, in compared with flat terrain, brightness temperature gradient decreases in mountainous area, and the extent of reduction depends on complexity (Figure 1). The brightness temperatures are simulated based on various spatial resolutions of DEM and integrated into a grid of 6.25km×6.25km. The results reveal that coarser DEM results in greater sky visibility (Figure 2) and higher brightness temperature (Figure 3). Therefore, a fine DEM is necessary to simulate the brightness temperatures in mountainous areas. Additionally, the observation footprints vary with satellites and frequencies, resulting in discrepancies in snow depth retrieval and temporal consistency.

figure 1Brightness temperature difference between K and Ka bands varies with aspect, slope and sky radiation

figure 2 Comparison of sky visibility obtained from DEMs with different resolutions.

Figure 3 Comparison of brightness temperature simulated from DEMs with different resolutions

How to cite: Che, T. and Dai, L.: Terrain effects on microwave emission transmission of snowpack and snow depth retrieval, EGU General Assembly 2024, Vienna, Austria, 14–19 Apr 2024, EGU24-7043, https://doi.org/10.5194/egusphere-egu24-7043, 2024.

EGU24-7703 | ECS | Posters on site | CR1.5 | Highlight

Centennial observed snowfall trends and variability in the European Alps 

Michele Bozzoli, Alice Crespi, Michael Matiu, Bruno Majone, Lorenzo Giovannini, Dino Zardi, Yuri Brugnara, Alessio Bozzo, Daniele Cat Berro, Luca Mercalli, and Giacomo Bertoldi

Climate change significantly affects snow, emphasizing the urgency to comprehend the temporal and spatial variations in snowfall trends. Analysing historical snowfall data across large areas is often impeded by the lack of continuous long-term time series. This study investigates snowfall trends (HN) by examining observed time series from 46 Alpine sites at various elevations spanning the period 1920-2020. In addition to HN, the analysis focuses on key parameters such as precipitation (P), mean temperature (TMEAN), and large-scale synoptic descriptors — the North Atlantic Oscillation (NAO), Arctic Oscillation (AO), and Atlantic Multidecadal Oscillation (AMO) indices — to discern patterns and variations in HN over the years.

The study reveals that over the past century, below 2000 m a.s.l., there has been a decline in HN across the Alps, particularly in southern and low-elevation sites, despite a slight increase in winter precipitation. The South-West and South-East regions experienced average losses of 4.9% and 3.8% per decade, respectively, while the Northern region showed a smaller relative loss of -2.3% per decade. The negative HN trends are primarily attributed to a TMEAN increase of 0.15 °C per decade. The majority of the HN decrease occurred between 1980 and 2020, as a result of a more pronounced increase in TMEAN. This is reinforced by changes in the running correlation between HN and TMEAN, NAO, AO over time; before 1980, there was no correlation, while in later years, the correlation increased. This suggests that in recent times, the right combination of temperature, precipitation, and atmospheric patterns has become crucial for snowfall. On the other hand, no correlation was found with the AMO index.

How to cite: Bozzoli, M., Crespi, A., Matiu, M., Majone, B., Giovannini, L., Zardi, D., Brugnara, Y., Bozzo, A., Cat Berro, D., Mercalli, L., and Bertoldi, G.: Centennial observed snowfall trends and variability in the European Alps, EGU General Assembly 2024, Vienna, Austria, 14–19 Apr 2024, EGU24-7703, https://doi.org/10.5194/egusphere-egu24-7703, 2024.

Plant phenology is highly sensitive to climate change, and the Arctic region is experiencing rapid changes in vegetation and snowpack. However, the specific climatic drivers of these changes are poorly understood. This study aimed to investigate the effects of snowpack phenology and environmental variables on the onset of vegetation phenology in the Alaskan Arctic. The results showed that Snow cover end date (SCED) had a stronger correlation with the Start of the growing season (SOS) compared to other factors, with consistent spatial and temporal patterns. Forested vegetation exhibited strong positive feedback between SCED and SOS, while grassland, shrub, and tundra communities showed insignificant positive feedback. Temperature and Fractional photosynthetically active radiation (FPAR) also significantly affected SOS. Snow density and snow depth played a larger role in SOS variation during the short pre-season period. These findings highlight the need for further investigation into the role of snowpack in specific vegetation types, particularly after observing widespread greening. Future studies should consider factors such as changes in snowmelt timing and photoperiod and traditional climatic factors like temperature and precipitation.

How to cite: Mu, Y. and che, T.: Unraveling the Influence of Snow Phenology on Vegetation across Alaskan Plant Communities, EGU General Assembly 2024, Vienna, Austria, 14–19 Apr 2024, EGU24-9574, https://doi.org/10.5194/egusphere-egu24-9574, 2024.

The Visible Infrared Imaging Radiometer Suite (VIIRS) sensor onboard Joint Polar Satellite System (JPSS) satellites will replace the Moderate-Resolution Imaging Spectroradiometer (MODIS) to prolong data recording in the future. 
Therefore, it is a fundamental task to analyze the consistency and assess the accuracy of the snow cover products retrieved from the two sensors. 
In this study, snow cover products from MODIS/Terra, MODIS/Aqua, VIIRS/SNPP and VIIRS/JPSS-1, were evaluated in terms of Normalized Difference Snow Index (NDSI) consistency and accuracy assessment using higher resolution images of Landsat and Sentinel-2 snow cover products. Paired comparisons were performed among the four products in five major snow distribution regions over the world: Northeast China (NE), Northwest China (NW), the Qinghai–Tibet Plateau (QT), Northern America (NA), and European Union (EU). The two categories of snow products are utilized: The L3 Daily Tiled products, referenced by their Earth Science Data Type (ESDT) names of VJ110A1, VNP10A1, MOD10A1, MYD10A1, and L3 Daily Cloud-Gap-Filled (CGF) products, VJ110A1F, VNP10A1F, MOD10A1F, MYD10A1F. The important conclusions demonstrated as follows.
(1) During the snow season, the four types of 10A1 snow products demonstrated good consistency, with higher R values and smaller BIAS under clear sky. VIIRS exhibited a higher snow cover percentage than MODIS. By combining the four 10A1snow products, it is effective and feasible to produce cloud-free snow products.
(2) The consistency of the four 10A1F snow products was lower than that of the 10A1 products under clear skies. SNPP showed good consistency with JPSS-1, and the same to TERRA with AQUA.
(3) In the 10A1F products based on the previous day's clear-sky cloud-filling algorithm, VJ1 and VNP products exhibited larger fluctuations compared to MOD and MYD products. Among the 10A1F products, the smaller fluctuations and higher snow cover percentage of MODIS, along with a cloud persistence duration higher than VIIRS, led to an overestimation in MODIS's 10A1F snow products.
(4) The snow-cloud confusion is existing both in products with the same sensor and with different sensors for the 10A1products, and the latter is much larger than the former, the percentage of which is approximately 10% in the five regions.
(5) High-resolution snow product validation indicates that VIIRS has higher accuracy in both snow products than MODIS. 
(6) The newest JPSS-1 snow cover products display good agreement with that of SNPP. The pixels with the flag of ‘no decision’ in VNP10A1, MOD10A1, MYD10A1 are labelled as land, waterbody, and mostly clouds in VJ110A1 product, respectively.               
Above all, in spite of existing sensor differences affecting consistency of snow cover products, the paired comparisons indicated that under clear skies, the four snow products exhibit good consistency, with higher consistency observed in snow products from the same sensor. The evaluations by higher resolution snow products assured the high accuracy. It is effective and feasible to produce cloud-free snow products considering the overestimation of 10A1F products.

How to cite: Liu, A. W. and Che, T.: Consistency and Accuracy Assessment of Snow Cover Products from Terra, Aqua, SNPP and JPSS-1 Satellites, EGU General Assembly 2024, Vienna, Austria, 14–19 Apr 2024, EGU24-9925, https://doi.org/10.5194/egusphere-egu24-9925, 2024.

EGU24-11117 | Orals | CR1.5 | Highlight

Swiss snow cover in a changing climate: Evaluation of a long-term, high-resolution SWE climatology 

Sven Kotlarski, Sarina Danioth, Stefanie Gubler, Regula Muelchi, Adrien Michel, Tobias Jonas, Christian R. Steger, and Christoph Marty

Surface snow cover is an important and highly interactive component of global and regional climate systems and has already clearly responded to past warming trends in many regions of the world. Moreover, it is a key ingredient for tourism industry, water supply, irrigation, and hydro-power generation in many mountainous and high-latitude regions. Accurate information about the past, present and future evolution of snow cover is therefore of high importance.

In this context, we here present and evaluate a newly developed gridded SWE climatology for Switzerland, available at daily resolution since 1961 and at a 1 km grid spacing. The climatology is based on a variant of the snow cover model of the Operational Snow Hydrological Service (OSHD) of Switzerland, driven by gridded atmospheric input and bias-adjusted towards in-situ snow depth measurements. In accordance with previous works, the analysis shows that the Swiss snow cover has changed strongly over the last decades. The comparison of two climatological long-term periods, 1962-1990 and 1991-2020, in terms of mean September-May SWE and the number of snow days (SWE > 10 mm) within the snow season, reveals a decrease in both indicators over the majority of the country. Low elevations < 1000 m show relative decreases larger than 50% of the mean SWE and larger than 30% regarding the mean number of snow days (about -22 days). The largest absolute difference of mean SWE is found at medium elevations between 1500 and 2000 m with a decrease of about 45 mm (about -26%).

The validation of the new snow climatology indicates a high general agreement with in-situ observations and independent remote sensing products. Larger uncertainties and limitations are found at the highest elevations (> 3000 m). They originate from different sources, such as temporal inconsistencies in the gridded input data of the underlying OSHD snow model or the lack of stations at high elevations that are needed for the bias adjustment of the model. Nevertheless, the new snow climatology is able to provide adequate information on past snow cover for Switzerland as a whole and will, among others, serve as a reference for the development of future snow cover scenarios.

How to cite: Kotlarski, S., Danioth, S., Gubler, S., Muelchi, R., Michel, A., Jonas, T., Steger, C. R., and Marty, C.: Swiss snow cover in a changing climate: Evaluation of a long-term, high-resolution SWE climatology, EGU General Assembly 2024, Vienna, Austria, 14–19 Apr 2024, EGU24-11117, https://doi.org/10.5194/egusphere-egu24-11117, 2024.

EGU24-11228 | ECS | Orals | CR1.5

Mapping snow depth in the Arctic with public satellite elevation datasets, a case study in Iceland with ICESat-2 and the ArcticDEM 

César Deschamps-Berger, Joaquin Belart, Andri Gunnarsson, Jesus Revuelto, Guðfinna Aðalgeirsdóttir, and Juan Ignacio Lopez-Moreno

Satellite datasets are especially useful to monitor the cryosphere in vast and remote environments, such as the Arctic, where seasonal snowpack controls permafrost distribution, surface runoff, plant growth and animal survival rate. The recent availability of free, high-precision and high-resolution elevation datasets show promises to map snow depth on a large scale, a key bulk variable of the snowpack. Here, we mapped the snow depth distribution across Iceland (65°N) using elevation data from ICESat-2, a photon-counting laser altimetry satellite, and the ArcticDEM, a large set of digital elevation models from satellite stereoimages. The snow depth was retrieved through comparison of acquisitions with snow-on conditions (ICESat-2, ArcticDEM) and snow-free (summer ArcticDEM). Despite the heterogeneous spatial coverage of the two datasets, negative impacts of clouds, polar night and a shallow snowpack often close to the limit of detection, we successfully retrieved snow depth from 2018 to 2023, at monthly resolution. By leveraging large publicly available datasets, this approach is promising to further monitor the snowpack in other regions of the Arctic.

How to cite: Deschamps-Berger, C., Belart, J., Gunnarsson, A., Revuelto, J., Aðalgeirsdóttir, G., and Lopez-Moreno, J. I.: Mapping snow depth in the Arctic with public satellite elevation datasets, a case study in Iceland with ICESat-2 and the ArcticDEM, EGU General Assembly 2024, Vienna, Austria, 14–19 Apr 2024, EGU24-11228, https://doi.org/10.5194/egusphere-egu24-11228, 2024.

EGU24-11303 | ECS | Orals | CR1.5

Snow Distribution  Evaluation in High Mountain Asia: Observations and Modeling 

Guang Li, Hongxiang Yu, and Ning Huang

Snow in mountainous areas changes fast in space and time, resulting in strong spatial and temporal heterogeneity, which highly impacts the radiation balance and hydrological cycle. However, gaps still exist between observations and modeling due to serval issues. One issue is the absence of wind drifting and blowing snow (WDBS) processes in most mesoscale atmospheric models. A newly developed WDBS-coupled atmospheric model, CRYOWRF, was used to evaluate the snow distribution in the Tarim area and Namco area, to assess the impact of WDBS and its sublimation on the snow distribution. Field observations were also carried out to validate the modeling, which showed good agreement.  A highly temporal heterogeneity pattern is shown in High Mountain Asia due to the strong blowing snow sublimation. Our works prove that CRYOWRF has a good performance in High Mountain Asia.

How to cite: Li, G., Yu, H., and Huang, N.: Snow Distribution  Evaluation in High Mountain Asia: Observations and Modeling, EGU General Assembly 2024, Vienna, Austria, 14–19 Apr 2024, EGU24-11303, https://doi.org/10.5194/egusphere-egu24-11303, 2024.

EGU24-11617 | ECS | Posters on site | CR1.5

Can we estimate snow accumulation and melt across climates using simple temperature-index modelling? 

Adrià Fontrodona-Bach, Josh Larsen, Bettina Schaefli, and Ross Woods

There are two main limitations to understanding large-scale impacts of environmental change on snow resources, 1) observational snow data at the point scale is highly limited, and 2) extrapolation using models can be challenging due to data availability and performance. This study seeks to address these limitations using widely available climate network data combined with a temperature-index snow model to derive large-scale estimates of mean snow water equivalent conditions across the Northern Hemisphere. Temperature-index modelling is a common approach for simulating snow accumulation and melt in hydrological models. Many studies use this method because of its simplicity, efficiency, and generally good performance if properly calibrated. The approach relies on three assumptions and parameters, namely the snowfall and snowmelt temperature thresholds and the degree-day factor. At scales beyond single gauged catchments, the estimation of these parameters was difficult to date due to a lack of observations on snowmelt. Using the new Northern Hemisphere snow water equivalent dataset (NH-SWE) and co-located climate network observations of temperature and precipitation, this work provides the first large-scale evaluation of temperature-index melt model assumptions and parameters across a diverse range of snow climates. Our study reveals the 0°C as snowfall air temperature threshold captures most snowfall events, especially in cold climates, but risks missing 13% of snowfall events, especially in climates hovering at near-freezing temperatures. Similarly, a snowmelt air temperature threshold of 0°C performs well for most daily snowmelt observations but may incorrectly identify the onset of the melt season too early. Estimated degree-day factors converge towards 3-5 mm/°C/day for deeper snowpack climates (> 300 mm), but their estimation may be more challenging for colder climates with shallower snowpacks (< 300 mm), conditions where the degree-day factors have much higher interannual variability. For estimating mean values of seasonal snow onset and snowmelt season onset and mean snow accumulation at a given location, the temperature-index melt model performs consistently well on average despite its simplicity, but challenges may arise due to warm biases in temperature records or solid precipitation undercatch, mainly over higher elevation areas. This study provides valuable insights into temperature-index melt modelling for large-scale applications, and the results should help refine modelling approaches to enhance our understanding of snowpack responses to global warming.

How to cite: Fontrodona-Bach, A., Larsen, J., Schaefli, B., and Woods, R.: Can we estimate snow accumulation and melt across climates using simple temperature-index modelling?, EGU General Assembly 2024, Vienna, Austria, 14–19 Apr 2024, EGU24-11617, https://doi.org/10.5194/egusphere-egu24-11617, 2024.

EGU24-12946 | ECS | Orals | CR1.5

Impact of Internal Structure on Water Routing in a Semiarid Andean Glacier 

Gonzalo Navarro, Shelley MacDonell, Rémi Valois, Giulia de Pasquale, and Benjamin Robson

In semiarid Andean regions, rock glaciers are more prevalent than debris-free glaciers and their relatively extensive areal coverage suggest the existence of significant frozen water reserves. Although there are some doubts whether permafrost landforms constitute a readily available water resource due to the effective thermal insulation provided by the active layer, there is some suggestion that permafrost can act as a primary factor controlling water flow and delivery to the catchment. The hydrogeomorphological connections and water system processes linking different hydrological units impacts the fate of the generated water, making it paramount to understand how water is transmitted from the headwater hydrological system to the wider catchment to better predict future impact of climate change in this important environment. However, unravelling their role is reasonably complicated since in semiarid regions glacial complexes (i.e. combination of glaciers and rock glaciers) are common and contain not only complicated structures but also complex hydrological connections.

In this study, the scientific understanding of the hydrological role of ice-debris glacial landforms is analysed to better understand how the transfer of water by glacier complexes relates to their internal structure. The research analyses the lower section of the Tapado glacier complex, in the Chilean semiarid Andes (30°S), which comprised the lower section of the debris-covered Tapado Glacier, that is in morphologic continuity to a rock glacier and a moraine at lower elevations. Geophysical measurements and elevation changes using uncrewed aerial vehicles (UAVs) were employed to inspect the internal structure of the selected ice-debris units in order to evaluate how it controls hydrological routing and storage, and in the delivery of cryospheric waters to the wider catchment.

Overall, internal structural arrangement and composition affect water routing and storage on the explored ice-debris landforms. Impermeable zones, characterised by massive glacial ice, ground ice or interstitial ice, not only represent a water storage capacity but are also a barrier to water flow. Therefore, at their interface with air-filled debris they also play a role in downstream water transmission, since sectors such as the debris layer (debris-covered glacier), active layer (rock glacier), intra-permafrost sectors (rock glacier), and main interstitial ice-free body of the moraine play important roles in the downglacier flow transfer. In addition, the potential subpermafrost hydrological connection between the rock glacier and the moraine area was recognised to occur as baseflow. Importantly, a potentially relevant hydrological role of the rock glacier is described based on its observed heterogenous internal structure associated with enhanced vertical infiltration compared to the debris-covered glacier. Lastly, in general, the moraine acts as a transmissive medium between generated glacial and snow meltwater and the proglacial area and river, buffering incoming flows due to the existence of interstitial ice within moraine structure, which also potentially enables deep groundwater circulation.

How to cite: Navarro, G., MacDonell, S., Valois, R., de Pasquale, G., and Robson, B.: Impact of Internal Structure on Water Routing in a Semiarid Andean Glacier, EGU General Assembly 2024, Vienna, Austria, 14–19 Apr 2024, EGU24-12946, https://doi.org/10.5194/egusphere-egu24-12946, 2024.

EGU24-13564 | Orals | CR1.5 | Highlight

SWEET (Snow Water Equivalent Estimation Tool): A new tool to generate updated SWE estimates for poorly monitored regions 

Simone Schauwecker, Álvaro Ayala, Gonzalo Cortés, Eduardo Yáñez, Shelley MacDonell, Katerina Goubanova, and Cristian Orrego

In the dry Chilean North, the impact of the mountain snowpack on freshwater availability in the adjacent lowlands areas is crucial. The correlation between the snow water equivalent record and regionally averaged river discharges suggests that ~85% of the streamflow variance could be explained by the snowpack record alone. As seasonal snow cover depends on few winter events, there is a large year-to-year variability in the snow water equivalent (SWE). Typically, there are some dry years with very low annual precipitation which are compensated by wet years. However, since around 2010, the almost continuous extraordinarily dry conditions (so-called Central Chile “mega drought”) and increased water consumption in the region have led to significant stress on the water system. Hence, for an efficient water allocation and water management, it is crucial to know the actual SWE stored in the mountain snowpack. Until now, decisions have been based on scarce point measurements of the SWE or snow area estimates from MODIS. A drawback of these estimates is the large uncertainty that hampers efficient water allocation with important implications for water security of different sectors such as hydropower, agriculture and domestic use. 

To address this problem, we have developed a new operational SWE Estimation Tool for water resources decision making in the Coquimbo region (SWEET-Coquimbo), able to estimate current SWE in near real-time with a latency of ~10 days. SWE is estimated using a data assimilation framework that combines bias-corrected meteorological forcing ensembles from reanalysis data (ERA5, 5-day latency), hydrological modeling (Snowmodel) and satellite observations (Landsat) of the snow-covered area. SWEET-Coquimbo is placed in an open-access web platform, visualizing the current state of the SWE of five main catchments. The data can be downloaded and used for research and diagnostic purposes. 

The newly generated data show SWE for the period 2000-2023. We can now better understand the response of the regional snow cover to the Central Chile megadrought on snow cover and general trends in SWE over the last two decades. SWEET-Coquimbo has allowed, for the first time, a catchment-based estimation of the water available from the snowpack, which can now be used to improve seasonal runoff forecasts. Furthermore, our method has a great potential to be validated and applied to other mountainous regions with sparse in-situ data, as it does not rely directly on in-situ data.

How to cite: Schauwecker, S., Ayala, Á., Cortés, G., Yáñez, E., MacDonell, S., Goubanova, K., and Orrego, C.: SWEET (Snow Water Equivalent Estimation Tool): A new tool to generate updated SWE estimates for poorly monitored regions, EGU General Assembly 2024, Vienna, Austria, 14–19 Apr 2024, EGU24-13564, https://doi.org/10.5194/egusphere-egu24-13564, 2024.

EGU24-16383 | ECS | Posters on site | CR1.5

Decadal changes of the snow in the western Tian- shan derived from in-situ snow depth measurements  

Adkham Mamaraimov, Abror Gafurov, Andreas Güntner, and Bodo Bookhagen

Winter snow accumulation is important for summer water supply in Central Asia, and contributes more than 50 % to the annual runoff. The region’s water availability is highly dominated by snow reserves in the mountain, which will be affected by climate change. Volumetric snow data play a vital role for hydrologic forecast in mountainous river basins, where snow is considered as a dominating hydrological component. This study quantifies decadal snow depth changes in the Western Tian-Shan in the Chirchik River Basin in Uzbekistan. The snow depth measurements from Uzhydromet have been used in this research. The historical changes in snow depth has been statistically analyzed for the 1963-2020 hydrological years. Correspondingly, the impact of climatic factors (temperature and precipitation) on snow dynamics were assessed as well. The results of hydrometeorological parameters such as snow depth, air temperature at 2 meters and precipitation were plotted as the trend line on monthly, seasonal, and annual scales. To verify statistical significance of the trend dynamics, the slope method and the Mann-Kendall trend test were applied. Our results show that snow cover (duration) days were significantly decreased by 4 days per decade or 21 days for 57 years from 1963 to 2020. Particularly, the initial occurrence of a permanent snow onset day was significantly delayed by 3 days per decade or 16 days for 57 years. Likewise, annual peak snow depth day was significantly shifted earlier by 4 days per decade or 20 days for 57 years. Interestingly, the maximum snow depth did not change statistically significant, but we observe a decline of 3.33 cm per decade or 19 cm for 57 years. Overall, we conclude that the duration of snow cover (snow reserve) has significantly decreased in the Chirchik basin due to climate warming in the last 57 years.     

How to cite: Mamaraimov, A., Gafurov, A., Güntner, A., and Bookhagen, B.: Decadal changes of the snow in the western Tian- shan derived from in-situ snow depth measurements , EGU General Assembly 2024, Vienna, Austria, 14–19 Apr 2024, EGU24-16383, https://doi.org/10.5194/egusphere-egu24-16383, 2024.

EGU24-17058 | Orals | CR1.5

Present and future evolution of the winter snow cover in the French Vosges massif with the help of the regional climate MAR model 

Xavier Fettweis, Bruno Ambroise, Pierre-Marie David, Nicolas Ghilain, and Patrice Paul

The current and future evolution of snow cover in the Vosges massif (N-E of France) was simulated at a resolution of 4 km with the regional climate model MAR (version 3.14) forced by the ERA5 reanalysis. Thanks to the adjustment of only few parameters, MAR (initially developed for the polar regions) was optimized and validated with respect to daily observations of temperature, precipitation and height of the snowpack. Over the 62 winters (DJF) 1960-2021, MAR suggests a statistically significant decrease of about a factor of two in the average snow depth due to the significant increase in temperatures (~+2°C/62 years). Although precipitation has slightly increased (+10-20%/62 years) due to a non-significant strengthening of the westerly circulation, it falls more and more in the form of rain, especially below 1000 m. Above 1000 m, it does not snow less than before but there is more melting reducing the snowpack between two snow events. By extrapolating current trends, an anomaly of +2.5°C (resp. +3.8°C) compared to the winters of 1960-90 would be sufficient to no longer have snowpack on average below 750m (resp. 1000m). This trend is fully confirmed by MAR forced by 5 global models (EC-EARTH3, IPSL-CM6A-LR, MIROC6, MPI-ESM1-HR, NorESM2) from the CMIP6 database using both SSP245 and SSP585 scenarios over 1980-2100. In 2050, the average winter snow cover at 1000m will be reduced by half and will become almost non-existent in 2100 following SSP585. While with SSP245, MAR suggests skiing conditions still possible until 2100 above 1000m.

How to cite: Fettweis, X., Ambroise, B., David, P.-M., Ghilain, N., and Paul, P.: Present and future evolution of the winter snow cover in the French Vosges massif with the help of the regional climate MAR model, EGU General Assembly 2024, Vienna, Austria, 14–19 Apr 2024, EGU24-17058, https://doi.org/10.5194/egusphere-egu24-17058, 2024.

EGU24-17505 | ECS | Orals | CR1.5

Determining snow material properties from near-infrared photography 

Lars Mewes, Benjamin Walter, Jon Buchli, Valeria Büchel, Markus Suter, Martin Schneebeli, and Henning Löwe

It is well understood that snow is a complex, porous material, whose microstructural changes directly affect its physical properties. Therefore, – to gauge the snow's role within the climate system – it is of interest to accurately measure and characterize the spatio-temporal variability of snow surfaces and snowpacks.

On a local scale, for example inside a snowpit during a field campaign, snow measurements are often taken in a manual, point-like fashion resulting in single, one-dimensional profiles with a sampling resolution of a few centimeters. At this resolution thin layers are difficult to observe and spatial inhomogeneities of the snowpack are missed. State-of-the-art X-ray microtomography (μ‑CT) scans of snow provide excellent spatial resolution,1 however, the added experimental constraints prevent sampling extended spatio-temporal domains.

To address some of these limitations, we propose to use near-infrared (NIR) photography2 with 940 nm illumination to determine the snow's specific surface area (SSA) and density. Our device – called SnowImager – achieves millimeter resolution and covers a spatial extent of a few square meters, such as the surface area of a snowpit wall. While the SSA is determined directly from the measured NIR image using the well-established asymptotic radiation transfer theory,3–6 the density dependence is introduced by physically truncating the illuminating and back-scattered light. It results non-trivially from the lateral component of the sub-surface scattering process and enables us to recover density profiles that compare well to reference data from density cutter and μ‑CT measurements. As a demonstration, we present the spatial variability of an Antarctic snowpack at an unprecedented level of detail, revealing an extremely high spatial variability of the snow microstructure.

Using near-infrared photography enables accurate and fast determination of snow material properties, whenever millimeter spatial resolution and a spatial extent of several square meters are required. It is thus ideally suited to simultaneously capture thin layers within the snowpack and spatial inhomogeneities over a centimeter to meter scale, which is relevant as ground truth measurement for climate research, remote sensing and avalanche forecasting among others.


1. Kerbrat, M. et al., Atmos. Chem. Phys. 8, 1261–1275 (2008).

2. Matzl, M. & Schneebeli, M., J. Glaciol. 52, 558–564 (2006).

3. Bohren, C. F. & Barkstrom, B. R., J. Geophys. Res. 79, 4527–4535 (1974).

4. Warren, S. G., Rev. Geophys. 20, 67–89 (1982).

5. Kokhanovsky, A. A. & Zege, E. P., Appl. Opt. 43, 1589–1602 (2004).

6. Libois, Q. et al., The Cryosphere 7, 1803–1818 (2013).

How to cite: Mewes, L., Walter, B., Buchli, J., Büchel, V., Suter, M., Schneebeli, M., and Löwe, H.: Determining snow material properties from near-infrared photography, EGU General Assembly 2024, Vienna, Austria, 14–19 Apr 2024, EGU24-17505, https://doi.org/10.5194/egusphere-egu24-17505, 2024.

Seasonal alpine snow is subject to fluctuating meteorological conditions with diurnal temperature cycles around the freezing point and a mix of snow and rain. Throughout the season, fresh snow accumulations repeatedly contribute to the snowpack whereas older layers beneath contain snow at various stages of the metamorphosis often including melting and refreezing periods. The increasing complexity of the snowpack throughout the snow season affects the interaction of radar signals with the snowpack and underlying ground.

Numerous radar/SAR missions, operating at different frequencies, aim to retrieve snow parameters such as snow mass, snow water equivalent, and snow cover extent. These include missions like CRISTAL, TSMM, ROSE-L, and NISAR, each utilizing specific frequency bands to study the temporal variations in snow properties. Understanding the vertical structure of seasonal snow and its interaction with radar signals at various microwave frequencies from L- to Ka-band is therefore essential.

In our study, we investigated tower-mounted rail-based tomographic SAR measurements obtained within the ESA SnowLab project in Davos Laret, Switzerland. The SAR tomography technique provides non-destructive measurements of the vertical structure of the snowpack by means of vertical profiles of radar backscatter, co-polar phase differences, and interferometric phase differences. The measurements were taken with the ESA SnowScat and the ESA Wide-Band Scatterometer, covering a wide range of frequency bands. Additional data on snow characteristics and meteorology complemented the radar measurements. We present time series of SAR tomographic profiles over entire snow seasons at different frequency bands (1-6 GHz, 12-18 GHz, and 28-40 GHz) with reference snow characterizations obtained from snow pits and SnowMicroPen measurements. Detailed analyses include depth-resolved co-polar phase differences, anisotropy, and differential interferometric phase, revealing insights into changes in snow properties over time.

The high-resolution SAR tomographic profiles offer valuable information on microwave interactions with seasonal alpine snow. Analysis of vertical radar backscatter profiles indicates relative changes in location and intensity within the snowpack, correlating with factors like melting and refreezing cycles, snow accumulation, and liquid water content.

We find that distinctive features of seasonal snow, such as melt-freeze crusts, varying penetration depths, and anisotropy can be tracked over time using a SAR tomography approach. To exploit this information for snow mass and structure retrieval, further research tailored to specific spaceborne SAR mission objectives is required. The ESA SnowLab time series of SAR tomographic profiles is a rich dataset covering a broad spectrum of frequencies and providing an opportunity to advance the understanding of scattering mechanisms in alpine snow for various spaceborne SAR missions. The comprehensive coverage includes frequency bands relevant to existing and future mission concepts.

How to cite: Frey, O., Wiesmann, A., Werner, C., Caduff, R., Löwe, H., and Jaggi, M.: High-resolution snow parameter/structure retrieval from tower-based radar time series of seasonal snow obtained with the ESA SnowScat and the ESA Wideband Scatterometer in SAR tomographic profiling mode, EGU General Assembly 2024, Vienna, Austria, 14–19 Apr 2024, EGU24-17561, https://doi.org/10.5194/egusphere-egu24-17561, 2024.

EGU24-17624 | Orals | CR1.5

Snowfall variability, trends and their altitudinal dependence in the European Alps from ERA5, HISTALP and in-situ observations 

Silvia Terzago, Ludovica Martina Gatti, Enrico Arnone, and Michael Christian Matiu

Mountain precipitation is a key feature of the hydrological cycle since it feeds snowpack, glaciers, river runoff and supports ecosystems and human life both locally and downstream. However, available precipitation datasets are affected by large uncertainties in mountain regions, especially during the cold season when most of the precipitation falls as snow: on one hand, commonly used precipitation gauges can have systematic losses up to 80-100% in case of snow precipitation, mainly owing to wind undercatch; on the other hand, reanalysis datasets generally provide much larger precipitation amounts when compared to observations and observation-based datasets. So, an accurate quantification of the snowfall component is crucially needed to reduce the uncertainty on mountain total precipitation in the cold season.    

In this work we present an extensive analysis of snowfall precipitation over the Greater Alpine Region (GAR) considering snowfall data from different data sources, including long-term in-situ observations, reanalysis and gridded datasets. We analyze: i) the most comprehensive observational dataset of monthly fresh snow depth (commonly employed as a measure of snowfall precipitation), consisting of more than 2000 in-situ station time series, covering 6 alpine countries (Switzerland, Austria, Germany, Slovenia, Italy and France); ii) the snowfall dataset provided by the ECMWF ERA5 global reanalysis at 0.25° spatial resolution, and iii) the HISTALP gridded snowfall dataset at 0.08° spatial resolution, which is based on temperature and precipitation observations. We compare the three datasets over the last decades to investigate i) climatological features of seasonal and monthly snowfall over the GAR; ii) snowfall variability and trends in relation to elevation; iii) snowfall trends in relation to temperature and total precipitation, based on the best available observational datasets; iv) uncertainties in the snowfall climatology and trends, by comparing the different data sources. This study provides a first comprehensive evaluation of the quality of ERA5 and HISTALP snowfall datasets against ground observations. Moreover, by quantifying the snowfall component, it contributes to better characterize mountain precipitation in the cold season.  

How to cite: Terzago, S., Gatti, L. M., Arnone, E., and Matiu, M. C.: Snowfall variability, trends and their altitudinal dependence in the European Alps from ERA5, HISTALP and in-situ observations, EGU General Assembly 2024, Vienna, Austria, 14–19 Apr 2024, EGU24-17624, https://doi.org/10.5194/egusphere-egu24-17624, 2024.

EGU24-17847 | ECS | Posters on site | CR1.5

Exploring potential nonlinear developments of snowline depletion in a changing climate in Austria 

Daniel Günther, Roland Koch, and Marc Olefs

The seasonal snow cover is of great interest in Austria due to its immense importance for numerous economic, ecological and social sectors. Meteorological conditions, expressed as the snowline altitude determine whether rain or snow falls on the ground. If the intensity of precipitation is sufficiently high and there is little atmospheric mixing, the melting of solid precipitation in valley areas can lead to a cooling of the atmosphere and to a further drop in the snowline altitude – the snowline depletion effect.  In the course of a changing climate, an increase in snowline altitude is predicted. However, these predictions do not consider the described effect of snowline depletion. From the theory, the increase of the snowline has nonlinear consequences for the frequency and intensity of the subsequent depletion effect. In this study, we investigate this effect for Austria during past precipitation events on the basis of station observations and gridded now-casting products, develop and test a simplified parametrization, and subsequently show its potential future evolution based on simulations.

How to cite: Günther, D., Koch, R., and Olefs, M.: Exploring potential nonlinear developments of snowline depletion in a changing climate in Austria, EGU General Assembly 2024, Vienna, Austria, 14–19 Apr 2024, EGU24-17847, https://doi.org/10.5194/egusphere-egu24-17847, 2024.

EGU24-18184 | Posters on site | CR1.5

First results of an inventory of mountain snow information at global scale 

Wolfgang Schöner, Michael Matiu, and Carlos Wydra

Snow information from mountain regions worldwide is of high relevance but its spatial and temporal distribution inhomogeneous. The currently running IACS Joint Body on the Status of Mountain Snow Cover, a joint initiative of IACS together with MRI and WMO GCW aims at improving the snow information, data availability and the access to the data for mountain regions worldwide. As part of the initiative, an inventory was initiated which should provide a first and overall picture on the spatial and temporal availability of snow information in the various mountain regions of the world. As there is no strict delineation of mountain from non-mountain regions, it has been up to the contributing experts to decide on what is part/not part of a mountain region. For larger mountain regions with rather different snow climates, the spatial resolution of the inventory was split into several parts. The inventory was launched in May 2023 and was implemented as on online tool.

The paper presents initial analyses of the inventory, looking at the spatial and temporal patterns of snow information at a global scale. The picture derived from the feedback of the inventory shows fairly clear global differences, with regions where individual researchers (e.g. Central Asia) are driving access to snow information, while other regions have well established access routines/portals provided by the institutions operating the snow networks (e.g. the US). A preliminary analysis based on metadata from the inventory, a digital elevation model and the GMBA mountain delineation identifies the distribution of in-situ station and their snow information worldwide and how this varies by region and elevation. Information on already estimated spatial and temporal trends of key snow cover variables from mountain regions, such as for snow depth HS and depth of snowfall HN (from unpublished and published papers), are compiled together, although the different trend periods do not make comparison easy. Overall, a rather inhomogeneous picture emerges with regions such as the Alps or the Scandinavian mountains on the one hand, in which the snow information is spatially and temporally dense (with many published studies), and on the other hand regions (such as Greenland or Patagonia) in which the snow information from observations is extremely sparse.

How to cite: Schöner, W., Matiu, M., and Wydra, C.: First results of an inventory of mountain snow information at global scale, EGU General Assembly 2024, Vienna, Austria, 14–19 Apr 2024, EGU24-18184, https://doi.org/10.5194/egusphere-egu24-18184, 2024.

EGU24-18472 | Orals | CR1.5

On the importance of the cryosphere in a tropical Andean basin: the past, present and future of the glaciers and runoff in the Rio Santa 

Catriona Fyffe, Emily Potter, Evan Miles, Thomas Shaw, Mike McCarthy, Andrew Orr, Edwin Loarte, Katy Medina, Simone Fatichi, and Francesca Pellicciotti

The Peruvian Andes contains the largest mass of glaciers in the tropics and these glaciers have shown considerable decay over the past 4 decades and into the present day. The historic and future runoff is tied to the cryospheric changes in the region and this could have important consequences for water resources, given the importance of snow and ice melt for dry season runoff. To disentangle the role of the cryosphere in the water cycle in the tropical Andes we run the fully distributed, hourly glacier-hydrological model TOPKAPI-ETH, both in the past (from 1987) and into the future over the upper Rio Santa catchment in the Cordillera Blanca. Meteorological forcing is provided by bias-corrected WRF simulations, which are also used for statistical downscaling of CMIP5 model projections to provide the future climatology. Calibration of model parameters is conducted using a step-wise approach using a wealth of ground-based data and model outputs are evaluated against gauged runoff data and remote sensing estimates of snow cover, glacier cover and glacier mass balance. 

We find that under present conditions (2008-2018) snowmelt is an important contributor to runoff, comprising 16% to 47% of inputs (the range in weekly average as a proportion of all snow melt (on and off-glacier), ice melt and rain contributions) into the catchment with its proportional contribution largest at the beginning of the dry season (early June). Off-glacier snowmelt is important in the wet season, but snow is confined to on-glacier areas by the mid-dry season. Snow cover <5000 m is ephemeral, lasting hours to days, with correspondingly thin average snow depths and rapid fluctuations in the wet season snowline. Meanwhile, ice melt is an important contributor to runoff in the dry season (up to 54% of the inputs in early August) in all glacierised catchments, even those with a small glacier cover, but the wet season contribution is small. We also explore the long term evolution of glaciers and snow cover in the catchment and its implications for catchment runoff. Through the long term modelling we investigate the timing of peak water in the catchment and the key drivers of runoff change in the past. Our future projections will allow us to examine the impact of future climate changes on the glaciers and snow dynamics. A key vulnerability is the impact of temperature increases on the ephemeral snowpack and the consequences for glacier mass balance. We will also investigate the potential implications for catchment runoff and dry season water availability.

How to cite: Fyffe, C., Potter, E., Miles, E., Shaw, T., McCarthy, M., Orr, A., Loarte, E., Medina, K., Fatichi, S., and Pellicciotti, F.: On the importance of the cryosphere in a tropical Andean basin: the past, present and future of the glaciers and runoff in the Rio Santa, EGU General Assembly 2024, Vienna, Austria, 14–19 Apr 2024, EGU24-18472, https://doi.org/10.5194/egusphere-egu24-18472, 2024.

EGU24-19588 | Orals | CR1.5

Seasonal snow cover variations in Central Asia based on remote sensing data 

Akmal Gafurov, Adkham Mamaraimov, Busch Friedrich, and Abror Gafurov

Snow is an important hydrological component in Central Asia. The snowmelt contributes to about 50 % of total water formation in the region, depending on geographic conditions. Many hydro-meteorological phenomena such as floods or drought conditions can be triggered by snowmelt amounts in Central Asia. The amount of snow accumulation in the mountains of Tian-Shan and Pamir also defines the availability of water for summer months to be used for agricultural production or re-filling of reservoirs for energy production in the winter period. Thus, it is of high importance to better understand the seasonal variation of snow and if the over the global average climate warming in the region is affecting the processes related to snow accumulation and melt.

In this study, we analyze 22 years of daily Moderate Resolution Imaging Radiometer (MODIS) snow cover data that was processed using the MODSNOW-Tool, including cloud elimination. Additionally, observed snow depth data from meteorological stations were used to estimate trends related to snow cover change. We used several parameters such as snow cover duration, snow depth, snow cover extent, and snowline elevation to analyze changes.  We conducted this analysis in 18 river basins across the Central Asian domain with each river basin having different geographic conditions and the results show varying tendencies. In many river basins, a clear decrease of snow cover was found to be significant, whereas in some river basins also increase in the snow cover extent in particular months could be identified. We attributed the changes related to snow cover to available historical temperature and precipitation records from meteorological stations to better understand the driving forces. The results of this study indicate seasonal snow cover variations but also potential water shortages in particular months as well as water abundance in months where water demand is not high in Central Asia.

How to cite: Gafurov, A., Mamaraimov, A., Friedrich, B., and Gafurov, A.: Seasonal snow cover variations in Central Asia based on remote sensing data, EGU General Assembly 2024, Vienna, Austria, 14–19 Apr 2024, EGU24-19588, https://doi.org/10.5194/egusphere-egu24-19588, 2024.

EGU24-21766 | ECS | Posters on site | CR1.5

Evaluating Sentinel-1 volume scattering based snow depth retrievals over NASA SnowEx sites 

Zachary Hoppinen, Ross Palomaki, Jack Tarricone, George Brencher, Devon Dunmire, Eric Gagliano, Adrian Marziliano, Naheem Adebisi, Randall Bonnell, and Hans-Peter Marshall

Synthetic aperture radar will be at the forefront of future advancements in global

remote sensing of snow depth and snow water equivalent. Recently, snow depth

retrievals using an empirical volume scattering approach with C-band Sentinel-1 (S1)

data have been demonstrated over the European Alps and Northern Hemisphere, with

the most accurate results obtained in regions with dry, deep (>1.5 m) snowpacks and

little vegetation influence. However, these S1-based snow depth retrievals have

previously been compared only to point-based measurements or modeled snow depth

products. In this study we develop an open-source version of the S1 snow depth

retrieval technique and compare the results to spatially-distributed lidar snow depth

measurements. The highly accurate and fine resolution lidar datasets were collected

during the NASA Snow SnowEx 2020 and 2021 field campaigns at six study sites

across the western United States. These regions represent different snow environments

and characteristics than the datasets used for comparison in previous investigations.

We compare the S1 and lidar snow depths at a range of spatial resolutions and interpret

the results within the context of snowpack, vegetation, and terrain characteristics. At 90

m resolution, comparisons between lidar and S1 snow depth retrievals show low to

moderate correlations (R = 0.38) and high RMSE (0.98 m) averaged across the study

sites, with improved performance at 500 m resolution (R = 0.59, RMSE = 0.69 m). The

distribution of S1 and lidar snow depths are more similar in regions of deeper snow,

lower forest coverage, higher incidence angles, dry snow, and at coarser spatial

resolutions. Our results highlight limitations of the current S1 snow depth algorithm and

present opportunities to improve the technique for future snow depth retrievals across

varied snow environments.

How to cite: Hoppinen, Z., Palomaki, R., Tarricone, J., Brencher, G., Dunmire, D., Gagliano, E., Marziliano, A., Adebisi, N., Bonnell, R., and Marshall, H.-P.: Evaluating Sentinel-1 volume scattering based snow depth retrievals over NASA SnowEx sites, EGU General Assembly 2024, Vienna, Austria, 14–19 Apr 2024, EGU24-21766, https://doi.org/10.5194/egusphere-egu24-21766, 2024.

EGU24-22452 | Posters on site | CR1.5

Use of mobile L-Band interferometric synthetic aperture radar observations to inform snow property estimation 

Elias Deeb, Tate Meehan, Zach Hoppinen, Charles Werner, Othmar Frey, Richard Forster, and Adam LeWinter

With the dawn of future L-Band satellite interferometric missions (e.g., NISAR - NASA/ISRO SAR and ESA ROSE-L) upon us, there are unique opportunities to explore the use of radar methods and techniques across a variety of applications. Moreover, through the advancement of radar remote sensing hardare and software, additional opportunities exist to specifically target and explore the development of snow estimation, snowmelt impact, and resulting soil moisture detection applications. With the development of mobile interferometric synthetic aperture (InSAR) hardware and software solutions, we present findings from field campaigns using a multi-polarization L-band (1.6 GHz) InSAR system (Gamma Remote Sensing) deployed from mobile vehicle (car), unmanned aerial vehicle (UAV), and helicopter-based platforms. These platforms allow us to control the temporal repeat of InSAR acquisitions assessing the role of changing environmental conditions on InSAR coherence, bracketing synoptic weather events to identify change in the radar signal, as well as simulating the temporal repeat of future satellite missions to estimate what may be done with these data when available. Results from time-series of InSAR acquisitions exploring snow water equivalent estimation, soil moisture, and airborne deployments (e.g., helicopter and UAV) show sensitivity to L-Band coherence and phase for application development. Future work will also be discussed exploring interferometric tomography and bistatic radar applications.

How to cite: Deeb, E., Meehan, T., Hoppinen, Z., Werner, C., Frey, O., Forster, R., and LeWinter, A.: Use of mobile L-Band interferometric synthetic aperture radar observations to inform snow property estimation, EGU General Assembly 2024, Vienna, Austria, 14–19 Apr 2024, EGU24-22452, https://doi.org/10.5194/egusphere-egu24-22452, 2024.

EGU24-22543 | Orals | CR1.5

Quantifying snow water storage from aerial LiDAR surveys in eight Pacific coastal watersheds, British Columbia, Canada 

Rosie Bisset, Bill Floyd, Brian Menounos, Alison Bishop, Sergey Marchenko, Peter Marshall, and Hakai Geospatial

While airborne Light Detection and Ranging (LiDAR) surveys are routinely used to measure snow volume in many types of mountain watersheds, those that are heavily forested and lie within maritime environments have been largely ignored to date. Here, we summarise our findings from a four-year study (2020-2023) of eight watersheds within the coastal rainforests of southwest British Columbia, which collectively represent an area of >330 km2. Aerial LiDAR surveys were conducted 3 to 5 times per year between March and June in order to measure snow depth across each watershed. Spatiotemporally-distributed snow density was estimated using a random forest model incorporating weather station data, LiDAR-derived metrics and in-situ snow density observations. At peak snow volume, we find typical mean catchment-wide snow water equivalent values of ~600-1200 mm, verified by a widespread field campaign consisting of > 25,000 in-situ measurements of snow depth and density. We show that, typically, ~60-90 % of the snow water volume is stored at mid-elevations of between 800 and 1500 m, where air temperatures are close to melting point and forest cover is prevalent, leaving the snowpack vulnerable to early seasonal melt onset and impacts due to forest management. We find that while peak measured snow volume typically represents ~20-40 % of surface runoff, providing an important buffer towards droughts within the region, snowmelt volumes can be insufficient to safeguard downstream water supply during extreme seasonal drought events. Overall, the results of this work provide valuable insights into the vulnerability of the snowpack in coastal maritime regions and the potential knock-on effects of a changing snowpack on regional water security.

How to cite: Bisset, R., Floyd, B., Menounos, B., Bishop, A., Marchenko, S., Marshall, P., and Geospatial, H.: Quantifying snow water storage from aerial LiDAR surveys in eight Pacific coastal watersheds, British Columbia, Canada, EGU General Assembly 2024, Vienna, Austria, 14–19 Apr 2024, EGU24-22543, https://doi.org/10.5194/egusphere-egu24-22543, 2024.

Glacier surges are prevalent in the Karakoram and often threaten local residents by submerging land and initiating secondary disasters. The Kyagar Glacier is well known for its surge history as it frequently blocked the downstream valley, leading to a series of high-magnitude glacial lake outburst floods. Although the surge dynamics of the Kyagar Glacier have been broadly described in the literature, there remains an extensive archive of remote sensing observations that have great potential for revealing specific surge characteristics and their relationship with historic lake outburst floods. We propose a new perspective on quantifying the surging process using successive digital elevation models (DEMs), which could be applied to other sites where glacier surges are known to occur. Advanced Spaceborne Thermal Emission and Reflection Radiometer DEMs, High Mountain Asia 8-meter DEMs, and the Shuttle Radar Topography Mission DEM were used to characterize surface elevation changes throughout the period from 2000 to 2021.We also used Landsat time series imagery to quantify glacier surface velocities and associated lake changes over the course of two surge events between 1989 and 2021. Using these datasets, we reconstruct the surging process of the Kyagar Glacier in unprecedented detail and find a clear signal of surface uplift over the lower glacier tongue, along with uniformly increasing velocities, associated with the period of surge initiation. Seasonal variations in surface flow are still evident throughout the surge phase, indicating the presence of water at the glacier bed. Surge activity of the Kyagar Glacier is strongly related to the development and drainage of the terminal ice-dammed lake, which is controlled by the drainage system beneath the glacier terminus.

How to cite: Lv, M.: Quantifying the surging process of the Kyagar Glacier in the Karakoram using successive digital elevation models and optical satellite images, EGU General Assembly 2024, Vienna, Austria, 14–19 Apr 2024, EGU24-2778, https://doi.org/10.5194/egusphere-egu24-2778, 2024.

EGU24-3498 | ECS | Orals | CR5.2 | Highlight

Reconstructed global glacier mass change since LIA strongly influenced by the sample of observed glaciers 

Anouk Vlug, Fabien Maussion, Paul Leclercq, Larissa van der Laan, Jonathan Carrivick, and Ben Marzeion

An accurate global reconstruction of glacier mass change since the Little Ice Age (LIA) is of importance for, e.g., glacier mass change attribution studies and constraining the past sea-level budget. However, there are significant inconsistencies between reconstructions of the global LIA volume derived from (i) glacier length change records and (ii) glacier models that include the build-up to the LIA. The inconsistencies are present in both the magnitude and timing of the LIA maximum. Model reconstructions have shown a smaller peak of glacier volume, occurring many decades later than glacier length records indicate. Furthermore, as the maximum LIA volume did not occur synchronously between glaciers, the sampling choice of glaciers from the global population will have an impact on the total reconstructed LIA volume. Here, we tested the effect of different sampling strategies on reconstructed LIA volume, using a model based reconstruction from the Open Global Glacier Model, forced with the Last Millennium Reanalysis, as a surrogate world. Our analysis shows that glaciers for which length change observations prior to 1945 are available (the “real-world sample”) are not representative of the global signal. This shortcoming has the potential to explain large inconsistencies between the model-based reconstructions of glacier mass and reconstructions from observations. While the real-world sample is skewed, it is still a better representation of the global signal than would be expected from a random sample of the same size.

How to cite: Vlug, A., Maussion, F., Leclercq, P., van der Laan, L., Carrivick, J., and Marzeion, B.: Reconstructed global glacier mass change since LIA strongly influenced by the sample of observed glaciers, EGU General Assembly 2024, Vienna, Austria, 14–19 Apr 2024, EGU24-3498, https://doi.org/10.5194/egusphere-egu24-3498, 2024.

EGU24-4066 | Orals | CR5.2 | Highlight

Reconciled regional & global glacier mass changes 2000−2022 

Michael Zemp, Livia Jakob, Inés Dussaillant, Samuel, U. Nussbaumer, Sophie Dubber, and Noel Gourmelen and the GlaMBIE Team

Glacier changes are a sign of climate change and have an impact on the local hazard situation, region runoff, and global sea level. In previous reports of the Intergovernmental Panel on Climate Change (IPCC), the assessment of glacier mass changes was hampered by spatial and temporal limitations as well as by the restricted comparability of different observing methods. The Glacier Mass Balance Intercomparison Exercise (GlaMBIE; https://glambie.org) aims to overcome these challenges in a community effort to reconcile in-situ and remotely sensed observations of glacier mass changes at regional to global scales.

In this contribution, we will present the approach and results of the new data-driven consensus estimation of regional and global mass changes from glaciological, DEM-differencing, altimetric, and gravimetric methods. Our reconciled estimate suggests a global glacier mass loss of about 5,500 Gt from 2000 to 2022, with an acceleration of about 25% when comparing the second with the first half period. Since 2000, glaciers regionally have lost between 1 and 30% of their total ice volume, and about 4.5% globally. We will discuss these results in view of differences between observation methods and in comparison to previous IPCC reports, the implications for regional glacier mass loss and global sea-level rise, and remaining opportunities for further research.

How to cite: Zemp, M., Jakob, L., Dussaillant, I., Nussbaumer, S. U., Dubber, S., and Gourmelen, N. and the GlaMBIE Team: Reconciled regional & global glacier mass changes 2000−2022, EGU General Assembly 2024, Vienna, Austria, 14–19 Apr 2024, EGU24-4066, https://doi.org/10.5194/egusphere-egu24-4066, 2024.

EGU24-4111 | ECS | Orals | CR5.2

Alpine-wide LIA glacier reconstruction and ELA patterns using glacier modelling 

Andreas Henz, Andreas Vieli, Samuel Nussbaumer, and Guillaume Jouvet

The maximum extent of the glaciers in the European Alps during the Little Ice Age (LIA) is relatively well known. However, the ice surface geometry and related ice volume are still poorly constrained. We provide an Alpine-wide reconstruction of glacier thickness using the novel Instructed Glacier Model (IGM). The IGM uses the innovative approach based on deep-learning and GPU to accelerate the solving of computationally expensive 3D physics of glacier flow, which is key to work in high-resolution at the Alpine scale. The mass-balance model is tuned to fit each glacier of the Alps to its known maximum LIA extent resulting in ice-surface geometries and volumes that are consistent with glacier physics and the principles of mass conservation. In addition, our approach provides the corresponding equilibrium-line altitudes (ELAs) for individual glaciers and thereby reveals regional ELA patterns. Comparing these patterns with pre-industrial climate model data permits to analyse the relationship between ELA and climate factors such as temperature, precipitation, aspect, and solar radiation. In conclusion, our approach not only contributes to the estimates of LIA glacier shapes and geometries, but also permits to infer first-order relationships between glacier dynamics and climate conditions.

How to cite: Henz, A., Vieli, A., Nussbaumer, S., and Jouvet, G.: Alpine-wide LIA glacier reconstruction and ELA patterns using glacier modelling, EGU General Assembly 2024, Vienna, Austria, 14–19 Apr 2024, EGU24-4111, https://doi.org/10.5194/egusphere-egu24-4111, 2024.

The Little Ice Age (LIA) was originally understood as a period of increased glaciation in the late Holocene. Today, the term is used to describe the multi-centennial glacier advance and maximum level period in the last millennium, but it is also used to refer to the contemporaneous cooler climatic conditions beyond glaciated areas.

Glacier dynamics in the Alps during the last centuries of the LIA are especially known from historical documents, i.e., written and pictorial sources, which essentially date from around 1600 CE and cover some well-known glaciers. Today, these data are enhanced in particular by tree-ring analyses on remnants of trees buried during glacial advances, which can provide calendar dates for advances and glacier maxima, also for the early centuries of the LIA. Moreover, our knowledge of the LIA period is increasingly enhanced by regional climate reconstructions and analyses on climate forcings.

The LIA in the Alps can be defined as the period between the onset of climate cooling, which led to a first LIA-type maximum of glaciers, and the last LIA maximum level generally observed around the middle of the 1800s, i.e., between 1260 and 1860 CE. The first LIA-type maxima are demonstrable for the 1300s, around 1320 and 1380 CE, and then further, often seven maxima for the period ca. 1600-1860 CE. Accordingly, and taking into account the climatic variability, the LIA can be divided into an early (ca. 1260-1380), intermediate (ca. 1380-1575) and main phase (ca. 1575-1860 CE).

Compared to the preceding period of the Medieval Climate Anomaly, reconstructions demonstrate increased climatic variability for the LIA, marked by repeated and pronounced cooling phases that finally triggered the glacier advances. These climatic disturbances correlate remarkably directly with significant volcanic eruptions or phases of increased volcanic activity and, albeit less clearly, with periods of reduced solar insolation, which can be derived from reduced solar activity. Distinctive and historically documented glacier advance phases are often correlated with climatic disturbances following major volcanic eruptions, e.g., the advance period around 1820 CE is following the preceding volcanic events of 1809 and 1815 CE.

Today, the LIA is not only the coolest multi-centennial period of the last 10,000 years but also the reference period for assessing the changes from a system of climate and glacier variability largely determined by natural factors to an environmental system clearly shaped by human activities.

How to cite: Nicolussi, K.: Glacier variability in the Alps during the Little Ice Age - overview on course, evidences and causes, EGU General Assembly 2024, Vienna, Austria, 14–19 Apr 2024, EGU24-4392, https://doi.org/10.5194/egusphere-egu24-4392, 2024.

Interdisciplinary approaches are needed to reconstruct the behaviour of glaciers beyond the beginning of systematic, direct measurements. Particularly for the period of the Little Ice Age (LIA), historical documents have been very valuable to successfully reconstruct former glacier extents at different sites. An analysis of historical documents on the well-documented Mont Blanc region, for example, provides unique insights into the LIA glacier development.

The Mont Blanc area became popular with artists, scientists, and travellers in the mid-18th century, including Jean-Antoine Linck from Geneva, who is probably the artist to whom we owe the greatest number of unique glacier views. Jean-Antoine Linck was particularly interested in the icy regions, which he discovered and drew with alpinistic daring and naturalistic accuracy, preferably in gouache, although many pencil sketches have also been preserved. From a glacier history perspective, Linck's work is indispensable, even if many of his artworks are not precisely dated by the author: It represents the whole development of the Mont Blanc glaciers, specifically the Mer de Glace and Glacier des Bossons, but also other glaciers during the period from the end of the 18th century until the 19th century glacier maximum around 1820. As an amazing novelty, Linck was probably the first observer to show a glacier advance with the help of two realistic and accurate views from the same position; one as the Glacier des Bossons retreats and the other as it advances. In addition, various views by Linck make it possible to quantify smaller glacier extents, e.g. around 1800 at the Glacier des Bois (Mer de Glace), which were depicted much more rarely.

To distribute his work, Linck subtly used the etching technique to create easily reproducible plates in large format, which are then hand-coloured with gouache and watercolour. This technique allowed him to create numerous reproductions of the same view, while still giving them a unique and original aspect, views that are remarkable for their serenity and silence, while offering luminous atmospheres. These illustrations introduced the realistic representation of the high mountains into the iconography of Genevese painting and thus led to a new kind of landscape painting with a permanent character.

In terms of glacier history, the work of Jean-Antoine Linck has the same significance for the Mont Blanc area as that of Caspar Wolf and Samuel Birmann for the central Swiss Alps or that of Thomas Ender for the Austrian Alps in terms of glacier iconography. Linck was therefore both an artist and a glacier historian.

How to cite: Nussbaumer, S. U. and Zumbühl, H. J.: The glacier views of Jean-Antoine Linck - a milestone for the Mont Blanc glacier history from the 18th to the 19th century, EGU General Assembly 2024, Vienna, Austria, 14–19 Apr 2024, EGU24-5311, https://doi.org/10.5194/egusphere-egu24-5311, 2024.

High Mountain Asia (HMA) contains the largest glacier inventory outside the polar regions and the melting of these glaciers provides an important freshwater supply for over 250 million people in south, central, and east Asia. Recent studies have quantified glacier changes over the past decades in this area mainly based on the interpretation of satellite imagery, while few studies have investigated the longer-term (centennial-scale) glacier changes due to the lack of mapped outlines and reliable methods to reconstruct the three-dimensional surfaces and volumes of past glaciers. We compiled a dataset of >15,000 mapped glacier outlines during the Little Ice Age (LIA) in the Himalayas, Gangdise, Tanggula, and Tian Shan and reconstructed the ice thickness and volumes of LIA glaciers and their corresponding contemporary glaciers based on a flowline-based GIS model, PalaeoIce. Initial results of 640 LIA glaciers and their corresponding 1466 contemporary glaciers from Tian Shan indicate a total of 47.6% loss of ice volumes since the LIA and the ice volume loss are negatively correlated with glacier area and equilibrium line altitude. This presentation reports the reconstruction of >15,000 LIA glaciers and their corresponding >20,000 contemporary glaciers in the four mountain ranges (Himalayas, Gangdise, Tanggula, and Tian Shan) to examine the spatial pattern of LIA glacier changes and their influencing factors (climate, topography, and debris cover). This work provides important insights into the impacts of glacier changes on water resources in High Mountain Asia in the past 300-500 years.

How to cite: Li, Y.: Patterns and influencing factors of glacier changes in High Mountain Asia since the Little Ice Age, EGU General Assembly 2024, Vienna, Austria, 14–19 Apr 2024, EGU24-6015, https://doi.org/10.5194/egusphere-egu24-6015, 2024.

Extensive databases of satellite imagery are now available and can be used to undertake assessments of the mass balance of glaciers. Previous studies have mapped the end-of-season snowlines (ESS) on glaciers from satellite imagery to find their snowline altitudes (SLA) and used these as proxies for the glacier equilibrium-line altitudes (ELA). This approach is advantageous because it can be implemented at scale and may employ automated methods. The veracity of using remotely measured SLAs as a proxy for in-situ measured ELAs however, has not yet been robustly demonstrated.

This project is undertaking a systematic mapping of ESSs on glaciers with existing measured mass balance records to determine the errors associated with remotely measured SLAs. Glaciers are selected from the World Glacier Monitoring Service (WGMS) Fluctuations of Glacier (FoG) database. For each ELA record, we identify the Landsat image closest in date to the original ELA measurement (where cloud cover is minimal) and the image with the highest altitude snowline for the year. For each image, the snowline is mapped, and its corresponding SLA is extracted from the ASTER Global Digital Elevation Map (ASTERGDEM). The SLAs vs. ELAs of glaciers covering time series greater than 20 years are presented.

How to cite: Hallford, M.: Testing the veracity of satellite-derived end-of-season snowline altitudes as a proxy for the glacier ELA., EGU General Assembly 2024, Vienna, Austria, 14–19 Apr 2024, EGU24-6439, https://doi.org/10.5194/egusphere-egu24-6439, 2024.

EGU24-7010 | Orals | CR5.2

Progress on third glacier inventory of Xinjiang Uygur Autonomous Region (XUAR), northwestern China 

Zhongqin Li, Feiteng Wang, Puyu Wang, and Zexin Zhan

There are nearly half of the glaciers in China distributed in the Xinjiang Uygur Autonomous Region (XUAR) in northwestern China, where the largest glacierized centers outside polar region are nourished by the highest mountain ranges on earth such as Karakoram, western Kunlun mountains, eastern Pamir and Tianshan etc. Glaciers are water tower in this vast arid land in northwestern China. Up-to-date glacier inventory is highly demanded. Based on the latest glacier inventory compilation techniques including those for the first and second Chinese glacier inventories, we currently compiled the third glacier inventory of XUAR, named as Chinese Glacier Inventory of Xinjiang 2020 (CGI-X2020). Comparing to the second Chinese glacier inventory (CGI-2), three improvement has been made in the CGI-X2020. Firstly, CGI-X2020 is based on a total of 235 scenes Chinese satellite imageries were selected out of 30,000 :ZY1 (5); ZY3 (59);  GF1 (135); GF2 (1) ; GF7 (2) and GF6 (33) during the period 2018-2021, mainly during 2020 summer, having a resolution better the 2 m, whereas CGI-2 was based on Landsat TM/ETM+ imageries acquired during 2006–09 with a resolution of 30 m. Secondly, the glacier volume (an important parameter of the glacier inventory) was computed by scaling method which was validated by 22 in-suit glacier thickness measurements through GPR cross glacierized region in XUAR by our research team. Thirdly, the debris coverage of the glaciers were better identified on the basis of high-resolution imageries.

According to GIX2020, by 2020, there are 24,448 glaciers in XUAR, covering an area of 23,531.65 km2 with a total volume about 1548.80 km; There are 20,586 glaciers with an area smaller than 1km2, but the area and volume occupy only 19.16% and 7.95%. Glacier volume in Tarim basin accounts for 64.72% of that in total river systems; The glacier volume is distributed in Kunlun Mountains, followed by Tien Shan and Karakoram Mountains, respectively; 30.68% and 23.92% of the total glacier volume are distributed in Kashgar and Hotian region, respectively.

How to cite: Li, Z., Wang, F., Wang, P., and Zhan, Z.: Progress on third glacier inventory of Xinjiang Uygur Autonomous Region (XUAR), northwestern China, EGU General Assembly 2024, Vienna, Austria, 14–19 Apr 2024, EGU24-7010, https://doi.org/10.5194/egusphere-egu24-7010, 2024.

EGU24-8967 | ECS | Posters on site | CR5.2

Quantifying the morphological evolution and interaction of ice cliffs and supraglacial stream incision on debris-covered glaciers using high-resolution terrestrial lidar and UAV methods 

Boris Ouvry, Céline Walker, Marin Kneib, Johannes Reinthaler, Francesca Pellicciotti, and Andreas Vieli

Ice cliffs are known to enhance ablation on debris-covered glaciers and surface ablation. The upstream part of debris-covered glacier tongues is often characterised by downstream-widening supraglacial valleys with hummocky topography, arch-shaped ice cliffs alongside incised and meandering supraglacial channels. The incision of supraglacial channels has been suggested as a potentially important process for the formation of ice cliffs; however, the interactions between channel undercutting and ice-cliff formation are poorly understood and remain to be quantified. In particular, the stream undercutting cannot be observed from nadir-based satellite or UAV methods.

In this study, we therefore use a more local approach to investigate these interactions by applying high-resolution terrestrial remote-sensing methods at the example of two debris-covered glaciers: Satopanth Glacier, located in the Indian Himalayas, and Zmutt Glacier in the European Alps. We combined (i) high-density point cloud data from a terrestrial laser scanner, (ii) drone imagery, (iii) time-lapse imagery, and in situ stake measurements of the channel overhangs and the debris and ice-cliff surfaces at daily and fortnightly intervals during the melting season. By differencing the point clouds and DEMs using a Lagragian reference system, we are able to calculate channel incision and melt rates alongside ice-cliff backwasting rates. We further constrain the evolution of these surfaces with the stake measurements and continuous time-lapse imagery of 30 (Zmutt) and 5 (Satopanth) minute intervals.

Our results show that our approach, particularly the acquisition of point cloud data using terrestrial laser-scanning, offers promising perspectives for analysing channel incision and related ice-cliff backwasting. The dominating processes observed for the evolution of the surface morphology are the backwasting of the exposed ice cliff, the erosion of the stream in the undercut below, and the ablation of the debris-covered surface, which are exposed to a range of external factors (e.g., meltwater flow, air temperature, solar radiation, deposition, and debris thickness). We find that the sideway component of the channel incision usually exceeds the downward component and creates, depending on the size of the stream, undercuts of several 10s of cm (Zmutt) to several meters (Satopanth) in width. The related horizontal undercutting rates are generally comparable or more significant than ice-cliff backwasting and sub-debris ablation. However, we note that the incision and ice cliff morphology varies according to their location and orientation along the meandering meltwater stream. For deeply undercut ice overhangs, we are able to detect downward deformation that occasionally leads to a collapse of the ice cliff above and may thereby indirectly further enhance ice cliff backwasting. 

Our results imply that stream incision is the driving process of undercutting and maintaining the ice cliffs, hence a crucial process for their formation and evolution. The integrated use of high-resolution field-based remote-sensing methods thereby contributed successfully towards a better understanding of the morphological evolution of surfaces with relatively thin debris and the related characteristic supraglacial valleys.

How to cite: Ouvry, B., Walker, C., Kneib, M., Reinthaler, J., Pellicciotti, F., and Vieli, A.: Quantifying the morphological evolution and interaction of ice cliffs and supraglacial stream incision on debris-covered glaciers using high-resolution terrestrial lidar and UAV methods, EGU General Assembly 2024, Vienna, Austria, 14–19 Apr 2024, EGU24-8967, https://doi.org/10.5194/egusphere-egu24-8967, 2024.

EGU24-9700 | ECS | Posters on site | CR5.2

Tapping the potential of multi-temporal thermal infrared UAV over a debris-covered glacier  

Gabriele Bramati, Florian Hardmeier, Jennifer Susan Adams, Andreas Vieli, and Kathrin Naegeli

Understanding the role and dynamics of debris covering alpine glaciers is complex and multi-faceted. A thin or non-continuous layer (smaller than 2cm) promotes melting, whereas a thicker layer insulates the underlying ice. The response of debris-covered glaciers to climate change is not uniform worldwide. These glaciers not only react to the changing climate, but they are also sensitive to debris-cover evolution. To date, studies analysed limited spatio-temporal data and thus do not describe multi-temporal changes in debris cover thickness. However, these strongly impact long-term glacier evolution as topography changes can lead to ice cliff formation, which is known to considerably speed up glacier melt. Multi-temporal high-resolution remote sensing offers the possibility to fill this gap and monitor changes at a small scale. In this contribution, we apply multi-temporal close-range remote sensing to a debris-covered glacier in the Swiss Alps (Zmuttgletscher, Valais, CH). We make use of Unmanned Aerial Vehicle (UAV) surveys equipped with a dual optical-thermal camera together with manual debris excavations and in-situ meteorological data in different years (2020 and 2023). The thermal surveys are calibrated using supraglacial and proglacial lake water temperatures, combined with debris surface temperature measurements. We explore the debris thickness, morphology, and topography evolution of a portion of the glacier, and discuss it in relation to glacier dynamics and debris transport. The work contributes to the understanding of glacier debris evolution, which is often neglected in debris-covered glacier models and global projections.

How to cite: Bramati, G., Hardmeier, F., Adams, J. S., Vieli, A., and Naegeli, K.: Tapping the potential of multi-temporal thermal infrared UAV over a debris-covered glacier , EGU General Assembly 2024, Vienna, Austria, 14–19 Apr 2024, EGU24-9700, https://doi.org/10.5194/egusphere-egu24-9700, 2024.

Direct glaciological measurements are an important dataset of glacier mass balances but remain concentrated on a small number of glaciers. On hydrological years 2019/20 and 2020/21, 318 annual mass-balance observations were compiled based on 169 glaciers worldwide (Zemp et al., 2023). On the other hand, the current climate crisis now requires a description of cryosphere evolution at a larger scale by quantifying annual snow and ice losses on a larger number of glaciers.

A relevant attempt to fill this gap has been provided by Huggonet et al. (2021) where a global dataset of mass balances at a glacier scale have been generated from 2000 to 2020. While being an extremely valuable glacier mass balance dataset, it is limited to provide mass balance estimation with a time scale longer than 5 years, i.e. annual mass balances cannot be considered reliable.

On the other side, the equilibrium line altitude (ELA) method (Rabatel et al., 2016) have been proven to be an effective approach to reconstruct annual glacier mass balance time series as soon as annual estimation of ELA from satellite multispectral images (e.g. Landsat, Sentinel-2) and at least two digital terrain models (DTMs) acquired at different years are available. Typically, highly accurate DTMs (e.g. airborne LiDAR or photogrammetric DTMs), which are only available on a regional scale base, have been employed within the ELA method.

The main objective of this work is to test the ELA method using as input: 1) Landsat and Sentinel-2 estimation of ELA and 2) ASTER DTMs (Hugonnet et al., 2021). In this way, annual mass balances can be retrieved using satellite data only.

We initially tested this approach over the glaciers in Trentino and South Tyrol where seven glaciers have been monitored through glaciological measurements and different airborne DTMs have been acquired during the last 20 years. Our results show that the use of the ELA method with high resolution airborne DTMs can produce mass balance estimations characterized by an error around 0.3 m w.e. with respect to ground measurements. This error value is in line with estimations conducted with the same method in other regions (e.g. Rabatel et al., 2016) and it is in the error range of ground based measurements. The use of ASTER-based 5 years DTM differences as input of the ELA method can produce estimations with a similar error range. Therefore, the combination of ASTER DTM and ELA extracted from Landsat or Sentinel-2 images may be an interesting approach to produce accurate annual mass balance estimations for many glaciers in the world.


References :

Hugonnet, R. et al. (2021). Accelerated global glacier mass loss in the early twenty-first century. Nature 592, 726–731

Rabatel, A. et al. (2016). Spatio-temporal changes in glacier-wide mass balance quantified by optical remote sensing on 30 glaciers in the French Alps for the period 1983–2014. Journal of Glaciology62(236), 1153-1166.

Zemp, M. et al. (2023). Global Glacier Change Bulletin No. 5 (2020-2021). WGMS.

How to cite: Casarotto, C. and Callegari, M.: Annual glacier mass balance estimation through ASTER DTMs and snowlines extracted from Landsat and Sentinel-2 images, EGU General Assembly 2024, Vienna, Austria, 14–19 Apr 2024, EGU24-9745, https://doi.org/10.5194/egusphere-egu24-9745, 2024.

EGU24-10176 | ECS | Orals | CR5.2

Glacier Monitoring Using GEDI Data in Google Earth Engine: Outlier Removal and Accuracy Assessment 

Alireza Hamoudzadeh, Roberta Ravanelli, and Mattia Crespi

Climate change has notably altered the elevation of mountain glaciers, particularly in alpine regions. Alpine glaciers play a pivotal role not only as indicators of climate change but also as crucial elements for human and wildlife well-being, regulating freshwater supply and providing vital habitats in Europe. Consequently, continuous monitoring of these glaciers offers valuable insights into their changing structure and surface dynamics [1].


While Unmanned Aerial Vehicles (UAV) offer the most precise method for tracking glacier surface changes, their practicality is often hindered by cost limitations and challenging in-situ measurements in extreme weather or remote areas. Therefore, remote sensing and satellite altimetry emerge as a feasible alternative in such scenarios.


Numerous LiDAR and RADAR altimetry sensors, such as Jason-2 and 3, CryoSat, and ICESat-1 and 2, have been employed. However, the Global Ecosystem Dynamics Investigation (GEDI), a reliable source of altimetry data, has been overlooked due to its restricted latitude range of 51.6 and -51.6 [2]. GEDI has proven its efficacy in measuring forest and canopy top height, monitoring lakes and water resources and generating Digital Surface Models (DSM).


Google Earth Engine (GEE), a cloud-based platform renowned for its ability to integrate diverse datasets and potent analytical tools, has recently incorporated GEDI into its extensive repository [3].

Our initial analysis aims to assess the accuracy of GEDI data for glacier monitoring. Firstly, we focus on detecting and eliminating outliers. Secondly, we compare the glacier levels obtained from GEDI with reference ground truth. Thus, we've chosen the Rutor and Belvedere glaciers in Northern Italy, where we have access to reference-level measurements from UAV DEMs.


The proposed outlier detection consists of two steps for each GEDI passage over the glacier surface.
The first step relies on quality surface flags available within GEDI bands, In the subsequent phase, the outlier removal process was refined by employing the x-means algorithm, an unsupervised classifier available within GEE. This approach facilitated the identification and elimination of outliers within the GEDI data set, contributing to refining the dataset's accuracy for comparative analysis with the reference ground truth.

After the above-mentioned outlier removals, we obtained a median difference of -0.27m and NMAD of 4.9 m for Rutor Glacier in 2021 from more than 500 footprints, whereas for Belvedere a median difference of -0.43 and NMAD of 3.7m were obtained. These underestimated values might be due to the nearly 2-month difference between the DEM and the GEDI acquisitions.


[1] Belloni, V., et al. (2023). High-resolution high-accuracy orthophoto map and digital surface model of Forni Glacier tongue (Central Italian Alps) from UAV photogrammetry. Journal of Maps, 19(1), 2217508.

[2] Hamoudzadeh, A., et al.: Gedi Data Within Google Earth Engine: Potentials And Analysis For Inland Surface Water Monitoring, EGU General Assembly 2023, Vienna, Austria, EGU23-15083


[3] Hamoudzadeh, A., et al. (2023). GEDI data within google earth engine: preliminary analysis of a resource for inland surface water monitoring. In The International Archives of the Photogrammetry, Remote Sensing and Spatial Information Sciences.

How to cite: Hamoudzadeh, A., Ravanelli, R., and Crespi, M.: Glacier Monitoring Using GEDI Data in Google Earth Engine: Outlier Removal and Accuracy Assessment, EGU General Assembly 2024, Vienna, Austria, 14–19 Apr 2024, EGU24-10176, https://doi.org/10.5194/egusphere-egu24-10176, 2024.

EGU24-10439 | Posters on site | CR5.2

The Laki Eruption – studying Weather and Climate during the Little Ice Age with Paleo-Reanalysis 

Jörg Franke, Andrew Friedman, Noemi Imfeld, and Stefan Brönnimann

The assimilation of early instrumental, documentary, and proxy data into model simulations allows the study of multivariate climate variability from monthly to centennial time scales. The strength of our paleo-reanalysis ModE-RA (Modern Era Reanalysis) lies specifically in the period of the Little Ice Age because the number of assimilated values per year increases from hundreds in the 17th century to thousands in the 18th century to tens of thousands in the 19th century. In addition, recent efforts of weather reconstruction based on early instrumental data even allow for European reconstructions at daily time scales back into the 18th century.

Here, we present a case study of the global climate and European weather anomalies following the Laki eruption in 1783. Most reports have been limited to the European domain and described an unexpectedly warm summer of 1783 and extremely cold winters in the three following years. Our weather reconstruction and ModE-RA support recent model simulations which suggested atmospheric blocking to be the cause of the unexpected warm anomalies in Europe. However, the entire summer of 1783 was not hot, but only a relatively short period in June and July. On the northern hemisphere scale, we find an aerosol-induced cooling. African and Indian Monsoon rainfall is reduced due to a weaker land-sea temperature gradient in line with the response to strong tropical eruptions and an interhemispheric temperature contrast in line with the response to strong extratropical eruptions. In contrast to recent simulations of the Laki eruption, ModE-RA shows a clear boreal winter warming at high latitudes, slightly dampening the hemispheric-scale cooling signal. In the future, monthly paleo-reanalysis or even daily weather reconstructions could be used to drive models of Little Ice Age glacier dynamics.

How to cite: Franke, J., Friedman, A., Imfeld, N., and Brönnimann, S.: The Laki Eruption – studying Weather and Climate during the Little Ice Age with Paleo-Reanalysis, EGU General Assembly 2024, Vienna, Austria, 14–19 Apr 2024, EGU24-10439, https://doi.org/10.5194/egusphere-egu24-10439, 2024.

EGU24-11248 | ECS | Orals | CR5.2

A new inventory of High Mountain Asia surging glaciers derived from multiple elevation datasets since the 1970s 

Lei Guo, Jia Li, Amaury Dehecq, Zhiwei Li, Xin Li, and Jianjun Zhu

Glacier surging is an unusual instability of ice flow, and inventories of surging glaciers are important for regional glacier mass balance studies and glacier dynamic studies. Glacier surges in High Mountain Asia (HMA) have been widely reported. However, the completeness of available inventories of HMA surging glaciers is hampered by the insufficient spatial and temporal coverage of glacier change observations or by the limitations of the identification methods. In this project, we established a new inventory of HMA surging glaciers based on glacier surface elevation changes and morphological changes over four decades. Three elevation change observations based on four elevation sources (the KH-9 DEM, NASA DEM, COP30 DEM, and HMA DEM), three publicly released datasets, and long-term Landsat satellite image series were utilized to assess the presence of typical surging features over two time periods (1970s–2000 and 2000–2020). Through a multi-criteria and cross-validation workflow, all surging glaciers within HMA were identified and indicated with different possibility of surging. Particular efforts were taken to exclude advancing glaciers and separate surging tributaries from glacier complexes. In total, 890 surging and 336 probably or possibly surging glaciers were identified in HMA. Compared to the most recent inventory of surging glaciers in HMA, our inventory incorporated 253 previously unidentified surging glaciers, and most of them are quite small glaciers due to the more complete coverage. The number and area of surging glaciers accounted for ∼ 2.49 % (excluding glaciers smaller than 0.4 km2) and ∼ 16.59 % of the total glacier number and glacier area in HMA, respectively. Glacier surges were found in 21 of the 22 subregions of HMA (except for the Dzhungarsky Alatau); however, the density of surging glaciers is highly uneven. Glacier surges occur frequently in the northwestern subregions (e.g., Pamir and Karakoram) but less often in the peripheral subregions. The inventory further shows that surge activity is more likely to occur for glaciers with a larger area, longer length, and wider elevation range. Among glaciers with similar areas, the surging ones usually have steeper slopes than non-surging ones. Finally, we leverage 50 years of multi-temporal glacier mass balance observations to investigate the relationship between glacier surges and mass balance.

How to cite: Guo, L., Li, J., Dehecq, A., Li, Z., Li, X., and Zhu, J.: A new inventory of High Mountain Asia surging glaciers derived from multiple elevation datasets since the 1970s, EGU General Assembly 2024, Vienna, Austria, 14–19 Apr 2024, EGU24-11248, https://doi.org/10.5194/egusphere-egu24-11248, 2024.

EGU24-12440 | Posters on site | CR5.2

Integration of historical glacier images into the Euro-Climhist database 

Christian Rohr, Samuel U. Nussbaumer, Céline Walker, Corina Haller, Tamara T. Widmer, Matthias Fries, Lukas Würsch, and Heinz Zumbühl

Glaciers are excellent climate indicators, and the worldwide glacier retreat serves as a warning signal for the current climate change with its dramatic effects on humans and the environment. Visualizing glacier change by means of images can reach a broad public. Historical glacier images, especially from the so-called Little Ice Age (LIA, approx. AD 1300 to 1850 in the European Alps), show the earlier glacier fluctuations in a particularly impressive way and give us a unique insight into the climatic events of that time. These findings are in turn the key to understand current and possible future climate changes.

The long-term research project "Euro-Climhist" is one of the first projects of its kind worldwide to extract historical documentary data on climate and weather from a wide variety of source types, evaluate the data accordingly, and make it generally accessible in an online database (https://www.euroclimhist.unibe.ch). Until now, the Euro-Climhist database consisted mainly of written sources and measurement data. Within this project, the Euro-Climhist database was conceptually extended to include and secure glacier images in the long term, and to make them accessible to researchers and to the public. Around 500 glacier images were specially prepared for the database and provided with the corresponding metadata, i.e., the name of the artist, the original descriptions as well as supplementary descriptions from the literature, the dating of the images, and the image type. In particular, the assignment to one of five image types - drawing, oil painting, print, photograph, or map - allows conclusions to be drawn about the accuracy of the glacier extents depicted.

Besides written evidence, historical pictorial representations of glaciers allow us to reconstruct glacier extents in the Alps from the early 17th century onwards. Satisfactory quantities of historical material are only available for those glaciers that achieved the necessary degree of fame early on to attract travellers, scientists, and artists. Pictorial representations in painting and graphic arts date back to the early 17th century, but only appear in large numbers with the emerging popularity of Alpine travel during the 18th century. Photographs are available from the end of the 1840s.

How to cite: Rohr, C., Nussbaumer, S. U., Walker, C., Haller, C., Widmer, T. T., Fries, M., Würsch, L., and Zumbühl, H.: Integration of historical glacier images into the Euro-Climhist database, EGU General Assembly 2024, Vienna, Austria, 14–19 Apr 2024, EGU24-12440, https://doi.org/10.5194/egusphere-egu24-12440, 2024.

Glaciers play a fundamental role in the Earth’s water cycles. They are one of the most important freshwater resources for societies and ecosystems and the recent increase in ice melt contributes directly to the rise of ocean levels. For this reasons, they have been declared as an Essential Climate Variable (ECV) by the Global Climate Observing System (GCOS). Within the Copernicus Climate Change Services (C3S), the global gridded annual glacier mass change dataset provides information on changing glacier resources for the last five decades by combining the glacier outlines from the globally complete Randolph Glacier Inventory with the mass balance and elevation change observations from the Fluctuation of Glaciers database of the World Glacier Monitoring Service (WGMS).

The glacier change product provides a global assessment of annual glacier mass change and related uncertainties (in m w.e. and Gt) and gridded area changes (km2)  since the hydrological year 1975/76 to present, provided in a 0.5°x0.5° (latitude-longitude) global regular grid and in netcdf file format. The new product bridges the gap on spatio-temporal coverage of glacier change observations, providing for the first time in the CDS an annually resolved glacier mass change product using the glacier elevation change sample as calibration. This goal has become feasible at the global scale only recently and thanks to a new globally near-complete (96% of the world’s glaciers) dataset of glacier elevation changes between 2000 and 2020.

The global gridded annual glacier mass change product integrates nicely into the family of the gridded ECV products provided by the C3S CDS. It provides new insights into regional to global glacier mass changes and, hence, has a great potential for contributing to the various state of the climate reports as well as to assessments of the global sea-level budget, the global energy cycle or the global water cycle. Continuation and expansion of the glaciological in-situ observation network is essential for providing the temporal variability of the glacier mass change product. Ensuring the continuation of open source spaceborne datasets with extensive acquisitions tasking planned over glaciated regions is crucial for ensuring the good quality of future glacier products, and one of the greatest gaps in the quality and continuation of the glacier services delivered to C3S.

How to cite: Dussaillant, I., Bannwart, J., Paul, F., and Zemp, M.: Glacier mass change gridded data from 1976 to present derived from the Fluctuations of Glaciers Database - A new product in the Copernicus Service Climate Data Store, EGU General Assembly 2024, Vienna, Austria, 14–19 Apr 2024, EGU24-13856, https://doi.org/10.5194/egusphere-egu24-13856, 2024.

EGU24-14469 | ECS | Posters virtual | CR5.2

Evolution of the covered glaciers in the Cordillera Blanca during the period 1962 - 2020 

Yadira Curo, Juan de Dios Fernandez, Gladis Celmi, Danny Robles, and Mayra Mejia

Glacier dynamics and the effects of climate change accelerate bedrock erosion and instability of the surrounding topography, causing clean glaciers to be gradually covered by debris, particularly in the ablation zones. While the area of glaciers covered worldwide is increasing, there are few studies on this phenomenon in tropical glaciers and its possible significant effects on glacier melt. In this context, this study analyzes the spatio-temporal evolution of the area of glaciers covered by debris in the Cordillera Blanca from 1962 to 2020. 

To achieve this aim, we used data from the Peruvian National Glacier Inventory for 1962 and 2020. We also identify the covered glaciers through the photo-interpretation of geomorphological features, such as the color and texture of the ground surface, the presence of thermokarst zones, and the formation of small lakes/lagoons observed in the satellite images. In addition, we got the topographic features from the ALOS PALSAR digital elevation model.

The outcomes of this investigation reveal an increase in the number and surface area of glaciers covered, from 33 units (15.41 km2) in 1962 to 173 units (23.06 km2) in 2020. This shows an increase of 49.64% from the glacier area covered by debris. The increase in covered glaciers in the Cordillera Blanca could be because many glaciers identified as debris-free in 1962 were partially or totally covered in 2020; 17.13 km2 of the glacier debris-free area was covered by debris during this period. It has been observed that 93% of the area covered by debris is on slopes greater than 8°. Of these, 25% were in the 24° - 33° range, and 23% were on steeper slopes than 33°. The orientation analysis indicates a predominance of surface covered towards the southwest and south.

Likewise, the areas of glacier retreat covered between 1962 and 2020 were analyzed, identifying 9.45 km2 of glacier surface loss. 18% of the loss areas are on slopes steeper than 8º, mainly from 8º to 17º slope, where 28% of the loss area is located. Meanwhile, a clear retreat trend is observed in those areas with a north orientation of 95% and a northeast orientation of 5%.

These findings suggest a possible association between the higher magnitude slope conditions and the formation of covered glaciers, while the orientation influences the retreat of these glaciers.

How to cite: Curo, Y., Fernandez, J. D. D., Celmi, G., Robles, D., and Mejia, M.: Evolution of the covered glaciers in the Cordillera Blanca during the period 1962 - 2020, EGU General Assembly 2024, Vienna, Austria, 14–19 Apr 2024, EGU24-14469, https://doi.org/10.5194/egusphere-egu24-14469, 2024.

This paper presents a dendroglaciological study of Hailuogou Glacier, a maritime glacier in Hengduan Mountains, southwest China. We used tree-ring data collected from the glacier forefield, including buried wood and oldest living trees on moraine ridges, to reconstruct the glacier fluctuations during the past six centuries. The tree-ring data were combined with radiocarbon dating and remote sensing interpretation to determine the ages of moraine ridges and glacial deposits. The results show that Hailuogou Glacier experienced five equilibrium stages since the Little Ice Age, with the most extensive advance around 1760s AD and the most rapid retreat since the 20th century. The glacier fluctuations were compared with temperature and precipitation reconstructions from nearby regions, and the response relationship between the glacier and climate change was discussed. The paper demonstrates the potential of dendroglaciology to provide high-resolution records of maritime glacier history and its link to climate change in the Tibetan Plateau. The paper also contributes to the better understanding of the long-term relationship between the fluctuation of maritime glaciers and climate change, and provides a scientific basis and basic data for the prediction of glacier change under the future climate change scenario.

How to cite: Zhu, H., Xu, P., and Zhu, X.:  Hailuogou Glacier activities during the past six centuries inferred from tree rings and 14C dating, EGU General Assembly 2024, Vienna, Austria, 14–19 Apr 2024, EGU24-15154, https://doi.org/10.5194/egusphere-egu24-15154, 2024.

EGU24-15640 | Posters on site | CR5.2

Establishing glacier proximal meteorological and glacier ablation stations in different climatic zones along the South American Andes. 

Owen King, Tom Matthews, Marcos Andrade, Juan-Luis Garcia, Claudio Bravo, Wouter Buytaert, Juan Marcos Calle, Alejandro Dussaillant, Tamsin Edwards, Iñigo Irarrazaval, Baker Perry, Emily Potter, Laura Ticona, Bethan Davies, and Jeremy Ely

Climate change has had a significant impact on the behaviour of the high mountain cryosphere, with widespread glacier retreat and mass loss now occurring in most of the planet’s glacierised mountain ranges over multi-decadal timescales. If we are to accurately understand the impacts of deglaciation on freshwater availability to communities downstream, robust modelling of future glacier meltwater yield is paramount. Meteorological observations at glacierised elevations are essential to drive simulations of the energy balance at glacier surfaces, and therefore glacier melt, although such records are sparse in most high mountain regions due to the logistical challenges associated with making even short-term measurements. The scarcity of high-altitude meteorological observations has resulted in only limited understanding of factors such as the spatial and temporal variability of temperature lapse rates, precipitation amounts and phase, and the prevalence of conditions suited to sublimation, all of which have an important influence on glacier mass loss rates at high elevation.

Here we summarise the installation of meteorological and glacier ablation stations in different climatic zones of the South American Andes - the Tropical Andes of Peru (Nevado Ausangate basecamp, 4800 m, (13°48'45.96"S, 71°12'53.18"W) and Bolivia (Laguna Glaciar, 5300 m, 15°50'10.59"S, 68°33'11.30"W), the Subtropical Andes (Glaciar Universidad, Chile, 2540 m, 34°43'10.07"S, 70°20'44.98"W) and Patagonian Andes (Lago Tranquillo, Chile, 280 m, 46°35'47.00"S, 72°47'38.91"W) – as part of the NERC-funded Deplete and Retreat Project. Meteorological station records include time series of air temperature and pressure, relative humidity, wind speed and direction, incoming and outgoing short- and longwave radiation, precipitation amount and phase. Coincident glacier ablation is monitored at each site using ‘Smart Stakes’, recording surface elevation change on-glacier. We describe station situation, installation and preliminary measurements, along with aims and objectives of analyses using the meteorological time series.

How to cite: King, O., Matthews, T., Andrade, M., Garcia, J.-L., Bravo, C., Buytaert, W., Calle, J. M., Dussaillant, A., Edwards, T., Irarrazaval, I., Perry, B., Potter, E., Ticona, L., Davies, B., and Ely, J.: Establishing glacier proximal meteorological and glacier ablation stations in different climatic zones along the South American Andes., EGU General Assembly 2024, Vienna, Austria, 14–19 Apr 2024, EGU24-15640, https://doi.org/10.5194/egusphere-egu24-15640, 2024.

EGU24-15934 | Orals | CR5.2 | Highlight

The pulse of the Pamirs: using remote sensing and in situ data to investigate accelerating glacier mass loss in the Pamirs 

Evan Miles, Thomas Shaw, Shaoting Ren, Martina Barandun, Dilara Kim, Haruki Hagiwara, Sultan Belekov, Marlene Kronenberg, Eric Pohl, Joel Fiddes, Achille Jouberton, Stefan Fugger, Tomas Saks, Abdulhamid Kayumov, Martin Hoelzle, and Francesca Pellicciotti

In situ and satellite observations have unambiguously indicated the hastening rate of global glacier decay over the past two decades. In the region affected by the Karakoram Anomaly, however, the near-zero mass change and relatively high uncertainty from satellite observations combine with complex glacier dynamics to make glacier mass balances difficult to interpret, yet very few direct observations are available to confirm glacier mass changes. A pressing question for this region is therefore whether this glacier mass stability has already ended, or how long it will persist. Our observations over the past several years in the Pamir mountains, located on the periphery of this anomalous zone, have highlighted glaciers suffering from small accumulation areas at the end of the balance year, due to a combination of reduced winter snowfall and increased summer melt. In this study, we draw together a variety of field and remote sensing observations to assess the severity of Pamir glacier changes in recent years as compared to the historical baseline.

We first examine historic climatic records and reanalyses from the region to examine the degree to which recent years fit within the observed historic seasonal and annual ranges. We compare the recent period to historic in situ and remote sensing glacier mass balance measurements recorded at Abramov Glacier, the single long-term monitoring reference glacier for the region, and to the historic network of Soviet meteorological measurements. We then consider regional changes to glacier surface albedo and surface temperature over the past 23 years based on satellite measurements. Taken together, these data sources enable us to link direct meteorological and glaciological conditions to broad spatial and temporal patterns of change across the Pamir mountains.

Our results highlight progressively worsening conditions for glaciers since 2000, as indicated by warming air temperatures, decreasing precipitation, and decreasing albedo. 2021 and 2022 were likely the worst two years for glaciers at the regional scale, experiencing the hottest air temperatures and land surface temperatures in the 21st century, but poor conditions also occurred in 2006-2008. Our results highlight that Pamir surface albedos in these years were the lowest of the 21st century, excepting in the East Pamir, which also shows the least negative mass balances and the most moderated climatic changes. 

Satellite albedo and thinning measurements agree with both reanalysis data and in situ measurements at Abramov Glacier that mass losses have accelerated. However, historic glaciological measurements at Abramov and regional meteorological stations both highlight that similar periods in terms of hot air temperatures, low precipitation and rapid glacier mass loss occurred in the 1970s, and likely the 1940s, across much of the Pamirs.  Consequently, although observations and projections suggest trends towards hotter and drier conditions with increased mass loss, it may be too soon to draw the curtains on the 40-year mass stability of the Karakoram Anomaly.

How to cite: Miles, E., Shaw, T., Ren, S., Barandun, M., Kim, D., Hagiwara, H., Belekov, S., Kronenberg, M., Pohl, E., Fiddes, J., Jouberton, A., Fugger, S., Saks, T., Kayumov, A., Hoelzle, M., and Pellicciotti, F.: The pulse of the Pamirs: using remote sensing and in situ data to investigate accelerating glacier mass loss in the Pamirs, EGU General Assembly 2024, Vienna, Austria, 14–19 Apr 2024, EGU24-15934, https://doi.org/10.5194/egusphere-egu24-15934, 2024.

EGU24-19324 | ECS | Posters on site | CR5.2

An improved dataset of ASTER elevation time series in High Mountain Asia to study surge dynamics 

Luc Béraud, Fanny Brun, Amaury Dehecq, Laurane Charrier, and Romain Hugonnet

Some glaciers display flow instabilities, among which surge events particularly stand out. Surges are quasi-periodic flow perturbations with an abnormally fast flow over a few months to years. It can result in surface elevation changes of more than 100 m in a few months.

The estimation of the mass transfer and the flow variation can be inferred from the glacier surface elevation and velocities. It is critical data to better understand the dynamics of a surge. While satellite-based DEMs provide useful information for studying surges, their use in previous studies was generally limited to a few DEM differences extending over periods of several years. To date, very few studies have leveraged the full time series of elevation data available since ~2000 which could help quantify the variations of mass transfer during the very short surge phases.

Here, we exploited the high temporal and spatial coverage of the ASTER optical satellite sensor to compute a dense time series of elevation suited for the study of surges. Our case study area is the Karakoram range, in High Mountain Asia. We used non-filtered ASTER digital elevation models (DEMs) of 100 m resolution from Hugonnet et al. (2021). The time series range from about 2001 to 2019, with a median of 56 observations per on-glacier pixel over the whole period. We developed a specific method for filtering the elevation time series that preserves surge signals, as opposed to the original method that tends to reject this behaviour as outliers. A LOWESS method – locally weighted polynomial regression (Derkacheva et al., 2020; Cleveland, 1979) is at the core of this workflow. Then, we predicted the elevation over a regular temporal and spatial grid from filtered data, with the B-spline method ALPS-REML (Shekhar et al., 2021).

In this presentation, we will present the results of this method applied to more than 1000 DEMs covering the Karakoram region to derive elevation time series at 100 m resolution. The filter and the prediction performances will be discussed. The results will be compared with those of other studies, in terms of surge onset and end dates, location or volume transported. Finally, the  elevation data set will be analysed with regard to velocities extracted from ITS_LIVE (Gardner et al., 2024) to validate the approach and highlight the complementarity of both types of observations.

How to cite: Béraud, L., Brun, F., Dehecq, A., Charrier, L., and Hugonnet, R.: An improved dataset of ASTER elevation time series in High Mountain Asia to study surge dynamics, EGU General Assembly 2024, Vienna, Austria, 14–19 Apr 2024, EGU24-19324, https://doi.org/10.5194/egusphere-egu24-19324, 2024.

Mass loss of snow packs due to recrystallization processes and subsequent vapor fluxes are inherently difficult to measure experimentally. Present numerical advances enable new simulation tools to explore the otherwise invisible mass fluxes due to diffusive and convective water vapor transport. In this study we calculate the effective vapor fluxes as a function of the local mass transfer coefficient, snow depth, and a range of microstructure parameters given by porosity and specific surface area. A set of flow, heat transport and vapor transport equations re developed. Heat transport is characterized by the Rayleigh number while vapor transport depends on the Péclet and Damkhöler numbers. The latter measures the relative importance of vapor transfer to advective fluxes. For low Rayleigh numbers, the system behaves in a purely diffusive manner. however, convective transport mechanisms dominate for high Rayleigh values. Convection is found to enhance vapor transport. This is in agreement with previously unexplained mass losses in field observations. The effect of vapor mass transfer between the solid and gas phase is also analyzed. The results can be used for macroscale snow pack models to predict large scale mass loss due to sublimation for snow covered areas such as Antarctica, Greenland and seasonally covered Tundra.

How to cite: Hidalgo, J. J. and Krol, Q.: Effective vapor transport in snow: The role of convection and the local mass transfer coefficient, EGU General Assembly 2024, Vienna, Austria, 14–19 Apr 2024, EGU24-3827, https://doi.org/10.5194/egusphere-egu24-3827, 2024.

EGU24-6861 | ECS | PICO | CR6.2

Aeolian snow transport induces airborne snow metamorphism with implications for snowpack physical properties 

Sonja Wahl, Benjamin Walter, Franziska Aemisegger, Luca Bianchi, and Michael Lehning

Aeolian transport of snow is a cryospheric process prevalent in all snow-covered areas. It influences the energy and mass balance of these cold regions. Apart from the direct effects during the process, aeolian transport alters the snow’s microstructure, leaving behind a wind-blown snow layer with different snowpack characteristics than before the wind event. For high-resolution climate modeling in snow-covered regions, it is thus important to incorporate the immediate and lasting effects of wind-induced aeolian snow transport for an accurate representation of the energy and mass balances of a snowpack. Apart from mechanical mechanisms such as fragmentation and aggregation of snow crystals, the metamorphic mechanism (sublimation and deposition of water molecules on the suspended snow particles) can alter the microstructure of snow during aeolian transport. It is difficult to predict the relative importance of the two mechanisms for the evolution of the microstructure of wind-blown snow, not least because the process is happening on the micro-scale but is unfolding on large spatial scales on the respective particle trajectories. Thus, it is difficult to observe.
However, metamorphic processes leave a fingerprint on the snow’s composition of stable water isotopes whereas the mechanical mechanisms do not. Hence, monitoring the evolution of the stable water isotope signal of the snow can act as a macro-scale tracer for the metamorphic micro-scale processes. The stable water isotope signal can thus help to differentiate the processes at play during aeolian snow transport.
Here we show through observations of cold laboratory ring-wind tunnel experiments that aeolian transport of snow involves airborne snow metamorphism. We monitored the evolution of the microstructure and the isotopic composition of airborne snow through repeated sampling of snow from the air stream. In a total of 19 experiments we varied the temperature in a range of -20°C to -3°C and the transport times varied between 50 - 180 minutes. We find a rapid exponential decay in specific surface area (SSA) with transport time which reduces the SSA value to 35-70% of its starting value by the end of the experiments. Further, we observe a shift in the particle size distribution towards larger snow particles, both for the most abundant and maximum particle sizes with aeolian transport time. Simultaneously, the water isotope signature shows mainly an enrichment in δ18O and a decrease in d-excess which is a strong indicator for isotopic fractionation and thus evidence for the presence of metamorphic processes. Combining the results, we attribute the change in snow microstructure to airborne snow metamorphism. The unique combination of information on the isotopic composition and microstructure of airborne snow under well-constrained laboratory conditions can be used to develop parameterizations for the incorporation of airborne snow metamorphism in snow-process models.

How to cite: Wahl, S., Walter, B., Aemisegger, F., Bianchi, L., and Lehning, M.: Aeolian snow transport induces airborne snow metamorphism with implications for snowpack physical properties, EGU General Assembly 2024, Vienna, Austria, 14–19 Apr 2024, EGU24-6861, https://doi.org/10.5194/egusphere-egu24-6861, 2024.

EGU24-8976 | ECS | PICO | CR6.2

Spatiotemporal variability of turbulent fluxes over snow in mountain regions  

Rainette Engbers, Sergi González-Herrero, Nander Wever, Franziska Gerber, and Michael Lehning

Turbulent exchange of heat and moisture plays an important role in snow cover dynamics in mountain regions and governs the boundary layer dynamics. While these processes are subject to great spatiotemporal variability, particularly in complex terrain, virtually all measurements of heat, moisture and momentum fluxes are point observations. To quantify the spatial variability, and assess the representativeness of the observations, numerical modelling of the atmosphere and surface is a useful tool. Still, there is substantial uncertainty in the accuracy of how surface models capture this spatial variability, particularly in complex terrain with large spatial variability on small scales. These uncertainties can be partially attributed to (1) the use of Monin-Obukhov similarity theory (MOST) which has limitations in complex terrain due to the role of advection and (2) the errors in representing near-surface atmospheric gradients in the simulations. In this study, we analyse sources of errors in representing energy exchange over snow in mountain regions and look specifically at the spatiotemporal variability during different meteorological events in the region of Davos, Switzerland. To verify common modelling approaches with observations, we use model predictions of turbulent fluxes from CRYOWRF, the atmospheric model WRF coupled to the surface model SNOWPACK. The fluxes at different resolutions are compared to turbulent fluxes measured using the Eddy Covariance method (EC) and calculated with MOST. This model validation is done for different meteorological events representative of the local climate. Preliminary results indicate that the fluxes are highly spatially variable, being an order of magnitude higher on the leeside than on the windward side of a mountain ridge. This indicates that local heat fluxes are not representative of the whole mountain area, which has implications for the calculation of snow melt, sublimation and accumulation across mountainous terrain. The resolution of the model also plays a large role in representing the fluxes as the modelled fluxes differ greatly depending on the resolution. Our results quantify to what extent snow-atmosphere interactions and their spatial variability are correctly represented in state-of-the-art numerical weather and snow models. 


How to cite: Engbers, R., González-Herrero, S., Wever, N., Gerber, F., and Lehning, M.: Spatiotemporal variability of turbulent fluxes over snow in mountain regions , EGU General Assembly 2024, Vienna, Austria, 14–19 Apr 2024, EGU24-8976, https://doi.org/10.5194/egusphere-egu24-8976, 2024.

EGU24-12325 | PICO | CR6.2

A comparison of snow depth scaling patterns from TLS, UAV and Pleiades observations  

Jesús Revuelto, Pablo Mendoza, Cesar Deschamps-Berger, Esteban Alonso-González, Francisco Rojas-Heredia, and Juan Ignacio López-Moreno

Understanding the evolution of snowpack in heterogeneous mountain areas is a highly demanding task and requires the application of suitable observation techniques to retrieve snow properties at distinct spatial scales. In turn, once the reliability of these techniques is established, the comprehension of snowpack scaling properties helps to determine which processes are more relevant on the control of snow distribution and its temporal evolution. Previous studies have reported detailed observational datasets and insights on the main drivers of snowpack distribution through variogram analysis up to 500-800 m, identifying scale break lengths and their anisotropies. Here, we examine scale breaks derived from variogram analysis applied to snow depth observations at the Izas Experimental Catchment (located in Central Spanish Pyrenees) and the surrounding area for the period 2019-2023. To this end, we use data retrieved with three observation techniques: Terrestrial Laser Scanning (TLS-LiDAR, 12 acquisitions), Unmanned Aerial Vehicles (UAV-SfM, 20 acquisitions), and satellite stereo images (4 Pléiades acquisitions), covering different domains around the experimental site. First, we analyze the consistency among the observational techniques, and then we explore possible drivers explaining detected scale breaks through variogram analysis up to 4000 m. Overall, similar results were obtained with the three observational techniques, with a very high temporal consistency for the first detected scale break length and little variations with direction. We also found good agreement between the search distance used to compute the topographic position index (TPI), the first scale break length, and the mean distance between peak snow accumulations, which vary between 15 and 25 m, not only for the entire study domain, but also in manually delineated Hydrological Response Units.

How to cite: Revuelto, J., Mendoza, P., Deschamps-Berger, C., Alonso-González, E., Rojas-Heredia, F., and López-Moreno, J. I.: A comparison of snow depth scaling patterns from TLS, UAV and Pleiades observations , EGU General Assembly 2024, Vienna, Austria, 14–19 Apr 2024, EGU24-12325, https://doi.org/10.5194/egusphere-egu24-12325, 2024.

EGU24-12854 | ECS | PICO | CR6.2

Quantifying the Impact of Dynamic Lapse Regimes on Spatially-Distributed Snow Simulations 

Kristen Whitney, Sujay Kumar, John Bolten, Justin Pflug, Fadji Maina, Christopher Hain, David Mocko, and Melissa Wrzesien

Accurate characterization of surface meteorological distributions over coastal areas and complex terrain, especially the relationship between temperature and altitude, is essential for the accurate simulation of snowpack dynamics. This becomes increasingly difficult at spatial resolutions smaller than common gridded meteorological forcing datasets due to the sparsity of long-term temperature measurements and the influence of local factors like cool air pooling and inversions. Near-surface air temperatures (Ta) are often assumed to decrease with elevation at a constant rate of 6.5oC km-1, which could lead to large model errors in snow evolution and other processes key to snow hydrology, water resource management, and other applications. This study evaluates the impact of local dynamical adjustments to downscaled Ta on snow simulations over two coastal mountainous terrains using the Noah-MultiParameterization (NoahMP) land surface model. Forcings are derived from remote sensing and reanalysis precipitation products and the (Modern-Era Retrospective Analysis for Research and Applications, version 2) MERRA-2 atmospheric products (including Ta) at the downscaled 1-km resolution. Hourly lapse rates at each grid cell are calculated by applying linear regression to Ta and elevation from surrounding grid cells (within one grid lengths in the x or y direction) at the Ta native MERRA-2 resolution and applied to the downscaled 1-km Ta product. We will present the impact on simulated snow water equivalent, snow cover, and snow depth across simulations forced with the downscaled Ta (1) without lapse rate correction, (2) corrected with a constant lapse rate (6.5oC km-1), and (3) corrected with the dynamic hourly lapse rate. Results will be compared against remote sensing-based products.

How to cite: Whitney, K., Kumar, S., Bolten, J., Pflug, J., Maina, F., Hain, C., Mocko, D., and Wrzesien, M.: Quantifying the Impact of Dynamic Lapse Regimes on Spatially-Distributed Snow Simulations, EGU General Assembly 2024, Vienna, Austria, 14–19 Apr 2024, EGU24-12854, https://doi.org/10.5194/egusphere-egu24-12854, 2024.

To maintain computational efficiency and avoid adding too many uncertainties into Land Surface Models (LSMs) with fine-scale parameterization, many efforts have been made to improve sub-grid representations of heterogeneous landscapes. HydroBlocks LSM stands out as a model that employs advanced hierarchical clustering methods, utilizing field-scale satellite-derived data to construct sub-grid tiles or clusters. The Noah-MP land surface model is applied within each tile. Unlike conventional tiling approaches, knowing the spatial location of the clusters provides the opportunity to incorporate the interactions across the distinct clusters. Presently, they interact through the subsurface flow processes. Despite the comprehensiveness of these models, both Noah-MP and HydroBlocks lack consideration for the wind-induced snow transport which plays a pivotal role in snow-related hazards. Other than that, the sublimation and redistribution of wind-blown snow in exposed environments contributes significantly to variations in snow depth. It not only exerts local influence on surface water and energy balance, but also can have expansive impact since the snowmelt is critical for the water availability of downstream basins. To address this limitation, we propose the integration of a blowing snow module into HydroBlocks. This module, inspired by the Prairie Blowing Snow Model, consists of physical-based wind transport and sublimation algorithms. Clusters will be categorized into source and sink regions considering their topography and vegetation. The redistribution of snow mass at every timestep will be calculated based on the wind condition and the adjacent borders between clusters. This research seeks to pave the way for modeling other mass transport processes between tiles which considers the complex interactions within heterogeneous landscapes.

How to cite: Cai, J. and Chaney, N.: Integrating a Blowing Snow Module for Enhanced Representation of Snow Dynamics and Surface in the HydroBlocks modeling framework, EGU General Assembly 2024, Vienna, Austria, 14–19 Apr 2024, EGU24-13274, https://doi.org/10.5194/egusphere-egu24-13274, 2024.

EGU24-15202 | PICO | CR6.2

Wind tunnel experiments to characterize snow densification and SSA reduction caused by aeolian snow transport 

Benjamin Walter, Sonja Wahl, Hagen Weigel, and Henning Löwe

Snow precipitation frequently occurs under moderate to strong wind conditions, resulting in drifting and blowing snow. Processes like particle fragmentation and airborne metamorphism during snow transport result in microstructural modifications of the ultimately deposited snow. Despite the relevance (optically and mechanically) of surface snow for alpine and polar environments, this effect of wind on the snow microstructure remains poorly understood and quantified. Available descriptions of snow densification due to wind are exclusively derived from field measurements where conditions are difficult to control. Information on the effect of wind on the specific surface area (SSA) is basically nonexistent. The goal of this experimental study was to systematically quantify the influence of wind on the surface snow density and SSA for various atmospheric conditions (temperature, wind speed, precipitation intensity), and to identify the relevant processes. 

We conducted experiments in a cold laboratory using a closed-circuit ring wind tunnel with an infinite fetch to investigate wind-induced microstructure modifications under controlled atmospheric, flow and snow conditions. Artificially produced dendritic nature-identical snow was manually poured into the ring wind tunnel for simulating precipitation during the experiments. Airborne snow particles are characterized by high-speed imaging, and deposited snow is characterized by density and SSA measurements resulting in a comprehensive dataset.

            The high-speed images support a snow particle transport scheme in the saltation layer similar to natural conditions. We measured an increase of the densification rate with increasing wind speed which differs from available model parameterizations. The SSA was found to decrease under the influence of wind, while increasing wind velocities intensified the SSA decrease. For higher air temperatures (Ta > -5°C), both the densification and SSA rates significantly differ from the rather constant rates at lower temperatures. We attribute this to the effects of enhanced cohesion or sintering (density) and intensified airborne snow metamorphism (SSA) at higher air temperatures. A sensitivity experiment revealed a strong influence of airborne snow metamorphism on the SSA decrease. Our results provide a first step towards an improved understanding and modeling of the effect of aeolian snow transport on optically and mechanically relevant microstructural properties of surface snow.

How to cite: Walter, B., Wahl, S., Weigel, H., and Löwe, H.: Wind tunnel experiments to characterize snow densification and SSA reduction caused by aeolian snow transport, EGU General Assembly 2024, Vienna, Austria, 14–19 Apr 2024, EGU24-15202, https://doi.org/10.5194/egusphere-egu24-15202, 2024.

The snowpack plays a fundamental role in regulating the global climate thanks to its high albedo and thermal insulation properties, and for many regions of the world it also has very local and important impacts. Indeed, the snow is an important water reservoir, storing the water in solid state during cold months, and releasing it in liquid state during warmer months. But the snow is also the necessary condition for the development of rural places which base their economy on winter sports. However, a certain risk is always associated with snow when it deposits on the ground, since the snow can slide down, creating avalanches which may cause several damages to the local flora, fauna, buildings and infrastructures. Typically, the conditions that allow the occurrence of snow avalanches span from the point scale to the slope scale, and depend on the snowpack properties. Kilometer-resolution numerical models are not able to reproduce the slope-scale variability of the snowpack properties because of the complex interaction between the atmospheric flows and the topography at finer scale. To address this limitation, we apply several algorithms to downscale 1 km horizontal resolution WRF atmospheric simulations to 500 m horizontal resolution in order to force the snow cover model Alpine3D with more representative weather data. Additionally, we train a fully convolutional neural network to downscale 10 km resolution IMERG precipitation data to 1 km horizontal resolution, further downscaled to 500 m. Furthermore, 2m temperature point observations are interpolated at 500 m resolution using geostatistical techniques. Finally, we force Alpine3D with a combination of forecasted and observed data, obtaining improved simulation results compared to using only forecasted weather data. This implies that the use of a combination of simulated and observed weather data is particularly promising for the estimation of the snowpack properties at slope-scale resolution in regions characterized by complex topography, providing more reliable information for risk mitigation, and sustainable development of snow-prone areas.

How to cite: Raparelli, E. and Tuccella, P.: Improving snowpack simulation at slope-scale resolution with machine learning and geostatistical downscaling of observed and forecasted weather data., EGU General Assembly 2024, Vienna, Austria, 14–19 Apr 2024, EGU24-15809, https://doi.org/10.5194/egusphere-egu24-15809, 2024.

Mountain snowpack serves as a vital water source for both high-altitude regions and adjacent lowlands, significantly impacting local economies through its influence on tourism, communication, logistics, and recreational risks. However, mid-elevation snow cover is diminishing due to climate change (IPCC-2021), emerging as a critical concern in water management. Despite its importance, a lack of comprehensive understanding stems from a scarcity of well-distributed mountain snowpack observations and specific simulation tools. This knowledge gap is more pronounced in Mediterranean mountainous regions, where intricate processes of growth and ablation, high spatial variability, and a high inter-annual variability pose obstacles for models. To address these challenges, hyper-high resolution models (<1 km) have been developed, but they often come with significant computational expenses. As an alternative, SnowCast has been introduced, which nests ERA5 atmospheric reanalysis (ECMWF), the Intermediate Atmospheric Research model (ICAR, NCAR), and the Flexible Snow Model (FSM2, University of Edinburgh), incorporating custom parametrizations and high-resolution topographic forcing models. This approach enables highly parallelized computations, enhancing the efficiency of simulating multiple years. This capability allows the application of such resolution for climate studies while managing computational costs effectively. Validation through extensive fieldwork, automated snowpack monitoring, and satellite imagery shows that the model provides a realistic temporal and spatial representation of snow cover. In-depth analysis of model performance will be presented, along with discussions on potential new processes for implementation, exploration of additional validation techniques, and future prospects for coupling with a hydrological model.

How to cite: González Cervera, Á. and Durán, L.: SnowCast: Hyper-high resolution downscaling model. Snowpack simulation in a mountainous region in Central Spain (Peñalara Massif), EGU General Assembly 2024, Vienna, Austria, 14–19 Apr 2024, EGU24-15828, https://doi.org/10.5194/egusphere-egu24-15828, 2024.

EGU24-17057 | PICO | CR6.2

Snow on permafrost: the effect of spatial snow variability on soil temperature in Trail Valley Creek, NWT, Canada 

Inge Grünberg, Daniela Hollenbach Borges, Jennika Hammar, Nick Rutter, Philip Marsh, and Julia Boike

Snow is a potent insulator, influencing the temperature of the active layer and the permafrost in the Arctic region. However, our understanding of spatial patterns of snow properties and their interplay with vegetation remains limited due to scarcity of local and regional snow data. Furthermore, the duration, depth, and physical properties of the Arctic snow cover are changing with rising air temperature and new precipitation patterns. We study the spatial snow distribution and its drivers and consequences around the Trail Valley Creek research catchment in the Northwest Territories, Canada. Our dataset includes a 143 km² snow depth raster captured on April 2, 2023, at a 1-meter spatial resolution, as well as data from 13 spatially distributed loggers measuring air/snow temperature, soil surface temperature, and soil temperature at 8 cm depth from August 27, 2022, to August 9, 2023. Detailed information on vegetation types, structure, and soil properties at all locations is included. Our analysis covers the timing of soil freeze and thaw, snow and soil temperatures, and their correlation with vegetation characteristics, particularly focusing on April snow depth. Our findings underscore the pivotal role of snow in regulating soil temperature, making it a key driver for permafrost protection or thaw. The results reveal significant variability in April snow depth across the 13 study locations, ranging from no snow to 1.7 meters, resulting in winter minimum soil temperatures between -31°C and -4°C. The study confirms that thicker snow cover contributes to warmer soil temperatures. While the soil at 8 cm freezes uniformly in mid-October across all sites, snow patterns lead to high variability in soil thawing dates, which span one month between May 10 and June 08, 2023. Understanding the spatial patterns of snow depth, thermal properties, and timing is crucial for assessing the snow effect on soil temperature. The large range of winter soil temperatures, which we observed, may lead to differences in thaw depth development in the following summer and potentially to talik formation affecting permafrost stability.

How to cite: Grünberg, I., Hollenbach Borges, D., Hammar, J., Rutter, N., Marsh, P., and Boike, J.: Snow on permafrost: the effect of spatial snow variability on soil temperature in Trail Valley Creek, NWT, Canada, EGU General Assembly 2024, Vienna, Austria, 14–19 Apr 2024, EGU24-17057, https://doi.org/10.5194/egusphere-egu24-17057, 2024.

EGU24-19751 | ECS | PICO | CR6.2

A continuum mechanics perspective on the rheology of firn in the context of firn densification 

Timm Schultz, Angelika Humbert, and Ralf Müller

While the complex nonlinear rheology of ice is well known and often discussed, for example in the context of large-scale ice sheet modeling, calving, and isotropy occurring at shear margins, the rheology of firn is often considered to be rather simple. According to Truesdell’s first metaphysical principle, which states that ”all properties of a mixture must be mathematical consequences of properties of the constituents” (Truesdell, C. (1984), Rational Thermodynamics, Springer-Verlag, p. 221), the material behavior of firn should be related to that of ice, since firn is primarily a mixture of ice and air. What distinguishes firn from ice is its microstructure. The field of continuum mechanics provides methods to relate the microstructural properties of a material to its macroscopic material behavior.

Here we review a homogenization method developed for the densification of nonlinear creeping metallic powders and first applied to the simulation of firn densification by Gagliardini and Meyssonnier (1997, Annals of Glaciology, 24, pp. 242–248). The method links the rheology of ice to that of firn by describing firn as a porous medium with an ice matrix. The advantage of this approach is that it is formulated in all three spatial dimensions, allowing the inclusion of horizontal divergence due to ice flow without additional parameterization. A large database of dated firn cores allows the determination of the governing model parameters using an optimization approach. We discuss the results, advantages, and limitations of this approach, as well as validation strategies.

How to cite: Schultz, T., Humbert, A., and Müller, R.: A continuum mechanics perspective on the rheology of firn in the context of firn densification, EGU General Assembly 2024, Vienna, Austria, 14–19 Apr 2024, EGU24-19751, https://doi.org/10.5194/egusphere-egu24-19751, 2024.

EGU24-20320 | PICO | CR6.2

Monitoring snow depth by Integrating in an optimal way citizen science and other techniques 

David Pulido-Velazquez, Antonio Collados_Lara, Pedro Sánchez, Leticia Baena-Ruiz, Eulogio Pardo-Iguzquiza, Carlos Lorenzo-Carnicero, Juan Carlos García-Davalillo, Luis Carcavilla, Steven Fassnatch, Javier Herrero, Jose David Hidalgo, Victor Cruz Gallegos, Juan de Dios Gomez Gomez, Mónica Leonor Meléndez, Nemesio Heredia, Ignacio Lopez-Moreno, Jesús Revuelto, Helen Flynn, Amalia Romero, África de la Hera Portillo, Jorge Jódar, and Elisabeth Diaz-Losada

The snow depth (SD) is an excellent indicator of climate, yet a poorly monitored variable in many mountain ranges. A novel integrated approach is proposed for optimal monitoring of SD dynamics in the 5 National Parks located in Alpine (NPA) zones of Spain (i.e., Sierra Nevada, Guadarrama, Picos de Europa, Ordesa y Monte Perdido, and Aigüestortes i Estany de Sant Maurici). It will leverage the existing infrastructure of snow poles installed by the Snow Monitoring National Program in Spain (ERHIN). This program obtains SD measurements by direct observation from helicopter flights (1-3 per year). This monitoring activity has been drastically reduced in some mountain ranges during the economic crisis. The objective of this current work is to avoiding potential gaps in the valuable long-term SD timeseries of the pole measurements. An innovative Citizen Science Activity (CSA) methodology is being implemented to engage volunteers to collect the maximum number of photos of the snow poles. It is designed as a sports challenge, in which ranking and awards will be given to the most active participants. It aims to enhance the project with a minimum economic cost, and has the additional objective of raising awareness and encouraging responsible visits to these NPA. It has been tested in Sierra Nevada National Park, where we have identified the necessity to combine the information obtained from this CSA with other approaches to maximize the amount of useful information collected, and in order to reduce the uncertainty in snow distribution.

A number of automatic point sensors have been installed to collect additional snow depth data at snow poles with a high number of days with snow, as identified from a historical analyses of snow cover area (SCA). These locations also have higher uncertainty SD measurements, and thus far, there have been less opportunity for the citizen science collection of photos. In order to identify the most relevant snow poles, we have used a regression model that estimates the spatial distribution of snow depth and its uncertainty from snow cover area and snow depth data. since the high cost of this complementary monitoring actions needs to be considered. a multi-sensors experiment is being performed to identify the best cost-benefit automatic sensors (ultrasound sensors, time-lapse cameras, etc). Drone field campaigns will be also performed, together with distributed information from airborne LIDAR and high resolution Pléiades satellite imagery. Such field campaigns there are costly, and thus the CSA has been also extended to the other 4 NPA. We are using a variety of media (e.g., social networks, TV, radio, and newspapers) to disseminate and communicate the CSA activity in order to maximize participation.

Acknowledgements:
This research has been partially supported by the projects: STAGES-IPCC (TED2021-130744B-C21), SIGLO-PRO (PID2021-128021OB-I00), from the Spanish Ministry of Science, Innovation and Universities, SER-PM (2908/22) from the National Park Research Program, RISKYEARTH (Recovery funds), and SIERRA-CC (PID2022-137623OA-I00) funded by MICIU/AEI/10.13039/501100011033 and by FEDER, UE.

How to cite: Pulido-Velazquez, D., Collados_Lara, A., Sánchez, P., Baena-Ruiz, L., Pardo-Iguzquiza, E., Lorenzo-Carnicero, C., García-Davalillo, J. C., Carcavilla, L., Fassnatch, S., Herrero, J., Hidalgo, J. D., Cruz Gallegos, V., Gomez Gomez, J. D. D., Meléndez, M. L., Heredia, N., Lopez-Moreno, I., Revuelto, J., Flynn, H., Romero, A., de la Hera Portillo, Á., Jódar, J., and Diaz-Losada, E.: Monitoring snow depth by Integrating in an optimal way citizen science and other techniques, EGU General Assembly 2024, Vienna, Austria, 14–19 Apr 2024, EGU24-20320, https://doi.org/10.5194/egusphere-egu24-20320, 2024.

EGU24-108 | Orals | NH1.2

Reconstructing Historical Flood Events: A Monte Carlo-Based Uncertainty Approach 

Ramtin Sabeti, Thomas R. Kjeldsen, and Ioanna Stamataki

Reconstructing historical flood events can offer critical insight into past hydrological responses to extreme weather, informing contemporary flood risk management and infrastructure design. This study employs reverse engineering, based on historical data such as recorded rainfall, flood marks, visual records, and eyewitness accounts to reconstruct a flood event. Historical data was collected by the team during a workshop with the local community. The approach involves hydrological (HEC-HMS) and hydraulic (HEC-RAS) models to simulate the flood event. The July 1968 UK storm, remarkable for record rainfall reaching 175 millimetres within 18 hours, caused extensive devastation in south-west England. This study focuses on reconstructing the 1968 flash flood on the River Chew, notably the peak hydrograph in the village of Pensford. A Monte Carlo simulation approach is used in conjunction with the HEC-HMS and HEC-RAS models to produce a range of potential input hydrographs with uncertainty input parameters (primarily event rainfall and Manning’s roughness) that match the historical evidence.  In particular, the Monte Carlo approach is implemented using a series of Python scripts enabling multiple HEC-RAS simulations to be conducted and the results synthesised in the form of an uncertainty analysis of key parameters such as peak flow. 

How to cite: Sabeti, R., R. Kjeldsen, T., and Stamataki, I.: Reconstructing Historical Flood Events: A Monte Carlo-Based Uncertainty Approach, EGU General Assembly 2024, Vienna, Austria, 14–19 Apr 2024, EGU24-108, https://doi.org/10.5194/egusphere-egu24-108, 2024.

EGU24-395 | ECS | Orals | NH1.2

Beyond Extreme Temperature: Spatiotemporal Analysis of Humid Heat Stress  

Jency Maria Sojan and Jayaraman Srinivasan

Extreme humid heat stress presents significant challenges to human health and productivity. Traditional heat action plans formulated to tackle dry heat stress are insufficient to address the complexities associated with humid heat stress. Furthermore, there is limited quantitative evidence on the evolving patterns of humid heat stress under changing climate. This study investigates the spatiotemporal trends of extreme heat stress across the Global South from 1964 to 2023, distinguishing between dry and humid heat, using high-resolution ERA5 reanalysis hourly data and the Heat Index (HI).

Notably, South Asia and the Middle East experience the highest frequency of extremely humid heat stress. Specific regions in peninsular South Asia have extremely humid heat stress hours from May to June due to persistent high humidity levels. In contrast, western regions of South Asia encounter extreme dry heat stress preceding the monsoon season, followed by a transition to humid heat stress immediately after the onset of the monsoon. The temporal analysis reveals a more rapid increase in the occurrence of extremely humid heat stress compared to that of dry heat stress from May to July over the past 60 years. This underscores the evolving nature of heat stress and the intensification of humid conditions compared to dry ones.

In conclusion, this study advocates for a shift from exclusively addressing dry stress to a comprehensive approach that accounts for the diverse impacts of humid heat stress, particularly on vulnerable populations. This understanding is critical for policymakers to formulate adaptive strategies tailored to the changing landscape of extreme heat stress. 

How to cite: Sojan, J. M. and Srinivasan, J.: Beyond Extreme Temperature: Spatiotemporal Analysis of Humid Heat Stress , EGU General Assembly 2024, Vienna, Austria, 14–19 Apr 2024, EGU24-395, https://doi.org/10.5194/egusphere-egu24-395, 2024.

EGU24-737 | ECS | Posters on site | NH1.2

A database for the outer sizes of tropical cyclones over the Middle Americas 

Adolfo Perez Estrada and Christian Domínguez Sarmiento

Tropical cyclones (TCs) pose a constant threat to populations residing within tropical and subtropical regions. The direct impacts of TCs, such as intense surface winds, storm surge, and heavy precipitation near the center, are well known. However, the indirect effects (e.g, disruption of the upper-level mean wind flow resulting in continental convection, and precipitation associated with cloud bands away from the cyclone's center), are often underestimated.

It is crucial to comprehensively characterize the size of TCs, taking into account both direct and indirect effects, as this new size definition  could improve early warning systems. While various studies employ different parameterizations to describe cyclone size, many of them overlook precipitation. To address this gap, the ROCLOUD technique was developed using  a Python-based algorithm. This algorithm utilizes information on the TC’s position, the extent of cloud bands, and the size of the wind field to define an outersize for TCs located over the oceanic basins in the Middle Americas. In addition to ROCLOUD, we also developed a technique that uses the spatial distribution of TC rainfall to define the outer TC size, named as RPB algorithm. This technique  utilizes a threshold of 2.5 mm in the precipitation satellite products for depicting TC rainfall. Our dual approach provides a comprehensive understanding of TC  sizes, considering the presence of rainfall that can lead to disasters.

Our database shows  external sizes and positions of TCs (recorded every 6 hours) over the North Atlantic (NA) and Eastern Pacific (EP) Oceans during the 2000-2020 period. We got 191 and 336 positions  from the NA and EP basins, respectively. Statistical analysis reveals the coverage of oceanic basins and highlights their differences. We conclude that ROCLOUD offers an operational approximation of the external size of TCs, especially in situations where storms pose a threat to continental regions. The study discusses the utility of both versions of ROCLOUD and RPB for  the Tropical Cyclone Early Warning System over Mexico (EWS-TC), shedding light on the impact of TC sizes that can lead to disasters.

How to cite: Perez Estrada, A. and Domínguez Sarmiento, C.: A database for the outer sizes of tropical cyclones over the Middle Americas, EGU General Assembly 2024, Vienna, Austria, 14–19 Apr 2024, EGU24-737, https://doi.org/10.5194/egusphere-egu24-737, 2024.

EGU24-1525 | ECS | Orals | NH1.2

Objective Identification of Tropical Cyclones with Severe Storm Surge Potential for the North-west Pacific 

Xiaoqi Zhang, Gregor C Leckebusch, and Kelvin S Ng

Storm surges caused by tropical cyclones can significantly impact on coastal areas in East Asia, including megacities e.g., in China. To inform effective adaptation and mitigation planning, a robust storm surge hazard assessment is essential. Unfortunately, the real frequency-intensity distribution of relevant storm-surge levels can only be estimated with large uncertainly based on limited historical observations.

This study demonstrates the successful development of a two-step, objective and automated identification and selection approach of storm-surge relevant TCs for large model data sets where no ground truth verification is possible. In our approach, we combine for the first time two established identification and tracking tools originally developed for extra-tropical cyclones and storms and apply these to identify tropical cyclones. In the first step, we adapted the widely used Murray & Simmonds (1991) University of Melbourne tracking scheme (MS-Track) to the specific conditions of TC tracking in the North-west Pacific. In the second step, we apply the windstorm tracking tool WiTRACK to TC-induced severe wind fields to provide and attach the potential storm-surge relevant information in addition to just the core track provided by the MS-Track.

By validating our results with ERA5 reanalysis data and IBTrACS, we show that our method is simple yet has a well comparable performance in detecting and assessing relevant TC events than more complex tracking approaches. Based on this performance this approach is well-designed and specifically intended to specific applications in CAT modelling approaches, e.g. for the creation of physically consistent event sets for storm surges.

How to cite: Zhang, X., Leckebusch, G. C., and Ng, K. S.: Objective Identification of Tropical Cyclones with Severe Storm Surge Potential for the North-west Pacific, EGU General Assembly 2024, Vienna, Austria, 14–19 Apr 2024, EGU24-1525, https://doi.org/10.5194/egusphere-egu24-1525, 2024.

The physical mechanisms underlying extreme precipitation events linked to atmospheric moisture transport (IVT-P) are investigated in this study. It investigates changes in synoptic-scale weather patterns over the Indian subcontinent and identifies regions where IVT influences extreme precipitation. The study discovers a strong relationship between daily IVT and precipitation over the core monsoon region and the complex terrains of the Western Ghats and Himalayas. Event Coincidence Analysis reveals that extreme IVT can be used to forecast extreme precipitation in these regions. The dynamic component of moisture transport has a strong influence on daily and extreme precipitation over complex terrains. In contrast, the thermodynamic component has an influence on precipitation over regions with an abundance of water vapor and weak horizontal winds. The study also identifies synoptic features and moisture transport ahead of IVT-P events and finds intense low-pressure anomalies, the transition from ridge to trough patterns, and intense 700 hPa relative humidity in the specified regions. Overall, the study provides insights into the physical mechanisms underlying IVT-linked extreme precipitation events.

How to cite: Raghuvanshi, A. S. and Agarwal, A.: Deciphering the connections between extreme precipitation events, atmospheric moisture transport, and associated synoptic features over India, EGU General Assembly 2024, Vienna, Austria, 14–19 Apr 2024, EGU24-1625, https://doi.org/10.5194/egusphere-egu24-1625, 2024.

EGU24-1631 | ECS | Orals | NH1.2

Shift of soil moisture-temperature coupling exacerbated 2022 compound hot-dry event in eastern China 

Yueyang Ni, Bo Qiu, Xin Miao, Lingfeng Li, Jiuyi Chen, Xiaohui Tian, Siwen Zhao, and Weidong Guo

Compound hot-dry events (CHDEs) are among the deadliest climate hazards and are occurring with increasing frequency under global warming. The Yangtze River Basin in China experienced a record-breaking CHDE in the summer of 2022, causing severe damage to human societies and ecosystems. Recent studies have emphasized the role of atmospheric circulation anomalies in driving this event. However, the contribution of land–atmosphere feedback to the development of this event remains unclear. Here, we investigated the impacts of soil moisture-temperature coupling on the development of this concurrent heatwave and drought. We showed that large amounts of surface net radiation were partitioned to sensible heat instead of latent heat as the soil moisture-temperature coupling pattern shifted from energy-limited to water-limited under low soil moisture conditions, forming positive land–atmosphere feedback and leading to unprecedented hot extremes in August. The spatial heterogeneity of hot extremes was also largely modulated by the land–atmosphere coupling strength. Furthermore, enhanced land–atmosphere feedback has played an important role in intensifying CHDEs in this traditional humid region. This study improves the understanding of the development of CHDEs from three aspects, including timing, intensity, and spatial distribution, and enables more effective early warning of CHDEs.

How to cite: Ni, Y., Qiu, B., Miao, X., Li, L., Chen, J., Tian, X., Zhao, S., and Guo, W.: Shift of soil moisture-temperature coupling exacerbated 2022 compound hot-dry event in eastern China, EGU General Assembly 2024, Vienna, Austria, 14–19 Apr 2024, EGU24-1631, https://doi.org/10.5194/egusphere-egu24-1631, 2024.

EGU24-2445 | ECS | Posters virtual | NH1.2

A method of dynamic diagnosis for regional drought degree 

Ruxin Zhao, Hongquan Sun, and Lisong Xing

In view of the difficulty in quantifying the severity of regional drought, this study proposes a method that can quantify and dynamically diagnose the severity of regional drought events, and consider the cumulative superposition effect of drought in the process of spatial and temporal development and evolution. Starting from the site drought index, the method firstly establishes a regional drought index to determine whether drought occurs in the study area in the same month; secondly, it constructs a two-dimensional Copula joint probability model by counting the cumulative duration and cumulative severity of droughts; and finally, it uses the percentile method to classify the joint probability of two-dimensional cumulative drought characteristics into four degree levels of regional drought: light, moderate, severe, and extreme. In the study, the SPEI drought index from 1961 to 2022 was used as the basic data, and the drought centers of China, such as North China Plain, Yangtze River Basin, and Yunnan Province, were selected as the case validation zones, and the results showed that this method can effectively identify the historical drought events in the study area and dynamically diagnose the development process of severe and extreme droughts therein. 

How to cite: Zhao, R., Sun, H., and Xing, L.: A method of dynamic diagnosis for regional drought degree, EGU General Assembly 2024, Vienna, Austria, 14–19 Apr 2024, EGU24-2445, https://doi.org/10.5194/egusphere-egu24-2445, 2024.

        Using multi-source global station and grid monitoring data, FY-2H satellite, and ERA5 reanalysis data, the life history and precipitation characteristics of tropical cyclone "Freddy" as well as the causes of heavy precipitation in southern Mozambique were analyzed. The results show that "Freddy" had a lifespan of 35.5 days which made it the longest lived tropical cyclone in the world, as well as the widest latitude-crossing TC in the southern hemisphere. The extreme long life cycle of "Freddy" was related to favorable large-scale circulation conditions. The strong and sustained subtropical high pressure system made "Freddy" moving westward over the Southern Indian Ocean stably, without the opportunity to combine with the mid latitude trough or cold air which may cause the path turning, intensity weakening, or transformation. After the generation of "Freddy", more than 70% of its life time was over the sea, and the surrounding SST was generally abnormally high, which provided favorable conditions for the development or maintenance of TC intensity. Especially, the SST within the Mozambique Strait remained above 28 ℃, providing excellent underlying conditions for the enhancement of TC intensity, allowing "Freddy" to develop and strengthen rapidly twice after experiencing intensity weakening caused by landfall. The combined influence of favorable circulation conditions and warm sea surface temperature led to the extreme long life of "Freddy".

        "Freddy" made three landfall, bringing sustained heavy precipitation and severe floods to countries in Southeastern Africa. Especially in the southern part of Mozambique, precipitation had characteristics such as long duration, concentrated areas, and large accumulated amount. After landing in Mozambique, "Freddy" was located in a saddle field, leading to weakened steering airflow. Combined with high-level divergence and sustained transportation of warm and humid air by low-level jet, the large-scale circulation system provided favorable background conditions for the slow movement and maintenance of tropical cyclone. The development of low-level convergence and vorticity bands in lower troposphere, as well as strong and sustained water vapor transport, led to the persistence of heavy rainfall in Mozambique. The invasion of cold air induced the formation of a pseudo equivalent potential temperature high-gradient zone in southern Mozambique, and the cold air in the middle layer enhanced atmospheric instability, which was conducive to the development of convection. The southern part of Mozambique was continuously affected by several mesoscale convective systems (MCSs), which not only improved precipitation efficiency but also prolonged the duration of precipitation. The evolution of MCSs had obvious diurnal variation characteristics, with its rapid development and maturity stages almost concentrating in the afternoon to the earlier evening of local time. The increase in low-level wind speed promoted the enhancement of both water vapor and energy, and under the above conditions, the convergence of tropical cyclone wind direction and wind speed triggered the generation of MCSs continuously.

How to cite: Yang, S.: Analysis on the Characteristics of Extreme Long Life Cycle Tropical Cyclone "Freddy" and the Causes of Heavy Rainfall, EGU General Assembly 2024, Vienna, Austria, 14–19 Apr 2024, EGU24-2724, https://doi.org/10.5194/egusphere-egu24-2724, 2024.

Extreme temperature changes from one day to another, either associated with warming or cooling, can have a significant impact on health, environment, and society. Previous studies have quantified that such day-to-day temperature (DTDT) variations and extremes are typically more pronounced in mid-and high latitudes compared to tropical zones. However, the underlying physical processes and the relationship between extreme events and large-scale atmospheric circulation remain poorly understood. Here, such processes are investigated for different locations around the globe based on Observation, ERA5 reanalysis data, and Lagrangian backward trajectory calculations. In the extratropics, extreme DTDT changes are generally associated with changes in air mass transport, in particular shifts from warm to cold air advection or vice versa, linked to regionally specific synoptic-scale circulation anomalies (ridge or through patterns). Lagrangian temperature changes in the advected air masses are due to adiabatic warming, which is dominant in the local winter season, and diabatic warming, most importantly in summer. In contrast, for extreme DTDT changes in the tropics, local processes are more important than changes in advection. For instance, the strongest DTDT decreases over central South America in December-February are linked to a transition from mostly cloud-free to cloudy conditions, indicating an important role of radiative heating. The mechanistic insights into extreme DTDT changes obtained in this study can be helpful for improving the prediction of such events and anticipating future changes in their occurrence frequency and intensity.


How to cite: Hamal, K.: Quantification of the Physical Process Leading to Extreme Day-to-Day Temperature Changes, EGU General Assembly 2024, Vienna, Austria, 14–19 Apr 2024, EGU24-3564, https://doi.org/10.5194/egusphere-egu24-3564, 2024.

EGU24-3613 | ECS | Orals | NH1.2

Assessing windstorm hazard emerging from multiple types of storms 

Nasrin Fathollahzadeh Attar, Francesco Marra, and Antonio Canale

In the context of global climate change, windstorms pose significant environmental, ecological, and socioeconomic challenges. Mountainous and forested regions of Europe, including the Veneto region in northern Italy, have been devastated by unprecedented events such as the storms in July 2023 and Vaia in October 2018, raising the question whether such events may occur more frequently in the future. The probability of observing such extremes in present-day climate can be quantified using cumulative distribution functions of annual maxima wind speeds, obtained from extreme value analysis methods. Once these are derived, however, is it near to impossible to project future changes in these distributions as extreme wind speeds are caused by storms driven by diverse synoptic conditions, the characteristics and occurrence frequency of which may change differently in response to climate change.

This study introduces a method to derive cumulative distribution functions of annual maximum wind speeds explicitly considering the intensity and occurrence frequency of multiple types of storms. Independent windstorms are separated and their maximum hourly wind speed is isolated. Storms are then organized into types based on their local wind direction using a clustering technique. We then use a multi-type Simplified Metastatistical Extreme Value distribution (SMEV) to estimate the cumulative distribution function of annual maximum wind speed for the location of interest. The study focuses on mountainous areas, seeking a simpler relation between typical wind directions and synoptic conditions.

A thorough leave-one-out evaluation with benchmark models, including the traditional Generalized Extreme Value distribution (GEV) and a single-type SMEV, is conducted on 22 mountain stations in the Veneto region (northern Italy). We show that, overall, the proposed multi-type method provides estimates of extreme return levels that are comparable with the ones of single-type SMEV and GEV. Our results demonstrate that it is possible to derive cumulative distribution functions of annual maximum wind speeds explicitly considering storms emerging from different marginal processes. This paves the way to the use of projections of large-scale atmospheric dynamics from climate models to improve our prediction of future extreme wind speeds.


Keywords: Windstorm; Extreme events; Wind direction classification; Multiple types; Simplified Metastatistical Extreme Value (SMEV); Mountainous areas.

How to cite: Fathollahzadeh Attar, N., Marra, F., and Canale, A.: Assessing windstorm hazard emerging from multiple types of storms, EGU General Assembly 2024, Vienna, Austria, 14–19 Apr 2024, EGU24-3613, https://doi.org/10.5194/egusphere-egu24-3613, 2024.

EGU24-3992 | Posters on site | NH1.2

Synoptic and Mesoscale Conditions of Deep Moist Convection during the Cold Season in Croatia 

Maja Telišman Prtenjak, Domagoj Dolički, Petra Mikuš Jurković, and Damjan Jelić

In this study, thunderstorm activity during the cold part of the year was analyzed based on Thunderstorm Intensity Index (TSII) data on a pre-defined grid with a resolution of 3 km x 3 km in Croatia. The study covered a five-year period from 2016 to 2020, focusing on the months from October to March. The goal of the research was to conduct a spatial and temporal analysis of thunderstorm activity and determine the synoptic and thermodynamic conditions under which it occurs. The analysis aimed to provide an overview of the fundamental characteristics, thereby improving the understanding of deep moist convection in the cold part of the year, which poses a significant challenge in operational forecasting due to its lower frequency and more difficult intensity assessment. The occurrence of surface frontal disturbances was detected based on surface and upper-level synoptic charts, and the flow regime at the 500 hPa level was determined. Thermodynamic and kinematic parameters were calculated from radiosonde profiles from stations in San Pietro Capofiume, Brindisi, Pratica di Mare, Zagreb, and Zadar, using the thundeR free software package.

        A total of 290 convective days were selected for analysis from the observed period. The results indicate that synoptic forcing plays a significantly greater role in the development of convection during the cold part of the year compared to the warm part, while the dominant upper-level flow regime is southwest. The obtained values of CAPE (Convective Available Potential Energy) in the cold part of the year are much lower than those in the warmer part, with a significant contribution from the considerably lower amount of solar surface heating. Additionally, most thunderstorms developed under conditions of strong vertical wind shear, indicating that the atmospheric environment conducive to winter thunderstorms is predominantly a High Shear-Low CAPE (HSLC) environment.

How to cite: Telišman Prtenjak, M., Dolički, D., Mikuš Jurković, P., and Jelić, D.: Synoptic and Mesoscale Conditions of Deep Moist Convection during the Cold Season in Croatia, EGU General Assembly 2024, Vienna, Austria, 14–19 Apr 2024, EGU24-3992, https://doi.org/10.5194/egusphere-egu24-3992, 2024.

EGU24-4050 | ECS | Posters on site | NH1.2

Compound dry and hot extreme events in the Mediterranean region 

André Correia Lourenço, Ana Russo, Virgílio A. Bento, and João Lucas Geirinhas

Over the last few decades, the frequency, duration, magnitude of heatwaves in Europe have increased considerably, with major natural and socioeconomic impacts (Basarin et al., 2020; K.P. Tripathy et al., 2022). In climate change scenarios, these events are expected to present an increasing trend (Zscheischler et al., 2018) due to variations in dynamic and thermodynamic mechanisms, triggering unusually longer and more intense periods of drought and causing a reduction in agricultural production and the supply of water reservoirs. The Mediterranean region is a climate change hotspot and therefore a region susceptible to the development and intensification of single or compound hot and dry events (Giorgio and Linello, 2008).

This work aims at studying single and compound heatwaves and droughts based on ERA5 and ERA5-Land databases for Southern Europe on a 0.25º x 0.25º and 0.1º x 0.1º spatial resolution, respectively.

The results show positive trends for the duration and intensity of heatwaves and droughts and, conversely, negative trends for soil moisture. Most of the study area shows statistically significant negative trends when aggregating spatially. On the other hand, the annual temperature means tends to migrate towards higher values and precipitation means show a small decrease. Furthermore, the relation between large scale climatic patterns such as the North Atlantic Oscillation (NAO) and compound drought and heatwaves are studied here.

It is expected that compound hot and dry events will have a positive trend in their frequency, duration and intensity, as a consequence of climatic phenomena, such as the synoptic systems, or even due to previous dry characteristics of the soil. Our findings highlight the intricate interplay between different mechanisms in the occurrence of extreme events in Mediterranean Europe, putting into evidence the need for better representation this interplay in climate models.

A.L., A.R., V.B. and J.G. have been supported by the Fundação para a Ciência e a Tecnologia (FCT) I.P./MCTES through national funds (PIDDAC, grant no. UIDB/50019/2020, https://doi.org/10.54499/UIDP/50019/2020, and LA/P/0068/2020, https://doi.org/10.54499/LA/P/0068/2020, to Instituto Dom Luiz; project DHEFEUS, https://doi.org/10.54499/2022.09185.PTDC). J.G. acknowledges Fundação para a Ciência e a Tecnologia (FCT) for the PhD Grant 2020.05198.BD.


References:

Basarin, Biljana, Tin Lukić, and Andreas Matzarakis. 2020. "Review of Biometeorology of Heatwaves and Warm Extremes in Europe" Atmosphere 11, no. 12: 1276. https://doi.org/10.3390/atmos11121276.

Giorgi, F., Lionello, P., 2008. Climate change projections for the Mediterranean region. Global Planet. Change 63 (2), 90–104.

Tripathy, K. P., & Mishra, A. K. (2023). How unusual is the 2022 European compound drought and heatwave event? Geophysical Research Letters, 50, e2023GL105453. https://doi.org/10.1029/2023GL105453.

Zscheischler, J., Westra, S., van den Hurk, B. J. J. M., Seneviratne, S. I., Ward, P. J., Pitman, A., et al. (2018). Future climate risk from compound events. Nat. Clim. Change 8, 469–477. doi: 10.1038/s41558-018-0156-3.

How to cite: Lourenço, A. C., Russo, A., Bento, V. A., and Geirinhas, J. L.: Compound dry and hot extreme events in the Mediterranean region, EGU General Assembly 2024, Vienna, Austria, 14–19 Apr 2024, EGU24-4050, https://doi.org/10.5194/egusphere-egu24-4050, 2024.

Rainfall return levels are guiding hazard protection, insurance models, infrastructure design, construction, and planning of cities. When deriving information about the frequency and intensity of extremes by fitting extreme value models to pointwise observations, the regionalization of these models is challenging. Rain gauges are distributed unevenly, where some regions suffer from data scarcity in space and time. To address this, topographical and/or climatological covariates are often used for the spatial interpolation. On the other hand, high-resolution climate simulations are available to provide spatial information on rainfall extremes. However, these simulations are still governed by model biases, where the bias adjustment of extremes at ungauged locations is also inducing uncertainty.   

In this study, we propose a combination of observations and a high-resolution convection-permitting climate model simulation in the framework of smooth spatial Generalized Extreme Value (GEV) models in order to estimate spatial rainfall return levels. We choose a study area over southern Germany with complex terrain, which is densely monitored with 1132 rain gauges providing more than 30-year daily rainfall observations. There, a 30-year simulation of the Weather and Forecasting Research (WRF) model is available at 1.5 km resolution driven by ERA5 reanalysis data. We combine observations and covariates from the WRF simulation in the spatial GEV and refer to this approach as sGEV-WRF.

We want to answer three research questions to assess the added value of the proposed framework:

  • Is it worth the effort? Does the sGEV-WRF improve the generation of rainfall return levels compared to the WRF alone?
  • Does the WRF simulation as covariate add value? Can the sGEV-WRF outperform a topography-only spatial GEV?
  • Does the dynamical downscaling at high resolution add value? Can sGEV-WRF outperform a spatial GEV based on observations and covariates from the coarser resolution ERA5?

By evaluating the percentage bias, mean absolute error, and root-mean-square error, we show that the combination of observations and WRF can improve the representation of 10-year and 100-year return levels of daily rainfall.

In addition, we aim to assess the performance of this framework under data-scarce conditions. Therefore, we devise an extensive cross-validation study. We select 5%, 10%, 20%, 50%, 80%, 90%, and 95% of all 1132 rain gauges to re-build the spatial GEV models with 1000 random folds each. We show that the performance is robust under these conditions, highlighting the potential for the application in data-scarce regions. Furthermore, in a non-stationary setup with climate model future projections, it can serve as a reliable tool to assess climate change effects on heavy rainfall.     

How to cite: Poschlod, B. and Koh, J.: Combining observations and a high-resolution climate model for the generation of spatial rainfall return levels, EGU General Assembly 2024, Vienna, Austria, 14–19 Apr 2024, EGU24-5310, https://doi.org/10.5194/egusphere-egu24-5310, 2024.

EGU24-5441 | ECS | Orals | NH1.2

Compounding drivers amplify the severity of river floods  

Shijie Jiang, Larisa Tarasova, Guo Yu, and Jakob Zscheischler

Estimating the risk of river flooding under global warming is challenging, mainly due to the compound nature of the various drivers, which is not yet fully understood. Our study aims to quantitatively unravel the complex dynamics of multiple factors that interact and influence river flooding. Using interpretable machine learning techniques, we analyzed thousands of global catchments to identify the role of compounding drivers in river flooding. Our results indicate that these compounding drivers have played a significant role in increasing the magnitude of river floods over the past four decades. In particular, the influence of the interaction effects between these drivers becomes more pronounced with increasing flood magnitude, and the degree is modulated by specific physioclimatic conditions. Importantly, traditional flood analysis will underestimate the magnitude of extreme floods due to insufficient consideration of the varying compounding effects in flood generation. Overall, our results emphasize the need to more carefully incorporate compounding factors to improve extreme flood estimates.

How to cite: Jiang, S., Tarasova, L., Yu, G., and Zscheischler, J.: Compounding drivers amplify the severity of river floods , EGU General Assembly 2024, Vienna, Austria, 14–19 Apr 2024, EGU24-5441, https://doi.org/10.5194/egusphere-egu24-5441, 2024.

EGU24-5446 | ECS | Posters on site | NH1.2

Enhancing flood forecasting and prevention: The multidisciplinary approach of Flood2Now project and its innovative solutions 

Carlo Guzzon, Raül Marcos, Maria Carmen Llasat, Montserrat Llasat-Botija, Dimitri Marinelli, Albert Diaz Guilera, Luis Mediero, Luis Garrote, Alicia Cabañas Ibañez, Javier Arbaizar Gonzalez, and Olga Varela

Spain and the Mediterranean coast are largely affected by flash floods, which are generated by intense, localized storms within smaller basins, typically less than 100 km2 (Gaume et al., 2016). Predicting these events remains challenging as they are frequently triggered by convective systems operating at scales below the resolution of conventional meteorological models. In Spain, floods are the country's primary recurring natural disaster, accounting for nearly 70% of the compensation amount issued by the Consorcio de Compensación de Seguros (CCS, 2011). 

In this hydrogeological risk context, the ultimate goal of the Flood2Now project is to support the population and mitigate the risk associated with this natural hazard, through the implementation of an automatic real-time warning system in two basins (Francolí and Arga) located in the north-east part of the Iberian peninsula. Multidisciplinarity plays a pivotal role in defining this system, integrating various disciplines and information sources, ranging from complex systems physics and hydrometeorological data to citizen science and socio-economic statistics.

Flood2Now embodies a collaborative effort between universities, companies, and social foundations, to explore the following technical aspects: (i) establishing a comprehensive digital database spanning four decades of flood occurrences; (ii) exploring complex systems methodologies to discern interrelationships among various factors influencing flood impacts; (iii) studying weather patterns associated with diverse flood events, accounting for their impact; (iv) implementing analogous methodologies to enhance flood risk forecasting; and (v) integrating this knowledge to enhance operational systems aiding flood-related decision-making.

This research extends its impact on society by implementing citizen science methodologies to gather supplementary data for flood risk management, enhancing early warning systems' precision, and raising community awareness of flood risks and climate change. Innovative approaches include integrating historical and citizen-collected data into decision-making, employing ensemble prediction systems, and implementing advanced hydrological modeling techniques for streamflow prediction and decision support.

This contribution shows the selected basins and case studies, the proposed applied hydrometeorological chain to forecast flash flood impacts, and the improvements that citizen science can provide, on the one hand, in obtaining flow data and the state of rivers, especially in ungauged basins, and, on the other, in increasing risk awareness.

This research has been done in the framework of the Flood2Now project, Grant PLEC2022-009403 funded by MCIN/AEI/10.13039/501100011033 and by the European UnionNextGenerationEU/PRTR. 


References:

Gaume, E., Llasat M.C., et al., 2016. Mediterranean extreme floods and flash floods. Into Hydro-meteorological extremes, chapter 3, The Mediterranean Region under Climate Change. A Scientific Update (coordinated byAllEnvi).133-144. ISBN : 978-2-7099-2219-7.

CCS, 2021, Estadística riesgos extraordinarios. Serie 1971-2020. Available at: https://www.consorseguros.es/web/documents/1018/4419/Estadistica_Riesgos_Extraordinarios_1971_2014/14ca6778-2081-4060-a86d-728d9a17c522


How to cite: Guzzon, C., Marcos, R., Llasat, M. C., Llasat-Botija, M., Marinelli, D., Diaz Guilera, A., Mediero, L., Garrote, L., Cabañas Ibañez, A., Arbaizar Gonzalez, J., and Varela, O.: Enhancing flood forecasting and prevention: The multidisciplinary approach of Flood2Now project and its innovative solutions, EGU General Assembly 2024, Vienna, Austria, 14–19 Apr 2024, EGU24-5446, https://doi.org/10.5194/egusphere-egu24-5446, 2024.

Hail is by far the greatest contributor worldwide to insured losses from severe convective storms on an annual basis. Individual outbreaks can cause losses well above EUR 1 bn. In Italy, severe convective storm losses have been dominating the market in the last 5-7 years, with a record of EUR 1.4 bn in 2019 prior to year 2023. On 18-25 July 2023 an unprecedented outbreak brought large hail and strong winds to Lombardy, Veneto, Friuli-Venezia Giulia, Piedmont and Emilia-Romagna, with affected cities including Parma, Turin, Milan and Venice. There were many reports of large hailstones, causing significant damage to property and motor vehicle. The European hail record was breached too. Twice. On 19 July, a hailstone measuring 16 cm in diameter was recorded in Carmignano di Brenta, and broke the previous largest hail record in Europe, which was held by a 15 cm stone found in Romania in 2016. Just five days later, a new record was set, when a 19 cm hailstone was found in the town of Azzano Decimo. This is very close to the all-time largest hail recorded of 20.3 cm, found in 2010 in South Dakota, US. Total loss estimates, of which hail was by far the largest contributor, exceeds EUR 3 bn, of which 70-80% in the property sector (residential and commercial buildings), and the remaining 20-30% in the motor vehicle sector. These were the largest hail events in Italy in recorded history, and the costliest cat event in the third quarter of 2023 for the global insurance market.

Following in the footsteps of the severe convective storm outbreak that impacted France in June 2022, these storms came after a record-hot air mass that languished over Southern Europe much of the week prior. Persistent meteorological conditions conducive to rotating supercell thunderstorms were observed for several consecutive days. These compounded with local conditions favorable for the development of severe hail over the Po Valley. In this study we present a reconstruction of these events based on event reports from European Severe Weather Database. We analyze the synoptic configurations and pre-convective environments that characterized them, with focus on those properties and features that are peculiar to severe hail-forming thunderstorms. We look at different formulations of CAPE and vertical wind shear, as well as composite parameters such as the Significant Hail Parameter and the Supercell Composite Parameter. We make use of Gallagher Re’s Severe Convective Storm Index to contextualize these events historically, and to discuss climate change trends over Northern Italy. Finally, we discuss the implications that such events and their expected frequency under climate change have on the (re)insurance market.

How to cite: Panosetti, D. and Tomassetti, U.: The July 2023 Northern Italy hailstorms from a climatological and (re)insurance market perspective, EGU General Assembly 2024, Vienna, Austria, 14–19 Apr 2024, EGU24-5962, https://doi.org/10.5194/egusphere-egu24-5962, 2024.

The consensus of climatic research indicates that the likelihoods of extreme precipitation events are going to change significantly, but specific trends depend on the type of dominant weather system, and regional landscape and climate details. Despite the effort of increasingly accurate and converging global circulation models, the uncertainties in the ensemble of CMIP6 models, and the often course spatial resolution make translation of climate models to actionable information of flood forecasts complex and uncertain. We carried out an analysis of a large ensemble of Global Circulation Models (GCMs) of the CMIP6 ensemble that were downscaled statistically as part of the NASA NEX-GDDP-CMIP6 dataset. The analysis looked at segmented windowed return period analysis using the method of l moments to fit general extreme value distributions to global climate models. With analysis of 1, 3 and 7 day duration, median, 15 and 85 percent quantiles, between 5 and 100 year return period, and global spatial coverage, the results show variations in how precipitation events of various return periods and durational are predicted to change in GCMs, and what the associated uncertainty is for various regions of the world. Intermediate analysis outputs show artifacts in yearly extreme precipitation due to the applied statistical downscaling, but relative factors to be used in precipitation scaling under climate change resolves these. Average increases in precipitation extremes of percent are observed globally (+5.1%), with many local outliers for the SSP585 scenario in 2050 (e.g. regions such as the Himalayan region (+23.4 percent median), the Sahel region(+21.6%) or South-Western Spain (-3.9%)). The other SSP scenarios change the global average factors to +3.75% and +4.32% for SPP245 and SSP370 Respectively. Very low variability in the changes is observed for return periods, indicating that the intensity probability curves shift uniformly in the model output. Precipitation events duration does more significantly alter the analysis outputs, and various areas show differences here that correlate with flash and fluvial flood susceptibility. Finally, we open-source the analysis code and link the output as a built-in dataset in the fastflood.org rapid flood simulation platform. Here, automatically derived extreme precipitation events from era5 datasets can be rescaled under climate change conditions by applying the scaling factors derived in this work.

How to cite: van den Bout, B.: Global changes in extreme precipitation linked with rapid flood simulation tools, EGU General Assembly 2024, Vienna, Austria, 14–19 Apr 2024, EGU24-7617, https://doi.org/10.5194/egusphere-egu24-7617, 2024.

EGU24-8116 | ECS | Posters on site | NH1.2

IMERG-E and IMERG-L: A Comprehensive Evaluation of the Medicane Daniel in Thessaly, Greece 

Evangelos Leivadiotis, Silvia Kohnová, and Aris Psilovikos

On 4 September 2023, the area of Thessaly (Greece) experienced a catastrophic flood as a result of the Daniel hurricane sequence. This severe phenomenon is characterized by extreme rainfall records ranging from 305 mm to 1096 mm between 4 and 7 September, causing severe damage to infrastructure, agriculture and buildings. Seventeen casaulties were recorded. The aim of the study is to complete the integrated multi-satellite harvesting of the Global Precipitation Measurement Mission (IMERG) using 10 precipitation stations distributed in the Thessaly region. Specifically, two precipitation products (IMERG-E and IMERG-L) were used to evaluate the early and late extreme precipitation events of IMERG version 7. In order to obtain the rainfall data needed for the research, a time period of 4 September 2023 (0000UTC) to 7 September 2023 (2330UTC) was chosen. This window corresponds to the approximate time at which Daniel's storm convective zone was on the area of interest. The National Meteorological Agency collected six of the ten precipitation stations and four of the Public Electricity Agency. The evaluation process was divided into two parts: the first part aimed at estimating the total rainfall of IMERG-E and IMERG-L, and the second part aimed at estimating the total daily rainfall of both products. Two statistical assessment indicators were used: the Pearson correlation coefficient and the root mean square error (RMSE) to quantitatively assess the performance of satellite precipitation products using rain-gauge data. Firstly, the correlation coefficient between IMERG-E, IMERG-L and total precipitation at IMERG-E, IMERG-L and IMERG-L is -0.03 and 0.27, respectively. Early products did not correlate with ground data, but later versions showed weak positive linear relationships. The RMSE values are 0.8 and 0.52, respectively. The daily analyses of IMERG-E showed moderate negative correlations on September 4 (-0.29), September 5 (-0.15), and September 7 (-0.25), and moderate positive correlations on September 6 (0.37). In terms of daily performance, the correlation coefficients suggest weak positive correlations (0.22 in 4 September, 0.13 in 5 September, 0.23 in 7 September), with the exception of -0.3 in 6 September. RMSE values remain low (0.31 on 4 September, 0.34 on 5 September, 0.20 on 7 September), except for 6, September, where values (0.95) indicate high levels of error. Overall, the late version is more efficient than the early version, but there are rooms for improvements when the IMERG final version will be available.

How to cite: Leivadiotis, E., Kohnová, S., and Psilovikos, A.: IMERG-E and IMERG-L: A Comprehensive Evaluation of the Medicane Daniel in Thessaly, Greece, EGU General Assembly 2024, Vienna, Austria, 14–19 Apr 2024, EGU24-8116, https://doi.org/10.5194/egusphere-egu24-8116, 2024.

EGU24-9412 | Orals | NH1.2

Extratropical intrusions and their role in tropical flood events: A South Pacific perspective 

Romain Pilon, Andries de Vries, and Daniela Domeisen

Extratropical Rossby waves are a potential source of instability for driving convective disturbances in the tropics. In the South Pacific, island nations are subject to flooding associated with such convective disturbances, yet these have not been conclusively linked to any large-scale processes. Using an object-based approach, this study specifically explores in particular how Rossby waves propagating into the tropics can contribute to the formation of extratropical-tropical cloud bands, which can cause flooding events. These cloud bands are associated with substantial precipitation events and serve as easily detectable proxies to identify when such intrusions occur. Building upon this foundation we use ERA5 reanalysis along with a detection analysis for tropical-extratropical cloud bands and potential vorticity streamers and cutoffs to establish a climatology of such intrusions and cloud bands. This allows us to demonstrate the statistical association of extratropical intrusions with intensified deep convection, in particular over the tropical central South Pacific. We find that these intrusions contribute significantly to the occurrence of floods in the Polynesian islands. In summary, this study allows us to connect the interaction between the extratropics and the tropics with flood events in the South Pacific.

How to cite: Pilon, R., de Vries, A., and Domeisen, D.: Extratropical intrusions and their role in tropical flood events: A South Pacific perspective, EGU General Assembly 2024, Vienna, Austria, 14–19 Apr 2024, EGU24-9412, https://doi.org/10.5194/egusphere-egu24-9412, 2024.

EGU24-10058 | ECS | Orals | NH1.2

Detection of past extreme precipitation events and connection to recorded impacts: a multi-data and multi-method assessment over the Central-Eastern Alps 

Katharina Enigl, Alice Crespi, Sebastian Lehner, Klaus Haslinger, and Massimiliano Pittore

Extreme hydro-meteorological events are increasingly observed in southern Europe and especially in the European Alps, where they threaten ecological and socio-economic systems. To detect such events and analyse the changes in their occurrence, a proper definition of an extreme event is needed. Statistically, we define extremes from the tails of the probability distributions. However, these events are not necessarily extreme in terms of impact, and impact-related thresholds may vary spatially and temporally, i.e., single absolute thresholds do not necessarily reflect the extremes at all locations, in all time periods and all seasons. Moreover, the availability of harmonized and consistent datasets is crucial for investigating extremes in a transnational context. In this study, we focus on the identification and characterisation of extreme hydro-meteorological events affecting a transboundary Alpine region between Austria and Italy from 2003 to 2021 based on different definitions of extreme events considering spatiotemporal aspects and multiple datasets. Daily accumulated precipitation is used as the main proxy parameter to describe the potential for severe consequences, as it as it is the most broadly available quantity across different datasets compared to e.g., sub-daily precipitation sums. Moreover, its role as a triggering factor for various hazards (e.g., landslides, debris flows, pluvial and fluvial floods) is widely recognised. We analyse three different statistical methods for the detection of extreme events: (i) the identification of the highest daily precipitation amounts on a regional scale, (ii) the detection of daily precipitation values of high intensity on a local scale and (iii) the identification of exceptional daily precipitation records not in absolute terms but with respect to average conditions associated to a specific period of the year. All detection algorithms are applied to four gridded precipitation datasets, including both observation and reanalysis products, with different technical specifications. Subsequently, identified events for each method-dataset combination are blended with existing records of gravitational mass movements and fluvial floods in the Austrian-Italian border region to analyse the suitability of each combination to detect actual occurred impacts. First results indicate that most detected precipitation extremes relate to actual observed impacts (e.g., 74% for regional scale identification with reanalysis data). However, different method-dataset combinations have different strengths and weaknesses, which reflect inherent characteristics of the dataset and/or of the statistical method employed. Furthermore, some combinations show lower performance in detecting impactful events, because the dataset and method applied conflict with each other (e.g., a coarse-resolution dataset not resolving local-scale features conflicts with a statistical method searching for locally high intensities). The findings could contribute to better inform civil protection authorities about risks related to extreme hydrometeorological events, possibly affected by climate change.

How to cite: Enigl, K., Crespi, A., Lehner, S., Haslinger, K., and Pittore, M.: Detection of past extreme precipitation events and connection to recorded impacts: a multi-data and multi-method assessment over the Central-Eastern Alps, EGU General Assembly 2024, Vienna, Austria, 14–19 Apr 2024, EGU24-10058, https://doi.org/10.5194/egusphere-egu24-10058, 2024.

EGU24-10451 | Posters on site | NH1.2

Influence of Design Storm Profiles on Flood Peak Discharge in a Small River Catchment 

Kazimierz Banasik, Leszek Hejduk, Adam Krajewski, Donald E. Woodward, Andrzej Wałęga, and Beniamin Więzik

Estimations of flood peak discharges of low probability of exceedance are required for designing and maintaining hydraulic and road structures (reservoirs, weirs, water intakes, bridges, culverts) as well as for flood protection, including assessment of the risk of flooding. Rainfall-runoff models are usually the only alternative for such estimations in case of small catchments, as there is a lack of sufficient, good quality historic data to be used for applying the traditional i.e. statistical methods. The aim of this study was to check responses of a small agro-forested, lowland catchment located in center of Poland to rainfall of assumed probability of exceedance and of three profiles of intensity (i.e. a/ constant intensity, b/ asymmetric one with highest intensity between 0.3 and 0.5 its duration, c/ symmetric one with single peaked intensity) and various storm duration.

A regional formula, developed by state hydrological service, on relationship of intensity-duration-frequency, applicable also for region of center of Poland, has been used to find rainfall depths of the events with probability of exceedance of 1% (return period of 100 years) and various duration (i.e. D = 6, 12, 18, 24, 30, 36, 42, 48, 60 and 72 h), as input data for runoff hydrograph simulation. As the catchment, which area is 82.4 km2, has long term monitoring history, the model parameters, as Curve Number of NRCS (Natural Resources Conservation Service), used for extracting the effective rainfall (direct runoff) from total rainfall depth and parameters of Nash model, used for transformation of effective rainfall into direct runoff hydrograph, were estimated from recorded rainfall-runoff events. Over 50-year-continuous discharge record allowed us to estimate the 100 year flood, by applying statistical method for the investigated catchment, as 25,6 m3/s which form a base for comparison of the results of application of the rainfall-runoff model.

Results of modelling of the of rainfall-runoff process indicate: a/ that critical rainfall duration (producing highest peak discharges) of the three storm profiles were between 24 and 60 hours, and b/ higher peak discharges at critical rainfall durations of the three storm profiles than one of statistical method. The differences (overestimates) were from 1.6% for the constant intensity to 30.0% for the symmetric single peaked intensity.

How to cite: Banasik, K., Hejduk, L., Krajewski, A., Woodward, D. E., Wałęga, A., and Więzik, B.: Influence of Design Storm Profiles on Flood Peak Discharge in a Small River Catchment, EGU General Assembly 2024, Vienna, Austria, 14–19 Apr 2024, EGU24-10451, https://doi.org/10.5194/egusphere-egu24-10451, 2024.

EGU24-10531 | Orals | NH1.2

Evaluating Standard Precipitation Index (SPI) using MIROC6 historicclimate simulations and ERA 5 reanalysis data as a tool to map theimpacts of climate change in rainfall regime in Brazil 

Gean Paulo Michel, Aimée Guida Barroso, Franciele Zanandrea, Márcio Vinicius Aguiar Soares, Gabriel Ferreira Subtil de Almeida, Marcio Cataldi, Priscila Esposte Coutinho, Lívia Sancho, and Vitor Luiz Galves

Rising global average temperatures, as a consequence of climate change, have worsened the occurrences of extreme weather events, causing disruptions in rainfall patterns around the world. In Brazil, such effects are already observed with the increase of heat waves, floods, droughts, and wildfires. The correlation between disruptions in precipitation patterns and fires is complex, nevertheless, the intensity, frequency, and duration of drought events have significant impacts on fuel flammability and fire behavior. Drought monitoring is particularly relevant in Brazil, where the vast majority of forest fires have an anthropogenic ignition and prolonged dry periods favor such fires to spread out of control. The Standardized Precipitation Index (SPI) is one of the most important tools used to evaluate precipitation variability, offering simple yet robust statistical information on the distribution, duration, and frequency of rainfalls and, consequently, droughts. The SPI uses precipitation as input data to standardize the deviation of cumulated rainfall from the mean of historical precipitation, detecting water deficit (negative values) or water surplus (positive values) for a given location. In doing so, this index allows direct spatial comparability between arid and humid regions. This is an advantageous characteristic when drought analysis is applied to a country with different regional rainfall regimes, such as Brazil. The applicability of SPI as a source of drought prediction was investigated by observing its performance with historical climate simulations of the 6th phase of the Model for Interdisciplinary Research on Climate (MIROC6) and the fifth generation ECMWF atmospheric reanalysis of the global climate, ERA5. The direct comparison of the SPI data, employing the climatology extending from 1980-2014 in Brazil, derived both from the climate simulation model and the reanalysis data - which combines observations and models – has provided valuable insights. Preliminary results show an overall consistency in the calculated indexes from both sources, which are in line with seasonal regional rainfall patterns in Brazil. On average, the SPI indexes recognize water deficits for the North-east, north of the South-east and central regions of Brazil. During the months of winter, both indexes detect droughts in these regions, with ERA-5 SPI index registering severe droughts in central Brazil. These results suggest that the SPI index calculated using the reanalysis data seems to register droughts with greater severity and longer duration, identifying more precisely periods with little to no rainfall, whilst the SPI derived from the MIROC6 simulation data, although able to acceptably identify and delimitate droughts, records less severity for the same period. These findings are important to recognize the MIROC6-derived SPI index as a valuable tool in drought prediction. However, they also highlight the necessity of acknowledging the limitations of the model regarding the severity of droughts. The understanding and prediction of precipitation anomalies is fundamental to coping with the impacts of climate change on water resources, agriculture, and biodiversity, guiding mitigation and adaptation strategies in Brazil.

How to cite: Michel, G. P., Guida Barroso, A., Zanandrea, F., Aguiar Soares, M. V., Ferreira Subtil de Almeida, G., Cataldi, M., Esposte Coutinho, P., Sancho, L., and Galves, V. L.: Evaluating Standard Precipitation Index (SPI) using MIROC6 historicclimate simulations and ERA 5 reanalysis data as a tool to map theimpacts of climate change in rainfall regime in Brazil, EGU General Assembly 2024, Vienna, Austria, 14–19 Apr 2024, EGU24-10531, https://doi.org/10.5194/egusphere-egu24-10531, 2024.

EGU24-10737 | ECS | Orals | NH1.2

Projecting Extreme Rainfall in Sicily: Integrating Simple Scaling and Hourly Projections into Depth-Duration-Frequency Analysis 

Gaetano Buonacera, David J. Peres, Nunziarita Palazzolo, and Antonino Cancelliere

In this present work, we propose a robust methodology for the derivation of future rainfall depth-duration-frequency curves (DDFs), utilizing hourly projections, the assumption of simple scaling of precipitation, and the application of the method of moments for parameter estimation in dimensionless precipitation height distributions. The methodology introduced herein involves the application of change factors derived from climate projections to precipitation averages across various durations (1, 3, 6, 12, and 24 hours) and to the dimensionless moments of the precipitation series. To implement this methodology, we leverage regional scale models (RCM) from the EURO-CORDEX initiative, characterized by hourly temporal resolution. The direct utilization of hourly projection data allows to bypass the necessity for temporal disaggregation techniques. Change factors are calculated through an analysis of annual maxima derived from both future and control series (1971-2000) generated via RCMs. We consider two distinct emission scenarios, namely RCP (Representative Concentration Pathways) 4.5 and 8.5, spanning three future periods: near future (2021-2050), middle future (2051-2070), and far future (2071-2100). Our methodology is applied to multiple rain gauges located across the Sicily region. The outcomes of our investigation underscore an upward trend in future DDFs, particularly pronounced in the RCP 4.5 scenario and during the far future period. This trend is attributed to an observed intensification in the variability of rainfall events. Depending on the specific geographic location, chosen emission scenario, and future time period, future Depth-Duration-Frequency (DDF) curves may correspond to return periods that more than double those observed in the control climate. The methodology, given the easy availability of the exploited data, can turn useful for updating hydrological design criteria for flood mitigation.  


How to cite: Buonacera, G., Peres, D. J., Palazzolo, N., and Cancelliere, A.: Projecting Extreme Rainfall in Sicily: Integrating Simple Scaling and Hourly Projections into Depth-Duration-Frequency Analysis, EGU General Assembly 2024, Vienna, Austria, 14–19 Apr 2024, EGU24-10737, https://doi.org/10.5194/egusphere-egu24-10737, 2024.

EGU24-10848 | ECS | Orals | NH1.2

Extreme precipitation – temperature scaling: disentangling causality and covariation 

Sarosh Alam Ghausi, Erwin Zehe, Subimal Ghosh, Yinglin Tian, and Axel Kleidon

Warmer temperatures are expected to cause more intense rainfall, primarily due to the rise in atmospheric moisture at the rate of 7%/K, as indicated by the Clausius-Clapeyron (CC) equation. To evaluate this effect, studies use a statistical approach known as precipitation-temperature scaling that involves fitting an exponential regression between observations of extreme rainfall events and local temperatures, resembling how saturation-vapor pressure scales with temperature. However, the estimated sensitivities (also called scaling rates), exhibit notable deviations from the CC scaling (7%/K). These rates remain mostly negative in the tropics as the rainfall extremes exhibit a general monotonic decrease with temperature and “hook-shape” structures in most parts of tropics and mid-latitudes.

Here we show that most of the variability in the observed scaling rates arises from the confounding radiative effect of clouds associated with rainfall events. Clouds substantially reduce the net radiative heating of the surface during the storms by up to 100 W/m2 in the tropics, leading to the cooling of surface temperatures by up to 8K. This cloud-induced cooling results in a covariation between precipitation and local temperature, inducing a two-way causality in the observed scaling rates. To isolate this cooling effect, we used a thermodynamically constrained surface energy balance model and force it with radiative fluxes under both "clear" and "cloudy" sky conditions. We then quantified the changes in surface temperatures due to clouds and remove it from temperature observations during rainy days. After removing this effect, we found positive scaling across the global land areas, closely aligning with CC rates of 7%/K. We demonstrate that cloud radiative effects alone can explain the observed negative and hook-shaped relationships found in precipitation-temperature scaling.

Our findings imply that projected intensification of rainfall extremes with temperature by climate models is consistent with observations after the cloud-cooling effect is corrected for. Our results emphasize on making a clear distinction between causality and covariation by explicitly separating the temperatures before the rainfall event that are shaped by less clouds from temperature during the rainfall event which include clouds. This adds a crucial effect to the debate of interpreting observed precipitation - temperature scaling rates. Furthermore, our methodology of removing cloud effects on temperatures can be extended to estimate climate sensitivities from observations beyond precipitation extremes.

How to cite: Ghausi, S. A., Zehe, E., Ghosh, S., Tian, Y., and Kleidon, A.: Extreme precipitation – temperature scaling: disentangling causality and covariation, EGU General Assembly 2024, Vienna, Austria, 14–19 Apr 2024, EGU24-10848, https://doi.org/10.5194/egusphere-egu24-10848, 2024.

EGU24-11716 | ECS | Posters on site | NH1.2

Tropical Cyclone Rainfall Asymmetries Inferred from GPM-IMERG: A Focus on Lesser Antilles 

Catherine Nabukulu, Janneke Ettema, Victor Jetten, and Bastian van den Bout

Abstract

This study utilizes GPM-IMERG satellite rainfall estimates to assess the asymmetric rainfall patterns in 27 tropical cyclones (TCs) across the Lesser Antilles region from 2000 to 2020. The aim is to evaluate whether there is a persistent relationship between precipitation and wind characteristics, which could support improved TC-related flood risk assessment for these islands. With a focus on hurricane and tropical storm categories, the 30-minute precipitation variability was assessed within a radius of 500 km from the TC’s eye during its path in the study area. In addition, TC’s forward speed and wind characteristics, like  TC’s category and the extent of 34-knot winds (R34), are included. The analysis reveals temporal trends, indicating increased TC rainfall events in the study area during the second decade. Correlations show positive relationships between rainfall total (RT), rainfall area (RA), and rainfall intensity at the 90th percentile (RI0.9), with RT and RI0.9 showing the strongest link in the majority of the observations. Contrary to conventional assumptions, this research challenges the idea that highest category TCs in the wind intensity always produce higher rainfall, as we see that higher-category hurricanes such as H4 (209-251km/hr) and H5 (>=252km/hr) were often associated with lower rainfall values in RT and RI0.9 compared to tropical storms (63 - 118 km/hr). Tropical storms, like higher-category hurricanes, can display large rainfall areas. In addition,  quadrant analysis of rainfall zones around the TC eye highlights that the NE and SE quadrants in TC have significantly more rainfall impact. However, it also reveals the danger posed by weaker quadrants in wind characteristics such as SW and NW, as they can exhibit high rainfall values in RA and RT. The study indicates complex, non-linear relationships between TC’s wind and precipitation characteristics in the Lesser Antilles region. Incorporating the rainfall variability observed in TC dynamics into early warning systems and risk assessment is essential for a more effective emergency response and mitigation planning.

General methodology

The satellite rainfall estimates were obtained within a defined buffer of a diameter of 500km around the TC eye while following the TC trajectory. The buffer was further dissected into quadrant spatial zones  (NE, SE, SW and NW) to provide a detailed perspective on rainfall distribution in different parts of the TC impact area. For each eye position, rainfall characteristics (RT, RA and  RI0.9) were computed for the whole buffer and later individual quadrant partitions. The computed rainfall characteristics were then investigated for potential correlation relationships with the TC wind intensity. In addition, quadrant rainfall patterns were analyzed for persistence throughout the TC duration.


How to cite: Nabukulu, C., Ettema, J., Jetten, V., and van den Bout, B.: Tropical Cyclone Rainfall Asymmetries Inferred from GPM-IMERG: A Focus on Lesser Antilles, EGU General Assembly 2024, Vienna, Austria, 14–19 Apr 2024, EGU24-11716, https://doi.org/10.5194/egusphere-egu24-11716, 2024.

EGU24-12191 | ECS | Posters on site | NH1.2

Prediction and predictability of drought events in the Spree region 

Clara Hauke, Uwe Ulbrich, and Henning Rust

The predictability of drought events in the Spree region is analyzed, aiming at developing hydrological extreme events forecast and warning systems and long-term solutions regarding sustainable, interdisciplinary and integrated water resources management in the project SpreeWasser:N.

Predictors acting as potential indicators of imminent drought risk are inferred from statistical analyses, modeling and literature. Connections between certain states of the atmosphere (large-scale weather patterns) and local drought events are drawn, focussing mainly on agriculture as a user group. Special attention is paid to the succession of certain weather patterns and their impact on precipitation.

A drought forecast based on k-nearest neighbor regression is being developed using an algorithm which automatically selects the meteorological variables and regions yielding the largest forecast skill as input predictor variables during a hindcast period. This machine learning approach supports the discovery of underlying physical links in atmospheric phenomena.

The analysis and software development is based on ECMWF ERA5 reanalysis data and the objective weather type classification by the German Weather Service (DWD), spanning the years 1980 to 2021.

How to cite: Hauke, C., Ulbrich, U., and Rust, H.: Prediction and predictability of drought events in the Spree region, EGU General Assembly 2024, Vienna, Austria, 14–19 Apr 2024, EGU24-12191, https://doi.org/10.5194/egusphere-egu24-12191, 2024.

Tornadoes represent major meteorological hazards, in terms of damages to buildings, vehicles and structures and casualties. Because of their small space scale (order of 1km or less), duration (order of 1000s), strongly nonlinear and chaotic dynamics, tornadoes cannot be reproduced in operational weather prediction and climate models. It is important to develop approaches overcoming this limitation and capable of delivering reliable early warnings by civil protection services and estimating whether frequency and strength of tornadoes will change because of anthropogenic climate change. Recently, a probabilistic approach has been developed that resulted in analytical expressions of the probability of tornadoes occurrence based on meteorological parameters that can be extracted from weather prediction and climate models, such as WMAX (updraft maximum parcel vertical velocity, linked to the Convective Available Potential Energy CAPE), WS700 (the wind shear in the lower troposphere), LCL (the lifting condensation level), SRH900 (low-level storm relative helicity). An example is the formula log10(P)=-6.6+WMAX/(3.1+5.2 · WMAX/WS700), which is meant to describe dependence of probability P of occurrence of a tornadoes  on the surrounding environmental conditions and to distinguish among conditions with low and high probability. In this study this and similar formulas are applied to hindcasting the probability of tornadoes using ERA5 data. The purpose is to assess the skill of the method for operational prediction and explore its validity for climate change studies.

The methodology supporting this formula is extensively described in Ingrosso, R., Lionello, P., Miglietta, M. M., and Salvadori, G.: Brief communication: Towards a universal formula for the probability of tornadoes, Nat. Hazards Earth Syst. Sci., 23, 2443–2448, https://doi.org/10.5194/nhess-23-2443-2023, 2023.

How to cite: Lionello, P. and Muhammadi, A.: Testing the skill of an analytical expression for the probability of occurrence of tornadoes, EGU General Assembly 2024, Vienna, Austria, 14–19 Apr 2024, EGU24-12741, https://doi.org/10.5194/egusphere-egu24-12741, 2024.

EGU24-15012 | ECS | Orals | NH1.2

Drought projections and associated uncertainties over the Arabian Peninsula from CMIP6 models 

Md Saquib Saharwardi, Hari Prasad Dasari, Waqar Ul Hassan, Harikishan Gandham, Raju Pathak, Karumuri Ashok, and Ibrahim Hoteit

Drought frequency and severity have increased over the water-stressed Arid regions. This research employs multiple CMIP6 global climate models (GCMs) for projecting droughts over the Arabian Peninsula (AP) until the end of the 21st century. We utilized the standardized precipitation index (SPI) and standardized precipitation evapotranspiration index (SPEI) to generate projected future statistics of droughts along with uncertainties assessment from inter-model spread, scenarios, timescale, and methods therein.

For this purpose, after a meticulous analysis, we first identify the most suitable GCMs for better representation of AP's drought spatiotemporal pattern over the historical period (1985-2014). Our results indicate an increase in potential evapotranspiration (PET), which dominates simulated drought statistics relative to the precipitation. The projected evolution of the SPEI, which is derived from both precipitation and PET, indicates droughts  consistently increasing from low to high emission scenarios, In contrast, the SPI, owing to relatively-weaker amplification of the precipitation shows a moderately increasing wetness, except for a few northern regions where both indices evolve in agreement The fidelity of the simulated precipitation by many models over the historical period is also relatively poor compared to the PET, which may also be potentially adding to the uncertainties. In general, the principal sources of uncertainty in drought projections evolve from the choices of index, followed by scenarios, and inter-model variability, whereas methods and timescale mostly impact the magnitude of the trend in drought statistics.  

How to cite: Saharwardi, M. S., Dasari, H. P., Hassan, W. U., Gandham, H., Pathak, R., Ashok, K., and Hoteit, I.: Drought projections and associated uncertainties over the Arabian Peninsula from CMIP6 models, EGU General Assembly 2024, Vienna, Austria, 14–19 Apr 2024, EGU24-15012, https://doi.org/10.5194/egusphere-egu24-15012, 2024.

EGU24-15295 | Orals | NH1.2

Creation of an automatic workflow for a National Flood assessment in Aotearoa New Zealand 

Alice Harang, Emily Lane, Cyprien Bosserelle, Rose Pearson, Celine Cattoën-Gilbert, Trevor Carey-Smith, Hisako Shiona, Sam Dean, Raghav Srinivasan, Graeme Smart, and Matt Wilkins

To manage current flood hazard and help develop climate change adaptation strategies, the government-funded project “Mā te haumaru ō ngā puna wai: Increasing flood resilience across Aotearoa” aims to better understand flood hazard and risk across all Aotearoa New Zealand, now and in the future. A crucial part of this project is the generation of nationally consistent flood maps across the whole country for the current climate and future climate projections.

First, the workflow requires as input the identification of independent floodplains. Each floodplain will be associated to its catchment and be considered a computational unit. For each domain, a design storm is generated for a given scenario (Annual Exceedance Probability, climate projection, antecedent conditions) or an historical storm is used for validation purposes. The runoff and flow routing of streams and rivers on the steep part of the catchment are simulated with the NIWA TopNET model (McMillan et al. 2016). Used uncalibrated, this hydrological model was modified to include a physically realistic soil conductivity and provide a consistent response between gauge and ungauged catchments. The model is spun up to an average base flow with consistent soil and ground water antecedent conditions. The design storm is then run through the model to provide realistic flow boundary conditions to the hydrodynamic model in the populated lower catchment. Before the inundation modelling, the spatial maps are generated, using the GeoFabrics suite (Pearson et al. 2023), across the lower catchment, based on the latest LiDAR data available and complementary databases such as OpenStreetMap for infrastructure. This process produces a hydrologically conditioned DEM (Digital Elevation Model), including waterways opening and a basic riverbed estimation, associated to a roughness length map. Finally, the flood is simulated using the hydrodynamic model BG_Flood (Bosserelle et al. 2022). The model is a GPU-enabled inundation model using a modern shock-capturing St Venant solver. The model uses a quadtree type mesh that is well suited for GPU computation and allows iterative refinement of the mesh. A first coarse resolution run is used to define the expected flood extent. This flood extent and external data such as stop bank locations, is then used to produce a refinement map defining areas where higher resolution is needed. The model is then run a second time using the variably refined mesh.

Figure 1: Scheme of the cascade of model used to develop consistent flood maps in Aotearoa New Zealand.

This workflow has been validated on several historic flood events including a fluvial flood in Westport, ANZ (56h duration, 60-year flood), a fluvial and pluvial flood in Waikanae, ANZ (12h duration, 80-year flood) and the floods in the Hawkes Bay and Tairāwhiti regions (ANZ) following the Tropical Cyclone Gabrielle in February 2023 (over 100-year flood in some areas).

This workflow is based on open-sources tools; it is modular and automated for continual improvement, to enable data update and to facilitate the creation of new scenarios.

How to cite: Harang, A., Lane, E., Bosserelle, C., Pearson, R., Cattoën-Gilbert, C., Carey-Smith, T., Shiona, H., Dean, S., Srinivasan, R., Smart, G., and Wilkins, M.: Creation of an automatic workflow for a National Flood assessment in Aotearoa New Zealand, EGU General Assembly 2024, Vienna, Austria, 14–19 Apr 2024, EGU24-15295, https://doi.org/10.5194/egusphere-egu24-15295, 2024.

EGU24-15755 | ECS | Orals | NH1.2

The September 2023 flood in Derna, Libya: an extreme weather event or man-made disaster? 

Elad Dente, Moshe Armon, and Yuval Shmilovitz

Storm Daniel, the deadliest recorded Mediterranean tropical-like (medicane) storm, led to severe floods in large parts of the eastern-central Mediterranean, including Greece and northern Libya. Extreme rainfall, reaching more than 400 mm day-1, triggered a flash flood in Wadi Derna (Libya)– an ephemeral river with a drainage area of 575 km2 that crosses the city of Derna at its outlet to the Mediterranean Sea. Historical measures to mitigate flood risks included dam construction in the Wadi Dernah basin since the 1970s. However, during Storm Daniel, at least two of the dams were breached, resulting in a devastating flood that inundated much of the city of Derna, with over 4,000 casualties, 8,000 missing persons, and the displacement of tens of thousands. The devastating event was the focus of media coverage for a long time, but questions regarding the role of dams and their collapse remain open, and are relevant for other dammed regions as well: How extreme was the storm? How extreme the flood would have been if the dams had not been breached? What would the outcomes of the flood look like if dams were not built in the first place?

To analyze the characteristics of the storm over Wadi Derna, the catchment’s hydrological response, and the impact of the flood on the city of Derna, we integrate various datasets and models. Satellite-based precipitation estimations (IMERG) were used to quantify spatiotemporal storm properties and the catchment-scale rainfall, which were fed into the KINEROS2 hydrological model to quantify surface runoff upstream of the collapsed dams. The modeled flood hydrograph is then fed into a 2D hydraulic model (HEC-RAS) to test three end-member scenarios: (a) dam filling, overflow, and collapse, (b) dam overflow but no collapse, and (c) no dams exist in the wadi. This combination of methods reveals that the peak discharge during the flood was ~1,400 m3 s-1, just below the expected maximum extreme flood for this region. In the dam-collapse scenario, the populated flooded area is 40% larger than the no-dam scenario. These results emphasize the anthropogenic influence of damming natural streams on flood impacts. Given the high variability of precipitation in arid and semi-arid areas and the projected increase in extreme precipitation intensity with climate change, the Wadi Derna flood should serve as a warning sign for other populated areas downstream of a man-made dam in similar environments.

How to cite: Dente, E., Armon, M., and Shmilovitz, Y.: The September 2023 flood in Derna, Libya: an extreme weather event or man-made disaster?, EGU General Assembly 2024, Vienna, Austria, 14–19 Apr 2024, EGU24-15755, https://doi.org/10.5194/egusphere-egu24-15755, 2024.

EGU24-16370 | ECS | Posters on site | NH1.2

Analysis of historical flood events in Denmark with information from digital news media 

Jonas Wied Pedersen, Peter Steen Mikkelsen, and Michael Brian Butts

Reliable information on historical flood events is critical for flood risk analysis, climate change adaptation, verification of forecast models, etc. Unfortunately, such information is often difficult to find, due to e.g. lack of monitoring equipment at the location of a flood. In Denmark, management of water has traditionally been the responsibility of local authorities, which means there is a limited national overview of historical events and their consequences. Previous studies have employed different strategies for compiling a flood event inventory, including mining information from (1) insurance data, (2) social media data, and (3) newspaper archives. The aim of this study is to exploit a comprehensive digital news media archive to compile an inventory of Danish flood events in the period 2007-2020 with information on the time and location of the event, to classify the type of flood, and note any available information on local consequences and damages.

We have gained access to the company Infomedia’s large digital media archive, which consists of digitized articles from news sources ranging from major national newspapers to small, local outlets. The archive contains more than 75 million news articles with the earliest articles dating back to 1990. The archive is searchable through calls to an API with a custom search language that combine user-specified keywords. A hydrologist has read all articles that match the keywords, noting all the relevant information.

1,118 distinct flooded locations where identified over the 14-year period of 2007-2020. Results show that there is large year-to-year variability in the different types of floods. Urban pluvial floods are experienced somewhere in Denmark every single year, while the number of both fluvial and storm surge floods are very low (or entirely missing) in some years. Urban pluvial floods occur throughout the year but are highly concentrated in the summer months with a mean date of occurrence in late July, while storm surges are observed only between September and March with a mean date in mid-December. Fluvial floods are the least concentrated type of floods and occur throughout the year with a slight overweight in winter months (mean date in early January). The spatial distribution of floods is uneven with four out the 10 municipalities that experience the highest number of floods being located in Eastern Jutland (Vejle, Horsens, Kolding, Aarhus) and another four located in the Northern half of Zealand (Copenhagen, Roskilde, Gribskov, Holbæk).

Storm surge events occur over large geographical areas and we therefore speculate that they are more likely to be reported in news media than urban pluvial floods, which are often local events due to the small-scale nature of convective rainfall cells. Ongoing work is trying to quantify these aspects and validate the individual flood events in the inventory using additional data sources.

How to cite: Pedersen, J. W., Mikkelsen, P. S., and Butts, M. B.: Analysis of historical flood events in Denmark with information from digital news media, EGU General Assembly 2024, Vienna, Austria, 14–19 Apr 2024, EGU24-16370, https://doi.org/10.5194/egusphere-egu24-16370, 2024.

EGU24-16614 | Posters on site | NH1.2

A 172-year Drought Atlas for Romania  

Mihai-Gabriel Cotos, Monica Ionita, Catalin-Constantin Roibu, Adrian-Bogdan Antonescu, Petru-Cosmin Vaideanu, and Viorica Nagavciuc

In this study, we have created a 172-year historic drought catalogue for Romania by applying both the Standardized Precipitation Index (SPI) and the Standardized Precipitation Evapotranspiration Index (SPEI) to 16 long-term meteorological records/stations, covering the period 1852 – 2023. The long-term meteorological records together with documentary sources (e.g., newspapers, meteorological archives) spanning the last 172 years, are used to analyze the spatio-temporal patterns of variability, trends, and potential drivers of drought conditions, thus contributing to a nuanced understanding of Romania's hydroclimatic conditions over time. The results based on the SPEI point to the fact that the southern and eastern parts of Romania are becoming drier due to an increase in the potential evapotranspiration and mean air temperature, especially after the 1990’s. By contrast, the SPI drought index does not reveal these changes in the drought variability, mainly due to the fact that the precipitation does not exhibit a significant change. Five major drought-rich periods, in terms of duration and severity, were identified at the country level from 1852–2023, based on SPEI: 1866 – 1867, 1918 – 1920, 1947 – 1948, 2000 – 2001, and 2019 – 2022, respectively. The most pronounced drought event occurred during 2019 – 2022, followed by the 1866 – 1867 event. When analyzing the SPI-based events, similar results are found over the period 1852 – 1980, but the drought event from 2019 – 2022 is not captured by the SPI index. The most pronounced drought event, based on SPI, is the 1866 – 1867 event, followed by the 1919 – 1920 event. Nevertheless, due to the influence of the Carpathian Mountains, there are also strong regional differences in the drought events and their magnitude, with the southern and eastern parts of Romania being more affected by long-lasting drought events compared to the north-western part. Highlighting the above, a Drought Atlas for Romania (1852 – 2023) was developed using long-term meteorological data, which can provide comprehensive information on drought occurrence, magnitude and impacts over a period that goes beyond the currently available products.

How to cite: Cotos, M.-G., Ionita, M., Roibu, C.-C., Antonescu, A.-B., Vaideanu, P.-C., and Nagavciuc, V.: A 172-year Drought Atlas for Romania , EGU General Assembly 2024, Vienna, Austria, 14–19 Apr 2024, EGU24-16614, https://doi.org/10.5194/egusphere-egu24-16614, 2024.

EGU24-17041 | ECS | Orals | NH1.2

Evaluation of the performance of hydrological model LISFLOOD using the ECMWF seasonal meteorological forecast at 1arcmin-1day spatiotemporal resolution over German catchments 

Edgar Fabian Espitia Espitia, Yanet Diaz Esteban, Fatemeh Heidari, Qing Lin, and Elena Xoplaki

Floods and their devastating effects on society and economy have increased dramatically in Germany, and Europe in recent years. At the end of 2023, rivers and streams across Germany burst their banks due to heavy rainfall, affecting property, transport and power supplies and necessitating rescue operations and evacuations to protect human lives. One measure to deal with flooding and safeguard lives and property is the implementation of early warning systems, such as the European Flood Awareness System (EFAS), which provides short-term hydrological forecasts in real time. However, preparedness is essential along the responders value chain and longer term forecasts are important to anticipate, take precautions, raise awareness and generally mitigate the effects of flooding. The objective of this study is to evaluate the performance of hydrological forecasting using the seasonal meteorological forecast at a spatio-temporal resolution of 1 arcmin and day over Germany including all transboundary catchments for the period from 1990 to 2020. The hydrological model used was LISFLOOD. In the first step, LISFLOOD was calibrated using the meteorological observations, the EMO 1arcmin dataset and the discharge data from the transnational hydrological portal for all federal states and neighboring countries. The characteristics of land use, land cover, soil, groundwater, and human activity referred to as surface fields for global environmental modelling, were provided by EFAS. The second step, downscaling of the seasonal (long-term) forecast meteorological forcing to 1arcmin, is performed using a Deep Residual Neural Network (DRNN), and a bilinear interpolation approach over the seasonal forecast information of atmospheric conditions up to seven months into the future provided by the European Center for Medium-Range Weather Forecasts (ECMWF), 25 ensemble members in total. In the third step, the discharge is simulated by feeding the LISFLOOD model with two meteorological forcing scenarios, the DRNN downscaled and the bilinear approach of the seasonal meteorological forecast, to finally compare the performance with the observed runoff using the modified Kling-Gupta efficiency criteria (KGE'). The calibrated and validated LISFLOOD parameters showed a good and acceptable performance in all catchments, KGE' between 0.6 and 0.9. The DRNN downscaling technique shows a promising result, providing a good agreement between downscaled and observed dataset. Finally, the hydrological performance, KGE', is expected to be improved by 0.05 to 1 in the hydrological stations with good and poor performance, respectively, by using the DRNN downscaled seasonal forecast.

How to cite: Espitia Espitia, E. F., Diaz Esteban, Y., Heidari, F., Lin, Q., and Xoplaki, E.: Evaluation of the performance of hydrological model LISFLOOD using the ECMWF seasonal meteorological forecast at 1arcmin-1day spatiotemporal resolution over German catchments, EGU General Assembly 2024, Vienna, Austria, 14–19 Apr 2024, EGU24-17041, https://doi.org/10.5194/egusphere-egu24-17041, 2024.

EGU24-18684 | ECS | Orals | NH1.2

Modeling Uncertainty of Copula-based Joint Return Period of Flood Events under Climate Change 

Ankita Manekar and Meenu Ramadas

Modeling the joint behavior of flood characteristics under climate change is necessary for understanding the potential changes in associated flood risk and hazards. In this study, we assessed the changes in flood duration, peak, and volume between historical and future periods through copula-based flood frequency analysis, employing the Soil and Water Assessment Tool (SWAT) hydrological model for modeling flood risk in a tropical watershed (Govindpur) lying in eastern India. Observed streamflow at the watershed outlet is obtained for the baseline period (1990-2014) for flood analysis. A suitable copula model is selected for bivariate flood frequency analysis while assuming copula parameters vary between baseline and future periods under climate change. In this study, high-resolution (12-km) climate reanalysis dataset from the Indian Monsoon Data Assimilation and Analysis (IMDAA) and future climate projections from general circulation models (BCC-CSM2-MR, MPI-ESM1-2-HR) after downscaling and bias correction, are used for simulating flood events using SWAT. The use of high-resolution climate data for hydrological modeling and flood frequency analysis is a novel aspect of the presented study. Uncertainty in the estimation of joint return periods of flood events under climate change due to climate model selection and assumption of stationarity is also quantified in this study for the near future (2041-2070) period under the shared socio-economic pathway (SSP585) scenario. Among the GCMs used, BCC-CSM2-MR performed relatively better in simulating baseline period streamflow in the study watershed. In this study, the Clayton copula is obtained as the most suitable based on its lowest Akaike information criterion (AIC) value, and joint return periods are then derived with the help of a conditional copula. It is found that flood events are projected to become more severe in the near future; the flood peak value increased by more than 90%, while the duration is projected to decrease. Flood volume may likely double in the future, as per our analysis, suggesting the need for mitigation and precautionary measures to reduce flood risk in the watershed. Based on the analysis, uncertainty in flood return period estimation under changed future climate is to be accounted for extreme event studies, and that can aid in managing and minimizing the flood-associated risks.

Keywords: Climate Change, Flood Frequency Analysis, Soil and Water Assessment Tool, Copula, General Circulation Model, Uncertainty Analysis

How to cite: Manekar, A. and Ramadas, M.: Modeling Uncertainty of Copula-based Joint Return Period of Flood Events under Climate Change, EGU General Assembly 2024, Vienna, Austria, 14–19 Apr 2024, EGU24-18684, https://doi.org/10.5194/egusphere-egu24-18684, 2024.

The flood events in Germany during the summer of 2021 have once again brought to the forefront the challenges in translating scientific knowledge into effective disaster risk management practices. This paper examines the critical gap between the scientific understanding of flood risks and the practical needs of those who manage these risks. We delve into the limitations of current scientific approaches, such as flood risk and hazard mapping, in fully addressing the complexities and nuances required for practical disaster risk management, especially in the face of uncertain climate change impacts. We examine the dynamics of how flood risk information, inclusive of uncertainties, is perceived and acted upon, highlighting the psychological factors influencing these processes. The paper discusses the challenges and opportunities in translating scientific risk assessments and forecasts into practical, actionable strategies for communities and stakeholders. By highlighting the disconnects and potential areas for improvement in the science-practice interface, this paper seeks to foster a more coherent and comprehensive approach to disaster risk management. Within the framework of the Safe Development Paradox, the importance of communicating uncertainties and evaluating their potential impacts on planning and emergency responses is discussed. This paper addresses uncertainties at multiple levels and for different stakeholders, highlighting the integration of uncertainty information as a vital step in preparing for surprises and ambiguities in the context of extreme meteorological and hydrological events induced by severe weather and climate change.

How to cite: Höllermann, B.: Navigating Uncertainty in Flood Risk Perception in the Context of Climate-Induced Extremes , EGU General Assembly 2024, Vienna, Austria, 14–19 Apr 2024, EGU24-18692, https://doi.org/10.5194/egusphere-egu24-18692, 2024.

EGU24-19701 | Orals | NH1.2

Counterfactual floods: What if the storm track would have taken a different path? 

Bruno Merz, Viet Dung Nguyen, Guse Björn, Li Han, Xiaoxiang Guan, Oldrich Rakovec, Luis Samaniego, Bodo Ahrens, and Sergiy Vorogushyn

When a flood disaster occurs, there is an opportunity for affected individuals and decision-makers to learn from the experience. However, this learning tends to be narrowly focused on the specific event, missing the chance to discuss and prepare for even more severe or different events. For instance, regions that have been spared from havoc might feel safe and underestimate the risk. We suggest spatial counterfactual floods to encourage society to engage in discussions about exceptional events and appropriate risk management strategies. We create a series of floods across Germany by spatially shifting the rainfall fields of the 10 most expensive floods, arguing that past storm tracks could have occurred several tens of kilometers away from their actual paths. The set of spatial counterfactual floods generated includes events that are more than twice as severe as the most devastating flood in Germany since 1950. Our approach obtains peak flows that exceed the current flood-of-record at more than 70% of the gauges (369 out of 516). Spatial counterfactuals are proposed as an easy-to-understand approach to overcome society's unwillingness to consider and prepare for exceptional floods, which are expected to occur more frequently in a warmer world.

How to cite: Merz, B., Nguyen, V. D., Björn, G., Han, L., Guan, X., Rakovec, O., Samaniego, L., Ahrens, B., and Vorogushyn, S.: Counterfactual floods: What if the storm track would have taken a different path?, EGU General Assembly 2024, Vienna, Austria, 14–19 Apr 2024, EGU24-19701, https://doi.org/10.5194/egusphere-egu24-19701, 2024.

EGU24-19897 | Orals | NH1.2

Long-Term Trends and Drivers of Hailstorms in Switzerland 

Lena Wilhelm, Olivia Martius, Katharina Schröer, and Cornelia Schwierz

Climate change affects the severity and frequency of extreme meteorological events, including hailstorms. In this regard, it is imperative to understand the factors driving the intra- and interannual variability of hailstorms. In Switzerland, this remains insufficiently understood. To address this knowledge gap, our study conducts a long-term analysis to identify potential drivers and precursors of Swiss hailstorm variability. Due to the lack of long-term data on Swiss hailstorms, we developed statistical models reconstructing hail days from 1959 to 2022, utilizing radar-based hail observations and environmental data from ERA-5. Our hailday time series shows a statistically significant positive trend in yearly hail days in both southern and northern Switzerland. This trend is mainly attributed to heightened atmospheric instability and moisture content evident in recent decades' ERA-5 data. Noteworthy natural variability is observed in both regions. To delve into the large-scale mechanisms influencing Swiss hail activity, our study uses composites to explore potential drivers and precursors. Those include soil moisture conditions, sea surface temperature anomalies, large-scale variability patterns (Piper and Kunz 2017), central European weather types (e.g., Rohrer et al. 2018), cold fronts (Schemm et al. 2015, 2016), and atmospheric blocks (e.g. Barras et al. 2021). 

How to cite: Wilhelm, L., Martius, O., Schröer, K., and Schwierz, C.: Long-Term Trends and Drivers of Hailstorms in Switzerland, EGU General Assembly 2024, Vienna, Austria, 14–19 Apr 2024, EGU24-19897, https://doi.org/10.5194/egusphere-egu24-19897, 2024.

EGU24-19970 | ECS | Posters on site | NH1.2

Freva for ClimXtreme: helping to systematize holistic analysis of extreme events 

Etor E. Lucio-Eceiza, Christopher Kadow, Martin Bergemann, Andrej Fast, and Thomas Ludwig

Climate change is responsible for more extreme weather situations with damaging consequences. Public interest projects such as ClimXtreme [1, 2] were conceived to improve our knowledge on extreme events, the role of climate change, and their impacts. Focusing on an integrated approach, ClimXtreme evaluates the physical processes behind the extremes, their statistical assessment and their societal impact. On its second phase ClimXtreme [3] aims to open up its findings to a wider stakeholder base of different kinds.

Frameworks such as Freva (Free Evaluation System Framework [4, 5]) offer an efficient solution to handle customisable evaluation systems of large research projects, institutes or universities in the Earth system community [6-8] via the HPC environment and in a centralised manner. Mainly written in Python, Freva offers:

  • Centralised access. Freva can be accessed via command line interface, web, and a Python module with similar functionality.
  • Standardised data search. Freva allows quick and intuitive integration and searching of multiple, centrally stored data sets.
  • Flexible analysis. Freva provides a common interface for user-defined data analysis routines to be plugged into the system, regardless of the programming language. These plugins are able to search from and integrate their own results back into Freva. This environment enables an ecosystem of plugins that promotes the exchange of results and ideas between researchers, and facilitates the portability to any other research project using a Freva instance.
  • Transparent and reproducible results. Every analysis run through Freva (including parameter configuration and plugin version information) is stored in a central database and can be viewed, shared, modified and re-run by anyone within the project. Freva optimises the use of computing and storage resources and paves the way for traceability in line with the FAIR data principles [9].

The Freva instance of ClimXtreme (XCES [7]), hosted at DKRZ, provides fast access to more than 10 million data files from models (e.g. CMIP, CORDEX), observations (e.g. ERA5, HYRAS, stations) and plugin outputs. The ClimXtreme community has actively contributed plugins to XCES, its biggest asset, with nearly 20 plugins of different disciplines available to all within the project.

We would like to show a practical application of the capabilities of XCES by using it to systematise the characterisation (e.g. return periods, severity, co-occurrence...) of several past extreme events extracted from the ClimXtreme Phase 1 catalogue. Such an application can be extended to create workflows focused, for example, on the rapid assessment of the analysis of currently occurring events, allowing a quicker response to stakeholders or the public in general.


References:

[1] https://www.fona.de/de/massnahmen/foerdermassnahmen/climxtreme.php

[2] https://www.climxtreme.net/index.php/en/

[3] https://www.fona.de/de/aktuelles/nachrichten/2023/231207_ClimXtreme_Phase_2_b.php

[4] http://doi.org/10.5334/jors.253

[5] https://github.com/FREVA-CLINT/freva-deployment

[6] freva.met.fu-berlin.de

[7] https://www.xces.dkrz.de/

[8] www-regiklim.dkrz.de

[9] https://www.go-fair.org/fair-principles/


How to cite: Lucio-Eceiza, E. E., Kadow, C., Bergemann, M., Fast, A., and Ludwig, T.: Freva for ClimXtreme: helping to systematize holistic analysis of extreme events, EGU General Assembly 2024, Vienna, Austria, 14–19 Apr 2024, EGU24-19970, https://doi.org/10.5194/egusphere-egu24-19970, 2024.

EGU24-20455 | Posters virtual | NH1.2

Investigating the effects of initial soil moisture and the uncertainty of Manning friction coefficient on flood hazard estimation and mapping. 

Athanasios Loukas, Anastasios Katsiolas, and George Papaioannou

Floods are among the most devastating water-related hazards and are primarily responsible for the loss of human life and destruction of the natural and man-made environment. This study addresses the estimation and mapping of flood hazard in small mountain watersheds with urban areas at the lowlands and the related uncertainty. Specifically, this research studies the flood hazard for the Metropolitan city of Volos in Central Greece, which is frequently affected by intense storms that cause flash floods. The above study area is crossed by three (3) streams.The methodology used in the study is divided into three stages. At first the 24-hour design storm hydrographs were constructed for the three sub-basins of the study area with using the mean IDF parameters and the relevant confidence limits. The Alternating Block Method was used for the design hyetographs for return periods, T = 50-year, T=100-year and T=1000-year (worst-case scenario). The second stage concerns the hydrological analysis using a rainfall-runoff model. Firstly, the net rainfall was estimated by using the U.S. Soil Conservation Service (SCS-CN) method for three (3) soil's Antecedent Moisture Conditions (AMC) for dry-average-wet conditions. Then, the net rainfall was transformed by using the Instantaneous Unit Clark hydrograph into discharge and the flood hydrographs for each return period were estimated. At the final stage, the flood hydrograph estimated for each watershed was routed through the hydrographic network using the HEC-RAS 2D hydraulic-hydrodynamic simulation (2D) model.  For the flow routing, Manning’s n was estimated for various cross sections by visual inspection and corresponding values reported in international reports. The “upper” and “lower” boundaries of Manning’s n were estimated as the -50% and +50% of the average Manning’s n values, respectively. In this simulation approach, flood hazard maps for three return periods, T=50, T=100 and T=1000 years considering three different soil moisture conditions and three different values of Manning’s n have been estimated. The values of Manning’s n in the flood plain were estimated by using land cover/land use data.  The flow routing with in the urban areas was simulated by the block rising method. In total twenty-seven (27) flood scenarios have been simulated for each watershed. The results were validated with the flooded areas during a specific historical flood event using the Critical Success Index (CSI) method and reports and photographs of the historical flood event. The results of hydrological analysis and hydraulic simulation were also compared with the results of the Greek Flood Hazard Management Plans.

How to cite: Loukas, A., Katsiolas, A., and Papaioannou, G.: Investigating the effects of initial soil moisture and the uncertainty of Manning friction coefficient on flood hazard estimation and mapping., EGU General Assembly 2024, Vienna, Austria, 14–19 Apr 2024, EGU24-20455, https://doi.org/10.5194/egusphere-egu24-20455, 2024.

EGU24-22160 | Posters on site | NH1.2

Novel approach to quantifying long-term rainfall distribution variation: the region of Europe 

Andrew Barnes and Ioanna Stamataki

Climate change is changing rainfall and flood regimes across the world with severe and widespread impacts on society. Rainfall extremes are intensifying in frequency and magnitude due to the effects of climate change, and thus in this research, we introduce a new, novel framework for understanding how rainfall distributions are changing through time, enabling more accurate flood risk analysis. The framework offers two approaches to comparing rainfall distributions, the first of these utilises a stagnant benchmark distribution and the second highlights a moving benchmark approach. When combined the framework enables the identification of significant sudden and gradual changes in the distributions without the need to fit statistical distributions to the data.

 The region of Europe is selected as the case study and analysed in the four UN regions of Europe: Northern Europe, Eastern Europe, Southern Europe, and Western Europe. Using daily precipitation data generated using the ERA5 Reanalysis hourly data from the ECMWF’s Copernicus data store, the case study is used to highlight the capability of both frameworks to capture different forms of rainfall distribution shift.

 Comparing the frameworks presented revealed similar long term changes in the rainfall variation. The stagnant comparison showed that rainfall distributions have intensified since 1940 with a clear increase across all four regions of Europe regarding the percentage of days with rainfall, averaging at 2.75% across Europe. The largest changes seen are in the last comparison period for Eastern Europe (1960-1975) at 3.07% and in the latest comparison period (2005-2020) for Northern Europe (2.64%). The moving comparison method unveiled the strongest changes between the periods 1940-1960 and 1960-1980 with an average of 2.09% of rainfall days being intensified across all Europe. The most considerable shifts in rainfall variability occurred in Eastern (2.39%) and Western Europe (2.72%) during the 1960-1980 period.

 By applying it over the European region, this paper demonstrated how this novel approach can be used to identify long-term rainfall variation in the 20th century. The suggested frameworks do not rely on fitting statistical distributions and thus enable both long and short term change identification, providing flood risk managers a new solution to understanding local, regional and global rainfall variability and quantification. The analysis of the changing dynamics of precipitation patterns and the increase of the intensity of precipitation events, offers considerable potential for further investigations in the mitigation strategies of a resilient future.

How to cite: Barnes, A. and Stamataki, I.: Novel approach to quantifying long-term rainfall distribution variation: the region of Europe, EGU General Assembly 2024, Vienna, Austria, 14–19 Apr 2024, EGU24-22160, https://doi.org/10.5194/egusphere-egu24-22160, 2024.

The intensification of extreme precipitation in a warming climate has been shown in observations and climate models to follow approximately theoretical Clausius-Clapeyron scaling. However, larger changes have been indicated in events of short-duration which frequently trigger flash floods or landslides, causing loss of life. Global analyses of continental-scale convection-permitting climate models (CPCMs) and new observational datasets will be presented that provide the state-of-the-art in understanding changes to extreme weather (rainfall, wind, hail, lightning) and their compounding effects with global warming. These analyses suggest that not only warming, but dynamical circulation changes, are important in the manifestation of change to some types of extreme weather, which must be addressed in the design of new CPCM ensembles. We use our projections to provide the first analyses of impacts on infrastructure systems using a new consequence forecasting framework and show the implications for adaptation. It will be argued that a shift in focus is needed towards examining extreme weather events in the context of their ‘ingredients’ through their evolution in time and space. Coupled with exploration of their causal pathways, sequencing, and compounding effects – ‘storylines’ –, this can be used to improve both early warning systems and projections of extreme weather events for climate adaptation.

How to cite: Fowler, H.: Rapidly intensifying extreme weather events in a warming world: how important are large-scale dynamics in generating extreme floods?, EGU General Assembly 2024, Vienna, Austria, 14–19 Apr 2024, EGU24-22472, https://doi.org/10.5194/egusphere-egu24-22472, 2024.

EGU24-226 | ECS | Posters on site | NH9.2

Propagation of climate extremes across global value chains 

Serine Guichoud, Laurent Li, and Patrice Dumas

This paper presents a theoretical frame relying on the graph theory for assessing extreme weather events relative damage to global value chains. 
The approach is defined in three steps: the first part of the paper presents the intuition inspiring the defined model and associated theory , the second part is focused on a scenario analysis declining extreme events relative severity by countries, the third part leverages on the graph theory to translate the damages associated to these events into macro-sectorial value chains disruptions. A numerical application is then run by estimating drought global damages.
We consider damage as a score based on extreme events occurrence, calibrated in this article with historical data. Using the graph theory, we incorporate these damages to a network of countries moving from a stationary state of constant flows before a distribution of extreme events, to a modified state considering the extreme events occurrence. The spread of these production damages is modeled as a contagion applied to a network representing intermediate consumption financial flows, to assess the cumulative effect of a damage to value chains. 

How to cite: Guichoud, S., Li, L., and Dumas, P.: Propagation of climate extremes across global value chains, EGU General Assembly 2024, Vienna, Austria, 14–19 Apr 2024, EGU24-226, https://doi.org/10.5194/egusphere-egu24-226, 2024.

EGU24-681 | ECS | Orals | NH9.2

Windstorm risk assessment in the Netherlands: Evaluation of statistical dependencies between hazard and damage data 

Maria del Socorro Fonseca Cerda, Toon Haer, Hans de Moel, Jeroen Aerts, Wouter Botzen, Elco Koks, and Daan van Ederen

Extreme windstorms pose significant societal and economic challenges, ranking among the costliest natural disasters in Europe. This study addresses the complex task of quantifying windstorm impacts, with a specific focus on the Netherlands. Despite their substantial economic cost, windstorm risks in the Netherlands have been underexplored in dedicated regional studies. Existing large-scale investigations often rely on hazard-loss relationships derived from data from other European countries. We aim to enhance the accuracy of windstorm risk assessment by utilizing not only higher-resolution hazard data but also higher-resolution Dutch damage data. Our methodology involves analyzing high-resolution data to identify hazard variables that best correlate with losses. This is done by leveraging post-disaster loss data from a private Dutch insurance company. In particular, we use the aggregated losses per postal code 4 area, which delivers a nuanced understanding of the spatial distribution of losses. Simultaneously, we account for hazard intensities using the wind climatology data from KNMI North Sea Wind (KNW). This data is derived from 40 years (1979-2019) of ERA-Interim re-analyzed data and downscaled to a higher resolution (2.5 x 2.5 km) tailored specifically for the Netherlands. Through statistical analysis, the study aims to determine the most suitable hazard components for a regional windstorm damage assessment model. This approach aims to move beyond the conventional use of daily maxima wind speed or gust speed by evaluating the appropriateness of hazard variables concerning observed losses. This meticulous integration of proprietary loss records and refined wind climatology enables developing new spatial windstorm hazard maps and a high-resolution windstorm risk database, which provide a solid basis for risk assessment.

How to cite: Fonseca Cerda, M. S., Haer, T., de Moel, H., Aerts, J., Botzen, W., Koks, E., and van Ederen, D.: Windstorm risk assessment in the Netherlands: Evaluation of statistical dependencies between hazard and damage data, EGU General Assembly 2024, Vienna, Austria, 14–19 Apr 2024, EGU24-681, https://doi.org/10.5194/egusphere-egu24-681, 2024.

EGU24-3045 | Posters on site | NH9.2

Applying Mobile Phone Data on Seismic Disaster Reduction 

Sheu-Yien Liu and Ming-Wey Huang

To grasp specific population distribution information is crucial for accurate impact assessments and preparedness planning on natural disasters. With the high popularization of mobile phones, it is possible to know the distribution trend of the people movement in different regions. The mobile phone data from Chunghwa Telecom (the telecommunications company with largest market share in Taiwan) displayed in 500m×500m grids gives the spatiotemporal distribution of people around the Taiwan area on the geographic information system (GIS). Combined with immediate reception of earthquake intensity distribution map, not only can the number of people at risk be more accurately estimated, but also the abnormal flow of people can be highlighted in areas, and then provide real-time warning messages. Except for the real-time crowd data, the historical data from one year of 2018, which is converted into weekly crowd data, are also provided for the purpose of seismic disaster scenarios to improve the precision of relief needs by the grid-base earthquake impact assessment technology of TERIA (Taiwan Earthquake Impact Research and Information Application Platform, established by NCDR) for enhancing the disaster resilience against future major earthquakes.

How to cite: Liu, S.-Y. and Huang, M.-W.: Applying Mobile Phone Data on Seismic Disaster Reduction, EGU General Assembly 2024, Vienna, Austria, 14–19 Apr 2024, EGU24-3045, https://doi.org/10.5194/egusphere-egu24-3045, 2024.

EGU24-3851 | ECS | Posters on site | NH9.2

Development of the Methodology to Identify Potential Modes of Dam Failure and to Estimate Structural Health of Water Management Dams 

Mateja Klun, Žiga Begelj, and Andrej Kryžanowski

Here we present the project activities of an ongoing project aiming at the identification of potential failure modes of dams and the development of the methodology to be applied on water management dams in Slovenia. Water is the most important natural resource for human existence, while changes in hydrological conditions have an impact on the water balance and require innovative approaches in water management. There are currently 68 registered infrastructure facilities in Slovenia, 42 of which meet the criteria of large dams or are subject to a special regime for operational safety as critical infrastructure. According to the Slovenian National Committee for Large Dams the average age of our dams is already more than 45 years.

Objectives of the project proposal, which will last 24 months, are the following: the analysis of the current state of the practice in the field of dam surveillance in Slovenia, provision of a summary document with a set of potential failure mechanisms for each type of dams, and development of a methodology for identifying failure mechanisms and monitoring the condition of dams. Monitoring of dams is regularly carried out in Slovenia, at least in the form of technical monitoring of the structures. However, we must note that professional knowledge of the operational safety of dams has advanced considerably since the time when most of the dams in Slovenia were built. In particular, the understanding of dam safety has changed and is now understood in a broader sense, encompassing the safety of the dam and auxiliary structures under all conditions throughout its life cycle, as well as the safety of the population and the environment in the dams' impact area. The lifetime of dams is very long, and sound structural management improves their structural health of dams and extends their service life.

The main output of the project is the development of the methodology for identification of potential failure modes. The steps of the methodology will also be implemented on at least 3 pilot cases and will be presented to the professional public and to institutions working in the field of dams and dam engineering. The project addresses both the World Declaration on Dam Safety, (Porto, 2019), and the World Declaration Water Storage for Sustainable Development, from (Kyoto, 2012). The authors acknowledge that the research is financially supported by the Slovenian Research and Innovation Agency research project No. V2-2340 and by the Ministry of Natural Resources and Spatial Planning.

How to cite: Klun, M., Begelj, Ž., and Kryžanowski, A.: Development of the Methodology to Identify Potential Modes of Dam Failure and to Estimate Structural Health of Water Management Dams, EGU General Assembly 2024, Vienna, Austria, 14–19 Apr 2024, EGU24-3851, https://doi.org/10.5194/egusphere-egu24-3851, 2024.

EGU24-5387 | ECS | Orals | NH9.2 | Highlight

High-resolution Downscaling of Disposable Income in Europe using Open-source Data 

Mehdi Mikou, Améline Vallet, Céline Guivarch, and David Makowski

Poverty maps have been extensively used for identifying populations vulnerable to global changes. The frequency and intensity of extreme events are likely to increase in coming years as a result of climate change. In this context, several studies have hypothesized that the economic and social impact of extreme events depends on income. However, to rigorously test this hypothesis, it is necessary to have income data on a fine spatial scale, compatible with the analysis of extreme climatic events. In order to produce reliable high-resolution income data, we have developed an innovative machine learning framework, based on random forests, that we applied to produce a 1 km-gridded dataset of disposable income for 2015 in Europe. This dataset was generated by downscaling disposable income data available for more than 120,000 administrative units. Our learning framework showed high accuracy levels, and outperformed other existing approaches used in the literature for downscaling income. Using SHAP values, we explored the contribution of the model input factors to income predictions and found that, in addition to geographic inputs (country, latitude, longitude), distance to public transport or nighttime light intensity were key drivers of income predictions. Finally, we illustrated how this new dataset can help identifying poverty areas in Europe. More broadly, this dataset offers an opportunity to explore the relationships between economic inequality and environmental degradation in health, adaptation or urban planning sectors. It can also facilitate the development of future income maps that align with the Shared Socioeconomic Pathways, and ultimately enable the assessment of future climate risks.

How to cite: Mikou, M., Vallet, A., Guivarch, C., and Makowski, D.: High-resolution Downscaling of Disposable Income in Europe using Open-source Data, EGU General Assembly 2024, Vienna, Austria, 14–19 Apr 2024, EGU24-5387, https://doi.org/10.5194/egusphere-egu24-5387, 2024.

EGU24-8752 | ECS | Orals | NH9.2 | Highlight

Identifying global biases in hydro-hazard research by mining the scientific literature 

Lina Stein, S. Karthik Mukkavilli, Birgit M. Pfitzmann, Peter W. J. Staar, Ugur Ozturk, Cesar Berrospi, Thomas Brunschwiler, and Thorsten Wagener

Floods, droughts, and rainfall-induced landslides are hydro-geomorphic hazards that affect millions of people every year. These hazards are therefore heavily researched topics with several hundred thousand articles published. The large number of published articles means identifying existing gaps is a challenge, especially regarding research specific to local risk conditions and impacts. How well does hydro-geomorphic hazard research cover heavily impacted regions, different hydro-climatic processes, or relevant socio-economic aspects? In this work, we use natural language processing to search a database of 100 million abstracts for mentions of floods, droughts, and landslides. We annotate all hazards and location mentions and geolocate each study via Nominatim. We use this information to create global gridded research densities for the three hazards based on all study locations from 293,156 abstracts. We then compare research density to environmental, socio-economic, and disaster impact data. The global distribution of research is heavily influenced by human activity, national wealth, data availability, and population distribution. Countries that have been heavily impacted by hydro-geomorphic hazards in the past have a higher research density. However, this relationship strongly depends on country wealth. In low-income countries 100 times more people need to be affected before a comparable research density to high-income countries is reached. This disparity needs to be addressed to reduce disaster impact and adapt to changing conditions in the future. We here give guidance for which regions and hydro-climatic conditions an increased research focus on hydro-geomorphic hazards is most urgent.

How to cite: Stein, L., Mukkavilli, S. K., Pfitzmann, B. M., Staar, P. W. J., Ozturk, U., Berrospi, C., Brunschwiler, T., and Wagener, T.: Identifying global biases in hydro-hazard research by mining the scientific literature, EGU General Assembly 2024, Vienna, Austria, 14–19 Apr 2024, EGU24-8752, https://doi.org/10.5194/egusphere-egu24-8752, 2024.

The Central American Dry Corridor (CADC) spans Guatemala, Honduras, El Salvador, Costa Rica, and Nicaragua. Over half of the population in this region is engaged in agricultural activities, with more than 73% of the rural population living in poverty, and 7.1 million people experiencing severe food insecurity. The increasingly frequent droughts exacerbate the challenges faced by agricultural production in this area. Long-term series of agricultural drought mapping can assist agricultural planners in minimizing the impact of drought on production. Based on data from the Moderate Resolution Imaging Spectroradiometer (MODIS) spanning from 2001 to 2021, this study will utilize the Vegetation Health Index to map agricultural drought in CADC at monthly, seasonal, and interannual scales. Multi-temporal agricultural drought mapping will reveal the spatiotemporal distribution patterns of agricultural drought in CADC over the past 20 years. Additionally, the study will employ the Mann-Kendall test and Sens' slope estimator to simulate the changing trends of agricultural drought, aiming to identify regions where agricultural drought is worsening.

How to cite: Qiu, J. and Tarolli, P.: Long-term agricultural drought monitoring in the Central America Dry Corridor using Vegetation Health Index, EGU General Assembly 2024, Vienna, Austria, 14–19 Apr 2024, EGU24-9901, https://doi.org/10.5194/egusphere-egu24-9901, 2024.

EGU24-10678 | ECS | Orals | NH9.2

Leveraging Multi-Sector Needs Assessments to Assess Dynamic Social Vulnerability: A Methodological Exploration 

Jean-Baptiste Bove, Silvia De Angeli, Lorenzo Massucchielli, and Davide Miozzo

In the context of escalating climate change impacts, conflicts, urbanization, and the complex interplay between ecological, physical, human, and technological systems, this research explores an innovative methodology for the assessment of dynamic social vulnerability for disaster risk assessment and management by exploiting Multi-Sector Needs Assessments (MSNA) data. Current frameworks for assessing social vulnerability frequently exhibit a hazard-specific focus and are not often generalizable because of differences in methodologies or limits in data availability. Moreover, they often fail to incorporate the dynamic nature of vulnerability, and neglect the inclusion of critical context-specific elements. The proposed research addresses these limitations by exploring the innovative application of MSNAs conducted by humanitarian organizations for assessing dynamic social vulnerability. MSNAs, by providing data across various sectors and geospatial scales, offer an underutilized resource for understanding the multi-dimensional and dynamic aspects of vulnerability in crisis-affected contexts. The use of MSNA data, which includes repeated assessments over time and disaggregation by different population groups and geographic levels, presents new opportunities to understand how and why social vulnerability can change over time. This research aims to address the methodological challenges of data accessibility,  standardization, comparability, and representation of socio-economic factors by proposing an innovative way of constructing a social vulnerability index based on MSNA data and indicators that can capture and reflect changes in social vulnerability over time. This approach will be demonstrated through a case study, providing a practical illustration of how dynamic social vulnerability can be effectively measured and analyzed using MSNA data. The research will also highlight how the methodology can be replicated to any other country for which MSNA data is available. By bridging the gap between crisis-driven needs assessments and long-term social vulnerability analysis, this study contributes to more informed, context-specific, and timely strategies in disaster risk management, humanitarian response and policy-making. The findings are expected to enhance the understanding of social vulnerability in varied contexts, highlighting the dynamic nature of vulnerability from a multi-risk and multi-hazard perspective.

How to cite: Bove, J.-B., De Angeli, S., Massucchielli, L., and Miozzo, D.: Leveraging Multi-Sector Needs Assessments to Assess Dynamic Social Vulnerability: A Methodological Exploration, EGU General Assembly 2024, Vienna, Austria, 14–19 Apr 2024, EGU24-10678, https://doi.org/10.5194/egusphere-egu24-10678, 2024.

EGU24-12391 | ECS | Orals | NH9.2

Developing a micro-scale population exposure model: insights from the Italian context 

Sara Rrokaj, Daniela Molinari, Francesco Ballio, Alice Gallazzi, Stefano Annis, Maria Grazia Badas, Anna Rita Scorzini, and Marco Zazzeri

The increasing impacts of climate change and urbanization underscore the critical importance of micro-scale population data for enhancing natural risk management and emergency preparedness. Access to high resolution population information enables better correlation with the spatial variability of hazards, leading to more accurate damage estimations. However, such data are typically available at macro and meso-scales. In the case of Italy, for example, population data from the National Institute of Statistics (ISTAT) is provided at the census tract scale (meso-scale) for the entire country, despite the uneven distribution of residents within these areas. This study focuses on developing an exposure model for resident population in Italy at a finer spatial resolution than the currently available data. The model uses point data of resident population in the Emilia Romagna region, relating this information to residential building footprint area and volume, as well as land use features. The analysis reveals a notable portion of vacant residential buildings, with approximately 30% of Italian residential buildings reported as uninhabited by ISTAT. The study suggests that incorporating information on the type of residential buildings (main, secondary, or vacant) could significantly enhance the model's performance, especially in tourist-centric cities characterized by a high share of holiday houses. Additionally, the results of this study highlight the need for public entities to invest efforts in the development of a reliable and comprehensive spatial database that includes information on permanently inhabited properties.

How to cite: Rrokaj, S., Molinari, D., Ballio, F., Gallazzi, A., Annis, S., Badas, M. G., Scorzini, A. R., and Zazzeri, M.: Developing a micro-scale population exposure model: insights from the Italian context, EGU General Assembly 2024, Vienna, Austria, 14–19 Apr 2024, EGU24-12391, https://doi.org/10.5194/egusphere-egu24-12391, 2024.

EGU24-12963 | ECS | Orals | NH9.2

Systemic human-biosphere-atmosphere monitoring and diagnostics 

Wantong Li, Gregory Duveiller, Fabian Gans, Dorothea Frank, and Markus Reichstein

Here we propose a planetary health diagnostic framework, which aims to track, understand, and characterize the Earth system during the onset and progression of both chronic change (such as climate change) and abrupt disruptions (stemming from climate extremes and socio-economic shocks). However, monitoring a single component of the Earth system to guide policy, but ignoring other essential components, could lead to misleading diagnostics and maladaptation. To gain insights into the integration of climate, biosphere, and society, we apply an interactive dimensionality reduction to the annual variability of multi-stream global data from 2003-2022, including data representing the biosphere and climate combined with national socio-economic indicators.

We find that the interactions between biosphere, atmosphere and socio-economy can be captured by three principal axes, which cumulatively explain 17.3%, 22.8% and 24.5% of the variability condensed by non-interactive dimensionality reduction in each individual domain, respectively. First principal components are related to long-term trends in global warming, land surface dimming, and socio-technical development, while the second and third components are related to changes of other processes under climate and biospheric extremes and socioeconomic shocks. These processes include vegetation dynamics, land surface and atmospheric water demand, life and environmental inequality. We find distinct trajectories across countries with the most distinct cluster is Middle East and North Africa that exhibit climate extremes in 2010 and 2016, socio-financial shocks between 2010-2012 and COVID-19 in 2020. This study advocates for a data-driven paradigm to jointly monitor the recent trajectories of the biosphere, atmosphere, and society that could provide a better understanding and early warning of the state of the Earth system for human well-being.

How to cite: Li, W., Duveiller, G., Gans, F., Frank, D., and Reichstein, M.: Systemic human-biosphere-atmosphere monitoring and diagnostics, EGU General Assembly 2024, Vienna, Austria, 14–19 Apr 2024, EGU24-12963, https://doi.org/10.5194/egusphere-egu24-12963, 2024.

EGU24-13968 | Posters virtual | NH9.2

Flood Severity, Socio-Economic Impacts, and Elevation Strategy Effectiveness in a Subset of Louisiana Post-Hurricanes Katrina and Rita 

Ayat Al Assi, Rubayet Bin Mostafiz, Carol J. Friedland, and Fuad Hasan

FEMA's Hazard Mitigation Grant Program (HMGP) assisted survivors of Hurricanes Katrina and Rita, necessitating a 25% homeowner contribution for post-disaster home elevation. The federal Community Development Block Grant Disaster Recovery (CDBG-DR) program allocated $13.4 billion to Louisiana, offering $30K grants per home, aligning with HMGP needs. This study focused on elevated residential homes in a subset of Louisiana's housing data, aiming to understand the intersection of flood risk when disaggregated by frequency, vulnerable populations, and mitigation costs.

The analysis investigating the correlation between flood frequency/severity and variables such as race and ethnicity, and socioeconomic status, exploring their interconnections. Subsequently, we explored how flood risk changed both pre- and post-implementation of elevation strategies across various return periods, aiming to determine the proportional attribution of the total AAL to these different periods. Additionally, it examined the comparative flood risk before and after elevation strategies across diverse socioeconomic statuses. Finally, it analyzed the absolute benefits of elevation strategies, particularly the avoided AAL, compared with investment values and socioeconomic statuses.

The result of this study indicates that Poverty levels remain consistent across different return periods, a notable increase in Non-white population percentages with longer return periods, and a peak in Renters' percentage at floods with a return period of ≥200 years. It’s demonstrated that a substantial percentage of the total AAL is attributed to less frequent but more severe events—those occurring with return periods between 100 and 500 years, as well as those with return periods greater than 500-year. The results show inconsistencies in the Avoided AAL values across different investment levels suggest that the relationship between investment in elevation costs and Avoided AAL is not directly proportional.

The study results provide multifaceted insights, aiding in the identification of vulnerable communities and offering guidance for resource allocation decisions, and demonstrating the impact of elevation strategies. The economic analysis enhances understanding of federal mitigation investments' cost-effectiveness across diverse socio-economic statuses.


How to cite: Al Assi, A., Mostafiz, R. B., Friedland, C. J., and Hasan, F.: Flood Severity, Socio-Economic Impacts, and Elevation Strategy Effectiveness in a Subset of Louisiana Post-Hurricanes Katrina and Rita, EGU General Assembly 2024, Vienna, Austria, 14–19 Apr 2024, EGU24-13968, https://doi.org/10.5194/egusphere-egu24-13968, 2024.

EGU24-14637 | Posters on site | NH9.2

A systems approach for holistic resilience building 

Alison Sneddon

Resilience for Social Systems (R4S) is an approach to analyse the resilience of socioeconomic systems. Societies are made up of socio-economic systems which service the needs of their populations, and addressing recurrent crises and effectively building resilience requires an integrated systems approach. Where these systems are fragile and large portions of the population are socially or economically marginalized, communities are highly susceptible to external shocks and stresses; coordination among stakeholders to strengthen these systems will ultimately improve resilience and lead to resilient and inclusive development.

The R4S approach to resilience helps to understand how various system components (stakeholders, resources, regulations) interact and interconnect, as well as assessing the potential impacts from risk scenarios. In other words, when applying the R4S Approach to build resilience, the user can anticipate better how natural hazards can trigger economic shocks, how conflicts can leave people more exposed to additional shocks or stresses (e.g., an outbreak of cholera can be triggered when water, sanitation and hygiene systems are destroyed or become inaccessible), and how long-term stresses such as environmental degradation can lower agricultural productivity, weakening food security and income levels, and impacting a household’s ability to pay for health care or education.

Understanding these dynamics is critical to deliver better programming that addresses root causes of constraints rather than symptoms alone. The R4S Approach is based on best practice in Systems Thinking, Network Theory, Scenario Thinking, Social and Behaviour Change, Inclusion and Resilience approaches and provides a logical step by step process for assessing resilience of socio-economic systems.

This presentation will provide an overview of the R4S, the innovations in the assessment of complex and interlinked vulnerabilities it provides, and practical examples drawn from GOAL’s experience of conducting the assessment and implementing resilience-building strategies based on the needs and opportunities identified.

How to cite: Sneddon, A.: A systems approach for holistic resilience building, EGU General Assembly 2024, Vienna, Austria, 14–19 Apr 2024, EGU24-14637, https://doi.org/10.5194/egusphere-egu24-14637, 2024.

EGU24-15543 | ECS | Orals | NH9.2 | Highlight

Collection, Standardization and Attribution of Robust Disaster Event Information — A Demonstrator of a National Event-Based Loss and Damage Database in Austria 

Dominik Imgrüth, Katharina Enigl, Matthias Themessl, and Stefan Kienberger

Loss and damage databases are essential tools for disaster risk management in order to make informed decisions. However, even in data-rich countries such as Austria, there has been no consistent and curated multi-hazard database to date. Based on the demands of the United Nations, the European Union and national requirements for monitoring and managing the effects of disasters, the CESARE project (funded by KIRAS/FFG; project end 02/2022) designed and developed a demonstrator for a consistent national event-based damage database. This demonstrator enables event identification, loss and damage monitoring and assessment according to international standards and offers the possibility of disaster forensics. The CESARE system is based on existing data collected by administrations as well as federal authorities which are consolidated according to a common data model. By this means, the primary data and the data collection procedures are not affected and a sustainable exchange of data is made possible. The demonstrator currently focuses on two Austrian federal states, three hazard types - floods, storms and mass movements - and the period between 2005 and 2018. By analysing over 140,000 individual event descriptions, we demonstrated that - despite some limitations in retrospective data harmonisation - the implementation of an event-based national damage database is feasible and offers considerable added value compared to the use of individual data records. The demonstrator will in future substantially support quantitative analysis in the context of the national risk assessment, national UNDRR-Sendai monitoring and disaster risk management at federal level by providing the best possible harmonised damage information, tailored indicators and statistics as well as maps on the impact of hazards at municipal level. The CESARE system is currently being rolled out operationally as well as extended to other hazard categories and the remaining provinces of Austria. With its final implementation, CESARE will provide the most complete event and damage database in Austria.

How to cite: Imgrüth, D., Enigl, K., Themessl, M., and Kienberger, S.: Collection, Standardization and Attribution of Robust Disaster Event Information — A Demonstrator of a National Event-Based Loss and Damage Database in Austria, EGU General Assembly 2024, Vienna, Austria, 14–19 Apr 2024, EGU24-15543, https://doi.org/10.5194/egusphere-egu24-15543, 2024.

EGU24-18132 | Posters on site | NH9.2

Revealing Environmental Threats: Harmonizing Indigenous Narratives with Geomorphic Hazard Thematic Maps for Community Awareness 

Sheng-Chi Lin, Su-Min Shen, Sendo Wang, Mu-Ti Yua, Si-Chin Lin, and Chih-Hsin Chang

From the perspective of natural disaster prevention, larger-scale and higher-intensity geomorphic events often have longer recurrence intervals. The impact of these events on a region is frequently underestimated unless residents have experienced them firsthand. Consequently, the success of promoting self-reliant disaster-prepared communities by the government heavily relies on the experiences of the affected population. In this context, our study integrates government cartographic data and interprets the geomorphic evidence preserved in the landscape.

We conducted in-depth interviews with elders from indigenous tribes, leveraging their rich storytelling tradition and local residents' experiences to collect observations of environmental changes, past disaster experiences, and ancestral stories. The spirit of storytelling is incorporated into the map user manual, emphasizing a place-based approach. Using the devastating impact of Typhoon Morakot in 2009 on the Tjalja'avus Tribe in southern Taiwan as a case study, we produced a geomorphological hazard thematic map of the tribe. This map utilized national environmental mapping imagery, including landslide records, large-scale landslide-prone areas, potential debris flow streams, and high-resolution digital elevation models created by unmanned aerial vehicles LiDAR.

Through a combination of multi-temporal data visuals, we highlighted recent (within the last five years) highly active landslide locations, emphasizing dynamic geomorphic features. In the context of environmental awareness and risk communication between the government and local communities, we structured the map user manual to revolve around the narrative axis of visible terrain features in the tribal landscape and experiences or stories related to soil and rock disasters. This approach allows individuals to comprehend the geomorphic influences leading to disasters in their communities, facilitating collaboration between the government and community builders. Ultimately, our initiative aims to achieve environmental management and disaster prevention goals within indigenous communities.

How to cite: Lin, S.-C., Shen, S.-M., Wang, S., Yua, M.-T., Lin, S.-C., and Chang, C.-H.: Revealing Environmental Threats: Harmonizing Indigenous Narratives with Geomorphic Hazard Thematic Maps for Community Awareness, EGU General Assembly 2024, Vienna, Austria, 14–19 Apr 2024, EGU24-18132, https://doi.org/10.5194/egusphere-egu24-18132, 2024.

EGU24-18238 | ECS | Orals | NH9.2 | Highlight

Risk Tipping Points in an Interconnected World 

Caitlyn Eberle, Jack O'Connor, Liliana Narvaez, Melisa Mena-Benavides, and Zita Sebesvari

The convergence of multiple societal and ecological challenges threatens to push us into an uncertain, risky future. Our critical life-supporting systems, such as the human climate niche, hydrological cycles, natural ecosystems, food production, knowledge systems, and risk management tools, are all fundamentally challenged. While these systems have been continually reshaped throughout human history, the speed of change and the simultaneous changes occurring today are unprecedented. Our research shows how we are teetering on the precipice of multiple tipping points that can trigger abrupt and often irreversible changes to the systems we rely upon.

Our research provides a conceptual definition of risk tipping points as a new way to think about the risks we face and illustrates examples of how the concept can be applied. While climate tipping points refer to tipping elements of Earth systems, such as hydrological cycles or climate patterns, risk tipping points concern the socioecological systems dependent on them and when they stop being able to buffer risk and provide their expected functions. We discuss six prominent examples of risks facing these socioecological systems, such as groundwater depletion and space debris, and identify conceptual tipping points for each of them.

Furthermore, our research discusses each of these risk tipping points within a context of interconnectivity. We analyze how similar human behaviors and values are at the root of multiple risk tipping points, putting pressure on multiple systems simultaneously. Since none of these systems are isolated from each other, when one system passes a risk tipping point, it increases the overall risk across systems and may actually accelerate tipping in another system. Feedback loops between systems can amplify the impacts of risks and can create self-reinforcing dynamics that increase the speed of change. The effects of these manifesting risks may accumulate over time, causing multiple risk tipping points to overlap and increase risk even further.

Finally, our research demonstrates that any attempt to reduce risk in these systems must acknowledge and understand these underlying pressures and their interconnectivity. Actions that affect one system will likely have consequences on another, so integrated and informed solutions are necessary to avoid negative consequences. This also means that interconnectivity can be used as an advantage through solutions that provide co-benefits to address risk tipping points in multiple systems at once. Interconnected risks require interconnected solutions to ensure a safe and sustainable future for all.

How to cite: Eberle, C., O'Connor, J., Narvaez, L., Mena-Benavides, M., and Sebesvari, Z.: Risk Tipping Points in an Interconnected World, EGU General Assembly 2024, Vienna, Austria, 14–19 Apr 2024, EGU24-18238, https://doi.org/10.5194/egusphere-egu24-18238, 2024.

EGU24-18933 | ECS | Posters on site | NH9.2

A holistic examination of Disaster Risk Management in the context of volcanic risk in the Canary Islands 

María García-Vaquero, Sara García-González, Noemi Padrón-Fumero, Julia Crummy, Tamara Febles-Arévalo, and Jaime Díaz_Pacheco

Understanding the complexity of past chain events in depth and learning from them to improve
decision-making in a dynamic context can be challenging. Although efforts have been made to
address these challenges, further research is needed. Storylines have proven to be a valuable
qualitative tool not only for describing multi-hazard scenarios, understanding the system and
the interrelationships between different elements, but also for improving resilience by taking
into account lessons learned throughout the process.


The 2021 La Palma volcanic eruption, with its enduring aftermath characterised by atmospheric
gas emissions in one of the island's prime tourist locales, exemplifies the intricate challenges in
decision-making for planning, procedural execution, and organisational management. This
event highlights the extensive and profound impacts of such dynamic risks, underscoring the
need for adaptable and robust strategies in risk management and response. Our study aims to
provide a comprehensive understanding of the whole volcanic disaster in detail by integrating
the different dimensions (multi-hazard, multi-risk and systemic impacts) into the disaster risk
reduction cycle (prevention and preparedness, response and recovery). This approach provides
a holistic and proactive approach and allows for an assessment of the impact and
consequences of the decision making process in the Canary Islands at each stage over time. For
this purpose, a 20-year timeline will be used, starting in 2004 when the first seismic swarm
indicated a possible volcanic eruption in the island of Tenerife.


This research uncovers a significant shortfall in risk planning across all stages of the disaster
reduction cycle on the islands, noting a disproportionate emphasis on administrative
coordination during emergencies. The absence of preemptive measures in land-use planning,
especially in areas highly vulnerable to exposure, exacerbates the complexity of post-eruption
recovery. By thoroughly examining the decision-making processes, planning strategies, and
organisational procedures, this study aims to distil key lessons from recent experiences. Such
an endeavour enhances our comprehension of the complex interplay between decisions and
risks, providing critical insights for bolstering resilience against volcanic disasters.

How to cite: García-Vaquero, M., García-González, S., Padrón-Fumero, N., Crummy, J., Febles-Arévalo, T., and Díaz_Pacheco, J.: A holistic examination of Disaster Risk Management in the context of volcanic risk in the Canary Islands, EGU General Assembly 2024, Vienna, Austria, 14–19 Apr 2024, EGU24-18933, https://doi.org/10.5194/egusphere-egu24-18933, 2024.

EGU24-19054 | ECS | Posters on site | NH9.2

Agricultural Drought Case Study in South Korea: Selection of Rural Specialization Districts based on Principal Component Analysis 

Hyochan Kim, Hoyoung Cha, Jongjin Baik, Kihong Park, and Changhyun Jun

Recently, the frequency and severity of droughts have gradually increased due to extreme weather events and global warming. As the demand for drought management increases, field surveys and water supply are actively conducted in many countries. Given that such drought assessment and support require the consumption of labor and financial resources, the prioritization of essential agricultural areas has become a major topic for efficient decision-making in drought relief. In this study, we proposed a Principal Component Analysis (PCA) for selecting rural specialization districts across the 162 administrative regions of South Korea. Additionally, we aimed to investigate real cases of agricultural drought occurred in these regions by utilizing the survey of water supply measures derived from Ministry of Agriculture, Food and Rural Affairs. The research data comprised seven agricultural specialization factors, exemplified by agricultural workforce and infrastructure. First, we implemented singular decomposition method included in PCA process to represent the comprehensive trends of the agricultural specialization factors with maximum reflection. High value of principal component scores (PCS) estimated from PCA was interpreted as regions with high agricultural relevance. Lastly, the PCS were classified into different levels, defining top-ranking regions as rural specialization districts. Based on agricultural drought case studies from 2018 to 2021, it is expected that finding relative damage-prone areas and establishing appropriate drought responses will be feasible.

Keywords: Principal Component Analysis, Rural Specialization Districts, Agricultural Specialization Factors, Principal Components Score

Acknowledgement

This work was supported by the National Research Foundation of Korea(NRF) grant funded by the Korea government(MSIT) (No. RS-2023-00250239) and this research was supported by Korea Environment Industry & Technology Institute (KEITI) through Water Management Innovation Program for Drought (RS-2022-KE002032) funded by Korea Ministry of Environment.

This work was supported by the National Research Foundation of Korea(NRF) grant funded by the Korea government(MSIT) (No.NRF-2022R1A4A3032838).

How to cite: Kim, H., Cha, H., Baik, J., Park, K., and Jun, C.: Agricultural Drought Case Study in South Korea: Selection of Rural Specialization Districts based on Principal Component Analysis, EGU General Assembly 2024, Vienna, Austria, 14–19 Apr 2024, EGU24-19054, https://doi.org/10.5194/egusphere-egu24-19054, 2024.

EGU24-19940 * | ECS | Orals | NH9.2 | Highlight

A global database of natural hazards impacts reported in the scientific literature 

Taís Maria Nunes Carvalho, Jakob Zscheischler, Christian Kuhlicke, and Mariana Madruga de Brito

The increased frequency and magnitude of natural hazards might significantly increase social, economic, and health impacts on society in the next decades. Existing studies and databases of natural hazard impacts have several limitations, such as (1) a low level of detail on how people were affected; (2) an underestimation of the impacts; (3) a limited geographical range; and (4) a lack of information on the source of the data. However, scientific publications, reports, and handbooks compose a large data repository that can provide valuable and trustworthy information on natural hazards. We are building a global database on the impacts of natural hazards that have been documented since 1950 in the scientific literature. We mapped global research on climatological, hydrological, and meteorological extremes, such as heatwaves and floods. We retrieved over 40 thousand full-text open-access papers from ScienceDirect and Pubmed. Documents were coded according to (i) relevance: if the study describes impacts from a natural hazard, (ii) hazard class: single or multiple hazards, and (iii) event assessment: specific or multiple climate-related events. A randomly selected sample of the documents was manually labeled and a classification model was trained to classify the remaining papers. We further developed an annotation scheme for marking information on climate-related hazards in scientific publications, such as the date and location of hazard and their impacts. The inter-annotator agreement analysis shows the complexity of this task and the high annotation quality in our corpus. This work fills a critical gap in information extraction tasks within the natural hazards research domain, providing a robust foundation for future studies and analysis.

How to cite: Nunes Carvalho, T. M., Zscheischler, J., Kuhlicke, C., and Madruga de Brito, M.: A global database of natural hazards impacts reported in the scientific literature, EGU General Assembly 2024, Vienna, Austria, 14–19 Apr 2024, EGU24-19940, https://doi.org/10.5194/egusphere-egu24-19940, 2024.

Landslides cause severe impacts on society, infrastructure, and the environment globally, and their occurrence in some regions is expected to rise due to climate change. Although the cumulative impacts of landslides do not reach the level of earthquakes or floods, their disperse occurrence in space and difficult prediction pose a fundamental challenge for landslide disaster risk reduction effort. Clearly, accurate information is needed both for understanding spatiotemporal occurrence of landslides and their social impacts and responses held by societies. Documentary data are among the key sources that enable compilation of regional landslide databases, allow to quantify the landslide impacts and describe both quantitatively and qualitatively causal chains leading to increased landslide risk and the societal responses to landslide events. In this respect, the documentary data fill the time gap between the landslide occurrence in the past environments studied by proxy data, and the present-day landslides, for which different monitoring and mapping techniques may be used. Over the last decades, important progress has been made in employing various documentary data for landslide research, and extending empirical evidence about advantages and limitations is available thanks to case studies from different environmental and institutional settings. The synthesis of this progress that would guide further research is missing though. The overall goal of this paper is to broaden the perspective on the use of documentary data in historical landslide research, which has so far too much concentrated around the landslide inventories. To do so, we present a scoping literature review with three main objectives. First, we present a classification of both quantitative and qualitative approaches and related research questions in historical landslide research, linking them to key challenges in landslide disaster risk reduction. Second, we review the types and content of available documentary data sources with special attention paid to sources that have been underresearched so far. Finally, we review the quantitative and qualitative methods used to analyse the content of documentary data. While doing so, we draw also from comparative evidence in historical climatology and hydrology in order to point to methods that may hold a potential, but have not been validated in landslide research yet. The paper concludes with identifying challenges and pathways for future research.  

How to cite: Raška, P.: Recent progress in the use of documentary data in landslide research: a review of approaches, sources, and methods , EGU General Assembly 2024, Vienna, Austria, 14–19 Apr 2024, EGU24-20289, https://doi.org/10.5194/egusphere-egu24-20289, 2024.

EGU24-12 | ECS | Posters on site | NH9.1 | Highlight

Understanding fatal landslides on a global scale: insights from topographic, climatic, and anthropogenic perspectives 

Seckin Fidan, Hakan Tanyas, Abdullah Akbas, Luigi Lombardo, David N. Petley, and Tolga Gorum

Landslides are a common global geohazard that lead to substantial loss of life and socio-economic damage annually. Landslides are becoming more common due to climate change and anthropogenic disturbance, threatening sustainable development in vulnerable areas. Previous studies on fatal landslides have focussed on inventory development; spatial and temporal distributions; the role of precipitation and/or seismic forcing; and human impacts. However, their climatological, topographic, and anthropogenic characterization on a global scale has been neglected. Here, we present the association of natural and anthropogenically induced landslides in the Global Fatal Landslide Database (GFLD) with topographic, climatic, and anthropogenic factors, focusing on their persistent spatial patterns. The majority of natural (69.3%) and anthropogenic (44.1%) landslides occur in mountainous areas in tropical and temperate regions, which are also characterized by the highest casualty rates per group (66.7% and 43.0%, respectively). However, they significantly differ in terms of their morphometric footprint. Fatal landslides triggered by natural variables occur mostly in the highest portions of the topographic profile, where human disturbance is minimal. As for their anthropogenic counterpart, these failures cluster at much lower altitudes, where slopes are gentler, but human intervention is greater due to a higher population density. Our results demonstrate that fatal landslides have a heterogeneous distribution on different macro landforms characterized by different topographic, climatic, and population conditions. Our observations also point towards land cover changes being a critical factor in landscape dynamics, stressing human pressure as a discriminant cause/effect term for natural vs. human-induced landslide fatalities.

How to cite: Fidan, S., Tanyas, H., Akbas, A., Lombardo, L., Petley, D. N., and Gorum, T.: Understanding fatal landslides on a global scale: insights from topographic, climatic, and anthropogenic perspectives, EGU General Assembly 2024, Vienna, Austria, 14–19 Apr 2024, EGU24-12, https://doi.org/10.5194/egusphere-egu24-12, 2024.

EGU24-1451 | ECS | Posters on site | NH9.1

A vulnerability framework for a global flood catastrophe model 

Conor Lamb, Izzy Probyn, Oliver Wing, James Daniel, Florian Elmer, and Malcolm Haylock

In recent years the precision and skill of global flood hazard models has increased dramatically. This, alongside developments allowing for hazard model conversion to stochastic event sets and the open-sourcing of catastrophe modeling software, have opened up the possibilities of developing detailed and skillful global flood catastrophe models; assessing not just average risk but also the possible impacts of major flood events and the probability distribution of annual losses. In order to realize these possibilities, it is necessary to develop a global vulnerability framework that appropriately represents the state of the art in vulnerability modeling whilst being flexible to user inputs and faithfully representing uncertainties. 

Here, we present a framework for implementing a flexible vulnerability module within a global flood catastrophe model. Vulnerability curves are derived for a variety of occupancies (residential, commercial, industrial), for both building and contents losses. The mean loss ratio curves are derived from literature and commercial datasets before being normalized and fit to a family of logarithmic functions of depth, which can be adjusted for varying property characteristics. Uncertainty distributions are parameterised using a 4 parameter beta model and derived from a large insurance claims dataset (~2 million claims). 

Finally, using the same large claims dataset, we explore the event-level correlation of the quantiles sampled within our uncertainty distribution. Specifically, we evaluate the extent to which the quantiles sampled of the uncertainty distribution, in a Monte Carlo approach, should be clustered for each event. This is vital for correctly estimating the losses from rare, high-impact events and allows for a realistic representation of vulnerability uncertainty in aggregate loss estimates. 

How to cite: Lamb, C., Probyn, I., Wing, O., Daniel, J., Elmer, F., and Haylock, M.: A vulnerability framework for a global flood catastrophe model, EGU General Assembly 2024, Vienna, Austria, 14–19 Apr 2024, EGU24-1451, https://doi.org/10.5194/egusphere-egu24-1451, 2024.

EGU24-1669 | ECS | Posters on site | NH9.1

A Comprehensive Review of Coastal Compound Flooding Literature 

Joshua Green, Ivan Haigh, Niall Quinn, Jeff Neal, Thomas Wahl, Melissa Wood, Dirk Eilander, Marleen de Ruiter, Philip Ward, and Paula Camus

Compound flooding, where the combination or successive occurrence of two or more flood drivers leads to an extreme impact, can greatly exacerbate the adverse consequences associated with flooding in coastal regions. This paper reviews the practices and trends in coastal compound flood research methodologies and applications, as well as synthesizes key findings at regional and global scales. Systematic review is employed to construct a literature database of 271 studies relevant to compound flood hazards in a coastal context. This review explores the types of compound flood events, their mechanistic processes, and synthesizes the definitions and terms exhibited throughout the literature. Considered in the review are six flood drivers (fluvial, pluvial, coastal, groundwater, damming/dam failure, and tsunami) and five precursor events and environmental conditions (soil moisture, snow, temp/heat, fire, and drought). Furthermore, this review summarizes the trends in research methodology, examines the wide range of study applications, and considers the influences of climate change and urban environments. Finally, this review highlights the knowledge gaps in compound flood research and discusses the implications of review findings on future practices. Our five recommendations for future compound flood research are to: 1) adopt consistent definitions, terminology, and approaches; 2) expand the geographic coverage of research; 3) pursue more inter-comparison projects; 4) develop modelling frameworks that better couple dynamic earth systems; and 5) design urban and coastal infrastructure with compound flooding in mind. We hope this review will help to enhance understanding of compound flooding, guide areas for future research focus, and close knowledge gaps.

How to cite: Green, J., Haigh, I., Quinn, N., Neal, J., Wahl, T., Wood, M., Eilander, D., de Ruiter, M., Ward, P., and Camus, P.: A Comprehensive Review of Coastal Compound Flooding Literature, EGU General Assembly 2024, Vienna, Austria, 14–19 Apr 2024, EGU24-1669, https://doi.org/10.5194/egusphere-egu24-1669, 2024.

Translation of geoscience research into tangible changes, such as modified decisions, processes or policy in the wider world is an important yet notably difficult process. Co-RISK is an accessible (i.e. open access, paper-based, zero cost) ‘toolkit’ for use by stakeholder groups within workshops, which is intended to aid this translation process. It is given a robust basis by incorporating paradox theory from organisation studies, which deals with navigating the genuine tensions between industry and research organizations that stem from their differing roles. Specifically designed to ameliorate the organizational paradox, a Co-RISK workshop draws up ‘Maps’ including key stakeholders (e.g. regulator, insurer, university) and their positionality (e.g. barriers, concerns, motivations), and identifies exactly the points where science might modify actions. Ultimately a Co-RISK workshop drafts simple and tailored project-specific frameworks that span from climate to hazard, to risk, to implications of that risk (e.g. solvency). The action research approach used to design Co-RISK (with Bank of England, Aon, Verisk), its implementation in a trial session for the insurance sector and its intellectual contribution are described and evaluated. The initial Co-RISK workshop was well received, so application is envisaged to other sectors (i.e. transport infrastructure, utilities, government).  Joint endeavours enabled by Co-RISK could fulfil the genuine need to quickly convert the latest insights from environmental research into real-world climate change adaptation strategies. 


https://egusphere.copernicus.org/preprints/2023/egusphere-2023-1251/

How to cite: Hillier, J. K. and van Meeteren, M.: Co-RISK: A tool to co-create impactful university-industry projects for natural hazard risk mitigation, EGU General Assembly 2024, Vienna, Austria, 14–19 Apr 2024, EGU24-1684, https://doi.org/10.5194/egusphere-egu24-1684, 2024.

EGU24-2009 | ECS | Orals | NH9.1

Considering aftershock-induced damage accumulation in seismic loss assessments 

Corentin Gouache and Adélaïde Allemand

This work outlines a methodology developed for considering aftershock-induced damage accumulation in seismic loss assessments. In particular, it adapts this methodology to the case of reinforced concrete (RC) frames in mainland France and incorporates it to an already-developed seismic loss assessment model.

The methodology consists in dividing the RC buildings into sub-categories of buildings, depending on parameters influencing the vulnerability of the structures. For each category, a set of discrete damage states is defined. For each state Di, fragility functions are derived, enabling to compute the probability of transitioning to another damage state Di+1, knowing the intensity of the ground motion. Therefore, this methodology allows to estimate the final damage state reached by a structure submitted to a series of ground motions.

In order to do so, the pool of French RC buildings is analysed so as to create realistic and general models of RC frames. Ground motions are selected from an open database, following some criteria. Fragility functions are then derived (for each type of building) by applying numerous ground motions to the models and assessing the probabilities of reaching each damage state. The methods for constructing those fragility functions are evaluated from the literature. The choice of relevant parameters measuring damage and measuring ground motion intensity is also scrutinized.

How to cite: Gouache, C. and Allemand, A.: Considering aftershock-induced damage accumulation in seismic loss assessments, EGU General Assembly 2024, Vienna, Austria, 14–19 Apr 2024, EGU24-2009, https://doi.org/10.5194/egusphere-egu24-2009, 2024.

EGU24-5951 | ECS | Posters on site | NH9.1

Three-dimensional analysis of air temperature of the Hualien M6.9 earthquake based on the tidal forces 

Xian Lu, Weiyu Ma, and Zhengyi Yuan

The Hualien M6.9 earthquake on September 18, 2022 was calculated based on the additional tectonic stress caused by celestial tidal-generating forces (ATSCTF) model. The period of celestial tidal-generating forces was the time background of the air temperature calculation, and the air temperature variation of three-dimensional layered before and after the Hualien earthquake was studied combined with the air temperature data from the National Center for Environmental Prediction (NCEP) of United States. According to the changes of ATSCTF, the Hualien earthquake occurred within the Period B among the three periods: Period A, Period B, and Period C. The air temperature stratification changes during these three periods were calculated separately, and the results showed that on September 12 in Period B, a temperature increase phenomenon began to occur near the epicenter of the Hualien earthquake. On September 13, the air temperature increase anomaly was significant, and the amplitude and area of the temperature enhancement anomaly increased. On September 14th and 15th, the anomaly gradually weakened and disappeared, and the change of the air temperature anomaly followed the seismic thermal anomaly law caused by tectonic movement: the air temperature closer to the land’s surface had a greater anomaly amplitude and a wider anomaly range; as the altitude increases, the air temperature gradually decreases, and the range of anomalies gradually reduces until it disappears. Meanwhile, there were also high temperature anomalies on September 4 and 5 in the Period A, as well as October 1 to October 4 in the Period C. However, the amplitude and area of the warming anomalies in the upper atmosphere were larger than those near the land surface, which did not conform to the seismic thermal anomaly law caused by tectonic movements and did not belong to the seismic thermal anomalies. In addition, the solar geomagnetic KP index in the study area was relatively low during Period B, indicating that it was in a calm period of solar geomagnetic.

How to cite: Lu, X., Ma, W., and Yuan, Z.: Three-dimensional analysis of air temperature of the Hualien M6.9 earthquake based on the tidal forces, EGU General Assembly 2024, Vienna, Austria, 14–19 Apr 2024, EGU24-5951, https://doi.org/10.5194/egusphere-egu24-5951, 2024.

EGU24-7652 | ECS | Posters on site | NH9.1

A semi-automatic natural language tool to minimize systematic biases in geo-hydrological disaster datasets in tropical Africa 

Bram Valkenborg, Olivier Dewitte, and Benoît Smets

The high susceptibility to geo-hydrological hazards in tropical Africa and their impacts remain poorly documented in existing disaster databases. Only impactful events with high attention are manually reported, creating systematic biases. Natural Language Processing has the potential to automate the documentation of geo-hydrological disasters. This research focuses on developing a semi-automated tool to extract information from online press and social media posts. Fine-tuned Large Language Models perform a series of tasks, such as question-answering, zero-shot classification, and near-entity recognition, to extract information from these online sources. A three-step approach is proposed for the detection of events: (1) filtering posts or articles on their relevancy, (2) extracting information on the location, timing, and impact and (3) merging and sorting information to document identified events into a structured disaster database. Shortcomings compared to a manual approach remain. These mainly relate to the complexity of the text or toponymic ambiguity when geocoding events. The tool is therefore complementary to other information-gathering approaches. These new sources of information will improve our understanding of the distribution of disasters related to geo-hydrological hazards, especially in data scarce context. Future work will combine this semi-automated tool with remote sensing and citizen science data, to further reduce systematic biases in disaster datasets.

How to cite: Valkenborg, B., Dewitte, O., and Smets, B.: A semi-automatic natural language tool to minimize systematic biases in geo-hydrological disaster datasets in tropical Africa, EGU General Assembly 2024, Vienna, Austria, 14–19 Apr 2024, EGU24-7652, https://doi.org/10.5194/egusphere-egu24-7652, 2024.

EGU24-7875 | ECS | Orals | NH9.1

Advancing drought detection and management using ML enhanced impact-based drought indexes 

Martina Merlo, Matteo Giuliani, Yiheng Du, Ilias Pechlivanidis, and Andrea Castelletti

Drought is a slowly developing natural phenomenon that can occur in all climatic zones and propagates through the entire hydrological cycle with long-term socio-economic and environmental impacts. Intensified by anthropogenic climate change, drought has become one of the most significant natural hazards in Europe. Different definitions of drought exist, i.e. meteorological, hydrological, and agricultural droughts, which vary according to the time horizon and the variables considered. Just as there is no single definition of drought, there is no single index that accounts for all types of droughts. Consequently, capturing the evolution of drought dynamics and associated impacts across different temporal and spatial scales remains a critical challenge.

In this work, we first analyze different state-of-the-art standardized drought indexes in terms of their ability in detecting drought events at the pan-European scale, using hydro-meteorological variables from the E-HYPE hydrological model and forced with the HydroGFD v2.0 reanalysis dataset over the period 1993-2018. The findings suggest the need of adjusting the formulation of traditional drought indexes to better capture and represent drought-related impacts. Specifically, here we use the FRamework for Index-based Drought Analysis (FRIDA), a Machine Learning approach that allows the design of site-specific indexes to reproduce a surrogate of the drought impacts in the considered area, here represented by the Fraction of Absorbed Photosynthetically Active Radiation Anomaly (FAPAN). FRIDA builds a novel impact-based drought index combining all the relevant available information about the water circulating in the system identified by means of a feature extraction algorithm.

Our results reveal a general pattern among different indexes, that Southern England, Northern France, and Northern Italy are the regions with the highest number of drought events, whereas the areas experiencing longest drought durations are instead the Baltic Sea region and Normandy. Clustering the 35,408 European basins according to dominant hydrologic processes reveals that the variables mainly controlling the drought process vary across clusters. Similarly, we obtain diverse correlation between standardized drought indexes and the FAPAN in different clusters. Numerical results also show that, in one of the worst cases (cluster 10), the FRIDA index increases the correlation with FAPAN from 0.16 to 0.69. Lastly, the FRIDA indexes are computed for different climatic projections to investigate future trends in drought impacts.  Results show divergence with respect to the trends of the standardized drought indexes, with correlation values below 0.30. In conclusion, these findings can contribute in advancing drought-related climate services by enabling the analysis of projected drought impacts.


How to cite: Merlo, M., Giuliani, M., Du, Y., Pechlivanidis, I., and Castelletti, A.: Advancing drought detection and management using ML enhanced impact-based drought indexes, EGU General Assembly 2024, Vienna, Austria, 14–19 Apr 2024, EGU24-7875, https://doi.org/10.5194/egusphere-egu24-7875, 2024.

EGU24-8660 | ECS | Orals | NH9.1 | Highlight

Assessing landslide risk on a Pan-European scale 

Francesco Caleca, Luigi Lombardo, Stefan Steger, Ashok Dahal, Hakan Tanyas, Federico Raspini, and Veronica Tofani

Assessing landslide risk is a fundamental step in planning prevention and mitigation actions in mountainous landscapes. To date, most landslide risk analyses address this topic at the scale of a slope or catchment. Whenever the scale involves regions, nations, or continents, the landslide risk analysis is hardly implemented. To test this theoretical framework, we present a practical case study, represented by the European landscape. In this contribution, we take the main Pan-European mountain ranges and provide an example of risk assessment at a continental scale. We consider challenges like cross-national variations landslide mapping and digital data storage. A two-stepped protocol is developed to identify areas more prone to failure. With this initial information, we then model the possible economic consequences, particularly in terms of human settlements and agricultural areas, as well as the exposed population. The analytical protocol firstly results in an unbiased landslide susceptibility map, which is combined with economic and population data. The landslide risk is presented in both the spatial distribution of possible economic losses and the identification of risk hotspots. The latters are defined through a bivariate classification scheme by combining the landslide susceptibility and exposure of human settlements. Ultimately, the exposed population is represented during the two sub-daily cycles across the study area.

How to cite: Caleca, F., Lombardo, L., Steger, S., Dahal, A., Tanyas, H., Raspini, F., and Tofani, V.: Assessing landslide risk on a Pan-European scale, EGU General Assembly 2024, Vienna, Austria, 14–19 Apr 2024, EGU24-8660, https://doi.org/10.5194/egusphere-egu24-8660, 2024.

EGU24-9197 | Orals | NH9.1 | Highlight

A global stochastic flood risk model for any climate scenario 

Oliver Wing, Niall Quinn, Malcolm Haylock, Conor Lamb, Rhianwen Davies, Nick Sampson, Izzy Probyn, James Daniell, Florian Elmer, Johannes Brand, and Paul Bates

Modelling flood hazards at large scales – both uniform frequency hazard maps and event simulations whose frequency varies in space – is a relatively new scientific endeavour. Data and computation constraints have historically necessitated either a more local focus to modelling efforts, or the building of proof-of-concept global-scale models whose fidelity inhibits most practical applications.

Here, we present a global climate-conditioned flood catastrophe model; the culmination of decades of research into scaling inundation modelling, the incorporation of climate change, and synthetic event generation. 30 m resolution global maps representing fluvial, pluvial, and coastal flooding for given return periods were simulated using a hydrodynamic model with sub-grid channels whose inputs were defined using regional flood frequency analyses. Change factors from climate model cascades were flexibly used to perturb the local flood frequency a given flood map represents. Separately, a 10,000-year-long set of synthetic events were simulated using a conditional multivariate statistical model fitted to global fluvial-pluvial-coastal reanalysis data. The empirical return period of a given event is used to sample the corresponding flood map return period in order to build a long synthetic series of floods.

With a global exposure model built using a top-down approach – downscaling capital stock models to high-resolution satellite-derived land-use and building height data – and a global vulnerability model derived from an extensive review of modelling and engineering literature, we demonstrate the calibration and validation of the global risk model. We also show the software challenges overcome to run this model, as well as to enable end-users to flexibly calculate the flood risk of their own exposures in the Oasis Loss Modelling Framework.

How to cite: Wing, O., Quinn, N., Haylock, M., Lamb, C., Davies, R., Sampson, N., Probyn, I., Daniell, J., Elmer, F., Brand, J., and Bates, P.: A global stochastic flood risk model for any climate scenario, EGU General Assembly 2024, Vienna, Austria, 14–19 Apr 2024, EGU24-9197, https://doi.org/10.5194/egusphere-egu24-9197, 2024.

EGU24-9533 | Posters on site | NH9.1

Modeling inland flooding caused by tropical cyclones in the US using AI-based synthetic events 

Nans Addor, Natalie Lord, Balaji Mani, Thomas Loridan, Naoki Mizukami, Jannis Hoch, and Malcolm Haylock

Tropical cyclones (TCs) are a key driver of flooding in the US. Here we present a modeling approach to simulate their associated inundation footprint under present and future climate and generate the hazard data necessary to run a CAT model. 

We developed an AI-based model called RainCyc that learns from the TC rainfall fields dynamically generated by the WRF model as well as from observations. RainCyc is orders of magnitudes faster than WRF, meaning that orders of magnitude more events can be simulated for the same computational cost. This is essential to capture the tail of the distribution, i.e., to generate synthetic events over a period longer than the longest return period of interest. Future boundary conditions for RainCyc are provided by the CESM2-LENS ensemble, which covers the 21st century under SSP370 levels of warming using 50 model realizations started from slightly perturbed initial conditions.

The rainfall fields produced by RainCyc are used to simulate inland flooding, i.e., pluvial and fluvial. The inundation footprint for each event is generated by sampling from flood hazard maps simulated by the LISFLOOD hydraulic model. The sampling for pluvial is informed by RainCyc precipitation, while for fluvial, it relies on hydrological simulations driven by the FUSE and mizuRoute models. FUSE is a frugal rainfall-runoff model that is run at 10km over a domain encompassing each event to generate its associated runoff. This runoff is then provided to the vector-based routing model mizuRoute to generate flow time series from which peak flow is extracted and used to sample fluvial hazard maps.

We present this modeling framework and test it for thousands of years of synthetic events under present and future climate. We benchmark the hydrological simulations for historical events using runs from other models, including GloFAS. We also test the ability of the framework to generate synthetic events spanning the intensities covered by hazard maps for a wide range of return periods.

How to cite: Addor, N., Lord, N., Mani, B., Loridan, T., Mizukami, N., Hoch, J., and Haylock, M.: Modeling inland flooding caused by tropical cyclones in the US using AI-based synthetic events, EGU General Assembly 2024, Vienna, Austria, 14–19 Apr 2024, EGU24-9533, https://doi.org/10.5194/egusphere-egu24-9533, 2024.

Understanding the relationship between extreme temperature events and health outcomes necessitates integration of hazard and impact data. International databases of societal impacts from disasters serve as an important data source for empirical cross-country analyses. Yet, detailed and precise estimations of the hazard magnitude of these impact records are often lacking. Physical metrics play a pivotal role in, for instance, statistical analyses and exposure assessments.

In bridging this gap, our work leverages recent advancements in geocoding of disaster records alongside high-resolution meteorological datasets to construct an inventory of a diverse range of health-related climate metrics. Our global analysis spans over 200 records of extreme temperature disasters from the past fifty years. By doing so, we unveil insights into the properties of these disastrous heat- and cold-waves. We furthermore explore differences across space, time, metrics, and data sources. This work highlights the potential of utilizing this integrated approach to extract meaningful information from historical disaster records in global databases, aiding climate resilience and public health strategies.

How to cite: Lindersson, S. and Messori, G.: Quantifying health-related climate metrics of extreme temperature disasters: An international analysis over five decades, EGU General Assembly 2024, Vienna, Austria, 14–19 Apr 2024, EGU24-9798, https://doi.org/10.5194/egusphere-egu24-9798, 2024.

EGU24-10060 | ECS | Posters on site | NH9.1

The Impact of El Niño-Southern Oscillation on Tropical Cyclone Risks 

Juner Liu, Simona Meiler, David N. Bresch, and Carmen B. Steinmann

The El Niño-Southern Oscillation (ENSO) is the most important inter-annual signal of climate variability on the planet. It affects many natural hazards including tropical cyclones (TCs), known for causing severe economic losses and many fatalities. Although research efforts have examined ENSO’s influence on TC characteristics including frequency and intensity in different basins, the transfer of these findings to global TC risk assessments has yet to be undertaken. This covers aspects such as damage to physical assets and the number of people affected. However, this is complicated by many uncertainties, such as landfall location (heterogeneous distribution of exposures) and vulnerability definitions. To bridge this gap, we assess TC risks on physical assets and affected people under ENSO’s influence and quantify related sources of uncertainty on a global scale.

We analyze TC risks during El Niño and La Niña years, using three types of TC datasets: the International Best Track Archive for Climate Stewardship (IBTrACS), probabilistic tracks generated by a random walk algorithm (IBTrACS_p), and synthetic TCs generated by a statistical-dynamical TC model (MIT). Furthermore, we quantify the sensitivity of input variables, such as the ENSO threshold, and assess uncertainties arising from TC landfall location using uniform exposure values. The outcomes regarding ENSO-conditioned TC risks can potentially improve seasonal TC risk prediction, thus benefiting policymakers and the insurance industry alike. Additionally, the results contribute to more balanced and diversified (multi-)hazard risk portfolios by accounting for ENSO as an important common modulator of spatially compounding hazards.

How to cite: Liu, J., Meiler, S., Bresch, D. N., and Steinmann, C. B.: The Impact of El Niño-Southern Oscillation on Tropical Cyclone Risks, EGU General Assembly 2024, Vienna, Austria, 14–19 Apr 2024, EGU24-10060, https://doi.org/10.5194/egusphere-egu24-10060, 2024.

EGU24-10905 | ECS | Posters on site | NH9.1

Flooding Under Climate Change in Small Island Developing States 

Leanne Archer, Jeffrey Neal, Paul Bates, Natalie Lord, and Laurence Hawker

Small Island Developing States are a group of 57 island nations and territories which are some of the most at-risk places to the impacts of climate change globally, particularly from changes in hydrometeorological hazards such as flooding. Despite this, little research has quantified present day flood hazard and population exposure in small islands, let alone how this may change as global temperatures continue to rise. Until now, this was due to the insufficient data to produce high-resolution flood hazard and population exposure estimates for a wide range of possible scenarios at such a large scale. Following the release of Fathom’s Global Flood Model 3.0, in this work we combine global flood hazard estimates for coastal, fluvial, and pluvial flood hazard at ~30m flood model resolution to estimate present day population exposure to flooding across all 57 small islands. We also investigate how flood hazard and population exposure changes under three climate scenarios: two plausible climate change scenarios (SSP1-2.6 and SSP2-4.5), and a plausible worst-case climate scenario (SSP5-8.5). We assess how present day flood hazard and exposure differs across the island typologies, and how these are projected to change under the different climate change scenarios. We also compare population exposure with vulnerability metrics to explore how population exposure to flooding and vulnerability interact. The results of this analysis aim to improve understanding regarding the range of plausible estimates of current and future population exposure to flooding in Small Island Developing States. These results will help inform adaptation to more extreme flood risk in Small Island Developing States under current and future climate change.

How to cite: Archer, L., Neal, J., Bates, P., Lord, N., and Hawker, L.: Flooding Under Climate Change in Small Island Developing States, EGU General Assembly 2024, Vienna, Austria, 14–19 Apr 2024, EGU24-10905, https://doi.org/10.5194/egusphere-egu24-10905, 2024.

EGU24-13847 | Posters on site | NH9.1

Development of a Comprehensive Exposure-at-Risk Map for Europe: Integrating Coinciding Natural Hazards and Exposure Metrics 

James Daniell, Andreas Schaefer, Judith Claassen, Johannes Brand, Timothy Tiggeloven, Bijan Khazai, Trevor Girard, Annika Maier, Benjamin Blanz, Nikita Strelkovskii, Jaroslav Mysiak, Marleen de Ruiter, Wiebke Jaeger, and Philip Ward

The development of an Exposure-at-risk map for Europe that encompasses multiple coinciding natural hazards builds upon many previous attempts and existing portals such as TIGRA, TEMRAP, ESPON, JRC DRMKC, and GIRI to name a few, which have primarily focused on examining a few single hazards and limited exposure.
The novelty of this approach lies in its integration of a myriad of hazards into a single, cohesive framework. The European Hazard Map is constructed using data from various sources, covering geophysical hazards (earthquakes, volcanoes, landslides), meteorological hazards (winds, convective storms, storms), hydrological hazards (river/pluvial floods), climatic overlaps (bushfires, droughts), and biological hazards. These hazards are modelled using both stochastic and probabilistic methods as well as historical reanalysis, offering a robust and comprehensive view of potential risks.
The exposure component of this map is constructed around a handful of key Europe-wide metrics, encompassing aspects crucial to the European multi-sector context. These include tourism-based metrics such as domestic and international expenditure, hotel statistics, employment figures, as well as broader economic indicators like capital stock (particularly focusing on buildings), GDP, and critical infrastructure related to transport and energy. Additionally, agricultural production and seasonal population variations are factored in. These metrics are pivotal in assessing the potential impact of various hazards, including but not limited to earthquakes, tsunamis, winds, floods, landslides, tornadoes, hail, droughts, and bushfires.
This map has been developed as part of the MYRIAD-EU project, a multi-hazard initiative, and is built using open data sources and risk analytics within the project. A significant feature of this map is its ability to demonstrate temporal and spatial overlaps. This capability allows for the visualization of combined events or the combined impact of different exposure-hazard overlaps, depending on whether the output is stochastic or probabilistic. The interface of this map serves as a crucial gateway to the MYRIAD-EU multi-hazard software scorecard approach. It also plays a pivotal role in identifying overlapping hazards within the EU, enabling better preparedness and response strategies.
In summary, this Exposure-at-risk map for Europe is a significant advancement in the field of hazard assessment and risk management. It integrates a multitude of hazards and exposure metrics, offering a comprehensive and detailed view of potential risks across Europe. This map is not only a tool for current risk assessment but also a foundation for future research and development in this critical area of study.

How to cite: Daniell, J., Schaefer, A., Claassen, J., Brand, J., Tiggeloven, T., Khazai, B., Girard, T., Maier, A., Blanz, B., Strelkovskii, N., Mysiak, J., de Ruiter, M., Jaeger, W., and Ward, P.: Development of a Comprehensive Exposure-at-Risk Map for Europe: Integrating Coinciding Natural Hazards and Exposure Metrics, EGU General Assembly 2024, Vienna, Austria, 14–19 Apr 2024, EGU24-13847, https://doi.org/10.5194/egusphere-egu24-13847, 2024.

EGU24-13864 | Orals | NH9.1

Connecting the dots: teleconnection of global floods and their association with climate variability 

Yixin Yang, Long Yang, Qiang Wang, and Gabriele Villarini

A fundamental question in global hydrology is how global floods behaved in the past and are expected to behave in the future. Previous site-specific analyses might offer locally relevant insights, but little is known about how floods are connected in space and time as well as their synchronous responses to climate variability at the global scale. Here we carry out empirical analyses based on a comprehensive dataset of annual maximum flood peak series from 4407 stream gaging stations. We establish the link between any two stream gages if their annual maximum flood peak discharges are significantly correlated and the dates of their occurrences are sufficiently close (using event synchronization and complex network). Our results identify notable remote links of annual flood peak series over western Canada/US (e.g., upper Missouri River basin), northern Europe (e.g., Kemijoki River basin), southern China (e.g., middle Yangtze River basin), and northern South America (e.g., Amazon River basin). Annual flood peak series are linked to their local neighbors (within a distance of 4500 km) over eastern United States, central Europe, and eastern Australia. Remote links highlight the spatial dependence of riverine floods at the global scale. These links are dictated by the oscillation of dominant climate modes over the Pacific Ocean (e.g., El Niño Southern Oscillation, Pacific Decadal Oscillation) and their resultant anomalous atmospheric circulation patterns. Local flood clusters are more responsive to region-specific atmospheric forcings. The complex flood network plays an important role in regulating the dynamic behaviors of flood hazards. Our results offer new insights into global flood hydrology and their connections with large-scale climate forcings.

How to cite: Yang, Y., Yang, L., Wang, Q., and Villarini, G.: Connecting the dots: teleconnection of global floods and their association with climate variability, EGU General Assembly 2024, Vienna, Austria, 14–19 Apr 2024, EGU24-13864, https://doi.org/10.5194/egusphere-egu24-13864, 2024.

Floods constantly occur in San Miguel de Ibarra's urban setting each year. Situated on the slopes of the Imbabura volcano, an integral component of the UNESCO Global Geopark Imbabura, this Ecuadorian city boasts an invaluable cultural and natural heritage. However, it has experienced multiple adverse impacts due to the overflow of rivers and streams. In 2022, an inventory of floods was compiled for the Geopark, revealing the persistent recurrence of this phenomenon within the city. Consequently, it became imperative to gather historical and contemporary data from diverse sources such as public institutions (GAD Ibarra 2023), digital newspapers, social networks, and aerial imagery (IGM 2014) to discern patterns and establish correlations related to these occurrences (SNGRE 2023).

In this way, the acquired information spanning the period from 1965 to the present, insights were gained into the distribution of flood-prone zones and their correlation with paleochannels. Additionally, discernment was achieved regarding alterations in land-use planning attributable to urban expansion in the city, which, in turn, contributes to the heightened susceptibility to floods. This meticulous analysis unveiled specific areas within the city consistently affected by such hazards, elucidating these events' characteristics and the ensuing damage to both public and private properties. The current publication presents preliminary findings utilized in the estimation of flood risk.

Keywords: Paleochannels, floods, Ibarra, Imbabura, Imbabura UNESCO Geopark

References:

GAD Ibarra (2023) Cartography of Ibarra canton at several scales

IGM (2014) Cartography of Ibarra canton 1:5.000

IGM (2023) Historical imagery of flights in Ecuador at several scales

SNGRE (2023) Data Base Events SNGRE. Period 2010 to 2023

How to cite: Torres-Ramírez, R.: Paleochannels and their correspondence with floods in the 21st century. Case study of Ibarra city, Imbabura, Ecuador., EGU General Assembly 2024, Vienna, Austria, 14–19 Apr 2024, EGU24-14423, https://doi.org/10.5194/egusphere-egu24-14423, 2024.

Abstract: The incidences of earthquakes in the north Indian state of Uttarkhand are broadly associated with the presence of active fault viz. Main Central Thrust and Alaknanda Fault in the north, Moradabad Fault and Himalayan Frontal Thrust in the southern margin, Martoli Thrust and Indus Suture in the eastern, Mahendragarh Dehrdun Fault in the west. Uttarakhand falls under Seismic Zone IV and V and has been struck by several devastating earthquakes viz. 1905 Kangra earthquake of MW 7.8, 1991 Uttarkashi earthquake of MW 6.8 and 1999 Chamoli earthquake of MW 6.5 with maximum MM Intensity of IX observed in near-source region causing widespread damage and destruction in the study region. Uttarakhand region has undergone unprecedented development and population growth, emphasizing the importance of analysis of Seismic Hazard to ensure safe and secure progress in this seismically vulnerable region. Consideration of seismicity patterns, fault networks and similarity in the style of focal mechanisms yielded 10 areal seismogenic sources with additional active tectonic features in 0-25km, 25-70km, and 70-180km hypocentral depth ranges, along with 15 Ground Motion Prediction Equations for the tectonic provinces of Uttarakhand region yielding Probabilistic Peak Ground Acceleration (PGA) at engineering bedrock  seen to vary from 0.36g to 0.63g for 475years of return period which places the region in the moderate to high hazard zone necessitating a case study for site-specific seismic characterization of the region. Seismic site classification has been done based on an enriched geophysical, in-situ downhole, geotechnical database and surface geoscience attributes comprising of Geology, Geomorphology, Landform and Topographic Gradient derived shear wave velocity categorizes the region into Site Classes E, D4, D3, D2, D1, C4, C3, C2, C1, B and A. Using the input ground motion at bedrock level obtained from stochastic simulation for the near-source earthquakes, nonlinear site response analyses have been performed using PLAXIS-2D software package wherein site amplification has been mapped which is seen to vary in the range of 1.02 to 2.86. Surface-consistent probabilistic seismic hazard in terms of Peak Ground Acceleration (PGA) for a return period of 475 years has been assessed for the study region by convolving site amplification with bedrock hazard thus predicting a variation of PGA in the range of 0.51-1.61g. Additionally, assessment of liquefaction potential of the terrain and seismic hazard microzonation have been done for Dehradun city to identify areas with varying level of ground shaking and its associated liquefaction phenomenon during earthquakes, enabling the development of site-specific building codes and land-use regulations. The results of this investigation are expected to play vital roles in the earthquake–related disaster mitigation and management of the region.

How to cite: Bind, A. P. and Nath, S. K.: Site-specific Seismic Hazard Assessment of Uttarakhand, India with special emphasis on Liquefaction Potential  modelling of the terrain and Seismic Hazard Microzonation of Dehradun City, EGU General Assembly 2024, Vienna, Austria, 14–19 Apr 2024, EGU24-14677, https://doi.org/10.5194/egusphere-egu24-14677, 2024.

EGU24-16095 | ECS | Posters on site | NH9.1

Do catchment characteristics drive extreme discharge tail behavior in the Meuse catchment? Insights from 1,040 years of synthetic discharge data.  

Anais Couasnon, Laurène Bouaziz, Ruben Imhoff, Hessel Winsemius, Mark Hegnauer, Niek van der Sleen, Robert Slomp, Leon van Voorst, and Henk van den Brink

Understanding extreme discharge behavior is of importance for flood design and risk management. For example, estimates of large extreme discharge return periods such as the 100-year return period or higher are often needed as a basis for flood hazard maps or dike design. Yet, frequency analysis based on decade-long discharge records show a large uncertainty for these frequencies, among others due to the statistical uncertainty from the distribution parameters.  This is not the case for the shape parameter, a key parameter that describes the upward or downward curvature of the tail of the distribution and thus an indicator of extreme discharge behavior. 

This study provides robust estimates of the shape parameter by using the 1,040 years of synthetic daily discharge generated for the Meuse catchment as part of the EMfloodResilience project from the Interreg Euregio Meuse-Rhine program. The spatially-distributed hydrological model wflow_sbm, calibrated and validated for the Meuse catchment, is forced with 16 synthetic climate ensembles of 65 years representative for the current climate from the physically-based KNMI regional climate model RACMO climate model at a daily and hourly time step. The annual maxima (AM) from hydrological years (Oct-Sep) are retrieved from these continuous time series, and a GEV distribution is fit to the AM. We observe a clear spatial pattern of the shape parameter across the Meuse catchment. Using this large dataset of shape parameters, we also review the possible reasons for the different tail behavior obtained with respect to rainfall statistics, catchment characteristics and river systems following the In doing so, we aim to bridge the extreme value statistical modelling with our current understanding of the extreme hydrological signatures present in the catchment.

How to cite: Couasnon, A., Bouaziz, L., Imhoff, R., Winsemius, H., Hegnauer, M., van der Sleen, N., Slomp, R., van Voorst, L., and van den Brink, H.: Do catchment characteristics drive extreme discharge tail behavior in the Meuse catchment? Insights from 1,040 years of synthetic discharge data. , EGU General Assembly 2024, Vienna, Austria, 14–19 Apr 2024, EGU24-16095, https://doi.org/10.5194/egusphere-egu24-16095, 2024.

EGU24-16556 | ECS | Posters on site | NH9.1

Coastal flood risks in Europe in the context of sea-level rise: methods and preliminary results from the CoCliCo project 

Vincent Bascoul, Rémi Thiéblemont, Jeremy Rohmer, Elco Koks, Joël De Plaen, Daniel Lincke, Hedda Bonatz, and Goneri Le Cozannet

Present days and future coastal flooding is a key concern for Europe due to sea-level rise, storm surges and the importance of infrastructure at risk in low-lying areas. To support adaptation, information on future risks such as people exposed and economic damages are required. The CoCliCo project aims to contribute responding to this need by informing users about coastal risks via an open-source web platform. This platform aspires to improve decision-making on coastal risk management and adaptation in Europe.

Here, we present the methods used in CoCliCo to compute risks and provide early results of risk calculations at the European scale. The results take the form of costs calculated for different flooding scenarios on different infrastructures (residential buildings, roads...) as a function of flood water levels. Flood water levels are determined for each infrastructure based on flood modelling. Then, using vulnerability curves, a damage associated with the type of infrastructure as a function of the water level is assigned. The damage ratio then is used to calculate the cost of flooding. Coastal risk can also be presented in social terms, by assessing the number of people potentially affected by flooding. The results are illustrated for two case studies: Dieppe and Hyère in France using detailed flood modelling and complemented by preliminary results for Europe. Our results are compared results from with previous studies.

Finally, flood risk projections will be presented for several return periods at different scales and for different integrated scenarios considering climate change and associated socio-economic pathways as well as different adaptation options. These results will be made available on the CoCliCo platform.

How to cite: Bascoul, V., Thiéblemont, R., Rohmer, J., Koks, E., De Plaen, J., Lincke, D., Bonatz, H., and Le Cozannet, G.: Coastal flood risks in Europe in the context of sea-level rise: methods and preliminary results from the CoCliCo project, EGU General Assembly 2024, Vienna, Austria, 14–19 Apr 2024, EGU24-16556, https://doi.org/10.5194/egusphere-egu24-16556, 2024.

Tropical cyclones are events responsible for the costliest meteorological catastrophes. On average per year over the last decade, they have affected 20 million people, with estimated economic losses US$51.5 billion (Krichene et al., 2023). These consequences reduce the economic growth of the affected countries (Berlemann & Wenzel, 2018). Take Jamaica, for instance, where annual damages caused by tropical cyclones are estimated at 0.5%, reaching up to 10% of the Gross Domestic Product (Adam & Bevan, 2020).

The climatology of tropical cyclone, defined as characteristics averaged over years, controls parameters like tracks, intensification, number of storms, all crucial for induced hazards (winds, precipitation, storm surge and waves). In recent years, anomalous tropical cyclones have impacted the coasts worldwide. In 2023, hurricane Otis, without precedent, rapidly intensified off the coast of the coast of Acapulco (Mexico), resulting in at least 52 deaths and estimated damage exceeding 10 billion USD. The track of tropical cyclone Kenneth struck areas of Mozambique where no previous tropical cyclone had impacted before, resulting in 45 casualties and $100 million in damage (Mawren et al., 2020). The future of tropical cyclones is impregnated with uncertainty and is a matter of concern, which have motivated the recent advance in this topic. Several authors asseverate an increase in intensity, reduce in frequency (Bloemendaal, et al., 2022; T. Knutson et al., 2020; T. R. Knutson et al., 2010), and their poleward displacement (Studholme et al., 2022). However, the global study of the displacement of tropical cyclones and their characteristics due to the migration of storms has not been integrated into large-scale adaptation planning.

This study identifies regions affected by the displacement of storms in the North Atlantic at the municipal administration level. Analysing characteristics under two climatology periods—a baseline climate (1980-2017) and a future high-emission climate scenario, Shared Socioeconomic Pathway SSP8.5 (2015-2050)—we used synthetic tracks (Bloemendaal, et al., 2022) generated with a model based on STORM  (Bloemendaal et al., 2020). Four Global Climate Models (CMCC, CNRM, EC-Earth, and HadGEM3) were examined to evaluate uncertainty, focusing on frequency, intensity, and critical parameters such as size, translation speed, track complexity, residence time in front of the coast, and relative direction to the shoreline.

This study identifies hotspots where tropical cyclone characteristics are spatially displaced, increasing the exposure to tropical cyclones in these regions. For example, the Canary Islands in Spain show that hurricanes of category 1, in present conditions, have a return period of 215 years, reducing to 62 years in the SSP8.5 scenario. This is in line with the recent records, the Hermine storm in 2022 almost impacted their coasts. The results raise questions about our public policies for future adaptation. In areas historically unaffected and unprepared for tropical cyclones, the corresponding government may lack and require prevention systems for tropical cyclones, such as warning alarms, reducing subsidies for coastal development or implementing disaster relief policies. 

How to cite: Odériz, I. and Losada, I.: Implications of the displacement of tropical cyclones for public policies in the North Atlantic, EGU General Assembly 2024, Vienna, Austria, 14–19 Apr 2024, EGU24-17338, https://doi.org/10.5194/egusphere-egu24-17338, 2024.

EGU24-17738 | ECS | Orals | NH9.1

Complex emergencies: drivers of the humanitarian impacts of climate-related disasters 

Ellen Berntell, Nina von Uexkull, Tanushree Rao, Frida Bender, and Lisa Dellmuth

Climate-related disasters such as floods, droughts and storms often pose significant threats to human livelihoods, especially in developing countries. The extreme weather events often lead to destroying of shelter, harming of crops and livestock as well as fueling of conflicts, and the threat to human livelihoods are likely to increase due to climate change. While we know that climate change and conflict interact and reinforce each other, less is known in the context of natural disasters and disaster aid. In this paper we address this gap by studying how hazard severity, disaster exposure and drivers of vulnerability interact to produce humanitarian impacts, and if the delivery of emergency disaster aid alleviates these impacts. We do this by generating meteorological hazard severity measurements based on the reanalysis dataset ERA5, comparable across different climate-related disaster types, allowing us to study drivers of vulnerability to climate-related hazards. Secondarily, we study the role of aid allocation on limiting disaster mortality and displacement, with the results having broad implications for the understanding of disaster impacts and aid effectiveness.

How to cite: Berntell, E., von Uexkull, N., Rao, T., Bender, F., and Dellmuth, L.: Complex emergencies: drivers of the humanitarian impacts of climate-related disasters, EGU General Assembly 2024, Vienna, Austria, 14–19 Apr 2024, EGU24-17738, https://doi.org/10.5194/egusphere-egu24-17738, 2024.

EGU24-17751 | ECS | Orals | NH9.1 | Highlight

A New Method to Compile Global Multi-Hazard Event Sets 

Judith Claassen, Elco E. Koks, Timothy Tiggeloven, and Marleen C. de Ruiter

This study presents a new method, the MYRIAD-Hazard Event Sets Algorithm (MYRIAD-HESA), that compiles historically-based multi-hazard event sets. MYRIAD-HESA is a fully open-access method that can create multi-hazard event sets from any hazard events that occur on varying time, space, and intensity scales. In the past, multi-hazards have predominately been studied on a local or continental scale, or have been limited to specific hazard combinations, such as the combination between droughts and heatwaves. Therefore, we exemplify our approach by compiling a global multi-hazard event set database, spanning from 2004 to 2017, which includes eleven hazards from varying hazard classes (e.g. meteorological, geophysical, hydrological and climatological). This global database provides new scientific insights on the frequency of different multi-hazard events and their hotspots. Additionally, we explicitly incorporate a temporal dimension in MYRIAD-HESA, the time-lag. The time-lag, or time between the occurrence of hazards, is used to determine potentially impactful events that occurred in close succession. Varying time-lags have been tested in MYRIAD-HESA, and are analysed using North America as a case study. Alongside the MYRIAD-HESA, the multi-hazard event sets, MYRIAD-HES, is openly available to further increase the understanding of multi-hazard events in the disaster risk community. The open-source nature of MYRIAD-HESA provides flexibility to conduct multi-risk assessments by, for example, incorporating higher resolution data for an area of interest.

How to cite: Claassen, J., Koks, E. E., Tiggeloven, T., and de Ruiter, M. C.: A New Method to Compile Global Multi-Hazard Event Sets, EGU General Assembly 2024, Vienna, Austria, 14–19 Apr 2024, EGU24-17751, https://doi.org/10.5194/egusphere-egu24-17751, 2024.

EGU24-17874 | ECS | Orals | NH9.1

An evaluation of the use of regional climate model data applied to extreme precipitation in the Meuse basin 

Leon van Voorst, Henk van den Brink, and Anais Couasnon

Understanding of hydrological and meteorological extremes is essential for flood risk management and flood protection. A primary focus in these professions is adequate estimation of extreme events that correspond to large return periods. Hydrological and meteorological observations only go back several decades, complicating frequency analysis of these large extremes. Capturing the tail behaviour of extremes is particularly challenging with such short records, resulting in high uncertainty of large precipitation and discharge extreme estimates.

This study proposes an alternative strategy for hydrological and meteorological frequency analysis. Long timeseries obtained from regional climate models are used to replace short observational datasets, leading to a substantial reduction of the statistical uncertainty of meteorological and hydrological extreme estimates. The approach was tested in the Meuse basin as part of the EMFloodresilience project, evaluating meteorological extremes from 16 synthetic ensembles of 65 years from the RACMO regional climate model (forced by the EC-EARTH global climate model). Hydrological extremes are analysed in a subsequent study from Rijkswaterstaat and Deltares, by forcing the wflow discharge model with the RACMO climate model dataset.

The study results reveal that bias-corrected model data is climatologically comparable to observational averages and extremes, exhibiting similar GEV location and scale parameters. Revealing a previously unexamined range of extremes, the model data offers a more plausible method to estimate the tails of annual extremes and likely provides a better estimate of the corresponding GEV shape parameter. Spatially, the model-derived parameter shows greater consistency across different sub-catchments of the Meuse basin compared to observations, suggesting a more robust insight in the tail behaviour of extremes. Additionally, a distinct separation between GEV distributions of summer and winter events is observed, indicating a transition in magnitude dominance from winter to summer maxima and possibly the presence of a double population. The existence of such a double population is difficult to obtain from observations, but can have an enormous impact on the return values of summer extremes. This emphasizes the need for further research on this area for adequate flood management.

How to cite: van Voorst, L., van den Brink, H., and Couasnon, A.: An evaluation of the use of regional climate model data applied to extreme precipitation in the Meuse basin, EGU General Assembly 2024, Vienna, Austria, 14–19 Apr 2024, EGU24-17874, https://doi.org/10.5194/egusphere-egu24-17874, 2024.

EGU24-18718 | ECS | Orals | NH9.1

When one becomes many: Including complex channel systems in large scale flood models 

Laurence Hawker, Jeffrey Neal, Michel Wortmann, Louise Slater, Yinxue Liu, Solomon H. Gebrechorkos, Julian Leyland, Philip J. Ashworth, Ellie Vahidi, Andrew Nicholas, Georgina Bennett, Richard Boothroyd, Hannah Cloke, Helen Griffith, Pauline Delorme, Stuart McLelland, Andrew J. Tatem, Daniel Parsons, and Stephen E. Darby

Over 70% of flood events recorded in the past two decades in the Global Flood Database and WorldFloods dataset have occurred in locations where complex channel systems occur. Here we define complex channel systems as parts of the river network that diverge, such as bifurcations, multi-threaded channels, canals and deltas. Yet, large scale flood models have, until now, used only single-threaded networks due to the lack of a river network that reflects complex channel systems . Therefore, these large-scale models fundamentally misrepresent the physical processes in these often highly populated areas, leading to sub-optimal estimates of flood risk.

Using the new Global River Topology (GRIT) dataset, a global bifurcation and multi-directional river network (Wortmann et al. 2023), we extend the river channel bathymetry estimation routine of Neal et al. (2021) to model multi-channels with LISFLOOD-FP. We compare the multi-thread model results to observations and to previous versions of LISFLOOD-FP using a single-threaded river network in the Indus, Mekong and Niger rivers at 1 arc second (~30m). By using GRIT, we find marked improvements in model results, observing better connectivity to areas of the floodplain that are far from the main channel and more channel floodplain interactions in wetlands. This work paves the way to further our understanding of global flood risk and to finally consider the diverse, evolving nature of geomorphologically active river networks. As this work progresses, we will continue to model a typology of bifurcations and multi-directional rivers to help further our understanding of the significance of complex river systems.

Neal, J., Hawker, L., Savage, J., Durand, M., Bates, P., & Sampson, C. (2021). Estimating river channel bathymetry in large scale flood inundation models. Water Resources Research57(5), e2020WR028301.

Wortmann, M., Slater, L., Hawker, L., Liu, Y., & Neal, J. (2023). Global River Topology (GRIT) (0.4) [Data set]. Zenodo. https://doi.org/10.5281/zenodo.7629908

How to cite: Hawker, L., Neal, J., Wortmann, M., Slater, L., Liu, Y., Gebrechorkos, S. H., Leyland, J., Ashworth, P. J., Vahidi, E., Nicholas, A., Bennett, G., Boothroyd, R., Cloke, H., Griffith, H., Delorme, P., McLelland, S., Tatem, A. J., Parsons, D., and Darby, S. E.: When one becomes many: Including complex channel systems in large scale flood models, EGU General Assembly 2024, Vienna, Austria, 14–19 Apr 2024, EGU24-18718, https://doi.org/10.5194/egusphere-egu24-18718, 2024.

EGU24-20386 | ECS | Orals | NH9.1

Slow-moving landslide exposure increases with population pressure 

Joaquin Vicente Ferrer and Oliver Korup

Slow-moving landslides can cause damage to structures and infrastructure and result in thousands of casualties, if they fail catastrophically. Landslide motion may accelerate after prolonged rainfall, and with alterations to their surface hydrology caused by urbanization. As populations grow in mountainous regions, there will be more direct interactions between communities expanding onto landslides. Yet, the lack of systematic data has precluded a global overview of exposure. We address this by compiling a global database of 7,764 large landslides (>0.1 km2 in area) reported to be slow-moving. Here, we assess the presence of human settlements in 2015 and estimate exposure across IPCC regions with projected landslide risk. We estimate that 9% of landslides in a given basin are occupied by human settlements. On 1195 km2 slow-moving landslides, settlement footprints total 55 km2 and cover an average of 12%, relative to the landslide area. We show regional influences of exposure to floods, average steepness, and urbanization on exposure across basins. Our estimates of exposure in East Asia (EAS) show the most credibility across regions facing growing landslide and flood risk by the IPCC. Apart from Central Asia, we find that urbanization in a basin increases the relative number of landslides inhabited. Furthermore, we find that regions with mountain risks projected to increase have highest uncertainty in our assessment.

How to cite: Ferrer, J. V. and Korup, O.: Slow-moving landslide exposure increases with population pressure, EGU General Assembly 2024, Vienna, Austria, 14–19 Apr 2024, EGU24-20386, https://doi.org/10.5194/egusphere-egu24-20386, 2024.

EGU24-20522 | ECS | Orals | NH9.1

Global assessment of human exposure to sea-level rise to 2300 

Jack Heslop, Robert Nicholls, Caridad Ballesteros Martinez, Daniel Linke, and Jochen Hinkel

The PROTECT project [1] includes a probabilistic integrated assessment of global population exposure to coastal flood hazard under climate-induced sea-level rise (SLR) over the next three centuries (to 2300). The assessment synthesises present-day datasets on population distribution [2], low lying coastal elevations [3] and extreme tides [4] with probabilistic projection datasets of population [5] and sea level [6] to 2300. For the scenarios considered (SSP1-2.6 & SSP2-4.5) and at a global scale, the median human exposure to coastal flood hazards grows substantially but then peaks in the early 2200s and subsequently slowly declines by 2300, despite continued rise in sea level.

Previous assessments have primarily focussed on shorter timeframes [2], typically to 2100, while it is widely acknowledged that even if temperatures are stabilised, sea levels are almost certain to continue to rise for many centuries [7][8][9]. Stakeholder workshops carried out with practitioners under the umbrella of PROTECT [10] and literature reviews [11][12] highlight the importance of extending sea-level rise information beyond 2100, to support strategic coastal adaptation and management, land-use planning, and critical infrastructure design.

Recent advancements in long term socio-economic modelling [13][5] now provide projections of global population and GDP at country level to 2300. These have already been applied to long-term risk assessments for other climate sectors [13][5][14].

For this assessment, the global coastline was split into ~29,000 segments, each assigned an extreme tide curve (from the COAST-RP dataset [4]) and a hypsometric curve, generated from a global terrain model [3] and present-day population distribution [2]. The hypsometric curves aggregate the total land-area and population at each elevation, including consideration of hydraulic connectivity to the coastline. This gives the land area and population that would be exposed at a given coastal flood level (up to 20mAMSL) for each coastal segment.

When sea-level scenarios [6] (SSP1-2.6 & SSP2-4.5) and socio-economic data [5] are combined, the human exposure and land area exposure to coastal flood hazard under a chosen extreme tide return period (or the annual average based on the event-exposure curve) is calculated.

This approach facilitates efficient computations, sampling across probabilistic data, and providing robust statistics at a high spatial resolution compared to traditional methods. The outputs at each coastal segment can be aggregated to sub-national, national, or the global scale.

In this analysis, it is found that the median exposure of people to coastal flood hazards increases fivefold to a peak in the early 2200s and subsequently slowly declines to 2300 in both SSPs, despite the continued rise in sea level. For the 80th percentile population exposure grows even more (10- to 11-fold) but then stabilises rather than declines. These results reflect the interplay of sea level and demography with fall in global population in the latter half of the assessment period and are contrary to conventional wisdom. This analysis shows that in addition to sea-level rise, it is important to consider demographic trends when considering coastal futures.

Figure 1. Probabilistic annual average global population exposure to coastal flood hazard

References exceed the word limit so not included

How to cite: Heslop, J., Nicholls, R., Ballesteros Martinez, C., Linke, D., and Hinkel, J.: Global assessment of human exposure to sea-level rise to 2300, EGU General Assembly 2024, Vienna, Austria, 14–19 Apr 2024, EGU24-20522, https://doi.org/10.5194/egusphere-egu24-20522, 2024.

EGU24-21315 | Orals | NH9.1

Wildfire Risk Assessment under present and future climate at national scale: a pan european approach 

Farzad Ghasemiazma, Giorgio Meschi, Andrea Trucchia, and Paolo Fiorucci

The authors present a framework designed to model wildfire risk and the future projection of wildfire risk patterns, also in view of climate change scenarios. The adopted modeling framework is inherently multi scale, giving results at national scale, after a data gathering process developed at regional / supranational scale. The risk assessment comprises the computation of susceptibility, hazard, exposures, and damage layers. Machine learning techniques are used to assess the wildfire susceptibility and hazard at regional level, analogously to [1, 2]. To this end, a two-models approach has been adopted. The first model, based on the Random Forest Classifier, is trained at pan-European level to capture the climate variability of the European continent and related fire regimes. Building upon the outcome of this model, a wildfire susceptibility map representative for the historical
conditions at pan-European level is produced and used in input of a second machine learning model, to provide results at national level. The strength of this model lies in using high-resolution downscaled climate data and annual temporal resolution, with the objective of computing a high resolution annual susceptibility map for the specific region. This approach facilitates the generation of annual outcomes for both historical and future conditions, using the climate projections available in the ISIMIP framework. The result of five different climate models and three climate change scenarios have been used to estimate the average annual losses due to wildfires. The wildfire hazard has been evaluated through empirical approaches, building a wildfire hazard classes map combining fuel type/severity maps with wildfire susceptibility. Then, a burning probability is estimated for each hazard class: a statistical analysis on historical wildfires at pan-European level has been performed in order to retrieve the annual relative burned area per hazard class. The method allows to estimate the average annual probability to be affected by a fire given a wildfire event. Several exposed elements were used to estimate the losses ranging from infrastructure to forest and roads: Global Earthquake Model [3] provides a dataset featuring economic values under both present and future conditions across five categories of infrastructures at European level. JRC, OpenStreeMap, and Copernicus provide information on the presence of roads and forests. Empirical vulnerability functions establish a link between severity maps, the presence of exposed elements, and their economic value, leading to the estimation of potential damage maps. The assessment of average annual losses involves coupling spatial information on average annual probability with potential damage maps. This approach allows for the evaluation of average values across various future timeframes associating a variance accounting for both the year to year and climate models’ variability. Results have been produced at national level for several countries characterized by different wildfire regimes, land cover and climate, such as Croatia, Romania and Bulgaria.

How to cite: Ghasemiazma, F., Meschi, G., Trucchia, A., and Fiorucci, P.: Wildfire Risk Assessment under present and future climate at national scale: a pan european approach, EGU General Assembly 2024, Vienna, Austria, 14–19 Apr 2024, EGU24-21315, https://doi.org/10.5194/egusphere-egu24-21315, 2024.

EGU24-1193 | ECS | Posters on site | CL2.3

Climate drivers of meteorological droughts in north-western Europe (1836-2022) 

Emile Neimry, Hugues Goosse, and Mathieu Jonard

Droughts have garnered global attention due to their adverse effects on crops, ecosystems, and society. Despite their frequent occurrence in north-western Europe, the causes of these droughts remain poorly understood. This study investigates the historical climate drivers of meteorological droughts in the region. The identification of drought events since 1836 is conducted using the Standardized Precipitation Evapotranspiration Index at a 3-month scale, based on reanalysis datasets (ERA5 and 20CRv3). Subsequently, by employing clustering methods, we categorize the diverse atmospheric conditions leading to droughts into discernible patterns. Our next objective is to assess the long-term variability and trends within these patterns. This research provides a long-term regional analysis of meteorological drought drivers, contributing to a deeper understanding of regional climate changes over the past two centuries.

How to cite: Neimry, E., Goosse, H., and Jonard, M.: Climate drivers of meteorological droughts in north-western Europe (1836-2022), EGU General Assembly 2024, Vienna, Austria, 14–19 Apr 2024, EGU24-1193, https://doi.org/10.5194/egusphere-egu24-1193, 2024.

EGU24-1722 | ECS | Orals | CL2.3

Revealing a systematic bias in percentile-based temperature extremes 

Lukas Brunner and Aiko Voigt

Worsening temperature extremes are among the most severe impacts of human-induced climate change. To quantify such extremes and their changes various methods have been applied over the years. One frequently used approach is to define extremes relative to the local temperature distribution as exceedances of a given percentile threshold. 

For hot extremes, the Expert Team on Climate Change Detection and Indices (ETCCDI) defines TX90p relative to the 90th percentile of maximum temperature on each calendar day in the 30-year period 1961-1990. To increase the number of samples available for the percentile calculation a 5-day running window is recommended leading to a total of 30x5=150 samples for each calendar day. However, this still limited number of samples can lead to internal variability being mixed into the percentile and cause a strongly varying extreme threshold, which is undesirable. Therefore, many studies do not follow the ETCCDI recommendation and use longer seasonal windows of 15- or even 31-days to increase the number of samples available for the percentile calculation. 

We show that the use of such long seasonal windows introduces a systematic bias that leads to a striking underestimation of the expected extreme frequency. This expected exceedance frequency is 10% for the 90th percentile when evaluating the extreme frequency in the same period as the threshold is calculated (in-base). For ERA5 the 1961-1990 average, global average temperature extreme frequency is only 9% – a relative bias of -10%. In individual regions and seasons, the bias can be considerably larger, exceeding -75%. 

We develop a simple bias correction and use it to show that the bias generally decreases in a warming climate in CMIP6. It, therefore, also affects estimates of future temperature and related heatwave changes. The decrease of the bias can lead to an overestimation of changes in the heatwave frequency by as much as 30%. Based on these results, we strongly warn against the use of long seasonal windows without correction when calculating extreme frequencies and their changes.

How to cite: Brunner, L. and Voigt, A.: Revealing a systematic bias in percentile-based temperature extremes, EGU General Assembly 2024, Vienna, Austria, 14–19 Apr 2024, EGU24-1722, https://doi.org/10.5194/egusphere-egu24-1722, 2024.

EGU24-1791 | Orals | CL2.3 | Highlight

Storylines of high-impact climate events 

Theodore Shepherd

High-impact climate events are generally expected to be exacerbated by climate change. For heatwaves, heavy precipitation, and evaporatively-driven drought, the IPCC AR6 made very strong general statements about changes in hazard. But as soon as one attempts to attribute high-impact climate events, the particular details of those events (which are inevitably compound events) and of the human-managed environment take centre stage. Because real-world events are not independent and identically distributed, one cannot reliably apply a general statement to a particular event. This basic aspect of statistical inference, widely recognized in other fields, seems not well appreciated within the climate science community. Physical climate storylines (physically-based unfoldings of past climate or weather events, or of plausible future events or pathways) offer a way to respect the complexity of high-impact climate events and the multiple causal factors involved, of which climate change will only be one. Indeed, identifying the non-climatic factors that affect vulnerability and exposure is essential for good decision-making around climate adaptation. In this talk I will describe the rationale behind the use of storylines for high-impact climate events from the broader perspective of attribution, and explain how conditional attribution allows probability and risk to enter in a physically interpretable and meaningful way.

How to cite: Shepherd, T.: Storylines of high-impact climate events, EGU General Assembly 2024, Vienna, Austria, 14–19 Apr 2024, EGU24-1791, https://doi.org/10.5194/egusphere-egu24-1791, 2024.

EGU24-2132 | ECS | Posters on site | CL2.3

A Regional Perspective of Storyline Simulations of the Recent European Summer Heatwaves 

Tatiana Klimiuk, Patrick Ludwig, Antonio Sánchez Benítez, Helge Goessling, Peter Braesicke, and Joaquim G. Pinto

Heatwaves are a major natural hazard affecting Europe, and their maximum temperatures are projected to increase strongly with climate change. In recent years, the event-based storyline approach has proven its applicability for climate change attribution studies. Constraining the large-scale dynamics to that of the recent past serves to separate the thermodynamic effects of increasing greenhouse gas concentrations from the largely uncertain dynamic changes. Within the SCENIC project, the storylines are produced with the spectrally nudged global coupled AWI-CM1 model (90 km horizontal resolution). They are downscaled with ICON-CLM to the Euro-Cordex (12 km) and subsequently to the central European domain (3 km). Using this model chain, we captured the series of European summer heat waves and droughts of 2018-2022. We placed them into the pre-industrial climate and three environments corresponding to +2, +3, and +4 K warmer worlds. We quantified the warming rate per degree of global warming (which sometimes exceeds 2.5 over larger areas) and assessed the role of soil-atmosphere feedback in contributing to these rates. More specifically, for several European heatwaves, we explored the connection of the evaporative regime of a region affected by a heatwave to the region's response to global warming during this event. Taking advantage of the high signal-to-noise ratio of event-based storylines, we add one more dimension - the global warming level - to the scope of land-atmosphere feedback studies.

How to cite: Klimiuk, T., Ludwig, P., Sánchez Benítez, A., Goessling, H., Braesicke, P., and G. Pinto, J.: A Regional Perspective of Storyline Simulations of the Recent European Summer Heatwaves, EGU General Assembly 2024, Vienna, Austria, 14–19 Apr 2024, EGU24-2132, https://doi.org/10.5194/egusphere-egu24-2132, 2024.

EGU24-2258 | ECS | Posters on site | CL2.3

Storyline approach for the analysis of the 2012 drought in Serbia and possible future similar events 

Milica Tosic, Vladimir Djurdjevic, Ivana Tosic, and Irida Lazic

In 2012, Serbia experienced one of its warmest and driest years on record. The summer of 2012 marked the highest temperatures recorded since meteorological measurements began in Serbia, in relation to the reference period from 1991 to 2020. Throughout the summer, the entire country faced severe drought conditions persisting until the end of November. Serbia's agriculture is very vulnerable to drought - an estimated annual economic loss is approximately 2 billion euros due to extreme 2012 drought. Recent studies emphasize the value of the storyline approach in offering a comprehensive and manageable framework for evaluating environmental, societal and economic risks associated with climate change. Considering the potential for more intense climate events resulting from climate change, we decided to apply the storyline approach, to determine what future events similar to drought 2012 might look like and how they are influenced by different climate change scenarios. We constructed drought metrics based on precipitation deficit, following the method proposed by van der Wiel et al. [1], and with the use of the EOBS dataset. Analyzing future scenarios involved creating a meteorological analogue to the 2012 drought, using single model large ensemble historical and future scenario simulations from CMIP6 database - the MPI-M Earth System Model version 1.2, for different SSP scenarios. This analysis offers insights into different storylines, aiding the assessment of climate risks and the potential impacts of hypothetical drought scenarios.

The summer of 2012 was extraordinarily warm, and, as previous studies show significant changes in temperature extremes during the summer season in Serbia, we included analyses of temperature anomalies during the summer. Additionally, to create more comprehensive storylines, our study involves analyzing large-scale atmospheric patterns. Our results show an increase in drought severity in a warmer future, offering an enhanced understanding of how extreme events like the 2012 drought (or more severe) are changing measurably due to climate change, and provide examples of potential impacts, in order to raise public awareness about the potential consequences of future climate change in Serbia.

[1] van der Wiel, K., Lenderink, G. and de Vries, H., 2021. Physical storylines of future European drought events like 2018 based on ensemble climate modelling. Weather and Climate Extremes33, p.100350.

How to cite: Tosic, M., Djurdjevic, V., Tosic, I., and Lazic, I.: Storyline approach for the analysis of the 2012 drought in Serbia and possible future similar events, EGU General Assembly 2024, Vienna, Austria, 14–19 Apr 2024, EGU24-2258, https://doi.org/10.5194/egusphere-egu24-2258, 2024.

EGU24-2286 | ECS | Posters on site | CL2.3

Extreme rainfall in Northern China in September 2021 tied to air–sea multi‐factors 

Yue Sun, Jianping Li, Hao Wang, Ruize Li, and Xinxin Tang

The September rainfall over Northern China (NC) in 2021 was the heaviest since 1961 and had unprecedented socioeconomic impacts. Holding the hypothesis that the drivers of extreme climate events usually contain extreme factors, we firstly propose the Ranking Attribution Method (RAM) to find the possible air–sea multi-factors responsible for this rainfall event. Via the atmospheric bridges of zonal-vertical circulation and Rossby wave energy propagation, the remote factors of warm sea surface temperature anomalies (SSTA) over the tropical Atlantic, cold SSTA over the tropical Pacific, Southern Annular Mode-like pattern in the Southern Hemisphere and North Pacific Oscillation-like pattern in the Northern Hemisphere jointly strengthened the Maritime Continent (MC) convection and Indian monsoon (IM). Through meridional-vertical circulation, the intensified MC convection enhanced the subtropical high over southern China and induced ascending motion over NC. The local factor of extreme air acceleration in the east Asian upper-level jet entrance region further anchored the location of the southwest-northeast rain belt. The strengthened IM and subtropical high over southern China induced considerable moisture transport to the rain belt via two moisture channels. The combined effect of these extreme dynamic and moisture conditions formed this unprecedented rainfall event. This study suggests that the RAM can effectively reveal the factors that contributed to this extreme rainfall event, which could provide a new pathway for a better understanding of extreme climate events.

How to cite: Sun, Y., Li, J., Wang, H., Li, R., and Tang, X.: Extreme rainfall in Northern China in September 2021 tied to air–sea multi‐factors, EGU General Assembly 2024, Vienna, Austria, 14–19 Apr 2024, EGU24-2286, https://doi.org/10.5194/egusphere-egu24-2286, 2024.

EGU24-2365 | ECS | Orals | CL2.3

Sub-seasonal UK winter precipitation intensifies in-line with expected temperature scaling 

James Carruthers, Selma Guerreiro, Hayley Fowler, and Daniel Bannister

Interannual to multi-decadal variability in large-scale dynamics such as atmospheric and oceanic circulation results in significant noise and temporary trends in regional climate. Attempting to understand longer term trends as a result of anthropogenic climate change requires disentangling internal variability and climate change signals. One of these climate signals is the Clausius-Clapeyron (CC) scaling in precipitation resulting from temperature increases. In this work, we characterise and constrain variability in sub-seasonal winter rainfall in the UK resulting from synoptic scale-conditions. The UK experiences periods of sustained precipitation in some winters which result in widespread flooding due to extreme accumulation, such as the winter of 2013/2014. Using categorised sea-level pressure fields and gridded precipitation between 1900-2020, we simulate ‘expected’ precipitation resulting from North Atlantic synoptic conditions. We find a rising trend since the 1980s in observed monthly accumulation which is not reflected in the simulated precipitation timeseries, indicating that recent wet winters in the UK have been wetter than expected given the synoptic conditions. The rising trend in the residual (observed - simulated) mean monthly precipitation is in line with expected CC scaling rate of ~6-7% per degree warming according to changes in UK annual mean temperature. However, the residual in extreme monthly precipitation has scaled at approximately twice that rate. To better understand differences in changes for average and extreme precipitation accumulation, we explore the influence of dynamical feedbacks which may increase precipitation at higher intensities. We find that residual precipitation is influenced by the persistence of synoptic conditions and exhibits remote teleconnections to sea surface temperature and atmospheric conditions in the tropics and sub-tropics. This work highlights the importance of considering variability in large-scale dynamics when identifying climate change signals and sheds light on influences on sub-seasonal to seasonal winter precipitation in the UK.ences on sub-seasonal to seasonal winter precipitation in the UK.

How to cite: Carruthers, J., Guerreiro, S., Fowler, H., and Bannister, D.: Sub-seasonal UK winter precipitation intensifies in-line with expected temperature scaling, EGU General Assembly 2024, Vienna, Austria, 14–19 Apr 2024, EGU24-2365, https://doi.org/10.5194/egusphere-egu24-2365, 2024.

EGU24-2574 | Orals | CL2.3

Statistically impossible temperatures. 

Michael Wehner, Mark Risser, Likun Zhang, and William Boos

The 2021 heatwave in the Pacific Northwest of the United States and Canada was unusual in many regards. In particular, not only was the event deemed impossible prior to the human interference in the climate system, standard out-of-sample non-stationary generalized extreme value (GEV) analyses revealed it to be statistically impossible in 2021 as many observed temperatures were above the upper bound of the upper bound of fitted GEV distributions. Obviously, as the event actually occurred, these statistical models are not fit for the purpose of estimating the influence of climate change on the event’s probability.

By expanding the number of physical covariates beyond just greenhouse gas concentrations and by incorporating spatial statistical techniques in a Bayesian hierarchal framework, we are able to construct a statistical model where observed temperatures during this heatwave were not “impossible” and thus estimate the change in their probabilities leading to Granger-type causal inference attribution statements.

We further extend this statistical framework to all quality daily GHCN station measurements and find that while many physically plausible outlier temperatures are impossible in the simple non-stationary GEV framework, they can be explained using our more complicated non-stationary Bayesian spatial statistical model embedded in a deep learning machinery.


How to cite: Wehner, M., Risser, M., Zhang, L., and Boos, W.: Statistically impossible temperatures., EGU General Assembly 2024, Vienna, Austria, 14–19 Apr 2024, EGU24-2574, https://doi.org/10.5194/egusphere-egu24-2574, 2024.

EGU24-3153 | ECS | Posters on site | CL2.3

A systematic bias in future heatwave diagnostics throughout the seasonal cycle 

Maximilian Meindl, Lukas Brunner, and Aiko Voigt

Human-induced climate change is leading to a warming Earth, resulting in more frequent and intense temperature extremes. Daily temperature extremes can be defined following various approaches, with relative percentile-based thresholds being a common method. Here we explore spatio-temporal heatwaves across the seasonal cycle derived from daily temperature extremes, emphasizing the critical role of the extreme threshold chosen in their definition.

To investigate the sensitivity of heatwave characteristics to the extreme threshold definition, we focus on the approach utilizing a so-called moving threshold. This method involves a 31-day running window to increase the sample size for percentile calculations as well as an additional 31-year running window to account for the impact of global warming. We recognize that introducing a seasonal running window may introduce biases in threshold exceedances. To address this issue, Brunner and Voigt (2023) proposed a simple bias correction method, involving the removal of the mean seasonal cycle before percentile threshold calculation, which we also use here to explore effects on downstream impact metrics. 

We focus on the 99th percentile as threshold and show the potential for a significant bias in the extreme frequency, exceeding 50% in certain regions according to 5 selected CMIP6 models. Our findings further reveal that without bias correction this also leads to a substantial underestimation of derived heatwave properties, in particular area, duration, and magnitude. For the ACCESS-CM2 model, the difference in heatwave area can reach up to 40%, when comparing bias-corrected and not bias-corrected results for the 100 biggest events in the period 1960-1990.

Our results contribute to a better understanding of the implications of using a seasonally running window on heatwave characteristics, providing valuable insights for future climate projections. We emphasize the importance of adopting appropriate methods and bias correction techniques to enhance the accuracy of temperature extreme assessments in the context of ongoing climate change.


References:

Brunner and Voigt (2023): Revealing a systematic bias in percentile-based temperature extremes. EGU General Assembly 2024. EGU24-1722

How to cite: Meindl, M., Brunner, L., and Voigt, A.: A systematic bias in future heatwave diagnostics throughout the seasonal cycle, EGU General Assembly 2024, Vienna, Austria, 14–19 Apr 2024, EGU24-3153, https://doi.org/10.5194/egusphere-egu24-3153, 2024.

EGU24-3174 | Orals | CL2.3

Storylines of East Asian cold extremes in 2020/2021 under different warming climate 

Wenqin Zhuo, Antonio Sánchez-Benítez, Helge Goessling, Marylou Athanase, and Thomas Yung

Whether cold-air outbreak over mid-latitude in a warmer climate would become more or less extreme is a subject of debate, particularly due to uncertainty links between Arctic amplification and these cold extremes, which complicated by the atmosphere internal variability.  Here we employ an event-based storyline approach, which fixed the atmospheric circulation to the observed  through spectral nudging, to quantify thermodynamic effect on extreme cold events during the winter of 2020/2021 in East Asia under different warming scenarios. Notably, we detect the strongest warming, up to +10K, over Eastern Siberia in the +4K-warmer climate, which is related to warmer cold air mass originating from unfrozen sea ice over Siberia region. In contrast, in the southern China, due to the observed and expected increasing aerosol concentration, peaking by the mid-21st century and altering the radiative balances, a mild cooling is present from pre-industrial to present-day climates. The cooling in this region is likely to persist in +2K-warmer scenario but was not observed when up to the +4K warmer climate. Correspondingly, no prominent temperature variation is observed in the middle East Asia, with the warming extent largely mirroring the overall climate background.

How to cite: Zhuo, W., Sánchez-Benítez, A., Goessling, H., Athanase, M., and Yung, T.: Storylines of East Asian cold extremes in 2020/2021 under different warming climate, EGU General Assembly 2024, Vienna, Austria, 14–19 Apr 2024, EGU24-3174, https://doi.org/10.5194/egusphere-egu24-3174, 2024.

A “once-in-a-millennium” super rainstorm battered Zhengzhou, central China, from 07/17/2021 to 07/22/2021 (named “7.20” Zhengzhou super rainstorm). It killed 398 people and caused billions of dollars in damage. ​A pressing question, however, is whether rainstorms of this intensity can be effectively documented by geological archives to understand better their historical variabilities beyond the scope of meteorological data. Here, four land snail shells (Cathaica fasciola) were collected from Zhengzhou in 2021, and weekly to daily resolved snail shell δ18O records from June to September of 2021 were obtained by gas-source mass spectrometry (GSMS) and secondary ion mass spectrometry (SIMS). The daily resolved records show a dramatic negative shift between 06/18/2021 and 09/18/2021, which has been attributed to is related to the “7.20” Zhengzhou super rainstorm. Moreover, the measured amplitude of the shell δ18O shift caused by the “7.20” Zhengzhou super rainstorm is consistent with the theoretical value estimated from the flux balance model and local instrumental data within the error range. Our results suggest that the ultra-high resolution δ18O of land snail shells have the potential to reconstruct local synoptic scale super rainstorm events quantitatively. And the proposed “best practice” of current work indicated that fossil snail shells in sedimentary strata can be valuable material for investigating the historical variability of local super rainstorms under different climate background conditions.

How to cite: Wang, G., Dong, J., and Yan, H.: Quantitative reconstruction of a single super rainstorm using daily resolved δ18O of land snail shell, EGU General Assembly 2024, Vienna, Austria, 14–19 Apr 2024, EGU24-4973, https://doi.org/10.5194/egusphere-egu24-4973, 2024.

EGU24-6659 | Orals | CL2.3

Empirical storylines of climate change using clustering analysis 

Xavier Levine and Priscilla Mooney

Storylines are intended to provide concrete realizations of the climate response to global warming, to help anticipate the possible impacts of climate change on society and nature. Recent studies on climate change storylines have used a multivariate linear regression (MLR) framework to determine those climate realizations, for specific variables, regions and seasons (called target variables); this is achieved by leveraging known climatic interactions across a large number of model projections, which are represented by the covariability of the target variable with pre-determined climate indices (called predictor indices). Yet, a systematic methodology for selecting the best set of predictor indices for a specific target variable is lacking, with the set of predictors usually being chosen according to our current understanding of the most important climatic interactions. Furthermore, the storylines that emerge from it are tailored to explain changes in one specific variable, region and season (the target variable), and thus are unable to be generally applicable to a range of target variables.

Even if the MLR framework succeeds in generating an array of representative climate outcomes for specific cases, we hypothesize that alternative methodologies can be used to generate likely climate outcomes from model simulations while alleviating some of the limitations of the MLR framework. Here, we propose to use clustering analysis to provide possible climate realizations from model projections. Clustering ensures a comprehensive and efficient decomposition of the spread in climate projections found across model simulations, without the need of predefining predictors (both an advantage and inconvenience), but also can be applied to more than one target variable at a time. 

We present findings from various empirical clustering methods, using the three main categories of algorithm (e.g. distribution-, density-, and centroid-based) to produce our so-called empirical storylines. We focus on the Arctic region during the boreal summer season, comparing storylines obtained from each clustering method with findings from a set of “classic” storylines obtained using the MLR framework. We discuss the implications of our results for improving our understanding of the spread in climate projections, and conclude on the existence of a most likely cluster (storyline) by relating our climate change clusters with clusters for the present-day climate. 

How to cite: Levine, X. and Mooney, P.: Empirical storylines of climate change using clustering analysis, EGU General Assembly 2024, Vienna, Austria, 14–19 Apr 2024, EGU24-6659, https://doi.org/10.5194/egusphere-egu24-6659, 2024.

EGU24-6945 | ECS | Orals | CL2.3

Not as Rare as Expected: Assessing Singapore’s Unprecedented Droughts in a Changing Climate 

Xiao Peng, Biao Long, and Xiaogang He

There has been growing evidence suggesting a rising frequency and/or intensity of droughts in tropical regions in a warming climate. Singapore, a water-scarce city heavily reliant on water imports, faces heightened vulnerability to extreme drought episodes. Preparing for unprecedented droughts is thus pivotal for this tropical island city to safeguard a sustainable and resilient water supply. However, the accuracy of quantifying the probability and severity of unprecedented droughts, such as those with a 1000-year return period, is hindered by observations (e.g., in situ measurements, satellite data, etc.) with limited data length, typically spanning only about 50 years. Physics-based regional climate models offer a distinct advantage in simulating extreme droughts beyond historically available data. Yet, naïve Monte Carlo simulations for rare events becomes computationally infeasible at high spatiotemporal resolutions, a scale most relevant in urban drought risk mitigation. In this study, building upon the Giardina-Kurchan-Lecomte-Tailleur algorithm, we develop a computationally efficient framework to simulate Singapore’s unprecedented drought events. Our framework couples the Weather Research and Forecasting (WRF) model with a sequential importance sampling procedure, incorporating the ‘Darwinian pressure’ to favor trajectories conducive to extreme drought conditions. With just slightly over 100 trajectories, we can efficiently simulate very rare drought events (e.g., 1-in-10000-years and rarer) while maintaining their physical plausibility. The WRF model also enables detailed spatiotemporal dynamics of unprecedented droughts, allowing direct estimation of potential compounding extremes, such as concurrent droughts and heatwaves. Moreover, we quantify changes in the likelihood of plausible yet unprecedented droughts under various future climate change scenarios, such as Shared Socioeconomic Pathway 5-8.5 (SSP585), in comparison to the present climate. Our results reveal a robust increase in the chance of unprecedented droughts, emphasizing the importance of developing resilient water strategies for Singapore to prepare for such events in the near future.

How to cite: Peng, X., Long, B., and He, X.: Not as Rare as Expected: Assessing Singapore’s Unprecedented Droughts in a Changing Climate, EGU General Assembly 2024, Vienna, Austria, 14–19 Apr 2024, EGU24-6945, https://doi.org/10.5194/egusphere-egu24-6945, 2024.

EGU24-7744 | ECS | Orals | CL2.3 | Highlight

Storylines for heat-mortality extremes 

Samuel Lüthi, Erich Fischer, and Ana Vicedo-Cabrera

Recent heat extremes reached records far out of the observational temperature range. These extremes challenged the risk view of climate scientists on what could be physically possible within the current climate conditions. However, it is precisely such unprecedented events that pose a large risk to underprepared societies. To better anticipate and prepare for such potential extreme events, the climate risk community started producing storylines which are designed to draw potential and plausible worst-case scenarios without aiming to quantify their probability of occurrence.

The recent development of the ensemble boosting method allows investigating physically plausible extreme heatwaves by re-initializing a climate model with random round-off perturbed atmospheric initial conditions shortly before the onset of a great heat anomaly. This allows for creating storylines whilst ensuring physical consistency. However, so far these storylines were only used to estimate the pure physical climate extreme without the additional quantification of impacts on society.

In this study, we therefore aim to produce several storylines for potential worst-case heat-mortality scenarios. For that, we aim to combine ensemble boosted climate model output with methods from environmental epidemiology to quantify heat-mortality. Concretely, we model the empirical relationship between daily mean temperature and daily mortality counts by using quasi-Poisson regression time series analyses with distributed lag nonlinear models, which is a well-established approach in climate change epidemiology. We then combine these empirical temperature-mortality relationships with the bias-corrected extreme storylines that we developed by ensemble boosting a fully-coupled free-running climate model (CESM2).

The findings of this study have significant implications for societies, particularly in the context of public health policy development, to effectively respond to unprecedented but anticipatable heat extremes.

How to cite: Lüthi, S., Fischer, E., and Vicedo-Cabrera, A.: Storylines for heat-mortality extremes, EGU General Assembly 2024, Vienna, Austria, 14–19 Apr 2024, EGU24-7744, https://doi.org/10.5194/egusphere-egu24-7744, 2024.

EGU24-8388 | ECS | Orals | CL2.3

The Future of Hot-Dry Events in the World’s Breadbasket Regions 

Victoria Dietz, Johanna Baehr, and Leonard Borchert

We use a 50-member large ensemble of the CMIP6 version of the MPI-ESM1.2-LR model to examine the future of hot-dry compound events at 1.5 and 2°C of global warming. By targeting the largest maize production areas (breadbasket regions) and their corresponding growing seasons, we tailor our analysis to food production, indicating potential future threats to global food security. Our results suggest a notable shift in the extremes associated with maize harvest failure in the breadbaskets between 1.5 and 2°C of global warming, highlighting the value of mitigating climate change and the future need to adapt to climate challenges in the agricultural sector.

Our analysis shows a significant increase in the likelihood of these extremes during maize growing seasons across almost all examined regions and variables. In particular, the occurrence probability of heat events and hot-dry compounds at least doubles in most regions when the world warms from 1.5 to 2°C. Locally, cumulated heat excess increases everywhere, while the spatial extent of heat consistently expands across all regions in contrast to the relatively stable pattern we find for precipitation as we transition from one level of global warming to another. We additionally explore spatial compounding, where multiple breadbasket regions experience simultaneous extremes in the same growing season, exacerbating global food security challenges. Scenarios that were virtually impossible in the past, such as hot-dry events affecting at least three regions simultaneously, take on non-zero probabilities in a world that is 1.5 or 2°C warmer. The probabilities of simultaneous heat and hot-dry compounds in a 2°C warmer world significantly exceed those in a 1.5°C warmer world, to the extent that there is little to no overlap between the corresponding ensemble spreads.

How to cite: Dietz, V., Baehr, J., and Borchert, L.: The Future of Hot-Dry Events in the World’s Breadbasket Regions, EGU General Assembly 2024, Vienna, Austria, 14–19 Apr 2024, EGU24-8388, https://doi.org/10.5194/egusphere-egu24-8388, 2024.

In 2015, Limin Jiao et al. used concentric circles and inverse S function curves to analyze the construction land density of 28 major cities in China and successfully divided the internal structure of urban areas. Based on this, this study takes  Beijing-Tianjin-Hebei core area (Beijing, Tianjin and Langfang) and  Shanghai metropolitan area (Yangtze River Delta region) as the research objects, analyze the changes in construction land structure and urban heat island effect from 2001 to 2020.
It is feasible to use the Anselin local Moran I tool of Arcgis to analyze urban centers based on population density (Yingcheng Lia; Xingjian Liu, 2018). We established a fishing net analysis, and the grid with HH significant clustering (high population density surrounded by those of similar high densities) can be regarded as the center of the city. Then, concentric circles with a diameter of 1KM are established based on these center points, and the proportion of construction land in each circle is extracted. And use the inverse S function (Formula 1) to fit the extraction results.
 (1)
The determination coefficient R2 of all fitting results is greater than 0.98, and the results are highly reliable. Then the fitted function is differentiated twice. The two extreme points correspond to the concentric radius of the inner city and the suburbs (R1, R2, and R1<R2) respectively. We found that the radius of the central city and peripheral urban areas of both metropolitan areas has expanded over the past 20 years, with Shanghai's peripheral cities expanding at a faster rate. In addition, the urban radius of Beijing-Tianjin-Hebei is about twice that of Shanghai.
In this study, the urban heat island effect is represented by the difference in surface temperature between suburban areas and Inner City. The results show that the urban heat island effect in the two regions has shown an increasing trend over 

How to cite: Zhang, X., Roca Cladera, J., and Arellano Ramos, B.: Research on urban heat island effect based on concentric circle division of urban structure - Take the Beijing-Tianjin-Hebei and Shanghai metropolitan areas as examples, EGU General Assembly 2024, Vienna, Austria, 14–19 Apr 2024, EGU24-9680, https://doi.org/10.5194/egusphere-egu24-9680, 2024.

EGU24-9911 | ECS | Posters on site | CL2.3

Attribution of European Heatwaves to Global Warming Using Spectrally Nudged Storylines 

Dalena Leon, Frauke Feser, and Linda Van Garderen

This study employs Spectrally Nudged Storylines to attribute heatwaves to anthropogenic global warming. Utilizing high-resolution global (ECHAM) and regional (CCLM) climate models, we aim to discern the influence of anthropogenic climate change on the characteristics of European heatwaves observed in the last decade. Differently to the statistical approach that uses large ensembles/datasets to study large amount of similar events and attribute their occurrence to climate change, the storylines simulate a specific extreme event under different thermodynamical conditions by constraining the large scale dynamics of the system. Thus, directly attributing the change in characteristics of the extreme event to the changes in the thermodynamics, based on the prescribed sea surface temperature and greenhouse gases emission levels. In such way, three storylines are built: a Factual storyline that resembles the climate state as we know it, a Counter Factual storyline that is fixed to the past century representing a world without climate change, and a Plus 2°C storyline that shows how these extreme events change in a world where the global mean temperature is 2°C higher than in pre-industrial times. By the use of these three storylines, we can tell to what extent global warming has provoked heatwaves to be as extreme in a world as we know it, and what can we expect them to be in a warmer future climate.

How to cite: Leon, D., Feser, F., and Van Garderen, L.: Attribution of European Heatwaves to Global Warming Using Spectrally Nudged Storylines, EGU General Assembly 2024, Vienna, Austria, 14–19 Apr 2024, EGU24-9911, https://doi.org/10.5194/egusphere-egu24-9911, 2024.

EGU24-10006 | ECS | Orals | CL2.3

Impacts of regional grid refinement on climate extremes over the Arctic in storyline-based earth system model simulations. 

René R. Wijngaard, Willem Jan van de Berg, Adam R. Herrington, and Xavier Levine

Over the last few decades, the Arctic region has warmed up at a greater rate than elsewhere at the globe, partly resulting from the on-going loss of sea ice and snow over land. It is projected that the amplified warming of the surface will continue in the future, most likely altering the magnitude and frequency of temperature extremes, such as heat waves and cold spells. In addition, the intensity and frequency of extreme precipitation and droughts are projected to change, which may pose serious threats for the human infrastructure and livelihoods. To assess (future) climate extremes, Earth System Models (ESMs) with (regionally) refined resolution could be helpful, particularly in mountainous regions.

In this study, we use the variable-resolution Community Earth System Model version 2.2 (VR-CESM) to evaluate and assess present-day and future climate extremes, such as heat waves and heavy precipitation, over the Arctic. Applying a globally uniform 1-degree grid and a VR grid with regional grid refinements to 28 km over the Arctic and Antarctica, we run present-day (2005–2014) and future (2090–2099) simulations with interactive atmosphere and land surface models, and prescribed sea ice and surface temperatures. The simulations follow two storylines of Arctic climate change that represent a combination of strong/weak polar Arctic amplification and strong/weak SST warming in the Barents-Kara seas. We evaluate the ability of the VR grid to simulate climatic extremes by comparison with gridded outputs of the globally uniform 1-degree grid and the ERA5 reanalysis and assess future climate extremes by focussing on temperature and precipitation extremes. The initial outcomes generally show that for some temperature/precipitation extremes indices the VR grid performs better than the globally uniform 1-degree grid, while for other indices the globally uniform 1-degree grid performs better. Future projections suggest that warm temperature extremes will generally increase both in magnitude and frequency, whereas cold temperature extremes will decrease in magnitude, especially over regions dominated by large sea ice loss. Further, precipitation is projected to increase in intensity and volume. The outcomes of this study may contribute to an improved understanding on future climate extremes and its implications.

How to cite: Wijngaard, R. R., van de Berg, W. J., Herrington, A. R., and Levine, X.: Impacts of regional grid refinement on climate extremes over the Arctic in storyline-based earth system model simulations., EGU General Assembly 2024, Vienna, Austria, 14–19 Apr 2024, EGU24-10006, https://doi.org/10.5194/egusphere-egu24-10006, 2024.

It is well established that internal variability arising spontaneously from the chaotic nature of the climate system can amplify or obscure anthropogenically-forced signals, especially at near-term and at regional scale in the extratropics. In this talk, we focus on Northern Europe (NEU) winter climate changes over the 2020-2040 period and propose a set of internal variability storylines (IVS) to tackle related uncertainties. IVS are built from the combined evolution of the North Atlantic Oscillation (NAO) and the Atlantic Meridional Overturning Circulation (AMOC) diagnosed as drivers of variability for temperature over NEU.

We first show, based on a large ensemble of historical-scenario simulations from CNRM-CM6-1, that, depending on the near-term [AMOC-NAO] doublet evolution, anthropogenically-forced changes can be either considerably amplified with much warmer-wetter mean conditions, almost doubled, or considerably masked with marginal warming and unchanged mean precipitation with respect to present day. We then provide evidence for the robustness of our results by using large-ensembles from several models which ultimately allows assessing the full range of uncertainties for near-term climate change.

We finally use the 2010 severe winter case as an illustrative example of the added-value in expressing climate change knowledge in a conditional form through IVS to plan at best climate-related risks and local adaptation strategies at near term. Reframing the uncertain climate outcomes into the physical science space through IVS grapples the complexity of regional situations; it is also informative to more efficiently communicate towards the general public as well as for climate literacy in general.

How to cite: Cassou, C., Line, A., and Msadek, R.: Assessment of climate change at near-term (2020-2040) over Northern Europe through internal variability storylines, EGU General Assembly 2024, Vienna, Austria, 14–19 Apr 2024, EGU24-11961, https://doi.org/10.5194/egusphere-egu24-11961, 2024.

EGU24-11971 | Posters on site | CL2.3

Insights and Reflections: The 'Exploring Unprecedented Extremes' Workshop 

Dominique Paquin, Dominic Matte, Jens H. Christensen, Martin Drew, and Alexandrine Bisaillon

Due to the various regions and contexts around the world with distinct climatic characteristics, climate hazards vary significantly in their nature, frequency, and impact, causing property damage, population distress, communication failures, environmental damage, and economic losses. Unfortunately, 2023 showcased extreme weather and climate events that have surpassed previous records. These include heatwaves, floods, wildfires, tornadoes. The occurrence of these extreme events poses a challenge to our comprehension of future climates, primarily due to their divergence from our conventional thought patterns or their status as out-of-sample scenarios. With ongoing climate warming, the potential for more severe events in the future is a concern. Insufficient preparation may result in breakdowns within specific sectors or even societal collapse. Effective preparation involves multiple factors, with the initial challenge lying in forming expectations - a task complicated by events that fall outside our usual anticipations, such as out-of-sample occurrences. 


In the face of those climate challenges, understanding and mitigating the impacts of unprecedented climate extremes has become a critical area of focus. To shed light on this challenge, a workshop titled "Exploring Unprecedented Extremes" was convened in November 2023. This event brought together experts from diverse fields to deliberate on innovative approaches to climate change adaptation and mitigation. Emphasizing co-creation and interdisciplinary collaboration, the workshop addressed key themes such as the integration of various sectors into climate change strategies, the complexities of decision-making under uncertainty, and the crucial role of transdisciplinary research in comprehensively understanding and effectively responding to climate extremes. This poster focuses on the key takeaways and strategic reflections that emerged following the workshop, capturing the essence of our collaborative discourse on climate challenges.

How to cite: Paquin, D., Matte, D., Christensen, J. H., Drew, M., and Bisaillon, A.: Insights and Reflections: The 'Exploring Unprecedented Extremes' Workshop, EGU General Assembly 2024, Vienna, Austria, 14–19 Apr 2024, EGU24-11971, https://doi.org/10.5194/egusphere-egu24-11971, 2024.

EGU24-12519 | ECS | Orals | CL2.3

Storyline simulations suggest a northward expansion of European droughts in warmer climates. 

Antonio Sánchez Benítez, Monica Ionita, Marylou Athanase, Thomas Jung, Qiyun Ma, and Helge Goessling

Climate change is causing an increase in the frequency, intensity and persistence of heatwaves and droughts, as seen, for example, in Central Europe in recent years. These changes are expected to be even more severe in the future. Two factors contribute to these changes in extreme events: dynamic changes – changes in the likelihood of weather patterns  – and thermodynamic changes. While the former are uncertain in future climate projections, the latter are characterized by a high signal-to-noise ratio, as there is a robust and ubiquitous rise in land-surface temperatures.

To better understand and analyze both contributions, we employ the so-called "event-based storyline approach", which involves nudging our global CMIP6 coupled climate model (AWI-CM1) towards the observed large-scale free-troposphere winds using various climate background conditions and initial states. This enables us to simulate the same weather conditions, including jet streams and blockings, in different climates: preindustrial, present, and in 2 °C, 3 °C, and 4 ºC warmer worlds. This methodology provides an efficient way of making the consequences of climate change more understandable to experts and non-experts, as extreme events that are fresh in people's memory are simulated in different climates with moderate computational resources.

Our simulations successfully reproduce recent hot and dry extreme events, like the 2019 or 2022 European heatwaves and the record-breaking 2022 drought. Our experiments reveal an intensification of these extremes from preindustrial to present climates (attribution), mainly in southern Europe, with no major changes in Central and Northern Europe. However, we project that this exacerbation will expand northward in future warmer climates, leading to even more severe drought in Central Europe and the Mediterranean by the end of the century. Taking advantage of our methodology we explore the physical mechanisms helping to exacerbate these events in future warmer climates.

How to cite: Sánchez Benítez, A., Ionita, M., Athanase, M., Jung, T., Ma, Q., and Goessling, H.: Storyline simulations suggest a northward expansion of European droughts in warmer climates., EGU General Assembly 2024, Vienna, Austria, 14–19 Apr 2024, EGU24-12519, https://doi.org/10.5194/egusphere-egu24-12519, 2024.

EGU24-12974 | ECS | Orals | CL2.3

On the key role of anthropogenic warming in triggering extreme convective events: the case of the destructive Mediterranean derecho in 2022 

Juan Jesús González-Alemán, Damian Insua-Costa, Eric Bazile, Sergi González-Herrero, Mario Marcello Miglietta, Pieter Groenemeijer, and Markus G. Donat

A derecho is a widespread, long-lived, straight-line windstorm that is associated with a fast-moving group of severe thunderstorms known as a mesoscale convective system.

During 18 August 2022, a highly intense and organized convective storm, classified as a derecho, developed over the western Mediterranean Sea affecting Corsica, northern Italy and Austria, with wind gusts up to 62 m/s and giant hail (~11 cm). There were 12 fatalities and 106 people injured. This event received much attention in the media for its extraordinary impact and the rareness over the Mediterranean Sea. The derecho developed over an extreme marine heatwave that persisted during the whole summer. Therefore, the hypothesis of a relationship between the extreme atmospheric event and the extreme marine heatwave rapidly arose, and thus, a possible link with anthropogenic climate change.

This convective event can be considered as extreme from the affected locations point of view (in terms of winds) but also is between one of the most powerful derechos ever recorded in the USA and Europe. Also, the event developed over an extreme marine heatwave that was mainly affecting the western Mediterranean Sea during summer 2022.

Here, by performing model simulations with both the NCAR Model for Prediction Across Scales and the Météo-France nonhydrostatic operational AROME model and using an storyline approach, we find a relationship between the marine heatwave, the actual anthropogenic climate change conditions, and the development of this extremely rare and severe convective event. We also find a future worrying increase in intensity, size and duration of such an event with future climate change conditions.

How to cite: González-Alemán, J. J., Insua-Costa, D., Bazile, E., González-Herrero, S., Miglietta, M. M., Groenemeijer, P., and Donat, M. G.: On the key role of anthropogenic warming in triggering extreme convective events: the case of the destructive Mediterranean derecho in 2022, EGU General Assembly 2024, Vienna, Austria, 14–19 Apr 2024, EGU24-12974, https://doi.org/10.5194/egusphere-egu24-12974, 2024.

EGU24-15314 | ECS | Orals | CL2.3

Investigating typical patterns for co-occurring heatwaves 

Vera Melinda Galfi

The typicality of extreme weather and climate events denotes their property to exhibit similarities in spatial patterns, temporal evolution, and underlying physical processes, with this resemblance intensifying as events become more extreme. Recent findings highlight that highly intense heatwaves, defined as prolonged local temperature anomalies, are consistently associated with specific large-scale circulation patterns. This suggests that there is a typical way to realise very extreme local temperature anomalies. Here, I will explore typical ways for the emergence of extremely intense hemispheric anomalies, characterized by notably large zonal variations in air temperature or geopotential height. This investigation aims to shed light on preferred atmospheric configurations leading to the simultaneous occurrence of heatwaves on a hemispheric scale.

How to cite: Galfi, V. M.: Investigating typical patterns for co-occurring heatwaves, EGU General Assembly 2024, Vienna, Austria, 14–19 Apr 2024, EGU24-15314, https://doi.org/10.5194/egusphere-egu24-15314, 2024.

EGU24-15334 | Orals | CL2.3

Changes in land-atmosphere coupling may amplify increases in very rare temperature extremes 

Douglas Maraun, Reinhard Schiemann, Albert Osso, and Martin Jury

Extreme heat events are becoming more severe. Attribution studies have demonstrated the effect of anthropogenic climate change on recent devastating events, including the heat waves in Canada in 2021, Northern India in 2022 and the Western Mediterranean in 2023. Such impactful events are very rare with return periods of 100 years and more even in present climate. Their rareness is in stark contrast to the typically considered return periods ranging from less than a year to maybe 20 years. This choice might often be inevitable because of practical limitations, mainly the length of observational and climate model records. But generalising from such analyses to extreme events in general tacitly assumes that very rare events respond to climate change in a similar way as the analysed moderate extreme events. Several studies investigating land-atmosphere feedbacks and atmospheric circulation changes indicate, however, that this assumtion may not be justified.

Here we use three single model initial condition large ensembles (SMILES) to assess differences between projected changes in moderate heat extremes (represented by 2-year return values of the hottest day in a year) and very rare extreme events (represented by corresponding 200-year return values). We analyse changes from 1990-2014 to 2075-2099 according to the SSP5-8.5 scenario.

We find large regions where projected changes in very extreme events are markedly different - both stronger or weaker - to those in moderate extreme events. Model uncertainty about these differences is very high though: all considered SMILES suggest that such regions exist, but they do not agree on the locations.  The underlying mechanisms, however, are robust across models: in regions of increasing soil moisture temperature coupling strength, changes in very rare events can be almost twice as high as those in moderate extremes. Vice versa, in regions of decreasing coupling strength, changes may be much weaker. These changes can to a large extent be traced back to changes in precipitation patterns, highlighting the role of atmospheric circulation changes.  

The corresponding patterns emerge already over shorter time horizons and are thus relevant for mid-century projections, low emission scenarios and event attribution studies. Robust inference about these differences is impossible based on individual model simulations, but requires the sample size of SMILES.  Not accounting for these changes could lead to a dramatic misrepresentation of future climate risks from heat events. Our findings therefore confirm the importance of studies specifically targeting very extreme events.

How to cite: Maraun, D., Schiemann, R., Osso, A., and Jury, M.: Changes in land-atmosphere coupling may amplify increases in very rare temperature extremes, EGU General Assembly 2024, Vienna, Austria, 14–19 Apr 2024, EGU24-15334, https://doi.org/10.5194/egusphere-egu24-15334, 2024.

EGU24-15505 | ECS | Posters on site | CL2.3

Evaluating the simulation of extreme events with the land surface model CLM5.0 over Europe for 2018-2022: comparison with in situ and remotely sensed data 

Arpita Bose, Christian Poppe Terán, Bibi Naz, Visakh Sivaprasad, Stefan Kollet, and Harrie-Jan Hendricks Franssen

Climate change is expected to amplify the frequency and intensity of extreme events in the future. Recently there was a series of summers with heat waves and droughts over central Europe from 2018 to 2022, but also severe flooding in 2021. These events had substantial effects on agriculture, water resources, and human lives. To monitor and assess the impacts of extreme events, in situ and remote sensing data for soil moisture, evapotranspiration and carbon fluxes are important. In this study we evaluate simulation results by the Community Land Model (CLM, version 5.0) over the EUROCORDEX domain for past extreme events between 2018 and 2022 and analyze to which degree the model is able to reproduce low soil moisture levels, and changes in evapotranspiration, leaf area index and carbon fluxes in the areas most affected by the extreme event, on the basis of a comparison with in situ (e.g., ICOS) and remotely sensed (e.g., SMAP, MODIS) data. Additionally, we will compare CLM5.0 results to other land surface models, such as ERA5-Land, GLDAS, GLEAM. Our model setup over EUROCORDEX is driven by atmospheric forcings from the ERA5 reanalysis. The soil texture information is obtained from FAO at 10 km resolution and the land use data is from LULC from NCAR mapped to plant/crop functional types. It was found that CLM5.0 overestimates soil moisture and exhibits a wet bias compared to SMAP during heat waves. In addition, the comparison of measured evapotranspiration with CLM5.0 shows that drought stress response is underestimated by the model. A systematic underestimation or overestimation of the impact of past extreme events on the land surface would point to model limitations which is important to resolve to gain confidence in the simulation of future extreme events under conditions of climate change.

How to cite: Bose, A., Poppe Terán, C., Naz, B., Sivaprasad, V., Kollet, S., and Hendricks Franssen, H.-J.: Evaluating the simulation of extreme events with the land surface model CLM5.0 over Europe for 2018-2022: comparison with in situ and remotely sensed data, EGU General Assembly 2024, Vienna, Austria, 14–19 Apr 2024, EGU24-15505, https://doi.org/10.5194/egusphere-egu24-15505, 2024.

EGU24-16575 | ECS | Posters on site | CL2.3

Enhanced surface temperature over India during 1980–2020 and future projections: causal links of the drivers and trends 

Rahul Kumar, Jayanarayanan Kuttippurath, Gopalakrishna Pillai Gopikrishnan, Pankaj Kumar, and Hamza Varikoden

The Earth’s surface temperatures have increased significantly since the beginning of industrialisation. The substantial emissions of greenhouse gases have played a role in global warming and the ongoing climate change, with projections indicating continued trends. This study explores the long-term surface temperature trends in India from 1980 to 2020, utilizing surface, satellite, and reanalysis data. Causal discovery is employed to assess the impact of geophysical drivers on temperature changes. Southern India exhibits the highest mean surface temperatures, while the Himalayas experience the lowest, aligning with solar radiation patterns. The causal discovery analysis identifies the varying influence of atmospheric processes, aerosols, and specific humidity on surface temperature. Positive temperature trends are observed during the pre-monsoon (0.1–0.3 °C dec−1) and post-monsoon (0.2–0.4 °C dec−1) seasons in northwest, northeast, and north-central India. Northeast India demonstrates substantial annual (0.22 ± 0.14 °C dec−1) and monsoon (0.24 ± 0.08 °C dec−1) warming. Post-monsoon trends are positive across India, with the western Himalaya (0.2–0.5 °C dec−1) and northeast India (0.1–0.4 °C dec−1) experiencing the highest values. Projections based on the Coupled Model Intercomparison Project 6 (CMIP6) indicate potential temperature increases of 1.1–5.1 °C by 2100 under the Shared Socioeconomic Pathways (SSP5)–8.5 scenario. The escalating temperature trend in India raises concerns, emphasizing the necessity for adaptation and mitigation measures to counteract the adverse impacts of accelerated warming and regional climate change.

How to cite: Kumar, R., Kuttippurath, J., Gopikrishnan, G. P., Kumar, P., and Varikoden, H.: Enhanced surface temperature over India during 1980–2020 and future projections: causal links of the drivers and trends, EGU General Assembly 2024, Vienna, Austria, 14–19 Apr 2024, EGU24-16575, https://doi.org/10.5194/egusphere-egu24-16575, 2024.

EGU24-17486 | ECS | Orals | CL2.3

Hydro-economic assessment of biophysical drought impacts on agriculture 

Mansi Nagpal, Jasmin Heilemann, Bernd Klauer, Erik Gawel, and Christian Klassert

As climate changes globally and locally, the risk of temperature anomalies, heat waves and droughts have significantly increased. Studies have demonstrated that droughts exert adverse biophysical effects on crop production, posing an unprecedented threat to harvests and resulting in substantial economic losses in Europe. Assessing these biophysical drought impacts on agriculture is crucial for developing effective strategies for drought preparedness, mitigation, and adaptation. This paper contributes to this effort by presenting a framework to estimate economic costs associated with droughts that specifically captures the biophysical impact of climate change on crop output.

Existing analyses for drought damages in agriculture are developed for a specific drought event and primarily focus on the reduction in farmer’s income or crop yields in drought events. In these assessments, the biophysical impacts of droughts are not isolated and evaluated from their effects on other economic variables such as output prices, resulting in inaccurate damages. Additionally, lack of single universal definition of drought adds complexity to estimating the costs of droughts. This paper is aimed to contribute by focusing on agricultural droughts, which occurs when variability in soil moisture affects plant growth and development. We simulate this biophysical effect of drought on crop yields by applying a statistical crop yield model to data on soil moisture, temperature and perception. This approach helps isolate the direct impact of drought on agriculture from other changes in aggregate economic production (e.g. business conditions, commodity prices) and farmer management decisions (e.g. intermediate input use). The simulated biophysical yield effects are then quantified into monetary terms to estimate economic damages of droughts. We further look into the relationship of the economic damages and the intensity of droughts to determine drought thresholds that lead to increased economic losses.

The results provide bottom-up estimates of the economic damages of drought induced water deficiency in agriculture across Germany for the years 2016-2020. The spatio-temporal patterns of drought impacts can be useful for drought policy planning at local and national level. The economic costs estimation framework could be valuable in estimating farmer compensations and loss and damage of droughts. The results of the study can provide reliable estimates of the costs of climate-change-related extreme weather events, which may help inform macroeconomic and integrated impact assessment models of economic losses (and gains).

How to cite: Nagpal, M., Heilemann, J., Klauer, B., Gawel, E., and Klassert, C.: Hydro-economic assessment of biophysical drought impacts on agriculture, EGU General Assembly 2024, Vienna, Austria, 14–19 Apr 2024, EGU24-17486, https://doi.org/10.5194/egusphere-egu24-17486, 2024.

EGU24-17759 | Orals | CL2.3 | Highlight

A daily ensemble of Past and Future Weather for rapid attribution and future perspectives 

Hylke de Vries, Geert Lenderink, Erik van Meijgaard, Bert van Ulft, and Wim de Rooy

Europe faced many extreme events in the year 2023; storms, heatwaves, intense precipitation, widespread flooding, to mention a few. Long-standing records were broken, and re-broken again. The events invariably received a lot of attention by the media and triggered many questions from journalists, eager to report about them. These questions are typically about the frequency or ‘extremeness’ of the event, whether or how already occurred climate change has impacted this frequency, and what the future perspectives are: Would a similar event in future or past climate have (had) a larger or smaller impact? 

It is a challenge for scientists to answer such (attribution) questions rapidly, i.e., before or on the day of the event, or in the immediate aftermath. Weather attribution teams like WWA (World Weather Attribution) now apply standardised procedures based on combining observations and climate modelling, to produce such analyses within weeks.

Here we discuss an approach that may augment the set of already existing tools and frameworks for rapid attribution analysis. The approach is based on regional downscaling in combination with pseudo global warming (PGW). Each day a small downscaled ensemble is created using as initial and boundary conditions the ECMWF analysis and forecasts. In addition to this ‘present-day’ ensemble, also a ‘past’ and ‘future’ ensemble are created using PGW. Due to the synchronicity of the time-evolution of the past, current and future ensembles, the signal-to-noise ratio is high, allowing an immediate estimate of how (thermodynamic) changes could have contributed to the event, and how a similar event in a future climate could look. Inherent limitation of PGW is that it cannot, or only in a limited way, address the frequency-change aspect. 

We illustrate the PGW-ensemble with a number of events that occurred during 2023 such as storm Hans (August), the December snowfall, and the unprecedented yearly rainfall amount in the Netherlands.

How to cite: de Vries, H., Lenderink, G., van Meijgaard, E., van Ulft, B., and de Rooy, W.: A daily ensemble of Past and Future Weather for rapid attribution and future perspectives, EGU General Assembly 2024, Vienna, Austria, 14–19 Apr 2024, EGU24-17759, https://doi.org/10.5194/egusphere-egu24-17759, 2024.

EGU24-17826 | ECS | Orals | CL2.3

Where and when will the next precipitation record be broken?  

Iris de Vries, Erich Fischer, Sebastian Sippel, and Reto Knutti

Not only will climate change lead to more intense extreme precipitation, it will also lead to more frequent record-breaking daily rainfall. Given the tendency of society to design critical infrastructure and emergency plans based on (statistics derived from) historical observations, an increasing occurrence of record-breaking events – events that are more intense than ever recorded – poses a high risk for loss and damage. 

A major challenge in the projection of very extreme events is their inherent rarity. This problem is even more prominent for record events: by definition these events are not present in sample data because they have not yet occurred. An additional difficulty, which is particularly challenging for precipitation, is the high internal variability in and local character of very rare extremes. This implies that, by chance, an observed data sample of finite size might contain few extremes, whereas the true probability and intensity of extremes given by the (unknown) underlying distribution is much higher. In practice, this can lead to “surprise extremes”. 

With the help of extreme value theory, we approach this problem from two angles, using multi-model CMIP6 data and two different ground-station based observational datasets. Firstly we assess, for all observed land grid cells, where the last observed precipitation record is “extraordinarily long ago” given the theoretical record breaking rate prescribed by historical and future climate according to the CMIP6 models. Secondly, we assess where the last observed record value is “extraordinarily low in intensity” given the historical and future modelled distribution of extreme precipitation. Combining these two approaches, we highlight regions on earth where the probability of record precipitation events in the near future is high.

We find that grid points where the last observed precipitation record is extraordinarily long ago are ubiquitous and scattered globally. When combining this with the observed record intensity, the number of grid points that stand out for their high near-term record probability decreases drastically. We find a somewhat higher density of high-probability grid points in Australia and southern South America, but the pattern is not very clear. Nonetheless, every world region contains a number of grid points where the current observed record is both extraordinarily long ago and low in intensity, and where the near-term probability of a new precipitation record is thus high.

How to cite: de Vries, I., Fischer, E., Sippel, S., and Knutti, R.: Where and when will the next precipitation record be broken? , EGU General Assembly 2024, Vienna, Austria, 14–19 Apr 2024, EGU24-17826, https://doi.org/10.5194/egusphere-egu24-17826, 2024.

EGU24-17905 | Posters on site | CL2.3

Climate projections over the Eastern Mediterranean Black Sea region using a pseudo global warming (PGW) approach.  

Patrick Ludwig, Soner C. Bagcaci, Ismail Yücel, M. Tugrul Yilmaz, and Omer L. Sen

This study presents high-resolution (4 km) simulations of the Weather Research and Forecasting (WRF) model using the pseudo-global-warming (PGW) approach. The aim is to investigate seasonal climatic changes in the Eastern Mediterranean Black Sea (EMBS) region between the periods of 2071-2100 and 1985-2014. The climate change signals retrieved from the CMIP6 GCMs under the highest emission scenario (SSP5-8.5) were added to ERA5 data to account for future climate perturbation. During the baseline period  (1995-2014), the dynamically downscaled ERA5 (not perturbed) and ground observations yielded daily near-surface temperature reach correlations of around 0.98 and daily precipitation correlations ranging from 0.60 to 0.76. The WRF simulations for the future climate accurately represent the low-level anticyclonic circulation over the EMBS caused by anomalous ridge development over southern Italy in winter (DJF) and the decrease in vertical pressure velocity and resulting low-level circulation due to heat-low development over the Eastern Mediterranean in summer (JJA) as represented by the GCMs. Likewise, the wetting and drying patterns in the regional WRF simulations match those in the GCM ensemble over the subregions of the EMBS in winter. However, abnormal precipitation increases occur in the WRF simulations over the Caucasus and nearby regions, which is a new insight as this pattern does not exist in the GCM ensemble. This abnormality is likely caused by the higher-than-expected sea-surface temperature (SST) of the Caspian Sea and considering high-resolution simulations over the complex topography of that region.

How to cite: Ludwig, P., Bagcaci, S. C., Yücel, I., Yilmaz, M. T., and Sen, O. L.: Climate projections over the Eastern Mediterranean Black Sea region using a pseudo global warming (PGW) approach. , EGU General Assembly 2024, Vienna, Austria, 14–19 Apr 2024, EGU24-17905, https://doi.org/10.5194/egusphere-egu24-17905, 2024.

EGU24-18632 | ECS | Posters on site | CL2.3

A climatological look on the intersection of synoptic conditions and extreme weather-induced potential impact events in the cross-border region of Austria and Italy 

Sebastian Lehner, Katharina Enigl, Alice Crespi, Massimiliano Pittore, and Klaus Haslinger
Extreme weather events and associated natural hazards pose a significant global threat to all levels of society. It is scientific consensus that climate change contributes to an increasing frequency and intensity of these events. One of the key challenges for decision-makers in the field of civil protection is to deal with the changing landscape of weather-induced impact events, that are driven by climate change. Hence, assessing the current and changing conditions across spatiotemporal scales for extreme weather events under a changing climate is essential.

This study explores the potential of utilizing weather circulation type classification through its correlation with observed weather-induced extreme events and their potential impacts on the local-scale. Thereby, high-impact weather types can be determined as a relevant background field, serving as a measure about the potential of severe weather hazards. We employ ERA5 reanalysis data as baseline meteorological input data to derive long-term and robust time series of weather types from mean sea level pressure that are relevant for the cross-border region of Austria and Italy. The classification scheme 'Gross-Wetter-Typen' (GWT) with 18 classes was used to assign each day a prevailing weather type class. The overlap between derived classes is further investigated by means of unsupervised clustering techniques, to evaluate clusters of groups across all GWT classes. Additional meteorological fields (e.g. equivalent potential temperature, geopotential height, precipitable water, ...) are validated on top of the GWT classes for further characterisation of extreme weather events. Days exhibiting extreme weather-induced potential impact events are derived via percentile methods applied to precipitation data from observational gridded datasets (Enigl et al., 2024, EGU24-10058). Finally, we extend our analysis with an evaluation of potential changes by applying found relationships to state-of-the-art climate model data from the Coupled Model Intercomparison Project 6 (CMIP6) to investigate the changing landscape of potential weather extremes.

Our findings indicate that a specific subset of large-scale weather circulation patterns acts as a crucial precursor to high-impact weather extremes. Furthermore, considering the climate change scenario SSP3-7.0, the frequency and associated precipitation totals linked to these weather patterns exhibit an increase. This suggests a potential rise in both the frequency and intensity of extreme weather events and their corresponding impacts if emissions continue to increase.

How to cite: Lehner, S., Enigl, K., Crespi, A., Pittore, M., and Haslinger, K.: A climatological look on the intersection of synoptic conditions and extreme weather-induced potential impact events in the cross-border region of Austria and Italy, EGU General Assembly 2024, Vienna, Austria, 14–19 Apr 2024, EGU24-18632, https://doi.org/10.5194/egusphere-egu24-18632, 2024.

EGU24-19572 | ECS | Posters on site | CL2.3

Heatwaves and compound extremes under atmospheric blocking 

Magdalena Mittermeier, Laura Suarez-Gutierrez, Yixuan Guo, and Erich Fischer

In early September 2023, Europe was under the influence of a pronounced atmospheric block in the shape of the Greek letter “omega”. Such an omega-blocking is characterized by a persistent anticyclone in the center flanked by two low pressure systems to the south in the west and east. The omega-block interrupts the mean westerly flow and leads to prolonged persistent conditions lasting for at least five days. The core of the omega-blocking in September 2023 was located over Central Europe and Southern Scandinavia, which experienced a heatwave in the first week of September 2023. On the other hand, the regions positioned at the eastern flanks of the omega-blocking (Greece, Bulgaria, Libya) were hit by heavy precipitation resulting in major floods.

While omega-blocking situations can result in severe spatially compounding extremes, there is still a research gap on current and future dynamics of (omega) blocking. Current generations of climate models underestimate blocking frequencies – especially over Europe. This makes it difficult to derive robust statistics about blocking related compound extremes under current and future climate, because the observational record only offers a limited number of event examples and atmospheric blocking underlies a high natural climate variability.

We employ the novel method of ensemble boosting to explicitly boost blocking situations in the Community Earth System Model 2 (CESM2) large ensemble. With this model re-initialization method initial conditions 10 to 30 days before the event are slightly perturbed, which results in hundreds of coherent physical event trajectories (event storylines). This allows to study following research questions: Is the CESM2 model capable of reproducing an omega blocking event with spatially compounding extremes in the magnitude of the September 2023 event? Could the September 2023 event have been even more devastating by chance? Have we experienced anything close to the most intense compound omega-blocking event possible under current climatic conditions? In our poster, we present our research concept as well as preliminary results.

How to cite: Mittermeier, M., Suarez-Gutierrez, L., Guo, Y., and Fischer, E.: Heatwaves and compound extremes under atmospheric blocking, EGU General Assembly 2024, Vienna, Austria, 14–19 Apr 2024, EGU24-19572, https://doi.org/10.5194/egusphere-egu24-19572, 2024.

EGU24-19808 | Posters on site | CL2.3 | Highlight

Unveiling and communicating climate change by near-real-time attribution and projection of the current weather based on nudged storyline simulations 

Helge Goessling, Marylou Athanase, Antonio Sánchez-Benítez, Eva Monfort, and Thomas Jung

Attribution and projection of climate change by event-based storylines has recently been established as a powerful tool that complements the well-established probabilistic approach. Event-based storylines which nudge the observed atmospheric winds in climate models have been particularly helpful in isolating the thermodynamic component of climate change. The approach is characterised by a high signal-to-noise ratio because differences due to internal variability are effectively removed by imposing (via nudging) the same large-scale atmospheric circulation in different climates. Nudging-based storylines make it possible to unveil the “climate change signal of the day” for the actually observed weather, be it an extreme or an every-day event, which comes with a great potential for climate change communication. Here we take the approach one step further and present our efforts to provide nudging-based climate storylines in near-real-time. This includes not only the automated extension of storyline simulations on a daily basis, but also the dissemination via an online tool that allows both scientific and non-scientific users to explore the “climate change signal of the day” for a number of relevant variables in useful and intuitive ways. While the omission of possible dynamical changes and the reliance on a single model need to be communicated as clear limitations, we envisage that tools like our prototype may become an important piece of the future dissemination portfolio of climate change information.

How to cite: Goessling, H., Athanase, M., Sánchez-Benítez, A., Monfort, E., and Jung, T.: Unveiling and communicating climate change by near-real-time attribution and projection of the current weather based on nudged storyline simulations, EGU General Assembly 2024, Vienna, Austria, 14–19 Apr 2024, EGU24-19808, https://doi.org/10.5194/egusphere-egu24-19808, 2024.

The estimation of reference evapotranspiration (ETo) holds significant importance for the hydrological cycle, necessitating an extensive understanding of the various climate variables and their influence on ETo variability. This study aims to examine spatio-temporal variations in Penman Monteith based ETo estimations and the factors contributing to their changes over the Indian subcontinent in the historic and future climate change. Using climate variables from the ERA5 reanalysis and CMIP6 simulations this study focuses on the changes in ETo across different aridity zones in the study area. Further, the partial least squares (PLS) regression was employed to determine the relative contribution of different climate variables on ETo trends. Results show that the majority (70%) of the areas in the subcontinent exhibited decreasing ETo trends in the historical past. Zonal analysis of ETo trends revealed all zones except the humid zone exhibited a significant decreasing trend for ETo. Contribution analysis shows that, across the study area, temperature and radiation are the most significant factors influencing ETo, followed by wind speed and relative humidity. Further, temperature and ETo were found to be having opposing tendencies, highlighting an “evapotranspiration paradox” that encompasses the majority of the study area. CMIP6 simulations show that ETo is projected to increase significantly across the Indian subcontinent, especially in the semi-arid and arid regions with temperature and radiation being the dominant factor contributing to increases in ETo.

How to cite: Varghese, F. C. and Mitra, S.: Spatio-temporal variation of reference evapotranspiration and its contributing factors over the Indian subcontinent under historic and future climate change, EGU General Assembly 2024, Vienna, Austria, 14–19 Apr 2024, EGU24-675, https://doi.org/10.5194/egusphere-egu24-675, 2024.

EGU24-878 | ECS | Orals | CL4.1

Land-Climate Nexus: Unravelling Extremes with Attention Networks 

suchismita subhadarsini, D. Nagesh Kumar, and S. Govindaraju Rao

The intricate interplay between land use, climate dynamics, and other contributing factors significantly influences the occurrence of extreme events such as droughts, floods, and heatwaves. Modeling this complex system in a high-dimensional space poses a formidable challenge, given incomplete understanding and limited availability of data. This study explores the application of deep learning approaches, specifically leveraging transformer architectures, to capture long-range dependencies in spatiotemporal data. These mechanisms are then employed to encapsulate the complex interactions between land use, climate, and other factors influencing extreme events. The proposed approach incorporates attention mechanisms, enhancing interpretability by highlighting crucial spatial and temporal features essential for forecasting. To evaluate the effectiveness of this methodology, a case study was conducted on the Godavari River Basin in India. Utilizing vegetation indices as a representation of crop type and land use, alongside climate data spanning from 2000 to 2020, the results provide valuable insights into the driving factors behind land use change and climate extremes in the region. The study not only demonstrates predictive capabilities of the proposed approach but also offers insights into the intricate relationships within the land-atmosphere feedback system. The extracted information is useful for making informed decisions related to land management, climate adaptation, and disaster risk reduction.

How to cite: subhadarsini, S., Kumar, D. N., and Rao, S. G.: Land-Climate Nexus: Unravelling Extremes with Attention Networks, EGU General Assembly 2024, Vienna, Austria, 14–19 Apr 2024, EGU24-878, https://doi.org/10.5194/egusphere-egu24-878, 2024.

EGU24-1608 | Orals | CL4.1

Forest Canopy Transpiration: A Key Moderator of Hydroclimate Variability and Extreme Rainfall in the Maritime Continent 

Min-Hui Lo, Ting-Hui Lee, Jason Hsu, Chun-Lien Chiang, and Yan-Ning Kuo

This study investigates the interannual variability of evapotranspiration (ET) in the Maritime Continent (MC), focusing on the dynamics behind its minimal fluctuations despite significant changes in precipitation due to the El Niño-Southern Oscillation. We analyze ET components - canopy evaporation (CE), canopy transpiration (CT), and soil evaporation (SE) - and uncover a self-compensating mechanism between CE and CT. During El Niño, increased CT offset decreased CE and SE, maintaining ET's stability. Conversely, La Niña shows an inverse pattern. Additionally, the research examines the impacts of deforestation on extreme precipitation in MC. Deforestation disrupts the ET balance by removing CT's stabilizing effect, amplifying ET variability, and altering precipitation patterns. Our findings propose a new precipitation paradigm in MC under deforestation: "rich-get-richer, poor-get-poorer, and the middle-class-also-get-poorer," marked by increased variability in extreme precipitation events. The study highlights the critical role of MC's forest canopy transpiration in moderating ET variability and its significant influence on the hydroclimatological cycle, especially under deforestation. This intricate interplay between deforestation, ET, and precipitation emphasizes the need to consider both local land use and broader climatic changes in understanding and managing the region's water cycle and extreme climate events.

How to cite: Lo, M.-H., Lee, T.-H., Hsu, J., Chiang, C.-L., and Kuo, Y.-N.: Forest Canopy Transpiration: A Key Moderator of Hydroclimate Variability and Extreme Rainfall in the Maritime Continent, EGU General Assembly 2024, Vienna, Austria, 14–19 Apr 2024, EGU24-1608, https://doi.org/10.5194/egusphere-egu24-1608, 2024.

EGU24-1973 | ECS | Orals | CL4.1

Global South most affected by socio-ecosystem productivity decline due to compound heat and flash droughts 

Lei Gu, Erich Fischer, Jiabo Yin, Louise Slater, Sebastian Sippel, and Reto Knutti

Flash droughts (FDs) and heatwaves are posing disproportionate biophysical and social losses worldwide, particularly threatening the disadvantaged communities in the Global South. However, the underlying physical mechanisms behind compound heat-flash drought (CHFD) events and their impacts on global socio-ecosystem productivity remain elusive. Here using satellites, reanalysis, reconstructions, and field measurements, we find more dry regions (53%~62%) with above-average ratios of FDs accompanied by extreme heat than humid regions (50%~57%), due to asymmetric effects by synoptic weather systems. The CHFDs associated with strong soil moisture-temperature coupling aggravate the constraint on plant photosynthesis in dry regions, whereas this coupling-related vegetation stress is not significant in humid regions. We further develop a global risk framework that integrates CHFD hazards, population/agriculture exposures, and vulnerability, and find the Global South is the primary region affected by CHFDs, contributing to greater-than-usual carbon uptake reduction, 90%~94% and 76%~86% of risks to world population and agriculture over the past four decades. We reveal the Global South is severely affected by the impacts of CHFDs on socio-ecosystem productivity decline and underscore the importance of efforts to monitor, predict, and mitigate the rise in CHFDs. 

How to cite: Gu, L., Fischer, E., Yin, J., Slater, L., Sippel, S., and Knutti, R.: Global South most affected by socio-ecosystem productivity decline due to compound heat and flash droughts, EGU General Assembly 2024, Vienna, Austria, 14–19 Apr 2024, EGU24-1973, https://doi.org/10.5194/egusphere-egu24-1973, 2024.

The land-atmosphere coupling is responsible for flash droughts as the reduced soil moisture increases sensible heat and consequently the lifting condensation level, which ultimately reduces convective precipitation. Meanwhile, the decrease in atmospheric humidity increases the evaporation demand, facilitates the drying of the land surface, and triggers flash droughts with rapid onset and devastating impact. However, whether the role of the land-atmosphere coupling is enhanced or weakened under climate change remains elusive, as previous studies are usually based on unconditional analysis without discriminating dry or wet extremes. Here, we start the investigation from a mega-flash drought occurred over the Yangtze River basin in southern China during the summer of 2022. Both the offline high-resolution land surface model simulations and the CMIP6 climate model data are used for the analysis. It is found that high temperature aggravates the 2022 flash drought onset speed and intensity, highlighting the importance of climate warming. Even under natural climate forcings, the land-atmosphere coupling increases the risks of flash drought intensity and onset speed. The synergy of coupling and anthropogenic climate change would further increase the risks. The synergistic effect on the long-term trends of flash droughts is also being explored, shedding light on the mechanism of flash droughts in a changing climate.

How to cite: Yuan, X.: Synergistic effect of land-atmosphere coupling and climate change on flash droughts, EGU General Assembly 2024, Vienna, Austria, 14–19 Apr 2024, EGU24-2848, https://doi.org/10.5194/egusphere-egu24-2848, 2024.

EGU24-3079 | ECS | Orals | CL4.1

Causal analysis of Heatwaves in India: Impact of Remote Soil Moisture 

Abhirup Banerjee, Armin Koehl, and Detlef Stammer

Heatwaves are a significant threat to human health, agriculture, and infrastructure; particularly in India, where they are prevalent during the pre-monsoon months. May is a critical period for heatwave occurrences, severely impacting the Indian subcontinent. This work delves into the underlying mechanisms driving heatwaves in India, specifically focusing on those that occur in May. Utilizing an intermediate complexity earth system model, PLASIM1, and its adjoint2 for sensitivity analysis3, we systematically investigate the causal role of remote soil moisture in heatwave formation. We find that variations in remote soil moisture significantly influence the strength and duration of pre-monsoon heat waves in India. Our analysis shows that at a lead time of 10-15 days, higher soil moisture particularly over the Middle East, can prolong heatwave conditions over India. On the other hand, high soil moisture over India suppresses the development of heatwaves with no lag. The delayed mechanism of remote soil moisture works through the altered atmospheric circulation patterns induced by heat flux forcing modulated by soil moisture anomalies, leading to enhanced subsidence and reduced moisture transport to India. Our study provides valuable insights into the mechanisms driving heatwaves in India, particularly those in May. These insights are crucial for developing effective early warning systems, enhancing disaster preparedness, and implementing mitigation strategies to reduce the adverse impacts of these extreme events.

1The Planet Simulator (PlaSim): a climate model of intermediate complexity for Earth, Mars and other planets.

2Marotzke, Jochem, et al. "Construction of the adjoint MIT ocean general circulation model and application to Atlantic heat transport sensitivity." Journal of Geophysical Research: Oceans 104.C12 (1999): 29529-29547.

3Köhl, Armin, and Andrey Vlasenko. "Seasonal prediction of northern European winter air temperatures from SST anomalies based on sensitivity estimates." Geophysical Research Letters 46.11 (2019): 6109-6117.

How to cite: Banerjee, A., Koehl, A., and Stammer, D.: Causal analysis of Heatwaves in India: Impact of Remote Soil Moisture, EGU General Assembly 2024, Vienna, Austria, 14–19 Apr 2024, EGU24-3079, https://doi.org/10.5194/egusphere-egu24-3079, 2024.

Assessing the impacts of anthropogenic land use and land cover change (LULCC) on climate extremes is of public concern, calling for the use of state-of-the-art experiments and datasets to update our knowledge. Here, we used the CMIP6-LUMIP experiment results to depict the realistic LULCC effects on extreme temperature and extreme precipitation over both historical and future periods. We pointed out some interesting findings over the historical period: Approximately 1oC decrease in the maximum temperature, and up to nearly 2oC decrease in the minimum temperature in the mid-high latitude of the North Hemisphere. About 10 annual heatwave days can be avoided by LULCC effects in 10% of specific LULCC-intense regions. Three LULCC-intense regions in the North Hemisphere have experienced cooling effects in intensity, frequency, and duration aspects. The precipitation displayed a clear contrast change between the North Hemisphere (wetter) and the South Hemisphere (drier), especially on light rainy days (R1mm). Results of the future period indicate that the tropical deforestation regions are projected to induce a remarkably hotter and drier trend. However, the climate responses averaged globally to deforestation have no obvious changes due to the colder and wetter compensation responses in other regions. The maximum temperature increase in deforestation regions is prominent in intensity, frequency, and duration aspects, while the drought is mainly manifested by frequency and duration reduction of precipitation. Seasonal cycle of changes in temperature indices can be discovered in the North Hemisphere mid-latitude deforestation region, tropical region shows year-round consistency. Changes in LULCC induced climate extremes are more obvious under the low-emission scenario in general. Our work is devoted to portraying the latest and more realistic picture of LULCC impacts on climate extremes and gives early warning information to policymakers and the public.

How to cite: Zhang, M. and Gao, Y.: Impacts of anthropogenic land use and land cover change on climate extremes based on CMIP6-LUMIP experiments, EGU General Assembly 2024, Vienna, Austria, 14–19 Apr 2024, EGU24-4834, https://doi.org/10.5194/egusphere-egu24-4834, 2024.

EGU24-5226 | Posters on site | CL4.1

Using HydroTiles to represent different hydrological regimes in a global Earth System model 

Tobias Stacke, Philipp de Vrese, Veronika Gayler, and Victor Brovkin

Land surface regions that are of crucial importance for climate dynamics, such as Arctic permafrost landscapes, are often extremely heterogeneous. In these areas, hydrological processes and heat fluxes, which are influenced by topographic features on the scale of a few meters, can affect processes such as permafrost thaw over large regions. Despite the emergence of Earth system models that can operate at a resolution down to one kilometer, hydrological heterogeneity at smaller scales is often overlooked. In addition, high-resolution models are computationally intensive, making them unsuitable for the time scales required to study the climate impacts of processes such as permafrost thaw.

In this study, we present an extension to the tiling infrastructure of the ICON Earth system model that enables the representation of different hydrological regimes within individual grid cells. This innovative approach facilitates the representation of lateral water flow connections between different areas within grid cells and the simultaneous representation of different surface water and soil moisture states, such as dry and wet conditions, within a single grid cell. The impact of this improvement is twofold. First, it provides a more accurate representation of surface and soil hydrology. Second, it is expected to improve the representation of land-atmosphere coupling, allowing us to better capture feedbacks across landscapes affected by strong hydrologic contrasts.

By enabling the representation of hydrological features in subgrids through tiles, which we call HydroTiles, we hypothesize that the HydroTiles setup could replicate some features of high-resolution simulations even at lower resolutions. This approach offers the potential to make simulations more computationally cost-efficient. In our presentation, we would like to highlight the advantages and disadvantages of the HydroTile setup compared to high-resolution simulations.

How to cite: Stacke, T., de Vrese, P., Gayler, V., and Brovkin, V.: Using HydroTiles to represent different hydrological regimes in a global Earth System model, EGU General Assembly 2024, Vienna, Austria, 14–19 Apr 2024, EGU24-5226, https://doi.org/10.5194/egusphere-egu24-5226, 2024.

EGU24-5392 | ECS | Posters on site | CL4.1

Examining the impact of extreme land surface temperature and land cover on heatwave occurrence: The case of MENA region  

Mohammadsaeed asghariian, Parvin Azizi, Milad Aminzadeh, and Nima Shokri

The increase in Land Surface Temperature (LST) in a changing climate is expected to alter the intensity and frequency of heatwaves by shifting the energy partitioning over the land surface. The relationship between LST and hot air temperatures, influenced by land cover and associated changes in surface properties is not fully understood, particularly in dry regions of the world experiencing prolonged droughts. Extremely high LSTs and their projected changes [1] may stress resilience and adaptive capacities of the growing population in the Middle East and North Africa (MENA). We thus investigate the evolution of extremely high LSTs in MENA over the past two decades to identify its coupling with hot air temperatures considering different land cover types. Our preliminary results highlight the difference in warming rates of LST and air temperature across different land covers thus enabling to identify the role of land temperature extremes in triggering heatwave events. We observed that variation of land temperature arising from land cover changes (affecting soil moisture dynamics and surface thermal and radiative properties) may significantly influence the occurrence and the intensity of heatwaves in this region. The study offers valuable insights into the complex interplay between land and air hot extremes that are particularly important in local climate investigations, agricultural practices, and ecosystem functions.

Reference

[1] Aminzadeh, M., Or, D., Stevens, B., AghaKouchak, A., & Shokri, N. (2023). Upper bounds of maximum land surface temperatures in a warming climate and limits to plant growth. Earth's Future, 11, e2023EF003755. https://doi.org/10.1029/2023EF003755

How to cite: asghariian, M., Azizi, P., Aminzadeh, M., and Shokri, N.: Examining the impact of extreme land surface temperature and land cover on heatwave occurrence: The case of MENA region , EGU General Assembly 2024, Vienna, Austria, 14–19 Apr 2024, EGU24-5392, https://doi.org/10.5194/egusphere-egu24-5392, 2024.

EGU24-5644 | ECS | Orals | CL4.1 | Highlight

The relationship between forest fragmentation and extreme high temperature 

Ran Du and Yanhong Gao

Warming lead to a surge in extreme climate events, including heatwaves, droughts, flooding, and wildfires. Numerous studies demonstrate that these occurrences have become more frequent, which exerts notable influences on socio-economic development and human health. Besides natural climate changes, land use and land cover changes (LULCC) play a crucial role in shaping extreme climates. As the most extensive land use type globally, forest has experienced great changes since the industrial evolution. Deforestation is one of the most notable global environmental issues. Besides the decrease of the coverage, fragmentation is one of the appearances of deforestation. Many studies have demonstrated that forest distribution shows high agreements with climate regimes generally, however, the relationship between forest fragmentation and extreme climate events remain unclear. This study analyzes the relation between forest fragmentation and main extreme high temperature indices in 2000-2020. Global continental areas are categorized into regions with increased and decreased forest fragmentation index. Regions with increased index, such as the southeast Amazon, Congo Basin, and parts of the Southeast Asia are emphasized. The 11 extreme temperature indices are analyzed responded to the forest fragmentation index change. This study could provide insights for forest management strategies adapting to climate change in the future.

How to cite: Du, R. and Gao, Y.: The relationship between forest fragmentation and extreme high temperature, EGU General Assembly 2024, Vienna, Austria, 14–19 Apr 2024, EGU24-5644, https://doi.org/10.5194/egusphere-egu24-5644, 2024.

The Vietnamese Mekong Delta (VMD) is the most productive region in Vietnam in terms of agriculture and aquaculture. Unsurprisingly, droughts have emerged as a persistent concern for stakeholders throughout the VMD in recent decades. In the evolution and intensification of droughts, local feedbacks in the Land-Atmosphere (LA) interactions were considered to play a crucial role. Previous studies mainly focused on the water cycle feedback loop (e.g., soil moisture-evaporation-precipitation) in the LA interactions. However, there is a noticeable gap in the feedback loop of coupled water and energy balances (e.g., soil moisture-sensible heat-precipitation) associated with the anomalies in sensible heat and precipitation. Therefore, deep understanding of the roles of key variables and their inter-relationships in the LA interactions is of great significance for local communities and authorities. In this study, a deep learning model, named Long- and Short-term Time-series Network (LSTNet), was applied to simulate the LA interactions over the VMD. With the ERA5 data as modelling inputs, the role of each key variable (e.g., soil moisture, sensible and latent heat) in the LA interactions over the past decade (2011-2020) was investigated, and the variations of these variables and their inter-relationships in the future period (2015-2099) were also analyzed based on the Coupled Model Intercomparison Project Phase 6 (CMIP6) data. The LSTNet model has demonstrated that the deep learning algorithm can effectively capture the relative importance of key variables in the LA interactions. We found it is crucial to evaluate the effect of coupled temperature and sensible heat on the LA interactions, particularly for the regions that are susceptible to concurrent droughts and heatwaves, as the co-occurrence of dry and hot weather conditions would inhibit the formation of precipitation and intensify the drought severity. Moreover, the decline in soil moisture and the rise in sensible heat under a changing climate are anticipated to further diminish precipitation in the future. This study would not only enhance our knowledge of the feedback mechanisms in the LA interactions during the drought evolution and intensification, but also provide valuable insights for further development and advancement of hydrologic models for drought monitoring and forecasting.

How to cite: Zhou, K., Shi, X., and Renaud, F.: Deep Learning-Based Analyses of Feedback Mechanisms in the Land-Atmosphere Interactions during Droughts over the Vietnamese Mekong Delta, EGU General Assembly 2024, Vienna, Austria, 14–19 Apr 2024, EGU24-5756, https://doi.org/10.5194/egusphere-egu24-5756, 2024.

EGU24-6099 | ECS | Orals | CL4.1

How strong is land-atmosphere coupling in global storm-resolving simulations? 

Junhong Lee and Cathy Hohenegger

The debate on the sign of land-atmosphere coupling has not been solved so far. On the one hand, studies using global coarse-resolution climate models have claimed that the land-atmosphere coupling is positive. But, such models use convective parameterizations, which is a source of uncertainty. On the other hand, studies using regional climate models with explicit convection have reported negative coupling. Yet, the large-scale circulation is prescribed in such models, and interactions with the ocean are neglected. In this study, we revisit the land-atmosphere coupling using a global fully coupled storm-resolving simulation that has been integrated at a grid spacing of 5 km over a full seasonal cycle, and we compare these results to a coarse-resolution climate model simulation using parameterized convection. We find that the coupling between soil moisture and precipitation is weaker and more negative in the storm-resolving than in the coarse-resolution simulation. Further analysis indicates that not only the feedback between soil moisture and evapotranspiration but also between evapotranspiration and precipitation is weaker in the storm-resolving simulation, in better agreement with observations. Reasons for the differences will be mentioned.

How to cite: Lee, J. and Hohenegger, C.: How strong is land-atmosphere coupling in global storm-resolving simulations?, EGU General Assembly 2024, Vienna, Austria, 14–19 Apr 2024, EGU24-6099, https://doi.org/10.5194/egusphere-egu24-6099, 2024.

EGU24-7942 | ECS | Orals | CL4.1

The cooling effect induced by the Three Gorges Reservoir operation in observations and model simulations 

hongbin li, weiguang wang, and giovanni forzieri

The Three Gorges Dam, the world's largest hydropower project, and its impoundment reservoir have notably modified land cover, with potential implications for regional hydroclimate. However, the seasonal dynamic climate feedbacks arising from variations in water body areas managed by the Three Gorges Reservoir (TGR) remains poorly understood. Based on data-driven analysis and regional climate simulations, we depict the impact of the TGR regulation activities on local land surface temperature (LST) and biophysical processes across different spatiotemporal dimensions, determine the spreading extent of this effect to external territories, and further identify the quantitative attributions between regional climate variabilities and the TGR operation. Results indicate that the TGR induces more pronounced daytime cooling from May to October, particularly in June-August (JJA) with -2.41±0.23 K. The influence of TGR on nighttime LST transitions to warming effects in most regions from November to April (NDJFMA). The significantly increased latent heat (LH) from evaporation growth dominates cooling effects, particularly during daytime, while in JJA, the effects of evaporation are constrained to some extent by abundant precipitation. Albedo exerts a comparatively significant dominance on the nighttime LST in NDJFMA. The TGR-induced surroundings LST changes are notably discernible within an approximately 10 km buffer. The simulations amplify the magnitude and extent of the TGR cooling effect. The simulation results reveal significant reductions in LST of 6.08% (-1.42 K, JJA) and 4.58% (-1.04 K, December-January-February, DJF). respectively, TGR-induced LH variations are dominant for cooling (contributions: -52.09% in JJA; -71.98% in DJF, respectively) among the diverse energy components. This study is valuable for providing scientific guidance in reservoir planning under changing climate.

How to cite: li, H., wang, W., and forzieri, G.: The cooling effect induced by the Three Gorges Reservoir operation in observations and model simulations, EGU General Assembly 2024, Vienna, Austria, 14–19 Apr 2024, EGU24-7942, https://doi.org/10.5194/egusphere-egu24-7942, 2024.

EGU24-8546 | Orals | CL4.1

Role of infiltration on land–atmosphere feedbacks in Central Europe: WRF-Hydro simulations evaluated with cosmic-ray neutron soil moisture 

Joel Arnault, Benjamin Fersch, Martin Schrön, Heye Reemt Bogena, Harrie-Jan Hendricks-Franssen, and Harald Kunstmann

The skill of climate models partly relies on their ability to represent land–atmosphere feedbacks in a realistic manner, through the coupling with a land surface model. However, these models often suffer from insufficient or erroneous information on soil hydraulic parameters. In this study, the land–atmosphere model WRF-Hydro driven with ERA5 reanalysis is employed to reproduce the regional climate over Central Europe with a horizontal resolution of 4 km, for the period 2017-2020 during which cosmic-ray neutron sensor (CRNS) soil moisture is available at three Terrestrial Environmental Observatories. The soil hydraulic parameter datasets referred to as SoilGrids and EU-SoilHydroGrids, together with Campbell and van Genuchten–Mualem retention curve equations, are used to assess the role of infiltration on modeled land–atmosphere feedbacks. After calibration of the percolation parameter to better capture observed discharge amounts in the observatories, it is found that WRF-Hydro with Campbell and SoilGrids gives the lowest mean temperature and mean precipitation differences compared to the E-OBS product from European Climate Assessment & Dataset, by reducing soil moisture in the rootzone, increasing temperature, and decreasing precipitation through a positive soil moisture–precipitation feedback process. WRF-Hydro with van Genuchten–Mualem and EU-SoilHydroGrids best reproduces CRNS soil moisture daily variations, despite enhanced positive biases that generate a larger proportion of convective precipitation favored over wet soils and spurious discharge peaks. The question remains open whether an infiltration modeling option that better captures CRNS soil moisture dynamics can also lead to a clear improvement of the simulated climate.

How to cite: Arnault, J., Fersch, B., Schrön, M., Bogena, H. R., Hendricks-Franssen, H.-J., and Kunstmann, H.: Role of infiltration on land–atmosphere feedbacks in Central Europe: WRF-Hydro simulations evaluated with cosmic-ray neutron soil moisture, EGU General Assembly 2024, Vienna, Austria, 14–19 Apr 2024, EGU24-8546, https://doi.org/10.5194/egusphere-egu24-8546, 2024.

EGU24-9084 | ECS | Posters on site | CL4.1

Sensitivity of the simulated regional climate to changes in the prescribed soil type distributions: Insights from Coupled Regional Climate Model EBU-POM 

Irida Lazic, Vladimir Djurdjevic, Ivana Tosic, and Milica Tosic

In previous studies, it was noticed that many high-resolution Regional Climate Models (RCMs) simulations within the state-of-the-art EURO-CORDEX multi-model ensemble tend to overestimate air temperature and underestimate precipitation in summer leading to the so-called summer drying problem. One of the possible and considerable sources of uncertainty in simulated regional climate is the choice of soil texture database and its soil parameter values. This is crucial because soil hydrophysical properties, influenced by such choices, have an impact on soil moisture and therefore affect the partitioning of surface fluxes [1]. These properties among others play a role in controlling the evolution of soil and air temperature, evapotranspiration, runoff, and precipitation. 

To better understand one of the possible reasons for this problem, we performed two simulations with the coupled regional climate model EBU-POM with two different prescribed soil type distributions. One simulation used the soil type dataset derived from the Zobler dataset and in the second simulation, we used FAO/STATSGO dataset. Two 11-year EBU-POM simulations were conducted, spanning the period from 2000 to 2010. These simulations were initiated in 1998, allowing a two-year spin-up time to reduce the impact of initial fields. The area of interest was Central Europe with a focus on Pannonian Basin because previous studies indicated pronounced dry and warm biases during summer and autumn in low-lying areas, especially in south-eastern Europe. 

The soil moisture capacity is influenced by its hydrophysical characteristics, wherein the size of soil grains plays a crucial role. In this investigation, we emphasized and analyzed the significance of soil hydrophysical properties in shaping surface fluxes. We performed the comprehensive analysis with a focus on the most common specific soil category transitions related to changes in soil parameters and bias changes in surface and near-surface variables and fluxes. The main goal of this study is not to inspect the accuracy of the soil texture map but rather to comprehend the impact on modeled surface and near-surface variables when employing one soil texture dataset versus the other. 

On the other hand, Seneviratne et al. [2] suggested that a new transitional zone characterized by strong land-atmosphere interactions shifted northwards to central and eastern Europe as a consequence of global warming. Their findings highlighted that increased temperature variability in this region is mainly due to land-atmosphere feedbacks. Hence, we analyzed bias in surface and near-surface variables and fluxes and their relation to extreme events such as the heat wave occurred in 2007 to determine their influence on heat wave formation.

[1] Dennis, E. J., and Berbery, E. H. (2021). The role of soil texture in local land surface–atmosphere coupling and regional climate. Journal of Hydrometeorology22(2), 313-330.

[2] Seneviratne, S. I., Lüthi, D., Litschi, M., and Schär, C. (2006). Land–atmosphere coupling and climate change in Europe. Nature, 443(7108), 205-209.

Keywords: regional climate modelling, soil moisture, soil texture, land-atmosphere interactions

Acknowledgement: This research was supported by the Science Fund of the Republic of Serbia, No. 7389, Project Extreme weather events in Serbia - analysis, modelling and impacts” - EXTREMES

How to cite: Lazic, I., Djurdjevic, V., Tosic, I., and Tosic, M.: Sensitivity of the simulated regional climate to changes in the prescribed soil type distributions: Insights from Coupled Regional Climate Model EBU-POM, EGU General Assembly 2024, Vienna, Austria, 14–19 Apr 2024, EGU24-9084, https://doi.org/10.5194/egusphere-egu24-9084, 2024.

EGU24-9091 | ECS | Orals | CL4.1

Analysis of trends in surface energy fluxes under hot conditions using remote sensing products 

Almudena García-García and Jian Peng

Studying land-atmosphere interactions is important for understanding the mechanisms leading to changes in temperature and precipitation extremes. However, the non-conservation of energy and water in most products and their coarse spatial and temporal resolution hamper the study of land-atmosphere feedbacks. The combination of remote sensing data and modelling frameworks allows to greatly improve the spatial coverage and resolution of data products. Here, we investigate trends in surface fluxes over Europe using the new data product generated with the high-resolution land surface fluxes from satellite and reanalysis data (HOLAPS) framework. HOLAPS is a one dimensional modelling framework that solves the energy and water balance at the land surface, providing consistent surface and soil variables derived from remote sensing data and reanalysis products as forcings. The evaluation of the HOLAPS product against eddy covariance measurements shows slightly better results than other ET and H products at daily scales in summer (KGE > 0.0 for ET and KGE > -0.3 for H) and during hot extremes (KGE > -0.15 for ET and KGE >-0.7 for H), while the state-of-the-art products show KGE > -0.49 for ET and KGE > -1.2 for H in summer and KGE > -0.49 for ET and KGE > -1.5 for H during hot extremes. These results together with the 1D conservation of energy and water in the modeling framework makes this product the perfect tool for the analysis of trends in surface energy and water fluxes during the last decades. Preliminary results for the period 2001-2016 reveals a larger increase in the energy reaching the surface during the hottest month of the year than during summer over central Europe and the Mediterranean coast. This extra energy is released as sensible heat over dry areas during the hottest month of the year. In areas where soil water is available, the extra energy available during the hottest month is released as latent heat flux, adding it to the already large latent heat flux during summer. These results support previous analyses indicating an increase of latent heat flux during hot conditions at monthly scales. However, trends at higher temporal resolutions should be examined to improve the robustness of this conclusion. 

How to cite: García-García, A. and Peng, J.: Analysis of trends in surface energy fluxes under hot conditions using remote sensing products, EGU General Assembly 2024, Vienna, Austria, 14–19 Apr 2024, EGU24-9091, https://doi.org/10.5194/egusphere-egu24-9091, 2024.

EGU24-11141 | ECS | Posters on site | CL4.1

The drought response of European ecosystem processes via multiple components of the hydrological cycle 

Christian Poppe Terán, Bibi Naz, Harry Vereecken, and Harrie-Jan Hendricks Franssen

Droughts have become more frequent and severe in Europe over the last decade - a trend expected to continue. Recent studies have shown widespread responses of energy, water, and carbon fluxes in ecosystems to single drought years from flux observations. 

However, to better understand how ecosystems react to droughts, we need to gain explicit knowledge about the different factors that influence their response. In this light, it is crucial to associate the influence of droughts on diverse ecosystem types with particular compartments of the hydrological cycle (atmosphere, surface, soil, and groundwater reservoirs). For instance, during a drought, atmospheric dryness might be the dominant factor in arid regions as opposed to dry soils in humid regions.

Here, we use states and fluxes of water and carbon (vapor pressure deficit, surface runoff, soil moisture, and water table depth) from the Community Land Model 5 in a 3 km resolution over Europe from 1995 to 2018 to determine the drought anomalies of ecosystem processes (gross primary production and evapotranspiration). Importantly, we apply a systematic drought concept integrating lags between deficits in a network of multiple sections of the hydrological cycle during a drought.

Our analyses indicate that the dominance of a particular water resource in controlling ecosystem processes converges regionally and is predominantly consistent across drought events. This finding emphasizes using more comprehensive drought indices incorporating time lags and multiple water resources when analyzing ecosystem responses. Lastly, it identifies areas potentially threatened by droughts and their controlling water resource.

How to cite: Poppe Terán, C., Naz, B., Vereecken, H., and Hendricks Franssen, H.-J.: The drought response of European ecosystem processes via multiple components of the hydrological cycle, EGU General Assembly 2024, Vienna, Austria, 14–19 Apr 2024, EGU24-11141, https://doi.org/10.5194/egusphere-egu24-11141, 2024.

EGU24-11163 | ECS | Orals | CL4.1

Examining the influence of forest changes on drought across time scales in Europe through multiple regional climate model simulations 

Yan Li, Bo Huang, Chunping Tan, Yi Liu, and Henning W. Rust

Land cover changes, notably forest alterations, have been observed across Europe due to extensive land management policies. These changes have significant influence on local climates through diverse biophysical mechanisms, given the crucial role of forests in the land ecosystem. While modeling studies have emphasized the impact of forest changes on regional temperature and precipitation in recent decades, their effects on drought conditions in this region remain largely unexplored. To address this gap, our study analyzes multiple simulations with regional climate models to comprehensively investigate how forest changes impact drought across various timescales in Europe. Specifically, we explored seven models, each simulated two extreme scenarios: maximum forest coverage and grass coverage in the region. The comparison between extreme forest coverage and grass coverage serves to evaluate the impact of deforestation on drought. The Standardized Precipitation Evapotranspiration Index was chosen as our metric to assess drought conditions. Our findings reveal considerable variation among the models in depicting the response to deforestation in terms of drought, particularly notable in Scandinavia and Eastern Europe. Our results suggest an increase in aridity on the Iberian Peninsula following deforestation. In Scandinavia the response varies during the year: winter months tend toward increased dryness, while summer months display a tendency toward greater wetness post-deforestation. Our primary objectives encompass quantifying the potential impacts of deforestation in Europe, identifying resilient model responses, and unraveling the sources of uncertainty within these simulated impacts. Through a meticulous analysis of model responses across regions and timescales, we aim to offer insights into the nuanced effects of forest change on drought conditions. This exploration is crucial in guiding future land management policies and devising strategies to mitigate potential adverse impacts of deforestation on regional drought susceptibility in Europe. Ultimately, our study seeks to contribute to informed decision-making regarding land use practices and their implications for climate and ecosystems.

How to cite: Li, Y., Huang, B., Tan, C., Liu, Y., and Rust, H. W.: Examining the influence of forest changes on drought across time scales in Europe through multiple regional climate model simulations, EGU General Assembly 2024, Vienna, Austria, 14–19 Apr 2024, EGU24-11163, https://doi.org/10.5194/egusphere-egu24-11163, 2024.

Extreme climate events such as droughts and heatwaves significantly impact the stability of ecosystem function and are expected to intensify in the future. The mid-high latitude regions of the Northern Hemisphere (23.5° to 90°N) exhibit pronounced seasonality and are highly sensitive to climate variations. However, further research is needed to understand the vegetation decline and its changing trends driven by extreme hydroclimatic and their compound events in this region. This study, based on multi-source data including NDVI, LAI, and GPP from 1982 to 2015 as vegetation growth indicators, amid to identify vegetation decline during the growing season and explore its temporal trends, and to further reveal the seasonal response. The research supported the importance of drought and high temperature compared to extreme wet and cold conditions. Due to the high frequency, wide impact and long duration of impact, independent low SM dominated the cumulative vegetation decline, followed by low SM and high VPD compound events. High VPD caused stronger negative impacts on vegetation growth than high T and that it was more strongly coupled to SM. We further found a turning point in vegetation decline. Because of the significant increase in VPD and its enhanced coupling with low SM, low SM and its compound events, especially SM- & VPD+ & T+ compound events, led to a significant enhancement of the vegetation decline after about the 21st century. Furthermore, the sensitivity of vegetation growth to extreme hydroclimatic has also significantly increased, with stronger intensity of vegetation decline. Seasonally, early growing season vegetation was more vulnerable (with the strongest continuous decline) due to experiencing the longest duration of negative impacts, while summer vegetation was more sensitive to extreme hydroclimatic, with the strongest intensity. Notably, compound events of high VPD and low SM primarily affected summer vegetation growth. Additionally, there was a significant lag time in vegetation response to extreme hydroclimatic, especially to high VPD and high T. In over half of the regions, the vegetation response to high T and high VPD had a lag time exceeding two months, which may be associated with seasonal legacy. In the context of global warming, further investigation is needed to explore the inter-seasonal connections. This research significantly contributes to a deeper understanding of ecosystem responses to extremes hydroclimatic and its future changes.

How to cite: Du, R. and Wu, J.: The turning point in vegetation decline in the Northern Hemisphere driven by hydroclimatic extremes, EGU General Assembly 2024, Vienna, Austria, 14–19 Apr 2024, EGU24-11693, https://doi.org/10.5194/egusphere-egu24-11693, 2024.

EGU24-12392 | ECS | Posters virtual | CL4.1

Heatwaves and Droughts in Europe: A multi-year analysis using MODIS Land Surface Temperature Anomalies 

Foteini Karinou, Ilias Agathangelidis, and Constantinos Cartalis

In recent decades, European societies and ecosystems have faced recurrent extreme temperatures that contribute to a significant number of impacts, such as wildfires, heat-related illnesses, and crop losses. As heat extremes are further projected to increase in frequency and intensity, a better understanding and close monitoring of these events is necessary. In this study, remotely-sensed Land Surface Temperatures (LSTs) from the Moderate Resolution Imaging Spectroradiometer (MODIS) are used to assess recent heatwaves and droughts in Europe (2003 – 2023). Our results reveal that surface heat extremes are intensifying and becoming more frequent. Moreover, a strong coupling is found between surface thermal extremes, heatwaves (based on near-surface air temperatures) and droughts. Finally, surface LST anomalies are investigated in the context of shifts in energy partitioning under heatwaves/droughts, using eddy covariance flux measurements from the Integrated Carbon Observation System network.

How to cite: Karinou, F., Agathangelidis, I., and Cartalis, C.: Heatwaves and Droughts in Europe: A multi-year analysis using MODIS Land Surface Temperature Anomalies, EGU General Assembly 2024, Vienna, Austria, 14–19 Apr 2024, EGU24-12392, https://doi.org/10.5194/egusphere-egu24-12392, 2024.

EGU24-12955 | ECS | Posters on site | CL4.1

The influence of temperature–moisture coupling on the occurrence of compound hot and dry events over South America: historical and future perspectives 

João L. Geirinhas, Ana Russo, Renata Libonati, Diego G. Miralles, Daniela C. A. Lima, Andreia F. S. Ribeiro, and Ricardo M. Trigo

The strong global warming observed in the past 50 years has intensified the Earth’s water cycle, triggering more frequent and severe rainfall and drought episodes, a trend that is expected to be aggravated in many regions1,2. Consequently, significant changes in the distribution of temperature, precipitation and evaporation are foreseen. Such changes will likely cause disturbances to the physical coupling between temperature and moisture and, ultimately, to the occurrence of compound hot and dry (CDH) extremes, leading to severe environmental and socio-economic impacts3–5. These coupling interactions can be conceptualized by (1) the correlation between temperature and precipitation to characterize atmospheric coupling, and (2) the correlation between temperature and evaporation, as a proxy for land–atmosphere coupling.

Data from ERA5 reanalysis and from a weighted CORDEX-CORE ensemble6 assuming two different emission scenarios (RCP2.6 and RCP 8.5), was used to assess, for seven climate regions in South America, the influence of these coupling interactions on the occurrence of CDH conditions.

Results obtained by applying multivariate regression models for the historical period (1980–2005) demonstrate that the dependence of CDH conditions on these two metrics of coupling varies considerably from region to region. While in some areas of South America a monotonical influence of a particular coupling mechanism dominates, in other regions of the continent a jointly impact of both coupling processes in the occurrence of CDH conditions is present.  We also investigate how the distribution levels of these two coupling processes will change in future due to long-term disturbances expected by climate change in temperature and in the water balance, and how a higher or lower occurrence of CDH episodes can be explained by changes in the type and strength of the dominant coupling mechanism.  

References

  • Chagas, V. B. P. et al. Climate and land management accelerate the Brazilian water cycle. Nat. Commun. 13, 5136 (2022).
  • Donat, M. G. et al. More extreme precipitation in the world’s dry and wet regions. Nat. Clim. Chang. 6, 508–513 (2016).
  • Berg, A. et al. Interannual Coupling between Summertime Surface Temperature and Precipitation over Land: Processes and Implications for Climate Change. J. Clim. 28, 1308–1328 (2015).
  • Miralles, D. G. et al. Land–atmospheric feedbacks during droughts and heatwaves: state of the science and current challenges. Ann. N. Y. Acad. Sci. 1436, 19–35 (2019).
  • Lesk, C. et al. Stronger temperature–moisture couplings exacerbate the impact of climate warming on global crop yields. Nat. Food 2, 683–691 (2021).
  • Lima, D. C. A. et al. A multi-variable constrained ensemble of regional climate projections under multi-scenarios for Portugal – Part I: An overview of impacts on means and extremes. Clim. Serv. 30, 100351 (2023).

Acknowledgments:

JG is grateful to Fundação para a Ciência e a Tecnologia I.P./MCTES (FCT) for the PhD Grant 2020.05198.BD. JG, AR, RMT, and DCAL also thank FCT I.P./MCTES through national funds (PIDDAC) – UIDB/50019/2020 (https://doi.org/10.54499/UIDP/50019/2020) and LA/P/0068/2020 (https://doi.org/10.54499/LA/P/0068/2020). AR, RMT, RL, JG and AFSR thank also FCT for project DHEFEUS (https://doi.org/10.54499/2022.09185.PTDC). AR was supported by FCT through https://doi.org/10.54499/2022.01167.CEECIND/CP1722/CT0006. DCAL was supported by FCT through https://doi.org/10.54499/2022.03183.CEECIND/CP1715/CT0004. DGM acknowledges support from the European Research Council (HEAT, 101088405).

How to cite: Geirinhas, J. L., Russo, A., Libonati, R., Miralles, D. G., Lima, D. C. A., Ribeiro, A. F. S., and Trigo, R. M.: The influence of temperature–moisture coupling on the occurrence of compound hot and dry events over South America: historical and future perspectives, EGU General Assembly 2024, Vienna, Austria, 14–19 Apr 2024, EGU24-12955, https://doi.org/10.5194/egusphere-egu24-12955, 2024.

EGU24-13027 | ECS | Posters on site | CL4.1

Unveiling the influences of soil moisture on moist heat stress extremes: a global assessment using CMIP6 data 

Jingwei Zhou, Dragan Milosevic, and Adriaan Teuling

Soil moisture is a key variable in land-atmosphere interactions, as it affects the partitioning of near-surface energy fluxes and thereby temperature and humidity of the lower atmosphere. Both ambient temperature and humidity play a crucial role in the removal of heat from the human body through direct heat transfer and sweat evaporation, therefore these two factors are commonly used in measuring moist heat stress. As moist heat stress describes the combined effects of temperature and humidity on human health and well-being, understanding the intricate relationship between soil moisture and moist heat stress is crucial for accurately assessing and mitigating moist heat extremes. Whereas the impact of soil moisture on temperature is well understood, previous research has found non-trivial and complex relations between soil moisture and moist heat stress due to humidity feedbacks. We selected two metrics among four widely used metrics which involve both temperature and humidity, indoor and open-air wet-bulb globe temperature, heat index, and humidex, to represent the heat stress in our study. We use different levels to describe the significance of the heat stress and tolerance level among the population.

In this study, we aim to investigate the impacts of soil moisture on moist heat stress at the global scale using the Land Surface, Snow and Soil moisture Model Intercomparison Project (LS3MIP) dataset within the sixth phase of the Coupled Model Intercomparison Project (CMIP6). We use the historical and future simulations from LS3MIP to analyze the spatial and temporal variations of soil moisture-heat stress coupling, and to identify the regions that are most susceptible to moist heat stress. Interactions between soil moisture and moist heat stress tend to be particularly pronounced in hot and humid regions,. These regions are likely to experience more frequent events with higher moist heat stress, posing serious challenges for human health and adaptation.

To our best knowledge, this study is the first to show a global picture of the interactions between soil moisture and moist heat stress using CMIP6 dataset. The pattern of heat stress in relation to soil moisture in perspectives of the time of day, season, and soil moisture regime will be investigated. Our study provides a novel insight into the role of soil moisture in modulating moist heat stress, and highlights the need for more accurate representation of land surface processes and feedbacks in climate models. The findings are crucial for developing effective strategies in managing moist heat stress risks and protecting vulnerable populations.

How to cite: Zhou, J., Milosevic, D., and Teuling, A.: Unveiling the influences of soil moisture on moist heat stress extremes: a global assessment using CMIP6 data, EGU General Assembly 2024, Vienna, Austria, 14–19 Apr 2024, EGU24-13027, https://doi.org/10.5194/egusphere-egu24-13027, 2024.

EGU24-13484 | ECS | Orals | CL4.1

Seasonal Variability of Deforestation-Induced Warming in the Congo Basin Using Remote-Sensing Data 

Coralie Adams and Luis Garcia-Carreras

Deforestation impacts in the Congo Basin remain significantly understudied compared to other tropical regions. The main driver of Congo Basin deforestation is small-scale industrial agriculture, which leads to the formation of the rural complex; a mosaic patch of deforested land comprising small fields at different stages of regrowth being deforested repeatedly. Transition from primary forest to rural complex may induce lesser changes in albedo, Bowen ratio, and surface roughness than primary forest to cropland, suggesting the impacts of deforestation on temperatures in the Congo Basin will differ from those in other rainforest regions. The Basin's long-term warming trend and possible ongoing drying could exacerbate warming due to deforestation. It is therefore essential that we understand how the specific nature of deforestation in the Congo Basin influences temperatures, and how this is affected by changes in the large-scale conditions driven by global climate change.

In this study, we used MODIS satellite data for LST and EVI, CHIRPS2 for rainfall, and the Global Forest Change dataset for deforestation analysis from 2000 to 2019 to assess how observed deforestation is affecting LST in the Congo Basin and how the deforestation-induced warming varies with climate anomalies, LST and rainfall (SPI), and Δ EVI (deforested EVI – surrounding forest EVI). Due to limited data availability, caused by the prevalence of cloud cover throughout much of the year, our focus narrowed to the most data-consistent dry season (DJF), where land-atmosphere interactions are also likely to be strongest.

We found a linear relationship between cumulative deforestation and warming over deforested land, which varied in intensity by month. A typical 1 km rural complex pixel within the region will warm by +0.33 °C in December, +0.85 °C in January, and +1.54 °C in February, relative to the surrounding forest. We then assessed the cause of the strong seasonal differences by looking at the deforestation-induced warming as a factor of the climate anomalies and Δ EVI. The amount of warming of a typical 1 km rural complex pixel did not show a relationship with the LST anomaly or SPI for the individual months. However, when considering all months collectively, a correlation emerged with the LST anomaly, suggesting a seasonal evolution where the LST anomaly acts as a proxy. We then found a link between the warming of a typical 1 km rural complex pixel and Δ EVI which is present for each month; this partially explains the interannual variability of the results, but it doesn’t explain the seasonal evolution. Comprehensive and high-quality observations are needed over the Congo Basin to fully untangle these relationships. Accurate soil moisture data could be crucial in understanding the pronounced seasonal differences in warming. These findings suggest that even though the rural complex differs from cropland, and might be expected to have a smaller impact, the additional warming can still be substantial (+1.54 °C), although it has a strong seasonal dependency.

How to cite: Adams, C. and Garcia-Carreras, L.: Seasonal Variability of Deforestation-Induced Warming in the Congo Basin Using Remote-Sensing Data, EGU General Assembly 2024, Vienna, Austria, 14–19 Apr 2024, EGU24-13484, https://doi.org/10.5194/egusphere-egu24-13484, 2024.

EGU24-14184 | ECS | Orals | CL4.1

Links between seasonal precipitation intermittency and soil moisture variability 

Woon Mi Kim, Isla Simpson, Clara Deser, Flavio Lehner, and Angeline Pendergrass

Precipitation is an important control of soil moisture on land. Thus, many studies have focused on understanding the influences of mean or total precipitation variability on soil moisture. However, the relationship between precipitation intermittency (the temporal distribution of rainfall events) and soil moisture variability remains largely underexplored. This question requires more attention as climate models are known to be deficient in their representation of precipitation intermittency (PI), and PI is projected to increase in a future warmer climate, potentially affecting soil moisture variability. In this study, we examine the associations between seasonal PI and soil moisture (SM) across the globe in observation-based datasets (ERA5, MSWEP, and GLEAM) and model simulations (CESM2 Large Ensembles – LENS2) for the period 1981–2020. As a methodology to quantify the associations between PI and SM, we use a conditional regression analysis of 10cm soil moisture onto a metric of PI (reverted number of wet days in a season) after the removal of the influence of total seasonal precipitation from each variable. 

The result suggests that in many regions, higher PI leads to decreases in SM under the same amount of seasonal precipitation. These associations are explained by increased runoff under higher PI. Therefore, the spatial patterns of the magnitude and sign of the linkage between PI and SM align with the global patterns of PI-runoff interactions. Additionally, the regions where evapotranspiration (ET)–SM correlations are high (>0.5) present higher SM sensitivity to changes in PI. CESM2 exhibits spatial consistency in the PI–SM associations with ERA5, although noticeable differences exist in the magnitudes of the regression coefficients between the two datasets. In general, the PI–SM associations are weaker in CESM2. This disparity is attributed to the different runoff sensitivity to changes in precipitation and PI. CESM2 exhibits reduced runoff sensitivity to PI than ERA5 over the entire globe. This finding implies that how runoff is modeled and constrained in climate models will affect future projections of soil moisture.

How to cite: Kim, W. M., Simpson, I., Deser, C., Lehner, F., and Pendergrass, A.: Links between seasonal precipitation intermittency and soil moisture variability, EGU General Assembly 2024, Vienna, Austria, 14–19 Apr 2024, EGU24-14184, https://doi.org/10.5194/egusphere-egu24-14184, 2024.

Land-atmosphere interactions are crucial in both weather and climate extremes. Studies have revealed certain large atmospheric circulation patterns such as amplified circumglobal wave 5 and 7 play important role in generating and maintaining surface extremes. These extremes can occur at the same time but different locations, for example in 2010, the wave 5 pattern was the driver for Russian heatwave and Pakistan flooding. But how soil moisture and land-atmosphere interactions affect the climatology states of jetstreams, amplified waves, and hence persistent extremes still remains unclear.

Here, we employ large ensemble simulations from climate model EC-Earth 3 to study the role of soil moisture in affecting large-scale atmospheric circulation for the period of 2009 to 2016. Three sets of experiments (each set has 100 ensemble members) are carried out with perturbed atmosphere-soil moisture interactions and one reference run (100 members) in which the interaction between the atmosphere and the land is fully interactive. We show that atmosphere-soil moisture interactions strongly influence the climatological mean states of atmospheric circulation in the Northern Hemisphere during the summer season (June to August) and especially in July. With the same soil moisture climatology, the reference run showed an overall land warming that led to poleward migration of jet and a more Arctic front jet state.

 Additionally, West Russia is chosen for the case study area as it is a hotspot for both amplified wave 5 and wave 7 heat extremes. We define the long duration heatwave event as near-surface temperature exceeding 30oC for at least eight days. The results show that with the soil-atmosphere interaction, the probability of such events increased from 2.2% to 5.8% for wave 5 and 0.47% to 4.5% for wave 7.

How to cite: Luo, F., Selten, F., and Coumou, D.: The role of soil moisture on summer atmospheric circulation climatology and persistent heatwaves in the Northern Hemisphere, EGU General Assembly 2024, Vienna, Austria, 14–19 Apr 2024, EGU24-14484, https://doi.org/10.5194/egusphere-egu24-14484, 2024.

EGU24-14774 | Orals | CL4.1

Drought Changes Growing Season Length and Vegetation Productivity 

Josh Gray, Eunhye Choi, Mark Friedl, and Patrick Griffiths

Meteorological droughts are increasing in intensity, frequency, and duration due to climate change. These events may have substantial impacts on vegetation productivity that influence the global carbon balance. Effects vary considerably, however, with the intensity of the drought as well as local abiotic and biotic conditions such as vegetation type, soil type, and the timing of the drought. Productivity is primarily reduced because droughts decrease the efficiency with which plants can convert atmospheric CO2 into carbohydrates, largely because of stomatal closure when energy is not limiting. However, another aspect by which droughts can reduce productivity is by shortening the growing season length (GSL). GSL reduction may be particularly pronounced in vegetation communities already sensitive to precipitation variability, in particular, short-rooted grassland and croplands ecosystems. Here, we use evidence from satellite observations of ecosystem activity, meteorological measurements, and data from eddy-covariance flux towers to reveal the impact of several large-scale meteorological droughts on vegetation productivity on natural and managed ecosystems. In particular, we show that the timing of the drought is important, with late droughts being particularly diminishing to productivity. We also demonstrate that while plant physiological responses to drought dominate the reduction in productivity, the diminishment of GSL plays an underappreciated role. These results have wide implications for the future carbon balance under a changing climate, and suggests that ecosystem models could better explain productivity by incorporating the effects of droughts on GSL.

How to cite: Gray, J., Choi, E., Friedl, M., and Griffiths, P.: Drought Changes Growing Season Length and Vegetation Productivity, EGU General Assembly 2024, Vienna, Austria, 14–19 Apr 2024, EGU24-14774, https://doi.org/10.5194/egusphere-egu24-14774, 2024.

EGU24-15546 | ECS | Orals | CL4.1

Challenges in simulating ground surface temperature based on remote sensing land surface temperature over mountain grasslands 

Raul-David Șerban, Giacomo Bertoldi, Paulina Bartkowiak, Mariapina Castelli, and Andrea Andreoli

Ground surface temperature (GST), measured at a depth of around 5 cm below the ground surface, is essential for understanding the climate change impacts in the Earth Critical Zone. Large spatiotemporal variations of GST have been reported in mountain regions due to the heterogeneity of surface cover and topography. This work aims to improve the monitoring of GST using a physical land-surface model driven by satellite-based land surface temperature (LST). In this regard, GST was simulated using the physical GEOtop model at 1500 m elevation in Matsch Valley, north-eastern Italian Alps, from 2014 to 2017 during the phenological cycle, between April and October. The model was forced only by the LST derived from the Terra MODerate resolution Imaging Spectroradiometer (MODIS). The 1-km MODIS LST was first downscaled to a finer spatial resolution of 250-m using data-driven sharpening from random forest algorithm. The simulated GSTs correlate well with the in-situ observations with a Pearson correlation of 0.88 and a coefficient of determination of 0.77. However, the model overestimated the GST for the whole period with a mean bias of 8.72 °C. These overestimations are similar to the differences between in-situ GST and MODIS LST which range from 4.8 to 19 °C with an average of 8.5 °C. They are mainly caused by the low temporal resolution of LST data with only one observation per day which is additionally limited by frequent cloud cover contamination and the low spatial resolution of the MODIS thermal channels. Modelling the damping of the LST signal in the first centimeters of soil to simulate GST in very heterogeneous areas like alpine pastures is still challenging. This is mainly due to the resolution mismatch between ground and remote sensing observations and the poor knowledge of soil and vegetation properties needed to parametrize physical models.

How to cite: Șerban, R.-D., Bertoldi, G., Bartkowiak, P., Castelli, M., and Andreoli, A.: Challenges in simulating ground surface temperature based on remote sensing land surface temperature over mountain grasslands, EGU General Assembly 2024, Vienna, Austria, 14–19 Apr 2024, EGU24-15546, https://doi.org/10.5194/egusphere-egu24-15546, 2024.

EGU24-16559 | Orals | CL4.1 | Highlight

Assessing extreme temperature volatilities across Germany between 1990 and 2022 

Elisa Jordan, Ankit Shekhar, and Mana Gharun

Climate change causes a global rise in mean air temperature and increased frequency of temperature extremes. Recent studies link sharp temperature changes between consecutive days to increased mortality, reduced economic growth, and negative effects on ecosystems. While climatological analyses predominantly focus on mean temperatures, extreme temperatures have higher impacts on human health. This study assesses the variability of the daily maximum air temperature between two consecutive days (i.e., volatility) across Germany from 1990 to 2022. We used observation-based raster data of the maximum daily temperature assessed volatility regarding: 1) magnitude, 2) seasonality, 3) the direction of temperature change, and 4) trends during the entire period. As changes of land use and land cover have a direct impact on local temperatures, we analysed the land cover changes during the same period and examine its correlation to extreme volatilities.

The results showed a higher magnitude of rapid temperature decreases compared to temperature increases. Extreme volatilities increased with further distance to the coast from north of Germany to south. Overall, abrupt day-to-day temperature changes occurred mostly during the warming half-year (from March to August). During the study period, significant trends of 0.5 °C and 0.2 °C per decade showed a widening range of extreme volatility in spring and autumn. Compared to unchanged areas, changing land cover was predominantly liked to increasing volatilities of up to 0.5 °C. Understanding rapid temperature changes is crucial for climate change mitigation strategies and limiting impacts on human health and on the environment.

How to cite: Jordan, E., Shekhar, A., and Gharun, M.: Assessing extreme temperature volatilities across Germany between 1990 and 2022, EGU General Assembly 2024, Vienna, Austria, 14–19 Apr 2024, EGU24-16559, https://doi.org/10.5194/egusphere-egu24-16559, 2024.

EGU24-16729 | ECS | Posters on site | CL4.1

Poleward migration of soil moisture–temperature coupling hotspots under global warming 

Daniel F.T. Hagan, Diego Miralles, Guojie Wang, Alan T. Kennedy-Asser, Mingxing Li, Waheed Ullah, and Shijie Li

Global hotspot regions where soil moisture (SM) constrains temperature changes are expected to migrate and change in intensity under climate change, impacting hydroclimatic events; however, the nature of these changes is still uncertain. Using multiple model outputs from the Coupled Model Intercomparison Project Phase 6 (CMIP6), we assessed potential future changes in the coupling between boreal summer SM and near-surface mean air temperature (T) across the globe under four Shared Socioeconomic Pathways (SSPs, 2015–2100). We find weakening SM impacts on T (SM-T coupling) in semi-arid, low-latitude regions with increasing emission scenarios due to reduced sensitivity of evaporation to SM. However, our results showed intensifying SM-T coupling primarily over humid regions with increasing precipitation yet decreasing SM due to increasing evaporation. We demonstrate that these changes could be linked to the poleward expansion of the Hadley cells and water-limiting conditions, shifting SM controls on partitioning the surface net radiation and subsequently on T under global warming. These results suggest a higher likelihood of extreme hydroclimatic events, such as heatwaves in higher latitudes associated with the SM–T coupling, which could impact food and water security.

How to cite: Hagan, D. F. T., Miralles, D., Wang, G., Kennedy-Asser, A. T., Li, M., Ullah, W., and Li, S.: Poleward migration of soil moisture–temperature coupling hotspots under global warming, EGU General Assembly 2024, Vienna, Austria, 14–19 Apr 2024, EGU24-16729, https://doi.org/10.5194/egusphere-egu24-16729, 2024.

EGU24-17393 | Orals | CL4.1

Investigating the Climate Impacts of Afforestation and Deforestation in Europe via 5 km climate model simulations 

Luca Caporaso, Gregory Duveiller, Matteo Piccardo, Emanuele Massaro, Caspar Roebroek, Mirco Migliavacca, and Alessandro Cescatti

In the context of the European Green Deal framework, understanding the intricate and varied impacts of afforestation and deforestation across different regions is paramount. A complex interplay of environmental factors shapes the resulting climate effects. Evaluating these impacts and their spatial variability is crucial for formulating effective and context-specific climate mitigation and adaptation strategies.

This study takes a comprehensive approach, investigating both local and non-local effects of afforestation and deforestation within Europe, with a specific emphasis on the radiative budget and temperature dynamics.  Utilizing the cutting-edge Regional Climate Model (RegCM5) in conjunction with the Community Land Model version 4.5 (CLM4.5), we conducted simulations at a fine-scale, convective-permitting resolution of 5 km. This granular approach allows for an in-depth understanding of climate dynamics, shedding light on the distinct climate responses to forest cover alterations at various locations.

We conducted three simulations spanning the period 2004-2014: a control run and two scenarios involving afforestation and deforestation.  We concentrated on analyzing climatic changes through variables such as land surface temperature, near-surface air temperature, and the energy fluxes at the Earth's surface and the top of the atmosphere (TOA). Results suggest that afforestation/deforestation can yield substantial impacts on the climate system. It underscores the critical importance of evaluating biophysical effects at a high resolution, emphasizing the need to incorporate such considerations into climate change mitigation strategies.

Recognizing the location-dependent nature of afforestation and deforestation climate impacts, combined with the capabilities of advanced modeling tools, underscores the importance of flexible and adaptable land use planning. The practical implications of our findings extend to policymaking, offering insights that can inform sustainable land use decisions. These insights can guide the formulation of resilient and sustainable land use policies, aligning with the ambitious objectives of the European Green Deal.

How to cite: Caporaso, L., Duveiller, G., Piccardo, M., Massaro, E., Roebroek, C., Migliavacca, M., and Cescatti, A.: Investigating the Climate Impacts of Afforestation and Deforestation in Europe via 5 km climate model simulations, EGU General Assembly 2024, Vienna, Austria, 14–19 Apr 2024, EGU24-17393, https://doi.org/10.5194/egusphere-egu24-17393, 2024.

EGU24-17662 | ECS | Orals | CL4.1

Large biases in soil moisture limitation across CMIP6 models 

Francesco Giardina, Ryan S. Padrón, Benjamin D. Stocker, Dominik L. Schumacher, and Sonia I. Seneviratne

Accurate soil moisture representation is crucial in climate modeling, due to its significant role in land-atmosphere interactions. Our study focuses on water storage dynamics and analyzes how soil moisture limitation is represented in simulations from the land component (land-hist experiment) of seven models within the Coupled Model Intercomparison Project phase 6 (CMIP6). We quantified the annual maximum depletion in soil moisture, contrasting model results with observations of terrestrial water storage from the Gravity Recovery and Climate Experiment (GRACE). Our analysis shows that CMIP6 models mostly underestimate these annual extremes in soil moisture reductions, with the Amazon consistently emerging as the most biased region. We further computed the critical soil moisture thresholds and quantified the frequency of soil moisture limitation in CMIP6 simulations, comparing model estimates against solar-induced fluorescence (SIF) and GRACE observations. We found consistent results with the annual maximum depletion in soil moisture, with models almost always overestimating the frequency of soil moisture limitation globally compared to observations. We validated our findings with data from 128 eddy-covariance sites from eight biomes worldwide. Our study illuminates the biases in soil moisture storage and dynamics between CMIP6 models and empirical observations, highlighting the importance of improving the representations of soil moisture and land-atmosphere interactions in Earth System Models.

How to cite: Giardina, F., Padrón, R. S., Stocker, B. D., Schumacher, D. L., and Seneviratne, S. I.: Large biases in soil moisture limitation across CMIP6 models, EGU General Assembly 2024, Vienna, Austria, 14–19 Apr 2024, EGU24-17662, https://doi.org/10.5194/egusphere-egu24-17662, 2024.

EGU24-17860 | Orals | CL4.1

The International Soil Moisture Network (ISMN): providing a permanent service for earth system sciences 

Matthias Zink, Fay Boehmer, Wolfgang Korres, Kasjen Kramer, Stephan Dietrich, and Tunde Olarinoye

Soil moisture is recognized as an Essential Climate Variable (ECV), because it is crucial to assess water availability for plants and hence food production. Having long time series of freely available and interoperable soil moisture data with global coverage enables scientists, practitioners (like farmers) and decision makers to detect trends, assess the impacts of climate change and develop adaptation strategies.

The collection, harmonization and archiving of in situ soil moisture data was the motivation to establish the International Soil Moisture Network (ISMN) at the Vienna University of Technology in 2009 as a community effort. Based on several project funding periods by the European Space Agency (ESA), the ISMN became an essential means for validating and improving global land surface satellite products, climate and hydrological models. In December 2022, the ISMN was transferred to a new hosting facility the International Centre for Water Resources and Global Change (ICWRGC) and the German Federal Institute of Hydrology (BfG) in Koblenz (Germany). ISMN data are successfully provided from the new host since then and will be for decades to come as the German government committed to its long-term funding.

This presentation is going to showcase the International Soil Moisture Network (ISMN). Beyond offering comprehensive in situ soil moisture data, ISMN freely disseminates additional environmental variables, including soil temperature, snow depth, snow water equivalent, precipitation, air temperature, surface temperature and soil water potential if they are available from our data providers. With a global reach, ISMN has already accumulated 3000 stations with observations at various depths, while about 1000 stations are updated on a daily basis. Ongoing efforts are concentrated on expanding the database by incorporating additional stations and networks from institutional or governmental sources. Substantial resources are directed towards fortifying the operational system and improve usability to better serve our users. Additional efforts are undertaken to include ISMN in the data-to-value chain by contributing to international initiatives like WMO, FAO and GCOS. One example is the contribution to WMO’s yearly Global State of the Water Resources report.

How to cite: Zink, M., Boehmer, F., Korres, W., Kramer, K., Dietrich, S., and Olarinoye, T.: The International Soil Moisture Network (ISMN): providing a permanent service for earth system sciences, EGU General Assembly 2024, Vienna, Austria, 14–19 Apr 2024, EGU24-17860, https://doi.org/10.5194/egusphere-egu24-17860, 2024.

EGU24-18231 | ECS | Orals | CL4.1

Summer Drought Prediction in Europe combining Climate Simulations and Remote Sensing 

David Civantos Prieto, Jesús Peña-Izquierdo, Lluis Palma, Markus Donat, Gonzalo Vilella, Mihnea Tufis, Arjit Nandi, Maria Jose Escorihuela, and Laia Romero

The occurrence of droughts is ruled by the interplay of complex processes with very different natures and spatio-temporal scales. Different modes of climate variability, like the North Atlantic Oscillation or ENSO (El Niño-Southern Oscillation), set the prevalence of distinct weather regimes providing sources of predictability at large-scale. On the other hand,  land-atmosphere feedbacks play a crucial role in climate extremes, and particularly, in the evolution and amplification of droughts. However, the weak predictability of the former large-scale variability in the extratropics together with the poor representation of these feedbacks in current seasonal predictive systems lead to a limited capability of predicting droughts months in advance. In this study (part of the AI4Drought project, funded by ESA), we aim to enhance summer drought prediction in Europe from spring conditions by the combination of state-of-the-art climate simulations and remote sensing.

A hybrid model combining climate simulations and high-resolution remote sensing data is proposed to boost the predictability signal at seasonal time-scale through the integration of two machine learning (ML) models. The first model (model-A) enhances large-scale predictability. It consists of a generative model (conditional variational auto-encoder, based on Pan et al., 2022), which is trained with 10.000s years of CMIP6 climate simulations to empirically learn the probability distributions between global spring fields; e.g., sea surface temperatures and 500 hPa geopotential height; and summer drought conditions (SPEI3). A local-scale model for extremes amplification is developed (model-B). A pixel-based (multi-layer neural network) model aims to capture land-atmosphere feedbacks; integrating local conditions from satellite-based products and reanalysis data, e.g. soil moisture (SM), temperatures and NDVI together with information from the large-scale predictions from model-A in order to predict SM anomalies for the whole summer season.

Preliminary results highlight the significance of local conditions in enhancing drought predictions, particularly in the Mediterranean region, where land-atmosphere feedbacks are pronounced. Experiments conducted under ideal conditions, knowing the future large-scale conditions in advance, demonstrate improved prediction skill when local conditions (e.g., soil moisture, NDVI) are included as predictors.

Moreover, a DeepSHAP analysis (eXplainableAI-based method) is performed to understand which are the most important drivers for the local-scale model prediction of summer SM anomalies. As expected, the spring’s SM anomalies are the most important input features; together with the large-scale conditions described by August SPEI-3. Additionally, temperature anomalies have a relatively high importance when predicting summer drought conditions.

This research underscores the potential of a hybrid approach integrating climate simulations and remote sensing data to advance the understanding and prediction of summer droughts in Europe.

How to cite: Civantos Prieto, D., Peña-Izquierdo, J., Palma, L., Donat, M., Vilella, G., Tufis, M., Nandi, A., Escorihuela, M. J., and Romero, L.: Summer Drought Prediction in Europe combining Climate Simulations and Remote Sensing, EGU General Assembly 2024, Vienna, Austria, 14–19 Apr 2024, EGU24-18231, https://doi.org/10.5194/egusphere-egu24-18231, 2024.

EGU24-18682 | ECS | Posters on site | CL4.1

Uncovering the moisture and heat sources to croplands during agricultural failure events 

Hao Li, Jessica Keune, and Diego Miralles

Dry and hot climate anomalies threaten rainfed agricultural productivity worldwide. Land–atmosphere feedbacks play a critical role during these abnormal weather events; for example, dry soils reduce evaporation and enhance sensible heating over the land surface, thereby amplifying air temperatures and water deficits for crops, consequently leading to agriculture failure. Moreover, these anomalies of moisture and heat upwind can be translated into downwind regions, thus leading to the spatial propagation of crop-adverse climate conditions. 

In this presentation, we analyse precipitation and temperature anomalies associated with crop failure events over the world’s largest 75 rainfed breadbaskets. Then the spatio-temporal origins of moisture and heat over these breadbaskets are determined using a novel atmospheric Lagrangian modelling framework along with satellite observations. Results indicate that upwind and local land–atmosphere feedbacks together cause lower moisture and higher heat transport into these breadbaskets, leading to decreases in yield of up to 40%. By zooming into the Southeastern Australia wheat belt as an example, known for experiencing recurrent droughts and heatwaves, we provide a detailed analysis of the anomalies of water and energy fluxes and atmospheric circulation and their impacts on moisture and heat sources. We find a substantial impact of advection of dry and hot air from upwind terrestrial regions, particularly during crop failure events, i.e., 1994, 2002, and 2006. Persistent high-pressure systems significantly alter moisture and heat imports into the wheat belt during these events, with upwind drought conditions intensifying rainfall deficits and heat stress in the agricultural region.

Our study suggests the potential for upwind land management to mitigate agricultural losses in rainfed, water-limited regions. Further understanding the intricate relationships between upwind and local influences on global breadbaskets, and specific regions like Southeastern Australia, may provide crucial insights for developing adaptive measures to avert food shortages in the face of a changing climate.

How to cite: Li, H., Keune, J., and Miralles, D.: Uncovering the moisture and heat sources to croplands during agricultural failure events, EGU General Assembly 2024, Vienna, Austria, 14–19 Apr 2024, EGU24-18682, https://doi.org/10.5194/egusphere-egu24-18682, 2024.

EGU24-19126 | Orals | CL4.1

Development of a land model for the next generation MIROC climate model and evaluation of its simulated land-atmosphere coupling 

Tomoko Nitta, Takashi Arakawa, Akira Takeshima, Dai Yamazaki, and Kei Yoshimura

We have been developing Integrated Land Simulator as a land model for the next generation of the MIROC climate model. Using a general-purpose coupler, ILS couples various land component models with minimum modifications and makes a land model independent from the atmospheric model. The major changes from the previous version of the land model in MIROC6 are the method of coupling land and atmosphere, the independent grid system and spatial resolution for the land model, and the river model. In MIROC6, the land model was part of the physical process of the atmospheric model and was run sequentially, but in the new model (MIROC-ILS), the land and atmospheric models are run in parallel. We have confirmed the MIROC-ILS meets the requirements such as water balance closure and computation time. In the presentation, we will show how the changes of land-atmosphere coupling method and coupling frequency affects the simulated atmosphere field.

How to cite: Nitta, T., Arakawa, T., Takeshima, A., Yamazaki, D., and Yoshimura, K.: Development of a land model for the next generation MIROC climate model and evaluation of its simulated land-atmosphere coupling, EGU General Assembly 2024, Vienna, Austria, 14–19 Apr 2024, EGU24-19126, https://doi.org/10.5194/egusphere-egu24-19126, 2024.

EGU24-19526 | ECS | Orals | CL4.1

Exploring the influence of land-atmosphere interactions on humid heat extremes in a convection permitting model simulation 

Guillaume Chagnaud, Chris Taylor, Cathryn Birch, Lawrence Jackson, John Marsham, and Cornelia Klein

Ambient humidity reduces the ability of the body to cool down through sweating, adding to the heat 
stress caused by elevated air temperature alone. Indeed, humid heat waves (HHWs) are already a threat
for humans, livestock and wildlife, and their impacts are projected to increase with global warming.
HHWs result from the combination of thermodynamic and dynamic processes interacting on a range of 
time and space scales and whose relative importance may vary according to location and time of year.

Africa is one continent where HHWs, defined here as extremes of wet-bulb temperature (Twb), are 
expected to become more important under global warming. Local-scale humid heat extremes may occur 
within more moderate larger-scale events across much of the continent. Yet, climatological 
characteristics of these smaller-scale events such as location and timing (in year and day) are poorly 
documented in the current climate, due to a lack of high-resolution data and research focus. Moreover, 
a comprehensive understanding of their meso- to synoptic-scale drivers is still lacking. Here, we explore 
these two issues using a 10-year pan-African convection-permitting model simulation that explicitly 
resolves land-atmosphere interactions, and particularly those involving moist processes that are 
instrumental to HHWs.

We find humid heat extremes in semi-arid regions occurring in the core of the rainy season, on length 
scales down to a few tens of kilometers. During HHWs, Twb peaks several hours 
later than the climatological peak in the late morning. This diurnal cycle shift is likely due to HHWs 
typically developing in the aftermath of a rainfall event: the resulting positive anomaly in soil moisture 
induces increased latent heat fluxes, low level divergence, and a reduced PBL height, all ingredients
displaying sharp spatial gradients conducive to locally high Twb values. These results have implications 
for the improvement of localized HHW predictability based on local soil moisture conditions, a key step 
towards climate change adaptation through e.g., early-warning systems.

How to cite: Chagnaud, G., Taylor, C., Birch, C., Jackson, L., Marsham, J., and Klein, C.: Exploring the influence of land-atmosphere interactions on humid heat extremes in a convection permitting model simulation, EGU General Assembly 2024, Vienna, Austria, 14–19 Apr 2024, EGU24-19526, https://doi.org/10.5194/egusphere-egu24-19526, 2024.

EGU24-20049 | ECS | Orals | CL4.1

Impact of soil moisture data assimilation on short-term numerical weather prediction 

Zdenko Heyvaert, Michel Bechtold, Jonas Mortelmans, Wouter Dorigo, and Gabriëlle De Lannoy

Land-atmosphere (LA) coupling describes the dynamic interaction between the Earth’s land surface and (the bottom of) the atmosphere. This coupling involves the exchange of energy, water, and momentum between the two systems and its strength varies depending on several factors (e.g., season, land cover, topography, and climate zone). Several metrics that quantify the strength of the LA coupling, both physical and statistical, have been developed and explored extensively in the literature.

Coupled systems that model the atmosphere, the land surface, and their interaction require an initialization of both the atmospheric and the land components. For the latter, a land surface model (LSM) is typically spun up in a so-called ‘offline’ manner, i.e., not coupled to the atmospheric model but forced by an atmospheric reanalysis product. So far, little research has focused on the potential impact of satellite-based soil moisture data assimilation (DA) during this spin-up period on the subsequent forecast by the coupled system. However, several studies in the land surface modeling community have demonstrated the potential benefit of soil moisture DA to improve estimates of hydrological variables and land surface fluxes in offline simulations.

In this study, soil moisture retrievals from the 36 km Soil Moisture Active/Passive (SMAP) Level 2 product are assimilated into the Noah-MP LSM with dynamic vegetation, forced by the MERRA-2 atmospheric reanalysis. This is done using a one-dimensional Ensemble Kalman Filter (EnKF) within the NASA Land Information System (LIS). The DA updates the moisture in each of the four soil layers of the LSM. The resulting land reanalysis provides consistent estimates of land surface variables and fluxes from 1 January 2016 through 31 December 2020 on an 18 km grid over the contiguous United States.

This land reanalysis is subsequently used to initialize the land component of an experiment where the Noah-MP LSM and the Weather Research & Forecasting (WRF) atmospheric model are coupled within the NASA Unified WRF (NU-WRF) framework. The atmospheric component is initialized with MERRA-2, which also serves as the boundary condition for the atmospheric model. We compare the results in terms of short-term atmospheric estimates (e.g., of evaporative fraction, growth of the planetary boundary layer, screen-level temperature and humidity) with an initialization that uses a purely model-based land spin-up. 

Our study allows the quantification of land DA impact during spin-up and the assessment of its relationship with the LA coupling strength. The results will provide important insights into where and when short-term atmospheric forecasts may benefit from assimilating satellite-based soil moisture retrievals.

How to cite: Heyvaert, Z., Bechtold, M., Mortelmans, J., Dorigo, W., and De Lannoy, G.: Impact of soil moisture data assimilation on short-term numerical weather prediction, EGU General Assembly 2024, Vienna, Austria, 14–19 Apr 2024, EGU24-20049, https://doi.org/10.5194/egusphere-egu24-20049, 2024.

EGU24-1089 | ECS | Posters on site | CL4.5

Evaluation of Mesoscale Eddy-Ice Interaction in the Southern Ocean using High-Resolution Models 

Stephy Libera, Hugues Goosse, and Dian Putrasahan

Antarctic sea ice plays an important role in the global climate through its influence on local and global oceanic and atmospheric circulations, planetary radiative balance, and the crucial support it provides for Southern Ocean ecosystem. Understanding the physical processes influencing Antarctic sea ice, and the drivers of its change are therefore of broad interest. The sea ice–covered the Southern Ocean, has relatively weak stratification in the upper ocean, where a relatively thin halocline separates the cold winter mixed layer from significantly warmer ocean interior. When warmer waters from the ocean interior enter the mixed layer, it can melt sea ice at its base. Features in the upper ocean, like mesoscale eddies can impact the thermohaline structure and stratification in this region and can impact the heat delivered to the surface. However, the mesoscale dynamics in the polar regions, especially under sea ice cover, is little known due to the limited observations and the inability of many numerical models to resolve mesoscale processes in the high latitudes.   

This study aims to understand better the interaction between ocean mesoscale eddies and sea ice using high-resolution European Eddy RIch Earth System Models (EERIE) models. We investigate the effect of mesoscale eddies locally, and the integrated effect of eddy-sea ice interaction in the circumpolar Southern Ocean. Previous studies have identified eddy ice interactions to vary within regions of varying sea ice concentrations, such as in the high concentration pack ice and low-concentration marginal ice zones. The variations in the eddy-sea ice interaction in the Southern Ocean, within the open ocean, pack ice, and marginal ice zones are further investigated in this study.  

How to cite: Libera, S., Goosse, H., and Putrasahan, D.: Evaluation of Mesoscale Eddy-Ice Interaction in the Southern Ocean using High-Resolution Models, EGU General Assembly 2024, Vienna, Austria, 14–19 Apr 2024, EGU24-1089, https://doi.org/10.5194/egusphere-egu24-1089, 2024.

EGU24-1430 | Orals | CL4.5

Evaluation of the K-scale model hierarchy across MetOffice models. 

Claudio Sanchez, Huw Lewis, Richard Jones, James Warner, and Dasha Shchepanovska

Models resolving km-scale processes, such as deep convection, improve the representation of precipitation associated to several processes at sub-synoptic scales, e.g. diurnal cycle, mesoscale convective systems or tropical cyclones. These models generally improve extremes and add value to hazard forecasting, in particular over the tropics. However, these models have been unaffordable to run on a pseudo-global scale until recently and thus their impact in large scale processes is not well known.

Aiming to develop the next generation of Met Office weather and climate prediction systems, the UK K-scale project has been established to evaluate the technical challenges, the scientific improvements and the predictability benefits of km-scale models. The first step of the program is the development of a K-scale “model hierarchy”, a family of simulations across several resolutions and two scientific configurations under the same MetOffice Unified Modelling framework (MetUM). Such hierarchy comprises a generic global model at 12km resolution, realizations at different resolutions of the Cyclic Tropical Channel (CTC), which is a global model in the zonal with north and south boundaries at 26N and 44S respectively, and limited area models (LAMS) over several locations at 2.2km. The two scientific configurations are (i) a global-like aimed at global resolutions above 10km, which includes a parametrization of shallow and mid-level convection, and (ii) a regional-like aimed to km- and sub-km-scale LAM which does not parametrize convection at any level.

Our results from simulations of the 40-day DYAMOND summer and winter periods show than differences between global-like and regional-like configurations at the same resolution can be as large as differences between models at 12km and 4.4km resolution with the same configuration. When all convective processes are not parametrized in the whole tropics at km-scale resolution, the PDF of precipitation shift towards higher intensities, the diurnal cycle improves in several regions, and the wet and dry biases around the E-W boundaries of LAMs are reduced.

The African tropical easterly jet is represented differently across the simulations; with a stronger jet in global-like configurations with convective parametrization. A significant change in mean-state upper wind over the Indian Ocean has potential implications on both subsidence over East Africa, and wind shear over West Africa. These are both tied to widespread rainfall patterns over Africa.

Regional-like configurations at km-scale resolution capture the kinetic energy spectra slope -5/3, poorly represented by the global-like model at 12km. The uncertainty growth across the kscale hierarchy is explored with the use of a twin experiment methodology, and in particular the role of equatorial waves in the error growth across resolutions and science configurations.

How to cite: Sanchez, C., Lewis, H., Jones, R., Warner, J., and Shchepanovska, D.: Evaluation of the K-scale model hierarchy across MetOffice models., EGU General Assembly 2024, Vienna, Austria, 14–19 Apr 2024, EGU24-1430, https://doi.org/10.5194/egusphere-egu24-1430, 2024.

EGU24-2040 | ECS | Posters on site | CL4.5

The representation of tropical cyclones in high resolution coupled climate simulations 

Paolo Ghinassi and Paolo Davini

Tropical cyclones (TCs) are one of the most impactful weather phenomena on Earth. Their formation and development depends on small-scale processes like air-sea interaction and convection. These processes pose challenges for climate models since they are often misrepresented and act as sources of uncertainty. Additionally, TCs interact with both tropical and extratropical large-scale circulation, contributing to the upscale error propagation. The accurate representation of such physical processes in climate models therefore is crucial for the correct simulation not only of TCs but of the entire climate system. Until a few years ago, these small scale processes could not be resolved explicitly in traditional state-of-the-art coupled climate simulations due to a too coarse horizontal resolution. Nowadays that we are able to run climate simulations at a very high resolution (less than 10 km) and explicitly resolve such processes we expect to have a much more realistic representation of the intensity, frequency, and structure of TCs in climate models.

For this study, we consider data from the nextGEMS and Climate Digital Twin (part of the Destination Earth initiative) experiments (with an horizontal resolution up to 2.5 km), assessing model performance comparing them with both ERA5 reanalysis and with observational data sets such as IBTrACS to detect model biases. An algorithm for the detection and tracking of TCs based on the TempestExtremes library is used to detect and track TCs at first on a coarser resolution grid on a single time step (e.g., every 6 hours). Then, a series of variables at the original model resolution are saved in the vicinity of the TC centres, to allow examining their finer structure with an unprecedented level of detail. This diagnostic is part of the Application for Quality assessment and Uncertainty quAntification (AQUA) model evaluation framework developed within the Destination Earth project. Our analysis considers the TCs intensity (e.g. cyclones classification, wind pressure relationship), TCs structure (e.g. examining wind gusts and rain bands) and TCs temporal and spatial distribution (computing and analysing TCs trajectories). Preliminary results enlight the ability of these very high-resolution climate simulations to represent TCs features in a much more realistic way, especially close to the smallest resolved scales. Moreover, an increased horizontal resolution is beneficial to reduce model biases, enabling climate models to simulate TCs with a magnitude comparable to the observations.

How to cite: Ghinassi, P. and Davini, P.: The representation of tropical cyclones in high resolution coupled climate simulations, EGU General Assembly 2024, Vienna, Austria, 14–19 Apr 2024, EGU24-2040, https://doi.org/10.5194/egusphere-egu24-2040, 2024.

EGU24-2359 | ECS | Posters on site | CL4.5

Simulating the Earth system with interactive aerosols at the kilometer scale 

Philipp Weiss and Philip Stier

Aerosols originate from natural processes and human activities. They scatter and absorb radiation but also act as condensation nuclei in clouds. How these interactions influence the climate is still uncertain. New climate simulations at the kilometer-scale allow us to examine long-standing questions related to these interactions such as the complex effects on convective clouds. To perform kilometer-scale simulations with interactive aerosols, we developed the reduced-complexity aerosol module HAM-lite and coupled it to the climate model ICON-Sapphire. HAM-lite is based on and fully traceable to the complex aerosol module HAM. Aerosols are represented as an ensemble of log-normal modes with prescribed sizes and compositions.

We present first global simulations with ICON-Sapphire and HAM-lite at resolutions of about five kilometers and over periods of a few months. The sea surface temperature and sea ice are prescribed with boundary conditions of AMIP, and the initial conditions of the atmosphere and land are derived from the operational analysis of ECMWF. The aerosols are represented by two pure modes, one of dust and one of sea salt, and two internally mixed modes, both of organic carbon, black carbon, and sulfate. The first mixed mode represents aerosols from biomass burning emissions and the second mixed mode represents aerosols from anthropogenic and volcanic emissions.

The simulations capture key elements of the global aerosol cycle, of which some are missing entirely in coarse-scale simulations. For example, cold pool fronts drive intense dust storms over the Sahara and tropical cyclones interact with sea salt aerosols in the Pacific. We observe the transport of dust aerosols across the ocean, the wash out of sea salt aerosols by rain bands, and the updraft of biomass burning aerosols over land. We evaluate the observations with a combination of remote-sensing and in-situ data. We also compare the results to coarse-scale climate simulations. To understand processes like updraft by convection or deposition by rain, we examine the distribution of aerosols throughout the vertical column.

How to cite: Weiss, P. and Stier, P.: Simulating the Earth system with interactive aerosols at the kilometer scale, EGU General Assembly 2024, Vienna, Austria, 14–19 Apr 2024, EGU24-2359, https://doi.org/10.5194/egusphere-egu24-2359, 2024.

We propose a protocol for observational intensive intercomparison experiments of global storm-resolving models, targeting for evaluation by the EarthCARE satellite, the new satellite scheduled to be launched in May 2024. Previously, a month-long or 40-day simulation of an intercomparison of global storm-resolving models was conducted under the DYAMOND (the DYnamics of the Atmospheric general circulation Modeled On Non-hydrostatic Domains) project. Global storm-resolving models can simulate meso-scale systems in the global domain, and it has been shown that the month-long simulations under the DYAMOND project reproduce the evolution of meso-scale convective systems comparable to nature in many aspects. As a next step of the feasibility of the global storm-resolving models, two directions of the intercomparison experiments are considered. One is to extend the simulation time to cover a longer period, such as a one-year experiment with a seasonal march (Takasuka et al. 2024, in preparation). The other is to evaluate with intensive observations. Here, we propose a possible protocol for the short-term (a few weeks to a month) intercomparison experiment to evaluate GSRM results with observation by the EarthCARE satellite and the coordinated grand observation campaign called ORCESTRA.

The EarthCARE satellite will enable the world's first observations of Doppler velocities from space using radar. This groundbreaking capability allows for the observational understanding of global snow and raindrop falling velocities. In numerical climate and weather forecasting models, falling velocities of snow and raindrops have traditionally relied on empirical formulas based on fragmented observations, lacking comprehensive validation through global observations. These falling velocities have frequently been used as tuning parameters for numerical models. The falling velocity of upper-level clouds directly impacts radiation balance through variations in cloud amount. In contrast, the raindrop velocity influences the formation of cold pools and the organization of convective clouds. After obtaining Doppler velocity observations from the EarthCARE satellite, reliance on these falling velocities as tuning parameters becomes obsolete, introducing observational constraints. Conversely, altering these falling velocities from traditional prescribed values in numerical models leads to deviations in model climatology and equilibrium states from observations, necessitating refinement of other processes, which require the resolution of new compensatory errors. This presentation analyzes the characteristics of Doppler velocities using the global non-hydrostatic model NICAM and discusses the impact of snow and raindrops falling velocities. Specifically, utilizing the EarthCARE-like simulated data based on a global 220m mesh NICAM simulation, we aim to comprehend the global view of falling velocity characteristics and gain insights to analyze the EarthCARE satellite observational data.

How to cite: Satoh, M., Roh, W., and Matsugishi, S.: Proposal for an Intensive Short-term Intercomparison Experiment of Global Storm Resolution Models for Evaluation by EarthCARE Satellite Observations, EGU General Assembly 2024, Vienna, Austria, 14–19 Apr 2024, EGU24-3359, https://doi.org/10.5194/egusphere-egu24-3359, 2024.

EGU24-5731 | ECS | Orals | CL4.5

Identifying cloud objects in the km-scale earth system model ICON 

Vanessa Rieger, Paul Splechtna, and Aiko Voigt

Clouds crucially impact Earth’s climate. The distribution of clouds, horizontally and vertically, influences the radiative transfer through the atmosphere. Hence, to correctly compute the radiative transfer, it is important to understand the horizontal and vertical distribution of clouds.  Km-scale earth system models enable to resolve convection explicitly and offer the potential to represent cloud patterns more realistically. We investigate simulations of the earth system model ICON with a horizontal resolution of 5 km performed within the project nextGEMS. We identify cloud objects using connected component labelling. The method is applied to the vertically integrated cloud field as well as to the global three-dimensional cloud field. We analyse the distribution of cloud objects, their water and ice content as well as their fractal dimension on a global and regional scale. The choice of the threshold for identifying cloud objects strongly influences the analysis of the objects.

How to cite: Rieger, V., Splechtna, P., and Voigt, A.: Identifying cloud objects in the km-scale earth system model ICON, EGU General Assembly 2024, Vienna, Austria, 14–19 Apr 2024, EGU24-5731, https://doi.org/10.5194/egusphere-egu24-5731, 2024.

EGU24-6596 | ECS | Orals | CL4.5

Improved northern hemispheric atmospheric blocking properties in two storm-resolving climate models 

Edgar Dolores Tesillos and Olivia Martius

Atmospheric blocking and its associated extreme phenomena, such as hot and cold spells represent a risk to society. Current climate models struggle to simulate the atmospheric blocking properties, making it difficult to understand the underlying physical processes and raising uncertainty about their evolution under warming. Today, several climate models attempt to better resolve small-scale processes and have demonstrated their ability to convincingly simulate them; however, few studies have evaluated the impact of these tunings on large-scale flow.

Here, we investigate the representation of Atmospheric blocking characteristics in the two new generations of storm-resolving Earth-system models (nextGEMS), consisting of the Icosahedral Nonhydrostatic Weather and Climate Model (ICON) and the ECMWF Integrated Forecasting System (hereafter only IFS). These models are run at high horizontal resolution, ICON at 5 km (convective parameterization off) and IFS at 4.4 km and 28 km (convective parameterization on). Both models are fully coupled models with eddy-resolving ocean models. The five years of simulations are compared with the reanalysis ERA5 and one CMIP6 model (MPI-ESM1-2-LR). Atmospheric blockings are identified and tracked using a Lagrangian approach based on the geopotential height anomaly at 500 hPa. Properties such as intensity, size, and zonal speed are evaluated.

The nextGEMS showed an increased skill in reproducing atmospheric blocking at the system scale. Firstly, the Atmospheric blocking intensity, spatial extension, and zonal speed are closer to the ERA5 than the CMIP6 model. However, the block intensity and size in the IFS model are simulated better than in the ICON model, and its improvement increases at the finest resolution, 4.4 km. This improvement at higher resolution coincides with more precipitation upstream to the block center than at lower resolution during the onset phase. The latter is consistent with recent studies, indicating that increased moist processes contribute to stronger and bigger blocks. Thus, we provide insights into how the large-scale flow can benefit from the storm-resolving climate models by increasing their skill to simulate atmospheric blocking characteristics and the diabatic processes at higher resolution in a fully coupled system. A more comprehensive evaluation of the large-scale flow in the nextGEMS models will be performed with longer runs.

How to cite: Dolores Tesillos, E. and Martius, O.: Improved northern hemispheric atmospheric blocking properties in two storm-resolving climate models, EGU General Assembly 2024, Vienna, Austria, 14–19 Apr 2024, EGU24-6596, https://doi.org/10.5194/egusphere-egu24-6596, 2024.

EGU24-7170 | Orals | CL4.5

Projections of future climate changes from the cloud-permitting greenhouse warming simulations 

Sun-Seon Lee, Ja-Yeon Moon, Axel Timmermann, Jan Streffing, Tido Semmler, and Thomas Jung

Assessing the future risk of natural disasters, securing sustainable energy and water resources, and developing strategies for adapting to climate change remain challenging due to the large uncertainties in regional-scale climate projections. Recent efforts to address this issue include km-scale coupled climate model simulations that resolve mesoscale processes in the atmosphere and ocean, as well as their interactions with the large-scale environment and small-scale topographic features. Our presentation shows the first results from a series of global 9 km-scale greenhouse warming simulations using the AWI Climate Model Version 3 which is based on the OpenIFS atmosphere model at TCO1279 resolution and 137 vertical levels and the FESOM2 ocean model at 4-15 km resolution. By comparing a set of consecutive 10-year time-slice simulations forced by the CMIP6 SSP585 scenario with a transient simulation at a lower-resolution (31 km in the OpenIFS), we identify key differences in weather and climate-related phenomena, including tropical cyclones, ENSO, and regional climate change features that can be attributed to km-scale dynamics in clouds and atmospheric circulation patterns. The findings from our cloud-permitting climate simulations provide valuable insights into the role of small-scale processes in the sensitivity of the regional and global climate.

How to cite: Lee, S.-S., Moon, J.-Y., Timmermann, A., Streffing, J., Semmler, T., and Jung, T.: Projections of future climate changes from the cloud-permitting greenhouse warming simulations, EGU General Assembly 2024, Vienna, Austria, 14–19 Apr 2024, EGU24-7170, https://doi.org/10.5194/egusphere-egu24-7170, 2024.

EGU24-8254 | ECS | Orals | CL4.5

Demonstrating the potential of km-scale multi-annual coupled global simulations in nextGEMS: a (urban) surface perspective 

Xabier Pedruzo-Bagazgoitia, Tobias Becker, Sebastian Milinski, Thomas Rackow, Irina Sandu, Souhail Boussetta, Emanuel Dutra, Ioan Hadade, Joao Martins, Joe McNorton, Birgit Sützl, and Nils Wedi

The nextGEMS project is dedicated to develop global coupled earth-system models for multidecadal climate projections at a kilometre-scale resolution. By harnessing the strengths of high spatial resolution, the project seeks to improve the representation of physical processes and provide climate information at spatial scales that align with real-world measurements. Preparing for 30-year production runs, nextGEMS has achieved significant milestones, including the successful completion of five-year global coupled runs with a 5 km spatial resolution by two different Earth-System models: ICON, and ECMWF’s Integrated Forecasting System (IFS) coupled to the sea ice-ocean model FESOM. In this work we focus on the km-scale IFS-FESOM configuration, along with a comparable set of coarser IFS simulations coupled to either FESOM or NEMO ocean models.

We first provide a brief overview of the most relevant scientific modifications on IFS and FESOM through the development cycles needed to perform multi-annual simulations: a reduction of the global water and energy imbalance by orders of magnitude, as well as the modification in cloud physics parameters to provide a stable climate, improved coupling of ocean surface currents and fluxes, and the addition of improved high-resolution land use and land cover maps.

We further investigate the impact that the new refined surface maps have on the representation of climate at the surface and near-surface. We first explore the spatio-temporal surface-atmosphere coupling in these km-scale simulations. We then focus on more local phenomena: In particular, we pioneer the study of urban climate via coupled global multiannual simulations and explore surface-atmosphere interactions over urbanized areas, by combining refined land use/land cover maps with the active urban scheme in IFS. We find a more realistic spatial distribution of surface temperature in both urban and rural areas, especially noticeable at spatial resolutions of 9km and finer. By showing that the diurnal cycle of urban heat island intensity exhibits improved accuracy in numerous large European urban areas, our global simulations can provide local granularity at the scale of individual cities The enhancements in representing urban climate features are quantified through reduced bias, root-mean square error, and increased correlation with successively increasing model resolution.

How to cite: Pedruzo-Bagazgoitia, X., Becker, T., Milinski, S., Rackow, T., Sandu, I., Boussetta, S., Dutra, E., Hadade, I., Martins, J., McNorton, J., Sützl, B., and Wedi, N.: Demonstrating the potential of km-scale multi-annual coupled global simulations in nextGEMS: a (urban) surface perspective, EGU General Assembly 2024, Vienna, Austria, 14–19 Apr 2024, EGU24-8254, https://doi.org/10.5194/egusphere-egu24-8254, 2024.

EGU24-8565 | Orals | CL4.5

Ocean Eddy-rich Climate Simulation with IFS-FESOM 

Rohit Ghosh, Suvarchal K Cheedela, Nikolay Koldunov, Amal John, Jan Streffing, Vasco Müller, Sebastian Beyer, Thomas Rackow, Dmitry Sidorenko, Sergey Danilov, and Thomas Jung

Efforts to enhance climate model simulations by achieving higher resolutions to explicitly capture sub-grid scale processes constitute a central objective in contemporary climate modeling. In this pursuit, our focus is on resolving a pivotal element of the climate system—the ocean meso-scale eddies. At the Alfred-Wegener-Institute, we are working towards this objective by employing the ocean-sea ice model FESOM at approximately 5km horizontal resolution (NG5), coupled with the atmospheric model IFS at a 9km horizontal resolution (tco1279).

This presentation showcases preliminary results from the control simulations of IFS-FESOM under 1950 radiative conditions. Furthermore, we provide an initial glimpse into results from a historical simulation starting in 1950 with the same model configuration. Our analysis illuminates how ocean eddy-rich regions are portrayed in our simulations relative to observations. We delineate the changes and improvements in key climate components, encompassing North Atlantic/Southern Ocean temperatures, NAO, atmospheric blocking, midlatitude storm tracks, ENSO, Monsoon, ITCZ, Hadley/Walker Cells, MJO, meridional overturning, gyre circulations, as well as Arctic/Antarctic Sea ice dynamics under such high resolution.

Moreover, we endeavor to demonstrate how regional high-frequency weather and climate processes can be accurately represented in such simulations, including capturing the nature of regional extremes. In essence, our goal is to illustrate how advancing model resolution to resolve ocean eddies contributes to a more comprehensive representation of the climate system.


How to cite: Ghosh, R., Cheedela, S. K., Koldunov, N., John, A., Streffing, J., Müller, V., Beyer, S., Rackow, T., Sidorenko, D., Danilov, S., and Jung, T.: Ocean Eddy-rich Climate Simulation with IFS-FESOM, EGU General Assembly 2024, Vienna, Austria, 14–19 Apr 2024, EGU24-8565, https://doi.org/10.5194/egusphere-egu24-8565, 2024.

EGU24-8603 | Orals | CL4.5

Cloud-feedbacks in global km-scale earth system model simulations 

Ja-Yeon Moon, Sun-Seon Lee, Axel Timmermann, Jan Streffing, Tido Semmler, and Thomas Jung

Clouds are an important regulator of earth’s radiation balance. Therefore, future changes in clouds and corresponding feedbacks are likely to influence global climate sensitivity. How clouds respond to greenhouse warming on global and regional scales is still not well understood. Here we present first results from a km-scale, cloud-permitting greenhouse warming simulation conducted with the coupled OpenIFS-FESOM2 model (AWI-CM3) with ~9 km atmosphere resolution, 137 vertical levels and  4-15 km variable ocean resolution. Our analysis is based on a  set of 10-year time-slice simulations, which branched off from a lower-resolution (31 km) SSP585 transient scenario run with relatively high climate sensitivity. We will quantify the effect of atmosphere resolution and cloud granularity on cloud radiative feedbacks. We will further present results from the calculation of radiative kernels to determine the role of high cloud feedbacks in polar amplification. 

How to cite: Moon, J.-Y., Lee, S.-S., Timmermann, A., Streffing, J., Semmler, T., and Jung, T.: Cloud-feedbacks in global km-scale earth system model simulations, EGU General Assembly 2024, Vienna, Austria, 14–19 Apr 2024, EGU24-8603, https://doi.org/10.5194/egusphere-egu24-8603, 2024.

EGU24-9221 | ECS | Orals | CL4.5

Autocorrelation – A Simple Diagnostic for Tropical Precipitation in Global Kilometer-Scale Climate Models 

Dorian Spät, Aiko Voigt, Michela Biasutti, and David Schuhbauer

Tropical precipitation is the result of a complex interplay of processes across a wide range of atmospheric scales and is highly variable from place to place. A particularly interesting geographical pattern is obtained for the lag 1 autocorrelation of daily precipitation. Generally, this metric displays a relatively uniform distribution of positive values throughout the tropics. However, certain land regions, such as the Sahel, stand out due to exceptionally low autocorrelation values. These low values correspond to a dominance of high frequency precipitation events in the power spectrum.

In accordance with previous work, we show that CMIP6 climate models struggle to create a similar autocorrelation pattern. Global kilometer-scale models circumvent many of the shortcomings of the conventional coarse models, by resolving deep convection. We find that the two global kilometer-scale models developed as part of the nextGEMS project produce an autocorrelation pattern that is quite similar to the observations. These models also provide an opportunity to study the processes associated with the autocorrelation pattern.

We compare simulations with deep convection parameterization turned on and off to investigate how the parameterization scheme affects the autocorrelation pattern and the underlying power spectrum. Additionally, we perform a precipitation variance analysis based on filtering of convectively coupled equatorial waves to study the genesis of the autocorrelation pattern.

How to cite: Spät, D., Voigt, A., Biasutti, M., and Schuhbauer, D.: Autocorrelation – A Simple Diagnostic for Tropical Precipitation in Global Kilometer-Scale Climate Models, EGU General Assembly 2024, Vienna, Austria, 14–19 Apr 2024, EGU24-9221, https://doi.org/10.5194/egusphere-egu24-9221, 2024.

EGU24-10275 | ECS | Posters on site | CL4.5

Precipitation impacting upper-ocean currents: an analysis using a km-scale Earth System model 

Hans Segura, Angel Peinado, Swantje Bastin, Marius Winkler, Rodomyra Schevchenko, Ian Dragaud, and Divya Patruri

In this study, we assess the impact of precipitation on the ocean current acceleration using an Earth System model resolving deep convection and ocean eddies using a horizontal grid spacing of 5 km. Punctual studies using observations show that precipitation events with intensities higher than 24 mm d^-1 could impact the upper-ocean dynamics. Basically, the increase in buoyance flux equals half buoyancy resulting in the absorption of shortwave radiation (200 W m-2) under clear sky conditions. Due to the spatial sparse of observational sites, there is still the question of whether this number holds only in specific locations. With a grid spacing of 5 km, the simulation shows that precipitation events in the tropical Atlantic with a mean intensity greater than 20 mm d-1 impact tremendously in the stratification due to salinity in the upper ocean with two consequences. First, the mixed layer depth shallows, even in cases with strong wind forcing. Second, the momentum trapped in this shallow layer accelerates the surface currents. This is also accompanied by an increase in the turbulent kinetic energy in the mixed layer depth. These results point to the fact that precipitation, in particular in the deep tropics, could impact the upper ocean dynamic.

How to cite: Segura, H., Peinado, A., Bastin, S., Winkler, M., Schevchenko, R., Dragaud, I., and Patruri, D.: Precipitation impacting upper-ocean currents: an analysis using a km-scale Earth System model, EGU General Assembly 2024, Vienna, Austria, 14–19 Apr 2024, EGU24-10275, https://doi.org/10.5194/egusphere-egu24-10275, 2024.

EGU24-10935 | ECS | Orals | CL4.5

AQUA: a novel quality assessment tool for km-scale simulations in the Destination Earth Climate Digital Twin - the core framework 

Matteo Nurisso, Jost von Hardenberg, Silvia Caprioli, Supriyo Ghosh, Nikolay Koldunov, Bruno P. Kinoshita, Natalia Nazarova, Paolo Ghinassi, and Paolo Davini

Destination Earth (DestinE) is a major initiative by the European Commission aiming to create a highly accurate global digital twin of Earth. The Climate Adaptation Digital Twin in DestinE is an ambitious project of several different climate simulations at the km-scale producing a large amount of heavy dataset, difficult to access and analyse with standard data processing  pipelines. Each project and each model produces data that may differ in format (NetCDF, GRIB, Zarr), structure and metadata, leading to the necessity of tweaks and complex pipelines in order to prepare data for analysis.

We thus introduce AQUA, an Application for Quality assessment and Uncertainty quAntification. AQUA is composed of a core engine facilitating data access, combined with a series of modular and independent diagnostics to be run continuously to monitor and evaluate climate simulations. In this contribution we present the core engine and its features. 

Though many available suites already exist to analyse data from global climate models, AQUA has been specifically developed to deal with large km-scale datasets, with the goal of unifying and simplifying climate data access for all users. AQUA responds to the need for users to have the focus on the development of their data analysis, while datasets are found, retrieved and homogenised by an external tool to which they can connect their pipeline. 

Developed in Python, leveraging the power of Dask and Xarray libraries, AQUA prioritises efficiency through lazy data access. Noteworthy is the utilisation of cdo for one-time weight computation, enhancing performances in regridding and averaging operations. A key strength lies in its ability to handle high-resolution, high-frequency data, loading into memory only when necessary. AQUA not only unifies and simplifies climate data access for users but also addresses the crucial need for responsive feedback to climate model developers.

How to cite: Nurisso, M., von Hardenberg, J., Caprioli, S., Ghosh, S., Koldunov, N., P. Kinoshita, B., Nazarova, N., Ghinassi, P., and Davini, P.: AQUA: a novel quality assessment tool for km-scale simulations in the Destination Earth Climate Digital Twin - the core framework, EGU General Assembly 2024, Vienna, Austria, 14–19 Apr 2024, EGU24-10935, https://doi.org/10.5194/egusphere-egu24-10935, 2024.

EGU24-11230 | ECS | Orals | CL4.5

AQUA: a novel quality assessment tool for km-scale simulations in the Destination Earth Climate Digital Twin - the diagnostics suite 

Silvia Caprioli, Jost von Hardenberg, Paolo Ghinassi, Supriyo Ghosh, Lukas Kluft, Nikolay Koldunov, François Massonnet, Natalia Nazarova, Matteo Nurisso, Pablo Ortega, Susan Sayed, Tanvi Sharma, and Paolo Davini

Destination Earth (DestinE) is a major initiative by the European Commission aiming to create a highly accurate global digital twin of Earth. This model, supported by advanced high-performance computing and artificial intelligence, will monitor and simulate interactions between natural phenomena and human activities with unprecedented accuracy. Developed within the Climate Adaptation Digital Twin of the Destination Earth project, AQUA (Application for Quality assessment and Uncertainty quAntification) is a specialized model evaluation framework for running climate data diagnostics.

While existing diagnostic suites for global climate model data are already available, AQUA stands out by specifically addressing extensive kilometer-scale datasets, to simplify climate data access for all possible users. AQUA features two diagnostic families:

  • "state-of-the-art” diagnostics, which compare low-resolution data with observations to assess general model performance and to identify biases and drifts (performance indices, radiation budget, atmospheric global mean time series and biases, teleconnection indices, ocean circulation evaluation, tropical cyclones detection, tracking and zoom-in)
  • “frontier” diagnostics, which exploit new high-resolution (i.e., km-scale hourly) climate data to provide insight at climatological scales of physical/dynamical processes that could not be investigated before (sea surface height variability, tropical rainfall) 

Beyond offering a flexible and efficient framework for processing and analyzing large volumes of climate data, AQUA’s modular design offers the possibility of seamless integration of new diagnostic tools, with plans for further expansion in the future phases of the project.
In this contribution, we will introduce the current suite of AQUA diagnostics and outline its planned future developments.

How to cite: Caprioli, S., von Hardenberg, J., Ghinassi, P., Ghosh, S., Kluft, L., Koldunov, N., Massonnet, F., Nazarova, N., Nurisso, M., Ortega, P., Sayed, S., Sharma, T., and Davini, P.: AQUA: a novel quality assessment tool for km-scale simulations in the Destination Earth Climate Digital Twin - the diagnostics suite, EGU General Assembly 2024, Vienna, Austria, 14–19 Apr 2024, EGU24-11230, https://doi.org/10.5194/egusphere-egu24-11230, 2024.

EGU24-11656 | ECS | Posters on site | CL4.5

Climate storylines using the spectral nudged simulations with IFS-FESOM 

Amal John, Sebastian Beyer, Marylou Athanase, Antonio Sánchez Benítez, Helge Goessling, and Thomas Jung

We are presenting our efforts to incorporate spectral nudging capabilities into the development and assessment of model-driven storyline scenarios using a km-scale coupled climate model. Working within the framework of the EU’s Destination Earth project, we are working towards this objective by employing the ocean sea-ice model FESOM coupled with the atmospheric model IFS.

We showcase our preliminary results from the nudged runs of IFS-FESOM for the present day which will eventually lead the way into the storyline scenarios where the same winds would be imposed in different climates. We also show a glimpse of how the nudged simulations for the present-day climate serve to assess model quality against observations based on relatively short simulations, incorporating field campaign data like MOSAiC. In the future, these capabilities could be used to produce “storylines” that help to address the question of how recent extreme events would unfold in preindustrial, +1.5K, +2K, +3K and +4K climates.

Ultimately, our novel storyline scenarios have the potential to illustrate the impact of climate change on extreme events in a way that is more tangible and relatable and nicely complements the probabilistic approach. Since they are based on recent extreme events and explore probable variations in diverse plausible climates, these storylines establish a more profound connection to users' experiences. When these scenarios are presented to users it can foster discussions on future activities and necessary adaptation measures.

How to cite: John, A., Beyer, S., Athanase, M., Sánchez Benítez, A., Goessling, H., and Jung, T.: Climate storylines using the spectral nudged simulations with IFS-FESOM, EGU General Assembly 2024, Vienna, Austria, 14–19 Apr 2024, EGU24-11656, https://doi.org/10.5194/egusphere-egu24-11656, 2024.

The amplitude of precipitation extremes across Europe is expected to increase through the 21st century under most climate change scenarios. Current CMIP-style global climate models broadly project increased flooding and drought extremes; however, they often rely on parametrization schemes or downscaling methods for inferring about potential future extreme events. These methods often introduce errors leading to high levels of uncertainty for policymakers and infrastructure planning. The need for accurate extreme event projections became further evident after the July 2021 floods and summer 2022 record-breaking heatwaves and droughts across Western Europe.

The ongoing H2020 Next Generation Earth Modelling Systems (nextGEMS) project aims to address these issues with the development of storm-resolving, fully-coupled, Earth-system models. Using the latest Cycle 3 runs from the Integrated Forecast System from ECMWF and ICON from MPI-M, we examine the dynamical representation of extreme precipitation events across Europe and compare it against a suite of observations (station and satellite based), reanalysis datasets, and CESM2 simulations. Focusing on tail-end extremes, the results focus on the realism of high precipitation extremes, value of upscaling to CMIP6 resolution, representation of precipitation drivers, and dry extremes (dry day percentages and consecutive dry days). Overall, both ICON and IFS perform reasonably well in representing high precipitation extremes although issues related to the ICON non-parameterized, deep convection causes overly frequent precipitation events.

How to cite: Wille, J. and Fischer, E.: Representation of extreme precipitation events in storm-resolving global climate models within the nextGEMS project, EGU General Assembly 2024, Vienna, Austria, 14–19 Apr 2024, EGU24-11797, https://doi.org/10.5194/egusphere-egu24-11797, 2024.

EGU24-12427 | ECS | Posters on site | CL4.5

Km-scale climate simulations with IFS-FESOM 

Sebastian Beyer, Dmitry Sidorenko, Rohit Ghosh, Amal John, Thomas Rackow, Jan Streffing, Suvarchal Kumar Cheedela, Bimochan Niraula, Nikolay Koldunov, and Thomas Jung

Within the EU’s Destination Earth (DestinE) initiative we are developing a digital climate twin with km-scale resolution. This enables us to resolve physical processes that, so far, have only been represented by approximations. This core model setup (called digital twin engine)  is able to run multidecadal simulations for historic periods as well as different future scenarios in unprecedented resolution which will be used by decision makers.

In phase one of DestinE, our goal is to run a control simulation (under 1950 pre industrial conditions), a historic simulation from 1990 to 2020 and finally, projection simulations from 2020 to 2040. The control run will be performed with a global atmospheric resolution of 9km, while the projection simulations use 4km. The ocean component uses the unstructured NG5 mesh, which means an approximate resolution of 5km.

In this work we present the latest iteration of the IFS-FESOM model, the Integrated Forecasting System coupled to the Finite volumE Sea Ice-Ocean Model FESOM2. We explain its components and recent improvements, including  the integration of ECMWF’s IO-server and post processing toolkit multio into the FESOM2 component and the introduction of a novel runoff mapper. Preliminary results from our kilometre-scale simulations are shown and compared to preindustrial conditions, with the primary objective to quantify effects of a ~1K warming world.

How to cite: Beyer, S., Sidorenko, D., Ghosh, R., John, A., Rackow, T., Streffing, J., Cheedela, S. K., Niraula, B., Koldunov, N., and Jung, T.: Km-scale climate simulations with IFS-FESOM, EGU General Assembly 2024, Vienna, Austria, 14–19 Apr 2024, EGU24-12427, https://doi.org/10.5194/egusphere-egu24-12427, 2024.

Global nonhydrostatic models that cover the globe with a kilometer (km)-scale mesh have been developed by various organizations worldwide and are expected to be next-generation models that can explicitly calculate deep convective clouds. However, it is known that convective upward motions are not sufficiently represented at the km-scale resolution, and the mesh size of O(100m) is required to obtain convergence of upward motions. To understand the limitation of global km-scale models, we investigate the representation of cloud, precipitation, and circulation with the resolution in the global simulations between km-scale to sub-km-scales.

We conduct the global atmospheric simulations by the Nonhydrostatic Icosahedral Atmospheric Model (NICAM) for the mesh size of 3.5 km, 1.7 km, 870 m, 440 m, and 220 m using the Supercomputer "Fugaku."  The 3.5 km experiment started on August 1, 2016, the same day as DYAMOND-summer, and the next higher resolution was run using the lower resolution simulation results as initial conditions. We analyzed data on August 5, 2016. We conducted the global 220m simulation for 8 hours.

The resolution dependence of cloud, precipitation, and convection was investigated. Lower clouds decrease with increasing resolution. High cloud increased or decreased with respect to resolution depending on the turbulence scheme. The precipitation distribution and zonal mean humidity do not change significantly, but the precipitation intensity changes with resolution. For the grid spacing of less than km, it eliminates overconcentration of precipitation, and the rain area widens as the resolution becomes finer. The coarse-grained rainfall distribution is smoother in the sub-km scale model than in the km scale model. A finer scale convection core is reproduced in the sub-km scale model. Vertical wind speed at grid point scales increases with increasing resolution. However, when horizontally averaged over a few-degree grid, the vertical wind speed decreases, and the circulation becomes weaker with higher resolution. We found that the km-scale model may be creating large strong convection. Uncertainties resulting from the turbulence scheme also appear to be large in the km/sub-km models.

How to cite: Matsugishi, S., Ohno, T., and Satoh, M.: Differences in the cloud, precipitation, and convection representation between the global sub-km mesh simulation and km simulations, EGU General Assembly 2024, Vienna, Austria, 14–19 Apr 2024, EGU24-14676, https://doi.org/10.5194/egusphere-egu24-14676, 2024.

EGU24-15657 | ECS | Orals | CL4.5

Towards a global km-scale flood forecasting system 

Jasper Denissen, Gabriele Arduini, Ervin Zsoter, Cinzia Mazzetti, Christel Prudhomme, Shaun Harrigan, Gianpaolo Balsamo, Iria Ayan-Miguez, Peter Dueben, Irina Sandu, and Benoit Vanniere

River discharge has direct influence on the water-food-energy-environment nexus and can have devastating impacts during extreme events with rapid onsets such as floods. Floods often occur after extreme precipitation events, which are challenging to forecast accurately, both in time and space. Unresolved small-scale processes and features, including convection and orography, have a detrimental effect on precipitation and consequently hydrological forecast skill. This calls for a spatial resolution increase in Numerical Weather Prediction (NWP) models, including their land component.

The Destination Earth programme of the European Commission addresses this with globally coupled forecasts at spatial resolutions down to the km-scale with lead times of 5 days: the Digital Twin on Weather-Induced Extremes (EDT). These meteorological forecasts are used to force ECMWF’s Land Surface Modelling System (ECLand), the land component of the Integrated Forecasting System (IFS), to generate runoff. Subsequently, the river-routing scheme CaMa-Flood, effectively 1-way coupled to the IFS, is used to route runoff in rivers and to produce hydrological simulations. Essentially, CaMa-Flood will be part of the continuous component of the EDT, which in phase 2 of Destination Earth will provide daily high-resolution forecasts to monitor extreme events, such as floods, in real time. As river discharge acts as a natural integrator of the water cycle, CaMa-Flood can be used as a diagnostic tool to assess the hydrological response to increases in spatial resolution of the forcing and the river-routing network.

In this study, two data products are derived: i) long-term hydrological simulations forced by atmospheric analysis data (e.g. ERA5 or ECMWF operational analysis) and ii) hydrological forecasts (daily forecasts in June - July 2021 and January - February 2022 as well as selected flood cases). To assess their quality, these data are validated with point-observed river-discharge time series. Analysis shows that the long-term hydrological simulations benefit from spatial resolution increases in the meteorological forcing and to a lesser extent from spatial resolution increases in the river-routing network. This is evidenced by higher Kling-Gupta Efficiency (KGE), higher correlations and lower biases across 876 river stations in Europe. Further, hydrological forecasts also benefit from higher spatial resolution meteorological forcing, evidenced both by higher correlations of the continuous summer/winter forecasts against river discharge observations from 798 river stations across Europe and by more pronounced flood peak magnitude for selected flood cases. These results highlight the added value of high resolution for hydrological forecast accuracy.

How to cite: Denissen, J., Arduini, G., Zsoter, E., Mazzetti, C., Prudhomme, C., Harrigan, S., Balsamo, G., Ayan-Miguez, I., Dueben, P., Sandu, I., and Vanniere, B.: Towards a global km-scale flood forecasting system, EGU General Assembly 2024, Vienna, Austria, 14–19 Apr 2024, EGU24-15657, https://doi.org/10.5194/egusphere-egu24-15657, 2024.

Cloud microphysics are a prime example of processes that remain unresolved in atmospheric modelling with storm-resolving resolution. In this study, we explore how uncertainties in the representation of microphysical processes affect the tropical energy budget in a global storm-resolving model (SRM). We use the global SRM ICON with a one-moment or a two-moment microphysics schemes and do several sensitivity runs, where we vary one parameter of the applied microphysics scheme in its range of uncertainty. We find that the two microphysics schemes have distinct signatures, e.g., in how condensate is distributed among the different hydrometeor categories or in the intensity distribution of precipitation, but their tropical mean cloud fraction and total condensate profiles are rather robust. Precipitation efficiency sets the amount of condensate in the atmosphere and thereby links microphysical processes to the radiative properties of the atmosphere. Uncertainties in the representation of microphysical processes cause substantial spread in the top-of-the-atmosphere (TOA) energy balance. In agreement with the robustness of the cloud fraction, changes in the radiative balance at TOA are dominated by changes in the radiative properties of cloudy points. A shift towards higher cloud-ice concentrations in simulations with the two-moment microphysics scheme leads to more reflected shortwave radiation that is not fully compensated by less outgoing longwave radiation and results in a slight cooling of the atmospheric column. Overall, microphysical sensitivities at storm-resolving resolution are substantial and resemble part of the inter-model spread of a multi-model ensemble.

How to cite: Naumann, A. K., Esch, M., and Stevens, B.: How the representation of microphysical processes affects the tropical energy budget in a global storm-resolving model, EGU General Assembly 2024, Vienna, Austria, 14–19 Apr 2024, EGU24-16801, https://doi.org/10.5194/egusphere-egu24-16801, 2024.

EGU24-17906 | ECS | Orals | CL4.5

Multifractal analysis for evaluating the representation of clouds in global km-scale models 

Lilli Freischem, Philipp Weiss, Hannah Christensen, and Philip Stier

Clouds are one of the largest sources of uncertainty in climate predictions. Emerging next-generation km-scale climate models need to simulate clouds and precipitation accurately to reliably predict future climates. To isolate issues in their representation of clouds, and thereby facilitate their improvement, km-scale models need to be thoroughly evaluated via comparisons with observations.

Traditionally, climate models are evaluated using spatio-temporally averaged observations. However, aggregated evaluation loses crucial information about underlying physical processes, such as convective updrafts, and the resulting cloud macrophysical structures. We postulate that a novel spatio-temporal evaluation strategy using satellite observations provides direct constraints on physical processes.

Here, we introduce multifractal analysis as a method for evaluating km-scale simulations. We apply it to top-of-atmosphere outgoing longwave radiation (OLR) fields to investigate structural differences between observed and simulated clouds in the tropics. For this purpose, we compute structure functions from OLR fields to which we fit scaling exponents. We then parameterise the scaling exponents to compute scaling parameters. The parameters compactly characterise OLR variability and can be compared across simulations and observations. We use this method to evaluate the ICON-Sapphire and IFS-FESOM simulations run for cycle 3 of the nextGEMS project via comparison with data from the geostationary satellite GOES-16.

We find that clouds in both models exhibit multifractal scaling from 50 to 1000km. However, the scaling parameters are significantly different between ICON and IFS, and neither match observations. In the ICON model, multifractal scaling exponents are lower than in observations whereas in IFS, they are larger. The observed differences indicate how the modelling approaches in ICON and IFS impact the organisation of clouds. More specifically, the deep convection scheme in ICON is switched off completely whereas it is still active in IFS, which could explain the difference in scaling behaviour we observed.

Our results show that spatio-temporal analysis is a promising new way to constrain global km-scale models. It can provide key insights into model performance and shed light on issues in the representation of clouds.

How to cite: Freischem, L., Weiss, P., Christensen, H., and Stier, P.: Multifractal analysis for evaluating the representation of clouds in global km-scale models, EGU General Assembly 2024, Vienna, Austria, 14–19 Apr 2024, EGU24-17906, https://doi.org/10.5194/egusphere-egu24-17906, 2024.

In recent years, great efforts have been made to reduce the horizontal grid spacing of atmospheric models to a few kilometers to build so-called Global Storm-Resolving Models (GSRMs). However, the vertical grid spacings used in these models are generally of the same order of magnitude as those used in classical climate models with horizontal grid spacings of a few hundred kilometers. From previous sensitivity experiments with a variety of model types, from direct numerical simulations to these classical climate models, it is known that especially the simulation of clouds can strongly depend on the vertical model resolution. To test the importance of the vertical grid spacing in GSRMs we have performed simulations with the ICON atmospheric model at 5 km horizontal grid spacing and with between 55 and 540 vertical layers, corresponding to maximum tropospheric vertical grid spacings between 800 and 50 m.  

Here we present results of these simulations. They results show that for most of the variables considered, halving the vertical grid spacing by half has a less pronounced impact than halving the horizontal grid spacing, but the effect is not negligible. For example, for each halving of the vertical grid spacing, coupled with necessary reductions in the time step length, cloud liquid water increases globally by approximately 7%, while it decreases by roughly 16% when halving the horizontal grid spacing. Both the grid spacing and the time step contribute to these effects. Comparison of selected climate variables with observations shows that model biases are only in some cases reduced by higher vertical resolution, because of the dominance of model biases with other origins.

How to cite: Schmidt, H.: Exploring the impact of the vertical grid spacing for the climate simulated in a global storm-resolving model, EGU General Assembly 2024, Vienna, Austria, 14–19 Apr 2024, EGU24-18060, https://doi.org/10.5194/egusphere-egu24-18060, 2024.

EGU24-18483 | Posters on site | CL4.5

Eulerian and Lagrangian Perspectives on Mesoscale Air-Sea Interactions 

Dian Putrasahan and Jin-Song von Storch
Mesoscale ocean eddies can be likened to weather events of the sea, influencing a multitude of coupled air-sea processes that help in regulating heat and carbon uptake and consequently the climate. With the advancements in high-performance computing, we can now employ multi-decadal kilometre-scale coupled global climate models (GCMs) that effectively captures the intricacies of mesoscale ocean-atmosphere interactions and shed light on their implications at larger scales. While low resolution CMIP-type GCMs show a dominance of atmospheric-forced coupled variability, e.g. faster winds over ocean surface can enhance turbulent heat flux and thus cool sea surface temperatures (SSTs), satellite observations and eddy-resolving coupled models show a prevalence of mesoscale ocean-forced coupled variability over eddy-rich regions like SST front areas. Two ocean mesoscale dynamical processes can promote such ocean-forced coupled variability, namely through thermal feedback and current feedback. Consider the thermal feedback as an example; the destabilisation of the atmosphere above warm mesoscale anomalies amplifies the downward transfer of momentum from higher-altitude winds to the surface, known as the vertical or downward mixing mechanism. This, in turn, leads to enhanced surface winds and increased turbulent heat flux over warm SST anomalies. We employ a coupled 5km-ocean 10km-atmosphere ICON model to assess the global distribution of mesoscale air-sea coupling associated with these feedbacks and their implications on wind work and eddy-induced Ekman upwelling. Additionally, we show examples of such mesoscale coupling from a Lagrangian perspective through composites of tracked eddies, their impact on ocean upwelling/downwelling and their imprint on the overlying atmosphere beyond the surface like precipitation.

How to cite: Putrasahan, D. and von Storch, J.-S.: Eulerian and Lagrangian Perspectives on Mesoscale Air-Sea Interactions, EGU General Assembly 2024, Vienna, Austria, 14–19 Apr 2024, EGU24-18483, https://doi.org/10.5194/egusphere-egu24-18483, 2024.

EGU24-18761 | Posters on site | CL4.5

Modelling of the Hunga Tonga eruption for testing the GPU port of ICON 

Luis Kornblueh and the Port ICON to Lumi

Porting weather and climate models such as ICON to GPU-based computer production systems requires serious testing of the code adapted to the
additional hardware and its software stack. The high resolution of storm resolving models poses problems for porting ICON and very short simulations facilitate this task.

The 2022 eruption of the Hunga Tonga–Hunga Haʻapai submarine volcano had a very strong water vapour signal, which is modelled by adjusting the model initial conditions to include a cylindrical water vapour plume: a very simple setup to implement, but one that reflects the strong signal in the model results. This plume is visible in the model for years. For the test case we focus on the first time steps. These support the detection of technical errors in the porting of the model code in very short simulations at the final model resolution of 5 km.

We present the scientific use case, the model configuration and some results from test simulations on Lumi.

How to cite: Kornblueh, L. and the Port ICON to Lumi: Modelling of the Hunga Tonga eruption for testing the GPU port of ICON, EGU General Assembly 2024, Vienna, Austria, 14–19 Apr 2024, EGU24-18761, https://doi.org/10.5194/egusphere-egu24-18761, 2024.

EGU24-18964 | ECS | Posters on site | CL4.5

On the detection and tracking of mesoscale ocean eddies: Parameter sensitivity 

Stella Bērziņa, Nicolas Gruber, and Matthias Münnich

The characteristics of coherent mesoscale eddies are an important point of evaluation for high-resolution ocean and coupled climate models. Mesoscale eddies are rotating features in the ocean on horizontal scales from 10 to 100 km that transport physical, chemical and biological properties of the ocean water. There are many possible ways to identify and track eddies (sea surface height anomalies, sea surface temperature anomalies, vorticity, etc.) and even within one method parameters can be adjusted to lead to different eddy identification results, for example, the allowed shape error of eddies.  

Here we explore systematically the sensitivity of the identification and tracking results to choices made with regard to data, allowed eddy size and shape error and the use of different high-pass filters. Additionally, eddy identification and tracking are done on a regular latitude-longitude grid rather than the native model grid, therefore, the impact of the chosen grid size is assessed.

To this end, we use “py-eddy-tracker” (Mason et al. 2014) a commonly used open-source geometry-based approach. The algorithm uses sea level anomaly data and several adjustable parameters to identify eddies. It then joins the identified eddies to form tracks by using the ellipsoid method described in Chelton et al. 2011, where the two closest lying eddies in subsequent time steps are connected if they occur within a restricted search region.

We apply this identification and tracking algorithm to high frequency output from different high-resolution coupled climate models run as part of the EERIE project and compare the results of eddy characteristics to observations. This study will help to make more informed and study-specific choices when setting threshold values in eddy identification algorithms for model assessment or creating eddy observational data set from satellite altimetry data.

How to cite: Bērziņa, S., Gruber, N., and Münnich, M.: On the detection and tracking of mesoscale ocean eddies: Parameter sensitivity, EGU General Assembly 2024, Vienna, Austria, 14–19 Apr 2024, EGU24-18964, https://doi.org/10.5194/egusphere-egu24-18964, 2024.

EGU24-19072 | ECS | Orals | CL4.5

Surface irradiance variability over land in storm-resolving models. 

Menno Veerman and Chiel van Heerwaarden

With increasing horizontal resolution in global models, we may expect an increasingly more realistic representation of cloud development over land as both large-scale circulations and local surface heterogeneities, such as orography and land use type, are better resolved. As clouds are a dominant contributor to inter- and intra-diurnal variations in both solar and thermal surface irradiance, the spatiotemporal irradiance variability should then be better represented than in conventional climate models. Here, we use the 5-year coupled atmosphere-ocean global simulations performed in Cycle 3 of the nextGEMS project to evaluate the surface irradiance variability over land. These 5-year simulations were performed at different resolution, from 4.4 to 28 km, and with two different global models, the Integrated Forecasting System (IFS) and the Icosahedral Nonhydrostatic model (ICON), allowing us to separate the impacts of horizontal resolution and of implementation choices concerning model physics. We select a couple of representative locations with varying climate and land surface characteristics where high-quality irradiance observations from the Baseline Surface Radiation Network (BSRN) are available. While first results show some benefits of increased horizontal resolution, higher resolutions simulations do not consistently produce more accurate surface irradiances than simulations at lower resolution. Furthermore, differences between the IFS and ICON models are often larger than differences between the IFS simulations at varying resolutions. These results suggest that if realistic surface irradiance predictions are concerned, e.g. for solar energy applications, the road to model improvement by increasing horizontal resolution is not straightforward. 

How to cite: Veerman, M. and van Heerwaarden, C.: Surface irradiance variability over land in storm-resolving models., EGU General Assembly 2024, Vienna, Austria, 14–19 Apr 2024, EGU24-19072, https://doi.org/10.5194/egusphere-egu24-19072, 2024.

EGU24-19735 | ECS | Posters on site | CL4.5

Network of extremes in ocean eddy-resolving climate models 

Emma Ferri, Nicolas Gruber, Matthias Münnich, and Dian Putrasahan

Marine extreme events, such as marine heatwaves, have a disproportional impact on marine organisms and ecosystems, shaping many of their characteristics. Even though such extremes have become the focus of much research in the last few years, our understanding of the processes that give rise to extreme conditions is still relatively poor. Mesoscale processes have been shown to structure and shape extremes, but also not much is known about their role. Here we use graph theory to detect the correlation between extreme marine events and distant occurrences of atmospheric extremes in the context of mesoscale variability. The data stem from a set of mesoscale resolution model simulation results obtained from the European Eddy RIch Earth System Models (EERIE) project. Common statistical tests such as the Pearson correlation coefficient and the Granger causality will be used to build the graph object. This will permit us to build a network of different oceanographic and atmospheric variables in an attempt to detect teleconnections, such as, for example, the impact of El Niño, on the onset, persistence, and demise of extremes. Our initial networks correlate various variables, such as precipitation and sea surface temperature (SST), eddy kinetic energy and SST, and global SST variations.

How to cite: Ferri, E., Gruber, N., Münnich, M., and Putrasahan, D.: Network of extremes in ocean eddy-resolving climate models, EGU General Assembly 2024, Vienna, Austria, 14–19 Apr 2024, EGU24-19735, https://doi.org/10.5194/egusphere-egu24-19735, 2024.

EGU24-21956 | ECS | Posters on site | CL4.5

Storm Tracks and Jet Streams in ICON: Unravelling Climate Change Responses through Aquaplanet Horizontal Grid Spacing Sensitivity Experiments 

Angel Peinado Bravo, Tiffany Shaw, Daniel Klocke, and Bjorn Stevens

General Circulation Models (GCMs) are widely used to understand our climate and to simulate and predict the effects of global warming, revealing the dynamical convergence of storm tracks and jet streams at horizontal grid spacing of 50 km (e.g., Lu et al. 2015). Nevertheless, they have shown persistent biases in the large-scale features of the general circulation and basic climate statistics, which are attributed mainly to the parameterization, specifically, convection parameterization. To address this, Global storm-resolving models (GSRMs) provide an alternative approach to parameterization by explicitly resolving convection and its interaction with other processes,  through the refinement of the horizontal grid, thus, offering new insights into the climate system. In a prior study, we showed the physical convergence of the tropical and general circulation structure at horizontal grid spacing of 2.5 km using aquaplanets. However, questions linger: Does the response under climate change of the storm tracks and jet streams converge at similar horizontal grid spacing, and what mechanism controls this convergence?


We will present the effect of increasing horizontal grid spacing on the convergence of the storm tracks and jet stream location and intensity using the global storm-resolving model ICON. Control runs and idealised climate change experiments (increasing sea-surface temperature by 4 Kelvin) were conducted at horizontal grid spacing from 160 km to 2.5 km using an aqua-planet configuration. We adopt an aqua-planet configuration to focus on atmospheric phenomena, specifically convection and cloud feedback, meanwhile reducing the effect of complex interaction with land, topography, sea ice, and seasons. We will discuss the convergence rate of the eddy driven jet, subtropical jet, storm track, and large-scale circulation and their response to climate warming, characterised by the location, width, and intensity. 

How to cite: Peinado Bravo, A., Shaw, T., Klocke, D., and Stevens, B.: Storm Tracks and Jet Streams in ICON: Unravelling Climate Change Responses through Aquaplanet Horizontal Grid Spacing Sensitivity Experiments, EGU General Assembly 2024, Vienna, Austria, 14–19 Apr 2024, EGU24-21956, https://doi.org/10.5194/egusphere-egu24-21956, 2024.

The latest assessment report (AR6) of the Intergovernmental Panel on Climate Change includes a new element to climate research, i.e. the Interactive Atlas (IA), which is very useful for users from different sectors. As the new CMIP6 global climate model simulations use the brand-new SSP-scenarios paired with the RCP-scenarios, the latest climate change projections should be evaluated in order to update the regional and national adaptation strategies. Keeping this in mind we focused on Europe, with a special emphasis on Hungary in our study.

Our aim was to analyse the potential future changes of different temperature indices for Europe, in order to recognize spatial patterns and trends that may shape our climate in the second half of the 21st century. For this purpose, multi-model mean simulation data provided by the IPCC AR6 WG1 IA were downloaded on a monthly base. We chose two climate indices beside the mean temperature values, which represent temperature extremes, namely, the number of days with maximum temperature above 35 °C and the number of frost days (i.e. when daily minimum temperature is below 0 °C). We focused on the end of the 21st century (2081–2100) with also briefly considering the medium-term changes of the 2041–2060 period (both compared to the last two decades of the historical simulation period, i.e. 1995–2014 as the reference period). For both future periods we used all scenarios provided in the IA, namely, SSP1-2.6, SSP2-4.5, SSP3-7.0 and SSP5-8.5.

Several zonal and meridional segments over the continent were defined, where we analysed the projected changes of the indices. The zonal segments provide an insight on two different effects that may induce spatial differences between future regional changes. (i) Continentality can be recognized as an increasing effect from the western parts of the segment towards the east. (ii) Topography also appears as the influence of mountains, plains, and basins emerge. The meridional segments provide information about the north-to-south differences as well, as the effects of sea cover. The changes in the indices are plotted on diagrams representing the different months, where the differences in the scenarios are also shown. These diagrams are compared to their respective landscape profiles, furthermore, statistical parameters were calculated. In addition, a monotony index was defined as the cumulative direction of differences between the neighbouring grid cells and analysed within the study.

Our results show that in the changes of mean temperature, both the zonal location and sea cover will play a key role in forming spatial differences within Europe. However, for the extreme temperature indices, topography and continentality are likely to become more dominant than sea cover, while the zonal location remains an important factor. 

Acknowledgements: This work was supported by the Hungarian National Research, Development and Innovation Fund [grant numbers PD138023, K-129162], and the National Multidisciplinary Laboratory for Climate Change [grant number RRF-2.3.1-21-2022-00014]. 

How to cite: Divinszki, F., Kis, A., and Pongrácz, R.: Analysing the projected monthly changes of temperature-related climate indices over Europe using zonal and meridional segments based on CMIP6 data, EGU General Assembly 2024, Vienna, Austria, 14–19 Apr 2024, EGU24-389, https://doi.org/10.5194/egusphere-egu24-389, 2024.

EGU24-868 | ECS | Posters on site | CL4.3

Relationship of the predictability of North Pacific Mode and ENSO with predictability of PDO 

Jivesh Dixit and Krishna M. AchutaRao

PDO and ENSO are most prominent variability modes in the Pacific Ocean at decadal and interannual timescales respectively. Mutual independence between ENSO and PDO is questionable (Chen & Wallace, 2016). Linear combination of the first two orthogonal modes of SST variability in our Study Region (SR; 70oN - 20oS, 110oE - 90oW) i.e. mode 1 (interannual mode, we call it, IAM; ENSO like variability) and mode 2 (North Pacific Mode (NPM; Deser & Blackmon (1995)); a decadal mode) produces a PDO like variability (Chen & Wallace, 2016). It suggests that PDO is not independently hosted in the Pacific Ocean and can be represented by two linearly independent variability modes.

To produce credible and skillful climate information at multi-year to decadal timescales, Decadal Climate Prediction Project (DCPP), led by the Working Group on Subseasonal to Interdecadal Prediction (WGSIP), focuses on both the scientific and practical elements of forecasting climate by employing predictability research and retrospective analyses within the Coupled Model Intercomparison Project Phase 6 (CMIP6). Component A under DCPP experiments concentrates on hindcast experiments to examine the prediction skill of participating models with respect to actual observations.

As linear combination of  IAM and NPM in SR produces PDO pattern and timescales efficiently, we compared the  ability of DCPP-A hindcasts to predict  IAM, NPM, and  PDO. In this analysis we use output from 9 models (a total of 128 ensemble members), initialised every year from 1960 to 2010. To produce the prediction skill estimates.

At lead year 1 from initialisation, the prediction of NPM,  IAM and PDO is quite skillful as the models are initialised with observations. In subsequent years, skill of either IAM or NPM or both drop significantly and that leads to drop in skill of predicted PDO index. Both the deterministic estimates and probabilistic estimates of prediction skill for DCPP hindcast experiments suggest that the ability of hindcast experiments to predict NPM governs the prediction skill to predict PDO index.

Keywords: PDO, ENSO, NPM, CMIP6, DCPP, hindcast

References

Chen, X., & Wallace, J. M. (2016). Orthogonal PDO and ENSO indices. Journal of Climate, 29(10), 3883–3892. https://doi.org/10.1175/jcli-d-15-0684.1

Deser, C., & Blackmon, M. L. (1995). On the Relationship between Tropical and North Pacific Sea Surface Temperature Variations. Journal of Climate, 8(6), 1677–1680. https://doi.org/10.1175/1520-0442(1995)008<1677:OTRBTA>2.0.CO;2

How to cite: Dixit, J. and AchutaRao, K. M.: Relationship of the predictability of North Pacific Mode and ENSO with predictability of PDO, EGU General Assembly 2024, Vienna, Austria, 14–19 Apr 2024, EGU24-868, https://doi.org/10.5194/egusphere-egu24-868, 2024.

EGU24-1757 | Posters on site | CL4.3

Is the NAO signal-to-noise paradox exacerbated by severe winter windstorms? 

Lisa Degenhardt, Gregor C. Leckebusch, Adam A. Scaife, Doug Smith, and Steve Hardiman

The signal-to-noise paradox is known to be a limitation in multiple seasonal and decadal forecast models where the model ensemble mean predicts observations better than individual ensemble members. This ‘paradox’ occurs for different parameters, like the NAO, temperature, wind speed or storm counts in multiple seasonal and decadal forecasts. However, investigations have not yet found the origin of the paradox. First hypotheses are that weak ocean – atmosphere coupling or a misrepresentation of eddy feedback in these models is responsible.

Our previous study found a stronger signal-to-noise error in windstorm frequency than for the NAO despite highly significant forecast skill. In combination with the underestimation of eddy feedback in multiple models, this led to the question: Might the signal-to-noise paradox over the North-Atlantic be driven by severe winter windstorms?

To assess this hypothesis, the signal-to-noise paradox is investigated in multiple seasonal forecast suites from the UK Met Office, ECMWF, DWD and CMCC. The NAO is used to investigate the changes in the paradox depending on the storminess of the season. The results show a significant increase of the NAO-signal-to-noise error in stormy seasons in GloSea5. Other individual models like the seasonal model of the DWD or CMCC do not show such a strong difference. A multi-model approach, on the other hand, shows the same tendency as GloSea5. Nevertheless, these model differences mean that more hindcasts are needed to conclusively demonstrate that the signal-to-noise error arises from Atlantic windstorms.

How to cite: Degenhardt, L., Leckebusch, G. C., Scaife, A. A., Smith, D., and Hardiman, S.: Is the NAO signal-to-noise paradox exacerbated by severe winter windstorms?, EGU General Assembly 2024, Vienna, Austria, 14–19 Apr 2024, EGU24-1757, https://doi.org/10.5194/egusphere-egu24-1757, 2024.

EGU24-1940 | ECS | Orals | CL4.3

Study of the Decadal Predictability of Mediterranean Sea Surface Temperature Based on Observations 

Xiaoqin Yan, Youmin Tang, and Dejian Yang

Sea surface temperature (SST) changes in the Mediterranean Sea have profound impacts on both the Mediterranean regions and remote areas. Previous studies show that the Mediterranean SST has significant decadal variability that is comparable with the Atlantic multidecadal variability (AMV). However, few studies have discussed the characteristics and sources of the decadal predictability of Mediterranean SST based on observations. Here for the first time we use observational datasets to reveal that the decadal predictability of Mediterranean SST is contributed by both external forcings and internal variability for both annual and seasonal means, except that the decadal predictability of the winter mean SST in the eastern Mediterranean is mostly contributed by only internal variability. Besides, the persistence of the Mediterranean SST is quite significant even in contrast with that in the subpolar North Atlantic, which is widely regarded to have the most predictable surface temperature on the decadal time scale. After the impacts of external forcings are removed, the average prediction time of internally generated Mediterranean SST variations is more than 10 years and closely associated with the multidecadal variability of the Mediterranean SST that is closely related to the accumulated North Atlantic Oscillation forcing.

How to cite: Yan, X., Tang, Y., and Yang, D.: Study of the Decadal Predictability of Mediterranean Sea Surface Temperature Based on Observations, EGU General Assembly 2024, Vienna, Austria, 14–19 Apr 2024, EGU24-1940, https://doi.org/10.5194/egusphere-egu24-1940, 2024.

EGU24-3190 | ECS | Orals | CL4.3

Seasonal forecasting of the European North-West shelf seas: limits of winter and summer sea surface temperature predictability 

Jamie Atkins, Jonathan Tinker, Jennifer Graham, Adam Scaife, and Paul Halloran

The European North-West shelf seas (NWS) support economic interests and provide environmental services to several adjacent populous countries. Skilful seasonal forecasts of the NWS would be useful to support decision making. Here, we quantify the skill of an operational large-ensemble ocean-atmosphere coupled dynamical forecasting system (GloSea), as well as a benchmark persistence forecasting system, for predictions of NWS sea surface temperature (SST) at 2-4 months lead time in winter and summer. We also identify sources of- and limits to NWS SST predictability with a view to what additional skill may be available in the future. We find that GloSea NWS SST skill is generally high in winter and low in summer. Persistence of anomalies in the initial conditions contributes substantially to predictability. GloSea outperforms simple persistence forecasts, by adding atmospheric variability information, but only to a modest extent. Where persistence is low – for example in seasonally stratified regions – both GloSea and persistence forecasts show lower skill. GloSea skill can be degradeded by model deficiencies in the relatively coarse global ocean component, which lacks a tidal regime and likely fails to properly fine-scale NWS physics. However, using “near perfect atmosphere” tests, we show potential for improving predictability of currently low performing regions if atmospheric circulation forecasts can be improved, underlining the importance of development of atmosphere-ocean coupled models for NWS seasonal forecasting applications.

How to cite: Atkins, J., Tinker, J., Graham, J., Scaife, A., and Halloran, P.: Seasonal forecasting of the European North-West shelf seas: limits of winter and summer sea surface temperature predictability, EGU General Assembly 2024, Vienna, Austria, 14–19 Apr 2024, EGU24-3190, https://doi.org/10.5194/egusphere-egu24-3190, 2024.

EGU24-4538 | ECS | Orals | CL4.3

Statistical downscaling of extremes in seasonal predictions - a case study on spring frosts for the viticultural sector 

Sebastiano Roncoroni, Panos Athanasiadis, and Silvio Gualdi

Spring frost events occurring after budburst of grapevines can damage new shoots, disrupt plant growth and cause large economic losses to the viticultural sector. Frost protection practices encompass a variety of vineyard management actions across timescales, from seasonal to decadal and beyond. The cost-effectiveness of such measures depends on the availability of accurate predictions of the relevant climate hazards at the appropriate timescales.

In this work, we present a statistical downscaling method which predicts variations in the frequency of occurrence of spring frost events in the important winemaking region of Catalunya at the seasonal timescale. The downscaling method exploits the seasonal predictability associated with the predictable components of the atmospheric variability over the Euro-Atlantic region, and produces local predictions of frost occurrence at a spatial scale relevant to vineyard management.

The downscaling method is designed to address the specific needs highlighted by a representative stakeholder in the local viticultural sector, and is expected to deliver an actionable prototype climate service. The statistical procedure is developed in perfect prognosis mode: the method is trained with large-scale reanalysis data against a high-resolution gridded observational reference, and validated against multi-model seasonal hindcast predictions.

Our work spotlights the potential benefits of transferring climate predictability across spatial scales for the design and provision of usable climate information, particularly regarding extremes.

How to cite: Roncoroni, S., Athanasiadis, P., and Gualdi, S.: Statistical downscaling of extremes in seasonal predictions - a case study on spring frosts for the viticultural sector, EGU General Assembly 2024, Vienna, Austria, 14–19 Apr 2024, EGU24-4538, https://doi.org/10.5194/egusphere-egu24-4538, 2024.

EGU24-4873 | ECS | Orals | CL4.3

Why does the Signal-to-Noise Paradox Exist in Seasonal Climate Predictability? 

Yashas Shivamurthy, Subodh Kumar Saha, Samir Pokhrel, Mahen Konwar, and Hemant Kumar Chaudhari

Skillful prediction of seasonal monsoons has been a challenging problem since the 1800s. However, significant progress has been made in Indian summer monsoon rainfall prediction in recent times, with skill scores reaching 0.6 and beyond, surpassing the estimated predictability limits. This phenomenon leads to what is known as the “Signal-to-noise Paradox.” To investigate this paradox, we utilized 52 ensemble member hindcast runs spanning 30 years.

Through the application of ANOVA and Mutual Information methods, we estimate the predictability limit globally. Notably, for the boreal summer rainfall season, the Indian subcontinent exhibited the paradox, among several other regions, while the Equatorial Pacific region, despite demonstrating high prediction skill, does not have the Signal-to-Noise paradox. We employed a novel approach to understand how sub-seasonal variability and their projection in association with predictors are linked to the paradoxical behavior of seasonal prediction skill.

We propose a new method to estimate predictability limits that is free from paradoxical phenomena and shows much higher seasonal predictability. This novel method provides valuable insights into the complex dynamics of monsoon prediction, thereby creating opportunities for expanded research and potential improvements in seasonal forecasting skill in the coming years.

How to cite: Shivamurthy, Y., Saha, S. K., Pokhrel, S., Konwar, M., and Chaudhari, H. K.: Why does the Signal-to-Noise Paradox Exist in Seasonal Climate Predictability?, EGU General Assembly 2024, Vienna, Austria, 14–19 Apr 2024, EGU24-4873, https://doi.org/10.5194/egusphere-egu24-4873, 2024.

EGU24-7134 | ECS | Orals | CL4.3

Towards the Predictability of Compound Dry and Hot Extremes through Complexity Science 

Ankit Agarwal and Ravikumar Guntu

Compound Dry and Hot Extremes (CDHE) have an adverse impact on socioeconomic factors during the Indian summer monsoon, and a future exacerbation is anticipated. The occurrence of CDHE is influenced by teleconnections, which play a crucial role in determining its likelihood on a seasonal scale. Despite the importance, there is a lack of studies unravelling the teleconnections of CDHE in India. Previous investigations specifically focused on teleconnections between precipitation, temperature, and climate indices. Hence, there is a need to unravel the teleconnections of CDHE. This study presents a framework combining event coincidence analysis (ECA) with complexity science. ECA evaluates the synchronization between CDHE and climate indices. Subsequently, complexity science is utilized to construct a driver-CDHE network to identify the critical drivers of CDHE. A logistic regression model is employed to evaluate the proposed drivers' effectiveness. The occurrence of CDHE exhibits distinct patterns from July to September when considering intra-seasonal variability. Our findings contribute to the identification of drivers associated with CDHE. The primary driver for Eastern, Western India and Central India is the indices in the Pacific Ocean and Atlantic Ocean, respectively, followed by the indices in the Indian Ocean. These identified drivers outperform the traditional Niño 3.4-based predictions. Overall, our results demonstrate the effectiveness of integrating ECA and complexity science to enhance the prediction of CDHE occurrences.

How to cite: Agarwal, A. and Guntu, R.: Towards the Predictability of Compound Dry and Hot Extremes through Complexity Science, EGU General Assembly 2024, Vienna, Austria, 14–19 Apr 2024, EGU24-7134, https://doi.org/10.5194/egusphere-egu24-7134, 2024.

EGU24-8028 | ECS | Orals | CL4.3

Constraining near to mid-term climate projections by combining observations with decadal predictions 

Rémy Bonnet, Julien Boé, and Emilia Sanchez

The implementation of adaptation policies requires seamless and relevant information on the evolution of the climate over the next decades. Decadal climate predictions are subject to drift because of intrinsic model errors and their skill may be limited after a few years or even months depending on the region. Non-initialized ensembles of climate projections have large uncertainties over the next decades, encompassing the full range of uncertainty attributed to internal climate variability. Providing the best climate information over the next decades is therefore challenging. Recent studies have started to address this challenge by constraining uninitialized projections of sea surface temperature using decadal predictions or using a storyline approach to constrain uninitialized projections of the Atlantic Meridional Overturning Circulation using observations. Here, using a hierarchical clustering method, we select a sub-ensemble of non-initialized climate simulations based on their similarity to observations. Then, we try to further refine this sub-ensemble of trajectories by selecting a subset based on its consistency with decadal predictions. This study presents a comparison of these different methods for constraining surface temperatures in the North-Atlantic / Europe region over the next decades, focusing on CMIP6 non-initialized simulations.

How to cite: Bonnet, R., Boé, J., and Sanchez, E.: Constraining near to mid-term climate projections by combining observations with decadal predictions, EGU General Assembly 2024, Vienna, Austria, 14–19 Apr 2024, EGU24-8028, https://doi.org/10.5194/egusphere-egu24-8028, 2024.

EGU24-9049 | Posters on site | CL4.3

Constraining internal variability in CMIP6 simulations to provide skillful near-term climate predictions 

Rashed Mahmood, Markus G. Donat, Pablo Ortega, and Francisco Doblas-Reyes

Adaptation to climate change requires accurate and reliable climate information on decadal and multi-decadal timescales. Such near-term climate information is obtained from future projection simulations, which are strongly affected by uncertainties related to, among other things, internal climate variability. Here we present an approach to constrain variability in future projection simulations of the coupled model intercomparison project phase 6 (CMIP6). The constraining approach involves phasing in the simulated with the observed climate state by evaluating the area-weighted spatial pattern correlations of sea surface temperature (SST) anomalies in individual members and observations. The constrained ensemble, based on the top ranked members in terms of pattern correlations with observed SST anomalies, shows significant added value over the unconstrained ensemble in predicting surface temperature 10 and also 20 years  after the synchronization with observations, thus extending the forecast range of the standard initialised predictions. We also find that while the prediction skill of the constrained ensemble for the first ten years is similar to the initialized decadal predictions, the added value against the unconstrained ensemble extends over more regions than the decadal predictions. In addition, the constraining approach can also be used to attribute predictability of regional and global climate variations to regional SST variability.

How to cite: Mahmood, R., G. Donat, M., Ortega, P., and Doblas-Reyes, F.: Constraining internal variability in CMIP6 simulations to provide skillful near-term climate predictions, EGU General Assembly 2024, Vienna, Austria, 14–19 Apr 2024, EGU24-9049, https://doi.org/10.5194/egusphere-egu24-9049, 2024.

There is an ongoing discussion about the contributions from forced and natural sources to the Atlantic Multi-decadal Variability (AMV).  As the AMV influences the general climate in large regions, this question has important consequences for climate predictions on decadal timescales and for a robust estimation of the influence of climate forcings.

Here, we investigate the Atlantic Multi-decadal Variability (AMV) in observations and in a large CMIP6 historical climate model ensemble. We compare three different definitions of the AMV aimed at extracting the variability intrinsic to the Atlantic region. These definitions are based on removing from the Atlantic temperature the non-linear trend, the part congruent to the global average, or the part congruent to the multi-model ensemble mean of the global average. The considered AMV definitions agree on the well-known low-frequency oscillatory variability in observations, but show larger differences for the models. In general, large differences between ensemble members are found.

We estimate the forced response in the AMV as the mean of the large multi-model ensemble.  The forced response resembles the observed low-frequency oscillatory variability for the detrended AMV definition, but this definition is also the most inefficient in removing the forced global mean signal. The forced response is very weak for the other definitions and only few of their individual ensemble members show oscillatory variability and, if they do, not with the observed phase.

The observed spatial temperature pattern related to the AMV is well captured for all three AMV definitions, but with some differences in the spatial extent. The observed instantaneous connection between NAO and AMV is well represented in the models for all AMV definitions. Only non-significant evidence of NAO leading the AMV on decadal timescales is found.

How to cite: Christiansen, B., Yang, S., and Drews, A.: The Atlantic Multi-decadal Variability in observations and in a large historical multi-model ensemble: Forced and internal variability, EGU General Assembly 2024, Vienna, Austria, 14–19 Apr 2024, EGU24-9100, https://doi.org/10.5194/egusphere-egu24-9100, 2024.

EGU24-9274 | ECS | Orals | CL4.3 | Highlight

The Role of the North Atlantic for Heat Wave Characteristics in Europe 

Sabine Bischof, Robin Pilch Kedzierski, Martje Hänsch, Sebastian Wahl, and Katja Matthes

The recent severe European summer heat waves of 2015 and 2018 co-occurred with cold subpolar North Atlantic (NA) sea surface temperatures (SSTs). However, a significant connection between this oceanic state and European heat waves was not yet established.

We investigate the effect of cold subpolar NA SSTs on European summer heat waves using two 100-year long AMIP-like model experiments: one that employs the observed global 2018 SST pattern as a boundary forcing and a counter experiment for which we removed the negative NA SST anomaly from the 2018 SST field, while preserving daily and small-scale SST variabilities. Comparing these experiments, we find that cold subpolar NA SSTs significantly increase heat wave duration and magnitude downstream over the European continent. Surface temperature and circulation anomalies are connected by the upper-tropospheric summer wave pattern of meridional winds over the North Atlantic European sector, which is enhanced with cold NA SSTs. Our results highlight the relevance of the subpolar NA region for European summer conditions, a region that is marked by large biases in current coupled climate model simulations.

How to cite: Bischof, S., Pilch Kedzierski, R., Hänsch, M., Wahl, S., and Matthes, K.: The Role of the North Atlantic for Heat Wave Characteristics in Europe, EGU General Assembly 2024, Vienna, Austria, 14–19 Apr 2024, EGU24-9274, https://doi.org/10.5194/egusphere-egu24-9274, 2024.

EGU24-9690 | ECS | Orals | CL4.3

Hybrid statistical-dynamical seasonal prediction of summer extreme temperatures over Europe 

Luca Famooss Paolini, Paolo Ruggieri, Salvatore Pascale, Erika Brattich, and Silvana Di Sabatino

Several studies show that the occurrence of summer extreme temperatures over Europe is increased since the middle of the twentieth century and is expected to further increase in the future due to global warming (Seneviratne et al., 2021). Thus, predicting heat extremes several months ahead is crucial given their impacts on socio-economic and environmental systems.

In this context, state-of-the-art dynamical seasonal prediction systems (SPSs) show low skills in predicting European heat extremes on seasonal timescale, especially in central and northern Europe (Prodhomme et al., 2022). However, recent studies have shown that our skills in predicting extratropical climate can be largely improved by subsampling the dynamical SPS ensemble with statistical post-processing techniques (Dobrynin et al., 2022).

This study assesses if the seasonal prediction skill of summer extreme temperatures in Europe in the state-of-the-art dynamical SPSs can be improved through subsampling. Specifically, we use a multi-model ensemble (MME) of SPSs contributing to the Copernicus Climate Change Service (C3S), analysing di hindcast period 1993—2016. The MME is subsampled by retaining a subset of members that predict the phase of the North Atlantic Oscillation (NAO) and the Eastern Atlantic (EA), typically linked to summer extreme temperatures in Europe. The subsampling relies on spring predictors of the weather regimes and thus allows us to retain only those ensemble members with a reasonable representation of summer heat extreme teleconnections.

Results show that by retaining only those ensemble members that accurately represent the NAO phase, it not only enhances the seasonal prediction skills for the summer European climate but also leads to improved predictions of summer extreme temperatures, especially in central and northern Europe. Differently, selecting only those ensemble members that accurately represent the EA phase does not improve either the predictions of summer European climate or the predictions of summer extreme temperatures. This can be explained by the fact that the C3S SPSs exhibits deficiencies in accurately representing the summer low-frequency atmospheric variability.

Bibliography

Dobrynin, M., and Coauthors, 2018: Improved Teleconnection-Based Dynamical Seasonal Predictions of Boreal Winter. Geophysical Research Letters, 45 (8), 3605—3614, https://doi.org/10.1002/2018GL07720

Prodhomme, C., S. Materia, C. Ardilouze, R. H. White, L. Batté, V. Guemas, G. Fragkoulidis, and J. Garcìa-Serrano, 2022: Seasonal prediction of European summer heatwaves. Climate Dynamics, 58 (7), 2149—2166, https://doi.org/10.1007/s00382-021-05828-3

Seneviratne, S., and Coauthors, 2021: Weather and Climate Extreme Events in a Changing Climate, chap. 11, 1513—1766. Cambridge University Press, https://doi.org/10.1017/9781009157896.013

How to cite: Famooss Paolini, L., Ruggieri, P., Pascale, S., Brattich, E., and Di Sabatino, S.: Hybrid statistical-dynamical seasonal prediction of summer extreme temperatures over Europe, EGU General Assembly 2024, Vienna, Austria, 14–19 Apr 2024, EGU24-9690, https://doi.org/10.5194/egusphere-egu24-9690, 2024.

EGU24-9905 | ECS | Orals | CL4.3

Optimization-based driver detection and prediction of seasonal heat extremes 

Ronan McAdam, César Peláez Rodríguez, Felicitas Hansen, Jorge Pérez Aracil, Antonello Squintu, Leone Cavicchia, Eduardo Zorita, Sancho Saldez-Sanz, and Enrico Scoccimarro

As a consequence of limited reliability of dynamical forecast systems, particularly over Europe, efforts in recent years have turned to exploiting the power of Machine Learning methods to extract information on drivers of extreme temperature from observations and reanalysis. Meanwhile, the diverse impacts of extreme heat have driven development of new indicators which take into account nightime temperatures and humidity. In the H2020 CLimate INTelligence (CLINT) project, a feature selection framework is being developed to find the combination of drivers which provides optimal seasonal forecast skill of European summer heatwave indicators. Here, we present the methodology, its application to a range of heatwave indicators and forecast skill compared to existing dynamical systems. First, a range of (reduced-dimensionality) drivers are defined, including k-means clusters of variables known to impact European summer (e.g. precipitation, sea ice content), and more complex indices like the NAO and weather regimes. Then, these drivers are used to train machine learning based prediction models, of varying complexity, to predict seasonal indicators of heatwave occurrence and intensity. A crucial and novel step in our framework is the use of the Coral Reef Optimisation algorithm, used to select the variables and their corresponding lag times and time periods which provide optimal forecast skill. To maximise training data, both ERA5 reanalysis and a 2000-year paleo-simulation are used; the representation of heatwaves and atmospheric conditions are validated with respect to ERA5. We present comparisons of forecast skill to the dynamical Copernicus Climate Change Service seasonal forecasts systems. The differences in timing, predictability and drivers of daytime and nighttime heatwaves across Europe are highlighted. Lastly, we discuss how the framework can easily be adapted to other extremes and timescales.


How to cite: McAdam, R., Peláez Rodríguez, C., Hansen, F., Pérez Aracil, J., Squintu, A., Cavicchia, L., Zorita, E., Saldez-Sanz, S., and Scoccimarro, E.: Optimization-based driver detection and prediction of seasonal heat extremes, EGU General Assembly 2024, Vienna, Austria, 14–19 Apr 2024, EGU24-9905, https://doi.org/10.5194/egusphere-egu24-9905, 2024.

EGU24-10539 | ECS | Orals | CL4.3

Exploring multiyear-to-decadal North Atlantic sea level predictability using machine learning and analog methods 

Qinxue Gu, Liwei Jia, Liping Zhang, Thomas Delworth, Xiaosong Yang, Fanrong Zeng, and Shouwei Li

Long-term sea level rise and multiyear-to-decadal sea level variations pose substantial risks of flooding and erosion in coastal communities. The North Atlantic Ocean and the U.S. East Coast are hotspots for sea level changes under current and future climates. Here, we employ a machine learning technique, a self-organizing map (SOM)-based framework, to systematically characterize the North Atlantic sea level variability, assess sea level predictability, and generate sea level predictions on multiyear-to-decadal timescales. Specifically, we classify 5000-year North Atlantic sea level anomalies from the Seamless System for Prediction and EArth System Research (SPEAR) model control simulations into generalized patterns using SOM. Preferred transitions among these patterns are further identified, revealing long-term predictability on multiyear-to-decadal timescales related to shifts in Atlantic meridional overturning circulation (AMOC) phases. By combining the SOM framework with “analog” techniques based on the simulations and observational/reanalysis data, we demonstrate prediction skill of large-scale sea level patterns comparable to that from initialized hindcasts. Moreover, additional source of short-term predictability is identified after the exclusion of low-frequency AMOC signals, which arises from the wind-driven North Atlantic tripole mode triggered by the North Atlantic Oscillation. This study highlights the potential of machine learning methods to assess sources of predictability and to enable efficient, long-term climate prediction.

How to cite: Gu, Q., Jia, L., Zhang, L., Delworth, T., Yang, X., Zeng, F., and Li, S.: Exploring multiyear-to-decadal North Atlantic sea level predictability using machine learning and analog methods, EGU General Assembly 2024, Vienna, Austria, 14–19 Apr 2024, EGU24-10539, https://doi.org/10.5194/egusphere-egu24-10539, 2024.

The inter-annual to multi-decadal variability of recurrent, synoptic-scale atmospheric circulation patterns in the Northern Hemisphere extratropics, as represented by the Jenkinson-Collison classification scheme, is explored in reanalysis data spanning the entire 20th century, and in global climate model (GCM) data from the historical, AMIP and DCPP experiments conducted within the framework of CMIP6. The aim of these efforts is to assess the effect of coupled vs. uncoupled and initialised vs. non-initialized GCM simulations in reproducing the observed low-frequency variability of the aforementioned circulation patterns.

Results reveal that the observed annual counts of typical recurrent weather patterns, such as cyclonic or anticyclonic conditions and also situations of pronounced advection, exhibit significant oscillations on multiple time-scales ranging between several years and several decades. The period of these oscillations, however, is subject to large regional variations. This is in line with earlier studies suggesting that the extratropical atmospheric circulation’s low frequency variability is essentially unforced, except in the Pacific-North American sector where the forced variability is enhanced due to ENSO teleconnections. Neither the periods obtained from historical nor those obtained from AMIP experiments align with observations. Likewise, not even the periods obtained from different runs of the same GCM and experiment correspond to each other. Thus, in an non-initialized model setup, ocean-atmosphere coupling or the lack thereof essentially leads to the same results. Whether initialization and/or augmenting the ensemble size can improve these findings, will also be discussed.

Acknowledgement: This work is part of project Impetus4Change, which has received funding from the European Union’s Horizon Europe research and innovation programme under grant agreement No 101081555.

How to cite: Brands, S., Cimadevilla, E., and Fernández, J.: Low-frequency variability of synoptic-scale atmospheric circulation patterns in the Northern Hemisphere extratropics and associated hindcast skill of decadal forecasting systems, EGU General Assembly 2024, Vienna, Austria, 14–19 Apr 2024, EGU24-10551, https://doi.org/10.5194/egusphere-egu24-10551, 2024.

EGU24-10574 | Orals | CL4.3 | Highlight

Will 2024 be the first year above 1.5 C? 

Nick Dunstone, Doug Smith, Adam Scaife, Leon Hermanson, Andrew Colman, and Chris Folland

Global mean surface temperature is the key metric by which our warming climate is monitored and for which international climate policy is set. At the end of each year the Met Office makes a global mean temperature forecast for the coming year. Following on from the new record 2023, we predict a high probability of another record year in 2024 and a 35% chance of exceeding 1.5 C above pre-industrial. Whilst a one-year temporary exceedance of 1.5 C would not constitute a breech of the Paris Agreement target, our forecast highlights how close we are now to breeching this target. We show that our 2024 forecast can be largely explained by the combination of the continuing warming trend of +0.2 C/decade and the lagged warming affect of a strong tropical Pacific El Nino event. We further highlight 2023 was significantly warmer than forecast and that much of this warming signal came from the southern hemisphere and requires further understanding.

How to cite: Dunstone, N., Smith, D., Scaife, A., Hermanson, L., Colman, A., and Folland, C.: Will 2024 be the first year above 1.5 C?, EGU General Assembly 2024, Vienna, Austria, 14–19 Apr 2024, EGU24-10574, https://doi.org/10.5194/egusphere-egu24-10574, 2024.

EGU24-11485 | ECS | Orals | CL4.3

Summer drought predictability in the Mediterranean region in seasonal forecasts 

Giada Cerato, Katinka Bellomo, and Jost von Hardenberg

The Mediterranean region has been identified as an important climate change hotspot, over the 21st century both air temperature and its extremes are projected to rise at a rate surpassing that of the global average and a significant decrease of average summer precipitation is projected, particularly for the western Mediterranean. On average, Mediterranean droughts have become more frequent and intense in recent years and are expected to become more widespread in many regions. These prolonged dry spells pose a substantial threat to agriculture and impact several socio-economic sectors. In this context, long-range weather forecasting has emerged as a promising tool for seasonal drought risk assessment. However, the interpretation of the forecasting products is not always straightforward due to their inherent probabilistic nature. Therefore, a rigorous evaluation process is needed to determine the extent to which these forecasts provide a fruitful advantage over much simpler forecasting systems, such as those based on climatology. 

In this study, we use the latest version of ECMWF’s seasonal prediction system (SEAS5) to understand its skill in predicting summer droughts. The Standardized Precipitation Evapotranspiration Index (SPEI) aggregated over different lead times is employed to mark below-normal dryness conditions in August. We use a comprehensive set of evaluation metrics to gain insight into the accuracy, systematic biases, association, discrimination and sharpness of the forecast system. Our findings reveal that up to 3 months lead time, seasonal forecasts show stronger association and discrimination skills than the climatological forecast, especially in the Southern Mediterranean, although the prediction quality in terms of accuracy and sharpness is limited. On the other hand, extending the forecast range up to 6 months lead time dramatically reduces its predictability skill, with the system mostly underperforming elementary climatological predictions. 

This approach is then extended to examine the full ensemble of seasonal forecasting systems provided by the Copernicus Climate Change Service (C3S) to test their skill in predicting droughts. Our findings can help an informed use of seasonal forecasts of droughts and the development of related climate services.

How to cite: Cerato, G., Bellomo, K., and von Hardenberg, J.: Summer drought predictability in the Mediterranean region in seasonal forecasts, EGU General Assembly 2024, Vienna, Austria, 14–19 Apr 2024, EGU24-11485, https://doi.org/10.5194/egusphere-egu24-11485, 2024.

EGU24-11930 | ECS | Posters on site | CL4.3

A global empirical system for probabilistic seasonal climate prediction based on generative AI and CMIP6 models  

Lluís Palma, Alejandro Peraza, Amanda Duarte, David Civantos, Stefano Materia, Arijit Nandi, Jesús Peña-Izquierdo, Mihnea Tufis, Gonzalo Vilella, Laia Romero, Albert Soret, and Markus Donat

Reliable probabilistic information at the seasonal time scale is essential across various societal sectors, such as agriculture, energy, or water management. Current applications of seasonal predictions rely on General Circulation Models (GCMs) that represent dynamical processes in the atmosphere, land surface, and ocean while capturing their linear and nonlinear interactions. However, GCMs come with an inherent high computational cost. In an operational setup, they are typically run once a month and at a lower temporal and spatial resolution than the ones needed for regional applications. Moreover, GCMs suffer from significant drifts and biases and can miss relevant teleconnections, resulting in low skill for particular regions or seasons. 

In this context, the use of generative AI methods that can model complex nonlinear relationships can be a viable alternative for producing probabilistic predictions with low computational demand. Such models have already demonstrated their effectiveness in different domains, i.e. computer vision, natural language processing, and weather prediction. However, although requiring less computational power, these techniques still rely on big datasets in order to be efficiently trained. Under this scenario, and with sufficiently high-quality global observational datasets spanning at most 70 years, the research trend has evolved into training these models using climate model output. 

In this work, we build upon the work presented by Pan et al., 2022, which introduced a conditional Variational Autoencoder (cVAE) to predict global temperature and precipitation fields for the October to March season starting from July initial conditions. We adopt several pre-processing changes to account for different biases and trends across the CMIP6 models. Additionally, we explore different architecture modifications to improve the model's performance and stability. We study the benefits of our model in predicting three-month anomalies on top of the climate change trend. Finally, we compare our results with a state-of-the-art GCM (SEAS5) and a simple empirical system based on the linear regression of classical seasonal indices based on Eden et al., 2015.


Pan, Baoxiang, Gemma J. Anderson, André Goncalves, Donald D. Lucas, Céline J.W. Bonfils, and Jiwoo Lee. 'Improving Seasonal Forecast Using Probabilistic Deep Learning'. Journal of Advances in Modeling Earth Systems 14, no. 3 (1 March 2022). https://doi.org/10.1029/2021MS002766.


Eden, J. M., G. J. van Oldenborgh, E. Hawkins, and E. B. Suckling. 'A Global Empirical System for Probabilistic Seasonal Climate Prediction'. Geoscientific Model Development 8, no. 12 (11 December 2015): 3947–73. https://doi.org/10.5194/gmd-8-3947-2015.

How to cite: Palma, L., Peraza, A., Duarte, A., Civantos, D., Materia, S., Nandi, A., Peña-Izquierdo, J., Tufis, M., Vilella, G., Romero, L., Soret, A., and Donat, M.: A global empirical system for probabilistic seasonal climate prediction based on generative AI and CMIP6 models , EGU General Assembly 2024, Vienna, Austria, 14–19 Apr 2024, EGU24-11930, https://doi.org/10.5194/egusphere-egu24-11930, 2024.

EGU24-12969 | ECS | Orals | CL4.3

How unusual is the recent decade-long pause in Arctic summer sea ice retreat? 

Patricia DeRepentigny, François Massonnet, Roberto Bilbao, and Stefano Materia

The Earth has warmed significantly over the past 40 years, and the fastest rate of warming has occurred in and around the Arctic. The warming of northern high latitudes at a rate of almost four times the global average (Rantanen et al., 2022), known as Arctic amplification, is associated with sea ice loss, glacier retreat, permafrost degradation, and expansion of the melting season. Since the mid-2000s, summer sea ice has exhibited a rapid decline, reaching record minima in September sea ice area in 2007 and 2012. However, after the early 2010s, the downward trend of minimum sea ice area appears to decelerate (Swart et al., 2015; Baxter et al., 2019). This apparent slowdown and the preceding acceleration in the rate of sea ice loss are puzzling in light of the steadily increasing rate of greenhouse gas emissions of about 4.5 ppm yr−1 over the past decade (Friedlingstein et al., 2023) that provides a constant climate forcing. Recent studies suggest that low-frequency internal climate variability may have been as important as anthropogenic influences on observed Arctic sea ice decline over the past four decades (Dörr et al., 2023; Karami et al., 2023). Here, we investigate how unusual this decade-long pause in Arctic summer sea ice decline is within the context of internal climate variability. To do so, we first assess how rare this is deceleration of Arctic sea ice loss is by comparing it to trends in CMIP6 historical simulations. We also use simulations from the Decadal Climate Prediction Project (DCPP) contribution to CMIP6 to determine if initializing decadal prediction systems from estimates of the observed climate state substantially improves their performance in predicting the slowdown in Arctic sea ice loss over the past decade. As the DCPP does not specify the data or the methods to be used to initialize forecasts or how to generate ensembles of initial conditions, we also assess how different formulations affect the skill of the forecasts by analyzing differences between models. This work provides an opportunity to attribute this pause in Arctic sea ice retreat to interannual internal variability or radiative external forcings, something that observation analysis alone cannot achieve.

How to cite: DeRepentigny, P., Massonnet, F., Bilbao, R., and Materia, S.: How unusual is the recent decade-long pause in Arctic summer sea ice retreat?, EGU General Assembly 2024, Vienna, Austria, 14–19 Apr 2024, EGU24-12969, https://doi.org/10.5194/egusphere-egu24-12969, 2024.

EGU24-14341 | Posters on site | CL4.3

Compound Heat and Dry Events Influenced by the Pacific–Japan Pattern over Taiwan in Summer 

Szu-Ying Lin, Wan-Ling Tseng, Yi-Chi Wang, and MinHui Lo

Compound dry and hot events, characterized by elevated temperatures and reduced precipitation, pose interconnected challenges to human social economics, necessitating comprehensive strategies for mitigation and adaptation. This study focuses on the Pacific-Japan (PJ) pattern, a significant climate variability influencing summer climates in East Asia. While previous research has explored its impact on Japan and Korea, our investigation delves into its effects on Taiwan, a mountainous subtropical island with a population of approximately 24 million. Utilizing long-term temperature and rainfall data, along with reanalysis dynamic downscaling datasets, we examine the interannual impacts of the PJ pattern on summer temperature and compound heat and dry events. Our findings reveal a significant temperature increase during the positive phase of the PJ pattern, characterized by anticyclonic anomalous circulation over Taiwan. Additionally, both the Standardized Precipitation Index and soil water exhibit a decline during this phase, reflecting meteorological and hydrological drought conditions. A robust negative correlation (-0.7) between drought indices and temperature emphasizes the compound effect of heat and dry events during the PJ positive phase. This study enhances the understanding of the PJ pattern as a climate driver, describing its role in hot and dry summers over Taiwan. The insights gained, when integrated into seasonal prediction and early warning systems, can aid vulnerable sectors in preparing for potential heat and dry stress hazards.

How to cite: Lin, S.-Y., Tseng, W.-L., Wang, Y.-C., and Lo, M.: Compound Heat and Dry Events Influenced by the Pacific–Japan Pattern over Taiwan in Summer, EGU General Assembly 2024, Vienna, Austria, 14–19 Apr 2024, EGU24-14341, https://doi.org/10.5194/egusphere-egu24-14341, 2024.

EGU24-14379 | Posters on site | CL4.3

Linkage between Temperature and Heatwaves in Summer Taiwan to the Pacific Meridional Mode 

Chieh-Ting Tsai, Wan-Ling Tseng, and Yi-Chi Wang

Over the past century, Taiwan has gradually recognized the hazards posed by extreme heat events (EHT), prompting the development of mid-term adaptation strategies to address challenges in the coming decades. However, our understanding of decadal-scale temperature variations remains insufficient, requiring further research into influencing factors. Our study reveals the crucial role of the Pacific Meridional Mode (PMM) in modulating decadal-scale variations in summer temperatures in Taiwan. During the positive phase of PMM, warm sea surface temperature anomalies trigger an eastward-moving wave train extending into East Asia. This leads to the development of high-pressure circulations near Southeast Asia and Taiwan, enhancing the temperature increase. This mechanism has been reproduced in experiments using the Taiwan Earth System Model. Moreover, our study utilizes the calendar day 90th percentile of maximum temperature (CTX) as the threshold for extreme high-temperature events (EHT), while also employing the heatwaves magnitude scale (HWMS) as the criterion for defining heatwaves. During the positive phase of PMM, the frequency and duration of EHT increase, with variations observed across different regions. The overall intensity of heatwave events also strengthens, primarily due to extended durations. Notably, in a single city, this results in exposure of up to 800,000 person-days to EHT, presenting a tenfold increase compared to the annual effect observed in the long-term warming trend. These findings on the decadal-scale relationship between summer temperatures in Taiwan and PMM contribute to a deeper understanding of EHT and heatwaves events impacts, providing more nuanced insights for future regional strategies in mitigating heatwave disasters.

How to cite: Tsai, C.-T., Tseng, W.-L., and Wang, Y.-C.: Linkage between Temperature and Heatwaves in Summer Taiwan to the Pacific Meridional Mode, EGU General Assembly 2024, Vienna, Austria, 14–19 Apr 2024, EGU24-14379, https://doi.org/10.5194/egusphere-egu24-14379, 2024.

EGU24-14688 | ECS | Orals | CL4.3

Exploring ML-based decadal predictions of the German Bight storm surge climate 

Daniel Krieger, Sebastian Brune, Johanna Baehr, and Ralf Weisse

Storm surges and elevated water levels regularly challenge coastal protection and inland water management along the low-lying coastline of the German Bight. Skillful seasonal-to-decadal (S2D) predictions of the local storm surge climate would be beneficial to stakeholders and decision makers in the region. While storm activity has recently been shown to be skillfully predictable on a decadal timescale with a global earth system model, surge modelling usually requires very fine spatial and temporal resolutions that are not yet present in current earth system models. We therefore propose an alternative approach to generating S2D predictions of the storm surge climate by training a neural network on observed water levels and large-scale atmospheric patterns, and apply the neural network to the available model output of a S2D prediction system. We show that the neural-network-based translation from large-scale atmospheric fields to local water levels at the coast works sufficiently well, and that several windows of predictability for the German Bight surge climate emerge on the S2D scale.

How to cite: Krieger, D., Brune, S., Baehr, J., and Weisse, R.: Exploring ML-based decadal predictions of the German Bight storm surge climate, EGU General Assembly 2024, Vienna, Austria, 14–19 Apr 2024, EGU24-14688, https://doi.org/10.5194/egusphere-egu24-14688, 2024.

Atlantic meridional overturning circulation (AMOC) is one of the mechanisms for climate predictability and one of the properties that decadal climate predictions are attempting to predict. The starting point for AMOC decadal predictions is sensitive to the underlying data assimilation and/or initialization procedure. This means that different choices during the data assimilation procedure (e.g., assimilation method, assimilation window, data sources, resolution, nudging terms and strength, full field vs anomaly initialization/assimilation, etc) can result in a different mean and even variability of reconstructed ocean circulation. How coherent the AMOC initial states should be among the CMIP-like decadal prediction experiments? How good in general should the initial AMOC be for decadal predictions? And do initialization issues of the ocean circulation influence the prediction skill of other variables that are of interest for application studies? These are the questions that we were attempting to address in our study, where we analyzed twelve decadal prediction systems from the World Meteorological Organization Lead Centre for Annual-to-Decadal Climate Prediction project. We identify that the AMOC initialization influences the quality of predictions of the subpolar gyre (SPG). When predictions show a large initial error in their AMOC, they usually have low skill for predicting the internal variability of the SPG five years after the initialization.

How to cite: Polkova, I. and the Co-Authors: Initialization shock in the ocean circulation reduces skill in decadal predictions of the North Atlantic subpolar gyre, EGU General Assembly 2024, Vienna, Austria, 14–19 Apr 2024, EGU24-15358, https://doi.org/10.5194/egusphere-egu24-15358, 2024.

EGU24-15476 | Posters on site | CL4.3

Statistics of sudden stratospheric warmings using a large model ensemble 

Sarah Ineson, Nick Dunstone, Adam Scaife, Martin Andrews, Julia Lockwood, and Bo Pang

Using a large ensemble of initialised retrospective forecasts (hindcasts) from a seasonal prediction system, we explore various statistics relating to sudden stratospheric warmings (SSWs). Observations show that SSWs occur at a similar frequency during both El Niño and La Niña northern hemisphere winters. This is contrary to expectation, as the stronger stratospheric polar vortex associated with La Niña years might be expected to result in fewer of these extreme breakdowns. We show that this similar frequency may have occurred by chance due to the limited sample of years in the observational record. We also show that in these hindcasts, winters with two SSWs, a rare event in the observational record, on average have an increased surface impact. Multiple SSW events occur at a lower rate than expected if events were independent but somewhat surprisingly, our analysis also indicates a risk, albeit small, of winters with three or more SSWs, as yet an unseen event.

How to cite: Ineson, S., Dunstone, N., Scaife, A., Andrews, M., Lockwood, J., and Pang, B.: Statistics of sudden stratospheric warmings using a large model ensemble, EGU General Assembly 2024, Vienna, Austria, 14–19 Apr 2024, EGU24-15476, https://doi.org/10.5194/egusphere-egu24-15476, 2024.

EGU24-15709 | ECS | Orals | CL4.3

Predicting Atlantic and Benguela Niño events with deep learning  

Marie-Lou Bachelery, Julien Brajard, Massimiliano Patacchiola, and Noel Keenlyside

Extreme Atlantic and Benguela Niño events continue to significantly impact the tropical Atlantic region, with far-reaching consequences for African climate and ecosystems. Despite attempts to forecast these events using traditional seasonal forecasting systems, success remains low, reinforcing the growing idea that these events are unpredictable. To overcome the limitations of dynamical prediction systems, we introduce a deep learning-based statistical prediction model for Atlantic and Benguela Niño events. Our convolutional neural network (CNN) model, trained on 90 years of reanalysis data incorporating surface and 100m-averaged temperature variables, demonstrates the capability to forecast the Atlantic and Benguela Niño indices with lead times of up to 3-4 months. Notably, the CNN model excels in forecasting peak-season events with remarkable accuracy extending up to 5 months ahead. Gradient sensitivity analysis reveals the ability of the CNN model to exploit known physical precursors, particularly the connection to equatorial dynamics and the South Atlantic Anticyclone, for accurate predictions of Benguela Niño events. This study challenges the perception of the Tropical Atlantic as inherently unpredictable, underscoring the potential of deep learning to enhance our understanding and forecasting of critical climate events. 

How to cite: Bachelery, M.-L., Brajard, J., Patacchiola, M., and Keenlyside, N.: Predicting Atlantic and Benguela Niño events with deep learning , EGU General Assembly 2024, Vienna, Austria, 14–19 Apr 2024, EGU24-15709, https://doi.org/10.5194/egusphere-egu24-15709, 2024.

EGU24-15974 | ECS | Posters virtual | CL4.3

Recalibrating DWD’s operational climate predictions: towards a user-oriented seamless climate service 

Alexander Pasternack, Birgit Mannig, Andreas Paxian, Amelie Hoff, Klaus Pankatz, Philip Lorenz, and Barbara Früh

The German Meteorological Service's (Deutscher Wetterdienst DWD) climate predictions website  (www.dwd.de/climatepredictions) offers a centralized platform for accessing post-processed climate predictions, including subseasonal forecasts from ECMWF's IFS and seasonal and decadal predictions from the German climate prediction system. The website design was developed in collaboration with various sectors to ensure uniformity across all time frames, and users can view maps, tables, and time series of ensemble mean and probabilistic predictions in combination with their skill. The available data covers weekly, 3-month, 1-year, and 5-year temperature means, precipitation sums and soil moisture for the world, Europe, Germany, and particular German regions. To achieve high spatial resolution, the DWD used the statistical downscaling method EPISODES. Moreover, within the BMBF project KIMoDIs (AI-based monitoring, data management and information system for coupled forecasting and early warning of low groundwater levels and salinisation) the DWD provides climate prediction data of further hydrological variables (e.g. relative humidity) with corresponding prediction skill on a regional scale.

However, all predictions on these time scales can suffer from inherent systematic errors, which can impact their usefulness. To address these issues, the recalibration method DeFoReSt was applied to decadal predictions, using a combination of 3rd order polynomials in lead and start time, along with a boosting model selection approach. This approach addresses lead-time dependent systematic errors, such as drift, as well as inaccuracies in representing long-term changes and variability.

This study highlights the improved accuracy of the recalibration approach on decadal predictions due to an increased polynomial order compared to the original approach, and its different impact on global and regional scales. It also explores the feasibility of transferring this approach to predictions with shorter time horizons of the provided variables.

How to cite: Pasternack, A., Mannig, B., Paxian, A., Hoff, A., Pankatz, K., Lorenz, P., and Früh, B.: Recalibrating DWD’s operational climate predictions: towards a user-oriented seamless climate service, EGU General Assembly 2024, Vienna, Austria, 14–19 Apr 2024, EGU24-15974, https://doi.org/10.5194/egusphere-egu24-15974, 2024.

EGU24-16366 | ECS | Orals | CL4.3

Decadal predictions outperform projections in forecasting winter precipitation over the Mediterranean region 

Dario Nicolì, Silvio Gualdi, and Panos Athanasiadis

The Mediterranean region is highly sensitive to climate change, having experienced an intense warming and drying trend in recent decades, primarily due to the increased concentrations of anthropogenic greenhouse gases. In the context of decision-making processes, there is a growing interest in understanding the near-term climate evolution of this region.

In this study, we explore the climatic fluctuations of the Mediterranean region in the near-term range (up to 10 years ahead) using two different products: projections and decadal predictions. The former are century-scale climate change simulations initialized from arbitrary model states to which were applied anthropogenic and natural forcings. A major limitation of climate projections is their limited information regarding the current state of the Earth’s climate system. Decadal climate predictions, obtained by constraining the initial conditions of an ensemble of model simulations through a best estimate of the observed climate state, provide a better understanding of the next-decade climate and thus represent an invaluable tool in assisting climate adaptation.

Using retrospective forecasts from eight decadal prediction systems contributing to the CMIP6 Decadal Climate Prediction Project (CMIP6 DCPP) and the corresponding ensemble of non-initialized projections, we compare the capabilities of the state-of-the-art climate models in predicting future climate changes of the Mediterranean region for some key quantities so as to assess the added value of initialization. 

Beyond the contribution of external forcings, the role of internal variability is also investigated since part of the detected predictability arises from internal climate variability patterns affecting the Mediterranean. The observed North Atlantic Oscillation, the dominant climate variability pattern in the Euro-Atlantic domain, as well as its  impact on wintertime precipitation over Europe are well reproduced by decadal predictions, especially over the Mediterranean, outperforming projections. We also apply a sub-sampling method to enhance the respective signal-to-noise ratio and consequently improve precipitation skill over the Mediterranean.

How to cite: Nicolì, D., Gualdi, S., and Athanasiadis, P.: Decadal predictions outperform projections in forecasting winter precipitation over the Mediterranean region, EGU General Assembly 2024, Vienna, Austria, 14–19 Apr 2024, EGU24-16366, https://doi.org/10.5194/egusphere-egu24-16366, 2024.

EGU24-16985 | Posters on site | CL4.3

Investigating signals in summer seasonal forecasts over the North Atlantic/European region 

Julia Lockwood, Nick Dunstone, Kristina Fröhlich, Ramón Fuentes Franco, Anna Maidens, Adam Scaife, Doug Smith, and Hazel Thornton

The current generation of seasonal forecast models struggle to skilfully predict dynamical circulation over the North Atlantic and European region in boreal summer.  Using two different state-of-the-art seasonal prediction systems, we show that tropical rainfall anomalies drive a circulation signal in the North Atlantic/Europe via the propagation of Rossby waves.  The wave, however, is shifted eastwards compared to observations, so the signal does not contribute positively to model skill.  Reasons for the eastward shift of the Rossby wave are investigated, as well as other drivers of the signal in this region.  Despite the errors in the waves, the fact that seasonal forecast models do predict dynamical signals over the North Atlantic/Europe signifies seasonal predictability over this region beyond the climate change trend, and understaning the cause of the errors could lead to skilful predictions.

How to cite: Lockwood, J., Dunstone, N., Fröhlich, K., Fuentes Franco, R., Maidens, A., Scaife, A., Smith, D., and Thornton, H.: Investigating signals in summer seasonal forecasts over the North Atlantic/European region, EGU General Assembly 2024, Vienna, Austria, 14–19 Apr 2024, EGU24-16985, https://doi.org/10.5194/egusphere-egu24-16985, 2024.

EGU24-17418 | Posters on site | CL4.3

Strengthening seasonal forecasting in the Middle East & North Africa (MENA) through the WISER Programme. 

Stefan Lines, Nicholas Savage, Rebecca Parfitt, Andrew Colman, Alex Chamberlain-Clay, Luke Norris, Heidi Howard, and Helen Ticehurst

In this presentation, we introduce the WISER MENA projects SeaFOAM (Seasonal Forecasting Across MENA) and SeaSCAPE (Seasonal Co-Production and Application in MENA). These projects explore both the improvement to the regional-level seasonal forecast in the MENA region, as well as how to tailor the information in ways useful to a range of climate information stakeholders. SeaFOAM works alongside Maroc Meteo, Morocco's National Meteorological and Hydrological Service (NMHS) and the Long Range Forecasting node of the Northern Africa WMO Regional Climate Centre (RCC), to develop a framework for objective seasonal forecasting. This approach will blend techniques such as bias correction via local linear regression and canonical correlation analysis (CCA), with skill-assessed sub-selected models, to improve forecasting accuracy. Multiple drivers of rainfall variability, including the North Atlantic Oscillation (NAO) and Mediterranean Oscillation (MO), are investigated for their calibration potential. SeaSCAPE works with the WMO and various partners across MENA to understand the use of seasonal information in multiple sectors, exploring existing gaps and needs. Through stakeholder engagement workshops, training and bespoke support for the Arab Climate Outlook Forum (ArabCOF), SeaSCAPE operates collaboratively to tailor regional and national-level climate information to improve accessibility and usability of climate information on seasonal timescales.

How to cite: Lines, S., Savage, N., Parfitt, R., Colman, A., Chamberlain-Clay, A., Norris, L., Howard, H., and Ticehurst, H.: Strengthening seasonal forecasting in the Middle East & North Africa (MENA) through the WISER Programme., EGU General Assembly 2024, Vienna, Austria, 14–19 Apr 2024, EGU24-17418, https://doi.org/10.5194/egusphere-egu24-17418, 2024.

EGU24-17585 | Orals | CL4.3

Skill of wind resource forecasts on the decadal time scale 

Kai Lochbihler, Ana Lopez, and Gil Lizcano

Accurate forecasts of the natural resources of renewable energy production have become not only a valuable but a crucial tool for managing the associated risks of specific events, such as wind droughts. Wind energy, alongside with solar power, now provide a substantial part to the renewable energy share of the global energy production and growth in this sector will most likely further increase. The naturally given fluctuations of wind resources, however, pose a challenge for maintaining a stable energy supply, which, at the end of the chain, can have an impact on the energy market prices.
Operational short-term forecasting products for the wind energy sector (multiple days) are already commonly available and seasonal to sub seasonal forecasting solutions (multiple months) can provide valuable skill and are gaining in popularity. On the other side of the spectrum, typically on a time scale of multiple decades, we find risk assessment based on climate change projections. In between the long and short term time scales, however, there is a gap that still needs to be filled to achieve seamless prediction of risks that are relevant for the energy sector: decadal predictions.

Here, we present the results of an evaluation study of a multi-model decadal prediction ensemble (DCPP) for a selection of wind development regions in Europe. The evaluation is based on multiple decades long hindcasts and carried out with a focus on the skill of predicting specific event types of wind resource availability in a probabilistic context, alongside with basic deterministic skill measures. We further investigate specific event constellations and their large-scale drivers that, in combination, can provide windows of opportunity with enhanced predictive skill. We conclude with a discussion on how this hybrid approach can be used to potentially increase not only forecast skill but also the trust of the end user.

How to cite: Lochbihler, K., Lopez, A., and Lizcano, G.: Skill of wind resource forecasts on the decadal time scale, EGU General Assembly 2024, Vienna, Austria, 14–19 Apr 2024, EGU24-17585, https://doi.org/10.5194/egusphere-egu24-17585, 2024.

EGU24-19229 | ECS | Orals | CL4.3

Comparing the seasonal predictability of Tropical Pacific variability in EC-Earth3 at two different horizontal resolutions 

Aude Carreric, Pablo Ortega, Vladimir Lapin, and Francisco Doblas-Reyes

Seasonal prediction is a field of research attracting growing interest beyond the scientific community due to its strong potential to guide decision-making in many sectors (e.g. agriculture and food security, health, energy production, water management, disaster risk reduction) in the face of the pressing dangers of climate change.

Among the various techniques being considered to improve the predictive skill of seasonal prediction systems, increasing the horizontal resolution of GCMs is a promising avenue. There are several indications that higher resolution versions of the current generation of climate models might improve key air-sea teleconnections, decreasing common biases of global models and improving the skill to predict certain regions at seasonal scales, e.g. in tropical sea surface temperature.

In this study, we analyze the differences in the predictive skill of two different seasonal prediction systems, based on the same climate model EC-Earth3 and initialized in the same way but using two different horizontal resolutions. The standard (SR) and high resolution (HR) configurations are based on an atmospheric component, IFS, of ~100 km and ~40 km of resolution respectively and on an ocean component, NEMO3.6, of ~100 km and ~25 km respectively. We focus in particular on the Tropical Pacific region where statistically significant improvements are found in HR with respect to SR for predicting ENSO and its associated climate teleconnections. We explore some processes that can explain these differences, such as the simulation of the tropical ocean mean state and atmospheric teleconnections between the Atlantic and Pacific tropical oceans. 

A weaker mean-state bias in the HR configuration, with less westward extension of ENSO-related SST anomalies, leads to better skill in ENSO regions, which can also be linked to better localization of the atmospheric teleconnection with the equatorial Atlantic Ocean. It remains to be assessed if similar improvements are consistently identified for HR versions in other forecast systems, which would prompt their routine use in seasonal climate prediction.

How to cite: Carreric, A., Ortega, P., Lapin, V., and Doblas-Reyes, F.: Comparing the seasonal predictability of Tropical Pacific variability in EC-Earth3 at two different horizontal resolutions, EGU General Assembly 2024, Vienna, Austria, 14–19 Apr 2024, EGU24-19229, https://doi.org/10.5194/egusphere-egu24-19229, 2024.

EGU24-19251 | Orals | CL4.3 | Highlight

The opportunities and challenges of near-term climate prediction 

Hazel Thornton

Accurate forecasts of the climate of the coming season and years are highly desired by many sectors of society. The skill of near-term climate prediction in winter in the North Atlantic and European region has improved over the last decade associated with larger ensembles, improving models and boosting of the prediction signal using intelligent post processing. International collaboration has improved the availability of forecasts and promoted the uptake of forecasts by different sectors. However, significant challenges remain, including summer prediction, understanding the risk of extremes within a season, multi-seasonal extremes and how best to post process the forecasts to aid decision making. This talk will summarise recent near-term climate prediction research activities at the UK Met Office and will detail our experience of providing such forecasts to the energy and water sectors.  

How to cite: Thornton, H.: The opportunities and challenges of near-term climate prediction, EGU General Assembly 2024, Vienna, Austria, 14–19 Apr 2024, EGU24-19251, https://doi.org/10.5194/egusphere-egu24-19251, 2024.

This study focuses on applying machine learning techniques to bias-correct the seasonal temperature forecasts provided by the Copernicus Climate Change Service (C3S) models. Specifically, we employ bias correction on forecasts from five major models: UK Meteorological Office (UKMO), Euro-Mediterranean Center on Climate Change (CMCC), Deutscher Wetterdienst (DWD), Environment and Climate Change Canada (ECCC), and Meteo-France. Our primary objective is to assess the performance of our bias correction model in comparison to the original forecast datasets. We utilise temperature-based indices recommended by the Expert Team on Climate Change Detection and Indices (ETCCDI) to evaluate the effectiveness of the bias-corrected seasonal forecasts. These indices served as valuable metrics to gauge the predictive capability of the models, especially in forecasting natural cascading hazards such as wildfires, droughts, and floods. The study involved an in-depth analysis of the bias-corrected forecasts, and the derived indices were crucial in understanding the models' ability to predict temperature-related extreme events. The results of this research contribute valuable information for decision-making and planning across various sectors, including disaster risk management and environmental protection. Through a comprehensive evaluation of machine learning-based bias correction techniques, we enhance the accuracy and applicability of seasonal temperature forecasts, thereby improving preparedness and resilience to climate-related challenges. 

How to cite: Mbuvha, R. and Nikraftar, Z.: Machine Learning Approaches to Improve Accuracy in Extreme Seasonal Temperature Forecasts: A Multi-Model Assessment , EGU General Assembly 2024, Vienna, Austria, 14–19 Apr 2024, EGU24-19297, https://doi.org/10.5194/egusphere-egu24-19297, 2024.

EGU24-19359 | ECS | Posters on site | CL4.3

Seasonal forecast of the late boreal winter temperature based on solar forcing and QBO 

Mikhail Vokhmianin, Antti Salminen, Kalevi Mursula, and Timo Asikainen

The ground temperature variability in the Northern Hemisphere winter is greatly influenced by the state of the polar vortex. When the vortex collapses during sudden stratospheric warmings (SSWs), rapid changes in stratospheric circulations propagate downward to the troposphere in the subsequent weeks. The ground effect following SSWs is typically manifested as the negative phase of the North Atlantic Oscillation. Our findings reveal a higher frequency of cold temperature anomalies in the Northern part of Eurasia during winters with SSWs, and conversely, warm anomalies in winters with a strong and stable vortex. This behavior is particularly evident when temperature anomalies are categorized into three equal subgroups, or terciles. Recently, we developed a statistical model that successfully predicts SSW occurrences with an 86% accuracy rate. The model utilizes the stratospheric Quasi-Biennial Oscillation (QBO) phase and two parameters associated with solar activity: the geomagnetic aa-index as a proxy for energetic particle precipitations and solar irradiance. In this study, we explore the model's potential to provide a seasonal forecast for ground temperatures. We assess the probabilities of regional temperature anomalies falling into the lowest or highest terciles based on the predicted weak or strong vortex state. Additionally, we demonstrate that the QBO phase further enhances the forecast quality. As the model provides SSW predictions as early as preceding August, our results carry significant societal relevance as well, e.g., for the energy sector, which is highly dependent on prevailing weather conditions.

How to cite: Vokhmianin, M., Salminen, A., Mursula, K., and Asikainen, T.: Seasonal forecast of the late boreal winter temperature based on solar forcing and QBO, EGU General Assembly 2024, Vienna, Austria, 14–19 Apr 2024, EGU24-19359, https://doi.org/10.5194/egusphere-egu24-19359, 2024.

EGU24-605 | ECS | Posters virtual | ERE1.5

Disentangling social perspectives on the use of reclaimed water in agriculture using Q methodology 

Cintya Villacorta Ranera, Irene Blanco Gutiérrez, and Paula Novo Nunez

Water scarcity due to climate change and increased water demands is driving the use of non-conventional water sources, including reclaimed water, particularly in agriculture. In many EU countries affected by droughts, reclaimed water has become an important component of the overall water mix. For example, in Spain, Europe’s most arid country, reclaimed water is 560 hm3/year (nearly 10% of the treated wastewater).

The use of reclaimed water has many advantages, but it also faces significant barriers. The lack of social acceptance has been described as one of the major obstacles. However, understanding how different stakeholders perceive the use of reclaimed water has not been addressed in depth the literature so far. Existing studies are scarce and fragmented. They focus on a single type of stakeholder (farmers or consumers), ignoring the perceptions and eventual acceptance of different stakeholder groups directly or indirectly impacted by reclaimed water.

This study attempts to fill this gap by exploring the plurality of perspectives on the use of reclaimed water for irrigation in Spain. To do so, we applied Q-methodology and conducted twenty-three interviews with key stakeholders, including representatives of public administration, environmental groups, farmer associations, food retailers, consumer organizations, water treatment companies and water reuse experts. As part of the Q study, stakeholders were asked to sort according to their level of relative agreement 36 statements related to different socio-economic, technical, environmental, institutional and political aspects of reclaimed water. The results were analysed using principal component analysis in R ('qmethod' package).

Our study found three discourses: 1- Reclaimed water is a guarantee for water supply in agriculture, 2- Reclaimed water has the potential to be a sustainable water resource and 3- Reclaimed water has a negative impact on the environment. These discourses show different ways of understanding reclaimed water. Although stakeholders had diverse perceptions, there is a certain agreement that the public administration has the will to promote the use of reclaimed water and therefore it is key to promote reclamation projects in agriculture.

They also agree that most consumers are not informed about the quality of reclaimed water and its benefits in the agricultural sector, which leads to a certain social reluctance to use it, and to avoid this, awareness campaigns would be necessary to increase the social acceptance of reclaimed water.

Therefore, some discourses conclude that it is possible that reclaimed water may have pollution problems, but it is also true that the potential for improvement in reclamation technology can avoid them. Regarding the reduction of ecological flows, it is important to study this on a case-by-case basis, as this problem tends to occur in inland areas, although not always.

Finally, the question of who should pay for water regeneration is very controversial and the best solution is to share the costs between the different stakeholders, with the purification and reclamation being carried out tipping fee, and the farmers, with the help of the administration, bearing the costs of the infrastructure and controls from WWTP.

How to cite: Villacorta Ranera, C., Blanco Gutiérrez, I., and Novo Nunez, P.: Disentangling social perspectives on the use of reclaimed water in agriculture using Q methodology, EGU General Assembly 2024, Vienna, Austria, 14–19 Apr 2024, EGU24-605, https://doi.org/10.5194/egusphere-egu24-605, 2024.

EGU24-1342 | ECS | Orals | ERE1.5 | Highlight

Increasing water footprints of flex crops 

Oleksandr Mialyk, Markus Berger, and Martijn J. Booij

Flex crops—crops with multiple end-uses that can be flexibly interchanged—play an important role in our society. Due to high nutritional and energy contents, they became widely used in various industries, providing food, animal feed, biofuels, and other chemical components. However, a limited number of studies exists on the environmental pressures of such crops, specifically concerning water resources.

Here, we aim to quantify the water footprints of main flex crops—namely maize, oil palm, soya beans, sugar cane, coconut, cassava, rape seed, and sunflower—using a recently published database on gridded water footprints of the world’s major crops in the 1990–2019 period. Our study reveals three key developments:

  • All flex crops experienced large water-productivity gains in response to increasing crop yields (less water is needed per tonne).
  • The global water footprint of flex crops has increased by more than one trillion cubic metres as productivity gains were insufficient to meet rapidly growing demand.
  • The production of flex crops has been concentrating around main exporting regions, most notably in Latin America and South-eastern Asia.

As demand keeps increasing, this raises a need for further research addressing the sustainability of flex crops. In particular, regarding the potential links to green and blue water scarcity, exposure of global supply chains to socio-economic and climatic risks, and the role of flex crops in our society.

How to cite: Mialyk, O., Berger, M., and J. Booij, M.: Increasing water footprints of flex crops, EGU General Assembly 2024, Vienna, Austria, 14–19 Apr 2024, EGU24-1342, https://doi.org/10.5194/egusphere-egu24-1342, 2024.

EGU24-1481 | ECS | Posters on site | ERE1.5

Overcoming Barriers to Sustainable Rice Production: A Remote Sensing-Enabled Approach 

Nick Kupfer, Carsten Montzka, and Tuan Quoc Vo

In Vietnam, conventional rice cultivation is under strong economic and ecological pressure. Against this backdrop, there is a rising demand for organic products both domestically and globally. In response, OrganoRice aims to facilitate the transition to organic farming in the model provinces of Vinh Long, Dong Thap, and An Giang in the Mekong Delta through a collaborative effort between German and Vietnamese partners. The initiative encompasses not only addressing physical challenges such as soil and water pollution reduction, optimal fertilization, and ecological plant protection but also delves into critical socio-economic dimensions, including enhancing the income of rice farmers and product marketing. The project acknowledges the intricate task of integrating cultural identity and individual farmers into the social fabric of the village community as a crucial factor for success in the conversion process. Direct communication with the rural population is prioritized, and key local stakeholders and scientific institutions, such as Can Tho University, play pivotal roles in ensuring the project's sustainable success.

The Mekong Delta's agricultural landscape is being explored through advanced tools such as remote sensing and hydrological simulations to map, predict, and optimize crop types, agricultural practices (both conventional and organic), and irrigation water pathways. Leveraging European Copernicus satellites Sentinel-1 and Sentinel-2, alongside PlanetScope equipped with radar and multispectral sensors, allows for monitoring plant growth conditions at a high spatial resolution. The analytical process involves examining remotely sensed data through phenological metrics, quantile mapping, and Fourier transform, complemented by conceptual simulations of irrigation flow paths. The initial phase comprises a comprehensive high-resolution time-series analysis of land use and land cover (LULC) dynamics to identify all potential LULCs influencing organic rice farming. Subsequently, irrigation flow path modeling is employed to estimate complex water dependencies. Ultimately, data fusion of LULC and irrigation analysis, combined with crop-specific pesticide data, results in an opportunity map highlighting suitable areas for organic rice farming. This interdisciplinary approach underscores the importance of integrating technological advancements with socio-economic considerations for a comprehensive and sustainable organic farming transition in the Mekong Delta.

How to cite: Kupfer, N., Montzka, C., and Quoc Vo, T.: Overcoming Barriers to Sustainable Rice Production: A Remote Sensing-Enabled Approach, EGU General Assembly 2024, Vienna, Austria, 14–19 Apr 2024, EGU24-1481, https://doi.org/10.5194/egusphere-egu24-1481, 2024.

EGU24-1491 | ECS | Orals | ERE1.5

Modelling Agrivoltaics in a climate perspective for water-energy-food nexus analysis 

Lia Rapella, Philippe Drobinski, and Davide Faranda

Renewable energies (REs) are increasingly important in addressing the challenge of climate change. Their development and widespread use can significantly reduce greenhouse gas emissions from fossil fuels and help mitigate the effects of climate change. To achieve a "net-zero" carbon economy, the transition to a RE system must occur alongside a profound transformation of the agri-food sector. Agrivoltaics (AVs) offers an opportunity to achieve both of these goals simultaneously. AVs provides clean energy and it is an important tool for realizing a sustainable and circular food economy in rural and farming communities. Additionally, by placing photovoltaic (PV) panels over crop fields, AVs can avoid the competition between solar energy and agriculture for land-use. This can also help to mitigate the impact of climate change on crop productivity, which is expected to be negatively affected by a warmer and drier future climate.
In our study, we developed a large-scale sub-grid AVs model to explore the inter-links between climate, the AVs system, and crops. This model enables a comprehensive evaluation of the effectiveness and efficiency of an AVs configuration within the context of the climate-water-energy-food nexus. Our approach involves coupling a PV model with the soil-vegetation-atmosphere-transfer model ORCHIDEE (Organising Carbon and Hydrology In Dynamic Ecosystems) to construct the AVs module. The PV layer simulates the effects of PV panels, altering solar radiation and wind speed taken from atmospheric forcings. Subsequently, these altered variables, along with other key atmospheric variables like air temperature and precipitation required by ORCHIDEE, are used as inputs to the hydro-vegetation layer. Leveraging ORCHIDEE capability to quantify terrestrial water and energy balances at the land surface, this integration allows for a comprehensive simulation of crop ecosystem behavior within an AVs system. Net Primary Production (NPP), Water Use Efficiency (WUE), and PV power potential (PVpot) are finally computed as ultimate outputs of our model, representing key indicators for the water-energy-food nexus. Focusing on the Iberian Peninsula and the Netherlands, we apply our model to assess three AVs configurations (fix-tilted array, sun tracking, sun antitracking) across three specific years (2015, 2018, 2020) for two types of crops. Specifically, we compare the performance of different configurations among themselves and against the situation without AVs systems to analyze different behaviors depending on climate conditions, crop type, and location and to explore the potential benefits of the AVs systems.

How to cite: Rapella, L., Drobinski, P., and Faranda, D.: Modelling Agrivoltaics in a climate perspective for water-energy-food nexus analysis, EGU General Assembly 2024, Vienna, Austria, 14–19 Apr 2024, EGU24-1491, https://doi.org/10.5194/egusphere-egu24-1491, 2024.

The escalating threat of water scarcity presents a dual challenge to both food production and water-related systems. The degradation of conventional water resources (e.g., surface water and ground water), coupled with insufficient investment in infrastructure, has compelled the water sector to seek alternative sources such as Non-Conventional Water Resources (NCW), encompassing reclaimed water reuse and desalination of brackish and seawater, as a long-term strategy, particularly in arid and semi-arid environments where irrigation is a vital component.
Recognizing the substantial potential of NCWs, this research presents the outcomes of an extensive study [1]. The study adopts a multidisciplinary approach, specifically employing Multi-Criteria Decision Making (MCDM), to assess the effectiveness of smart city water management strategies within the framework of NCWs. Utilizing representative criteria, our analysis involves objective judgment, assigns weights through the Analytic Hierarchy Process (AHP), and scores strategies based on their adherence to these criteria.
Our findings underscore the pivotal role of the "Effectiveness and Risk Management" criterion, carrying the highest weight at 15.28%, in shaping strategy evaluation and ensuring robustness. Criteria with medium weight include "Resource Efficiency, Equity, and Social Considerations" (10.44%), "Integration with Existing Systems, Technological Feasibility, and Ease of Implementation" (10.10%), and "Environmental Impact" (9.84%), focusing on ecological mitigation. Recognizing the importance of community engagement, "Community Engagement and Public Acceptance" (9.79%) is highlighted, while "Scalability and Adaptability" (9.35%) address the dynamics of changing conditions. Balancing financial and governance concerns are "Return on Investment" (9.07%) and "Regulatory and Policy Alignment" (8.8%). Two low-weight criteria, "Data Reliability" (8.78%) and "Long-Term Sustainability" (8.55%), emphasize data accuracy and sustainability.
Strategies with higher weights, such as "Smart Metering and Monitoring, Demand Management, Behavior Change," and "Smart Irrigation Systems," prove highly effective in enhancing water management in smart cities. Notably, medium-weighted strategies (e.g., "Educational Campaigns and Public Awareness," "Policy and Regulation," "Rainwater Harvesting," "Offshore Floating Photovoltaic Systems," "Collaboration and Partnerships," "Graywater Recycling and Reuse," and "Distributed Water Infrastructure") and low-weighted strategies (e.g., "Water Desalination") also contribute significantly, allowing for customization based on each smart city's unique context.
This research is of significance as it addresses the complexity of urban water resource management, offering a multi-criteria approach that enhances traditional single-focused methods. It comprehensively evaluates water strategies in smart cities and provides a criteria-weight-based resource allocation framework for sustainable decision-making, thereby boosting smart city resilience. It is essential to acknowledge that results may vary depending on specific smart city needs and constraints. Future studies are encouraged to explore factors such as climate change's impact on water management in smart cities and consider alternative MCDM methods like Technique for Order of Preference by Similarity to Ideal Solution (TOPSIS) or Elimination and Choice Expressing the Reality (ELECTRE) for strategy evaluation.

[1] Bouramdane, A.-A., Optimal Water Management Strategies: Paving the Way for Sustainability in Smart Cities. Smart Cities 2023, 6, 2849–2882. https://doi.org/10.3390/smartcities6050128


How to cite: Bouramdane, A.-A.: Sustainable Management Strategies for Non-Conventional Water Resources: Enhancing Food and Water Security in Arid and Semi-Arid Regions , EGU General Assembly 2024, Vienna, Austria, 14–19 Apr 2024, EGU24-2856, https://doi.org/10.5194/egusphere-egu24-2856, 2024.

EGU24-3533 | Posters virtual | ERE1.5 | Highlight

Challenges and opportunities of using reclaimed water for agricultural irrigation in Spain: A hydro-economic analysis.  

Paloma Esteve, Irene Blanco-Gutiérrez, Marina RL Mautner, Samaneh Seifollahi-Aghmiuni, and Marisa Escobar

Growing pressure on water resources and climate uncertainty are driving the need for alternative water sources. In countries with severe water stress, such as Spain, the reuse of water from urban wastewater treatment plants has become a promising opportunity to secure and improve agricultural production. The use of reclaimed water in agriculture offers many significant economic and the environment benefits. In addition to preserving freshwaters, it increases the reliability of water supplies and provides a source of nutrients needed for crop growth and soil fertility. In recent years, the European Union and the Spanish government have promoted the reuse of reclaimed water for irrigation as part of their circular economy strategies. However, the uptake of this practice is still limited and so far deployed below its potential.

This study uses a hydro-economic model to investigate the potential for reclaimed water reuse in agriculture and effective water resource management in the Western La Mancha aquifer in Spain. In this region, groundwater abstraction for irrigation exceeds aquifer recharge, leading to conflicts between rural socio-economic development and water conservation. In this context, reclaimed water reuse is seen as an alternative source to groundwater that can contribute to reduce over-exploitation. An economic optimization model is linked to the hydrology model WEAP (Water Evaluation And Planning system) to analyse management alternatives, that include full compliance with the current water abstraction regime and different levels of reclaimed water reuse from the region’s urban wastewater treatment plants (current level and full potential). Climate uncertainty is also simulated and represented by projected precipitation and temperature changes from a selection of global climate models under different representative concentration pathways (4.5 and 8.5).

The results show that compliance with the abstraction regime can help to mitigate aquifer overexploitation. Reclaimed water reuse represents an additional effort for aquifer recovery, resulting in improved groundwater storage levels. Its effect is particularly relevant under climate change scenarios, although groundwater levels would show a downward trend. However, reusing reclaimed water for irrigation reduces effluent flows to rivers and has a negative impact on meeting the environmental needs of downstream wetlands. At the same time, water reuse could mitigate the negative impact of water scarcity on farm incomes, especially in municipalities with high-capacity treatment plants (> 1Mm3/year) where high value crops (vineyards, olives and horticultural crops) are grown. 

Overall, this research evidence uneven impacts of reclaimed water reuse across the basin. Its contribution to reversing groundwater depletion is limited and should be understood as part of the solution, but not as the solution itself. Our results provide valuable insights into the economic and environmental implications of reclaimed water reuse and can support policy decisions for the adoption of such alternatives for integrated and sustainable water resource management in semi-arid regions.

How to cite: Esteve, P., Blanco-Gutiérrez, I., Mautner, M. R., Seifollahi-Aghmiuni, S., and Escobar, M.: Challenges and opportunities of using reclaimed water for agricultural irrigation in Spain: A hydro-economic analysis. , EGU General Assembly 2024, Vienna, Austria, 14–19 Apr 2024, EGU24-3533, https://doi.org/10.5194/egusphere-egu24-3533, 2024.

EGU24-3941 | ECS | Orals | ERE1.5 | Highlight

Do non-conventional water resources lead to a better performance of irrigation communities? A comparative analysis between the regions of Murcia (Spain) and Apulia (Italy) 

Mario Ballesteros-Olza, Sarah Stempfle, Irene Blanco-Gutiérrez, Almudena Gómez-Ramos, Giacomo Giannoccaro, and Bernardo De Gennaro

In a context of growing global water demands, plus climate change affecting water resources availability, non-conventional water sources (like reclaimed water and desalinated seawater) are emerging as promising water supply alternatives. Given that agriculture is the major contributor to water withdrawals, this study analyzes if the use of non-conventional water for irrigation leads to a better performance of irrigation communities (ICs). To do so, the research includes several ICs from the Segura River Basin (southeast of Spain), a region with structural water deficit, which is pioneer regarding the use of non-conventional water; as well as ICs from the Apulia region (southeast of Italy), which also suffers from water scarcity problems, but is less experienced regarding the use of non-conventional water. A benchmarking analysis was carried out, based on a set of Key Performance Indicators (KPIs), such as irrigation efficiency, guarantee of water supply, energy costs or gross margin, among others. This methodology has been previously used in the framework of the water and drainage sector. Also, a Principal Component Analysis and Clustering Analysis were applied to explore potential dissimilarities between the studied ICs and their causes. Finally, a regression analysis was carried out to observe if the use of non-conventional water has any effects on the performance of the studied ICs. The results of this research may help to increase knowledge regarding the pros and cons of using these non-conventional water resources, depending on the socioeconomic, environmental and geographical context. This way, this study would contribute to promoting the use of non-conventional water in other regions, leaning towards a more sustainable use of water resources and, consequently, protecting and preserving water ecosystems.

How to cite: Ballesteros-Olza, M., Stempfle, S., Blanco-Gutiérrez, I., Gómez-Ramos, A., Giannoccaro, G., and De Gennaro, B.: Do non-conventional water resources lead to a better performance of irrigation communities? A comparative analysis between the regions of Murcia (Spain) and Apulia (Italy), EGU General Assembly 2024, Vienna, Austria, 14–19 Apr 2024, EGU24-3941, https://doi.org/10.5194/egusphere-egu24-3941, 2024.

EGU24-4136 | ECS | Orals | ERE1.5 | Highlight

The economic and environmental impacts of UK meat imports post-Brexit 

Kaixuan Wang, Lirong Liu, Jonathan Chenoweth, and Stephen Morse

The United Kingdom (UK), a high consumer of meat, has traditionally relied heavily on the European Union for its meat imports. However, with the advent of Brexit, the UK now faces the imperative of identifying potential meat-importing nations. The choices of different meat import countries not only impact the economy and environment of the UK but also other countries around the world. This study builds the UK Meat Trade-centred World Input-Output Model (UK-MTWIO), incorporating diverse import data within various scenarios. With different scenarios considering costs, GHG emission and animal welfare, this study analyzes the economic, environmental and animal welfare impacts on the UK and other countries worldwide. The novelty involves the comprehensive consideration of scenario setting, the application of RAS method as well as the animal welfare analysis with the method of world input-output model. The study reveals that beef imports have the most significant impact on the imports of the lamb and pork. Meanwhile, the changes in the UK's meat trade may change the trade partners of some major meat-importing countries. In terms of environment, some import scenarios have the potential to contribute to GHG emissions reduction in the global agricultural sector: CHN, MEX, and JPN are typical countries that are significantly impacted. The results of this study provides valuable insights for policymakers making meat trade decisions post-Brexit.

How to cite: Wang, K., Liu, L., Chenoweth, J., and Morse, S.: The economic and environmental impacts of UK meat imports post-Brexit, EGU General Assembly 2024, Vienna, Austria, 14–19 Apr 2024, EGU24-4136, https://doi.org/10.5194/egusphere-egu24-4136, 2024.

EGU24-5637 | ECS | Orals | ERE1.5

Balancing food system greenhouse gas emissions reduction and food security in China 

Hao Zhao, Haotian Zhang, Petr Havlik, and Jinfeng Chang

China's increasing food consumption, particularly for animal products, presents a substantial challenge to mitigating greenhouse gas (GHG) emissions, not only within China but also extending to its trading partners. In this study, we employ the well-established food system integrated assessment model (GLOBIOM-China) to comprehensively investigate GHG emissions within the context of China's future food consumption. Our study indicates that in the baseline scenario (BAU), GHG emissions from China's food consumption side are projected to be 965 million tonnes of CO2 equivalent (Mt CO2 eq) by 2060, similar to the current level. Domestically, ruminant production accounts for a substantial 44% of total consumption-based emissions. Meanwhile, livestock-related methane emissions take prominence in terms of different gas categories, comprising a significant 45%. Virtual GHG emissions import is expected to decrease due to the deceleration of land use change, while the GHG emissions attributable to livestock product imports are projected to incrementally rise, eventually constituting 17.2% of the total food consumption-based emissions. Striving for food self-sufficiency (SS scenario) offers a pathway to diminishing China's food system GHG emissions and virtually imported emissions by 6% and 43%, respectively. However, this scenario presents an increase of domestic emissions by 2% and simultaneously poses challenges to domestic land use and other related indicators. Maintaining basic food self-sufficiency, and reducing calorie intake from animal sources and improving production practices contribute to a 216 Mt CO2eq reduction of total GHG emissions. This approach not only holds promise for emission reduction but also brings broader benefits such as decreased agricultural commodity prices (by -28%), reduced nitrogen fertilizer uses (by -13%), diminished agricultural land requirement (by -10%), and only 2% decline in per capita calorie intake. Our study reconciles GHG mitigation strategies and food security within China's food system, thereby contributing significantly to global sustainable development.

How to cite: Zhao, H., Zhang, H., Havlik, P., and Chang, J.: Balancing food system greenhouse gas emissions reduction and food security in China, EGU General Assembly 2024, Vienna, Austria, 14–19 Apr 2024, EGU24-5637, https://doi.org/10.5194/egusphere-egu24-5637, 2024.

EGU24-7331 | ECS | Orals | ERE1.5

Agricultural pollution in Indian Interstate Trade Network 

Shekhar Goyal, Raviraj Dave, Udit Bhatia, and Rohini Kumar

Humanity’s contemporary challenge in achieving global food security is sustainably feeding the rising global population. Intensive agricultural practices have powered green revolutions, helping nations attain self-sufficiency. However, these fertilizer-intensive methods and exploitative trade systems have created unsustainable agrarian systems. To probe the environmental consequences on production hubs, we map the fate of Nitrogen and Phosphorus in India’s interstate staple crop trade over the recent decade. Here, we analysed the spatiotemporal evolution of physical and virtual nutrient flow within India's interstate agricultural trade network, examining the environmental load on key production regions, assessing the sustainability of domestic wheat and rice trade systems in light of nutrient surplus, and providing policy recommendations for environmentally sustainable food security. Our examination of the cereal crop trade reveals that the Nation's food bowls contributing significantly towards domestic food security are sacrificing their environmental goals by becoming pollution-rich and water-poor. Our study emphasises policies focusing on redistributing funds from agricultural subsidies that aggravate environmental disparity to those incentivising sustainable production. The findings could offer a foundation for designing and exploring alternate trade network configurations that aim for environmental sustainability without compromising food security goals.


How to cite: Goyal, S., Dave, R., Bhatia, U., and Kumar, R.: Agricultural pollution in Indian Interstate Trade Network, EGU General Assembly 2024, Vienna, Austria, 14–19 Apr 2024, EGU24-7331, https://doi.org/10.5194/egusphere-egu24-7331, 2024.

EGU24-7380 | ECS | Orals | ERE1.5

Removal of favipiravir and oseltamivir in domestic wastewater effluents using ozonation and catalytic ozonation 

Nasim Chavoshi, Serdar Dogruel, Nilay Bilgin-Saritas, Zeynep Karaoglu, Irem Ozturk-Ufuk, Ramazan Keyikoglu, Alireza Khataee, Emel Topuz, and Elif Pehlivanoglu-Mantas

The surge in pharmaceutical use during global pandemics, like SARS-CoV-2, has led to increased antiviral concentrations in wastewater treatment plant influents. The low biodegradability of certain antivirals poses a challenge for wastewater treatment, threatening aquatic and soil ecosystems. This study aimed to optimize ozonation and catalytic ozonation processes for removing two anti-COVID-19 drugs (namely, favipiravir and oseltamivir) and assess their ecotoxicological effects in the context of potential wastewater reuse.

In this study, samples with 50 µg/L of favipiravir and oseltamivir were added to synthetic wastewater with approximately 50 mg COD/L, mirroring a typical domestic effluent. Experiments involved three ozone doses (0.2, 0.6, and 1 mg O3/mg DOC) at pH levels of 7 and 10. Adding 0.1 g/L of ZnFe layered double hydroxide as a catalyst aimed to improve the ozonation efficiency. Samples with 0.1 mg/L polyethylene microplastics were prepared to explore the efficiency of the applied processes in the presence of microplastics. The target drugs were quantified by LC-MS/MS. E. crypticus was used to understand the ecotoxicological impact of the treatment techniques on the potential reuse of treated wastewater for irrigation.

Regardless of the ozone dose used, ozonation at pH=7 resulted in removal efficiencies of 84% and 64% for favipiravir and oseltamivir, respectively. Increasing the pH value to 10 did not improve favipiravir elimination, yet an additional removal of 21% was recorded for oseltamivir at all three ozone doses. During catalytic ozonation, an approximately 30% decline in the abatement of drugs was observed when compared with ozonation alone, which could be attributed to either adsorption of ozone on the catalyst’s active-sites (blockage of active-sites and reduction in the availability of ozone radicals) or production of refractory by-products (enhancement in the competition between radicals and active-sites). In the presence of microplastics, ozonation experiments at pH=7 provided an average decrease of about 30% in the removal efficiency for both drugs whereas ozonation at pH of 10 resulted in an approximately 15% fall in the elimination level. Catalytic ozonation in the absence of microplastics, however, showed positive effects on the reduction rates of the examined drugs since the applied process yielded an improvement in the abatement of 14 and 7% for favipiravir and oseltamivir, respectively. Both in the presence and absence of microplastics, ozonation and catalytic ozonation of antivirals at pH=7 did not lead to any toxic effects for the reproduction of E. crypticus; instead, an increase in the reproduction performance was found, possibly due to the formation of more biodegradable organic intermediates. The experimental data obtained revealed that ozonation or catalytic ozonation could be viable alternatives for upgrading the existing wastewater treatment plants as they functioned well as a complementary treatment process not only to reduce the release of antivirals from domestic effluents, but also to substantially increase the reuse potential of treated wastewater for irrigation purposes.

This study was financially supported by the Scientific and Technological Research Council of Turkey (TUBITAK, Project #121Y383) and Scientific Research Projects Coordination Unit of Istanbul Technical University (ITU-BAP, Project # MYL-2023-44496).

How to cite: Chavoshi, N., Dogruel, S., Bilgin-Saritas, N., Karaoglu, Z., Ozturk-Ufuk, I., Keyikoglu, R., Khataee, A., Topuz, E., and Pehlivanoglu-Mantas, E.: Removal of favipiravir and oseltamivir in domestic wastewater effluents using ozonation and catalytic ozonation, EGU General Assembly 2024, Vienna, Austria, 14–19 Apr 2024, EGU24-7380, https://doi.org/10.5194/egusphere-egu24-7380, 2024.

EGU24-7458 | ECS | Orals | ERE1.5 | Highlight

Leveraging renewable energy solutions for distributed urban water management: The case of sewer mining 

Athanasios Zisos, Klio Monokrousou, Konstantinos Tsimnadis, Ioannis Dafnos, Katerina Dimitrou, Andreas Efstratiadis, and Christos Makropoulos

As urban populations swell and infrastructure demands escalate, managing resources sustainably becomes increasingly challenging. This paper focuses on the energy challenges inherent in distributed water management systems, using sewer mining as an example. Sewer mining is a distributed water management solution involving mobile wastewater treatment units that extract and treat wastewater locally. In this context, we examine the integration of renewable energy sources, specifically solar photovoltaics, to reduce reliance on traditional power grids, highlighting a pilot implementation at the Athens Plant Nursery in Greece since 2021. The study evaluates various system configurations, balancing performance with landscape integration, to propose a scalable and robust model for distributed water management. This approach not only addresses the direct energy requirements of water treatment systems but also contributes to the broader agenda of circular economy, by enhancing the sustainability and resilience of urban water infrastructure.

This work is supported by IMPETUS research project that has received funding from the European Union's Horizon 2020 research and innovation programme under grant agreement No. 101037084

How to cite: Zisos, A., Monokrousou, K., Tsimnadis, K., Dafnos, I., Dimitrou, K., Efstratiadis, A., and Makropoulos, C.: Leveraging renewable energy solutions for distributed urban water management: The case of sewer mining, EGU General Assembly 2024, Vienna, Austria, 14–19 Apr 2024, EGU24-7458, https://doi.org/10.5194/egusphere-egu24-7458, 2024.

EGU24-7880 | ECS | Orals | ERE1.5

Crop switching in the Indo-Gangetic Plain of India can improve water and food sustainability with increased farmers’ profit 

Ruparati Chakraborti, Kyle Frankel Davis, Ruth DeFries, Narasimha D. Rao, Jisha Joseph, and Subimal Ghosh

Water and food security in the Indo-Gangetic Plain (IGP) is severely affected due to the intensive irrigated agriculture, growing population, and changing climate. Agricultural intensification with the water-intensive rice-wheat system has increased the water demand in India. The declining monsoon rainfall and increased irrigation with more reliance on groundwater sources have resulted in groundwater depletion over India’s fertile region, the Indo-Gangetic Plain (IGP), with high energy usage. Despite several agricultural technology developments, no improvement is found in calorie production from cereal crops per unit of water consumption in the IGP. Crop switching from water-intensive rice and wheat to climate-resilient nutri-cereals can be a potential solution for water sustainability, but other dimensions i.e. food supply, and farmers’ profit need to be considered for implementation. So, a multi-objective optimization framework is needed to address the social, economic, and environmental sustainability objectives which are conflicting in nature, to find the optimal cropping pattern. In this study, an optimization model is developed and applied for crop switching with objectives to maximize calorie production, and farmers’ profit and to minimize water consumption by reallocating the cropped areas between cereals at the district level. Application of the model suggests switching from rice to millet and sorghum in the Kharif Season (monsoon), and wheat to sorghum and barley in the Rabi season (winter), which could potentially decrease water consumption by 32%, increase calorie production by 39%, and elevate farmers' profits by 140%. Water and energy savings (with the replaced cropping pattern are higher than changing irrigation practices (i.e. from flood to drip). So, crop switching coupled with efficient irrigation practices (drip) contributes to saving more energy and water. These findings suggest the potential of crop switching to address the multidimensional sustainability challenges in agricultural practices in the IGP, with a scope of application to other regions grappling with similar issues. The implementation of crop switching is driven by multiple factors such as the willingness of farmers, incentives, and other strategies for farmers to shift crop practice, procurement of nutri cereals through Minimum Support Price, subsidized supply through the Public Distribution System, and consumer demand; thus, leaving an opportunity to explore these aspects in future studies for policy framing towards sustainable agricultural practices.

How to cite: Chakraborti, R., Davis, K. F., DeFries, R., D. Rao, N., Joseph, J., and Ghosh, S.: Crop switching in the Indo-Gangetic Plain of India can improve water and food sustainability with increased farmers’ profit, EGU General Assembly 2024, Vienna, Austria, 14–19 Apr 2024, EGU24-7880, https://doi.org/10.5194/egusphere-egu24-7880, 2024.

EGU24-9881 | ECS | Posters on site | ERE1.5

Comparison of different interpolation techniques for sub-basins located in Madrid. 

Blanca Cuevas, Elena Pascual, Carlota Bernal, and Sergio Zubelzu

Soil hydrophysical properties can be very spatially and temporally heterogeneous even in small areas. Due to this spatial and temporal variability, it is impossible to obtain real data for each point of interest. Therefore, the possibility to obtain the optimal estimated value, at any desired point, is decisive. The aim is to evaluate different methods to minimise the error made in this measurement.

Two basins were selected in the Autonomous Community of Madrid (Spain), where hydraulic conductivity data were taken at different points. All sampling point in both basins were georeferenced. For each basing different interpolation methods were tested. The methods used are Spline, Inverse Distance Weighted Interpolation (IDW), Kriging, and Thiessen Polygons. With the help of the Matlab program, the values for each method were obtained. Finally, the error is used for the analysis.

Differences among the obtained data by each method are expected to be found. In addition to the differences between the number of samples and the error, and the location in the basin of the samples.

In conclusion, it is hoped to find the most appropriate method for obtaining a value as close to reality as possible. Furthermore, it is expected to be able to use this methodology in other situations.

Acknowledgements: This research Project has been funded by the Comunidad de Madrid through the call Research Grants for Young Investigators from Universidad Politécnica de Madrid

How to cite: Cuevas, B., Pascual, E., Bernal, C., and Zubelzu, S.: Comparison of different interpolation techniques for sub-basins located in Madrid., EGU General Assembly 2024, Vienna, Austria, 14–19 Apr 2024, EGU24-9881, https://doi.org/10.5194/egusphere-egu24-9881, 2024.

EGU24-11353 | ECS | Orals | ERE1.5

Agroforestry management practices as nature-based solutions for climate change adaptation in the Galapagos Islands 

Ilia Alomia, Yessenia Montes, Rose Paque, Jean Dixon, Armando Molina, and Veerle Vanacker

Small tropical islands in the Pacific Ocean are highly vulnerable to climate change. Nature-based solutions can help local communities adapt their local agricultural systems. Through a comparative analysis, we evaluated the effects of agroforestry management practices on soil temperature, soil water availability and storage, and carbon stocks in Santa Cruz Island (Galapagos Archipelago). We installed six monitoring sites that consist of two replicates per agroforestry management practices: (i) conservation of native forest, (ii) traditional agroforestry, and (iii) abandoned farmland in passive restoration. After pedological characterization of the sites, the soil physicochemical and hydrological properties were determined in the laboratory. Over 30 months (July 2019 to December 2021), the environmental sensors captured the hydrometeorological and soil physical and hydrological properties of the sites. This was done by a dense network of rain gauges, air temperature and relative humidity sensors, and time-domain reflectance probes that registered volumetric water content and soil temperature.

We measured differences in soil temperature, moisture availability and soil organic carbon content between soils under forest, traditional agroforestry and passive restoration. Forest soils are protected from direct solar radiation, and trees keep the soil 12% cooler than soils converted to agricultural land. Soil moisture is 20% higher under forest than under traditional agroforestry or abandoned farmland, and forest soils have a lower dry bulk density, lower saturated hydraulic conductivity and higher water retention capacity. The forests and sites under passive restoration store more than 377 Mg C. ha-1 (1 m depth), about 50% more than under traditional agroforestry. The study shows that conserving forest patches in an agricultural landscape might be a promising strategy to mitigate increasing soil temperatures, agricultural drought, and decline in soil organic carbon content. However, more studies on landscape scale are needed to corroborate those results.

How to cite: Alomia, I., Montes, Y., Paque, R., Dixon, J., Molina, A., and Vanacker, V.: Agroforestry management practices as nature-based solutions for climate change adaptation in the Galapagos Islands, EGU General Assembly 2024, Vienna, Austria, 14–19 Apr 2024, EGU24-11353, https://doi.org/10.5194/egusphere-egu24-11353, 2024.

EGU24-11369 | ECS | Orals | ERE1.5

Expert-based global database of sand dams dimensions and distribution across drylands 

Jessica Eisma, Luigi Piemontese, Giulio Castelli, Ruth Quinn, Bongani Mpofu, Doug Graber Neufeld, Cate Ryan, Hannah Ritchie, Lorenzo Villani, and Elena Bresci

Sand dams are water harvesting structures built across ephemeral sandy rivers to increase water supply in drylands. Despite their effectiveness in reducing water scarcity for local communities and their recent traction in research and development, information on their distribution and characteristics are sporadic and largely unreported. This gap represents a major barrier for understanding the large-scale potential of such a Nature-based Solution for drylands and planning for new infrastructure. This paper presents a global database of sand dam locations and dimensions developed within a collaboration between research and development experts on the topic. We collected sand dam information on location from several sources, ranging from research reports to databases provided by practitioners. We then reviewed and enriched them based on visual inspection from Google Earth images. The georeferenced information provided by the database can support research development on the effectiveness of sand dams and support practitioners with science-based criteria for sand dam development across global drylands.

How to cite: Eisma, J., Piemontese, L., Castelli, G., Quinn, R., Mpofu, B., Graber Neufeld, D., Ryan, C., Ritchie, H., Villani, L., and Bresci, E.: Expert-based global database of sand dams dimensions and distribution across drylands, EGU General Assembly 2024, Vienna, Austria, 14–19 Apr 2024, EGU24-11369, https://doi.org/10.5194/egusphere-egu24-11369, 2024.

Pumping energy is a key component of the groundwater governance challenge. Yet it is largely missing in the discourse on agricultural use of groundwater. A sub-category of literature studying groundwater-energy nexus tends to focus on groundwater depletion hotspots where entrenched interests and long-standing history restrict the range of feasible energy models. We simulate expected impacts of expanding groundwater irrigation under five different energy provision models in a region with among the lowest irrigation coverage, and therefore, free of path dependent policies. We find aquifer properties play a crucial role in mediating the groundwater-energy nexus. On average, the maximum volume of water that can be pumped from a well of a specific depth in an alluvial aquifer is approximately 150 times the volume that can be pumped from a well in a hard-rock aquifer. Therefore, managing uncertainty in groundwater consumption is a far greater challenge in alluvial than hard-rock aquifers. Uncertainty in groundwater consumption can be limited in hard-rock aquifers if the number of wells and depths of wells can be controlled - capital subsidies for well construction could be a potential policy. Our results imply that while solar pumps are a risky alternative in alluvial aquifers for maintaining current and future groundwater levels, they are relatively safe and among the most economical for expanding irrigation in hard-rock regions. Using a novel dataset comprising of biophysical and socioeconomic data, we find hard-rock regions to have limited irrigation coverage, high availability of annually replenishable groundwater, and high concentrations of marginalized farmers. Therefore, groundwater irrigation expansion in hard-rock areas could have dual benefits of ensuring future food security and targeting poverty reduction.

How to cite: Ray, S.: Balancing groundwater access and sustainability through energy pricing in India, EGU General Assembly 2024, Vienna, Austria, 14–19 Apr 2024, EGU24-13972, https://doi.org/10.5194/egusphere-egu24-13972, 2024.

EGU24-14721 | Posters on site | ERE1.5

Silage  production from olive mil wastes  

Ioannis Manariotis, Styliani Biliani, Maria Varvara Manarioti, and Nikolaos Athanassolpoulos

Within the European Union, approximately 129 Mtons of food waste were generated in 2011, and about 52% of them derived from post-processing activities. The most common by-products originated from the food industry are spent coffee grounds, sugar cane waste, and fruit peels, while the main agricultural wastes are livestock slurry, manure, crop residue, and woodland pruning and maintenance wastes. The olive tree is cultivated worldwide, and more than 90% of the cultivated area is located in the Mediterranean basin. The olive oil extraction is carried out using two- or three-phase centrifuge systems. The olive mill wastes can be incorporated into the diets of productive animals, especially ruminants, due to their high fiber content. The aim of this work was to investigate the optimum conditions for silage production for animal food using olive oil wastes from a diphasic olive mill facility. Olive mill waste and straw were the base materials for silage composition: 53 to 55% and 45 to 47%, respectively (dry weight basis). Different mass ratios of molasse (0 to 4%) and urea (0 to 1%) per olive mill mass (dry weight) were used. The presence of urea and the absence of molasses turned out to be inhibitory factors for the silage process. The highest molasses rates the highest efficiency of silage production.

How to cite: Manariotis, I., Biliani, S., Manarioti, M. V., and Athanassolpoulos, N.: Silage  production from olive mil wastes , EGU General Assembly 2024, Vienna, Austria, 14–19 Apr 2024, EGU24-14721, https://doi.org/10.5194/egusphere-egu24-14721, 2024.

EGU24-14983 | ECS | Orals | ERE1.5 | Highlight

Reducing climate change impacts and inequality of the global food system through diet shifts 

Yanxian Li, Pan He, Yuli Shan, Yu Li, Ye Hang, Shuai Shao, Franco Ruzzenenti, and Klaus Hubacek

How much and what we eat and where it is produced can create huge differences in greenhouse gas emissions. Bridging food consumption with detailed household-expenditure data, this study estimates dietary emissions from 13 food categories consumed by 201 expenditure groups in 139 countries, and further models the emission mitigation potential of worldwide adoption of the EAT–Lancet planetary health diet. We find that the consumption of groups with higher expenditures generally creates larger dietary emissions due to excessive red meat and dairy intake. As countries develop, the disparities in both emission volumes and patterns among expenditure groups tend to decrease. Global dietary emissions would fall by 17% if all countries adopted the planetary health diet, primarily attributed to decreased red meat and grains, despite a substantial increase in emissions related to increased consumption of legumes and nuts. The wealthiest populations in developed and rapidly developing countries have greater potential to reduce emissions through diet shifts, while the bottom and lower-middle populations from developing countries would cause a considerable emission increase to reach the planetary health diet. Our findings highlight the opportunities and challenges to combat climate change and reduce food inequality through shifting to healthier diets.

How to cite: Li, Y., He, P., Shan, Y., Li, Y., Hang, Y., Shao, S., Ruzzenenti, F., and Hubacek, K.: Reducing climate change impacts and inequality of the global food system through diet shifts, EGU General Assembly 2024, Vienna, Austria, 14–19 Apr 2024, EGU24-14983, https://doi.org/10.5194/egusphere-egu24-14983, 2024.

EGU24-15307 | ECS | Orals | ERE1.5

Tracking real-time impacts of climate variability and trade disruptions on water and food security  

Marijn Gülpen, Christian Siderius, Ype van der Velde, Jon Cranko Page, Jan Biermann, Ronald Hutjes, Lisanne Nauta, Samuel Sutanto, and Hester Biemans

Food insecurity results from a complex interplay of climate, socio-economic and political drivers, with local food security being frequently influenced by events elsewhere. Recent unprecedented climate events and economic disruptions such as Covid-19 and the resurgence of large intra- and inter-state conflict, show the diverse and unpredictable nature of risk, which can suddenly impacting food production and supply chains.

Here, we present a coupled hydrology-crop production-trade model that is able to simulate, in real time, current and near-future risks to water and food security. The model combines an operational process-based simulation of global crop production and hydrology with an ML-powered trade module, trained on FAOs detailed trade matrix dataset. It is updated monthly with the latest ERA5 climate data from the Copernicus Data Store to assess current risk, and can be forced with seasonal forecasting and long term climate projections up to 2100. The model explains about 50% of yield variability in major growing regions - a critical characteristic for nowcasts or seasonal forecasts – and the majority of food trade and trends therein, but generally still underestimates the variability. As a first step to better reproduce observed crop yield anomalies we improved the simulation of growing seasons in the production model.  

By combining production with trade, we are able to estimate the impact of climate-related yield anomalies elsewhere, and to assess risks for water- and food security at the country, regional or global scale. Derived indicators provide a real-time insight into, for example, food production and storage per capita, crop water productivity, or crop or export specific water stress. Through continued evaluation and learning, we expect to be able to better identify emerging stresses in the food system and its drivers, and support early anticipation of potential future food security risks. This should ultimately lead to a better understanding of the complexity of the global food system and eventually result in a more sustainable food system.

How to cite: Gülpen, M., Siderius, C., van der Velde, Y., Cranko Page, J., Biermann, J., Hutjes, R., Nauta, L., Sutanto, S., and Biemans, H.: Tracking real-time impacts of climate variability and trade disruptions on water and food security , EGU General Assembly 2024, Vienna, Austria, 14–19 Apr 2024, EGU24-15307, https://doi.org/10.5194/egusphere-egu24-15307, 2024.

EGU24-15345 | ECS | Orals | ERE1.5

Atrazine Removal in Constructed Wetlands: Efficacy of Monocultures versus Polycultures 

Sai Kiran Pilla, Mahak Jain, Partha Sarathi Ghosal, and Ashok Kumar Gupta

The Green Revolution in India, from 1967-68 to 1977-78, led to a significant shift in the country's agricultural landscape, transforming it from an insufficient food production country to a global agricultural power. This led to an increase in the use of pesticides, such as atrazine, which can pollute water sources and endanger aquatic habitats. This research aims to find sustainable and practical techniques for atrazine remediation within aquatic habitats. Literature suggests that macrophyte richness enhances the functionality of constructed wetlands (CWs), but the predominant practice is monocultures. The functional diversity within macrophyte communities is crucial for optimal performance of CWs for contaminant remediation. CWs with diverse growth forms exhibit enhanced plant growth and superior nutrient removal capabilities. The study evaluates atrazine removal efficacy of polyculture and monoculture plantation, monitoring the efficiency of various individual macrophyte, such as Canna indica and Phragmites Australis for atrazine detoxification. The findings could guide the formulation of sustainable and efficacious atrazine remediation strategies, safeguarding water quality and the integrity of aquatic ecosystems.

How to cite: Pilla, S. K., Jain, M., Ghosal, P. S., and Gupta, A. K.: Atrazine Removal in Constructed Wetlands: Efficacy of Monocultures versus Polycultures, EGU General Assembly 2024, Vienna, Austria, 14–19 Apr 2024, EGU24-15345, https://doi.org/10.5194/egusphere-egu24-15345, 2024.

EGU24-16795 | ECS | Posters on site | ERE1.5 | Highlight

Food loss & waste of staple crop products: mapping environmental impacts within the Nexus paradigm 

Francesco Semeria, Giacomo Falchetta, Adriano Vinca, Francesco Laio, Luca Ridolfi, and Marta Tuninetti

Over the last decade, a combination of economic uncertainty, supply shocks, and extreme climate events has led to a renewed prevalence of undernourishment, posing a serious threat to the realization of the Zero Hunger Sustainable Development Goal. Future scenarios are likely to be even more challenging to its accomplishment, based on projected trends of population growth and human-induced climate change impacts. There is urgent need for the development and implementation of sustainable transformation pathways to make agri-food systems worldwide more resilient and capable to sustain these pressures. These pathways should include a wide range of actions, targeting all stages of the value chain. Reducing food loss and waste (FLW), which currently accounts for approximately one-third of the food produced, is considered among those with the largest potential, with significant environmental co-benefits on the Water-Energy-Food-Ecosystem Nexus. The presence of complex and tele-coupled trade networks however, together with the lack of robust and granular datasets, make it difficult for researchers to run detailed analyses on this issue.

In this work we estimate the FLW associated to the consumption of a wide range of staple crops globally, disaggregating between the single food commodities and the different stages of the value chain. Moreover, we investigate the associated impacts on the water, land, and energy resources. The methodology applied allows us to trace the environmental impacts from the countries of production and manufacturing, where resources have been used, to the countries of consumption (from farm to fork) and backwards (from fork to farm), offering a dual perspective on the complex system. Our preliminary results show that over 20% of the quantities cultivated are wasted through FLW, globally. Transnational flows of FLW – and of associated virtual resources – compose a vast multi-layered network involving most of the countries worldwide. Differentiated impacts are observed, depending on the countries’ role in the network: while large exporters bear substantial impacts of FLW occurring abroad on their resources, net-importing nations transfer large portions of the environmental effects of the FLW associated with their consumptions onto foreign stocks. The ability to discern between the single food commodities, without aggregating primary and derived products, increases the level of specificity from past research. This detailed data is valuable for informing public policies, providing a more fine-grained approach to prioritize efforts in reducing FLW and its associated impacts.

How to cite: Semeria, F., Falchetta, G., Vinca, A., Laio, F., Ridolfi, L., and Tuninetti, M.: Food loss & waste of staple crop products: mapping environmental impacts within the Nexus paradigm, EGU General Assembly 2024, Vienna, Austria, 14–19 Apr 2024, EGU24-16795, https://doi.org/10.5194/egusphere-egu24-16795, 2024.

EGU24-18001 | ECS | Orals | ERE1.5

Adsorptive removal of humic acid from water by magnesium oxide 

Rupal Sinha and Partha Sarathi Ghosal

Disinfection is a critical drinking water treatment procedure to guarantee water safety in urban water supply systems. However, an inevitable consequence is the generation of secondary pollutants, referred to as disinfection byproducts (DBPs). Toxicological researches have linked the ingestion of DBPs to harmful human health consequences like a higher risk of bladder cancer, reproductive problems, etc. Subsequently, the water authorities face immense challenges due to their existence in the drinking water. The foremost approach to limiting their generation in the drinking water is to eliminate their precursors prior-to disinfection. Humic acid (HA), a significant constituent of the natural organic matter in surface water, has been acknowledged as the primary precursor of DBPs. Thus, the present work aims to reduce humic acid content in water by magnesium oxide (MgO) adsorbent. To ascertain the mechanism of humic acid removal, characterizations of the adsorbents were conducted both before and after. At neutral pH level, the impacts of various process parameters are examined, including contact time, adsorbent dosage, initial humic acid concentration, and temperature. Moreover, studies were performed to assess the effects of different solution pH on the elimination of humic acid. The removal of humic acid was found to be increased at low pH. At pH 3, over 85% elimination was obtained. Furthermore, the role of several anions, including nitrate, sulfate, and chloride, in the adsorption of humic acid has also been evaluated. Overall, the present study would be conducive to proving the applicability of MgO for the reduction of HA and other organic matter from water and, hence, reduce the generation of DBPs.

How to cite: Sinha, R. and Ghosal, P. S.: Adsorptive removal of humic acid from water by magnesium oxide, EGU General Assembly 2024, Vienna, Austria, 14–19 Apr 2024, EGU24-18001, https://doi.org/10.5194/egusphere-egu24-18001, 2024.

Life Cycle Assessment (LCA) is a systematic approach used to evaluate the environmental impacts of products, services, or activities throughout their life cycle, from raw material acquisition and production to use and final disposal or recycling stages. The goal of LCA is to comprehensively assess environmental impacts across the entire life cycle, including energy consumption, greenhouse gas emissions, water and land use, and more. The execution of LCA primarily involves four stages: "goal and scope definition," "life cycle inventory," "life cycle impact assessment," and "life cycle interpretation." This method helps identify and improve environmental hotspots in products or activities, aiming to reduce adverse impacts on the environment.

This study references the "Packaging Lunch Box Product Category Rules" published by the Environmental Protection Administration of the Executive Yuan in Taiwan. Using a vegetarian lunch box manufacturer in Taiwan as a data source, a "Vegetarian Lunch Box Carbon Footprint Calculation Tool" was developed using SimaPro. Users can input first-tier data for each stage of the product life cycle (such as raw material input, energy, transportation distance, and output products), enabling the calculation of the carbon footprint of the vegetarian lunch box.

However, during the "life cycle interpretation" stage, this study found that the "raw material acquisition stage" contributes 80% of the carbon footprint throughout the entire life cycle of the vegetarian lunch box. This indicates significant negative environmental impacts during the "agricultural production" process. As a result, the study traces the environmental impacts of upstream agricultural production processes for grains and vegetables and proposes an improvement strategy: regenerative agriculture.

Regenerative agriculture practices include protective tillage to reduce physical soil disturbance, increasing biodiversity in fields, cover cropping to enhance soil carbon and prevent erosion, crop rotation for balanced soil nutrient use, and refraining from using chemical fertilizers and pesticides. The goal of regenerative agriculture is to sequester carbon in the soil and above-ground biomass, reducing greenhouse gas emissions, increasing crop yields, enhancing resilience to unstable climates, and improving the health and vitality of rural communities.

This study will also employ the life cycle assessment method to collect inputs and outputs for both conventional farming practices and regenerative agriculture, comparing their environmental impacts.

How to cite: Chen, C.-K. and Tung, C.-P.: Application of Life Cycle Assessment in Vegetarian Lunch Box: Environmental Impact Hotspot Analysis of Whole Grain and Vegetable Production, EGU General Assembly 2024, Vienna, Austria, 14–19 Apr 2024, EGU24-18099, https://doi.org/10.5194/egusphere-egu24-18099, 2024.

EGU24-20605 | ECS | Posters on site | ERE1.5

Exploring the potential of cowpea inoculation in Namibia for improved resource use and human nutrition 

Jihye Jeong, Kerstin Jantke, and Uwe. A Schneider
  • Motivation, problem statement and aim

Cowpea is an important source of protein in the semiarid parts of sub-Saharan Africa. Even under water or temperature stress, cowpea can produce grain and fix nitrogen. The robustness of cowpea makes them a good choice especially for smallholder farmers with limited resource. Inoculated cowpea is not only more resilient against many plant diseases, but also can fix nitrogen more effectively.

Located in sub-Saharan region, water supply is a constant struggle of Namibia. In addition, due to dry climate and soil characters, only 1% of the country is arable. In contrast to harsh natural condition, over 70% of population depends their livelihoods on agriculture. For insufficient production, food supply in Namibia is highly dependent on imports. This combination of natural and societal condition puts Namibian population into nutrition hazard.

Thereby, the study aims to investigate the potential of cowpea inoculation in Namibia by answering the following questions:

1) How much can inoculation increase cowpea production in Namibia?

2) How much land and water resource can be saved by introducing inoculation in cowpea cultivation?

  • Methodology

Environment Policy and Integrated Climate (EPIC) model is adopted for crop simulation. It is calibrated specifically to the Namibian agricultural environment. Different climate scenarios and agricultural management systems are simulated in EPIC. The simulation result is used in optimisation modelling using General Algebraic Modelling System (GAMS). The model is simulated under objective of maximum food production given the current population.

  • Result

Primarily, potential cowpea production is depicted in both inoculated and non-inoculated scenarios. The simulation considers the total arable land of the country and subsistence farming as the only farming management. Cowpea production increases by 26% with inoculation.

The land and water use of inoculated cowpea cultivation is shown in relative to non-inoculated cowpea cultivation. In the perspective of current resource availability, the relative resource use is elaborated. Inoculation saves up to 23% of land and 79% of water use.

  • Conclusion

By introducing inoculation in cowpea cultivation, Namibia is expected to have meaningful increase in production and decrease in both land and water use. Since cowpea is already well integrated in smallholder farmers’ practice, the adoption of inoculation can penetrate the positive effects into remote and vulnerable areas.

How to cite: Jeong, J., Jantke, K., and Schneider, Uwe. A.: Exploring the potential of cowpea inoculation in Namibia for improved resource use and human nutrition, EGU General Assembly 2024, Vienna, Austria, 14–19 Apr 2024, EGU24-20605, https://doi.org/10.5194/egusphere-egu24-20605, 2024.

EGU24-21484 | Orals | ERE1.5

Sustainable and digitalized water management in rural environments in the SUDOE area (GestEAUr project) 

Jose Luis Molina, Victor Monsalvo, Angel Encinas, and Engracia Lacasa

The rural areas of the SUDOE present many common challenges related to the integrated water cycle: the scarcity of water resources (aggravated by climate change), the impact of agricultural and livestock activities on water quality (and the consequent difficulty of reconciling compliance with the European directive, the continuity of economic activity and the availability of water) and the lack of efficiency and profitability in management (with obsolete facilities and few human resources).
It is essential to strengthen collaboration networks between the many stakeholders involved in water resources management in order to implement efficient, sustainable and cost-effective techniques for water purification, reuse and treatment. To this end, it is necessary to create a new governance system based on territorial cooperation. Water is a common good and, as such, it does not understand borders.
The project will develop a strategy to improve water efficiency and quality in rural SUDOE areas in a context of climate change, 5 action plans for 4 organizations to improve water supply and treatment services, 3 pilot tests of cost-effective and sustainable solutions for water purification, purification and reuse, and a digital tool for 2 organizations to improve water management. In addition, it will improve the capacities of public authorities in 3 countries and the knowledge of water purification, treatment and reuse techniques like water treatment, reuse and purification techniques of 3 scientific institutions.
GestEAUr will adopt an innovative approach, addressing the integrated water cycle holistically (taking into account all its stages) and will go beyond existing practice, which tends to apply the same solutions whatever the characteristics of the territory where they are implemented.
Consequently, it will analyze and test cost-effective, cutting-edge and nature-based techniques (and combinations of techniques) (SBN) specific to the needs of rural areas in the SUDOE. It will also provide digital tools to optimize and facilitate their management and planning.

How to cite: Molina, J. L., Monsalvo, V., Encinas, A., and Lacasa, E.: Sustainable and digitalized water management in rural environments in the SUDOE area (GestEAUr project), EGU General Assembly 2024, Vienna, Austria, 14–19 Apr 2024, EGU24-21484, https://doi.org/10.5194/egusphere-egu24-21484, 2024.

EGU24-579 | ECS | Posters on site | AS2.4

Meteorological and Soil Moisture Measurements in Mount Kenya Region at Various Scales 

Peter K. Musyimi, Balázs Székely, Hellen W. Kamiri, Tom Ouna, and Tamás Weidinger

The optimal solution for solving many uncertainties associated with weather and climate data is accurate field measurement. This enhances various climate services that can be offered to different sectoral case studies and solve societal weather-related challenges by ensuring the obstacles are overcome amicably, for instance, climate adaptation barriers in the face of climate variability. The main goal of our study was to make long-term meteorological measurements in Mount Kenya region rainforest biome at an elevation of 1998 m above sea level (Karatina University weather station) and 3055 m above sea level (Mount Kenya field station) used at various scales from 2022. We are using Temperature-Moisture-Sensor (TMS) burial (1 m) and TMS Long (45 cm) soil sensors as well as temperature/relative humidity data loggers. These devices provide us with crucial data and reshape field measurement campaigns in data-scarce regions of Kenya. The soil moisture sensors also measure soil temperature, surface, and air temperature. The soil moisture data and temperature at various scales is acquired at an interval of 10 minutes while the data logger records data at an interval of 30 minutes.  Another key goal was to acquire soil moisture data at tropical rainforest biome which is scarce as well as relative humidity and temperature. The objectives of the study are to analyze reference evapotranspiration and estimation of real evapotranspiration in humid Mount Kenya climatic region, Nyeri County; compare climate parameters in two different elevations; to understand microclimatic changes associated with varying elevations and ensure data quality control in analysis by checking uncertainties and sensitivities associated with ERA5 reanalysis, synoptic (GFS/ECMWF) and station datasets. Therefore, to narrow the gap between missing data, uncertainties, and quality control of data, meteorological field measurements cannot be misconstrued.

Keywords: data loggers, field measurement, soil moisture, quality control, Kenya,

How to cite: Musyimi, P. K., Székely, B., Kamiri, H. W., Ouna, T., and Weidinger, T.: Meteorological and Soil Moisture Measurements in Mount Kenya Region at Various Scales, EGU General Assembly 2024, Vienna, Austria, 14–19 Apr 2024, EGU24-579, https://doi.org/10.5194/egusphere-egu24-579, 2024.

The impact of increasing CO2 on global temperature and strengthening of the greenhouse effect makes the measurements of gas exchange between the Earth’s surface and the atmosphere particularly important. Observational data on greenhouse gases exchange between different types of ecosystem and the atmosphere are crucial in thorough understanding the global climate mechanisms. Fruit tree ecosystems constitute an important kind of land use in Central Europe and apple is very extensively cultivated fruit tree crop in the world. Because intensively used apple orchards have a potential for carbon (C) sequestration and to be an important sink of atmospheric CO2 the continuous measurements of processes of ecosystem-atmosphere exchange are necessary for properly determining of global carbon (C) budget.

This work presents the results of continuous closed-path EC measurements of carbon dioxide (CO2) fluxes in the apple orchard located near Grójec in the Masovian voivodeship on the largest orchard area in Poland. These are the results of the first and the only measurements of the net CO2 fluxes (started in February 2023) carried out in the apple orchard ecosystem in Poland. The main goal of the work is to present variations of CO2 flux at different time scales at different stages of fruit tree growth and during different climatic conditions. The turbulent fluxes of CO2 were calculated on a 30-min basis. The raw data were computed using the EddyPro -7.0.9 software taking into account the necessary corrections and procedures to correct the obtained results. CO2 fluxes were characterized by clear daily variability with negative values during the day (CO2 uptake in the photosynthesis process) and positive at night (CO2 release in plants respiration processes). The most intensive CO2 absorption took place between May and September (phases of flowering and fruit development and ripening) the with a maximum in June. Negative 30 min mean CO2 flux value reached for this month was around 12 µmol ּ m-2 ּ s-1 around noon. In the remaining months the CO2 absorption processes were lower and ranged around a few µmol ּ m-2 ּ s-1

How to cite: Pawlak, I. and Kleniewska, M.: Variability of turbulent carbon dioxide flux netto at different time scales in an apple orchard ecosystem in Central Poland, EGU General Assembly 2024, Vienna, Austria, 14–19 Apr 2024, EGU24-592, https://doi.org/10.5194/egusphere-egu24-592, 2024.

EGU24-956 | ECS | Posters on site | AS2.4

Fluxible: an R package to calculate ecosystem gas fluxes in a reproducible and automated workflow. 

Joseph Gaudard, Richard Telford, Vigdis Vandvik, and Aud Helen Halbritter

Measurements of gas fluxes are widely used when assessing the impact of global-change drivers on key aspects of ecosystem dynamics, especially carbon. It shows whether an ecosystem is a source or a sink of atmospheric carbon, and how the storage dynamics could change in the future. Ecosystem gas fluxes are typically calculated from field-measured gas concentrations over time, using a linear or exponential model and manually selecting good quality data. This approach is highly time consuming and prone to potential bias that might be amplified in further steps, as well as having major reproducibility issues. The lack of a reproducible and bias-free approach creates challenges when combining global-change studies to make biome and landscape scale comparisons.

The Fluxible R package aims to fill this critical gap by providing a workflow that removes individual evaluation of each flux, reducing risk of bias, and making it reproducible. Users set specific data quality standards and selection parameters as function arguments that are applied to the entire dataset. The package runs the calculations automatically, without prompting the user to take decisions mid-way, and provides quality flags and graphs at the end of the process for a visual check. This makes it easier to use with large flux datasets and to integrate into a reproducible workflow. Using the Fluxible R package makes the workflow reproducible, increases compatibility across studies, and is more time efficient.

How to cite: Gaudard, J., Telford, R., Vandvik, V., and Halbritter, A. H.: Fluxible: an R package to calculate ecosystem gas fluxes in a reproducible and automated workflow., EGU General Assembly 2024, Vienna, Austria, 14–19 Apr 2024, EGU24-956, https://doi.org/10.5194/egusphere-egu24-956, 2024.

EGU24-1084 | ECS | Orals | AS2.4

Analysis of fog occurrence changes in the Namib Desert across time and space and impacts on natural and artificial fog collection 

Eleonora Forzini, Giulio Castelli, Aida Cuni-Sanchez, and Elena Bresci

In the Namib Desert, along the South-Western African coast, fog represents the main water input for local flora and fauna. During the last years, changes in the timing of fog occurrence and in the quantity of water that can be harvested from it, have been observed in several areas of the world, including the Namib Desert. A deeper insight into fog presence and fog water yield changes can help to understand to what extent Namib Desert’s ecosystem is being and will be affected in future by climate change. This information can also contribute to local environmental protection and carbon dioxide sequestration strategies, as fog water can be used for reforestation and land restoration. An 8-year-long dataset of harvested fog water rates recorded daily in 13 ground stations along the Namib Desert was statistically analysed to inspect advection fog occurrence evolution. The results show a noticeable intra-annual and inter-annual variability in rates and seasonality of harvested fog water. On the other hand, observed trends in collected fog water time series are generally decreasing, but longer time series are required to confirm the trend since El Niño Southern Oscillation (ENSO) phenomenon presence in the analysed period might have had an impact. The main hypothesis is that changes in fog occurrence and its characteristics are due to climate modifications, given that no extensive human activities are present in the area. However, further analyses on fog-related climatic and meteorological factors, possibly including remote sensing or reanalysis datasets aiming to increase the available data timespan, are envisioned to understand to what extent fog collection in the Namib Desert will be affected in future by climate change.

How to cite: Forzini, E., Castelli, G., Cuni-Sanchez, A., and Bresci, E.: Analysis of fog occurrence changes in the Namib Desert across time and space and impacts on natural and artificial fog collection, EGU General Assembly 2024, Vienna, Austria, 14–19 Apr 2024, EGU24-1084, https://doi.org/10.5194/egusphere-egu24-1084, 2024.

The observed surface wind speed (SWS) over China has declined in the past four decades, and recently, the trend has reversed, which is known as SWS stilling and recovery. The observed SWS is vulnerable to changes in nonclimatic factors, i.e., inhomogeneity. Unfortunately, most of the existing studies on the long-term trend of SWS were based on raw datasets without homogenization. In this study, by means of geostrophic wind speed and penalized maximal T test, we conduct a systematic homogeneity test and exploration of the homogenization impact for SWS at over 2,000 stations in China from 1970 to 2017. The results show that the inhomogeneity in the observed SWS over China is detectable at 59% of national weather stations. The breakpoint years are mainly concentrated in the late 1970s, mid-1990s and early 2000s. Overall, 18% of breakpoints are caused by station relocations, and the remaining breakpoints are likely related to anemometer replacement and measurement environment changes that occurred during the mid-1990s and early 2000s. After homogenization, the decreasing trend in SWS during 1970-2017 decreased from -0.15 m/s decade-1 to -0.05 m/s decade-1. The homogenized SWS recovery period advanced from the early 21st century to the early 1990s, which is consistent with the SWS variations, excluding the impact of urbanization around weather stations. The phase change in the Western Hemisphere warm pool (WHWP) might be one of the causes of homogenized SWS recovery.

How to cite: Zhang, Z.: Homogenization of observed surface wind speed based on geostrophic wind theory over China from 1970 to 2017, EGU General Assembly 2024, Vienna, Austria, 14–19 Apr 2024, EGU24-1358, https://doi.org/10.5194/egusphere-egu24-1358, 2024.

EGU24-2642 | Posters on site | AS2.4

Can dry get wetter even if rainfall declines? 

Nurit Agam and Dilia Kool

Drylands are 57% of the terrestrial area of the world, and are disproportionally affected by climate change. This is particularly pertinent in so-called “climate-change hotspots” such as the Mediterranean, where temperature increases at a rate of up to 0.45 oC/decade and precipitation is expected to decline. Given the sparsity of studies in drylands and the consequent lack of understanding of the unique processes in drylands, the degree to which these projections are accurate for drylands is questionable. The fact that drylands, by definition, are classified according to the aridity index, exposes the inherent assumption that desert hydrology is primarily governed by precipitation and potential evapotranspiration (ET0). There is increasing evidence, however, that non-rainfall water inputs (NRWIs; fog, dew, and water vapor adsorption) are a substantial source of water in multiple desert environments. In arid and hyper-arid drylands, water vapor adsorption is not only the least studied of the three NRWIs, but also likely the most common. In the Negev desert, Israel, the projected decrease in rainfall and increase in temperature, and therefore increase in ET0, is expected to result in drier soils. This potentially will increase the amount of water vapor adsorption. Here we present the actual rate of warming and the corresponding changes in ET0 in the Negev desert. We then elucidate, for the first time, the contribution of water vapor adsorption to desert hydrology and how it might be affected by climate change based on changes observed in the last 20 years.

How to cite: Agam, N. and Kool, D.: Can dry get wetter even if rainfall declines?, EGU General Assembly 2024, Vienna, Austria, 14–19 Apr 2024, EGU24-2642, https://doi.org/10.5194/egusphere-egu24-2642, 2024.

EGU24-3967 | Orals | AS2.4

Impact of Subsurface Thermal Anomalies on Air Temperatures in Idealized Scenarios Using PALM-4U 

Patricia Glocke, Christopher C. Holst, Basit A. Khan, and Susanne A. Benz

The impact of underground heat (or cold) sources such as man-made infrastructures or geothermal systems have been extensively studied in geosciences. Soil temperatures near underground parking garages may be up to 10 K warmer than their surroundings. However, the coupling between these temperature anomalies in the soil and the atmosphere as a bottom-up scheme has been neglected so far. We investigated how this scenario can be modeled in the turbulence and building resolving large eddy simulation urban climate model PALM-4U and assessed the impact of modified soil temperatures on air temperatures in an idealized domain. Hereby, the soil temperatures at 2-meter depth were increased and decreased by 5 K, respectively. Multiple scenarios were considered, differentiating between cyclic and Dirichlet/radiation boundary conditions along the x-axis. Further, we ran the simulations under summer and winter conditions, day and night, and three land cover types which are bare soil, short grass, and tall grass. After three days of simulation time, cyclic boundary conditions induced air temperature anomalies due to changes in the subsurface temperature. However, Dirichlet/radiation boundary conditions did not show alterations. Analyzing the cyclic scenarios, although the absolute air temperature was significantly influenced by the landcover, the magnitude of the air temperature anomaly shows little variation. Daytime and seasonality exerted a greater influence on the magnitude. The greatest positive near-surface air temperature anomaly when increasing the soil temperature was 0.38 K for all land cover types and develops during winter between 09:00 and 10:00 CET. Smallest influence was found during summer at 09:00 CET, where increased soil temperatures resulted in a 0.02 K rise over short- and tall grass, and 0.18 K over bare soil. Conversely, decreasing soil temperatures showed predominantly inverse patterns.

The findings contribute to the general comprehension of the coupling of soil- and atmospheric temperatures, inferring also insights of simulating idealized but reality-oriented scenarios in PALM-4U.

How to cite: Glocke, P., Holst, C. C., Khan, B. A., and Benz, S. A.: Impact of Subsurface Thermal Anomalies on Air Temperatures in Idealized Scenarios Using PALM-4U, EGU General Assembly 2024, Vienna, Austria, 14–19 Apr 2024, EGU24-3967, https://doi.org/10.5194/egusphere-egu24-3967, 2024.

EGU24-5207 | Posters on site | AS2.4

Eddy Covariance (EC) measurements in a restored floodplain area at the Morava River in Austria within the EU funded REWET project 

Anna Lindenberger, Magdalena von der Thannen, and Hans Peter Rauch

Although occupying only 7% of the earth's surface, wetlands store 33% of the world's terrestrial carbon. When these ecosystems are drained to be converted into agricultural, forestry or mining exploitations, they release greenhouse gases contributing to climate change. While bringing together 18 partners from 9 countries, the REWET (REstoration of WETlands to minimise emissions and maximise carbon uptake – a strategy for long term climate mitigation) project focuses on determining how the restoration and management of wetlands can be optimised to maximise their carbon uptake while in balance with type-specific natural processes and biodiversity.

The REWET project draws upon a network of seven Open Labs (OLs) located in different geographical areas of Europe and covers different types of terrestrial wetlands: freshwater wetlands, peatlands and floodplains. The heterogeneity of the Open labs allows the application of different restoration methodologies while following the same monitoring plan to provide replicable knowledge.

This paper presents the measurements and the first result of the OL in Austria within the REWET project. The site is a restored and now protected floodplain area at the Morava River. EC measurements are used to calculate the CO2 and CH4 fluxes and the seasonal as well as annual carbon balance of the ecosystem. Furthermore, the effect of floodplain water levels and grazing in this area is investigated. The EC instruments have been set up on a floating platform to allow measurements also during flood events, when understudied, critical transition of GHG fluxes may occur. The CO2/H2O analyser started collecting the first data in the middle of October 2023 whereas the CH4 analyser was added in end of December 2023. Since the CO2 analyser was put on site first flood events occurred end of December, which is the first data to be processed and analysed. Additional to the results the challenges in setting up an EC tower in a floodplain area will be presented.


Funded by the European Union. Views and opinions expressed are however those of the author(s) only and do not necessarily reflect those of the European Union or CINEA. Neither the European Union nor the granting authority can be held responsible for them.

How to cite: Lindenberger, A., von der Thannen, M., and Rauch, H. P.: Eddy Covariance (EC) measurements in a restored floodplain area at the Morava River in Austria within the EU funded REWET project, EGU General Assembly 2024, Vienna, Austria, 14–19 Apr 2024, EGU24-5207, https://doi.org/10.5194/egusphere-egu24-5207, 2024.

EGU24-5340 | ECS | Posters on site | AS2.4

Uncertainty of eddy covariance-derived net ecosystem CO2 exchange over a mountain forest reduced by multiple nighttime filtering approaches 

Alexander Platter, Katharina Scholz, Albin Hammerle, Mathias W. Rotach, and Georg Wohlfahrt

The assessment of net ecosystem CO2 exchange often relies on eddy covariance systems. However, this method overlooks CO2 advection, even if it is often non-negligible. This is especially the case under stable, low-turbulence nighttime conditions. Hence, there is a need to filter nighttime eddy covariance data for periods when advection can be expected to be non-negligible. This study evaluates both well-established and novel filtering methods at a mountain forest site in Tyrol, Austria (Forest-Atmosphere-Interaction-Research (FAIR) site, AT-Mmg). Established methods, including friction velocity (u*) filtering, its counterpart using the standard deviation of vertical velocity  fluctuations (σw) and an after-sunset flux maxima approach (commonly referred to as van Gorsel method) are applied. Additionally we use a more recent approach with a physically-derived measure of flow decoupling for filtering. With this method also stability information is taken into account, not only a turbulence scale, as in the commonly used u* filtering. As often seen in literature, the uncorrected CO2 flux underestimates the nighttime respiration, as it appears for all the filtering methods. Despite being based on widely differing assumptions, the various filtering approaches yielded relatively similar carbon budget estimates over 14 months of measurements (-252 to -290 g C/m2). in contrast to the uncorrected budget of -521 g C/m2.

Furthermore, we introduce a novel K-means clustering approach that groups flow situations into clusters based on vertical profiles of temperature, σw and wind speed. These clusters need then to be evaluated to determine whether they represent a flow situation in which CO2 advection is expected to be irrelevant. Such scenarios are often Foehn periods or early-night situations with high turbulence and low stability. This approach is relatively straightforward to implement, works with an unlimited number of input variables and has the advantage that the identified periods are easy to interpret. This method results in a 14-month budget of -232 g C/m2 for our study site. 

The universality of the clustering method allows not only for an unlimited number of input variables, it can be also easily extended for the entire day. There is no a priori reason not to filter eddy covariance data during the daytime when low-turbulence situations with persistent in-canopy flows may lead to non-negligible advection, especially in complex terrain. We made an attempt of daytime filtering in this study with the clustering method, but also with some adapted versions of the benchmark methods. All of these daytime filtering methods suggest that there is an underestimation of the CO2 uptake in the morning for the uncorrected measurements. Filtering for both nighttime and daytime leads to a range of 14-month budgets of -451 to -359 g C/m².

Further analysis, incorporating different established sites, direct advection measurements or numerical simulations, could be used in future to explore the full potential of the novel clustering approach, especially with its application to daytime flux data.

How to cite: Platter, A., Scholz, K., Hammerle, A., Rotach, M. W., and Wohlfahrt, G.: Uncertainty of eddy covariance-derived net ecosystem CO2 exchange over a mountain forest reduced by multiple nighttime filtering approaches, EGU General Assembly 2024, Vienna, Austria, 14–19 Apr 2024, EGU24-5340, https://doi.org/10.5194/egusphere-egu24-5340, 2024.

EGU24-5597 | ECS | Orals | AS2.4

Investigating forest management's impact on local climate in Fennoscandia through statistical and dynamical modeling 

Bo Huang, Yan Li, Xia Zhang, Chunping Tan, Xiangping Hu, and Francesco Cherubini

The forest plays a crucial role in the land ecosystem, impacting local climates through various biophysical mechanisms. While numerous observational and modeling studies have explored the distinctions between forested and non-forested areas, the impact of forest management on surface temperature has been relatively understudied. This limited attention is attributed to the inherent challenges associated with adapting climate models to effectively account for the complexities of forest structure parameters. Employing a combination of machine learning-based statistical analysis and a regional climate model, along with high-resolution maps detailing various forest compositions and structures, we explore the connection between specific forest management strategies and local temperature variations. The findings reveal a tendency for more developed forests to contribute to higher land surface temperatures compared to younger or less developed ones. Relative to the present state of Fennoscandian forests, an ideal scenario with fully developed forests is found to an annual mean warming of 0.26 ℃ in statistical models, with a range of 0.03 to 0.69 ℃ (5th to 95th percentile). However, the dynamical model indicates an annual average cooling effect of -0.25 °C, ranging from -0.42 to -0.10 °C (5th to 95th percentiles), attributing this difference to the dynamical model's inability to accurately simulate winter warming. Both models project a cooling effect in summer, with statistical and dynamical models showing -0.03 ± 0.22 ℃ and -0.53 ± 0.20 ℃, respectively. Conversely, scenarios involving undeveloped forests result in an annual average cooling of -0.29 ℃ in statistical models, with a range of -0.61 to -0.01 ℃, a slight summer warming of 0.03 ± 0.16 ℃, and a winter cooling of -0.69 ± 0.47 ℃. The dynamical model, however, predicts an annual average warming of 0.28 ± 0.18 °C, a summer warming of 0.53 ± 0.15 °C (mainly driven by increased sensible heat fluxes), and a winter cooling of -0.29 ± 0.25 °C. This study deepens our understanding of how alterations in vegetation impact climate patterns. While our findings shed light on the intricate connections between forest composition and surface temperatures, there's a clear need to refine how regional climate models capture the intricate biophysical mechanisms within forest dynamics. Enhancements in this representation will be crucial for establishing a comprehensive understanding of how forest management practices specifically influence local climate regulation services.

How to cite: Huang, B., Li, Y., Zhang, X., Tan, C., Hu, X., and Cherubini, F.: Investigating forest management's impact on local climate in Fennoscandia through statistical and dynamical modeling, EGU General Assembly 2024, Vienna, Austria, 14–19 Apr 2024, EGU24-5597, https://doi.org/10.5194/egusphere-egu24-5597, 2024.

EGU24-6114 | Orals | AS2.4

Reflect sunlight or use it to store carbon? 

Alexander Graf, Georg Wohlfahrt, Ankur Desai, and the FLUXNET ALBEDO team

In considerations about land management and global climate, biophysical effects like those of albedo are known to modify biochemical effects of greenhouse gas release or uptake. In particular, the cooling effect of afforestation via creation of carbon sinks has been shown to be partly offset by the low albedo and snow-masking effect of tree canopies.

In this presentation, we give a global overview on the relationship between albedo and CO2 uptake (net ecosystem productivity NEP and net biome productivity NBP). We focus on a recent study (Graf et al. 2023, https://doi.org/10.1038/s43247-023-00958-4) and the questions:

(i) Do ecosystems sequestering more CO2 have a lower albedo as a rule?

(ii) How close would such a relation be and how much room does it leave for climate-smart land use?

(iii) Given the different immediacy of albedo and NBP based radiative forcing, are there different mitigation policies to be preferred at different points in time?

To empirically investigate these questions with direct in-situ measurements, we identified 176 FLUXNET stations with sufficient coverage of NEP, incoming and outgoing shortwave radiation and ancillary data. A method to fill gaps in outgoing shortwave radiation and identify snow cover periods was developed and validated against available data and PI-provided snow statistics. 

We found a hyperbola-like decrease in maximum achievable effective (flux-weighted) long-term albedo as NEP increases, and vice versa. Apart from this joint limit, which also applied to non-forest and snow-free sites, the relation scattered strongly, indicating some room for climate-smart land use considering both albedo and carbon sequestration.

A conceptual model based on a paired-site permutation approach showed that maximizing each site’s NEP without considering albedo, leads to albedo-based positive radiative forcing (warming) during the first approximately 20 years, before being offset by an even stronger NBP-based cooling. However, the fact that most sites are currently far below their possible maximum albedo-NEP combination also allows for a balanced scenario in which both parameters are improved simultaneously. It avoids warming on all timescales, but provides less cooling than pure NEP maximization in the long term. We discuss how these timelines would interact with current emission reduction policies, the reasons underlying the relationship and real-world examples of joint NEP and albedo change.

How to cite: Graf, A., Wohlfahrt, G., Desai, A., and team, T. F. A.: Reflect sunlight or use it to store carbon?, EGU General Assembly 2024, Vienna, Austria, 14–19 Apr 2024, EGU24-6114, https://doi.org/10.5194/egusphere-egu24-6114, 2024.

EGU24-6150 | ECS | Posters on site | AS2.4

Investigation of the Vertical Geometry of Low Level Clouds in the Namib Desert 

Deepanshu Malik, Hendrik Andersen, and Jan Cermak

This study comprehensively investigates the vertical geometry of low-level clouds in the Namib desert. Using ceilometer measurements and meteorological station observations, a precise determination of cloud-base height and the separation of low-level stratus and fog is performed.
The Namib Desert, known for hyper-arid conditions and frequent cloudiness, presents an intriguing environment for the study of low-level clouds and their vertical geometry. Fog (ground-touching low-level clouds), a common atmospheric phenomenon in the Namib Desert, is influenced by the interplay of coastal upwelling and spatial temperature differences. Differentiation of fog from other low-level clouds and understanding cloud dynamics are crucial, as fog impacts the water balance in this arid region. Here, ceilometer measurements of cloud base altitude are analyzed and combined with local station measurements with the aim of developing a statistical model to robustly predict cloud base altitude.
Initial results suggest a robust correlation between the cloud base height and surface relative humidity, as well as other meteorological variables. This finding proves beneficial for utilizing meteorological parameters such as the lifted condensation level as a surrogate for cloud-base height. The outcomes of this study hold significance for modeling of satellite-based fog probability product and ecological studies.

How to cite: Malik, D., Andersen, H., and Cermak, J.: Investigation of the Vertical Geometry of Low Level Clouds in the Namib Desert, EGU General Assembly 2024, Vienna, Austria, 14–19 Apr 2024, EGU24-6150, https://doi.org/10.5194/egusphere-egu24-6150, 2024.

EGU24-6590 | ECS | Orals | AS2.4

Continuous, long-term monitoring of soil CO2 concentration and CO2 flux using a novel, low-cost CO2 sensor system 

Thi Thuc Nguyen, Ariel Altman, Nadav Bekin, Nurit Agam, and Elad Levintal

Soil respiration (Fs) datasets often exhibit low temporal-spatial resolution and spatial bias, particularly lacking observations in arid/semi-arid regions. This limitation significantly constrains our understanding of the mechanisms governing soil carbon dynamics and hinders the correct estimation of CO2 emissions at regional to global scales. Challenges in Fs estimation arise mainly from logistical constraints in manual data collection and the high costs of commercial measuring devices. To address this, we developed a low-cost, open-source, autonomous soil CO2 sensor system. The system design emphasized easy adoption and customization for non-engineer end-users, enabling the collection of high-frequency, long-term soil CO2 concentration data, and consequently, Fs estimates. A system including six low-cost CO2 sensors distributed at two soil depths (5 and 10cm) was deployed in the Negev Desert since May 2023. Fs estimates were determined from CO2 concentration gradient using Fick's law (FG) and cross-validated with Fs measured by automated chambers (FC). We found a good agreement between FG and FC both in the short term (i.e., sub-daily fluctuation) and long term (i.e., annual net CO2 emission). Our data also revealed daily and seasonal Fs patterns correlating with environmental factors like temperature and precipitation. The results demonstrate that our system, despite costing less than 10% of automated chamber systems, offers equivalent accuracy in Fs estimates, higher temporal resolution, and potential for enhanced spatial resolution if widely adopted.

How to cite: Nguyen, T. T., Altman, A., Bekin, N., Agam, N., and Levintal, E.: Continuous, long-term monitoring of soil CO2 concentration and CO2 flux using a novel, low-cost CO2 sensor system, EGU General Assembly 2024, Vienna, Austria, 14–19 Apr 2024, EGU24-6590, https://doi.org/10.5194/egusphere-egu24-6590, 2024.

The eddy covariance (EC) method has been widely used to capture the temporal and spatial patterns of nitrous oxide (N2O) emissions from a wide variety of agricultural ecosystems. Technological advancements in the recent years have brought new tunable infrared laser-based closed-path gas analyzers suitable for EC measurements. To achieve high sensitivity and low measurement noise, these analyzers use multi-pass optical cells with long sensing path. A drawback of these cells is the relatively large internal volume requiring high-flow rate, high-power pumps to attain fast response to changes in gas concentration.  Additionally, these cells are prone to contamination and require in-line filters. In this study we evaluate the frequency response of a novel, low-power, field deployable N2O closed-path EC system consisting of: (1) a gas analyzer with a small volume single-pass optical cell, (2) a 3 m sulfonated tetrafluoroethylene ionomer intake tube acting as water vapor permeable membrane to dry the air sample, (3) a cyclone type, non-barrier inertial particle separator (IPS) to mitigate the effects of particulates contamination of the optical sample cell, and (4) a small, low-power pump module with an automatic pressure and flow control. The performance of the new N2O EC system is evaluated in-situ 3 m above a fertilized agricultural wheat field and compared to a co-located fast-response H2O and CO2 open-path gas analyzer and sonic anemometer (IRGASON). Tube delays, determined by cross-covariance of N2O with vertical wind, were consistent over time and varied between 0.2 and 0.5 s. Spectral and co-spectral analysis of vertical wind, temperature, H2O, CO2 and N2O showed good agreement. Ogive functions demonstrated that the new system has adequate frequency response to capture >90% of the N2O fluxes for a wide range of wind speeds and atmospheric stabilities and is suitable for deployment in remote areas.

How to cite: Bogoev, I.: Frequency Response Evaluation of a Low-power Closed-path Eddy Covariance System for Measuring Nitrous Oxide Fluxes, EGU General Assembly 2024, Vienna, Austria, 14–19 Apr 2024, EGU24-6604, https://doi.org/10.5194/egusphere-egu24-6604, 2024.

EGU24-7308 | ECS | Posters on site | AS2.4

Role of vegetation and soil-induced effects of microclimate on non-rainfall water inputs 

Jannis Groh, Thomas Pütz, Daniel Beysens, Harry Vereecken, and Wulf Amelung

Precipitation (i.e. rain, snow, hail) is the main form of water input to our ecosystem. However, depending on local climatic conditions, a significant amount of water can also be produced by various fractions of non-rainfall water inputs (NRWIs), namely dew, hoar-frost, rime, fog, and adsorption of water vapour in the soil. Such NRWIs are often neglected because they are typically small compared to daily rainfall. However, these NRWIs provide our ecosystems with additional water, which is important for the survival of the fauna and flora in the ecosystem, especially during drier periods.

Although NRWIs are understood in principle, much remains to be learnt about their precise determination at the ecosystem level, their spatial and temporal distribution, and their ecological function for the ecosystem. We present a conceptual measurement setup that allows us to determine each non-rainfall water component for natural and extensive grasslands as well as for agricultural ecosystems. Our results for the experimental site Selhausen (Germany, TERENO-SOILCan) show that i) the main part of NRWI comes from dew formation, ii) the rate and frequency of dew formation differs significantly between vegetation types under similar atmospheric boundary conditions, and iii) the drivers of dew formation during a dry down period differ between ecosystems (grassland and arable land). A better understanding of these vegetation and soil-dependent effects will help us to better predict dew formation processes in our ecosystems in the future.

How to cite: Groh, J., Pütz, T., Beysens, D., Vereecken, H., and Amelung, W.: Role of vegetation and soil-induced effects of microclimate on non-rainfall water inputs, EGU General Assembly 2024, Vienna, Austria, 14–19 Apr 2024, EGU24-7308, https://doi.org/10.5194/egusphere-egu24-7308, 2024.

EGU24-7892 | Posters on site | AS2.4

Simultaneous trace gas flux monitoring of 10 greenhouse gases and air pollutants with a single instrument 

Morten Hundt, Marco Brunner, Jonas Bruckhuisen, and Oleg Aseev

Monitoring of trace and greenhouse gas fluxes is key to understand the interaction between atmosphere, plants, and soil and therefore to improving our understanding of the climate system in general.

Complex flux systems, in environments where both biogenic and anthropogenic sources and sinks play a role, require measurement of many different inert and reactive trace gases and greenhouse gases simultaneously to obtain a complete budget.

Until recently, however, the monitoring was usually limited to only a few gases per measurement device making the technique complex and expensive but providing only a limited picture. MIRO Analytical has developed a novel multicompound gas analyzer that can monitor up to 10 air pollutants (CO, NO, NO2, O3, SO2 and NH3), greenhouse gases (CO2, N2O, H2O and CH4) and other atmospheric trace gases such as (OCS, HONO, CH2O) simultaneously at ppb level.

The eddy covariance (eddy flux) technique is often used to measure fluxes of trace gases but requires a high time resolution. Our compact instrument, combing several mid-infrared lasers (QCLs), offers 10 Hz sampling rate, outstanding precision, selectivity and accuracy and an automatic water vapor correction, which makes it ideal for eddy covariance flux measurements.

In our contribution, we will introduce the measurement technique and will demonstrate application examples of this all-in-one atmospheric flux monitor. The system will be compared to alternative devices in parallel measurements and results of long-term observations and shorter campaigns will be presented.

How to cite: Hundt, M., Brunner, M., Bruckhuisen, J., and Aseev, O.: Simultaneous trace gas flux monitoring of 10 greenhouse gases and air pollutants with a single instrument, EGU General Assembly 2024, Vienna, Austria, 14–19 Apr 2024, EGU24-7892, https://doi.org/10.5194/egusphere-egu24-7892, 2024.

Atmospheric fluxes near the surface are key metrics for understanding the interactions between the biosphere and the atmosphere. There is an increasing demand for highly accurate flux measurements for species where fast-response analytical techniques are not available. This includes, among others, stable isotopes, oxygen, ammonia, nitrogen compounds, and bio-aerosols.

Here we introduce quantized eddy accumulation with error diffusion, a new easy-to-implement, high-accuracy eddy accumulation method that is compatible with slow-response analytical techniques. Similar to relaxed eddy accumulation, this method involves sampling air at a constant flow rate and directing it into one of two containers, depending on the vertical wind velocity. The flux is then calculated based on accumulated concentration averages over the flux averaging interval. However, unlike relaxed eddy accumulation, the new method is a direct method that does not require the empirical coefficient β. These developments were made possible by developing a new representation of conditional sampling at a constant flow rate as a quantization process of vertical wind velocity. Fluxes estimated with relaxed eddy accumulation were found to be biased due to sub-optimal quantization. To account for these errors, an error diffusion algorithm was developed, which made it possible to minimize the biases inherent in the quantization process, thereby allowing for accurate and direct flux estimates.

Quantized eddy accumulation with error diffusion is shown to achieve direct flux measurements with errors smaller than 0.1% of the reference eddy covariance flux. Additionally, this method enables an increase in the concentration difference in accumulated samples between updrafts and downdrafts without compromising accuracy, making it especially suitable for detecting smaller fluxes. It also provides improved accumulation volume dynamics, flexible accumulation intervals, and is less prone to errors from non-zero vertical wind velocities.

These new developments are especially useful for measuring small fluxes of elusive atmospheric constituents, particularly in the presence of measurement challenges such as instrument drift or frequency attenuation. A notable application is the accurate measurement of water stable isotopes, which enables the tracing of biological processes and the accurate partitioning of measured fluxes.

How to cite: Emad, A.: Quantized eddy accumulation with error diffusion: a new direct micrometeorological technique with minimal requirements, EGU General Assembly 2024, Vienna, Austria, 14–19 Apr 2024, EGU24-8926, https://doi.org/10.5194/egusphere-egu24-8926, 2024.

Automated Solution for Discrete Gas Sample Analyses with
Picarro G2508 and SAM Autosampler
Jan Woźniak1, Joyeeta Bhattacharya2, Magdalena E. G. Hofmann1, Frank Krijnen3, Guillermo Hernandez
Ramirez4
1Picarro B.V., Eindhoven, The Netherlands, 2Picarro Inc., Santa Clara, USA; 3University of Saskatchewan; 4University of Alberta

Abstract
Greenhouse gas research community has witnessed an ever-increasing need for automated
solutions for measuring greenhouse gas concentrations in small discrete gas samples. However,
traditional solutions like gas chromatographs often incur high initial and maintenance costs or are
complicated to deploy and maintain, and almost impossible to work with in the field. There has
been a rising interest in the SAM autosampler (www.openautosampler.com) which so far has
been utilized mostly for isotopic measurements of greenhouse gases (e.g., isotopic CO2/CH4), in
conjunction with low flow Picarro analyzers (<50 mL/min). In this report, we demonstrate the
compatibility, efficiency, and advantages of the SAM autosampler with Picarro Greenhouse Gas
(GHG) Concentration analyzers like the G2508 multi species gas analyzer, with much higher flow
rates (>200 mL/min). The results of our experiments show excellent precision and accuracy for
discrete CH4, CO2 and N2O gas measurements. Also, we have been able to determine linearity in
dilution factors and characterized memory effects and its variability in different gas species (e.g.,
comparing CO2 vs N2O). This report also provides recommendations on the methods and best
practices for discrete gas sample measurements. In summary, the Picarro G2508 (or other GHG
analyzers) in conjunction with SAM Autosampler offers an attractive, cost-effective, and simpler
alternative to gas chromatograph or similar available solutions

How to cite: Wozniak, J.: Automated Solution for Discrete Gas Sample Analyses withPicarro G2508 and SAM Autosampler, EGU General Assembly 2024, Vienna, Austria, 14–19 Apr 2024, EGU24-9193, https://doi.org/10.5194/egusphere-egu24-9193, 2024.

EGU24-9231 | ECS | Orals | AS2.4

Constructing a comprehensive numerical experiment to study biospheric-atmospheric feedbacks driving dry season cloud formation over the Amazon Basin  

Vincent de Feiter, Sebastiaan de Haas, Jordi Vilà-Guerau de Arellano, Raquel González Armas, Daniël Rikkers, Guido Haytzmann, Martin Janssens, Oscar Hartogensis, Imme Benedict, Luiz Machado, and Cléo Quaresma

The Amazonian hydrological and carbon cycle are controlled by a complex, interconnected and interdependent myriad of surface and atmospheric processes. Improving our understanding and numerical representation of these cycles under a changing climate requires a deeper exploration of the biospheric-atmospheric coupling and the processes governing the formation and deepening of shallow cumulus clouds. Utilising a comprehensive set of surface and upper-air atmospheric measurements from the CloudRoots-Amazon22 campaign alongside an integrated hierarchy of models, we construct a numerical experiment to systematically study these processes throughout the dry season of 2022. The model hierarchy consists of a large eddy simulation resolving turbulence and shallow cumulus formation, a coupled rainforest-atmosphere mixed-layer model to map the sensitivity to surface and atmospheric observations and a moisture tracking model to identify and quantify moisture sources, sinks, and long-range transport. Individual days of observations were characterised into representative shallow convective and shallow-to-deep convective regimes. We accurately replicated the evolution of radiation and the asymmetrical exchange fluxes of energy, momentum, moisture, and carbon during the shallow convective regime. By analysing the diurnal variability of the state variables, we can determine how turbulent mixing controls the morning transition, from strong gradients to well-mixed conditions above the forest. Ongoing work involves improving the representation of in-canopy processes and simulating the shallow-to-deep convective regime by introducing thermodynamic forcings, such as moist air intrusion or increased wind sheared conditions, on the shallow convective experiment.  

How to cite: de Feiter, V., de Haas, S., Vilà-Guerau de Arellano, J., González Armas, R., Rikkers, D., Haytzmann, G., Janssens, M., Hartogensis, O., Benedict, I., Machado, L., and Quaresma, C.: Constructing a comprehensive numerical experiment to study biospheric-atmospheric feedbacks driving dry season cloud formation over the Amazon Basin , EGU General Assembly 2024, Vienna, Austria, 14–19 Apr 2024, EGU24-9231, https://doi.org/10.5194/egusphere-egu24-9231, 2024.

EGU24-9320 | ECS | Orals | AS2.4

Water and Carbon Dioxide Interactions in the most unlikely places: The hidden dynamics of the Sahara Desert soils 

Nadav Bekin, Dennis Ashilenje, Abdelghani Chehbouni, Lhoussaine Bouchaou, Lamfeddal Kouisni, Dilia Kool, and Nurit Agam

Soil CO2 efflux is primarily attributed to the metabolic activity of soil organisms and is a major component of the global carbon balance. The carbon balance of deserts, such as the Sahara Desert, the largest desert on Earth, is considered neutral as low soil moisture inhibits biological activity and reduces the soil CO2 efflux to its lower limit. Studies in the last decades challenge this paradigm, reporting a mysterious nocturnal CO2 uptake by desert soils, which in some cases leads to a net gain of carbon by the soil. While the factors controlling this phenomenon are still under debate, it is clear that the presence of water is essential. How, then, can nocturnal CO2 uptake occur in the driest soil conditions when no apparent water is available to drive the process? We embarked on a field expedition in the Sahara Desert, southwest Morocco, during the summer of 2022 to explore the dynamics of water and carbon in this presumably “stagnant” ecosystem. We discovered nocturnal water vapor adsorption, driven by atmospheric water vapor transported from the Atlantic Ocean and penetrating hundreds of kilometers inland where the vapor is captured in the soil’s top layer. Changes in soil water content were determined from soil relative humidity (measured using a profile of relative humidity sensors) and soil-specific vapor sorption isotherms (measured using a vapor sorption analyzer). With this novel method, we were able to detect a daily increase of 0.3 mm of water even at a distance of 250 km from the Ocean. Concurrent measurements of CO2 fluxes (measured using manual and automatic flux chamber systems), confirmed that small atmosphere-to-soil CO2 fluxes occurred during the night, coinciding with downward water vapor fluxes. This indicates that the atmosphere provides a consistent water source and may initiate soil CO2 uptake. Simultaneous measurements of water vapor and CO2 fluxes at a second site suggested that the quality of the correlation between the two fluxes depends on soil properties. Overall, the daily CO2 cycle was unbalanced (net uptake of 0.08 g m-2) implying that the soil acted as a carbon sink. This sink is small, but considering its occurrence even in inland desert ecosystems and the fact that arid and hyper-arid regions occupy 26% of Earth’s terrestrial surface, the effect of atmospheric water capture by desert soils on CO2 exchange may play a significantly larger role in the global carbon balance than previously thought. 

How to cite: Bekin, N., Ashilenje, D., Chehbouni, A., Bouchaou, L., Kouisni, L., Kool, D., and Agam, N.: Water and Carbon Dioxide Interactions in the most unlikely places: The hidden dynamics of the Sahara Desert soils, EGU General Assembly 2024, Vienna, Austria, 14–19 Apr 2024, EGU24-9320, https://doi.org/10.5194/egusphere-egu24-9320, 2024.

EGU24-9627 | ECS | Orals | AS2.4

Increased spatial replication above heterogeneous agroforestry improves the representativity of eddy covariance measurements 

José Ángel Callejas Rodelas, Alexander Knohl, Ivan Mammarella, Timo Vesala, Olli Peltola, and Christian Markwitz

Eddy covariance (EC) studies typically involve the use of one or maximum two measuring towers, which leads to a low level of spatial replication, compromising the statistical representativity of EC measurements, especially above highly heterogeneous ecosystems, such as agroforestry systems. Lower-cost eddy covariance setups (LC-EC) represent a potential solution to this problem, since their affordability allows for the installation of multiple EC towers to study heterogeneity at the landscape scale. In the last years, several LC-EC setups have been successfully validated against conventional EC setups (CON-EC), with the main difference being the use of slower gas analyzers. These introduce a higher uncertainty due to the enhanced high-frequency spectral attenuation in the turbulent energy spectrum.

In this study, we analyzed turbulent fluxes of CO2 and H2O and turbulence characteristics measured by three flux towers equipped with LC-EC setups above one agroforestry system located in Wendhausen, Germany. The agroforestry system was a Short Rotation Alley Cropping (SRAC) system, consisting of alternating rows of trees and crops. The three flux towers were installed at different North-South aligned tree stripes. Additionally, we compared the results of the three LC-EC setups above the SRAC with another LC-EC setup installed at an adjacent monocropping (MC) field.

The objectives of the study were: (i) to evaluate the spatial variability of EC fluxes from the three flux towers above the SRAC system; (ii) to compare the variability of fluxes within the SRAC to the variability of fluxes between SRAC and MC; (iii) to quantify whether the use of several LC-EC setups counteracts the higher uncertainty associated to LC-EC, due to the increased statistical robustness of the measurement network compared to the hypothetical use of just one EC station.

The highest spatial variability across the SRAC was measured for CO2 fluxes, followed by latent heat (LE) flux, with coefficients of variation, calculated following Oren et al. (2006) (https://doi.org/10.1111/j.1365-2486.2006.01131.x), of 2.3 and 1.4 (dimensionless), respectively. The spatial variability in CO2 and LE fluxes within the SRAC was similar to the variability between MC and SRAC, and was attributed to the different land cover types around the towers. On the other hand, the spatial variability in sensible heat flux (H), momentum flux and turbulence characteristics (such as friction velocity and variance of vertical wind speed), within the SRAC, was smaller than the variability between SRAC and MC, likely explained by the development of an internal boundary layer (IBL) above the SRAC.

Our results show that the heterogeneity of the SRAC, despite not affecting significantly the turbulence characteristics across the site, leads to a large spatial variation in CO2 and LE fluxes. Therefore, a distributed network of several EC systems is necessary to properly quantify patterns and drivers of CO2 and latent heat fluxes above such heterogeneous land-use systems.

How to cite: Callejas Rodelas, J. Á., Knohl, A., Mammarella, I., Vesala, T., Peltola, O., and Markwitz, C.: Increased spatial replication above heterogeneous agroforestry improves the representativity of eddy covariance measurements, EGU General Assembly 2024, Vienna, Austria, 14–19 Apr 2024, EGU24-9627, https://doi.org/10.5194/egusphere-egu24-9627, 2024.

EGU24-9790 | ECS | Posters on site | AS2.4

Turbulence generation by unresolved orography 

Shreyas Deshpande and Cedrick Ansorge

Slope flows, resulting from the interplay between buoyancy and gravitational forces, are well-known to govern a plethora of local weather phenomena. In particular, orographic features and the associated surface roughness can induce turbulent mixing in the planetary boundary layer. While orographic drag models have been proposed to understand the effects of turbulence and waves due to orography, numerical simulations locally rely on closures based on the Monin-Obukhov Similarity Theory. The validity of these models and their interaction regarding turbulence production due to orography at unresolved scales is questionable. We study the turbulence generation by small-scale orography under the influence of stable stratification and weak mixing. To bypass the common complications with surface modeling, we use direct numerical simulation featuring a shallow valley to study the problem at a reduced scale. To imitate the intricate boundary conditions, an Immersed Boundary Method is used that features fully resolved three-dimensional roughness elements in the form of a local valley. However, modeling such flows also poses challenges due to the numerous parameters governing the triggering of turbulence. In this presentation, we introduce a scaling framework orographic for the problem and a viable numerical set-up along with the first results from preliminary studies at intermediate scale separation.

* This work is funded by the ERC Starting Grant ”Turbulence-Resolving Approaches of the Intermittently Turbulent Atmospheric Boundary Layer [trainABL]” of the European Research Council (funding ID 851347).

How to cite: Deshpande, S. and Ansorge, C.: Turbulence generation by unresolved orography, EGU General Assembly 2024, Vienna, Austria, 14–19 Apr 2024, EGU24-9790, https://doi.org/10.5194/egusphere-egu24-9790, 2024.

Atmospheric flows virtually always occur over rough surfaces, which enhances the drag, mixing and vertical transport of pollutants and moisture in the atmospheric boundary layer (ABL). During nighttime, when the absence of solar radiation leads to surface cooling, a stratified surface layer forms, and turbulence decreases in intensity and spatial extent, giving rise to large-scale intermittency. Roughness is known to counteract the buoyancy-induced reduction of turbulence in the stable regime by an increase of mixing, but the effects are lumped together in surface-layer similarity. To investigate the interaction of surface roughness and stable density stratification in the ABL at the process level, direct numerical simulation (DNS) of rough turbulent Ekman flow at Reynolds numbers well within the turbulent regime and for large domains is performed. Roughness is represented by an array of 56×56 roughness elements with a uniform width and height distribution on the lower wall. This small-scale three-dimensional surface roughness is fully resolved with an immersed boundary method (IBM) and has a packing density of 10%. For neutral stratification, we have obtained data in the transitionally rough regime and at the verge of the fully rough regime. Starting from the roughest neutral case with z0+≈2, stable stratification is gradually increased with a constant-temperature (Dirichlet) boundary condition. The focus of this study is the direct effect of roughness on the stability regime, the rough-wall scaling in the logarithmic layer and the scaling for the roughness parameters z-nought for momentum and temperature, which is crucial for the Monin–Obukhov similarity theory.


* This work is funded by the ERC Starting Grant ”Turbulence-Resolving Approaches of the Intermittently Turbulent Atmospheric Boundary Layer [trainABL]” of the European Research Council (funding ID 851347). Simulations were performed on the resources of the High-Performance Computing Center Stuttgart (HLRS) on the Hawk cluster. The computing time and storage facilities were provided by the project trainABL with the project number 44187.

How to cite: Kostelecky, J. and Ansorge, C.: Simulation and scaling analysis of small-scale roughness in neutrally and stably stratified turbulent Ekman flow, EGU General Assembly 2024, Vienna, Austria, 14–19 Apr 2024, EGU24-10016, https://doi.org/10.5194/egusphere-egu24-10016, 2024.

EGU24-10102 | Orals | AS2.4

The Land-Atmosphere Feedback Initiative 

Volker Wulfmeyer and the The LAFI Team

The quality of weather forecasts, seasonal simulations, and climate projections depends critically on the adequate representation of land-atmosphere (L-A) feedbacks. These feedbacks are the result of a highly complex network of processes and variables related to the exchange of momentum, energy, and mass. Significant challenges persist in understanding processes and feedbacks, which this initiative will address.

The Land-Atmosphere Feedback Initiative (LAFI) is an interdisciplinary consortium of researchers from atmospheric, agricultural, and soil sciences as well as from bio-geophysics, hydrology, and neuroinformatics proposing a novel combination of advanced research methods. The overarching goal of LAFI is to understand and quantify L-A feedbacks via unique synergistic observations and model simulations from the micro-gamma (» 2 m) to the meso-gamma (» 2 km) scales across diurnal to seasonal time scales.

LAFI consists of a network of closely intertwined projects addressing six research challenges formulated as objectives and hypotheses on 1) alternative similarity theories, 2) the impact of land-surface heterogeneity, 3) partitioning evapotranspiration, 4) understanding entrainment, 5) synergistic characterization of L-A feedback, and 6) droughts or heatwaves potentially investigated by ad-hoc field observations. Collaboration across the twelve projects will be fostered by three Cross Cutting Working Groups on Deep Learning, Sensor Synergy and Upscaling, as well as the LAFI Multi-model Experiment.

In this presentation, an overview of the LAFI research approach is given with particularly emphasis of the synergy of observations and modeling efforts substantiated by first results from the Land-Atmosphere Feedback Observatory (LAFO) at the University of Hohenheim in Stuttgart, Germany.

How to cite: Wulfmeyer, V. and the The LAFI Team: The Land-Atmosphere Feedback Initiative, EGU General Assembly 2024, Vienna, Austria, 14–19 Apr 2024, EGU24-10102, https://doi.org/10.5194/egusphere-egu24-10102, 2024.

EGU24-10295 | ECS | Posters on site | AS2.4

Exploring Nocturnal Canopy Advection in Complex Terrain Through Active Heating Fiber Optics: Unraveling Temperature Dynamics and Airflow Patterns 

Yi Fan Li, Kuo Fong Ma, Chin Jen Lin, Yen Jen Lai, Po Hsiung Lin, and Taro Nakai

Nocturnal advection significantly influences the accurate estimation of net ecosystem exchange (NEE). This phenomenon is prevalent in Taiwan's subtropical montane forests, introducing a potential bias when relying solely on eddy covariance data for carbon budget calculations. From the preliminary analysis, the wind speed can be well estimated through the temperature difference between the heated and unheated fiber optical.The derived five-minute average wind speed exhibits a high coefficient of determination (R^2) of up to 0.94.

In the current study, a fiber observational setup consisting of a 40m vertical section and a 90m horizontal section has been implemented to investigate temperature dynamics and airflow in complex terrain. The wind speed profile can be well reflected from the preliminary data analysis. Insights gained through this approach contribute to a better understanding of the nocturnal canopy advection model, offering valuable corrections to NEE estimates.

How to cite: Li, Y. F., Ma, K. F., Lin, C. J., Lai, Y. J., Lin, P. H., and Nakai, T.: Exploring Nocturnal Canopy Advection in Complex Terrain Through Active Heating Fiber Optics: Unraveling Temperature Dynamics and Airflow Patterns, EGU General Assembly 2024, Vienna, Austria, 14–19 Apr 2024, EGU24-10295, https://doi.org/10.5194/egusphere-egu24-10295, 2024.

EGU24-11109 | ECS | Orals | AS2.4

Time-scale turbulent transport extraction and high time resolution flux estimation using wavelet analysis 

Gabriel Destouet, Nikola Besic, Emilie Joetzjer, and Matthias Cuntz

Flux estimation from eddy-covariance flux tower measurements faces the problem of integrating fluxes only in the case of fully developed turbulence and in non-stationary environments with advective components. The standard eddy-covariance method operates on fixed-length signals, requiring the knowledge of a maximum correlation time-length as well as post-processing steps assessing the suitability and quality of the data. Statistical tests are carried out to assess if flux estimates were performed during sufficiently developed turbulence and if they were corrupted by advective components. Tests with friction velocity u* or σw, steady-state tests, and flux variance similarity are now standard during and after flux calculations. More elaborate methods such as ogive optimisation are used to deal with advection. An important disadvantage of all these statistical tests is that they discard the whole time interval such as half an hour if they detect failure.

Time-scale (time-frequency) analyses have been used as an alternative to the standard time-analysis approach to estimate ecosystem fluxes. In particular, wavelet analysis, which is well adapted to the study of non-stationary and scale invariant processes such as turbulence, has been used in previous works. It presents the ability of separating the different components of the flux in time-scale space and as such could be an efficient alternative for flux estimation avoiding the above statistical tests.

To address this problem, we propose a general framework for analysing fluxes in time-scale space, and propose a new method for identifying and extracting turbulent transport that avoids advective components and does not need statistical tests after the flux calculations. The new method is based on the analysis in time-scale domain of the amplitude of the vertical component of the Reynold stress tensor and can be seen as a time-scale transposition of standard tests mentioned above. As a direct consequence, we are able to estimate fluxes at high time resolution over times and scales with sufficiently developed turbulence. We show application of the framework at the beech forest site FR-Hes and demonstrate its relation with standard eddy covariance calculations. Our methodology is implemented in the Julia package TurbulenceFlux.jl and is readily available. The proposed framework and its code implementation is fully differentiable and hints to further investigations, such as the study of flux ecosystem response times, or sensitivity analysis against wavelet and averaging window parameters.

How to cite: Destouet, G., Besic, N., Joetzjer, E., and Cuntz, M.: Time-scale turbulent transport extraction and high time resolution flux estimation using wavelet analysis, EGU General Assembly 2024, Vienna, Austria, 14–19 Apr 2024, EGU24-11109, https://doi.org/10.5194/egusphere-egu24-11109, 2024.

EGU24-12298 | Posters on site | AS2.4

The dynamics of water vapor  absorption by soils typical of arid lands 

Pedro Berliner, Mercy Ama Boadi Manu, Dillia Kool, and Nurit Agam

Water vapor adsorption (WVA), a non-rainfall water input, is a poorly documented phenomenon despite its role in regulating water and energy fluxes in soils of coastal deserts. Water vapor movement towards the soil surface and its absorption by the soil occurs whenever the atmospheric water potential is higher than that of the air-filled soil pores. The latter is influenced by soil characteristics, in particular the soil surface area and pore connectivity. Thus, it is expected that under similar atmospheric conditions,  absorption of water vapor will be determined by soil characteristics. We carried out a detailed field trial in which we compared two loamy soils with different salt content.

Water vapor absorption was measured using micro-lysimeters (MLs) instrumented with relative humidity (RH) and temperature sensors at depths 0.5cm, 2cm, 5cm, 10cm, and 45cm in both MLs during the 2022 and 2023 summers. Total absorption was determined as the increase in mass from a minimum (obtained during late afternoon) to a peak observed on the next day before sunrise. Concurrent changes in soil water potential at each depth were computed by applying the Kelvin equation.

Relative humidity in both soils was low during the entire season with the average computed water potential values being lower in the high salt content soil. The total daily water vapor absorption was lower in the low salt content soil, and the rate of absorption was different . The temperature and RH distribution patterns with depth also differed consistently throughout the measuring season for both soils. The effect of salt on water vapor absorption will be highlighted.

How to cite: Berliner, P., Boadi Manu, M. A., Kool, D., and Agam, N.: The dynamics of water vapor  absorption by soils typical of arid lands, EGU General Assembly 2024, Vienna, Austria, 14–19 Apr 2024, EGU24-12298, https://doi.org/10.5194/egusphere-egu24-12298, 2024.

EGU24-13667 | Orals | AS2.4

Deployment of Doppler lidar within forests: Advancing our understanding of canopy-atmospheric boundary layer processes  

Sonia Wharton, Matteo Puccioni, Holly Oldroyd, Matthew Miksch, Matthias Falk, Stephan de Wekker, Robert Arthur, and Jerome Fast

The atmospheric boundary layer above forest canopies is difficult to measure in practice, and our understanding of its flow physics usually is still limited to tall tower measurements which have limited reach above the canopy, or vertically-profiling remote sensing measurements which are usually taken outside of the canopy. We present a recent 5-month study of wind flow measurements taken above a 50-m tall forest in Washington state, USA, using two Doppler lidars. One vertical-profiling lidar was placed directly on top of the 70-m tall Wind River National Ecological Observatory Network (NEON) tower and took measurements of wind velocity, direction and turbulence up to 220 m above ground level. A scanning lidar was placed in a nearby clearing and programmed to scan the wind field over the forest canopy, including overlapping its scans with the profiling lidar on top of the tower. The scanning lidar also captured terrain induced flows across the surrounding mountain-valley terrain. Both lidars captured wind jets and periods of intermittent turbulence over the forest canopy. How and when these mechanically-forced turbulence events penetrate the high leaf area index (LAI) forest canopy are studied using NEON’s eddy covariance flux exchange measurements and the tower profile measurements of air temperature, pressure, moisture, and wind velocity within the forest.


Applications of studying wind flow over the forest canopy are broad and vary from a better characterization of the wind profile for wind energy resource assessment to improving our understanding of vertical exchange processes by studying how “top-down” forced turbulence events influence mass and energy fluxes between the forest canopy and atmosphere. Special consideration of how above canopy processes influence canopy coupling/decoupling, including top-down turbulent sweep events, will be presented for the tall Wind River forest. We will also discuss upcoming experiments including 1) the deployment of 3-d sonic anemometers in the Wind River subcanopy (as part of a larger Integrated Carbon Observation System (ICOS) below-canopy study) to advance our understanding of canopy mixing processes and 2) a new campaign planned for the deciduous Mountain Lake Biological Station NEON tower in the mountains of Virginia, USA. The latter study is designed to observe changes in the above-canopy wind profile and its interactions with below-canopy flows and vertical flux exchanges across a summer-to-winter LAI transition.


How to cite: Wharton, S., Puccioni, M., Oldroyd, H., Miksch, M., Falk, M., de Wekker, S., Arthur, R., and Fast, J.: Deployment of Doppler lidar within forests: Advancing our understanding of canopy-atmospheric boundary layer processes , EGU General Assembly 2024, Vienna, Austria, 14–19 Apr 2024, EGU24-13667, https://doi.org/10.5194/egusphere-egu24-13667, 2024.

EGU24-14868 | Orals | AS2.4

Mapping soil moisture uptake by dry soils across Eddy covariance measurement sites 

Sinikka Paulus, Rene Orth, Sung-Ching Lee, Jacob A. Nelson, Anke Hildebrandt, Ngoc Nguyen, Markus Reichstein, and Mirco Migliavacca

Soils take up water vapor from the atmosphere through processes that involve vapor diffusion and water retention. This can theoretically occur in any ecosystem under the preconditions of a humid atmosphere and dry soil pores. It can play a critical role in dry ecosystems because it can provide a substantial proportion of the total water inputs at the daily timescale. However, it remains insufficiently investigated in many regions, partly due to the absence of continuous, dedicated measurements.

In this study, we use a recently developed algorithm to detect and filter Eddy Covariance (EC) derived negative latent heat flux data collected at semi-arid and arid sites to identify soil water vapor adsorption. In a previous study, we successfully used EC data to detect soil water vapor adsorption for a Mediterranean ecosystem. 

Our findings indicate that these negative latent heat fluxes exhibit a correlation with soil water content and relative humidity at various sites suggesting that a part of the negative latent heat flux is related to soil water vapor adsorption. Building on these findings, we demonstrate that soil water vapor adsorption occurs during the dry season in various ecosystems, including woody savannas, grasslands, shrublands, and even some forests. The flux magnitude reaches values comparable to daily evaporation, which is in line with existing literature on the few previously measured ecosystems.

Furthermore, we analyze the drivers of the occurrence and dynamics of soil water vapor across sites. Thereby we study the influence of e.g. soil texture or vegetation height. This way, our study expands our knowledge of the spatial extent and inter-annual dynamics of soil water vapor adsorption in natural ecosystems and, more generally, sheds light on a mostly overlooked aspect of land-atmosphere interaction.

How to cite: Paulus, S., Orth, R., Lee, S.-C., Nelson, J. A., Hildebrandt, A., Nguyen, N., Reichstein, M., and Migliavacca, M.: Mapping soil moisture uptake by dry soils across Eddy covariance measurement sites, EGU General Assembly 2024, Vienna, Austria, 14–19 Apr 2024, EGU24-14868, https://doi.org/10.5194/egusphere-egu24-14868, 2024.

EGU24-15005 | Posters on site | AS2.4

Climatology of surface parameters for the city of Turin using UTOPIA (Italy) land surface model 

Claudio Cassardo, Valentina Andreoli, Davide Bertoni, Sujeong Lim, Massimiliano Manfrin, and Seon K. Park

While there are several series of daily observations of temperature, precipitation and few other parameters available in many locations in the world, sometimes lasting more than a century, there are much less series of other variables related to the surfae atmospheric layer or underground soil, such as sensible and latent heat fluxes, soil heat flux, soil temperature and moisture in the root layer and below it. This work aims to propose a method to evaluate such parameters at a climatic time scale using a trusted land surface model, taking the variables from the outputs of the simulation and creating a database. In this work, the selected model is the UTOPIA (University of TOrino land surface Process Interaction model in Atmosphere). This technique can be applied in general to each site in which hourly observations of the seven parameters needed for the simulation are available (temperature, humidity, pressure, the two components of the horizontal wind velocity, precipitation and solar radiation or cloudiness). In a preliminary phase, the database will be created on the period 1992-2023, on which we have the availability of hourly measurements carried out at the Department of Physics of the Turin University. In a second phase, we plan to develop a methodology to derive hourly observtions from the existing series of data gathered in the city of Turin, using peculiar methods to interpolate or extrapolate the missing observations of required inputs and to downscale hourly observations from daily observations. This methodology could be tested using the eisting data in the recent climate period.

How to cite: Cassardo, C., Andreoli, V., Bertoni, D., Lim, S., Manfrin, M., and Park, S. K.: Climatology of surface parameters for the city of Turin using UTOPIA (Italy) land surface model, EGU General Assembly 2024, Vienna, Austria, 14–19 Apr 2024, EGU24-15005, https://doi.org/10.5194/egusphere-egu24-15005, 2024.

EGU24-15582 | ECS | Posters on site | AS2.4

A satellite-based analysis of fog and low stratus life cycle processes in the Po valley, Italy 

Eva Pauli, Jan Cermak, Hendrik Andersen, and Michaela Schütz

A better understanding of fog and low stratus (FLS) life cycle processes can help traffic safety, improve solar power planning and enhance the understanding of ecosystem processes in fog-prone regions. Nevertheless, large-scale analyses of FLS life cycle processes are challenging due to the high spatial variability of FLS and complex interactions between the land surface and the atmosphere.

Here, we use a satellite-based FLS formation and dissipation time data set, as well as reanalysis data to investigate regional variations in the FLS life cycle in the Po valley region in northern Italy. With its large spatial extent, relatively low topographic variability and high FLS occurrence, the Po valley is an ideal area to study FLS life cycle processes in central Europe. In a case study approach, we analyze FLS life cycle processes pertaining to variations in land surface characteristics and atmospheric drivers. First results reveal the importance of the temporal development of temperature, specific humidity and boundary layer height for FLS formation during radiation-driven FLS events. These effects are further modified by the local topography and the synoptic situation.

This analysis provides a basis to set up further process-oriented sensitivity studies using explainable machine learning, which has shown to be an ideal tool to gain a deeper understanding of the effect of non-linear land-atmosphere interactions on the FLS life cycle.

How to cite: Pauli, E., Cermak, J., Andersen, H., and Schütz, M.: A satellite-based analysis of fog and low stratus life cycle processes in the Po valley, Italy, EGU General Assembly 2024, Vienna, Austria, 14–19 Apr 2024, EGU24-15582, https://doi.org/10.5194/egusphere-egu24-15582, 2024.

EGU24-16214 | ECS | Orals | AS2.4

Microphysical and Electrical Characteristics of Fog in the United Arab Emirates 

Narendra Reddy Nelli, Diana Francis, Ricardo Fonseca, Olivier Masson, Mamadou Sow, Rachid Abida, and Emmanuel Bosc

Fog is a prevalent weather phenomenon in several arid regions, including the Empty Quarter desert in the United Arab Emirates (UAE), located on the northeastern side of the Arabian Peninsula. Despite being primarily an arid country with desert landscapes dominating its terrain, most events causing visibility to drop below 1 km in the UAE are attributed to condensation processes rather than dust occurrences. We present in-situ measurements of fog microphysics from the Barakah Nuclear Power Plant (BNPP, a coastal site located at 23.968052°N, 52.267309°E) and atmospheric electric field measurements obtained during the Wind-blown Sand Experiment (WISE)-UAE field campaign conducted at Madinat Zayed (23.5761° N, 53.7242° E; elevation: 119 m).

Measurements of fog microphysics were conducted during the winter season of 2021 -2022 at the BNPP, located in the Western coastal region of the United Arab Emirates. Twelve fog events were observed during this period. The primary objective of this study is to detail the microphysical characteristics of these events and refine current visibility parameterization schemes based on in-situ measurements of fog microphysical properties. All observed fog events are found to share a common feature: a bimodal distribution in droplet number concentration (Nc), with modes at 4.5 µm and 23.2 µm . Despite the high proportion of fog smaller droplets associated with the fine mode, the greatest contribution to the liquid water content (LWC) comes essentially from medium to large droplets between 10 µm and 35 µm. The recalibration of existing visibility parameterization schemes revealed that the decrease (increase) in horizontal visibility with increasing (decreasing) LWC (FI, fog index) tends to be more gradual for the studied cases compared to standard visibility parameterization schemes. Additionally, the fog sedimentation velocity, estimated to be at a maximum of 1.85 cm s-1, occurs predominantly in the LWC range of 100 - 200 mg m3, corresponding to a median volume diameter 24.8 µm. Our findings shed new light on the complexity of fog microphysics and its impact on visibility, underscoring their importance in refining weather models for accurate fog forecasting.

For the first time, the changes in the atmospheric electric field (Ez) during foggy conditions is studied in a hyper-arid region; the United Arab Emirates (UAE), using comprehensive measurements during the Wind-blown Sand Experiment (WISE)-UAE. The longer the fog persists, the more variable Ez becomes, primarily due to the fog's ability to absorb and redistribute the charges of the atmospheric small ions. This absorption alters the ion balance, affecting electrical conductivity within the atmosphere, which in turn leads to sustained alterations in Ez. A record high Ez value of 2571 V m-1 was measured during a long-lasting fog event. Ez values returned to normal during the fog dissipation phase. The results of this work can be applied to develop techniques for fog harvesting and to improve fog forecasting by accounting for the effect of the electric field on fog lifetime and characteristics.

How to cite: Nelli, N. R., Francis, D., Fonseca, R., Masson, O., Sow, M., Abida, R., and Bosc, E.: Microphysical and Electrical Characteristics of Fog in the United Arab Emirates, EGU General Assembly 2024, Vienna, Austria, 14–19 Apr 2024, EGU24-16214, https://doi.org/10.5194/egusphere-egu24-16214, 2024.

EGU24-16368 | ECS | Posters on site | AS2.4

Examining the fog occurrence over the Bucharest Henri Coandă International Airport and its adjacent area 

Alex Vlad, Gabriela Iorga, Nicu Barbu, and Sabina Stefan

Fog forecasting and fog nowcasting events are challenging issues especially when the fog phenomenon appears in the vicinity of airports because the reduced visibility associated with fog represent a high risk for air traffic events. Bucharest Henri Coandă International Airport (OTP, 44.57°N, 26.1°E, 95 m above sea level) is the largest airport in Romania and is located about 16 km north of Bucharest, the capital and most developed city of Romania. Its surroundings are comprised partly of residential and natural protected areas, and partly have agricultural use. Due to its geographic position, the airport is an important air traffic hub on the routes between western and eastern world destinations. In terms of numbers of flights, during the observation period analyzed here, the air traffic at OTP was significantly lowered during the spring of 2020 due to COVID-19 pandemic but soon after the restrictions were lifted and due to redirection of the flights over Ukraine after 2022, the air traffic is significantly increased in present.

Data and analyses reported here cover a period of 2 decades from the beginning of 2003 to the end of 2023. Meteorological data, including fog events, relative humidity, wind speed and direction, were measured by the weather station of Romanian Air Traffic Services Administration ROMATSA R.A. Data about boundary layer and solar radiation was extracted from the public available database from the European Centre for Medium-Range Weather Forecasts (ECMWF) ERA5.

Present study reports the analysis of the evolution of the frequency of fog events and the relationships between fog events and speed and direction of the wind, and between fog events and the relative humidity. The correlations between the boundary layer height, solar radiation and the fog events were also investigated. Bivariate polar plots revealed fog appears with higher frequency (about 32%) during cold season, from October to March, and during early morning hours. Overview of the entire data set shows in some years mono-modal distributions of the fog frequency of occurrence with respect to the local time with peaks during the night and in the early morning hours and mono-modal flat distributions in other years. We observed the fog events are correlated with dominant wind directions of east-nord-east (ENE) and west-south-west (WSW). Statistical analysis of the data also showed a prevalence of the radiation fog over the advection fog.

Acknowledgement: AV was supported by the University of Bucharest, PhD research grant. AV acknowledges the partial funding from the NO Grants 2014-2021, under Project contract no. 31/2020, EEA-RO-NO-2019-0423 project. Data regarding boundary layer and solar radiation was extracted from the public available database from the European Centre for Medium-Range Weather Forecasts (ECMWF) ERA5. We thank ROMATSA R.A. for access to the database.

How to cite: Vlad, A., Iorga, G., Barbu, N., and Stefan, S.: Examining the fog occurrence over the Bucharest Henri Coandă International Airport and its adjacent area, EGU General Assembly 2024, Vienna, Austria, 14–19 Apr 2024, EGU24-16368, https://doi.org/10.5194/egusphere-egu24-16368, 2024.

EGU24-16844 | Posters on site | AS2.4

Leaf thermoregulation and fog wetting dynamics of Erica platycodon in a Macaronesian cloud forest 

Carlos M. Regalado, Omar Garcia-Tejera, and Axel Ritter

Interception of fog droplets in cloud forests leads to wetting of the canopy, hampering transpiration and affecting the energy dynamics of the vegetation due to evaporation of the leaf water lamina and the reduction in the incoming solar radiation. We carried out continuous concurrent measurements of the canopy temperature (through infrared thermometers), artificial leaf wetness (LWS) and the micrometeorology of a cloud forest in the Anaga Biosphere Reserve (Tenerife, Canary Islands) during a 4-month period. Fog presence at the site, characterized by visibility measurements (Ω), was coincidental with variations in LWS and a decline in net solar radiation, Rn, i.e. 62.2 W m-2 during foggy conditions (Ω < 1 km) versus 245.0 W m-2 for fog-free conditions (Ω ≥ 1 km). Infrared readings during foggy conditions of one of the representative species of the cloud forest stand, the perennial tree Erica platycodon, showed that differences between canopy and ambient temperatures were primarily driven by Rn. After a fog event, E. platycodon was estimated to remain wet for at least 30 minutes up to 2.25 hours. This study provides information about the consequences of fog in the wetting/drying dynamics of cloud forests of the Canary Islands and their leaf thermoregulation.

How to cite: Regalado, C. M., Garcia-Tejera, O., and Ritter, A.: Leaf thermoregulation and fog wetting dynamics of Erica platycodon in a Macaronesian cloud forest, EGU General Assembly 2024, Vienna, Austria, 14–19 Apr 2024, EGU24-16844, https://doi.org/10.5194/egusphere-egu24-16844, 2024.

EGU24-16949 | ECS | Posters on site | AS2.4

Measuring Greenhouse Gas Exchange from Paddy Field Using Eddy Covariance Method in Mekong Delta, Vietnam 

Khue Vu Hoang Ngoc, Georg Jocher, Vu Le D. A., Son Le T., An Bui T., Bang Ho Q., and Huong Pham Q.

Agriculture is an important economic sector of Vietnam, the most common is wet rice cultivation. Wet rice cultivation is known as the main contributor to national greenhouse gas emissions. To better understand greenhouse gas exchange in wet rice cultivations and to investigate the factors influencing carbon cycling and sequestration in these types of ecosystems, since 2019, the first eddy covariance station has been installed in a paddy field in Long An province, Mekong Delta, Vietnam. The station is equipped with state-of-the-art equipment for CO2 and CH4 gas exchange and meteorological ancillary measurements. Data from the station are processed following the ICOS recommendations (Integrated Carbon Observation System) for CO2. For CH4, data are separately processed and gap-filled using a random forest model from methane-gap fill-ml, a machine learning package, as there is no standard method for CH4 flux gap-filling yet. Finally, the CO2 equivalent (CO2eq) based on CO2 and CH4 fluxes was estimated. The study area implemented a new water management practice called alternate wetting and drying, which helps to save water and reduce methane emissions. This practice resulted in the minor release of 0.8 kg CH4 per hectare in 2020 and 0.67 kg CH4 per hectare in 2021. However, CO2eq from the rice fields was negative, indicating that the rice fields acted as a sink for CO2eq, with -5.54 kg CO2eq per hectare in 2020 and -7.03 kg CO2eq per hectare in 2021. On a provincial level, rice cultivation activities in Long An, with a total area of 498293 ha, resulted in a CO2eq uptake of 2760 and 3503 tons in 2020 and 2021, respectively. This result is in contrast to the initial hypothesis that rice fields are a source of greenhouse gases. However, N2O was not investigated in this study, which is also known as a strong greenhouse gas.

How to cite: Vu Hoang Ngoc, K., Jocher, G., Le D. A., V., Le T., S., Bui T., A., Ho Q., B., and Pham Q., H.: Measuring Greenhouse Gas Exchange from Paddy Field Using Eddy Covariance Method in Mekong Delta, Vietnam, EGU General Assembly 2024, Vienna, Austria, 14–19 Apr 2024, EGU24-16949, https://doi.org/10.5194/egusphere-egu24-16949, 2024.

EGU24-17604 | ECS | Orals | AS2.4

The role of forest canopy-wind interactions on experimental fire behavior using coupled atmosphere-fire modeling 

William Antolin, Mélanie Rochoux, and Patrick Le Moigne


Session: AS2.4: Air-Land Interactions


Abstract:

Experimental fires provide insights into the behavior of wildland fires and their interactions with the atmosphere. They help modelers build simulations capable of accurately describing fire dynamics, and which can help identify the key processes driving fire development. In particular, the FireFlux I case (a tall grass fire covering 30 hectares) was the first experimental fire to provide in situ measurements of atmospheric dynamics near the fire, highlighting the complexity of fire-induced flows and the importance of fire-induced upward vertical motion (Clements et al. 2007). Despite much theoretical work on forest canopy turbulence, its interactions with fire dynamics are still poorly understood, while they could play an important role (Heilman et al. 2021).

One of the difficulties in wildland fire simulations stems from the disparity between scales. Highly detailed models based on computational fluid dynamics (CFD) tend to represent chemical, radiation, and turbulence processes at the cost of reduced domain size. Conversely, meteorological models tend to provide a better representation of ambient wind over a larger domain size, but this is at the expense of parameterization choices. An intermediate modeling scale is needed to represent the geographical and micrometeorological scales involved in a wildland fire, especially in the development of the fire plume and the induced air entrainment. In recent years, we have therefore worked on designing and validating a coupled atmosphere-fire model, Meso-NH/BLAZE (Costes et al. 2021), where BLAZE represents the fire as a propagating flaming front and Meso-NH is run in large-eddy simulation (LES) mode at high resolution (10-100 m). This preliminary work has highlighted the predominant influence of surface wind on fire behavior and thus the critical need to make it more representative.

In this study, we show that accounting for interactions between forest canopy, surface wind and fire can be done by adding a drag term in the Meso-NH momentum and TKE equations (Aumond et al. 2013), and by running coupled atmosphere-fire simulations at very high resolution (10m and finer). We also assess for the FireFlux I case, the impact of the forest canopy on fire spread through several original data analyses, including wavelet transforms, fire-canopy interaction statistics, and sensitivity to atmospheric turbulence.


References

Clements, C. B., et al. (2007) Observing the Dynamics of Wildland Grass Fires: FireFlux – A Field Validation Experiment. Bull. Amer. Meteor. Soc., 88, 1369–1382. doi: 10.1175/BAMS-88-9-1369

 E.Heilman WE, et al. (2021) Observations of Sweep–Ejection Dynamics for Heat and Momentum Fluxes during Wildland Fires in Forested and Grassland Environments. Journal of Applied Meteorology and Climatology 60(2), 185–199. doi:10.1175/jamc-d-20-0086.1

Costes, A., et al. (2021) Subgrid-scale fire front reconstruction for ensemble coupled atmosphere-fire simulations of the FireFlux I experiment. Fire Safety Journal, 126, 103475, doi: 10.1016/j.firesaf.2021.103475

Aumond, P., et al. (2013) Including the drag effects of canopies: Real case large-eddy simulation studies. Boundary-Layer Meteorology, 146, 65–80, doi: 10.1007/s10546-012-9758-x

How to cite: Antolin, W., Rochoux, M., and Le Moigne, P.: The role of forest canopy-wind interactions on experimental fire behavior using coupled atmosphere-fire modeling, EGU General Assembly 2024, Vienna, Austria, 14–19 Apr 2024, EGU24-17604, https://doi.org/10.5194/egusphere-egu24-17604, 2024.

EGU24-18634 | ECS | Posters on site | AS2.4

Urban Surface Energy Flux Estimations Utilizing a Thermodynamic Analytical Framework 

Mayank Gupta, Ajinkya Khandare, and Subimal Ghosh

At the local scale, energy exchange shapes microclimates and ecosystems crucial for human health and well-being. For urban areas, the effect, such as Urban Heat Island, is directly manifested in these surface energy fluxes with contrasting responses in values between urban and rural areas. Although progress has been achieved in modeling the land surface energy balance, challenges arise from complex, variable parameterizations linked to surface and climate characteristics, introducing uncertainties. In this work, we utilized the thermodynamic theory that considers the land-atmosphere as a radiative-convective system to analytically estimate total turbulent heat flux and land surface heat storage flux for 20 Urban sites and compared them with Eddy covariance observations. The heat fluxes are determined only from four primary parameters: incoming and outgoing longwave and shortwave radiations at the terrestrial surface. Using the monthly averages derived from the total turbulent flux estimates at the eddy covariance sites, we observed root-mean-square error (RMSE) of 29.16 ± 11.3 Wm−2, a mean bias error (MBE) of -7.09 ± 19.6 Wm−2 and R2 value of 0.82 ± 0.16. We further tested the analytical estimates with land use land cover of Urban sites. Our findings illustrate the distribution of land surface heat storage flux estimates following land use land cover characteristics. The analytical estimates of heat fluxes for urban areas offer several advantages, such as ease of implementation and inexpensive computation, facilitating the evaluation of urban land use feedback for informed urban planning.

How to cite: Gupta, M., Khandare, A., and Ghosh, S.: Urban Surface Energy Flux Estimations Utilizing a Thermodynamic Analytical Framework, EGU General Assembly 2024, Vienna, Austria, 14–19 Apr 2024, EGU24-18634, https://doi.org/10.5194/egusphere-egu24-18634, 2024.

EGU24-20860 | ECS | Posters on site | AS2.4

Laboratory analysis on fog harvesting meshes employing durability tests 

Maria Giovanna Di Bitonto, Carol Monticelli, Salvatore Viscuso, and Alessandra Zanelli

Fog harvesting, an ancient water extraction technique, has gained renewed attention in recent years with the introduction of the Fog Water Collector. Comprising a mesh and supporting structure, this collector has proven effective in extracting water from atmospheric moist air. The Raschel mesh, initially designed for agricultural purposes, has become the predominant choice due to its affordability and widespread availability. Current research endeavors aim to enhance fog water yield by optimizing both collector design and mesh properties.

While Raschel mesh coatings have traditionally been explored to improve efficiency, recent findings suggest that alternative meshes may outperform the conventional Raschel mesh. However, challenges persist in understanding the resistance, lifespan, and maintenance requirements of these newer materials.

Our research takes a systematic approach to address this gap by assessing the durability of various fog harvesting meshes under laboratory conditions. A series of standardized tests are conducted to evaluate their efficiency, providing insights into the intricate relationship between cost, water collection efficiency, duration, and environmental impact. The study aims to inform decision-making processes surrounding fog harvesting mesh selection, considering factors such as initial investment, operational efficiency, and long-term sustainability.

By conducting these analyses in a controlled laboratory environment, we aim to provide valuable insights without the logistical challenges associated with field studies. This approach allows for a thorough examination of fog harvesting mesh performance, contributing to the broader understanding of NRWIs and their potential applications at different scales.

How to cite: Di Bitonto, M. G., Monticelli, C., Viscuso, S., and Zanelli, A.: Laboratory analysis on fog harvesting meshes employing durability tests, EGU General Assembly 2024, Vienna, Austria, 14–19 Apr 2024, EGU24-20860, https://doi.org/10.5194/egusphere-egu24-20860, 2024.

EGU24-22205 | Posters on site | AS2.4

Quantification of storage change at two contrasting eddy covariance sites 

Anastasia Gorlenko, Konstantinos Kissas, Charlotte Scheutz, and Andreas Ibrom

Eddy covariance (EC) flux measurements are relevant for the study of global change biology when integrated over long-term periods (Baldocchi, 2019). This could lead to researchers being reluctant to adopt state-of-the-art correction methods, especially for sites that have collected continuous data and trends for the last 20 years. The storage change (SC) correction has often been overlooked and simplified and is generally under-investigated in the literature. The present study highlights the dynamics of the storage change term in two different landscapes and proposes a simple correction factor that can be applied backwards to historical data in a forested ecosystem.

The first studied site is a mixed deciduous forest in Denmark (DK-Sor), where a sequential vertical profile system (12 heights) has been installed in 2021 to characterize the vertical component of the storage change more accurately. We compare the often-used 1 point method with the results from the profile system for CO2 and H2O. We study the SC component in terms of its diurnal course, its impact on the annual carbon budget, and its relation to atmospheric stability parameters.

The second site is a Danish rural area (DK-Hove), where four different greenhouse gas fluxes are measured with EC sensors installed at 3 heights on a 200 m tall telecommunication tower. The SC profile system here consists of 5 levels and needs to adapt to the dynamic eddy covariance measurement height of the landscape-scale GHG monitoring system. We present 6 months of SC data from the tall tower for CO2, CH4, N2O and CO, their diurnal courses and relation to meteorological variables.

Overall, this work aims at bringing an additional contribution to shed light on the often-neglected SC term.


Reference:

Baldocchi, Dennis D. How eddy covariance flux measurements have contributed to our understanding of Global Change Biology. United Kingdom: N. p., 2019. Web. doi:10.1111/gcb.14807.

How to cite: Gorlenko, A., Kissas, K., Scheutz, C., and Ibrom, A.: Quantification of storage change at two contrasting eddy covariance sites, EGU General Assembly 2024, Vienna, Austria, 14–19 Apr 2024, EGU24-22205, https://doi.org/10.5194/egusphere-egu24-22205, 2024.

EGU24-22211 | Orals | AS2.4

Optimising the sampling strategy in tall tower eddy covariance flux measurements 

Andreas Ibrom, Konstantinos Kissas, Anastasia Gorlenko, and Charlotte Scheutz

Tall tower eddy covariance (EC) measurements can be used to narrow down the gap between the ecosystem and the continental scale observations by capturing greenhouse gas (GHG) fluxes in a landscape scale (>10 km2). Because of the large footprint, tall tower platforms enable monitoring of greenhouse gas net fluxes, integrating over a multitude of diverse GHG sources and sinks within anthropogenic ecosystems. Yet, the temporal variability of atmospheric stability and atmospheric boundary layer affects the size of the flux footprint and the quality of EC flux estimates, respectively, thereby complicating the interpretation of surface flux estimates. The objective of this study is to determine an optimal sampling scheme alternating between different measuring heights (zm) in order to maximise the number of valid flux measurements as well as mitigating the effect of weather fluctuations on the longitudinal position of the footprint.

We used a six months’ data set of continuous turbulence data measured from a recently deployed prototype flux observation station in a rural area close to the Danish Capital of Copenhagen, Zealand. The system is mounted on a 200 m telecommunication tower equipped with 3D ultrasonic anemometers in three different heights (70m, 90m, 115m) and with a TILDAS GHG analyser capable of switching between three sampling lines corresponding to the specified heights.

We define an optimal sampling strategy based on the peak location of the individual, crosswind-integrated footprints from valid samples. As valid, we characterized those flux measurements, when the zm was within the constant flux layer, as estimated from ceilometer measurement. For each of the half hours, we selected the zm with the footprint’s peak location closest to a target position.

In this presentation, we demonstrate the ability to constrain the flux footprint within a target landscape area by establishing a sampling schedule across the three sampling heights. The results showed that designing a sampling strategy that combines multiple heights has the potential to bring the aggregated footprint for the entire period (footprint climatology) closer to the targeted area. A similar outcome can be attained when sampling from a single height and excluding the instances where the footprint significantly deviates from the target area. Nevertheless, this comes with the trade-off of discarding valid data. Moreover, the weather effect on the variability of the crosswind-integrated footprints was reduced by setting an optimal, multi-height strategy in comparison to the aggregated footprints from the individual heights.

How to cite: Ibrom, A., Kissas, K., Gorlenko, A., and Scheutz, C.: Optimising the sampling strategy in tall tower eddy covariance flux measurements, EGU General Assembly 2024, Vienna, Austria, 14–19 Apr 2024, EGU24-22211, https://doi.org/10.5194/egusphere-egu24-22211, 2024.

The Kentucky Mesonet is a great asset for the Commonwealth of Kentucky, from realtime storm monitoring to building a detailed climate record. A detailed climate record is essential as causality between observations and extreme weather can be identified. The climate record being developed at the 80+ Kentucky Mesonet observation stations consists of approximately 75 indices. The indices include frequency, extremes, range, duration, and trends of precipitation, droughts, and temperature. For example, calculations of Warm/Dry days (daily mean temperature > 75th percentile of daily mean temperature and daily mean rainfall < 25th percentile of daily precipitation sum where the percentiles are based on a climatology taken from reanalysis between 1961 and 1990) are done for daily, monthly, seasonal, bi-annual, and annual aggregation periods. Particular attention will given to soil moisture - precipitation feedbacks as Kentucky has a karst geology which generates soil moisture gradients. Soil Moisture-precipitation feedbacks, the beginning and ending of land-atmosphere interactions in general, are highly dependent on the wind flow regime and atmospheric stability, so these relationships will elucidated in the presentation.  Tools will be developed based on interactions with policymakers and stakeholders as they will be making decisions today that impact the region’s main economic sectors (e.g. water, energy, transportation, etc.) as infrastructure erected today will likely be in place when the climate is different than at present. Examples will be provided that sample the different climate zones of the state, relative elevations of site locations, as well as different land cover and land uses.

How to cite: Rappin, E.: Land-Atmosphere Interactions as Observed by a Statewide in-situ Surface Observation Network, EGU General Assembly 2024, Vienna, Austria, 14–19 Apr 2024, EGU24-22465, https://doi.org/10.5194/egusphere-egu24-22465, 2024.

EGU24-3603 | ECS | Posters on site | EOS4.3

Bridging the gap between climate scenarios and law - a roadmap for mutual contributions 

Haomiao Du, Edward Brans, Murray Scown, Hsing-Hsuan Chen, Vassilis Daioglou, Mark Roelfsema, Annisa Triyanti, Dries Hegger, Leila Niamir, Marleen van Rijswick, Liping Dai, Peter Driessen, Yann du Pont, Dennis van Berkel, and Detlef van Vuuren

To bridge the knowledge gap between climate scenarios and law, this presentation is aimed to demonstrate currently demanded mutual contributions by legal professionals and integrated assessment modellers on 1) how legal knowledge can be integrated into climate scenarios and 2) how scientific evidence generated from climate scenarios can better guide climate litigation cases. We expect that this could support judges in making trade-offs in climate-related court cases and could contribute to the acceptance of decisions by judges in such cases. Given the emissions gap and the measures that must be taken to comply with the Paris Agreement, the latter is likely becoming more relevant.

Regarding the first part, the results are based on an empirical research project on Improving the Integration of Legal Knowledge and Scholars in Climate Scenario Assessments (https://www.uu.nl/en/research/sustainability/improving-the-integration-of-legal-knowledge-and-scholars-in-climate-scenario-assessments) and a workshop  (https://www.uu.nl/en/research/sustainability/workshop-report-promoting-the-mutual-understanding-between-legal-and-governance-scholars-and-climate) resulted from this project held in May 2023. Via interviews and focus-group discussions with 24 experts in climate modelling, climate law and politics, and ethics, our research highlights four legal aspects for integration, which are: 1) implementation end enforcement of climate targets, 2) key normative principles, 3) legal uncertainties, and 4) the applicability of scenarios in regional and local legal contexts. Considering the challenges of integration due to epistemic distinctions between disciplines, experts held different opinions on the feasibility of integrating those four aspects. Regarding actionable steps for the short term, revising narratives and a ‘legal reality check’ are the most agreed ones. The former refers to adding legal obligations that safeguard justice, fairness and fundamental human rights - traceable to various treaties - to narratives of the global futures. The latter refers to scrutinising the ‘shared feasibility space’ between law on the one hand and modelled scenarios and emission reduction pathways on the other: it can be the compatibility of legal principles with modelled scenarios based on different assessment criteria (e.g. fair share of burdens), or to compare scenarios with and without regulatory boundary conditions in a specific jurisdiction on a specific mitigation solution (e.g. BECCS scenarios).

Regarding the second part, the currently ongoing research focuses on the adoption of authoritative scientific evidence from climate scenarios - typically the projections referred to in the IPCC reports - in climate litigation cases. First, inspired by the Daubert Criteria, this research explores the possibility of developing guidelines for judges to deal with scientific uncertainties contained in multiple projected futures and determining admissibility of scientific evidence. Second, seeing the increasing reference to ‘open norms’ (e.g. due diligence, fair share) and fundamental human rights (to private life or a healthy environment) in court cases, modelled scenarios could provide information for guiding judges in their interpretation of key concepts such as carbon budgets, fair share, emission gap, appropriate emission reduction obligations, and climate-induced harm and loss and damage. We expect that this could be beneficial to the supportability of judges' decisions in climate cases.

How to cite: Du, H., Brans, E., Scown, M., Chen, H.-H., Daioglou, V., Roelfsema, M., Triyanti, A., Hegger, D., Niamir, L., van Rijswick, M., Dai, L., Driessen, P., du Pont, Y., van Berkel, D., and van Vuuren, D.: Bridging the gap between climate scenarios and law - a roadmap for mutual contributions, EGU General Assembly 2024, Vienna, Austria, 14–19 Apr 2024, EGU24-3603, https://doi.org/10.5194/egusphere-egu24-3603, 2024.

EGU24-5662 | ECS | Posters on site | EOS4.3

Litigation challenging over-reliance on carbon dioxide removal requires quantitative feasibility assessment 

Oliver Perkins, Peter Alexander, Almut Arneth, Calum Brown, James Millington, and Mark Rounsevell

Carbon dioxide removal (CDR) is an emerging frontier in climate change litigation1. CDR must play an important role in achieving global climate targets, by compensating for hard-to-abate emissions (such as from international transport). Yet, over-reliance on CDR in government and corporate decarbonisation plans may serve as a strategy to commit to climate action on paper, whilst making inadequate present-day emissions’ reductions. Therefore, litigation may be necessary to highlight where CDR commitments contribute to a credible decarbonisation plan, and where they are primarily employed as a delaying tactic. Hence, litigation arguing that a given level of CDR deployment represents an unacceptable risk to the achievement of legal climate targets must have clarity around plausible levels of real-world delivery.

Land-based CDR methods, such as afforestation and bioenergy with carbon capture and storage, frequently appear in both modelled decarbonisation scenarios and government policies. Here, we argue that quantitative assessment of the feasible potential of land-based CDR is vital to the success of CDR-focused litigation. Firstly, we highlight key land system processes that will constrain real-world CDR delivery to levels well-below the techno-economic assessments presented in the IPCC 6th Assessment Report (AR6). These constraining processes include land tenure and food insecurity, monitoring and verification, and impermanence due to biophysical disturbances and policy change. Quantifying the likely impact of such factors can fast-track successful CDR litigation by demonstrating the scale of the gap between CDR pledges and plausible real-world potentials.

Further, after Perkins et al., 2, we outline research frameworks that can deliver a quantified feasible potential for land-based CDR within the IPCC AR7 process, and highlight emerging trans-disciplinary methods making progress towards this goal. These methods include geospatial coupled socio-ecological model ensembles, which can capture interactions and feedbacks between socio-economic and biophysical drivers in the land system at global scale. Typically, such ensembles include coupling of spatial agent-based models of land user behaviour with dynamic global vegetation models and non-equilibrium agricultural trade models - which can represent system shocks such as geopolitical instability and extreme weather events. We conclude by arguing that quantitative feasibility assessment must be made a high priority in CDR research to prevent widespread over-reliance on CDR in decarbonisation policies.

1. Stuart-Smith, R.F., Rajamani, L., Rogelj, J., and Wetzer, T. (2023). Legal limits to the use of CO2 removal. Science 382, 772–774. 10.1126/science.adi9332.

2. Perkins, O., Alexander, P., Arneth, A., Brown, C., Millington, J.D.A., and Rounsevell, M. (2023). Toward quantification of the feasible potential of land-based carbon dioxide removal. One Earth 6, 1638–1651. 10.1016/j.oneear.2023.11.011.

How to cite: Perkins, O., Alexander, P., Arneth, A., Brown, C., Millington, J., and Rounsevell, M.: Litigation challenging over-reliance on carbon dioxide removal requires quantitative feasibility assessment, EGU General Assembly 2024, Vienna, Austria, 14–19 Apr 2024, EGU24-5662, https://doi.org/10.5194/egusphere-egu24-5662, 2024.

EGU24-8458 | ECS | Posters on site | EOS4.3

Save the Climate but Don’t Blame Us: Corporate Responses to Climate Litigation 

Noah Walker-Crawford

Fossil fuel companies are no longer denying anthropogenic climate change in recent climate litigation but question the validity of climate science for establishing legal responsibility. Past research on social movement legal mobilization has primarily focused on plaintiffs’ perspectives, showing how they use the judicial process as a site of knowledge production. Drawing attention to the other side, I conduct an analysis of scientific disputes in major climate change lawsuits and develop a typology for studying defendants’ evidentiary arguments. Defendants build evidentiary counter-narratives, challenge the substantive quality of plaintiffs’ claims, and attack the scientific integrity of compromising evidence. Litigants’ legal narratives and factual claims are linked to broader normative concerns about how the underlying issues should be resolved. Fossil fuel companies’ legal arguments reflect broader strategies to evade responsibility for climate change.

How to cite: Walker-Crawford, N.: Save the Climate but Don’t Blame Us: Corporate Responses to Climate Litigation, EGU General Assembly 2024, Vienna, Austria, 14–19 Apr 2024, EGU24-8458, https://doi.org/10.5194/egusphere-egu24-8458, 2024.

EGU24-12601 | ECS | Posters on site | EOS4.3

Towards Evaluating the Financial Responsibility of Carbon Majors for Climate-Related Damages 

Marina Andrijevic, Carl-Friedrich Schleussner, Jarmo Kikstra, Richard Heede, Joeri Rogelj, Sylvia Schmidt, and Holly Simpkin

In light of the global energy crisis and escalating climate change impacts, the liability of major fossil fuel companies is receiving heightened scrutiny, particularly in the context of climate litigation. This study initially establishes the feasibility of attributing climate damages to these companies. Utilizing the social cost of carbon methodology, we evaluate the damages inflicted by the top 25 oil and gas emitters from 1985 to 2018, comparing these to their financial profits. Our central estimate suggests partial damages of approximately 20 trillion USD, with the companies’ financial gains surpassing this by 50%, totaling around 30 trillion USD. This indicates the potential of carbon majors to cover their attributed damages while maintaining significant profits. In our analysis, we also explore how varying approaches to assigning responsibility and handling uncertainties in climate damages can markedly influence these findings. Additionally, we explore the role of sovereign wealth funds in perpetuating fossil-fuel derived wealth and the ensuing liability questions.

How to cite: Andrijevic, M., Schleussner, C.-F., Kikstra, J., Heede, R., Rogelj, J., Schmidt, S., and Simpkin, H.: Towards Evaluating the Financial Responsibility of Carbon Majors for Climate-Related Damages, EGU General Assembly 2024, Vienna, Austria, 14–19 Apr 2024, EGU24-12601, https://doi.org/10.5194/egusphere-egu24-12601, 2024.

EGU24-15814 | ECS | Posters on site | EOS4.3

Quantifying the human-induced climate change impact on heat-related mortality events in Europe with Extreme Event Attribution Methods  

Thessa M Beck, Lukas Gudmundsson, Dominik L Schumacher, Sonia I Seneviratne, Hicham Achebak, and Joan Ballester

Numerous Extreme Event Attribution (EEA) studies have consistently shown that human-induced climate change has increased the likelihood of extreme heat events. The increasing relevance of these studies in the context of climate litigation underscores the demand for the quantification of climate change impacts. Heat, as the primary contributor to weather-related mortality on the European continent, has caused more than 61,000 heat-related deaths in Europe during the 2022 summer. We carry out this proof-of-concept study in which we apply Extreme Event Attribution methods combined with epidemiological models to quantify how anthropogenic warming has influenced extreme heat-related mortality events in Europe. In contrast to most health impact studies, we utilize open-access mortality data from Eurostat, which is available in near-real time.

Because of the complex, non-linear relationship between temperature and mortality, we conduct separate Extreme Event Attribution analyses for (i) temperature extremes and (ii) associated heat-related mortality events in 232 distinct administrative regions spanning over 35 European countries. Our findings reveal that the probability of the maximum weekly values observed in 2022 has increased 12-fold [95th CI 3.51-147.15] for temperature and tripled [95th CI 1.02-18.63] for mortality compared to the pre-industrial baseline. Notably, we identify significant geographical disparities, e.g. in Spain the mortality risk is even 30 times higher [95th CI 3.33 – 1218.14] due to anthropogenic warming.

We find a statistically significant trend in 70% [90%] of the regions at the 0.95 [0.90] significance level, and across all age and sex groups, except for women aged 65 years or less, indicating that anthropogenic warming affects almost the entire European population.

This study establishes a foundation for subsequent analyses, not only for heat-related mortality events observed on different temporal and spatial scales but also for enabling an examination of other weather events and associated health impacts. By combining climate sciences and techniques with epidemiology and health data, it is possible to calculate the contribution of climate change to changes in health risks and mortality burdens by sociodemographic categories, such as sex, age, socioeconomic level, or comorbidities, especially in vulnerable groups. This transdisciplinary work has to potential to provide key information for climate-related health lawsuits and opens the door to inter- and transdisciplinary perspectives on how to integrate geoscience and epidemiology insights in litigation.

How to cite: Beck, T. M., Gudmundsson, L., Schumacher, D. L., Seneviratne, S. I., Achebak, H., and Ballester, J.: Quantifying the human-induced climate change impact on heat-related mortality events in Europe with Extreme Event Attribution Methods , EGU General Assembly 2024, Vienna, Austria, 14–19 Apr 2024, EGU24-15814, https://doi.org/10.5194/egusphere-egu24-15814, 2024.

EGU24-16721 | ECS | Posters on site | EOS4.3

Does climate change violate children’s rights? Investigating the use of scientific evidence in child and youth-led climate litigation 

Rosa Pietroiusti, Sam Adelman, Annalisa Savaresi, and Wim Thiery

Climate change is already increasing the frequency, intensity and duration of many extreme weather events around the world, as well as driving impacts on communities through slow-onset changes, and will continue to do so with each additional degree of warming. Young and future generations will face an ever-greater number of such events during their lifetimes, raising concerns regarding the intergenerational inequity inherent in climate change. In response to these concerns, child and youth-led climate litigation is emerging as an avenue to push for more ambitious climate policies at national and regional scales, by applying legal duties and obligations in a forward-looking way and presenting courts with  scientific evidence of observed and projected climate risks and impacts. Recent complaints led by young people, including, for example, Sacchi et al. v. Argentina et al., lodged in 2019 with the United Nations Committee on the Rights of the Child and Duarte Agostinho et al. v. Portugal et al., which was heard in 2023 by the European Court of Human Rights, have broken new ground by bringing the rights of children and future generations to the fore. Based on a review of recent and ongoing cases, we will investigate (i) what harms are claimed by youth plaintiffs, and (ii) whether, how and to what extent scientific evidence is used to support their claims. By comparing the cases in relation to their claims, jurisdictional frameworks, reference to human and/or children’s rights, and status, we will shed light on how youth applicants have addressed the main challenges of this specific category of climate litigation, including meeting the victimhood requirement, and what role evidence from the geosciences and other scientific fields has played.

How to cite: Pietroiusti, R., Adelman, S., Savaresi, A., and Thiery, W.: Does climate change violate children’s rights? Investigating the use of scientific evidence in child and youth-led climate litigation, EGU General Assembly 2024, Vienna, Austria, 14–19 Apr 2024, EGU24-16721, https://doi.org/10.5194/egusphere-egu24-16721, 2024.

EGU24-17250 | ECS | Posters on site | EOS4.3

From Glaciers to Courtrooms: Translating Natural Science Concepts into Legal Frameworks for Climate Litigation 

Randy Muñoz, Christian Huggel, Wilfried Haeberli, Martin Mergili, Adam Emmer, Lukas Arenson, and Matthieu Sturzenegger

The integration of natural science concepts into climate change litigation, particularly in cases related to glacier lake outburst floods (GLOFs) in mountainous regions like the Andes, faces significant challenges due to the differing nature of scientific and legal frameworks.

Scientific understanding of climate change impacts on phenomena such as GLOFs relies heavily on scenarios, modeling, and projections that evolve over time with advancements in technology and knowledge. These models need to be comprehensive, and consider an array of factors including glacier retreat, temperature changes and various risk factors. However, legal standards often require definitive proof of causation. There may arise a discrepancy creating  a gap in case of prevailing uncertainties inherent to high-mountain processes which may not always meet the exacting evidentiary requirements of litigation.

An illustrative example of this challenge is the case of a citizen in Huaraz, in the Andes of Peru, using a major German energy producer over the risks of a catastrophic flood from a GLOF at Lake Palcacocha. The German court’s decision to admit this case is groundbreaking in climate litigation. It implies a recognition of legal responsibilities of large emitters for potential losses and damages caused by anthropogenic climate change globally, provided a causal relation between emissions and risk can be established. This case exemplifies the challenge in linking complex scientific causation with legal accountability.

In the Palcacocha case, the German court defined to distinguish between i) the hazard and risk posed to the plaintiff in Huaraz, and ii) the attribution to anthropogenic climate change and the emissions produced by the defendant. Here we report on the geoscientific studies undertaken to analyze the hazard situation posed by potential rock and ice avalanches, impacting the glacial lake and producing potentially devastating floods in the city of Huaraz. Critical among other are concepts and methods to quantify probability of occurrence of an event, and the effect of cascading slope and mass flow processes.

In conclusion, the challenges in adapting natural science concepts for climate change litigation, particularly regarding GLOFs, stem from different concepts, standards of proof, and conceptual understandings in science and law. Bridging this gap is essential for effective climate litigation and requires innovative interdisciplinary approaches that facilitate the translation of scientific findings into legally cogent arguments. The framework, methods and standards we applied in the case of Palcacocha could serve for other litigation cases in similar environments, highly impacted and vulnerable to anthropogenic climate change. 

How to cite: Muñoz, R., Huggel, C., Haeberli, W., Mergili, M., Emmer, A., Arenson, L., and Sturzenegger, M.: From Glaciers to Courtrooms: Translating Natural Science Concepts into Legal Frameworks for Climate Litigation, EGU General Assembly 2024, Vienna, Austria, 14–19 Apr 2024, EGU24-17250, https://doi.org/10.5194/egusphere-egu24-17250, 2024.

EGU24-18367 | ECS | Posters on site | EOS4.3

Contributions of carbon majors to historical heatwaves 

Yann Quilcaille, Lukas Gudmundsson, Thomas Gasser, and Sonia I. Seneviratne

While human-induced climate change shows no sign of slowing down, calls to steer to a more sustainable path grow louder. Countries are sued for their lack of ambitious climate action, and high-emitting companies for their responsibilities. However, climate litigation is often impeded by the lack of scientific evidence directly relevant to the legal cases. Available attribution research can provide support for claims, but some key elements are still missing. First, event attribution studies are limited to a few selected events, depending on available researchers’ time and interests. Second, the contributions of high-emitting companies to recent extreme events has not yet been quantified. Here, we fill in both of these gaps. We present the first collective attribution of 149 historical heatwaves reported over the 2000-2021 period. We apply a well-established extreme weather attribution (Philip et al., 2020) to heatwaves reported in the EM-DAT database (EM-DAT, 2023). For each listed heatwave, we identify the event in observational data (ERA5, BEST) and CMIP6 data, then we estimate its occurrence probabilities for present and pre-industrial climate conditions. Subsequently, we calculate the contributions in global mean surface temperature of 110 fossil fuels and cement companies using their CO2 and CH4 emissions (Heede, 2014) and the reduced-complexity Earth system model OSCAR (Gasser et al., 2017). These contributions combined to the collective attribution allow for the calculation of the contributions of these carbon majors to all of the analyzed historical heatwaves. These carbon majors represent 76% of the CO2 emissions over 1850-2021, and half of this 76% is due to only six actors (nation-state of China for coal & cement; nation-state of the Former Soviet Union for coal, oil and gas; Saudi Aramco; Chevron; ExxonMobil; Gazprom). In terms of global mean surface temperature, these six majors contribute to 0.30°C, while the others contribute to an additional 0.34°C. The majority of heatwaves are made substantially more probable and intense due to these six carbon majors. Though, other carbon majors cannot be neglected, as their sole contribution may be enough to make some heatwaves possible. This attribution of a large number of heatwaves and the link to the contributions of the carbon majors will provide useful resources for climate litigation, paving the way towards their legal responsibility.


EM-DAT, CRED / UCLouvain: www.emdat.be, last access: 09.01.2024.

Gasser, T., Ciais, P., Boucher, O., Quilcaille, Y., Tortora, M., Bopp, L., and Hauglustaine, D.: The compact Earth system model OSCAR v2.2: Description and first results, Geoscientific Model Development, 10, 271-319, 10.5194/gmd-10-271-2017, 2017.

Heede, R.: Tracing anthropogenic carbon dioxide and methane emissions to fossil fuel and cement producers, 1854–2010, Climatic Change, 122, 229-241, 10.1007/s10584-013-0986-y, 2014.

Philip, S., Kew, S., van Oldenborgh, G. J., Otto, F., Vautard, R., van der Wiel, K., King, A., Lott, F., Arrighi, J., Singh, R., and van Aalst, M.: A protocol for probabilistic extreme event attribution analyses, Adv. Stat. Clim. Meteorol. Oceanogr., 6, 177-203, 10.5194/ascmo-6-177-2020, 2020.

How to cite: Quilcaille, Y., Gudmundsson, L., Gasser, T., and Seneviratne, S. I.: Contributions of carbon majors to historical heatwaves, EGU General Assembly 2024, Vienna, Austria, 14–19 Apr 2024, EGU24-18367, https://doi.org/10.5194/egusphere-egu24-18367, 2024.

EGU24-19683 | Posters on site | EOS4.3

Four roles for geoscientists in climate litigation 

Wim Thiery, Rosa Pietroiusti, Annalisa Savaresi, and Stefaan Smis

The number of climate change lawsuits is exploding,  and so is the need for scientific evidence on climate change in courtrooms. Here we identify four roles that climate researchers can take up in light of these recent developments: expert witness, party support, amicus curiae, and litigation-relevant research. For each role, we highlight recent examples and best practices, as well as pitfalls and their overcoming. These examples overall highlight the urgent need for interdisciplinary research between climate science and legal scholars to bring both research communities closer together. In addition, and in activities where exchange with litigators takes place, it is critical that ingestion of scientific information occurs right from the start of the litigation process.

How to cite: Thiery, W., Pietroiusti, R., Savaresi, A., and Smis, S.: Four roles for geoscientists in climate litigation, EGU General Assembly 2024, Vienna, Austria, 14–19 Apr 2024, EGU24-19683, https://doi.org/10.5194/egusphere-egu24-19683, 2024.

EGU24-20599 | Posters on site | EOS4.3

How stocks judge COPs: market impacts of climate conferences 

Robin Lamboll and Alaa Al Khourdajie

This study investigates the impact of Conference of the Parties (COP) meetings on the stock prices of oil companies and the broader implications for renewable energy sectors to examine the relationship between international climate negotiations and market responses in the energy sector. The analysis focuses on stock price movements and volatility within the oil and renewable energy industries. We look at the data of the 10 largest stocks in each category and investigate their behaviour during COP. The findings indicate that, with the exception of notable negative stock price movements during COPs 20 and 21 (before and during the signing of the Paris Agreement), COP meetings generally do not significantly influence the value of oil companies. There is also no impact on oil prices during COP itself, though some sign of disturbance in the period immediately afterwards. The study also addresses the renewable energy sector, finding no strong effects from most COP meetings but a notable decrease in stocks during COP6's failure. We conclude that the majority of COPs have not produced market signals indicating a green transition, although these signals are potentially detectable.

How to cite: Lamboll, R. and Al Khourdajie, A.: How stocks judge COPs: market impacts of climate conferences, EGU General Assembly 2024, Vienna, Austria, 14–19 Apr 2024, EGU24-20599, https://doi.org/10.5194/egusphere-egu24-20599, 2024.

The Climate Litigation Network supports national organisations that are taking litigation action against their governments in respect of the adequacy and implementation of national climate policies and targets. This presentation will provide an overview of the role in science in climate cases that challenge governments’ overall emissions reductions (“framework cases”) – of which there are more than 100 globally. Drawing from a litigator’s perspective, it will address common legal questions (i.e., harm, causation, foreseeability and remedies) that arise in such cases, and provide examples of how science has been used in case studies. 

Across framework cases, scientific evidence has been critical to success. For example, many cases, including those based on human rights or tort law, require claimants to show how they have been impacted or have suffered harm. In this regard, supporting studies range widely, depending on the facts of the case. These could include studies concerning extreme weather events, flooding, landslides, impacts on crop production and availability to water, and impacts on health or culture. To establish legal liability, claimants typically must show that the government’s actions can be causally linked to the harm, and that the harm was foreseeable. In this regard, attribution science and climate science generally can play a role in evidencing why government action (or lack of action) is contributing to climate change impacts. In terms of remedies, several cases have sought to push governments to adopt emissions reduction targets that reflect their “fair share” of the remaining global carbon budget. Numerous fair share methodologies have been developed by academics, many of which seek to reflect obligations and principles set out in the United Nations Framework Convention on Climate Change and international environmental law. In some cases, there may also be questions concerning loss and damage, which could require detailed analyses of how much damage has been incurred, or could be incurred in future, due to the impacts of climate change.

Drawing on case studies from specific cases, this presentation will highlight the current deployment of science in climate cases against governments and explore new frontiers.

How to cite: Williamson, A.: Challenging governments’ response to the climate crisis: the role of science in climate litigation, EGU General Assembly 2024, Vienna, Austria, 14–19 Apr 2024, EGU24-21949, https://doi.org/10.5194/egusphere-egu24-21949, 2024.

EGU24-758 | ECS | Orals | EOS4.4

Méditerranée 2000: Nurturing climate & ocean awareness 

Pimnutcha Promduangsri, Pariphat Promduangsri, and Estelle Bellanger

Humans have been suffering increasingly from the escalating impacts of climate and ocean change.  Well known examples are droughts, flooding, wildfires, acidification, heatwaves, sea-level rise, extreme storms and biodiversity loss.  If global average temperature rises by more than 1.5°C above pre-industrial levels, multiple climate tipping points will be triggered, and indeed, some already are.  This is and will be devastating for people around the world, especially those in coastal areas.  Thus, the need for immediate and informed action has become urgent.

This presentation will outline some of the many concrete, local actions in the area of climate and ocean, undertaken by Méditerranée 2000 (Med2000), an environmental association in the South of France.  Since 1989, the association has committed its efforts and educational programs to promoting sustainable development.  Each year, the association educates more than 25,000 young people and adults, led by a team of ten specialized speakers.  Med2000’s initiatives include awareness campaigns about climate and ocean change, hands-on educational activities in local schools and events for the general public.

How to cite: Promduangsri, P., Promduangsri, P., and Bellanger, E.: Méditerranée 2000: Nurturing climate & ocean awareness, EGU General Assembly 2024, Vienna, Austria, 14–19 Apr 2024, EGU24-758, https://doi.org/10.5194/egusphere-egu24-758, 2024.

Academic researchers have long been advocates of various causes in the public arena; their public advocacy to take normative positions regarding various moral, political or social issues is not new. Today, however, in the face of the many challenges facing our society, the question of researchers' public positions, particularly in relation to the environment and climate change, is being raised anew. A number of climate scientists are committed in a variety of ways, from signing op-eds to participating in the work of NGOs or think tanks, supporting legal actions or writing blog posts. In addition, the development of traditional and social media has significantly increased the public exposure of these researchers. At the same time, serious questions are being raised within the research community. Many of its members are debating the ways in which researchers can engage in such public advocacy, its advisability, and even its very principle. However, these debates are currently taking place in informal settings and, given the extensive individual experience of a number of colleagues, it is probably time to engage in this discussion in a more collective and organised way, as is done in other research communities.

Here are some examples of questions that might be discussed. How can researchers engage in public advocacy safely and responsibly? What is the role of the scientist versus the expert versus the citizen versus the activist? Can a researcher be neutral when taking a public stance? What is the risk of appearing naive, manipulated or irrelevant? How should researchers deal with vested interests and private actors? Should the climate community research geoengineering? For whom should researchers develop climate services?

Because addressing these issues involves a tension between personal values that may go beyond those shared by the scientific community, they are essentially novel ethical questions. Some may be so intimidating that many researchers choose not to engage publicly. Care must therefore be taken to organise the exchange properly, for example by creating safe internal spaces for debate or by inviting experts from other disciplines.

The French CNRS Ethics Committee has recently published on opinions on these issues[1], which I will use as a starting point for a broader discussion.


[1]  https://comite-ethique.cnrs.fr/en/comets-opinion-freedom-and-responsibility-academic-researchers-public-advocacy/

How to cite: Guilyardi, E.: Freedom and Responsibility: the Ethics of Academic Researchers’ Public Advocacy, EGU General Assembly 2024, Vienna, Austria, 14–19 Apr 2024, EGU24-1344, https://doi.org/10.5194/egusphere-egu24-1344, 2024.

EGU24-2053 | Orals | EOS4.4

Perceiving Cape-Town-Geoethics (CTG) through Symbolic Universes (SU) 

Martin Bohle, Rika Preiser, and Eduardo Marone

Cultural milieus determine the worldviews and practices of individuals and groups, including the reception of norms that guide them. Semiotic Cultural Psychological Theory (SCPT) methods, such as Symbolic Universes (SU), describe relationships of reception, worldviews and practice, which also applies to geo-philosophical matters [1]. This essay outlines how geoethics, for example, the Cape Town Geoethics (CTG), might be received in different cultural milieus.

The Cape Town Statement on Geoethics was proposed in 2016 at the 36th IGC [2] and is the most accessible resource on geoethics. It bundles various concepts in a Kantian/Aristotelian virtue ethics framework, illustrated, for example, by the Geoethical Promise [3].

The SU method describes the understanding, insights, and behaviour of groups of people expressing their respective cultural milieus. Extensive fieldwork identified five SU for people of European (Western) cultures [4]. The SUs called "Ordered Universe", "Interpersonal Bond", "Caring Society", "Niche of Belongingness", and "Others' World" categorise milieus, for example, in terms of relation to power and institutions or sources of trust. They corroborated with the Kohlberg hierarchy of the level of societal coordination [5] that is applicable to associate CTG and the worldviews of individuals and groups [6].

Comparing CTG and SU indicates: (1) CTG resonates most positively with people of the cultural milieu “Ordered Universe” (highest Kollberg level); (2) in other milieus, the reception of the CTG will be “measured”; (3) reception will be adverse for the milieu “Others' World” (lowest Kohlberg level). Hence, considering the quantitative distribution of SUs (in Europe), European citizens' reception of CTG is likely restrained.

Given complex-adaptive social-ecological systems of the World and Nature couple world views, human practices, and societal and natural systems [7] (see example: [8]), whether variants of CTG “fitted to different milieus” should be developed is of practical relevance. The perception of norms and their acceptance or rejection is a system feature, of which geoethics should not be agnostic.

[1] Bohle M (2019) “Homo Semioticus” Migrating Out of Area? In: Salvatore S, et al. (eds) Symbolic Universes in Time of (Post)Crisis. Springer Berlin Heidelberg, Cham, pp 295–307

[2] Di Capua G, et al. (2017) The Cape Town Statement on Geoethics. Ann Geophys 60:1–6. https://doi.org/10.4401/ag-7553

[3] Matteucci R, et al. (2014) The “Geoethical Promise”: A Proposal. Episodes 37:190–191. https://doi.org/10.18814/epiiugs/2014/v37i3/004

[4] Salvatore S, et al (2019) The Cultural Milieu and the Symbolic Universes of European Societies. In: Salvatore S, et al. (eds) Symbolic Universes in Time of (Post)crisis. Springer, Cham, pp 53–133

[5] Kohlberg L (1981) The Philosophy of Moral Development: Moral Stages and the Idea of Justice. Harber & Row, San Francisco

[6] Bohle M, Marone E (2022) Phronesis at the Human-Earth Nexus: Managed Retreat. Front Polit Sci 4:1–13. https://doi.org/10.3389/fpos.2022.819930

[7] Preiser R, Woermann M (2019) Complexity, philosophy and ethics. In: Galaz V (ed) Global Challenges, Governance, and Complexity. Edward Elgar Publishing., Cheltenham, pp 38–62

[8] Talukder B, et al. (2023) Complex Adaptive Systems-Based Conceptual Framework for Modeling the Health Impacts of Climate Change. J Clim Chang Heal 100292. https://doi.org/10.1016/j.joclim.2023.100292

How to cite: Bohle, M., Preiser, R., and Marone, E.: Perceiving Cape-Town-Geoethics (CTG) through Symbolic Universes (SU), EGU General Assembly 2024, Vienna, Austria, 14–19 Apr 2024, EGU24-2053, https://doi.org/10.5194/egusphere-egu24-2053, 2024.

EGU24-2607 | Posters on site | EOS4.4

Geoethics literacy:  Clarifying values, principles and behaviour 

David Crookall, Pimnutcha Promduangsri, and Pariphat Promduangsri

Learning about geoethics is not easy partly because the area is relatively new (having emerged in the early 2010s), the concepts are sometimes difficult to fathom and geoethics touches on such a wide area of geoscience phenomena and on such a variety of human issues.

Learning through active, participatory engagement has been developing since the 1960s, and is now deployed, albeit sporadically, across the full educational and training spectrum (from the humanities, through the social sciences to the hard sciences).  Methods that have developed in this learning paradigm include project work, internships, experiential learning, simulation/gaming, values clarification and many more.  We contend that participatory methods are an effective way in which to learn, as supported by much research.

Our poster invites you to participate in a game-like, values clarification exercise.  We have developed a new version of an exercise that we have used in several places (Austria, Costa Rica, France, online) to unravel the knotty relations among values, principles and behaviours related to geoethical issues and dilemmas.

It is possible to play alone, but it is more enlightening and engaging to play in pairs or small groups.  Please bring a friend or two to our poster and participate in our exercise.  The basic process of the exercise can be adapted to your own specific areas of interest.  We look forward to seeing you – please bring a pencil.

(This poster was originally intended as a workshop in a short course, but our SC proposal was declined.)

How to cite: Crookall, D., Promduangsri, P., and Promduangsri, P.: Geoethics literacy:  Clarifying values, principles and behaviour, EGU General Assembly 2024, Vienna, Austria, 14–19 Apr 2024, EGU24-2607, https://doi.org/10.5194/egusphere-egu24-2607, 2024.

EGU24-3568 | Posters on site | EOS4.4

Exploring the horizon of geosciences through the lens of geoethics 

Silvia Peppoloni and Giuseppe Di Capua

Geosciences play an indispensable role in the functioning of contemporary societies. Nevertheless, the technological aspects associated with the practical application of geoscientific knowledge, should not overshadow the fundamental contribution of geosciences to shaping human thought. Geosciences have not only influenced but continue to shape our perception of the world, its interrelationships, and evolution.

The ongoing ecological crisis, with its environmental, social, cultural, economic, and geopolitical implications, has stemmed from an imprudent trajectory in human development. Regrettably, there have been instances where geosciences have contributed to this irresponsible path. This oversight has led to an undervaluation of the social and cultural significance inherent in geological disciplines and the crucial role they can play in addressing current global challenges to support human societies.

Geoethics, as the ethics of responsibility towards the Earth system, is grounded in the comprehensive understanding provided by geoscientific knowledge of the complexity of reality. It stands out as the optimal tool for cultivating a new perspective on geosciences, recognizing them as fundamental disciplines crucial for addressing global environmental challenges. This recognition extends beyond technical considerations, emphasizing their cultural significance. By virtue of their epistemological foundations, the geosciences collectively represent an invaluable reservoir of knowledge for human civilization. They are indispensable for redefining the intricate relationship that binds us, as humans, to the Earth.

For this reason, geoethical thought should serve as a complementary element to knowledge in the education of geoscientists. It aims to furnish them with a principled framework and ethical values, offering guidance for any application of geoscientific knowledge to the natural environment and human communities. Additionally, geoethical thought is the ground on which to set a shared, global ethical foundation, facilitating the advancement of our interactions with nature. It seeks to actualize an ecological humanism that forms the basis for human well-being and a more sustainable development of socio-ecological systems. The geoethical perspective redefines the cultural significance and objectives of the geosciences. Geoeducation and communication emerge as fundamental tools for bridging the gap between geosciences and society. They play a crucial role in promoting geoscientific knowledge, highlighting not only its scientific value in providing technical solutions to the ecological crisis but also emphasizing the philosophical dimension of geosciences, the geosophy of living consciously and responsibly within the Earth system.

How to cite: Peppoloni, S. and Di Capua, G.: Exploring the horizon of geosciences through the lens of geoethics, EGU General Assembly 2024, Vienna, Austria, 14–19 Apr 2024, EGU24-3568, https://doi.org/10.5194/egusphere-egu24-3568, 2024.

EGU24-3586 | Posters on site | EOS4.4

An infrastructure for researching on geoethics and facilitating its international promotion 

Giuseppe Di Capua and Silvia Peppoloni

The development of the theoretical foundations of geoethics and its practical applications have had a notable boost in recent years, seeing the involvement of a growing number of scholars from different disciplines. This has increasingly necessitated the creation of spaces where reflections, discussions, results, and study materials can be shared. The network of scholar relationships has progressively developed physical and conceptual spaces for discussions. The goal has been to sustain conceptual consistency in geoethical thinking by anchoring reflections in the discipline's historical evolution and fostering further developments through open analysis, welcoming contributions from diverse disciplinary backgrounds. Today, what can be defined as a research infrastructure on geoethics and the promotion of its contents possesses a complex structure, serving as a convergence point for various cultural and scientific experiences.

At the core of this infrastructure lies the International Association for Promoting Geoethics - IAPG (https://www.geoethics.org), established in 2012. It consists of an Executive Committee, national sections, and Task Groups focusing on specific topics within geoethics. More recently, two new entities have augmented this infrastructure: i) the Commission on Geoethics of the International Union of Geological Sciences (IUGS), established in February 2023, that is the supporting branch of the IAPG to the IUGS and the IUGS body that officially deals with geoethics and social geosciences for the Union; ii) the Chair on Geoethics of the International Council for Philosophy and Human Sciences (CIPSH, an organization operating under the umbrella of UNESCO), established in December 2023, with the aim of expanding and reinforcing an international research network of institutions, not-governmental organizations, and individual scholars to foster interdisciplinary initiatives for bridging geosciences, humanities, and social sciences through geoethics.

The research infrastructure on geoethics has been enriched over time with two editorial initiatives: a) SpringerBriefs in Geoethics series by Springer Nature (https://www.springer.com/series/16482), founded in 2020 and supported by the IAPG, that envisions a series of short publications that aim to discuss ethical, social, and cultural implications of geosciences knowledge, education, research, practice and communication; b) the Journal of Geoethics and Social Geosciences (https://www.journalofgeoethics.eu/), a diamond open access publication of the National Institute of Geophysics and Volcanology (Rome, Italy) and supported by the IAPG, founded in 2021.

Finally, the research infrastructure on geoethics is complemented by the School on Geoethics and Natural Issues (the “Schola”), founded in 2019 (https://www.geoethics.org/geoethics-school). The “Schola” is a place for teaching and learning of the principles and values of geoethics in the light of the philosophy and history of Earth sciences. The intent is to provide background knowledge and the evaluation skills necessary to understand the complex relationship between human action on ecosystems and the decisions geoscientists make in the discipline that impact society, including improving the awareness of professionals, students, decision-makers, media operators, and the public on an accountable and ecologically sustainable development.

How to cite: Di Capua, G. and Peppoloni, S.: An infrastructure for researching on geoethics and facilitating its international promotion, EGU General Assembly 2024, Vienna, Austria, 14–19 Apr 2024, EGU24-3586, https://doi.org/10.5194/egusphere-egu24-3586, 2024.

The ocean has started to attract more attention in the recent past with the notions of Blue Economy and Blue Growth becoming rallying points for a new frontier for investments [1]. Many countries and institutions prepare policy papers promising to end poverty, a push for new technologies and profits to fund the development. A recent systematic review of the literature [2], however, found no trace of articulated ethics and justice notions in midst of all the lofty hope and hype surrounding the often blurred concepts. The increasing financialisation of technological developments accelerated through digitalisation and the internet are creating increasing injustices to humans and harm to nature. But, as Rushkoff argues [3], the possibilities for feedback and more circular reasoning have potential to teach everybody that there is no escape from the natural world, thus weaning us from the hyperbole of permanent exponential growth. Here it is argued that critically engaged ocean and geo-sciences with their inherent message of a changing planet through deep time can contribute to debunking the ahistorical promise of fixing self-created problems by starting on a presumed ‘clean slate’. We frequently observe a pattern of wanting to solve the damage provoked by one technology with more technology, e.g. deep sea mining [4] or further technology development in fisheries and aquaculture [5]. At country level, these deliberately disruptive industrial approaches often pay little attention to working with the affected small-scale wild food producers who account for a quarter of global production. Instead, harnessing a combination of traditional and indigenous knowledges and providing intelligible access to the sciences holds significant potential for less destructive pathways. That would also be consonant with the promotion of knowledge co-creation during the UN Ocean Decade in pursuit of a vision of ‘the science we need for the ocean we want’. Practice of co-creation will require some rethinking of the self-image of many sciences and adaptations to typical project formulation and flows. In return, this is expected to produce valuable new insights in addition to opportunities for cooperation and blue justice as steps towards transformations based on ethical principles.


[1] World Bank. (2016). Oceans 2030: Financing the blue economy for sustainable development. Blue Economy Development Framework, Growing the Blue Economy to Combat Poverty and Accelerate Prosperity. World Bank Group, Washington DC.

[2] Das, J. (2023). Blue Economy, Blue Growth, Social Equity and Small-scale Fisheries: A Global and National Level Review. Studies in Social Science Research, 4(1):45 p. DOI: https://doi.org/10.22158/sssr.v4n1p38

[3] Rushkoff, D. (2022). Survival of the richest. Escape fantasies of the tech billionaires. Scribepublications, UK, ISBN 978-1-915590-24-4, 212 p.

[4] Zenghui Liu, Kai Liu, Xuguang Chen, Zhengkuo Ma, Rui Lv, Changyun Wei, Ke Ma. (2023). Deep-sea rock mechanics and mining technology: State of the art and perspectives. International Journal of Mining Science and Technology, 33(9):1083-1115. https://doi.org/10.1016/j.ijmst.2023.07.007.

[5] FAO. (2022). The State of World Fisheries and Aquaculture 2022: Towards Blue Transformation. Rome, FAO. doi:10.4060/cc0461en

How to cite: Nauen, C. E.: Can geosciences help inserting social justice notions into Blue Economy narratives?, EGU General Assembly 2024, Vienna, Austria, 14–19 Apr 2024, EGU24-4054, https://doi.org/10.5194/egusphere-egu24-4054, 2024.

Science indicates that human impact on the planet's climate is clear. Over the past 30 years, climate change has shifted from being primarily a scientific concern to emerging as one of the defining environmental challenges within our society. However, science alone cannot guide us on how to address this crisis. This challenge is also about how we envision living together, what we collectively value, and the level of risk we are prepared to assume. It fundamentally pertains to the kind of society we aspire to, making education a pivotal component. Inspired by the Paris Agreement, the time has arrived for Climate Change Education. It derives its momentum from the aspirations and mobilization of the youth, making it the most potent transformative action in response to climate change.

Climate Change Education comes with unique and exciting opportunities. Firstly, it offers a chance to learn about science in general and climate science specifically, drawing from authoritative sources like IPCC reports. Secondly, it provides an avenue to acquire life skills, humanities knowledge, and insights into global citizenship, imparting a holistic perspective to the young generation on a global scale. Lastly, it fosters critical thinking, hopeful hearts, and empathy in an ever-evolving educational landscape. However, Climate Change Education presents numerous challenges as it strives to balance the development of cognitive, emotional, and practical aspects within existing educational systems. Educators need to be prepared for this unique combination of ‘head’, ‘heart’, and ‘hands’.

The mission of the Office for Climate Education (OCE) is precisely to empower educators in preparing young generations with a robust understanding of climate change and the skills needed to act as global citizens in a changing world. The OCE, driven by collaboration between climate science and educational communities, develops sets of pedagogical resources, offers teacher professional development opportunities, and facilitates networks of practice worldwide. As a pivotal participant in the newly established Greening Education Partnership, the OCE serves as a bridge between the global landscape of IPCC-based science and the specific needs of local primary and secondary educational systems in over 20 countries.

How to cite: Guilyardi, E. and Wilgenbus, D.: Exciting times for Climate Change Education – from global opportunities to local challenges, EGU General Assembly 2024, Vienna, Austria, 14–19 Apr 2024, EGU24-6101, https://doi.org/10.5194/egusphere-egu24-6101, 2024.

The National Association of State Boards of Geology (ASBOG) plays an essential role in supporting the licensing of applied geoscientists in more than 30 states in the United States [1] through promulgating model law, rules, and regulations for professional licensure, [2] by developing and implementing the Fundamentals of Geology (FG) and Practice of Geology (PG) exams, and [3] by providing related educational materials.  The content of the FG and PG exams is driven substantially by the results of Task Analysis Surveys (TAS) taken by practicing geologists and academic geologists.  Before 2023, the exams included content related to ethics reflected in the earlier TAS analytical summaries;  however, ethics content is not included in the 2023 TAS or, reportedly, in the current FG or PG exams.
     ASBOG has a history of including applied ethics in its products and organizational structure.  There is a "Code of Conduct/Harassment Policy and Performance Guidelines" for the ASBOG organization on its website (ASBOG.org).  The "Professional Geologist Model Licensure Law" states that each applicant must "submit a signed statement that the applicant has read and shall adhere to any code of professional conduct/ethics and rules established by the Board..." and that the application "be signed and sworn to by the applicant before a notary public" (ASBOG 2017, lines 844-847).  Its "Model Rules and Regulations" includes a sample "Code of Ethics" for licensed professional geologists (ASBOG 2019, p. 27-29).  
     Geoscience professional organizations in the US and internationally affirm the fundamental importance of ethics in academic and applied geoscience.  Virtually all professional organizations relevant to applied-geoscience practice in the United States (e.g., AAPG, AGI, AGU, AIPG, AEG, ASBOG, GSA, SIPES...) have some form of ethics code that their members are obligated to know and adhere to.  The International Association for the Promotion of Geoethics (IAPG -- www.geoethics.org) curates a list of codes of ethics/professional practice and provides publications and educational opportunities supporting geoethics.  Another essential resource is the "Teaching Geoethics" website (serc.carleton.edu/geoethics -- Mogk and Bruckner, 2014-23).
     Robert Tepel (1995) described the essential connection between licensure laws and professional ethics.  To the extent that there is a lack of ethics content in the current 2023 TAS, candidate handbook, exam preparation resources, and FG and PG exams, ASBOG sends a message that applied ethics might not be a core competency for licensed geoscientists -- a message for which there is essentially no support among geoscience professional organizations.
          I suggest that ASBOG collaborate with IAPG and other relevant organizations to address the problems or concerns that resulted in the reported elimination/reduction of ethics content in the application, preparation, and implementation of its FG and PG exams.  Licensed professional geoscientists must continue to understand that geoethics is foundational for their work within society.  For references and resources, visit CroninProjects.org/EGU-Geoethics2024/.

How to cite: Cronin, V.: The need to include ethics content in professional licensure exams in the US (and worldwide), EGU General Assembly 2024, Vienna, Austria, 14–19 Apr 2024, EGU24-6136, https://doi.org/10.5194/egusphere-egu24-6136, 2024.

EGU24-6573 | ECS | Orals | EOS4.4

Proposal for a Geoethics Code for the Geoscientist Community of Chile 

Hernán Bobadilla, Luisa Pinto Lincoñir, Pablo Ramirez, Thiare González, José Benado, Nilda Lay, Tania Villaseñor, Millarca Valenzuela, Mohammad Ayaz Alam, and Alejandro Pérez

The proposal of the Geoethics Code (hereinafter “Code”) of the Geological Society of Chile arises as a strategic objective of the Geoethics Group within this institution. The Code encapsulates the principles and values that ethically guide and protect the professional decisions of geoscientists in Chile to protect society and the environment. Likewise, it establishes standards of conduct from the personal to the environmental dimension of professional and scientific practice. Consequently, the Code serves as a valuable tool to the geoscientist community in Chile, facilitating reflection and decision-making within an ethical framework.

Grounded in the principles and values defined by the Geoethics Group of the Geological Society of Chile and the Cape Town Geoethics Declaration of the International Association Promoting Geoethics (IAPG) from 2016 (Di Capua et al., 2017), the Code is built upon four titles: a) Professional and scientific work; b) Geosciences and its relationship with society; c) Geosciences and its relationship with the environment; and d) Contribution to new generations of scientists and professionals in Geosciences.

The construction strategy of the Code underscores the pivotal role of the Chilean geoscientist community. Thus, the Code proposal was enriched through consultations, including surveys, meetings, discussions, and seminars, engaging the Geoscientist Community of Chile to understand their perspectives on pertinent topics and challenges. Furthermore, consultations and reflections were conducted to validate the Code proposal before and during the XVI Chilean Geological Congress in 2023. Ultimately, the Code underwent validation with experts from the IAPG, including geoscientists representing Latin America. Consequently, the Code authentically represents the concerns and challenges of the national geoscientific community while also resonating with the international geoscientific community.

Financing

This project is sponsored by the Geological Society of Chile.

Acknowledgements

To the geoscientist community of Chile, the IAPG experts and other professionals who have participated in the process of construction and reflection on the titles of the proposed Geoethics Code.

References

Di Capua, G., Peppoloni, S., Bobrowsky, P.T., 2017. The Cape Town Statement on Geoethics. Annals of Geophysics, 60, Fast Track 7: Geoethics at the heart of all geoscience. doi: 10.4401/ag-7553.

Keywords

Geoethics Code, Principles and Values, IAPG, Geoscientist Community.

How to cite: Bobadilla, H., Pinto Lincoñir, L., Ramirez, P., González, T., Benado, J., Lay, N., Villaseñor, T., Valenzuela, M., Alam, M. A., and Pérez, A.: Proposal for a Geoethics Code for the Geoscientist Community of Chile, EGU General Assembly 2024, Vienna, Austria, 14–19 Apr 2024, EGU24-6573, https://doi.org/10.5194/egusphere-egu24-6573, 2024.

EGU24-6593 | ECS | Posters on site | EOS4.4

Invitation to a research project on geography and climate education 

Pimnutcha Promduangsri

Educational approaches around the world are shaped by diverse geographical factors, including topography, climate, distance, urbanization and societal characteristics.  As a consequence, the methods employed for climate change education (CCedu) are expected to vary according to these geographical factors.

The United Nations Educational, Scientific and Cultural Organization (UNESCO) emphasizes the crucial role of CCedu in fostering an understanding of and effective response to the impacts of the climate crisis.  The Intergovernmental Panel on Climate Change (IPCC) highlights the importance of a globally conscious population for effectively addressing and adapting to climate change challenges.

However, rather than exploring the concept of CCedu or its effectiveness, my research project will focus on identifying the influence of geographical factors on climate change education/literacy.  In the long run, this project could potentially contribute to improving the effectiveness of CCedu.  I invite participants to visit my poster to discuss, share ideas and collaborate on this research project.

How to cite: Promduangsri, P.: Invitation to a research project on geography and climate education, EGU General Assembly 2024, Vienna, Austria, 14–19 Apr 2024, EGU24-6593, https://doi.org/10.5194/egusphere-egu24-6593, 2024.

Environmental (in)justice arising from Climate change and urbanization exhibit uneven distributions, specifically impacting disadvantaged communities. While studies in the USA highlight the elevated heat exposure faced by low-income and ethnic minority groups, similar insights are lacking for other countries. This knowledge gap impedes a comprehensive understanding of environmental (in)justice experienced by various socio-economic and ethnic groups and hampers the identification of inadequacy in urban planning policies.

This research seeks to bridge the gap between social and environmental sciences to address environmental (in)justice by establishing a link between extreme heat (at both regional and country level) and socio-economic disparities for Australia and New Zealand. Using remotely sensed satellite data for Land Surface temperature mapping for summer (night time) and Census data of countries, the analysis explores various socio-economic indicators—such as education levels, age demographics, and the proportion of foreign populations.

Australia and New Zealand serve as pertinent case studies due to their distinct socio-economic landscapes and Indigenous populations. By recognizing the unequal distribution of urban heat and its disproportionate impact on vulnerable communities, there emerges a critical mandate to prioritize equitable urban planning policies. This research underscores the urgency for policymakers and urban planners to prioritize environmental justice interventions and integrate strategies that aim to reduce race and class disparities concerning urban heat. The findings also serve as a template for similar analyses globally; fostering inclusive, equitable and resilient urban landscapes.

How to cite: Chawla, J. and Benz, S.: Examining Race and Class Disparities in Urban Heat in Australia and New Zealand: Towards Environmental Justice in Urban Planning, EGU General Assembly 2024, Vienna, Austria, 14–19 Apr 2024, EGU24-6662, https://doi.org/10.5194/egusphere-egu24-6662, 2024.

EGU24-7655 | Orals | EOS4.4

Delivering Critical Raw Materials: Ecological, Ethical and Societal Issues 

Richard Herrington and Sarah Gordon

Leaders across geographical and political boundaries are united behind a pledge to deliver a net zero carbon world by 2050.  Society’s conundrum is that mining is an essential part of that delivery, yet is an activity regarded by many as unpalatable. Projects that have fallen short on ecological, ethical, or social grounds, serve to confirm to many that mining is currently not an industry to be trusted, rather than being the industry that could and should be empowering significant societal development.

Examples of societal failure include the incidents around the 2012 miners’ strike at the Marikana platinum mine in South Africa which escalated into violence and loss of life.  Failure on ethical grounds was most recently highlighted by the settlement of corruption claims in the Democratic Republic of Congo (DRC) where international mining company staff bribed country officials to secure “improper business advantages.”  Ecological failures are all too common and most visible in the failure of tailings storage facilities such as the 2015 Mariana (Brazil), 2019 Brumadinho (Brazil), and 2022 Jagersfontein (South Africa) dam disasters.

The challenge for those who explore, extract, and process the raw materials so vital for the energy transition, is to do so whilst delivering on true Sustainability right from the start of any project.  Mining disasters are rarely a surprise.  The proactive management of both threats and opportunities is therefore key to the urgent delivery of materials to secure our net zero future in a responsible manner.  We must ensure that this delivery is achieved by projects with wholly net positive outcomes for the environment and people.

How to cite: Herrington, R. and Gordon, S.: Delivering Critical Raw Materials: Ecological, Ethical and Societal Issues, EGU General Assembly 2024, Vienna, Austria, 14–19 Apr 2024, EGU24-7655, https://doi.org/10.5194/egusphere-egu24-7655, 2024.

EGU24-8075 | Orals | EOS4.4

Can landslides provide geosystem services? 

Martin Mergili, Christian Bauer, Andreas Kellerer-Pirklbauer-Eulenstein, Jana Petermann, Hanna Pfeffer, Jörg Robl, and Andreas Schröder

The concepts of biodiversity and ecosystem services, focusing on the diversity of life and the services provided to humans by such diversity, in interaction with abiotic ecosystem components, are well established. Only recently, geosciences have started to challenge this rather biocentric view by highlighting that geodiversity – understood as the diversity of minerals, rocks, geological structures, soils, landforms, and hydrological conditions – provides substantial services to society and should be treated as equal partner to biodiversity. It was proposed to use the more general term natural services or, where geodiversity is much more relevant than biodiversity, geosystem services. Even though the term geosystem services is more and more employed in literature, it evolves only slowly into a commonly used concept with a clearly defined meaning. Interpretations range from all services associated with geodiversity which are independent of interactions with biotic nature, to the restriction to subsurface services. None or few of these concepts, however, include risks as negative services, or as costs of services, which is surprising as this would enable a more integrated vision on human-nature relationships. Only very recently, the potential of geosystem service maps to highlight both services and risks related to geomorphological processes was pointed out.

This work picks up landslides as a type of geomorphological process and landform, which is rather negatively connotated in society and associated with risks rather than with chances. We use landslides to develop a broader understanding of geosystem services, together with the common understanding of hazards and risks. We will (i) present a sound and integrated conceptual framework to consider landslides within the field of tension between risks and resources, and (ii) highlight a case study where landslides are used as cultural geosystem services for environmental education in the context of UNESCO Global Geoparks, which are considered important instruments for conserving and promoting geodiversity.

How to cite: Mergili, M., Bauer, C., Kellerer-Pirklbauer-Eulenstein, A., Petermann, J., Pfeffer, H., Robl, J., and Schröder, A.: Can landslides provide geosystem services?, EGU General Assembly 2024, Vienna, Austria, 14–19 Apr 2024, EGU24-8075, https://doi.org/10.5194/egusphere-egu24-8075, 2024.

EGU24-10646 | Posters virtual | EOS4.4

Protects and Heats 

Walter Tavecchio

The project “Protects and Heats” aims to safeguard the environment, to reduce the carbon dioxide emissions and the risk of collapse of buildings affected by earthquakes.

This is a new way to heat and cool buildings and at the same time mitigate the seismic vibrations.


The logic of the project is to create a discontinuity (Moat) in the ground in front of the structures to be protected, similar to damping methods that are implemented to dampen the vibrations produced by mechanical machines and without compromising the stability of the buildings themselves.

The project involves the construction of a double row of aligned micro piles and the insertion of HDPE and steel pipes inside the vertical drilling holes.

Closed circuit geothermal probes will be positioned, inside some vertical holes, with a low enthalpy closed circuit geothermal system.

The method of the project is achieved by combining two types of technologies:

-   The first concerns the interposition, between the direction of the seismic waves and the buildings, of a damping barrier.

The vertical barrier starting from the topographic surface will be positioned outside the buildings, generally orthogonal to the direction of the seismic waves.

-  The second concerns the installation of geo-exchange pipes, in the holes.

How to cite: Tavecchio, W.: Protects and Heats, EGU General Assembly 2024, Vienna, Austria, 14–19 Apr 2024, EGU24-10646, https://doi.org/10.5194/egusphere-egu24-10646, 2024.

EGU24-12918 | Orals | EOS4.4

The most consequential ethical decision for geoscience  

Emlyn Koster and Philip Gibbard

A geological definition of the Anthropocene, shorthand for humanity’s cumulative disruption of the Earth-Human Ecosystem, looms as the planet-and-people focused UN approaches its Summit of the Future in New York City on 22-23 September 2024. The International Union of Geological Sciences (IUGS) “aims to promote development of the Earth sciences through the support of broad-based scientific studies relevant to the entire Earth system”. With the UN recently declaring that the planet is in peril and in need of a rescue plan, Anthropocene considerations with a geoethical lens are urgently needed.

Each potential new interval in the Geological Time Scale begins with a working group mandated by the International Stratigraphic Commission (ICS), in the case of the Anthropocene also by its Subcommission on Quaternary Stratigraphy (SQS). The Anthropocene Working Group (AWG) was formed in 2009. In 2010, its first chair Jan Zalasiewicz with co-authors Mark Williams, Will Steffen and Paul Crutzen recognized that “the Anthropocene represents a new phase in both humankind and of the Earth, when natural forces and human forces become intertwined, so that the future of one determines the fate of the other”. In 2015, the AWG’s second and current chair Colin Waters with ten co-authors posed the question "Can nuclear weapons fallout mark the beginning of the Anthropocene Epoch?" in the Bulletin of the Atomic Scientists. This was affirmed in 2019 and the AWG presented its recommendation to the SQS in early 2024. The remaining review and decision steps are the ICS and IUGS. Reflecting concerns of other geoscience scholars as well as of other professions and an anxious public, an opposing mindset advocates for an Anthropocene event that spans the cumulative and ongoing environmental impacts of Homo sapiens. It views Geological Time Scale protocols as unsuitable for archaeological and contemporary developments, regards unemotive references to humanity’s most abhorrent invention as distasteful, and visualizes the Anthropocene Event as valuably informing a new zeitgeist for our troubled world.

In 1950 astronomer Fred Hoyle anticipated that humanity’s first view of the Earth from space would revolutionize the course of history. Insofar as a ‘giant leap of mankind’ did not result from NASA’s Apollo 1969 lunar mission with its estimated 600 million viewers, the Anthropocene Event fuels an opportunity for geoscience to inform a realistic outlook during NASA’s upcoming Artemis lunar mission. With unique knowledge of once pristine environments, current climate change and incipient sea level rise, ongoing biodiversity loss and ecosystem disruption, finite energy and mineral resources, the geoscience profession should arguably have already become a crucial asset in this troubled world.

How to cite: Koster, E. and Gibbard, P.: The most consequential ethical decision for geoscience , EGU General Assembly 2024, Vienna, Austria, 14–19 Apr 2024, EGU24-12918, https://doi.org/10.5194/egusphere-egu24-12918, 2024.

EGU24-13965 | Orals | EOS4.4

Ocean Futures: A New Paradigm and Teaching in the Age of Ocean Change 

Susanne Neuer, Stephanie Pfirman, Roberta Martin, Katie Kamelamela, Amy Maas, and Nick Bates

The new School of Ocean Futures (oceans.asu.edu) at Arizona State University (Tempe, AZ, USA) has embarked on a novel way of teaching ocean science with a forward-looking philosophy that centers on the current and future states of the ocean. While situated in Arizona State University’s main campus, it leverages the location of its two offshore campuses, the Center of Global Discovery and Conservation Science in Hilo, Hawaii, and the Bermuda Institute of Ocean Sciences (BIOS) in Bermuda. The Ocean Futures programs combine aspects of traditional ocean science teaching with ocean stewardship, partnerships, and Indigenous knowledge, and focus on the communities that live with the ocean and are affected by its rapid change. In this presentation we will introduce the curriculum of the new degree, as well as the challenges encountered, and best practices learned. Novel courses include “Introduction to Ocean Futures”, a capture course that aims at increasing the interdisciplinary knowledge of oceans, while actively seeking to increase diversity and retention in the field via inclusive pedagogical practices, the historical context of oceanography and an emphasis on developing a mindset of empowerment for change. It is followed by “Ocean Communities”, a course that immerses students through an ethnobotanical lens in global mountain to ocean cultural connections, while elaborating on how various human communities engage, exchange, and build relationships with regional resources. The students will receive hands-on aquatic knowledge through field courses at BIOS, the Sea of Cortez, Hawaii, and Antarctica. The curriculum culminates with an ocean workshop and capstone course that will allow the students to work directly with partners to address real-world challenges facing coastal communities and marine systems.


How to cite: Neuer, S., Pfirman, S., Martin, R., Kamelamela, K., Maas, A., and Bates, N.: Ocean Futures: A New Paradigm and Teaching in the Age of Ocean Change, EGU General Assembly 2024, Vienna, Austria, 14–19 Apr 2024, EGU24-13965, https://doi.org/10.5194/egusphere-egu24-13965, 2024.

In the Anthropocentric era, the human-driven climate crisis has become a serious global issue. To mitigate the impacts of climate change, it is crucial for humans to adopt a more sustainable way of living. Human behaviors are shaped by their culture, where religious beliefs play important roles. As a result, people turned to religions for addressing with climate change issues.

Seeming to be unrelated, religions and climate issues have found connections through social systems and communication. By endowing climate issues with religions meanings, religions are able to resonate with the ecological crisis and take meaningful actions. Through this "resonance," religions contribute to climate issues by shaping worldviews, establishing sustainable habits, initiating actions, and influencing policies.

Religious communities have recognized the severity of the human-driven climate crisis. Their call for action reflects the fact that Taiwanese society has failed to respond to the climate crisis due to its endless pursuit of consumerism. To deal with the challenges, religious communities have advocated for “Ecological Conversion”, which persuade people to save the nature for the sake of God.

How religions can empirically contribute to environment issues has been a long-discussed topic. However, previous literatures only focus on the Western-Christian World. Countries with religious beliefs other than Judeo-Christian ethics are seldom discussed. To explore the relationship between religion and climate in Asian contexts, this research will focus on Taiwan, a multicultural country with various religions.

Using the sample data from the 2020 Taiwan Social Change Survey, this study aims to explore the relationship between religion and climate by conducting factor analysis and ordinary least squares regressions.

The evidence reveals a weak connection between religions and people's climate attitudes in Taiwan. Among all the religions in Taiwan, Buddhists and Christians tend to have the most eco-friendly attitudes. The social networks within these two religious communities foster an eco-friendly atmosphere, which highlights the importance of environmental conservation. However, when it comes to peoples’ willingness to pay, faith holders are less likely to show their supports.

By illustrating the religion-climate relationship in Taiwan, this study demonstrates how these two fields intersect in a non-Western society. It also provides implications for how religions can inspire people's willingness to engage in environmental conservation efforts.

How to cite: Tsui, C. H.: Do religions matter? The empirical study of the religion-climate relation in Taiwan, EGU General Assembly 2024, Vienna, Austria, 14–19 Apr 2024, EGU24-14027, https://doi.org/10.5194/egusphere-egu24-14027, 2024.

EGU24-14752 | Posters on site | EOS4.4

Towards sustainable management of georesources: the importance of Cooperation Projects to boost education on responsible and sustainable mining. The example of the SUGERE and GEODES projects. 

Giovanna Antonella Dino, Susanna Mancini, Dolores Pereira, Manuela Lasagna, Francesca Gambino, Guido Prego, Domingos Gonçalves, Aida Jacinto, Daud Jamal, Josè Loite, Hélio Nganhane, Nelson Rodrigues, and Pedro Dinis

Sustainable and responsible management of geo-resources requires a rethinking and redesign of our production and consumption patterns. Awareness of the natural environment as a common good to be preserved, and knowledge of the close link between the natural environment and the socio-economic system are prerequisites for a profound change in human attitudes at both individual and societal levels. In this context, training and education of all actors involved in the management of geo-resources is an indispensable starting point for the acquisition of critical, ethical, and conscious thinking and the technical skills necessary to solve local problems and initiate sustainable development.

The present research focuses on two consequential ERASMUS+ projects: SUGERE and GEODES. Both had the common goal of the international standardization of Higher Education training and teaching in Earth Sciences and Mining Engineering.

SUGERE (Sustainable Sustainability and Wise Use of Geological Resources) was successfully completed in September 2023, involved 3 European universities (from Portugal, Spain, and Italy) and 6 non-European universities (from Mozambique, Cape Verde, and Angola). The objective was to enhance capacity building for the responsible and sustainable use of geological resources by supporting the didactic organization and standardization of 5 degree courses at Bachelor, Master and Doctorate levels in Earth Sciences and Mining Engineering. Both online and face-to-face training sessions were organized in European and African universities.

GEODES, started in June 2023, represents the continuation of the SUGERE project and involves a total of 9 partners. The same 3 European universities and 6 African institutions, formally attributing teaching and training roles to 2 universities that participated in SUGERE, already achieved a good standard in terms of infrastructures and have long teaching experience in the field of geosciences, and receiving 4 young institutions from less favored regions of Angola and Mozambique.

SUGERE and GEODES projects aim to strengthen the role of geosciences in the development of up-to-date strategies for the sustainable management of natural resources and to implement new collaborations thanks to an international network focused on local economic and social development and respect for the natural environment in the geological-mining context. The culture of sustainability and the deepening of skills in the field of geological mining form the basis for the development of the critical thinking necessary for local problem solving, the acquisition of ethical values and the technical skills that underpin sustainable development.

Deepening technical skills in geomining from a sustainable perspective is crucial for developing critical thinking and acquiring ethical values necessary for solving local problems. SUGERE and GEODES contribute to this outcome with a solid network of research, training, sharing and exchange of expertise and research activities between European and non-European universities interested in mining issues. A careful analysis of the local economic development of the countries involved in the projects is required to achieve the most effective methods for the exploration and sustainable exploitation of underground georesources.


How to cite: Dino, G. A., Mancini, S., Pereira, D., Lasagna, M., Gambino, F., Prego, G., Gonçalves, D., Jacinto, A., Jamal, D., Loite, J., Nganhane, H., Rodrigues, N., and Dinis, P.: Towards sustainable management of georesources: the importance of Cooperation Projects to boost education on responsible and sustainable mining. The example of the SUGERE and GEODES projects., EGU General Assembly 2024, Vienna, Austria, 14–19 Apr 2024, EGU24-14752, https://doi.org/10.5194/egusphere-egu24-14752, 2024.

Since time immemorial, nature, and by extension the ocean, have made positive contributions to the health of mankind. Whether it be fertile soil, pollination, medicine, taking part in mindfulness activities, or food, we as a species depend on the many services provided by the natural world.  Our environment can be linked to some fundamental determinants of health, such as clean air, clean water, and balanced nutrition, and emotional wellbeing.  Therefore, any environmental degradation as a result of climate change has undeniable tangible and intangible effects on human health all over the globe, and this is especially true in relation to mental health in populations occupying Large Ocean Island States (LOIS).   As climate change has led to an increase in extreme weather events, and the accompanying devastation, there has been a corresponding decrease in health and quality of life.  This presentation will explore how the impact of climate change and its corresponding impact on the ocean has enduring impacts, both physiologically and mentally.   Therefore, all of the processes and recommendations to combat climate
change will have important co-benefits to mental and physical health, and help to build resilience in the face of the dearth of resources faced by LOIS. This lack of resources must be urgently addressed, and solutions can be explored by fostering collaboration between mental health professionals and climate scientists to collect sufficient data. The resulting findings can be used to expedite access to the funds needed to implement the necessary levels of mitigation and adaptation specifically tailored to the infrastructural realities of LOIS.

How to cite: Alvarez de la Campa, S.: Climate Change, Ocean Health and Quality of Life - An Inextricable Connection in Large Ocean Island States, EGU General Assembly 2024, Vienna, Austria, 14–19 Apr 2024, EGU24-16730, https://doi.org/10.5194/egusphere-egu24-16730, 2024.

EGU24-17346 | Posters on site | EOS4.4

The importance of making geoethics a central concern of Sri Lankan education strategy 

Giuseppe Di Capua and Udaya Gunawardana

Like numerous regions worldwide, Sri Lanka faces significant environmental challenges that endanger its biodiversity, natural resources, and the well-being of its population. Predominant issues encompass water and air pollution, land degradation, deforestation, improper waste disposal, consequences of climate change, disaster risks, as well as the loss of biodiversity and geodiversity. The nexus between political, economic, and social factors contributes to these geo-environmental challenges, often exacerbated by the politicization of the environmental issues in Sri Lanka. However, it is crucial to acknowledge that human activities primarily drive these conditions. Gunnar Myrdal’s Soft State theory asserts that despite the existence of multiple governing bodies, regulations, and laws, humans strategically transcend the environment leading to the depletion of geo-environmental resources within a context of strong societal inequalities, particularly in developing countries influenced by the historical conditioning of colonial interests by developed nations. A philosophical exploration of this issue emphasizes the pivotal role of human indifference towards the environment and natural resources in causing these challenges. To address this issue effectively, a transformation in people's attitudes is imperative, and education emerges as the most potent tool for this purpose. However, a careful analysis of Sri Lanka's primary and secondary school curricula reveals an absence of a dedicated discipline addressing the philosophical and social dimensions of the geo-environmental matter. In light of this, the incorporation of subjects such as geoethics, which specifically addresses the ethical problems in the human-environment interaction, becomes paramount. Integrating geoethics into the educational framework, particularly at primary and secondary levels, stands as the foundation of a sustainable and responsible strategic approach to many societal and environmental problems. This educational strategy should envision as the most important solution to mitigate the majority of geo-environmental problems in Sri Lanka, fostering environmentally sensitive and responsible citizens.

How to cite: Di Capua, G. and Gunawardana, U.: The importance of making geoethics a central concern of Sri Lankan education strategy, EGU General Assembly 2024, Vienna, Austria, 14–19 Apr 2024, EGU24-17346, https://doi.org/10.5194/egusphere-egu24-17346, 2024.

EGU24-17614 | Orals | EOS4.4

Choice Question (MCQ) Peer Construction for Training Students as Climate Change decision-makers or Knowledge Spreaders 

Gérard Vidal, Charles-Henri Eyraud, Carole Larose, and Éric Lejan

After more than 40 years of reasoned alerts from the scientific community directed towards society, with minimal impact, a recent surge in the size and frequency of extraordinary climatic events has begun to reshape the perspectives of ordinary citizens. This situation underscores the challenge of directly influencing society with scientific evidence or models, emphasizing the crucial role of universities in training students who will occupy intermediate or elevated positions that may impact society at large.

While "Climate Fresk" has gained widespread popularity in higher education institutions as an effective tool for raising awareness about climate change and the intricate processes affecting our global earth ecosystem, concerns have arisen at the university level. The repetition of "Climate Fresk" or similar tools may be perceived as greenwashing practices, as university students are already well-acquainted with the issue. Hence, there is a need to surpass mere awareness in higher education.

As TASK Change Leaders at ENS-Lyon, we explored pedagogical and assessment tools provided by Sulitest. This initiative, extends beyond climate and ocean changes, it places a significant emphasis on various topics, including Sustainable Development Goals, earth limits, and driving processes of climate change. One of the major interest of the approach is to address all disciplines (scientific or non scientific).

We built a three-step strategy involving:

  • Administering a positioning test to enable students to assess their performance relative to the institution and the wider community.

  • Utilizing the looping tool from Sulitest, wherein small teams of students generate Multiple Choice Questions accompanied by a list of academic publications validating the terms of their questions. Subsequently, these questions are discussed in large interdisciplinary open groups, compelling students to articulate questions and answers intelligible across all disciplines.

  • Participating in the TASK to receive an assessment of their proficiency in sustainable development, evaluated by an external body.

This strategy, particularly the second step, empowers students to assume the role of a teacher or knowledge spreader in the face of a diverse peer community. It serves as a simulation of their potential future roles as educators, knowledge spreaders or decision-makers, instilling an understanding of the importance of providing validated sources and the challenges associated with crafting questions and answers comprehensible to all, preparing them for future teaching or decision-making scenarios. A notable byproduct is the creation of valuable pedagogical resources in a "connectivist MOOC flavor."

Beyond the training benefits, membership in the TASK Change Leaders group provides opportunities for discussions on the sustainability of education, green education, and competency frameworks, to apply to ourselves the concepts we are teaching.

How to cite: Vidal, G., Eyraud, C.-H., Larose, C., and Lejan, É.: Choice Question (MCQ) Peer Construction for Training Students as Climate Change decision-makers or Knowledge Spreaders, EGU General Assembly 2024, Vienna, Austria, 14–19 Apr 2024, EGU24-17614, https://doi.org/10.5194/egusphere-egu24-17614, 2024.

EGU24-20953 | Posters on site | EOS4.4

Shaping Thriving Ocean Futures – Education to advance healthy coastal communities and marine systems 

Susanne Neuer, Stephanie Pfirman, Roberta Martin, Katie Kamelamela, Amy Maas, Andrew Peters, and Nick Bates

The new Ocean Futures program at Arizona State University (Tempe, AZ, USA) prepares students to become coastal and marine stewards, community leaders, innovators, and researchers capable of shaping the future of the world's oceans.  The program is taught and mentored by faculty and community leaders in an environment that supports our students’ individual and collaborative strengths, creativity, and diversity.  Students learn and work across disciplines, exploring global and local ocean dynamics, ecosystems, and stressors, engaging with community contexts and livelihoods, and advancing culturally-appropriate, reciprocal stewardship.  In support of ASUʻs mission of embeddedness and linking innovation to public value, graduates of the School of Ocean Futures are equipped with the knowledge and skills to work with diverse communities and partners to create innovative solutions for our changing world.

The School of Ocean Futures educational goal is to build student capacity to apply knowledge of coastal and marine systems coupled with community partnerships to help shape thriving futures, both locally and globally.  Students engage in research and work with partners in Arizona, the Bermuda Institute of Ocean Sciences (BIOS) in Bermuda, the Center of Global Discovery and Conservation Science in Hilo, Hawaii, the Sea of Cortez, and Antarctica.

Ocean Futures education at ASU is based on an innovative “cascade” curriculum.  The cascade starts with core classes in Introduction to Ocean Futures and Ocean Communities, followed by foundational courses in sciences and mathematics, an upper-level core class in Oceanography, electives focused on partnerships, stewardship, and advanced problem-solving, and culminates in an applied workshop and capstone course where students work with partners to transfer knowledge to action in addressing problems facing coastal communities and marine systems.

How to cite: Neuer, S., Pfirman, S., Martin, R., Kamelamela, K., Maas, A., Peters, A., and Bates, N.: Shaping Thriving Ocean Futures – Education to advance healthy coastal communities and marine systems, EGU General Assembly 2024, Vienna, Austria, 14–19 Apr 2024, EGU24-20953, https://doi.org/10.5194/egusphere-egu24-20953, 2024.

Fifty years ago, Peter Berg developed a way to locate yourself within your bio-region, starting with your watershed. To begin, trace your water from precipitation to tap—and back to precipitation. Then, how much rain fell in your area last year? How much water does your household consume per month? What percentage of your town’s water supply goes to households? to manufacturing? to farming? to golf courses? to mining operations? to extinguishing fires? What pollutants affect your water supply? Once you can map your local water supplies, consider how manufacturing transistors, operating data storage centers and streaming videos impact international waters. With awareness of our daily lives’ impacts on local and international waters, we can create realistic limits.  

How to cite: Singer, K.: Mapping water from our tap to the watershed: A first step toward ecological limits  , EGU General Assembly 2024, Vienna, Austria, 14–19 Apr 2024, EGU24-21221, https://doi.org/10.5194/egusphere-egu24-21221, 2024.

This ongoing project integrates the concept of science diplomacy, conducting an in-depth exploration of the intricate interrelations among geo-bio-cultural diversity and its pivotal role in peace building, risk management, and climate action in Colombian cities and territories. Leveraging geodiversity assessment and its correlation with biodiversity, we explore how the bio-geo duplex interacts with ethnic diversity in Colombia. The aim is to develop initiatives aligned with the ancestral knowledge of indigenous, African-descended, farmers, and mixed-Colombian communities across cities and territories withing the geoethics concept.
In the realm of science diplomacy, our emphasis lies in cultivating international collaboration and knowledge exchange to tackle intricate societal challenges. We seek to foster dialogue and cooperation among traditional and nontraditional actors, advocating for the integration of scientific expertise with local and indigenous knowledge. The study provides a comprehensive analysis, considering historical, environmental, economic, social, and political contexts. It sheds light on how these interactions unfold and their diverse representations across Colombia, including the Caribbean, Pacific, and Andean regions.

How to cite: Marin-Ceron, M. I.: Science Diplomacy with Nontraditional Actors: Enhancing Geo-Bio-Cultural Diversity in Colombian Cities and Territories, EGU General Assembly 2024, Vienna, Austria, 14–19 Apr 2024, EGU24-22117, https://doi.org/10.5194/egusphere-egu24-22117, 2024.

In response to gradually expanding populations and the demand for food, excess anthropogenic phosphorus (P) input to watersheds leads to accumulating large P reservoirs in land systems, which becomes a persistent source of P pollution to aquatic systems, hindering the effectiveness of implementing water quality management. Therefore, clarifying the cycling process of P in watersheds, quantifying the legacy effects of P and identifying the spatial distribution of legacy P are key scientific issues for effectively developing watershed P management. We applied a modification Exploration of Long-tErM Nutrient Trajectories-Phosphorus model in a typical agricultural watershed in eastern China, which can well quantify the dynamics of legacy P over 40 years along the land-aquatic continuum. Modification of P erosion loss module improved the efficiency metrics of the model. The model indicated that the lag time for legacy P effects in the watershed was up to 10 years. P inputs increased by 40% (5.1 kg P ha-1 yr-1-9.8 kg P ha-1 yr-1) between 1980 and 2000 and decreased by 55% (9.8 kg P ha-1 yr-1-3.4 kg P ha-1 yr-1) between 2000 and 2020. Riverine P export fluxes increased from 0.11 kg P ha-1 yr-1to 1.49 kg P ha-1 yr-1 (13-fold increase) from 1980 to 2012, and then decreased to 0.96 kg P ha-1yr-1from 2012-2020 years to 0.96 kg P ha-1 yr-1 (35% decrease). The modification model was effective in clarifying the spatial and temporal distribution of legacy P and proposed an effective method to guide watershed P management.

How to cite: Hao, W. and Dingjiang, C.: Modification of exploration of long‐term nutrient trajectories for phosphorus (ELEMeNT-P) model to quantify legacy phosphorus dynamics in a typical watershed of eastern China, EGU General Assembly 2024, Vienna, Austria, 14–19 Apr 2024, EGU24-713, https://doi.org/10.5194/egusphere-egu24-713, 2024.

Streams and rivers emit substantial amounts of nitrous oxide (N2O) and are therefore an essential component of global nitrogen (N) cycle. Permafrost soils store a large reservoir of dormant N that, upon thawing, can enter fluvial networks and partly degrade to N2O, yet the role of waterborne release of N2O in permafrost regions is unclear. Here we report N2O concentrations and fluxes during different seasons between 2016 and 2018 in four watersheds on the East Qinghai-Tibet Plateau. Thawing permafrost soils are known to emit N2O at a high rate, but permafrost rivers draining the East Qinghai-Tibet Plateau behave as unexpectedly minor sources of atmospheric N2O. Such low N2O fluxes are associated with low riverine dissolved inorganic N (DIN) after terrestrial plant uptake, unfavorable conditions for N2O generation via denitrification, and low N2O yield due to a small ratio of nitrite reductase: nitrous oxide reductase in these rivers. We estimate fluvial N2O emissions of 0.432−0.463 Gg N2O-N yr−1 from permafrost landscapes on the entire Qinghai-Tibet Plateau, which is marginal (~0.15%) given their areal contribution to global streams and rivers (0.7%). However, we suggest that these permafrost-affected rivers can shift from minor sources to strong emitters in the warmer future, likely giving rise to the permafrost non-carbon feedback that intensifies warming.

How to cite: Zhang, L. and Stanley, E.: Unexpectedly small N2O emissions from alpine permafrost rivers on the East Qinghai-Tibet Plateau, EGU General Assembly 2024, Vienna, Austria, 14–19 Apr 2024, EGU24-1448, https://doi.org/10.5194/egusphere-egu24-1448, 2024.

EGU24-1498 | Orals | BG4.4

Recent developments integrating connected non-lotic and ephemeral water bodies into the Pulse-Shunt Concept 

Taylor Maavara, Kelly Aho, Craig Brinkerhoff, Laura Logozzo, Lee Brown, William McDowell, and Peter Raymond

River networks have been conceptualized as “leaky pipes” for carbon loss. However, there remains considerable uncertainty regarding where, when, and how carbon loss takes place along the aquatic continuum across hydroclimatic conditions. Recent modelling efforts have been developed to (1) connect river reaches with non- or semi-lotic systems including lakes, reservoirs, floodplains and wetlands, and (2) account for river network connectivity via quantification of ephemeral streamflow. These models, which use techniques such machine learning to scale from local measurements to high-resolution river network data products, enable the quantification of relative carbon loss fluxes in lentic vs. lotic systems across stream orders (“where”) within standardized hydroclimatic scenarios representing the full continua of flows and seasonal conditions possible within a watershed (“when”). These models further quantify carbon uptake via both biomineralization and photomineralization (“how”). We frame findings into an updated conceptual model of the Pulse-Shunt Concept, which builds on the representation of river networks as leaky pipes by correlating the “leakiness” with dependence on flow and stream order. We suggest that lakes and other lentic systems should be considered as reactivity “nodes” interspersed along mostly unreactive or passive river reaches. We additionally discuss how these river network modelling approaches can continue to be improved using sensor networks.

How to cite: Maavara, T., Aho, K., Brinkerhoff, C., Logozzo, L., Brown, L., McDowell, W., and Raymond, P.: Recent developments integrating connected non-lotic and ephemeral water bodies into the Pulse-Shunt Concept, EGU General Assembly 2024, Vienna, Austria, 14–19 Apr 2024, EGU24-1498, https://doi.org/10.5194/egusphere-egu24-1498, 2024.

Understanding the dynamics of organic carbon load in lakes and reservoirs is vital for comprehending the potential impact of human disturbance on the hydrological and carbon cycle. This study investigates the spatial and temporal variability of water volume and total organic carbon (TOC) concentration and examines changes in the TOC load during a drought year. We conducted a systematic analysis of water volume and TOC concentration data from 2,484 agricultural reservoirs in South Korea, covering 2020 to 2022 at both provincial and county levels. At the national level, the yearly TOC loads range between 1387 tons and1464.84 tons. This study conducts the rotated Principal Component Analysis (rPCA) of water volume and TOC concentration. The first rPCA mode showed a decreasing trend of water level (38% of the explained variance) and increasing trend of TOC concentration (23%) over the southern Korea region. The second rPCA mode is related to interannual variability of water level (23.5%) and TOC concentration (20%) over the central Korea region. In 2022, the southern and central Korea regions have a noticeable difference in water volume and TOC concentration. These variations were closely associated with a prolonged meteorological drought event in the southern Korea region, causing increased TOC levels and reduced water volume and thus changing a role of reservoirs from a carbon sink to a carbon source. This study provide insight about how organic carbon interacts with an extreme hydroclimatic condition in agricultural reservoirs.

How to cite: Lee, K.-H. and Kam, J.: Spatiotemporal patterns of water volume and total organic carbon concentration of agricultural reservoirs over South Korea, EGU General Assembly 2024, Vienna, Austria, 14–19 Apr 2024, EGU24-2420, https://doi.org/10.5194/egusphere-egu24-2420, 2024.

EGU24-2512 | ECS | Posters on site | BG4.4

Relative importance of groundwater and sediment-produced methane in stream emissions of two boreal catchments  

Sivakiruthika Balathandayuthabani, Balathandayuthabani Panneer Selvam, Magnus Gålfalk, Peter Saetre, Sari Peura, Ulrik Kautsky, Leif Klemedtsson, Lakshmanan Arunachalam, Geethalakshmi Vellingiri, and David Bastviken

Inland waters are important sources of methane (CH4) to the atmosphere. Significant quantities of CH4 are shown to be emitted from stream networks, despite their small areal coverage. Considerable gaps and uncertainties exist in the knowledge on the regulation of stream CH4 emissions, and their contribution to landscape scale C emissions. When the CH4 input from groundwater/surface runoff or from sediment production reaches the discharge areas, CH4 can either be microbially oxidised to carbon dioxide or emitted to the atmosphere. The relative importance of these sources and fates has implications for modelling and assessing long-term ecosystem CH4 balances. In the existing body of literature, there is a clear lack of data on the share of groundwater CH4 and sediment-produced CH4 to the total CH4 input in streams, the extent of CH4 oxidation or emission of these sources and the spatial variability over whole-catchment scales. Here we present a study on the fates of ground water and sediment-produced CH4 reaching stream environments in two different boreal catchments in Sweden. A combination of measurements, including CH4 concentration gradients below stream beds, stable carbon isotope gradient measurements, high resolution stream flux and discharge assessments, were used to follow the transport of CH4 below the stream bed to the stream water surface using inverse mass-balance modelling. The measurements covered all parts of the stream network in both catchments to include spatial variability. We show that around half of the total CH4 entering the streams were from groundwater. Almost all the groundwater and sediment-produced CH4 were oxidised (> 97%) before reaching atmosphere. Emissions to the atmosphere only represented a small fraction of the groundwater and sediment-produced CH4 reaching the stream (< 3%), indicating that CH4 oxidation is a major sink in the studied streams. Our data also reveals large spatial variability in surface water CH4 concentrations, concentration gradients below the stream beds, CH4 inputs, oxidation, and emission related to morphometry and presumably soil characteristics. We emphasize the importance of including spatial variability in stream networks to constrain the uncertainties in stream CH4 budget studies.

How to cite: Balathandayuthabani, S., Panneer Selvam, B., Gålfalk, M., Saetre, P., Peura, S., Kautsky, U., Klemedtsson, L., Arunachalam, L., Vellingiri, G., and Bastviken, D.: Relative importance of groundwater and sediment-produced methane in stream emissions of two boreal catchments , EGU General Assembly 2024, Vienna, Austria, 14–19 Apr 2024, EGU24-2512, https://doi.org/10.5194/egusphere-egu24-2512, 2024.

EGU24-2894 | ECS | Posters on site | BG4.4

Seasonal variation in organic carbon and its bioavailability (Falljökull glacier, Iceland) 

Ann-Kathrin Wild, Christina Fasching, and Peter Chifflard

Predictions regarding the export of organic carbon (OC) linked to glacier runoff remain constrained. Conventional mass balance approaches, which calculate annual OC export based on singular sampling points, overlook potential diurnal and seasonal variations in OC dynamics. In our study, we address this gap by employing high temporal resolution to systematically explore the concentration and composition of glacier-derived OC. Moreover, we examine the bioavailability of OC in glacial discharge directly at the terminus. This comprehensive investigation aims to enable accurate predictions of future OC release resulting from glacier retreat. Our chosen study site is the temperate Icelandic glacier Falljökull, part of the Öræfajökull and Vatnajökull ice cap, selected for its year-round accessibility.

Our findings reveal an average concentration of dissolved organic carbon (DOC) from the glacier of 0.14 mg L-1 based on 72 streamwater samples from the glacier terminus. Seasonal variations are evident with higher concentrations measured in winter (0.19 mg L-1) compared to summer (0.10 mg L-1). While the DOC concentration was relatively low during rain and glacial melt (0.12 mg L-1), snowmelt doubled the DOC concentration (0.20 mg L-1) indicating deposition as a source of glacial DOC. Furthermore, DOC concentration in glacial melt varied on a diurnal basis with peak values during early afternoon at highest discharges. The different weather events are reflected in the glacier discharge which could be shown by comparing the isotopic signature of ice, snow, and precipitation to the isotopic signature of the discharge water during designated events.

Absorbance and fluorescence measurements pointed to a predominantly protein-like, labile composition of DOC in glacial runoff. However, using incubation experiments with glacial meltwater we often found DOC values to increase pointing to the production of OC. Preliminary results highlight the seasonal and diurnal variability of glacial OC concentration and composition and the need to further study glacial OC bioavailability.

How to cite: Wild, A.-K., Fasching, C., and Chifflard, P.: Seasonal variation in organic carbon and its bioavailability (Falljökull glacier, Iceland), EGU General Assembly 2024, Vienna, Austria, 14–19 Apr 2024, EGU24-2894, https://doi.org/10.5194/egusphere-egu24-2894, 2024.

EGU24-3133 | ECS | Orals | BG4.4

Cryosphere-fed rivers in a warming climate, 1950-2050 

Dongfeng Li, Ting Zhang, Irina Overeem, Albert Kettner, Jaia Syvitski, Des Walling, Bodo Bookhagen, Amy East, Jim Best, Achim Beylich, Michele Koppes, Jinren Ni, and Stuart Lane

Cryosphere-fed rivers drain glacier, snow, and permafrost landscapes and are characterized by glacial, nival, pluvial and mixed hydrological regimes. Such river systems originate from high-mountain areas and transport water, sediment, nutrients, and organic carbon downstream, underpinning the freshwater and coastal ecosystems and supporting the lives of more than one-third of the world’s population.

In response to the amplified climate change, accelerating glacier-snow melt and permafrost thaw, the cryosphere-fed rivers are overall becoming warmer, wider and muddier associated with markedly increasing river turbidity and suspended sediment concentration. For instance, observational data from 28 headwater rivers in High Mountain Asia reveal that the river suspended sediment loads have been increasing at a rate of ~13% per decade since the 1950s, much faster than rate of increase of river water discharge (~5% per decade). Leveraging over 120 in-field observations and a sediment-climate elasticity model, we estimate that the present-day river suspended sediment load in High Mountain Asia is nearly two billion metric tons per year, and could more than double by 2050 under an extreme climate change scenario. Beyond High Mountain Asia, such warming-driven increases in river turbidity and suspended sediment concentrations have also widely featured in other cryospheric basins such as the Arctic, European mountains, and Andes.

The muddier rivers carry pollutants, nutrients, and organic carbon, thus affecting water quality and aquatic ecosystems in the cold regions and beyond. Increases in sediment-driven river turbidity can threaten river biotic conditions by blocking sunlight from reaching the streambed, limiting respiration, and deteriorating feeding conditions of benthic macroinvertebrates and fishes, thereby affecting habitat availability. Elevated turbidity can disturb habitats of macroinvertebrates and fishes by filling interstitial spaces between pebble and cobbles on the riverbed, thereby reducing the flow of oxygenated water through bed sediment that is essential to the survival of their eggs. The increased sediment supply especially the coarse sediment further magnifies river channel instability and migration, affecting fish habitats and carbon storage and release.

To better assess the impacts of changing climate on the functions and services of river ecosystems in strategically important cold regions, we highlight the pressing need to integrate multiple-sourced river observations, to develop empirical, physics-based, and AI-based river flux models, and to promote interdisciplinary scientific collaboration. The innovative system approach would best come from the creation of an interdisciplinary collaborative initiative, where climatologists, ecologists, glaciologists, permafrost scientists, hydrologists, civil engineers, and geomorphologists work together to establish an integrated cryosphere–water–sediment–carbon-ecology observation platform that facilitates the mechanism understanding and development of novel and powerful models. Furthermore, dialogues and collaboration between international scientists, stakeholders, local communities, and policymakers would help to bridge the gaps between state-of-the-art scientific findings and practicable adaptation strategies.

How to cite: Li, D., Zhang, T., Overeem, I., Kettner, A., Syvitski, J., Walling, D., Bookhagen, B., East, A., Best, J., Beylich, A., Koppes, M., Ni, J., and Lane, S.: Cryosphere-fed rivers in a warming climate, 1950-2050, EGU General Assembly 2024, Vienna, Austria, 14–19 Apr 2024, EGU24-3133, https://doi.org/10.5194/egusphere-egu24-3133, 2024.

EGU24-3644 | ECS | Orals | BG4.4

Universal microbial reworking of dissolved organic matter along soil gradients 

Erika Freeman, Erik Emilson, Thorsten Dittmar, Lucas Braga, Caroline Emilson, Tobias Goldhammer, Christine Martineau, Gabriel Singer, and Andrew Tanentzap

Soils lose a large amount of carbon annually to freshwaters as dissolved organic matter (DOM), which, if degraded, can undermine climate change mitigation. The degradation state of DOM in aquatic ecosystems can reflect the distance from its source, with DOM increasingly dominated by similar compounds as degradation proceeds. However, the processes underlying the degradation of DOM and its generality across environments are poorly understood. Here we found DOM changed similarly along two soil-aquatic gradients irrespective of environmental conditions. We tracked DOM across soil depths and hillslope positions in forest headwater catchments using ultra-high-resolution mass spectrometry and related its composition to soil microbiomes and physical chemistry. Along both gradients, carbohydrate-like and unsaturated hydrocarbon-like compounds increased in mass, suggestive of microbial reworking of plant material. Most of the variation in the abundance of these compounds (>56%) was related to the expression of genes important for breaking down plant-derived carbohydrates. Our results highlight the value of high-resolution molecular data in understanding global carbon cycles, directly implicate microbial processing in shifting DOM towards universal compounds in soils, and suggest that this process is generalizable across ecosystems and spatiotemporal scales. This consistent degradation process could provide insights for estimating the state of DOM in different environments and inform the management of soil-to-stream carbon losses.

How to cite: Freeman, E., Emilson, E., Dittmar, T., Braga, L., Emilson, C., Goldhammer, T., Martineau, C., Singer, G., and Tanentzap, A.: Universal microbial reworking of dissolved organic matter along soil gradients, EGU General Assembly 2024, Vienna, Austria, 14–19 Apr 2024, EGU24-3644, https://doi.org/10.5194/egusphere-egu24-3644, 2024.

EGU24-3814 | Posters on site | BG4.4

Fifteen years of remote sensing and analyses of the Baltic Sea primary production (2005–2019) 

Dariusz Ficek, Damian Stoltmann, Mirosława Ostrowska, Magdalena Pawlik, and Roman Majchrowski

Present systems based on data recorded by satellites allow for the determination of many characteristics of seas and oceans, including the photosynthetic production of primary organic matter in the water column (PP). The SatBaltic system, launched in 2015, was used to determine PP in the Baltic Sea waters. This system provides daily maps of the spatial distribution of PP values and other characteristics of this sea. Relevant data can be found on the SatBaltic website (www.satbaltyk.pl). The collected extensive data bank allowed for the analysis of a number of processes occurring in the ecosystem of this sea. Photosynthetic primary production of organic matter was analyzed based on data from 2005-2019. Statistical analyzes of PP data available in the SatBaltic System allowed for a quantitative description of its variability in the entire Baltic Sea area. The average daily PP value for the entire Baltic Sea varied from approximately 5 mgC m-2 day-1 in winter (December and January) to over 700 mgC m-2 day-1 in July. The total annual PP value of the Baltic Sea in the analyzed period ranged within (37 to 45)* 106 tC yr-1. The obtained results indicate a slight increase in the productivity of the Baltic Sea over a period of 15 years. PP analyzes also showed significant differences between the productivity of individual reservoirs. In the East Gotland Basin, PP is 4% higher than in the Bornholm Basin, while in the Gdańsk Basin it is 33% higher.

How to cite: Ficek, D., Stoltmann, D., Ostrowska, M., Pawlik, M., and Majchrowski, R.: Fifteen years of remote sensing and analyses of the Baltic Sea primary production (2005–2019), EGU General Assembly 2024, Vienna, Austria, 14–19 Apr 2024, EGU24-3814, https://doi.org/10.5194/egusphere-egu24-3814, 2024.

Nitrous oxide (N2O) is a strong greenhouse gas with ozone layer destruction ability, and its atmospheric concentration has been increasing rapidly due to anthropogenic activities. N2O reduction to dinitrogen (N2), the last step of denitrification, was recognized as the only biological N2O sink. Recently, diazotrophic N2O assimilation to organic nitrogen in biomass by nitrogenase has been discovered in the eastern South Pacific Ocean and cultured diazotroph Crocosphaera and Trichodesmium. N2O assimilation to organic nitrogen is thermodynamically more favored than N2 fixation in higher N2O concentration and cooler environments, but the distribution and detailed mechanism of this new N2O sink are still unclear. We applied isotopic tracing experiments to validate and measure N2O assimilation and built an enzymatic kinetics model for a mechanistic explanation. Cultured diazotroph Crocosphaera (WH8501) and Trichodesmium (IMS101) both showed evident N2O assimilation rates of 0.751 nM N h-1 for Crocosphaera at [N2O]/[N2] = 0.0075, 0.690 nM N h-1 for Trichodesmium at [N2O]/[N2] = 0.01, and 0.481 nM N h-1 for Trichodesmium at [N2O]/[N2] = 0.0005. Although N2O assimilation was assumed to be carried out by nitrogenase, it was asynchronous with the diel rhythmicity of N2 fixation. Field samples from the Pearl River Estuary did not demonstrate the presence of N2O assimilation. Since N2 fixation was absent as well, the isotopic tracer 46N2O barely introduced influences on nitrogen isotopic composition compared to photosynthesis and remineralization, indicating that N2O assimilation is an insignificant N2O sink in eutrophic estuarine waters. Our enzymatic kinetic model revealed that N2 rather than N2O dominated the overall growth rates of cultured diazotrophs. The model indicated the [N2O]/[N2] required for the presence of N2O assimilation in isotopic tracing experiments and explained the absence of this process under natural N2 concentration environments. The insights from this study may suggest new engineering methods to control N2O emissions.

How to cite: Li, G. and Ji, Q.: N2O Assimilation, a New N2O Sink and Organic Nitrogen Source in Aquatic Ecosystems, EGU General Assembly 2024, Vienna, Austria, 14–19 Apr 2024, EGU24-4027, https://doi.org/10.5194/egusphere-egu24-4027, 2024.

EGU24-5677 | Posters on site | BG4.4

The age of buried carbon changes the greenhouse gas budget of a dam 

Jörg Tittel, Yvonne Rosenlöcher, Tallent Dadi, Oliver J. Lechtenfeld, and Carsten Simon

Dams are a globally relevant source of greenhouse gases (GHG), which impair their function as a source of green energy. High burial rates of organic carbon (OC) in dam sediments may partly or fully offset the emissions. We argue that only the burial of carbon fixed in the timespan of dam operation changes the GHG balance. Here, we took sediment cores from a temperate dam. We analyzed radiocarbon age and OC molecular composition by laser desorption ionization mass spectrometry in the bulk OC and in four extract fractions. The bulk samples included modern OC, fixed after 1950. However, the extracted OC was of different ages (modern to 1900 years BP). Compounds with H/O ratios >2.5 predominated in 14C-old fractions, while compounds with ratios <2.5 were abundant in modern extracts. We conclude that only 43% of buried carbon originated from the contemporary atmosphere and can be offset against recent GHG emissions.

How to cite: Tittel, J., Rosenlöcher, Y., Dadi, T., Lechtenfeld, O. J., and Simon, C.: The age of buried carbon changes the greenhouse gas budget of a dam, EGU General Assembly 2024, Vienna, Austria, 14–19 Apr 2024, EGU24-5677, https://doi.org/10.5194/egusphere-egu24-5677, 2024.

EGU24-5808 | ECS | Orals | BG4.4

Reactive macronutrient ratios as predictors for nitrate cycling in stream ecosystems 

Anika Große, Nuria Perujo, Alexander J Reisinger, Patrick Fink, Dietrich Borchardt, and Daniel Graeber

Human activities have significantly altered macronutrient concentrations in surface waters, impacting both ecological functions and water quality. Typically, research assesses this alteration and its effects from a single macronutrient perspective. Alternatively, we propose that macronutrient perspectives need to be integrated via a stoichiometric framework via carbon (C) : nitrogen (N) : phosphorus (P) ratios. These ratios may help to assess and improve natural attenuation at ecosystem and catchment level. From the C:N:P perspective, agricultural practices have resulted in a stoichiometric N surplus in temperate stream ecosystems, an issue of which German streams are a prime example.  In contrast, Florida's streams are characterized by a P surplus relative to N and C due to high geological background P supply.  Our study encompasses five streams in Germany and Florida, covering a wide range of C:N:P ratios, each characterized by distinct catchment characteristics. Here, we ask whether C:N:P ratios are the main driver of microbial nitrate-N uptake, irrespective of other differences between the two regions. Through streamside mesocosm and microcosm laboratory experiments employing an isotope tracer approach, we compared nitrate uptake. Additionally, we manipulated C:N:P ratios to assess the short-term effects on nitrate uptake and measured retention in the streamside mesocosm experiment. Enhancing our understanding of the interconnectedness of biogeochemical cycles enables the development of management recommendations for stoichiometric restoration in highly impacted stream ecosystems. This research contributes valuable insights towards sustainable practices and the preservation of aquatic ecosystems facing nutrient-related challenges and water security.

How to cite: Große, A., Perujo, N., Reisinger, A. J., Fink, P., Borchardt, D., and Graeber, D.: Reactive macronutrient ratios as predictors for nitrate cycling in stream ecosystems, EGU General Assembly 2024, Vienna, Austria, 14–19 Apr 2024, EGU24-5808, https://doi.org/10.5194/egusphere-egu24-5808, 2024.

EGU24-5918 | ECS | Orals | BG4.4

A coupled O2-CO2 model to understand CO2 source partitioning in flowing freshwaters 

Jacob Diamond and Enrico Bertuzzo

The freshwater riverine carbon budget has an unexplained imbalance (~1.5 Pg-C y−1) between estimates of terrestrial C lateral imports and freshwater emissions. This imbalance may be resolved by investigating the source of freshwater CO2 emissions. That is, what proportion of the excess CO2 in rivers comes from lateral CO2 inputs (external, allochthonous sources) versus from riverine respiration of organic matter (internal, autochthonous sources)? We address this question by developing a model to estimate the reach-scale dissolved inorganic carbon (DIC) mass balance using sub-daily time series of dissolved O2 and CO2. The approach extends the classical single station model for the estimation of stream metabolism based on O2 observation by coupling the mass balance of DIC with the lateral input of water, O2 and DIC, and the mass balance of total alkalinity. Here, we present the results of the model application to several study sites across varying discharge and carbonate chemistries. We further show the model's utility in estimating magnitudes of river metabolism, lateral DIC concentration, photosynthetic and respiratory quotients, and carbon flux to the atmosphere.

How to cite: Diamond, J. and Bertuzzo, E.: A coupled O2-CO2 model to understand CO2 source partitioning in flowing freshwaters, EGU General Assembly 2024, Vienna, Austria, 14–19 Apr 2024, EGU24-5918, https://doi.org/10.5194/egusphere-egu24-5918, 2024.

EGU24-6645 | Orals | BG4.4

Three decades of changing nutrient stoichiometry from source to sea on the Swedish west coast 

Michael Peacock, Martyn Futter, Sara Jutterström, Dolly Kothawala, Filip Moldan, Johanna Stadmark, and Chris Evans

European ecosystems have been subject to extensive shifts in anthropogenic disturbance, primarily through atmospheric deposition, climate change, and land management. These changes have altered the macronutrient composition of aquatic systems, with widespread increases in organic carbon (C), and declines in nitrogen (N) and phosphorus (P). Less well known is how these disturbances have affected nutrient stoichiometry, which may be a more useful metric to evaluate the health of aquatic ecosystems than individual nutrient concentrations. The Swedish west coast has historically experienced moderate to high levels of atmospheric deposition of sulfate and N, and eutrophication. In addition, coastal waters have been darkening with damaging effects on marine flora and fauna. Here, we present three decades of macronutrient data from seven watercourses (plus additional lakes) along the Swedish west coast, including headwaters and river mouths, across a range of land covers, and with catchments ranging 0.037 – 40000 km2.

We find a high degree of consistency between these diverse sites, with widespread increasing trends in organic C, and declines in inorganic N and total P. These trends in individual macronutrients translate into large stoichiometric changes, with a doubling in C:P, and increases in C:N and N:P by 50% and 30%, showing that freshwaters are moving further away from the Redfield Ratio, and becoming even more C rich, and depleted in N and P. These changes were not restricted to headwaters but were also evident in larger rivers and at river mouths. Although recovery from atmospheric deposition is linked to some of these changes, land cover also appears to have an effect; lakes buffer against C increases, and decreases in inorganic N have been greatest under arable land cover. Taken together, our findings show that freshwater macronutrient concentrations and stoichiometry have undergone substantial shifts during the last three decades, and these shifts can potentially explain some of the detrimental changes that adjacent coastal ecosystems are undergoing. Our findings are relevant for all European and North American waters that have experienced historically high levels of atmospheric sulphate and N deposition, and provide a starting point for understanding and mitigating against the trajectories of long-term change in aquatic systems.

How to cite: Peacock, M., Futter, M., Jutterström, S., Kothawala, D., Moldan, F., Stadmark, J., and Evans, C.: Three decades of changing nutrient stoichiometry from source to sea on the Swedish west coast, EGU General Assembly 2024, Vienna, Austria, 14–19 Apr 2024, EGU24-6645, https://doi.org/10.5194/egusphere-egu24-6645, 2024.

The evaluation of metal toxicity in sediment has traditionally involved measuring sulfide concentrations and considering organic carbon content through the sediment biotic ligand model. This model operates on the assumption that the predominant formation of insoluble metal sulfides (MeS) renders the metals unavailable for uptake by benthic organisms. Specifically, in cases where the quantity of metals exceeds that of sulfides, the model postulates that the surplus metals will partition to organic carbon. It holds relevance in anoxic environments where sulfides and organic carbon play pivotal roles in metal binding. However, heavy metals susceptible to redox changes may be released from both MeS and organic carbon, particularly in oxidized sediments. Literature indicates elevated concentrations of dissolved Cadmium under oxidizing conditions compared to reduced sediments. Such liberated metals subsequently re-adsorb onto Fe oxides, another significant phase for metal binding.

To enhance cadmium toxicity prediction, we propose an advanced model that considers contributions from both Fe oxides and organic carbon, in addition to sulfide, in oxidized sediment. Partition coefficients (Kd) for both phases were determined using the Windermere Humic Aqueous Model, version 7 (UK Centre for Ecology and Hydrology, 2012), and the relationship with pH was derived through curve fitting to optimize data fitting. Previous studies' data align well with the predicted Kd values. A comprehensive model equation for determining a total Kd, incorporating these Kd values of Fe oxides and organic carbon contents, was formulated. Upon comparison with experimental data from sediment samples collected from 21 different regions in South Korea, the model exhibited accurate predictions within one order of magnitude.

To validate the proposed model, a toxicity test was conducted using a benthic invertebrate, Hyalella azteca, with the same sediment samples. While the previous model predicted toxicity, the observed mortality was less than 24%, indicating non-toxicity to the organism. The new model accurately assessed toxicity and serves as a valuable tool for predicting cadmium toxicity in oxidized sediment.

How to cite: Jeong, B., Shim, G., An, J., and Nam, K.: Integrated Prediction Model for Cadmium Toxicity in Oxidized Freshwater Sediment: Emphasis on the Role of Fe Oxides and Validation with Hyalella azteca, EGU General Assembly 2024, Vienna, Austria, 14–19 Apr 2024, EGU24-7236, https://doi.org/10.5194/egusphere-egu24-7236, 2024.

EGU24-8400 | ECS | Posters on site | BG4.4

Microbial response to climate-induced nutrient alterations in high Arctic freshwaters 

Nicolas Valiente, Laurent Fontaine, Andrea L. Popp, Anja Sundal, Jing Wei, Peter Dörsch, Sigrid Trier Kjær, Dag O. Hessen, and Alexander Eiler

In the Arctic, climate change leads to increased nutrient levels and organic carbon in freshwaters, caused by factors like permafrost thaw and growing populations of geese. Such alterations significantly impact freshwater ecosystems, potentially influencing community composition and diversity across various levels, including general microbial metabolism. We tested the hypothesis that a transition from autotrophy to heterotrophy occurs across a chronosequence of lakes in the high Arctic as a result of glacier retreat, influenced by distinct nutrient supplies and varying ecological succession statuses. To do so, we studied 5 lakes in the vicinity of Ny-Ålesund (Svalbard) following a chronosequence. The older lakes, closer to the fjord, were strongly impacted by birds, notably geese. For each lake, we tested the response to nutrients by adding an artificial nutrient solution with N and P, and the response to light or dark conditions. We incubated unfiltered water samples (80 mL) at 4 ºC in 120 mL flasks with atmospheric air as headspace. After 24h, samples for gases (O2, CO2, CH4 and N2O), nutrients (organic C, P and N) and eDNA (16S metabarcoding) were collected. Ar-corrected gas saturation of each GHG was used as a proxy of net metabolic changes. Regardless of the treatment applied, our results showed an increase in N2O saturation coupled with a decrease in O2 saturation after 24h in bird-impacted lakes, likely related to heterotrophic microbial activity. In such lakes, dark conditions promoted P accumulation, while N accumulated equally in light and dark incubations. In younger lakes (i.e., not impacted by birds), increased O2 saturation after 24h of incubation suggested that phototrophic metabolism was dominant. For nutrients, no significant pattern was observed for both light and dark incubations in younger lakes. Bacterial community composition differed between locations after 24h of incubation with a greater uniformity of species in younger lakes. This research advances our understanding of how nutrient enrichment affects biodiversity in the Arctic and metabolism in freshwater ecosystems.

How to cite: Valiente, N., Fontaine, L., Popp, A. L., Sundal, A., Wei, J., Dörsch, P., Trier Kjær, S., Hessen, D. O., and Eiler, A.: Microbial response to climate-induced nutrient alterations in high Arctic freshwaters, EGU General Assembly 2024, Vienna, Austria, 14–19 Apr 2024, EGU24-8400, https://doi.org/10.5194/egusphere-egu24-8400, 2024.

EGU24-9024 | ECS | Posters on site | BG4.4

Dynamics and patterns of water quality and stream metabolism in a low-land Mediterranean urban stream 

Tal Godinger, Zafrir Adar, and Shai Arnon

Water quality in streams provides fundamental information on ecosystem functioning and status. The use of sensors instead of grab sampling provides near-continuous information on the water quality, which reveals information on hydrological and biogeochemical processes that were unrecognized before. While information from sensors on water quality in temperate climates becomes ubiquitous, it is still rare in semi-arid and Mediterranean climate. The aim of this work was to quantify the dynamics and patterns of water quality and metabolism in a Mediterranean low-land urban stream. Sensors that measure oxygen, carbon dioxide, nitrate, cDOM, chlorophyll a, turbidity, electric conductivity, pH, water level, and light were deployed in July 2019 in the Yarkon Stream, an urban lowland stream in Israel. Preliminary results indicated that seasonal differences were observed under base-flow conditions for parameters that are indicative of biological processes. For example, the average concentrations of nitrate and oxygen were higher in the winter than in the summer. Differences between summer and winter to spring and autumn were less consistent. Seasons also affected the daily fluctuations of the biological-related parameters. For example, oxygen concentrations were roughly stable during the day in the winter but followed a clear peak in the afternoon during the summer. In addition, oxygen consumption was dominant all year long, leading to hypoxic conditions in the stream for most of the year. The driving mechanisms for the observed patterns will be discussed in the presentation, and further comparisons will be made to patterns in streams from temperate climates. It is expected that this work will provide new insights into the water quality dynamics and ecosystem status of Mediterranean streams, which can potentially improve water resources management and future restoration efforts.

How to cite: Godinger, T., Adar, Z., and Arnon, S.: Dynamics and patterns of water quality and stream metabolism in a low-land Mediterranean urban stream, EGU General Assembly 2024, Vienna, Austria, 14–19 Apr 2024, EGU24-9024, https://doi.org/10.5194/egusphere-egu24-9024, 2024.

EGU24-9065 | ECS | Orals | BG4.4

Tracking organic matter pollution and bacteria using fluorescence-based approaches in a UK Chalk stream 

Hannah Gunter, Kieran Khamis, Chris Bradley, David M. Hannah, Catherine M. Heppell, Tom Kelly, Rosie Nelson, Hannah Parry-Wilson, and Rob Stevens

Fluorescence spectroscopy is a rapidly evolving method for determining freshwater organic pollution. Historically, measurement was confined to the laboratory with a coarse temporal resolution. The development of field-deployable sensors has enabled in-situ, multi-peak monitoring - although challenges remain regarding fluctuating environmental conditions (e.g. pH and turbidity) that can impact on fluorometer accuracy and interpretation. This study aimed to use fluorescence spectroscopy (including in-situ sensors) to detect and differentiate sources of organic matter pollution in a predominantly groundwater fed, sewage-impacted, chalk stream.

High frequency monitoring (15 min resolution for 12 months) was undertaken at two sites on the River Chess, S. England. Two multi-parameter water quality sondes were installed above and below a Wastewater Treatment Works (WWTW) effluent outflow point in a mixed land use catchment (105 km2). Additional grab sampling was conducted during baseflow and stormflow for laboratory-based nutrient, spectrofluorimetric and bacterial analysis.

All sites had low turbidity (<10 NTU) and stable pH (7.7-7.8), during baseflow, ideal conditions for using in-situ fluorometers. Both the difference in wavelength intensity and the ratio of Peak T (Ex. 275/ Em. 350) to Peak C (Ex. 325/ Em. 470) could differentiate between sites, with an observable variation in response to diel cycles of effluent release downstream. The T:C ratio was able to characterize events with distinct hydrometeorological signatures (e.g. rainfall total, intensity, and antecedence), hence the ratio offers a feasible way of distinguishing between different sources of organic contamination in real-time. Relationships between fluorescence and nutrient/microbial concentrations varied in response to differing landcover (urban extent) and effluent contributions to bulk discharge. Effluent contributions also affected the strength of relationship between cultures and individual wavelength pairs, highlighting the importance of calibrating data for individual systems.

This study highlights that fluorescence is a valuable tool in both fingerprinting organic pollution and tracing the source across sites of contrasting landcover, and under varying hydro-climatological conditions that occur over event timescales. These findings provide the evidence base to develop a new method of detecting and understanding organic matter pollution events at a time scale that was previously unachievable.

How to cite: Gunter, H., Khamis, K., Bradley, C., Hannah, D. M., Heppell, C. M., Kelly, T., Nelson, R., Parry-Wilson, H., and Stevens, R.: Tracking organic matter pollution and bacteria using fluorescence-based approaches in a UK Chalk stream, EGU General Assembly 2024, Vienna, Austria, 14–19 Apr 2024, EGU24-9065, https://doi.org/10.5194/egusphere-egu24-9065, 2024.

EGU24-9236 | ECS | Orals | BG4.4

Radiocarbon as a key constraint for prediction of river carbon biogeochemistry 

Timo Rhyner, Benedict Mittelbach, Margot White, Lisa Broeder, Olivier Raymond, Negar Haghipour, Alex Brunmayr, Florian Storck, Lucas Passera, Melissa Schwab, Robert Hilton, Jürg Zobrist, and Timothy Eglinton

The lateral transport of riverine carbon is a key component of the global carbon cycle, yet several aspects are poorly understood. In particular, the magnitude and nature of carbon cycle responses in freshwater aquatic networks to on-going climate and environmental change remain unclear. Addressing this issue requires assessment of temporal changes in riverine carbon dynamics and identifying the underlying factors that influence the fate of transported carbon. For example, long-term observations of river chemistry from the Swiss National River Monitoring and Survey Program have revealed a steady increase in dissolved inorganic carbon (DIC) concentrations in the major four Swiss rivers (Rhine, Rhone, Ticino, and Inn) over the past ~50 years, yet the cause of this increase remains unclear. Potential contributors include increased DIC inputs from bedrock weathering, soil organic matter (OM) respiration or OM remineralization within aquatic systems. All of these processes are potentially accelerated with increasing temperatures due to global warming, but they have markedly different implications with respect to carbon cycling and ecosystem dynamics. While sensor monitoring and remote sensing approaches are invaluable for creating high-resolution spatially and temporally resolved data, distinguishing specific source components requires ancillary information. In this context, radiocarbon (14C) measurements obtained through coordinated sampling programs can serve as a powerful complementary constraint on carbon sources, turnover and transport times.

Switzerland provides a unique opportunity to use radiocarbon to assess carbon provenance in alpine streams and rivers, thanks to its high diversity of watersheds spanning strong climatic, elevational, lithological, ecological as well as anthropogenic gradients. This diversity is expressed in a wide range of 14C signatures for particulate organic carbon (POC; Δ14C values, −446‰ to −158‰), for dissolved organic carbon (DOC; −377‰ to −43‰) and DIC (−301‰ to −40‰). We argue carefully designed parallel field sampling of streams and rivers and subsequent measurement of radiocarbon and ancillary geochemical parameters would aid in groundtruthing high-resolution sensor data. To illustrate the value of 14C measurements, we present a multi-year 14C time-series from the sub-alpine Sihl River system to highlight event- and seasonally-driven changes in the composition of riverine carbon POC, DOC, and DIC. We place these observations in the context of 14C measurements on a broad range of Swiss river systems to further investigate overarching controls on fluvial carbon export from alpine and sub-alpine watersheds. Such information can help the design of targeted sampling and measurement programs to complement sensor measurements in order to develop a comprehensive understanding of changing river carbon biogeochemical dynamics.

How to cite: Rhyner, T., Mittelbach, B., White, M., Broeder, L., Raymond, O., Haghipour, N., Brunmayr, A., Storck, F., Passera, L., Schwab, M., Hilton, R., Zobrist, J., and Eglinton, T.: Radiocarbon as a key constraint for prediction of river carbon biogeochemistry, EGU General Assembly 2024, Vienna, Austria, 14–19 Apr 2024, EGU24-9236, https://doi.org/10.5194/egusphere-egu24-9236, 2024.

EGU24-10723 | Posters on site | BG4.4

Low dissolved organic carbon flux in small mountainous catchments of Taiwan 

Pei-Ling Wang, Ya-Fang Cheng, Jing-Yi Tseng, and Li-Hung Lin

Stream dissolved organic carbon (DOC) is an important component of the global carbon cycle. The export ofDOC from land to the ocean is well quantified by examining large rivers, but this often excludes small mountainous rivers (SMRs), where DOC is primarily allochthonous and acts as a microbial energy source, shaping stream biogeochemical cycling. Revealing the temporal and spatial variation of DOC in SMRs is crucial for filling the missing piece of DOC export and understanding the role of DOC in stream ecology.Taiwan frequently experiences extreme weather events and earthquakes, thereby featuring deep river incisions, rapid uplift and erosion, and limited soil development. It represents an ideal model system for studying SMRs with high area-normalized material fluxes. Two catchments, the Gaoping and Beinan River systems, with high particulate organic carbon (POC) flux in Taiwan, were examined. The variation of DOCconcentrations was wider in the Gaoping River system (ranging from 0.07 to 8.85 mg/L with a mean of 0.66 mg/L) compared to the Beinan River system (ranging from 0.26 to 0.67 mg/L with a mean of 0.37 mg/L). However, the mean values in both systems are significantly lower than the global average. Despite a greater human impact in the lower reach of the Gaoping River as a result of the dense population, temporal variations were substantial at all sites, but the disparities between wet and dry seasons were notable at specific sites. Temperature appeared to be the primary factor controlling DOC concentrations during the non-typhoon period. During the typhoon event, the DOC concentrations were positively correlated with total suspended solids (TSS). By analyzing the temporal sequence, the variation in DOC concentration and TSS exhibited a clockwise hysteresis with the DOC max proceeding TSS max. This event contributed approximately 10% of the annual DOC flux in the catchment. Compared with the POC flux, the DOC flux derived from these two catchments is much lower, indicating a decoupling of transportation for particulate and dissolved materials and limited river metabolisms in SMR catchments.

How to cite: Wang, P.-L., Cheng, Y.-F., Tseng, J.-Y., and Lin, L.-H.: Low dissolved organic carbon flux in small mountainous catchments of Taiwan, EGU General Assembly 2024, Vienna, Austria, 14–19 Apr 2024, EGU24-10723, https://doi.org/10.5194/egusphere-egu24-10723, 2024.

Streams and rivers are increasingly recognized as vital components of the global carbon cycle, especially in the context of climate change. To comprehensively understand their impact, it is essential to move beyond the study of individual reaches and consider the entirety of fluvial networks, including their terrestrial interactions. This holistic perspective is crucial for integrating fluvial networks into Earth System models and accurately assessing their role in the global carbon cycle.

In this context, we describe the Metabolic Regimes in Alpine Stream Networks Program (METALP, https://metalp.epfl.ch), an ecohydrological and biogeochemical monitoring study of high-mountain streams in the Swiss Alps, running since 2016. Employing a network of high-frequency sensors (10-min) paired with monthly grab sampling, METALP examines the hydrological, thermal, light, and carbon regimes of high-mountain streams. Initially focused on the metabolism of alpine streams, the project has evolved to explore long-term trends in ecosystem characteristics and functions, with a particular emphasis on understanding climate change impacts. This unique observatory has so far collected over 20 million usable data points, describing annual regimes of streamwater flow, temperature, sediment load, carbon fluxes, and ecosystem metabolism.

We present insights into the hydrologic and biogeochemical consequences of glacier loss, along with findings on dissolved organic carbon, gas exchange and CO2 emissions, oxygen concentrations, and gross primary production. Building on these insights, we then delve into the unique challenges associated with long-term monitoring in high-mountain catchments. These include marked hydrologic variability, with flows ranging over several orders of magnitude, and the need for monitoring equipment to withstand high flows, sediment loads, and avalanches, and remain functional during low flow periods. Seasonal snow cover and the remoteness complicate sampling campaigns and sensor maintenance. Additionally, the oligotrophic nature of high-mountain streams, with low analyte concentrations, necessitates sensitive monitoring programs capable of detecting subtle changes. These challenges inherently lead to gaps in data, necessitating not only technical adaptations for monitoring under difficult conditions but also innovative modeling strategies for compensating data loss.

Finally, the METALP network, along with river networks located in different climatic regions (i.e., the Krycklan catchment in Sweden, the StreamPULSE project, or the Arctic Great Rivers Observatory), provides a broader perspective, enabling us to understand biogeochemical patterns and dynamics across multiple streams. This approach is crucial for constructing a comprehensive picture of stream biogeochemistry and its response to climate change.

How to cite: Deluigi, N. and Robison, A. L.: Deciphering alpine stream responses to climate change: lessons from the METALP monitoring network, EGU General Assembly 2024, Vienna, Austria, 14–19 Apr 2024, EGU24-10927, https://doi.org/10.5194/egusphere-egu24-10927, 2024.

EGU24-10994 | Orals | BG4.4

Variability of annual primary production in the North Sea from 1983 to 2014: diatoms and non-diatoms show different trends 

Johannes Paetsch, Gennadi Lessin, Yuri Artioli, and Jeremy Blackford

Nitrogen and phosphorus inputs via rivers entering the North Sea showed maxima in the early 1980s. This led to eutrophication phenomena near the coast with high primary production and further negative consequences for the North Sea ecosystem.

Recent simulations with the ecosystem model ECOHAM for the North Sea, nested in the model NEMO-ERSEM for the Northwest European continental shelf, show that diatom and non-diatom driven productions behave differently with respect to decreasing eutrophication. In the southern and central North Sea, non-diatom production including calcifiers has indeed responded to the changes in nutrient supply via the rivers. However, diatom production in this region mostly remained stable and even increased in some cases.

A different picture emerges in the northern North Sea, where the reversal of the winter NAO index from high to lower values (1995/1996) was followed by a drastic collapse in the inflow of North Atlantic water. This also led to a cut in the nutrient supply. Here, both phytoplankton groups reacted similarly: from 1996, the primary production of both species declined and then recovered again from 1999.

Our results confirm the hypothesis of Desmit et al. (2019) that in the southern North Sea primary productivity responds to reduction in nutrient inputs with shifts in community structure, and in the northern North Sea with decrease in total productivity rates.

Reference:

Desmit, X., A. Nohe, A. V. Borges, T. Prins, K. De Cauwer, R. Lagring, D. Van der Zande and K. Sabbe (2019). Changes in chlorophyll concentration and phenology in the North Sea in relation to de-eutrophication and sea surface warming. Limnology and Oceanography 9999. DOI: 10.1002/lno.11351.

How to cite: Paetsch, J., Lessin, G., Artioli, Y., and Blackford, J.: Variability of annual primary production in the North Sea from 1983 to 2014: diatoms and non-diatoms show different trends, EGU General Assembly 2024, Vienna, Austria, 14–19 Apr 2024, EGU24-10994, https://doi.org/10.5194/egusphere-egu24-10994, 2024.

EGU24-11259 | Orals | BG4.4

A Real-time Monitoring System of Dissolved Nitrous Oxide, Methane and other Gases and their Isotopes in Aquatic Ecosystems 

Joanne Shorter, Joseph Roscioli, Elizabeth Lunny, and Scott Wankel

Coastal ecosystems are dynamic regions especially rich in diverse biological and geochemical interactions.  However, major gaps exist in our knowledge of the primary biogeochemical processes and the factors regulating their relative importance.  The study of the biogeochemical cycles of nitrogen and carbon in aquatic systems is important for understanding the fate of nutrients and other chemical components present there. Nitrous oxide (N2O) and methane (CH4), have important roles in these nitrogen and carbon biogeochemical processes as they are produced and cycled within coastal and ocean environments.  They are also significant greenhouse gases with major roles in climate change.  The gaps in our understanding of the distribution and dynamics of the underlying processes controlling their fluxes can be filled with the development and deployment of high-resolution spatial-temporal measurement methods.

We have developed a field deployable, real-time, in situ system to quantify dissolved greenhouse gases (N2O and CH4 and their isotopologues) in aquatic ecosystems including coastal wetlands.  This measurement system consists of i) an array of permeable, hydrophobic probes that can be brought under a partial vacuum without intrusion of liquid water; ii) a collection protocol for efficiently drawing dissolved gases into the sampling system without isotopic fractionation; and iii) an interface of the probe array and the extraction and sampling system with real time analytical instrumentation.  By integrating an Aerodyne tunable infrared laser direct absorption spectrometer (TILDAS) into the measurement system, we can achieve real time determination of concentration and isotopic abundances of N2O and CH4.

We have compared dissolved gases extracted from a variety of collected water samples including different tap water sources, ocean water, and wetland “swamp” water.  We observed higher N2O in the tap water samples compared to the ocean waters.  Swamp water collected from two areas of the wetland (i.e., still and moving water zones) had elevated CH4 and N2O, with the still water having higher methane and lower N2O than observed in water from area with movement.  We also compared dissolved N2O isotopologues with headspace in dosing experiments, achieving excellent comparisons of the 15N2O isotopic ratios (δ456, δ546) and site preference (SP = δ456- δ546) of dissolved N2O with the headspace.  Laboratory results as well as plans for field demonstrations in coastal areas will be discussed.

How to cite: Shorter, J., Roscioli, J., Lunny, E., and Wankel, S.: A Real-time Monitoring System of Dissolved Nitrous Oxide, Methane and other Gases and their Isotopes in Aquatic Ecosystems, EGU General Assembly 2024, Vienna, Austria, 14–19 Apr 2024, EGU24-11259, https://doi.org/10.5194/egusphere-egu24-11259, 2024.

EGU24-11765 | ECS | Posters on site | BG4.4

Relating fluorescent dissolved organic matter to bacterial biomass in English aquifer systems 

Archita Bhattacharyya, James Sorensen, Daren Gooddy, Daniel Read, and Ben Surridge

Dissolved organic matter (DOM) serves as crucial nutrient for microorganisms in oligotrophic groundwater environment. This study investigated regional-scale variations in fluorescent DOMs (fDOM) across three major English aquifers: Jurassic limestone, Permo-triassic sandstone, and Cretaceous chalk, which display different dominant groundwater flow regimes ranging from karstic, intergranular and fractured respectively. Untreated groundwater samples from 134 public supply pumps were analysed using Fluorescence spectroscopy to characterize fDOM in these aquifers with distinct properties. Our aim was to find the baseline fDOM concentrations in uncontaminated groundwater and explore the associations between fDOM, DOC, and bacterial biomass. PARAFAC modelling of the Excitation Emission Matrices (EEMs) revealed two humic-like components (HLF): component-1 peak-C, and component-2 or peak-M; and two protein-like components: component-3 or peak-T (tryptophan like or TLF) and component 4 or peak-B (Tyrosine like). Humic-like components were predominant in groundwater, with median total HLF of 0.19 raman unit (RU). Bacterial cells were enumerated using flow cytometry. Absence of E. Coli in the samples suggested no surface microbial contamination. DOC concentration ranged from 0.76 to 1.11 mg/L, lower than the UK groundwater mean of 3.1 mg/L, implying a carbon-poor environment. Significant difference of fDOM and DOC across three aquifers were observed. Median DOC and HLF were significantly higher in limestone and chalk aquifers than in sandstone aquifers. Higher humification index in limestone (HIX=0.8) and chalk (HIX=0.74) aquifer suggested less complex and high H/C ratio fDOM was present in sandstone aquifer (HIX=0.68). Sandstone also exhibited higher β/α ratio (0.97) and fluorescence index (FI=1.53) than chalk (β/α=0.85, FI=1.4) and limestone aquifer ((β/α=0.75, FI=1.4) suggesting fresher and more microbially derived autochthonous fDOM in sandstone aquifer in contrast with more mature and allochthonous fDOM in limestone and chalk aquifers. Positive correlations between HLF, TLF, and total bacterial cell concentration (TCC) were observed across all aquifers. However, DOC was only correlated with TCC in sandstone aquifers. This emphasised that the type of DOM, rather than its quantity, closely associates with bacterial biomass. Median TCC in karstic limestone aquifer (2×10⁴/ml) was nearly double that of intergranular sandstone (1×10⁴/ml), and fractured chalk aquifer (8×10³/ml). Despite relatively high fDOMs in chalk aquifers, TCC was significantly lower due to size exclusion of suspended bacteria through smaller pore-throats of the chalk. This also suggested that the correlation of TCC and fDOMs might not be due to more DOM promoting more bacterial productivity, but possibly due to their similar source. This study highlighted the carbon-poor nature of uncontaminated groundwater environments, with spatially distinct baseline values of fDOM, DOC, and TCC. Limestone and chalk aquifers have high permeability and surface connectivity and are therefore more vulnerable to quality degradation.

How to cite: Bhattacharyya, A., Sorensen, J., Gooddy, D., Read, D., and Surridge, B.: Relating fluorescent dissolved organic matter to bacterial biomass in English aquifer systems, EGU General Assembly 2024, Vienna, Austria, 14–19 Apr 2024, EGU24-11765, https://doi.org/10.5194/egusphere-egu24-11765, 2024.

North American beavers commonly build dams and create ponds, which alter both the stream hydrology and biogeochemistry. Beaver ponds are common in headwaters of boreal and arctic watersheds of Canada, and while they cover only a small portion of watershed area, their position and biogeochemical influence may allow them to have a large impact on the downstream delivery of solutes and their dominant forms. Previous studies have suggested that boreal beaver ponds commonly act as methylmercury (MeHg) sources to downstream ecosystems, but this has not been studied in the wetland-rich areas of the Taiga Plains, western Canada. Since wetlands are also known as key watershed locations of MeHg production, our objective was to determine whether beaver ponds receiving water from wetland-rich areas still act as net sources of MeHg. We sampled water chemistry at the inflow and outflow of 20 beaver ponds over two years to evaluate Hg and MeHg changes. We determined that there was a net loss of MeHg in the beaver ponds (-34.4% on average), particularly during conditions when water residence time was long. This effect was greatly reduced in wet conditions when water was passing through the ponds more quickly. Net MeHg losses were greater when water entering the pond was already high in MeHg, whereas ponds receiving low MeHg concentrations were neutral or even acted as small sources. These decreases were also correlated with higher dissolved oxygen concentration and isotopic changes in surface water which suggests that aerobic microbial demethylation and photodemethylation may be contributing to net MeHg loss. Understanding the conditions that drive solute delivery from these ponds will allow local land managers to determine appropriate courses of action for beaver management and support well-informed water quality risk assessments.

How to cite: Lagroix, J., Olefeldt, D., and Hood, G. A.: I'll be dammed: Beaver ponds as sites for net loss of methylmercury along stream networks on the peatland-rich Taiga Plains, western Canada, EGU General Assembly 2024, Vienna, Austria, 14–19 Apr 2024, EGU24-11993, https://doi.org/10.5194/egusphere-egu24-11993, 2024.

EGU24-12040 | ECS | Posters on site | BG4.4

Combining isotope measurements, water quality sensors and computational methods to unravel in-stream carbon dynamics of a complex stream network in the Italian Alps 

Giulia Grandi, Gianluca Botter, Nicola Durighetto, Mirco Peschiutta, Mauro Masiol, Barbara Stenni, and Enrico Bertuzzo

Freshwaters are key players in global carbon (C) cycle as they collect C leaked from the terrestrial ecosystem and host in-stream production and respiration processes. C transported by streams and rivers can be out-gassed to the atmosphere in the form of carbon dioxide (CO2), buried in the sediments or reach the coastal oceans. In the last decades, the relevance of these exchange fluxes to global CO2 emissions has been recognised, as well as the importance of describing the C dynamics at the stream sediment-water-atmosphere interfaces. Describing the functioning of fluvial C cycling under varying hydrodynamic and morphological traits is even more critical in mountain catchments due to the rapid change they are facing under global warming. However, estimation of these fluxes is largely uncertain and requires the integration of multidisciplinary theoretical and observational studies.

This work illustrates the planned activities and the preliminary results of two synergistic research projects aimed at resolving C cycling and stream metabolism in an alpine catchment: project CONSTRAIN (CarbON exchange processes across STReAm INterfaces) funded by the Italian Ministry of Research, and project iNEST (Interconnected North-Est Innovation Ecosystem) funded by the European Union Next-Generation EU. 

The projects focus on the Rio Valfredda, a pristine mountain stream network draining a 5.3 km2 catchment in the Italian Alps. The planned activities include the continuous, high frequency measurement of dissolved oxygen and carbon dioxide, along with environmental ancillary variables like photosynthetic active radiation, stream temperature, barometric pressure, pH and electrical conductivity, in four reaches within the stream network. Through a newly proposed model that couples the diel fluctuations of O2 and CO2, we aim to jointly estimate stream metabolism (i.e. gross primary production and ecosystem respiration), lateral input of dissolved inorganic carbon (DIC) and CO2 out-gassing to the atmosphere. 

We aim at linking C cycling patterns with hydrologic traits of the selected reaches. To that end, water stable isotopes (δ18O and δ2H) are being monitored in several tributaries of the stream network (grab samples with monthly frequency), at the catchment outlet (at daily frequency) and in the precipitation collected by rain gauges placed at different altitudes. From the analysis of the isotopic signature of streamflow and precipitation we reconstruct summary statistics of the travel time distribution of water within the hillslope with the goal of relating it with the lateral flow of DIC.

The comprehensive set of information collected, together with the previous knowledge about the hydrological dynamics of the Valfredda catchment, which has been closely monitored for the past 5 years in the framework of the DyNET project funded by the European Research Council, will allow upscaling C cycling at the level of the whole network rather than focusing on individual reaches. These projects will enhance our understanding of the role played by hydrology on the metabolism of complex river networks, unraveling the multifaceted dynamical relations that link rivers with the surrounding environment and allowing a robust assessment of the contribution of freshwaters to CO2 emissions.

How to cite: Grandi, G., Botter, G., Durighetto, N., Peschiutta, M., Masiol, M., Stenni, B., and Bertuzzo, E.: Combining isotope measurements, water quality sensors and computational methods to unravel in-stream carbon dynamics of a complex stream network in the Italian Alps, EGU General Assembly 2024, Vienna, Austria, 14–19 Apr 2024, EGU24-12040, https://doi.org/10.5194/egusphere-egu24-12040, 2024.

EGU24-13199 | Posters on site | BG4.4

Space-time dynamics of dissolved organic carbon (DOC) concentration and water quality in the Turbolo River catchment (southern Italy) 

Alfonso Senatore, Corrente Giuseppina Anna, Perri Alessio Carmelo, Greco Francesco, Mendicino Giuseppe, Beneduci Amerigo, and Botter Gianluca

This study investigates the spatial and temporal dynamics of dissolved organic carbon (DOC) and several other chemical-physical parameters concentrations in a Mediterranean headwater catchment (Turbolo River catchment, southern Italy) equipped with two multi-parameter sondes providing multiple-year (from 2019 to 2023) high-frequency measurements, complemented by discrete monitoring campaigns. The sondes were installed in two nested sections, a quasi-pristine upstream sub-catchment and a downstream outlet with anthropogenic water quality disturbances. Altogether, sixteen chemical-physical parameters were assessed: temperature, turbidity, electrical conductivity (EC), total dissolved solids (TDS), salinity, pH, ORP, ammonia nitrogen (N-NH4+) and dissolved organic carbon (DOC) in continuous mode; alkalinity, dissolved inorganic carbon (DIC), free CO2, not purgeable organic carbon (NPOC), total dissolved nitrogen (TDN), anionic and cationic content for discrete monitoring. In particular, DOC estimates were achieved by correcting the fluorescent dissolved organic matter -fDOM - values through an original procedure that did not require extensive laboratory measurements. Then, parameter dynamics at the seasonal and storm event scales were analyzed.

Results showed that all parameters have values consistent with those expected for fluvial water. Furthermore, the majority of the parameters generally recorded the highest values during the autumn season, showing then a decrease to spring lows and a new rise with the arrival of the driest months of the year. In particular, the seasonal scale analysis confirmed the climate control on DOC production, with increasing background concentrations in hot and dry summer months. On the other hand, the hydrological regulation proved crucial for DOC mobilization and export, with the top 10th percentile of discharge associated with up to 79% of the total DOC yield. The analysis at the storm scale using flushing and hysteresis indices highlighted substantial differences between the two catchments. In the steeper upstream catchment, the limited capability of preserving hydrological connectivity over time with DOC sources determined the prevalence of transport as the limiting factor to DOC export. In the downstream catchment, transport- and source-limited processes were observed almost equally. The correlation between the hysteretic behaviour and antecedent precipitation was not linear since the process reverted to transport-limited for high accumulated rainfall values. The influence of storm events was also verified for other parameters, which were either positively (turbidity, N-NH4+) or negatively (electrical conductivity, TDS and salinity) correlated with the streamflow variation.

Exploiting high-resolution measurements, the study provided insights into DOC and several other chemical-physical parameter dynamics in nested headwater catchments at multiple time scales.


Reference: Senatore et al., Water Resources Research, 2023, 59(11), e2022WR034397, https://doi.org/10.1029/2022WR034397

How to cite: Senatore, A., Giuseppina Anna, C., Alessio Carmelo, P., Francesco, G., Giuseppe, M., Amerigo, B., and Gianluca, B.: Space-time dynamics of dissolved organic carbon (DOC) concentration and water quality in the Turbolo River catchment (southern Italy), EGU General Assembly 2024, Vienna, Austria, 14–19 Apr 2024, EGU24-13199, https://doi.org/10.5194/egusphere-egu24-13199, 2024.

EGU24-13957 | Posters on site | BG4.4

Flow source drives extreme variation in dissolved organic carbon in an important North American Great Plains reservoir 

Helen Baulch, Anthony Baron, Ali Nazemi, and Colin Whitfield

Elevated dissolved organic carbon (DOC) concentrations are a major concern for drinking water treatment plants that draw from surface waters, owing to effects on disinfection byproduct formation, risks of bacterial regrowth in water distribution systems, and treatment costs. Yet within the vast Great Plains of North America water supplies are limited. As a result, water utilities often rely on water bodies with naturally elevated DOC. Using a 30-year data set encompassing both extreme wet and dry conditions we investigate the drivers of high variation in DOC, exploring effects of changing flow management and in-lake water chemistry. Using wavelet coherence analyses and generalized additive models of DOC, we find DOC concentration was significantly coherent with flow from a large upstream mesotrophic reservoir. DOC was also coherent with sulfate, total phosphorus, ammonium, and chlorophyll a concentrations across the 30-year record. These variables accounted for 56% of the deviance in DOC from 1990 to 2019, suggesting that water source and in-lake nutrient and solute chemistry are effective predictors of DOC concentration. Clearly, climate and changes in water and catchment management will influence source water quality in this already water-scarce region. Our results highlight the importance of flow management to shallow eutrophic reservoirs and demonstrate impacts on source water quality.  Results also highlight a key management challenge where wet periods can exacerbate water quality issues and these effects can be compounded by flow rules that dictate reducing inflows from systems with lower DOC. Our work shows that current flow management decisions to address water level and flood risk concerns also have important impacts on drinking water treatability, creating important tradeoffs and highlighting complex challenges for regional water security.  

How to cite: Baulch, H., Baron, A., Nazemi, A., and Whitfield, C.: Flow source drives extreme variation in dissolved organic carbon in an important North American Great Plains reservoir, EGU General Assembly 2024, Vienna, Austria, 14–19 Apr 2024, EGU24-13957, https://doi.org/10.5194/egusphere-egu24-13957, 2024.

EGU24-14012 | ECS | Orals | BG4.4

Sources and fate of dissolved inorganic carbon in rivers of Switzerland 

Alexander Brunmayr, Timo Rhyner, Dylan Geissbühler, Luisa Minich, Margot White, Florian Storck, Lucas Passera, Stephanie Zimmermann, Margaux Moreno Duborgel, Thomas Laemmel, Benedict Mittelbach, Negar Haghipour, Timothy Eglinton, Sönke Szidat, Frank Hagedorn, and Heather Graven

Each year, rivers export more than one teragram of carbon out of Switzerland as dissolved inorganic carbon (DIC), integrating diverse atmospheric, terrestrial, and aquatic carbon sources over their catchments. However, the contributions of the different carbon sources to riverine DIC – and thus the implications of DIC dynamics for the global carbon balance and climate – remain uncertain. Building upon the 50-year dataset from the national long-term river monitoring network of Switzerland (NADUF), we attempt to predict the vertical CO2 fluxes between rivers and the atmosphere, and to quantify catchment-scale DIC production through rock weathering, leaching of soil-respired CO2, and mineralization of organic carbon during fluvial transport. Supported by the national network of groundwater monitoring sites (NAQUA) and soil sampling sites covering Switzerland, a Bayesian mixing model disentangles the sources of riverine DIC using measured data of carbon and water isotopes (14C, 13C, 2H, 18O), as well as ion concentrations. The exchanges between river DIC and atmospheric CO2 across the air–water interface are predicted with a diffusion model, validated with measurements of the CO2 flux and isotopes from in situ floating-chamber experiments. Our predictions of the DIC source contributions and the net CO2 flux from rivers help to elucidate the role of DIC in the carbon balance of alpine and perialpine river catchments, and contribute towards closing the national carbon budget of Switzerland.

How to cite: Brunmayr, A., Rhyner, T., Geissbühler, D., Minich, L., White, M., Storck, F., Passera, L., Zimmermann, S., Moreno Duborgel, M., Laemmel, T., Mittelbach, B., Haghipour, N., Eglinton, T., Szidat, S., Hagedorn, F., and Graven, H.: Sources and fate of dissolved inorganic carbon in rivers of Switzerland, EGU General Assembly 2024, Vienna, Austria, 14–19 Apr 2024, EGU24-14012, https://doi.org/10.5194/egusphere-egu24-14012, 2024.

EGU24-14106 | ECS | Orals | BG4.4

Disconnectivity matters: The outsized role of small ephemeral wetlands in landscape-scale nutrient retention 

Frederick Cheng, Junehyeong Park, Mukesh Kumar, and Nandita Basu

Wetlands protect downstream waters by filtering excess nitrogen (N) generated from agricultural and urban activities. Small ephemeral wetlands, also known as geographically isolated wetlands (GIWs), are hotspots of N retention but have received fewer legal protections due to their apparent isolation from jurisdictional waters and are typically left out of restoration efforts. Here, we hypothesize that the isolation of the GIWs make them more efficient N filters, especially when considering transient hydrologic dynamics. We use a reduced complexity model with thirty years of remotely sensed monthly wetland inundation levels in 3,700 GIWs across eight wetlandscapes in the United States to show how consideration of transient hydrologic conditions that capture disconnectivity dynamics can increase N retention estimates by up to 130%, with greater retention magnification for the smaller wetlands. This effect is more pronounced in semi-arid systems, where transient assumptions lead to 1.8 times more retention, compared to humid landscapes where transient assumptions only lead to 1.4 times more retention.  Our results highlight how GIWs have an outsized role in retaining nutrients, and this service is enhanced due to their hydrologic disconnectivity. Under the context of the new EU Nature Restoration Law and other global conservation efforts, these unique ecosystems must be protected and considered in restoration plans to maintain the integrity of downstream waters.

How to cite: Cheng, F., Park, J., Kumar, M., and Basu, N.: Disconnectivity matters: The outsized role of small ephemeral wetlands in landscape-scale nutrient retention, EGU General Assembly 2024, Vienna, Austria, 14–19 Apr 2024, EGU24-14106, https://doi.org/10.5194/egusphere-egu24-14106, 2024.

EGU24-14428 | Orals | BG4.4

Stream Length and Diatom Communities Control Si Dynamics in Glacial Meltwater Streams of the McMurdo Dry Valleys, Antarctica 

Diane McKnight, Keira Johnson, Ruth Heindel, and kathi jo Jankowski

In the polar deserts of Antarctica, meltwater from glaciers flows in streams for only about two months during the summer. As the water flows downstream and interacts with the sediment in the stream channel, weathering reactions increase the concentrations of dissolved constituents in the stream water, especially silica. In the McMurdo Dry Valleys, the glacial meltwater streams that flow during the austral summer are important biogeochemical links between the alpine and terminal glaciers and the lakes in the valley floors.  As part of the McMurdo Dry Valleys Long-Term Ecological Research (MCMLTER) project, 17 first and second order streams are monitored for flow and water quality, and diatom community composition in the perennial microbial mats on the streambed. This study found that in streams that are about 1 km long and have abundant microbial mats, the diatoms can take up enough silica to reduce the concentrations of dissolved silica to very low values (>/= 1 mg/L). In comparison, in longer streams Si concentrations are greater (2 mg/L and greater) due to the input of Si from weathering in the hyporheic zone. A previous study has found that diatom community composition in two short streams is significantly related to total flow during the austral summer, leading to a hypothesis that decreases in Si concentrations with increasing flow may favor smaller diatoms with less silicified frustules. We analyzed the 25-yr discharge and silica record for 10 streams using the Weighted Regressions on Time, Discharge, and Season (WRTDS) model to estimate mean 5-day silica concentrations for December through January. These analyses revealed that the shortest stream with the strongest relationship between flow and diatom community composition consistently exhibited minimum Si concentrations of ~ 0.5 mg/L at peak flow. In contrast, Si concentrations were higher and more stable throughout the summer for long streams that exhibit little variation in diatom community composition. These results suggest that Si uptake by diatoms can control both in-stream Si concentrations and diatom community composition.  Understanding the relationship between the diatoms in the mat communities and environmental change is useful for interpreting the record of the stream diatoms preserved in lake sediments and for considering future scenarios for the Dry Valleys.

How to cite: McKnight, D., Johnson, K., Heindel, R., and Jankowski, K. J.: Stream Length and Diatom Communities Control Si Dynamics in Glacial Meltwater Streams of the McMurdo Dry Valleys, Antarctica, EGU General Assembly 2024, Vienna, Austria, 14–19 Apr 2024, EGU24-14428, https://doi.org/10.5194/egusphere-egu24-14428, 2024.

EGU24-14742 | Posters on site | BG4.4

Pine pollen is an important component of the Baltic Sea 

Magdalena Pawlik and Dariusz Ficek

Every year, pine pollen occurs at the water surface and cover large areas of the Baltic waters in spring. Its concentrations in the Baltic are sometimes so large that they actually form a conspicuous yellow layer on the surface. Pine pollen is a very important source of carbon and nutrients to the Baltic Sea.

The objective of this work was to estimate the absolute and relative concentrations of pine pollen and to show the spatial differentiation of pollen levels in Baltic Sea waters.

The measurements showed that practically the whole study area was covered with pollen. substantial pollen concentrations were recorded not only in the coastal zone but also at considerable distances from the shore. Pollen levels in Baltic surface waters, measured during the 2018 pollen season, varied from 0.5 to 14.7 µl l-1, which is 10–49.2% of the total suspension, ranging from 1.25 to 250 µm. To examine the biological role of pollen in the aquatic environment, the contents of carbon C, nitrogen N and phosphorus P were measured in pollen acquired from pine trees growing close to the Baltic shore. The levels of these elements were as follows: 47.66% C, 0.32% P and 2.50% N.

This work was supported by the National Science Centre of Poland (contract No. 2017/25/N/ST10/02578 to M.M.P).

How to cite: Pawlik, M. and Ficek, D.: Pine pollen is an important component of the Baltic Sea, EGU General Assembly 2024, Vienna, Austria, 14–19 Apr 2024, EGU24-14742, https://doi.org/10.5194/egusphere-egu24-14742, 2024.

EGU24-16364 | ECS | Orals | BG4.4

Impact of Particle Resuspension on Oxygen Consumption and Nutrient Cycling in a Turbid Estuary: Insights from the Loire Estuary 

Nour El Imene Boukortt, Edouard Metzger, Eric Bénéteau, Yoann Le Merrer, Philippe Souchu, Sophie Sanchez, Mohammed Barhdadi, Grégoire Maillet, and Sabine Schmidt

A characteristic feature of macrotidal estuaries is the presence of a Maximum Turbidity Zone (TMZ), defined by a high concentration of suspended particles (>0.5 g.L-1). It is maintained by frequent resuspension and deposition events, mainly influenced by waves, tidal currents, and river discharge. These cycles often result in enhanced organic matter degradation, generating a local dissolved oxygen (DO) demand, which can lead to drastic declines in DO and even hypoxic conditions (DO<2 mg.L-1). In the Loire estuary (France), a macrotidal and turbid environment prone to summer hypoxia, the TMZ is a focal point of interest as it is the site of a persistent oxygen deficit in the inner estuary. To investigate the effects of particle reactivity on DO consumption within the inner estuary, we conducted 14 sampling campaigns between summer 2022 and summer 2023, covering a wide range of river discharge and temperature conditions. We selected two sampling stations: one subjected to freshwater influence and almost continuous presence of TMZ, and the second exposed to coastal ocean conditions. Suspended particles were collected at mid-tide and incubated in the laboratory under controlled conditions at 20°C with continuous stirring to maintain resuspension. DO concentrations were measured using optic sensors and incubations were stopped when 30% of the oxygen concentration was consumed. Nutrient and organic matter composition were investigated by pre- and post-incubation filtration to analyse ammonium, nitrate, phosphate, particulate organic carbon, and nitrogen (POC, PON). DO consumption rates reached maximum values in spring (52.2±0.1 µmol.g-1.d-1,42.6±0.4 µmol.g-1.d-1) at the upstream and downstream stations, respectively. Overall, the most downstream station had higher oxygen consumption rates due to the marine influence contributing to the input of fresher organic material compared to the upstream station where the presence of TMZ is associated with degraded material. These results emphasize the importance of the material source on oxygen consumption rates. Our discussion will focus on the degradation processes occurring within the TMZ and consider how the reactivity and source of suspended particles may play a role in influencing oxygen consumption patterns, potentially contributing to the development of hypoxic conditions within the estuary.

How to cite: Boukortt, N. E. I., Metzger, E., Bénéteau, E., Le Merrer, Y., Souchu, P., Sanchez, S., Barhdadi, M., Maillet, G., and Schmidt, S.: Impact of Particle Resuspension on Oxygen Consumption and Nutrient Cycling in a Turbid Estuary: Insights from the Loire Estuary, EGU General Assembly 2024, Vienna, Austria, 14–19 Apr 2024, EGU24-16364, https://doi.org/10.5194/egusphere-egu24-16364, 2024.

EGU24-17208 | Orals | BG4.4

Exploring dissolved organic matter (DOM) signatures across contrasting UK landscapes using a high-resolution mass spectrometry ‘fingerprinting’ approach. 

Charlotte Lloyd, Jonathan Pemberton, Penny Johnes, Davey Jones, Chris Yates, Helen Glanville, Fran Brailsford, and Richard Evershed

Dissolved organic matter (DOM) plays a vital role in river ecosystem function and therefore understanding its composition is key. DOM has important implications for nutrient cycling and riverine health and with this in mind, it is vital to gain a more comprehensive understanding of the composition of riverine DOM at a molecular level and how this varies across contrasting landscapes. There are many factors which will influence DOM signatures, from differences in climate, soil type/geology, land-use, as well as intensity and nature of anthropogenic activity. Through understanding the potential relationships between these factors and DOM composition, we can gain key information regarding both sources of riverine DOM within river catchments, aiding pollution mitigation strategies, and how signatures may vary under changing climate and/or land-use.

The analysis of DOM poses a significant analytical challenge due to its complexity, however the advances in mass spectrometry now allows detailed characterisation at molecular scale. This study examines the DOM composition across 56 UK field sites spanning contrasting landscapes, including four different geologies/soil types. Additionally, 18 effluents from UK sewage treatment works (STW) were investigated. River water samples were collected and an untargeted analysis carried out using direct-infusion high-resolution mass spectrometry (DI-MS) and the resultant DOM signatures across the samples were compared.

Principal component analysis (PCA) and hierarchical clustering analysis methodologies were applied and showed that the DOM molecular composition between sites could be distinguished according to landscape character. Specifically, the PCA analysis showed that contrasting geologies/soil types were separated by the derived Principle Component (PC) 2 while PC1 separated the riverine samples from the STW effluents in the analytical space. Explanatory variables including landcover, land-use and population density alongside bulk nutrient data were used to begin to elucidate the driving factors behind the PCs. In addition to differences in DOM signatures, further analysis of the molecular compositions identified anthropogenically derived organic compounds, for example, series of polypropylene glycol (PPG) and polyethylene glycol (PEG) oligomers, which were present in almost all landscapes across the UK, illustrating that they are now ubiquitous across riverine environments. Using these data, we can begin to provide generalisable information regarding the molecular composition of DOM across different UK landscapes.

How to cite: Lloyd, C., Pemberton, J., Johnes, P., Jones, D., Yates, C., Glanville, H., Brailsford, F., and Evershed, R.: Exploring dissolved organic matter (DOM) signatures across contrasting UK landscapes using a high-resolution mass spectrometry ‘fingerprinting’ approach., EGU General Assembly 2024, Vienna, Austria, 14–19 Apr 2024, EGU24-17208, https://doi.org/10.5194/egusphere-egu24-17208, 2024.

EGU24-17925 | Posters on site | BG4.4

Quantifying estuarine carbon and nutrients retention at the regional scale using a generic process-based model and Monte Carlo simulations 

Goulven G. Laruelle, Vincent Thieu, Antoine Casquin, Marie Silvestre, Steeve Bonneville, and Anicée Massant

Most downstream compartments of the continental hydrological network, estuaries are the last biogeochemical filter of the Land-Ocean Aquatic Continuum before the oceanic realm. As such, they receive substantial amounts of carbon and nutrients from rivers and their intense biogeochemical processing allows the removal of part of those inputs, hence potentially contributing to the prevention of coastal eutrophication. Indeed, eutrophication resulting from enhanced nutrients loads from rivers is a pressing global issue, affecting numerous coastal areas and regional seas worldwide. However, simulating ecosystems as intricate as estuaries, characterized by numerous biogeochemical gradients, an intense benthic-pelagic coupling and controlled by complex hydrodynamics is a challenge often associated with intensive computation and data requirements. As a result, the development of numerical models suitable to quantify the filtering function of estuaries is often limited to scarce well studied systems. This highlights the still unresolved challenge of designing and applying a generic modeling strategy able to capture the complexity and intensity of biogeochemical processes for a diversity of often data-limited estuaries along a continuous coastal stretch.

In this study, we present the first spatially explicit, regional, fully transient simulation of the estuarine biogeochemical filter over a multi annual period. This application to 40 estuaries of the Atlantic coast of France from its southern border with Spain to Belgium was performed in the context of the nuts-STeauRY project which aims at illustrating the interest of integrated land-sea modelling approaches to better design spatialized scenarios of agriculture and land-use practice to limit coastal eutrophication in France.

                The simulations were performed using the proven generic estuarine model C-GEM coupled with the OMEN_SED sediment module and constrained, upstream by the pyNuts-Riverstrahler model, which describes the transfer of nutrients and carbon from the headwaters streams to the outlets of river hydrosystems. In its current version, C-GEM resolves tidally induced transport within the estuary along its longitudinal axis and its biogeochemical module includes all the main processes involving carbon and nutrients (i.e. production, remineralization, nitrification, denitrification…). The addition of a new explicit benthic module allows simulating sediments processes and burial which are essential to properly quantify carbon and nutrient retention. The strategy to simulate estuaries devoid of measurements relies on Monte Carlo simulations performed by varying the model’s parameterization constrained by an extensive literature survey and thoroughly validated on well monitored reference systems. Our results over the 2014-2019 period provide an insight into the parameters controlling the temporal and spatial variability of carbon and nutrient retention within a large set of estuaries with varying riverine nutrients loads and ranging from very small (<10km) to the Loire, Seine or Gironde estuaries, which lengths exceed 100km. The simulated retention rates vary widely from just a few percent in the smallest systems to over 40%, 30%, 20% in the largest ones for total organic carbon, total phosphorus and total nitrogen, respectively.

How to cite: Laruelle, G. G., Thieu, V., Casquin, A., Silvestre, M., Bonneville, S., and Massant, A.: Quantifying estuarine carbon and nutrients retention at the regional scale using a generic process-based model and Monte Carlo simulations, EGU General Assembly 2024, Vienna, Austria, 14–19 Apr 2024, EGU24-17925, https://doi.org/10.5194/egusphere-egu24-17925, 2024.

EGU24-20681 | Orals | BG4.4

QUANTOM – QUANTification of dissolved Organic Matter and the metabolic balance in river networks: mechanisms and model simulations of CO2 emissions 

Benoit Demars, Maeve McGovern, Leah Jackson-Blake, James Sample, Magnus Norling, Kjell Høgda, Stein Karlsen, Peter Dörsch, Marc Stutter, Barry Thornton, Jim Junker, and Juliana D'Andrilli

QUANTOM aims to quantify how changes in quality and quantity of dissolved organic matter (DOM) supply alter the metabolic balance of rivers, i.e. the contribution of in-stream DOM degradation to CO2 emissions. QUANTOM will determine the coupling between land vegetation growth from satellite observation and DOM delivery and transformation in streams using in-situ sensor technology and whole stream metabolism. QUANTOM will characterise the molecular transformations (reactive pathways) of DOM, from riparian soils to the Barents sea, through the river continuum at control points (hot spots and hot moments) using carbon stable isotope ratios and FT-ICR-MS. QUANTOM will formalise mathematically our novel understanding into a parsimonious river basin model for DOM with in-stream processes. QUANTOM’s vision is to have a model applicable across the natural northern rivers around the globe and transform the way we see and study rivers.

We have completed three years of fieldwork in the river Tana (Northern Norway), draining 16,000 km2 of north boreal and sub-arctic landscapes and discharging in the Barents sea (70°N). We will present the outline of the project, our conceptual approach and preliminary results such as satellite and in-situ sensor data, carbon fluxes and metabolic balance of the river network.   

How to cite: Demars, B., McGovern, M., Jackson-Blake, L., Sample, J., Norling, M., Høgda, K., Karlsen, S., Dörsch, P., Stutter, M., Thornton, B., Junker, J., and D'Andrilli, J.: QUANTOM – QUANTification of dissolved Organic Matter and the metabolic balance in river networks: mechanisms and model simulations of CO2 emissions, EGU General Assembly 2024, Vienna, Austria, 14–19 Apr 2024, EGU24-20681, https://doi.org/10.5194/egusphere-egu24-20681, 2024.

EGU24-24 | Orals | NP4.1

The fractional Sinusoidal wavefront Model (fSwp) for time series displaying persistent stationary cycles 

Gael Kermarrec, Federico Maddanu, Anna Klos, and Tommaso Proietti

In the analysis of sub-annual climatological or geodetic time series such as tide gauges, precipitable water vapor, or GNSS vertical displacements time series but also temperatures or gases concentrations, seasonal cycles are often found to have a time-varying amplitude and phase.

These time series are usually modelled with a deterministic approach that includes trend, annual, and semi-annual periodic components having constant amplitude and phase-lag. This approach can potentially lead to inadequate interpretations, such as an overestimation of Global Navigation Satellite System (GNSS) station velocity, up to masking important geophysical phenomena that are related to the amplitude variability and are important for deriving trustworthy interpretation for climate change assessment.

We address that challenge by proposing a novel linear additive model called the fractional Sinusoidal Waveform process (fSWp), accounting for possible nonstationary cyclical long memory, a stochastic trend that can evolve over time and an additional serially correlated noise capturing the short-term variability. The model has a state space representation and makes use of the Kalman filter (KF). Suitable enhancements of the basic methodology enable handling data gaps, outliers, and offsets. We demonstrate our method using various climatological and geodetic time series to illustrate its potential to capture the time-varying stochastic seasonal signals.

How to cite: Kermarrec, G., Maddanu, F., Klos, A., and Proietti, T.: The fractional Sinusoidal wavefront Model (fSwp) for time series displaying persistent stationary cycles, EGU General Assembly 2024, Vienna, Austria, 14–19 Apr 2024, EGU24-24, https://doi.org/10.5194/egusphere-egu24-24, 2024.

On some maps of the first military survey of the Habsburg Empire, the upper direction of the sections does not face the cartographic north, but makes an angle of about 15° with it. This may be due to the fact that the sections were subsequently rotated to the magnetic north of the time. Basically, neither their projection nor their projection origin is known yet.

In my research, I am dealing with maps of Inner Austria, the Principality of Transylvania and Galicia (nowadays Poland and Ukraine), and I am trying to determine their projection origin. For this purpose, it is assumed, based on the archival documentation of the survey, that these are Cassini projection maps. My hypothesis is that they are Graz, Cluj Napoca or Alba Julia and Lviv. I also consider the position of Vienna in each case, since it was the main centre of the survey.

The angle of rotation was taken in part from the gufm1 historical magnetic model back to 1590 for the assumed starting points and year of mapping. In addition, as a theoretical case, I calculated the rotation angle of the map sections using coordinate geometry. I then calculated the longitude of the projection starting point for each case using univariate minimization. Since the method is invariant to latitude, it can only be determined from archival data.

Based on these, the starting point for Inner Austria from the rotation of the map was Vienna, which is not excluded by the archival sources, and since the baseline through Graz also started from there, it is partly logical. The map rotation for Galicia and Transylvania also confirmed the starting point of the hypothesis.  Since both Alba Julia and Cluj Napoca lie at about the same longitude, the method cannot make a difference there; and the archival data did not provide enough evidence. In comparison, the magnetic declination rotations yielded differences of about 1°, which may be due to an error in the magnetic model.

On this basis, I have given the assumed projections of the three maps with projection starting points, and developed a method for determining the projection starting points of the other rotated grid maps. The results suggest that there is a very high probability that the section network was rotated in the magnetic north direction, and thus provide a way to refine the magnetic declination data at that time.

With this method I managed to give new indirekt magnetic declinations data from Central-East Europe, which can help to improve the historical magnetic field models. The main reason for this is that we don’t have any measurement from that region.

Furthermore the difference beetwen the angle of the section north and the declination data from gufm1 always 0.8-1°. Maybe there are systematical data error at that region.

Supported by the ÚNKP-23-6 New National Excellence Program of the Ministry for Culture and Innovation from the source of the National Research, Development and Innovation Fund.

How to cite: Koszta, B. and Timár, G.: A possible cartographical data source for historical magnetic field improvement: The direction of the section north of the Habsburg first military survey, EGU General Assembly 2024, Vienna, Austria, 14–19 Apr 2024, EGU24-582, https://doi.org/10.5194/egusphere-egu24-582, 2024.

EGU24-1988 | ECS | Posters on site | NP4.1

Predictive ability assessment of Bayesian Causal Reasoning (BCR) on runoff temporal series 

Santiago Zazo, José Luis Molina, Carmen Patino-Alonso, and Fernando Espejo

The alteration of traditional hydrological patterns due to global warming is leading to a modification of the hydrological cycle. This situation draws a complex scenario for the sustainable management of water resources. However, this issue offers a challenge for the development of innovative approaches that allow an in-depth capturing the logical temporal-dependence structure of these modifications to advance sustainable management of water resources, mainly through the reliable predictive models. In this context, Bayesian Causality (BC), addressed through Causal Reasoning (CR) and supported by a Bayesian Networks (BNs), called Bayesian Causal Reasoning (BCR) is a novel hydrological research area that can help identify those temporal interactions efficiently.

This contribution aims to assesses the BCR ability to discover the logical and non-trivial temporal-dependence structure of the hydrological series, as well as its predictability. For this, a BN that conceptually synthesizes the time series is defined, and where the conditional probability is propagated over the time throughout the BN through an innovative Dependence Mitigation Graph. This is done by coupling among an autoregressive parametric approach and causal model. The analytical ability of the BCR highlighted the logical temporal structure, latent in the time series, which defines the general behavior of the runoff. This logical structure allowed to quantify, through a dependence matrix which summarizes the strength of the temporal dependencies, the two temporal fractions that compose the runoff: one due to time (Temporally Conditioned Runoff) and one not (Temporally Non-conditioned Runoff). Based on this temporal conditionality, a predictive model is implemented for each temporal fraction, and its reliability is assessed from a double probabilistic and metrological perspective.

This methodological framework is applied to two Spanish unregulated sub-basins; Voltoya river belongs to Duero River Basin, and Mijares river, in the Jucar River Basin. Both cases with a clearly opposite temporal behavior, Voltoya independent and Mijares dependent, and with increasingly more problems associated with droughts.

The findings of this study may have important implications over the knowledge of temporal behavior of water resources of river basin and their adaptation. In addition, TCR and TNCR predictive models would allow advances in the optimal dimensioning of storage infrastructures (reservoirs), with relevant substantial economic/environmental savings. Also, a more sustainable management of river basins through more reliable control reservoirs’ operation is expected to be achieved. Finally, these results open new possibilities for developing predictive hydrological models within a BCR framework.

How to cite: Zazo, S., Molina, J. L., Patino-Alonso, C., and Espejo, F.: Predictive ability assessment of Bayesian Causal Reasoning (BCR) on runoff temporal series, EGU General Assembly 2024, Vienna, Austria, 14–19 Apr 2024, EGU24-1988, https://doi.org/10.5194/egusphere-egu24-1988, 2024.

EGU24-3857 | ECS | Posters on site | NP4.1 | Highlight

Spatial-Temporal Analysis of Forest Mortality 

Sara Alibakhshi

Climate-induced forest mortality poses an increasing threat worldwide, which calls for developing robust approaches to generate early warning signals of upcoming forest state change. This research explores the potential of satellite imagery, utilizing advanced spatio-temporal indicators and methodologies, to assess the state of forests preceding mortality events. Traditional approaches, such as techniques based on temporal analyses, are impacted by limitations related to window size selection and detrending methods, potentially leading to false alarms. To tackle these challenges, our study introduces two new approaches, namely the Spatial-Temporal Moran (STM) and Spatial-Temporal Geary (STG) approaches, both focusing on local spatial autocorrelation measures. These approaches can effectively address the shortcomings inherent in traditional methods. The research findings were assessed across three study sites within California national parks, and Kendall's tau was employed to quantify the significance of false and positive alarms. To facilitate the measurement of ecosystem state change, trend estimation, and identification of early warning signals, this study also provides "stew" R package. The implications of this research extend to various groups, such as ecologists, conservation practitioners, and policymakers, providing them with the means to address emerging environmental challenges in global forest ecosystems.

How to cite: Alibakhshi, S.: Spatial-Temporal Analysis of Forest Mortality, EGU General Assembly 2024, Vienna, Austria, 14–19 Apr 2024, EGU24-3857, https://doi.org/10.5194/egusphere-egu24-3857, 2024.

Iram Parvez1, Massimiliano Cannata2, Giorgio Boni1, Rossella Bovolenta1 ,Eva Riccomagno3 , Bianca Federici1

1 Department of Civil, Chemical and Environmental Engineering (DICCA), Università degli Studi di Genova, Via Montallegro 1, 16145 Genoa, Italy (iram.parvez@edu.unige.it,bianca.federici@unige.it, giorgio.boni@unige.it, rossella.bovolenta@unige.it).

2 Institute of Earth Sciences (IST), Department for Environment Constructions and Design (DACD), University of Applied Sciences and Arts of Southern Switzerland (SUPSI), CH-6952 Canobbio, Switzerland(massimiliano.cannata@supsi.ch).

3 Department of Mathematics, Università degli Studi di Genova, Via Dodecaneso 35, 16146 Genova, Italy(riccomag@dima.unige.it).

The deployment of hydrometeorological sensors significantly contributes to generating real-time big data. The quality and reliability of large datasets pose considerable challenges, as flawed analyses and decision-making processes can result. This research aims to address the issue of anomaly detection in real-time data by exploring machine learning models. Time-series data is collected from IstSOS - Sensor Observation Service, an open-source software that stores, collects and disseminates sensor data. The methodology consists of Gated Recurrent Units based on recurrent neural networks, along with corresponding prediction intervals, applied both to individual sensors and collectively across all temperature sensors within the Ticino region of Switzerland. Additionally, non-parametric methods like Bootstrap and Mean absolute deviation are employed instead of standard prediction intervals to tackle the non-normality of the data. The results indicate that Gated Recurrent Units based on recurrent neural networks, coupled with non-parametric forecast intervals, perform well in identifying erroneous data points. The application of the model on multivariate time series-sensor data establishes a pattern or baseline of normal behavior for the area (Ticino). When a new sensor is installed in the same region, the recognized pattern is used as a reference to identify outliers in the data gathered from the new sensor.

How to cite: Parvez, I.: Exploring Machine Learning Models to Detect Outliers in HydroMet Sensors, EGU General Assembly 2024, Vienna, Austria, 14–19 Apr 2024, EGU24-4280, https://doi.org/10.5194/egusphere-egu24-4280, 2024.

EGU24-5268 | ECS | Orals | NP4.1

Unveiling Geological Patterns: Bayesian Exploration of Zircon-Derived Time Series Data 

Hang Qian, Meng Tian, and Nan Zhang

For its immunity to post-formation geological modifications, zircon is widely utilized as chronological time capsule and provides critical time series data potential to unravel key events in Earth’s geological history, such as supercontinent cycles. Fourier analysis, which assumes stationary periodicity, has been applied to zircon-derived time series data to find the cyclicity of supercontinents, and wavelet analysis, which assumes non-stationary periodicity, corroborates the results of Fourier Analysis in addition to detecting finer-scale signals. Nonetheless, both methods still prognostically assume periodicity in the zircon-derived time-domain data. To stay away from the periodicity assumption and extract more objective information from zircon data, we opt for a Bayesian approach and treat zircon preservation as a composite stochastic process where the number of preserved zircon grains per magmatic event obeys logarithmic series distribution and the number of magmatic events during a geological time interval obeys Poisson distribution. An analytical solution was found to allow us to efficiently invert for the number and distribution(s) of changepoints hidden in the globally compiled zircon data, as well as for the zircon preservation potential (encoded as a model parameter) between two neighboring changepoints. If the distributions of changepoints temporally overlap with those of known supercontinents, then our results serve as an independent, mathematically robust test of the cyclicity of supercontinents. Moreover, our statistical approach inherently provides a sensitivity parameter the tuning of which allows to probe changepoints at various temporal resolution. The constructed Bayesian framework is thus of significant potential to detect other types of trend swings in Earth’s history, such as shift of geodynamic regimes, moving beyond cyclicity detection which limits the application of conventional Fourier/Wavelet analysis.

How to cite: Qian, H., Tian, M., and Zhang, N.: Unveiling Geological Patterns: Bayesian Exploration of Zircon-Derived Time Series Data, EGU General Assembly 2024, Vienna, Austria, 14–19 Apr 2024, EGU24-5268, https://doi.org/10.5194/egusphere-egu24-5268, 2024.

Semi-enclosed freshwater and brackish ecosystems, characterised by restricted water outflow and prolonged residence times, often accumulate nutrients, influencing their productivity and ecological dynamics. These ecosystems exhibit significant variations in bio-physical-chemical attributes, ecological importance, and susceptibility to human impacts. Untangling the complexities of their interactions remains challenging, necessitating a deeper understanding of effective management strategies adapted to their vulnerabilities. This research focuses on the bio-physical aspects, investigating the differential effects of spring and summer light on phytoplankton communities in semi-enclosed freshwater and brackish aquatic ecosystems.

Through extensive field sampling and comprehensive environmental parameter analysis, we explore how phytoplankton respond to varying light conditions in these distinct environments. Sampling campaigns were conducted at Müggelsee, a freshwater lake on Berlin's eastern edge, and Barther Bodden, a coastal lagoon northeast of Rostock on the German Baltic Sea coast, during the springs and summers of 2022 and 2023, respectively. Our analysis integrates environmental factors such as surface light intensity, diffuse attenuation coefficients, nutrient availability, water column dynamics, meteorological data, Chlorophyll-a concentration, and phytoplankton communities. Sampling encompassed multiple depths at continuous intervals lasting three days.

Preliminary findings underscore significant differences in seasonal light availability, with summer exhibiting extended periods of substantial light penetration. These variations seem to impact phytoplankton abundance and diversity uniquely in each ecosystem. While ongoing analyses are underway, early indications suggest distinct phytoplankton responses in terms of species composition and community structure, influenced by the changing light levels. In 2022 the clear water phase during spring indicated that bloom events have occurred under ice cover much earlier than spring, while in the summer there were weak and short-lived blooms of cyanobacteria. The relationship between nutrient availability and phytoplankton dynamics, however, remains uncertain according to our data.

This ongoing study contributes to understanding the role of light as a primary driver shaping phytoplankton community structures and dynamics in these environments.  Our research findings offer insights for refining predictive models, aiding in ecosystem-specific eutrophication management strategies, and supporting monitoring efforts of Harmful Algal Blooms.

How to cite: Kaharuddin, A. and Kaligatla, R.: Comparative Study of Spring and Summer Light Effects on Phytoplankton Communities in Semi-Enclosed Fresh- and Brackish Aquatic Ecosystems., EGU General Assembly 2024, Vienna, Austria, 14–19 Apr 2024, EGU24-5733, https://doi.org/10.5194/egusphere-egu24-5733, 2024.

EGU24-6065 | ECS | Orals | NP4.1

Magnetospheric time history:  How much do we need for forecasting? 

Kendra R. Gilmore, Sarah N. Bentley, and Andy W. Smith

Forecasting the aurora and its location accurately is important to mitigate any potential harm to vital infrastructure like communications and electricity grid networks. Current auroral prediction models rely on our understanding of the interaction between the magnetosphere and the solar wind or geomagnetic indices. Both approaches do well in predicting but have limitations concerning forecasting (geomagnetic indices-based model) or because of the underlying assumptions driving the model (due to a simplification of the complex interaction). By applying machine learning algorithms to this problem, gaps in our understanding can be identified, investigated, and closed. Finding the important time scales for driving empirical models provides the necessary basis for our long-term goal of predicting the aurora using machine learning.

Periodicities of the Earth’s magnetic field have been extensively studied on a global scale or in regional case studies. Using a suite of different time series analysis techniques including frequency analysis and investigation of long-scale changes of the median/ mean, we examine the dominant periodicities of ground magnetic field measurements at selected locations. A selected number of stations from the SuperMAG network (Gjerloev, 2012), which is a global network of magnetometer stations across the world, are the focus of this investigation.

The periodicities retrieved from the different magnetic field components are compared to each other as well as to other locations. In the context of auroral predictions, an analysis of the dominating periodicities in the auroral boundary data derived from the IMAGE satellite (Chisham et al., 2022) provides a counterpart to the magnetic field periodicities.

Ultimately, we can constrain the length of time history sensible for forecasting.

How to cite: Gilmore, K. R., Bentley, S. N., and Smith, A. W.: Magnetospheric time history:  How much do we need for forecasting?, EGU General Assembly 2024, Vienna, Austria, 14–19 Apr 2024, EGU24-6065, https://doi.org/10.5194/egusphere-egu24-6065, 2024.

EGU24-6151 | Posters on site | NP4.1

Using information-theory metrics to detect regime changes in dynamical systems 

Javier Amezcua and Nachiketa Chakraborty

Dynamical systems can display a range of dynamical regimes (e.g. attraction to, fixed points, limit cycles, intermittency, chaotic behaviour) depending on the values of parameters in the system. In this work we demonstrate how non-parametric entropy estimation codes (in particular NPEET) based on the Kraskov method can be applied to find regime transitions in a 3D chaotic model (the Lorenz 1963 system) when varying the values of the parameters. These infromation-theory-based methods are simpler and cheaper to apply than more traditional metrics from dynamical systems (e.g. computation of Lyapunov exponents). The non-parametric nature of the method allows for handling long time series without a prohibitive computational burden. 

How to cite: Amezcua, J. and Chakraborty, N.: Using information-theory metrics to detect regime changes in dynamical systems, EGU General Assembly 2024, Vienna, Austria, 14–19 Apr 2024, EGU24-6151, https://doi.org/10.5194/egusphere-egu24-6151, 2024.

EGU24-9367 | ECS | Orals | NP4.1

Fractal complexity evaluation of meteorological droughts over three Indian subdivisions using visibility Graphs 

Susan Mariam Rajesh, Muraleekrishnan Bahuleyan, Arathy Nair GR, and Adarsh Sankaran

Evaluation of scaling properties and fractal formalisms is one of the potential approaches for modelling complex series. Understanding the complexity and fractal characterization of drought index time series is essential for better preparedness against drought disasters. This study presents a novel visibility graph-based evaluation of fractal characterization of droughts of three meteorological subdivisions of India. In this method, the horizontal visibility graph (HVG) and Upside-down visibility graph (UDVG) are used for evaluating the network properties for different standardized precipitation index (SPI) series of 3, 6 and 12 month time scales representing short, medium and long term droughts. The relative magnitude of fractal estimates is controlled by the drought characteristics of wet-dry transitions. The estimates of degree distribution clearly deciphered the self-similar properties of droughts of all the subdivisions. For an insightful depiction of drought dynamics, the fractal exponents and spectrum are evaluated by the concurrent application of Sand Box Method (SBM) and Chhabra and Jenson Method (CJM). The analysis was performed for overall series along with the pre- and post-1976-77 Global climate shift scenarios. The complexity is more evident in short term drought series and UDVG formulations implied higher fractal exponents for different moment orders irrespective of drought type and locations considered in this study. Useful insights on the relationship between complex network and fractality are evolved from the study, which may help in improved drought forecasting. The visibility graph based fractality estimation evaluation is efficient in capturing drought and it has vast potential in the drought predictions in a changing environment.

Keywords:  Drought, Fractal, SPI, Visibility Graph

How to cite: Rajesh, S. M., Bahuleyan, M., Nair GR, A., and Sankaran, A.: Fractal complexity evaluation of meteorological droughts over three Indian subdivisions using visibility Graphs, EGU General Assembly 2024, Vienna, Austria, 14–19 Apr 2024, EGU24-9367, https://doi.org/10.5194/egusphere-egu24-9367, 2024.

EGU24-9537 | Posters on site | NP4.1

Wavelet-Induced Mode Extraction procedure: Application to climatic data 

Elise Faulx, Xavier Fettweis, Georges Mabille, and Samuel Nicolay

The Wavelet-Induced Mode Extraction procedure (WIME) [2] was developed drawing inspiration from Empirical Mode Decomposition. The concept involves decomposing the signal into modes, each presenting a characteristic frequency, using continuous wavelet transform. This method has yielded intriguing results in climatology [3,4]. However, the initial algorithm did not account for the potential existence of slight frequency fluctuations within a mode, which could impact the reconstruction of the original signal [4]. The new version (https://atoms.scilab.org/toolboxes/toolbox_WIME/0.1.0) now allows for the evolution of a mode in the space-frequency half-plane, thus considering the frequency evolution of a mode [2]. A natural application of this tool is in the analysis of Milankovitch cycles, where subtle changes have been observed throughout history. The method also refines the study of solar activity, highlighting the role of the "Solar Flip-Flop." Additionally, the examination of temperature time series confirms the existence of cycles around 2.5 years. It is now possible to attempt to correlate solar activity with this observed temperature cycle, as seen in speleothem records [1].

[1] Allan, M., Deliège, A., Verheyden, S., Nicolay S. and Fagel, N. Evidence for solar influence in a Holocene speleothem record, Quaternary Science Reviews, 2018.
[2] Deliège, A. and Nicolay, S., Extracting oscillating components from nonstationary time series: A wavelet-induced method, Physical Review. E, 2017.
[3] Nicolay, S., Mabille, G., Fettweis, X. and Erpicum, M., A statistical validation for the cycles found in air temperature data using a Morlet wavelet-based method, Nonlinear Processes in Geophysics, 2010.
[4] Nicolay, S., Mabille, G., Fettweis, X. and Erpicum, M., 30 and 43 months period cycles found in air temperature time series using the Morlet wavelet, Climate Dynamics, 2009.

How to cite: Faulx, E., Fettweis, X., Mabille, G., and Nicolay, S.: Wavelet-Induced Mode Extraction procedure: Application to climatic data, EGU General Assembly 2024, Vienna, Austria, 14–19 Apr 2024, EGU24-9537, https://doi.org/10.5194/egusphere-egu24-9537, 2024.

EGU24-10258 | Orals | NP4.1

New concepts on quantifying event data 

Norbert Marwan and Tobias Braun

A wide range of geoprocesses manifest as observable events in a variety of contexts, including shifts in palaeoclimate regimes, evolutionary milestones, tectonic activities, and more. Many prominent research questions, such as synchronisation analysis or power spectrum estimation of discrete data, pose considerable challenges to linear tools. We present recent advances using a specific similarity measure for discrete data and the method of recurrence plots for different applications in the field of highly discrete event data. We illustrate their potential for palaeoclimate studies, particularly in detecting synchronisation between signals of discrete extreme events and continuous signals, estimating power spectra of spiky signals, and analysing data with irregular sampling.

How to cite: Marwan, N. and Braun, T.: New concepts on quantifying event data, EGU General Assembly 2024, Vienna, Austria, 14–19 Apr 2024, EGU24-10258, https://doi.org/10.5194/egusphere-egu24-10258, 2024.

EGU24-10415 | ECS | Orals | NP4.1

Application of Transfer Learning techniques in one day ahead PV production prediction 

Marek Lóderer, Michal Sandanus, Peter Pavlík, and Viera Rozinajová

Nowadays photovoltaic panels are becoming more affordable, efficient, and popular due to their low carbon footprint. PV panels can be installed in many places providing green energy to the local grid reducing energy cost and transmission losses. Since the PV production is highly dependent on the weather conditions, it is extremely important to estimate expected output in advance in order to maintain energy balance in the grid and provide enough time to schedule load distribution. The PV production output can be calculated by various statistical and machine learning prediction methods. In general, the more data available, the more precise predictions can be produced. This poses a problem for recently installed PV panels for which not enough data has been collected or the collected data are incomplete. 

A possible solution to the problem can be the application of an approach called Transfer Learning which has the inherent ability to effectively deal with missing or insufficient amounts of data. Basically, Transfer Learning is a machine learning approach which offers the capability of transferring knowledge acquired from the source domain (in our case a PV panel with a large amount of historical data) to different target domains (PV panels with very little collected historical data) to resolve related problems (provide reliable PV production predictions). 

In our study, we investigate the application, benefits and drawbacks of Transfer Learning for one day ahead PV production prediction. The model used in the study is based on complex neural network architecture, feature engineering and data selection. Moreover, we focus on the exploration of multiple approaches of adjusting weights in the target model retraining process which affect the minimum amount of training data required, final prediction accuracy and model’s overall robustness. Our models use historical meteorological forecasts from Deutscher Wetterdienst (DWD) and photovoltaic measurements from the project PVOutput which collects data from installed solar systems across the globe. Evaluation is performed on more than 100 installed PV panels in Central Europe.

How to cite: Lóderer, M., Sandanus, M., Pavlík, P., and Rozinajová, V.: Application of Transfer Learning techniques in one day ahead PV production prediction, EGU General Assembly 2024, Vienna, Austria, 14–19 Apr 2024, EGU24-10415, https://doi.org/10.5194/egusphere-egu24-10415, 2024.

EGU24-11897 | Posters on site | NP4.1

Results of joint processing of magnetic observatory data of international Intermagnet network in a unified coordinate system 

Beibit Zhumabayev, Ivan Vassilyev, Zhasulan Mendakulov, Inna Fedulina, and Vitaliy Kapytin

In each magnetic observatory, the magnetic field is registered in local Cartesian coordinate systems associated with the geographic coordinates of the locations of these observatories. To observe extraterrestrial magnetic field sources, such as the interplanetary magnetic field or magnetic clouds, a method of joint processing of data from magnetic observatories of the international Intermagnet network was implemented. In this method, the constant component is removed from the observation results of individual observatories, their measurement data is converted into the ecliptic coordinate system, and the results obtained from all observatories are averaged after the coordinate transformation.

The first data on joint processing of measurement results from the international network of Intermagnet magnetic observatories in the period before the onset of magnetic storms of various types, during these storms and after their end are presented. There is a significant improvement in the signal-to-noise ratio after combining the measurement results from all observatories, which makes it possible to isolate weaker external magnetic fields. A change in the shape of magnetic field variations is shown, which can provide new knowledge about the mechanism of development of magnetic storms.

How to cite: Zhumabayev, B., Vassilyev, I., Mendakulov, Z., Fedulina, I., and Kapytin, V.: Results of joint processing of magnetic observatory data of international Intermagnet network in a unified coordinate system, EGU General Assembly 2024, Vienna, Austria, 14–19 Apr 2024, EGU24-11897, https://doi.org/10.5194/egusphere-egu24-11897, 2024.

We introduce the CLEAN algorithm to identify narrowband Ultra Low Frequency (ULF) Pc5 plasma waves in Earth’s magnetosphere. The CLEAN method was first used for constructing 2D images in astronomical radio interferometry but has since been applied to a huge range of areas including adaptation for time series analysis. The algorithm performs a nonlinear deconvolution in the frequency domain (equivalent to a least-squares in the time domain) allowing for identification of multiple individual wave spectral peaks within the same power spectral density. The CLEAN method also produces real amplitudes instead of model fits to the peaks and retains phase information. We applied the method to GOES magnetometer data spanning 30 years to study the distribution of narrowband Pc5 ULF waves at geosynchronous orbit. We found close to 30,0000 wave events in each of the vector magnetic field components in field-aligned coordinates. We discuss wave occurrence and amplitudes distributed in local time and frequency. The distribution of the waves under different solar wind conditions are also presented. With some precautions, which are applicable to other event identification methods, the CLEAN technique can be utilized to detect wave events and its harmonics in the magnetosphere and beyond. We also discuss limitations of the method mainly the detection of unrealistic peaks due to aliasing and Gibbs phenomena.

How to cite: Inceoglu, F. and Loto'aniu, P.: Using the CLEAN Algorithm to Determine the Distribution of Ultra Low Frequency Waves at Geostationary Orbit, EGU General Assembly 2024, Vienna, Austria, 14–19 Apr 2024, EGU24-12928, https://doi.org/10.5194/egusphere-egu24-12928, 2024.

EGU24-12938 | Posters on site | NP4.1

Applying Multifractal Theory and Statistical Techniques for High Energy Volcanic Explosion Detection and Seismic Activity Monitoring in Volcanic Time Series 

Marisol Monterrubio-Velasco, Xavier Lana, Raúl Arámbula-Mendoza, and Ramón Zúñiga

Understanding volcanic activity through time series data analysis is crucial for uncovering the fundamental physical mechanisms governing this natural phenomenon.

In this study, we show the application of multifractal and fractal methodologies, along with statistical analysis, to investigate time series associated with volcanic activity. We aim to make use of these approaches to identify significant variations within the physical processes related to changes in volcanic activity. These methodologies offer the potential to identify pertinent changes preceding a high-energy explosion or a significant volcanic eruption.

In particular, we apply it to analyze two study cases. First, the evolution of the multifractal structure of volcanic emissions of low, moderate, and high energy explosions applied to Volcán de Colima (México years 2013-2015). The results contribute to obtaining quite evident signs of the immediacy of possible dangerous emissions of high energy, close to 8.0x10^8 J. Additionally, the evolution of the adapted Gutenberg-Richter seismic law to volcanic energy emissions contributes to confirm the results obtained using multifractal analysis. Secondly, we also studied the time series of the Gutenberg-Richter b-parameter of seismic activities associated with volcanic emissions in Iceland, Hawaii, and the Canary Islands, through the concept of Disparity (degree of irregularity), the fractal Hurst exponent, H, and several multifractal parameters. The results obtained should facilitate a better knowledge of the relationships between the activity of volcanic emissions and the corresponding related seismic activities.  

How to cite: Monterrubio-Velasco, M., Lana, X., Arámbula-Mendoza, R., and Zúñiga, R.: Applying Multifractal Theory and Statistical Techniques for High Energy Volcanic Explosion Detection and Seismic Activity Monitoring in Volcanic Time Series, EGU General Assembly 2024, Vienna, Austria, 14–19 Apr 2024, EGU24-12938, https://doi.org/10.5194/egusphere-egu24-12938, 2024.

EGU24-13593 | ECS | Posters on site | NP4.1

Characterizing Uncertainty in Spatially Interpolated Time Series of Near-Surface Air Temperature 

Conor Doherty and Weile Wang

Spatially interpolated meteorological data products are widely used in the geosciences as well as disciplines like epidemiology, economics, and others. Recent work has examined methods for quantifying uncertainty in gridded estimates of near-surface air temperature that produce distributions rather than simply point estimates at each location. However, meteorological variables are correlated not only in space but in time, and sampling without accounting for temporal autocorrelation produces unrealistic time series and potentially underestimates cumulative errors. This work first examines how uncertainty in air temperature estimates varies in time, both seasonally and at shorter timescales. It then uses data-driven, spectral, and statistical methods to better characterize uncertainty in time series of estimated air temperature values. Methods for sampling that reproduce spatial and temporal autocorrelation are presented and evaluated. The results of this work are particularly relevant to domains like agricultural and ecology. Physical processes including evapotranspiration and primary production are sensitive to variables like near-surface air temperature, and errors in these important meteorological inputs accumulate in model outputs over time.

How to cite: Doherty, C. and Wang, W.: Characterizing Uncertainty in Spatially Interpolated Time Series of Near-Surface Air Temperature, EGU General Assembly 2024, Vienna, Austria, 14–19 Apr 2024, EGU24-13593, https://doi.org/10.5194/egusphere-egu24-13593, 2024.

EGU24-13879 | ECS | Posters on site | NP4.1

Understanding the role of vegetation responses to drought in regulating autumn senescence 

Eunhye Choi and Josh Gray

Vegetation phenology is the recurring of plant growth, including the cessation and resumption of growth, and plays a significant role in shaping terrestrial water, nutrient, and carbon cycles. Changes in temperature and precipitation have already induced phenological changes around the globe, and these trends are likely to continue or even accelerate. While warming has advanced spring arrival in many places, the effects on autumn phenology are less clear-cut, with evidence for earlier, delayed, or even unchanged end of the growing season (EOS). Meteorological droughts are intensifying in duration and frequency because of climate change. Droughts intricately impact changes in vegetation, contingent upon whether the ecosystem is limited by water or energy. These droughts have the potential to influence EOS changes. Despite this, the influence of drought on EOS remains largely unexplored. This study examined moisture’s role in controlling EOS by understanding the relationship between precipitation anomalies, vegetation’s sensitivity to precipitation (SPPT), and EOS. We also assess regional variations in responses to the impact of SPPT on EOS.

The study utilized multiple vegetation and water satellite products to examine the patterns of SPPT in drought and its impact on EOS across aridity gradients and vegetation types. By collectively evaluating diverse SPPTs from various satellite datasets, this work offers a comprehensive understanding and critical basis for assessing the impact of drought on EOS. We focused on the Northern Hemisphere from 2000 to 2020, employing robust statistical methods. This work found that, in many places, there was a stronger relationship between EOS and drought in areas with higher SPPT. Additionally, a non-linear negative relationship was identified between EOS and SPPT in drier regions, contracting with a non-linear positive relationship observed in wetter regions. These findings were consistent across a range of satellite-derived vegetation products. Our findings provide valuable insights into the effects of SPPT on EOS during drought, enhancing our understanding of vegetation responses to drought and its consequences on EOS and aiding in identifying drought-vulnerable areas.

How to cite: Choi, E. and Gray, J.: Understanding the role of vegetation responses to drought in regulating autumn senescence, EGU General Assembly 2024, Vienna, Austria, 14–19 Apr 2024, EGU24-13879, https://doi.org/10.5194/egusphere-egu24-13879, 2024.

EGU24-16981 | ECS | Orals | NP4.1

A machine-learning-based approach for predicting the geomagnetic secular variation 

Sho Sato and Hiroaki Toh

We present a machine-learning-based approach for predicting the geomagnetic main field changes, known as secular variation (SV), in a 5-year range for use for the 14th generation of International Geomagnetic Reference Field (IGRF-14). The training and test datasets of the machine learning (ML) models are geomagnetic field snapshots derived from magnetic observatory hourly means, and CHAMP and Swarm-A satellite data (MCM Model; Ropp et al., 2020). The geomagnetic field data are not used as-is in the original time series but were differenced twice before training. Because SV is strongly influenced by the geodynamo process occurring in the Earth's outer core, challenges still persist despite efforts to model and forecast the realistic nonlinear behaviors (such as the geomagnetic jerks) of the geodynamo through data assimilation. We compare three physics-uninformed ML models, namely, the Autoregressive (AR) model, Vector Autoregressive (VAR) model, and Recurrent Neural Network (RNN) model, to represent the short-term temporal evolution of the geomagnetic main field on the Earth’s surface. The quality of 5-year predictions is tested by the hindcast results for the learning window from 2004.50 to 2014.25. These tests show that the forecast performance of our ML model is comparable with that of candidate models of IGRF-13 in terms of data misfits after the release epoch (Year 2014.75). It is found that all three ML models give 5-year prediction errors of less than 100nT, among which the RNN model shows a slightly better accuracy. They also suggest that Overfitting to the training data used is an undesirable machine learning behavior that occurs when the RNN model gives accurate reproduction of training data but not for forecasting targets.

How to cite: Sato, S. and Toh, H.: A machine-learning-based approach for predicting the geomagnetic secular variation, EGU General Assembly 2024, Vienna, Austria, 14–19 Apr 2024, EGU24-16981, https://doi.org/10.5194/egusphere-egu24-16981, 2024.

EGU24-17344 | Posters on site | NP4.1

Introducing a new statistical theory to quantify the Gaussianity of the continuous seismic signal 

Éric Beucler, Mickaël Bonnin, and Arthur Cuvier

The quality of the seismic signal recorded at permanent and temporary stations is sometimes degraded, either abruptly or over time. The most likely cause is a high level of humidity, leading to corrosion of the connectors but environmental changes can also alter recording conditions in various frequency ranges and not necessarily for all three components in the same way. Assuming that the continuous seismic signal can be described by a normal distribution, we present a new approach to quantify the seismogram quality and to point out any time sample that deviates from this Gaussian assumption. To this end the notion of background Gaussian signal (BGS) to statistically describe a set of samples that follows a normal distribution. The discrete function obtained by sorting the samples in ascending order of amplitudes is compared to a modified probit function to retrieve the elements composing the BGS, and its statistical properties, mostly the Gaussian standard deviation, which can then differ from the classical standard deviation. Hence the ratio of both standard deviations directly quantifies the dominant gaussianity of the continuous signal and any variation reflects a statistical modification of the signal quality. We present examples showing daily variations in this ratio for stations known to have been affected by humidity, resulting in signal degradation. The theory developed can be used to detect subtle variations in the Gaussianity of the signal, but also to point out any samples that don't match the Gaussianity assumption, which can then be used for other seismological purposes, such as coda determination.

How to cite: Beucler, É., Bonnin, M., and Cuvier, A.: Introducing a new statistical theory to quantify the Gaussianity of the continuous seismic signal, EGU General Assembly 2024, Vienna, Austria, 14–19 Apr 2024, EGU24-17344, https://doi.org/10.5194/egusphere-egu24-17344, 2024.

EGU24-17566 | ECS | Posters on site | NP4.1

Unveiling Climate-Induced Ocean Wave Activities Using Seismic Array Data in the North Sea Region 

Yichen Zhong, Chen Gu, Michael Fehler, German Prieto, Peng Wu, Zhi Yuan, Zhuoyu Chen, and Borui Kang

Climate events may induce abnormal ocean wave activities, that can be detected by seismic array on nearby coastlines. We collected long-term continuous array seismic data in the Groningen area and the coastal areas of the North Sea, conducted a comprehensive analysis to extract valuable climate information hidden within the ambient noise. Through long-term spectral analysis, we identified the frequency band ranging from approximately 0.2Hz, which appears to be associated with swell waves within the region, exhibiting a strong correlation with the significant wave height (SWH). Additionally, the wind waves with a frequency of approximately 0.4 Hz and gravity waves with periods exceeding 100 seconds were detected from the seismic ambient noise. We performed a correlation analysis between the ambient noise and various climatic indexes across different frequency bands. The results revealed a significant correlation between the North Atlantic Oscillation (NAO) Index and the ambient noise around 0.17Hz.

Subsequently, we extracted the annual variation curves of SWH frequency from ambient noise at each station around the North Sea and assembled them into a sparse spatial grid time series (SGTS). An empirical orthogonal function (EOF) analysis was conducted, and the Principal Component (PC) time series derived from the EOF analysis were subjected to a correlation analysis with the WAVEWATCH III (WW3) model simulation data, thereby confirming the wave patterns. Moreover, we conducted the spatial distribution study of SGTS. The spatial features revealed that the southern regions of the North Sea exhibit higher wind-wave energy components influenced by the Icelandic Low pressure system and topography, which explains the correlation between ambient noise in the region and the NAO index. Furthermore, spatial features disclosed a correlation between the first EOF mode of the North Sea ocean waves and the third mode of sea surface temperature anomalies. This research shows the potential of utilizing existing off-shore seismic monitoring systems to study global climate variation and physical oceanography.

How to cite: Zhong, Y., Gu, C., Fehler, M., Prieto, G., Wu, P., Yuan, Z., Chen, Z., and Kang, B.: Unveiling Climate-Induced Ocean Wave Activities Using Seismic Array Data in the North Sea Region, EGU General Assembly 2024, Vienna, Austria, 14–19 Apr 2024, EGU24-17566, https://doi.org/10.5194/egusphere-egu24-17566, 2024.

EGU24-18061 | ECS | Orals | NP4.1

A new methodology for time-series reconstruction of global scale historical Earth observation data 

Davide Consoli, Leandro Parente, and Martijn Witjes

Several machine learning algorithms and analytical techniques do not allow gaps or non-values in input data. Unfortunately, earth observation (EO) datasets, such as satellite images, are gravely affected by cloud contamination and sensor artifacts that create gaps in the time series of collected images. This limits the usage of several powerful techniques for modeling and analysis. To overcome these limitations, several works in literature propose different imputation methods to reconstruct the gappy time series of images, providing complete time-space datasets and enabling their usage as input for many techniques.

However, among the time-series reconstruction methods available in literature, only a few of them are publicly available (open source code), applicable without any external source of data, and suitable for application to petabyte (PB) sized dataset like the full Landsat archive. The few methods that match all these characteristics are usually quite trivial (e.g. linear interpolation) and, as a consequence, they often show poor performance in reconstructing the images. 

For this reason, we propose a new methodology for time series reconstruction designed to match all these requirements. Like some other methods in literature, the new method, named seasonally weighted average generalization (SWAG), works purely on the time dimension, reconstructing the images working on each time series of each pixel separately. In particular, the method uses a weighted average of the samples available in the original time series to reconstruct the missing values. Enforcing the annual seasonality of each band as a prior, for the reconstruction of each missing sample in the time series a higher weight is given to images that are collected exactly on integer multiples of a year. To avoid propagation of land cover changes in future or past images, higher weights are given to more recent images. Finally, to have a method that respects causality, only images from the past of each sample in the time series are used.

To have computational performance suitable for PB sized datasets the method has been implemented in C++ using a sequence of fast convolution methods and Hadamard products and divisions. The method has been applied to a bimonthly aggregated version of the global GLAD Landsat ARD-2 collection from 1997 to 2022, producing a 400 terabyte output dataset. The produced dataset will be used to generate maps for several biophysical parameters, such as Fraction of Absorbed Photosynthetically Active Radiation (FAPAR), normalized difference water index (NDWI) and bare soil fraction (BSF). The code is available as open source, and the result is fully reproducible.

References:

Potapov, Hansen, Kommareddy, Kommareddy, Turubanova, Pickens, ... & Ying  (2020). Landsat analysis ready data for global land cover and land cover change mapping. Remote Sensing, 12(3), 426.

Julien, & Sobrino (2019). Optimizing and comparing gap-filling techniques using simulated NDVI time series from remotely sensed global data. International Journal of Applied Earth Observation and Geoinformation, 76, 93-111.

Radeloff, Roy, Wulder, Anderson, Cook, Crawford, ... & Zhu (2024). Need and vision for global medium-resolution Landsat and Sentinel-2 data products. Remote Sensing of Environment, 300, 113918.

How to cite: Consoli, D., Parente, L., and Witjes, M.: A new methodology for time-series reconstruction of global scale historical Earth observation data, EGU General Assembly 2024, Vienna, Austria, 14–19 Apr 2024, EGU24-18061, https://doi.org/10.5194/egusphere-egu24-18061, 2024.

EGU24-18197 | ECS | Orals | NP4.1 | Highlight

The regularity of climate-related extreme events under global warming 

Karim Zantout, Katja Frieler, and Jacob Schewe and the ISIMIP team

Climate variability gives rise to many different kinds of extreme impact events, including heat waves, crop failures, or wildfires. The frequency and magnitude of such events are changing under global warming. However, it is less known to what extent such events occur with some regularity, and whether this regularity is also changing as a result of climate change. Here, we present a novel method to systematically study the time-autocorrelation of these extreme impact events, that is, whether they occur with a certain regularity. In studies of climate change impacts, different types of events are often studied in isolation, but in reality they interact. We use ensembles of global biophysical impact simulations from the Inter-Sectoral Impact Model Intercomparison Project (ISIMIP) driven with climate models to assess current conditions and projections. The time series analysis is based on a discrete Fourier transformation that accounts for the stochastic fluctuations from the climate model. Our results show that some climate impacts, such as crop failure, indeed exhibit a dominant frequency of recurrence; and also, that these regularity patterns change over time due to anthropogenic climate forcing.

How to cite: Zantout, K., Frieler, K., and Schewe, J. and the ISIMIP team: The regularity of climate-related extreme events under global warming, EGU General Assembly 2024, Vienna, Austria, 14–19 Apr 2024, EGU24-18197, https://doi.org/10.5194/egusphere-egu24-18197, 2024.

EGU24-18210 | ECS | Posters on site | NP4.1

Long-term vegetation development in context of morphodynamic processes since mid-19th century 

Katharina Ramskogler, Moritz Altmann, Sebastian Mikolka-Flöry, and Erich Tasser

The availability of comprehensive aerial photography is limited to the mid-20th century, posing a challenge for quantitatively analyzing long-term surface changes in proglacial areas. This creates a gap of approximately 100 years, spanning the end of the Little Ice Age (LIA). Employing digital monoplotting and historical terrestrial images, our study reveals quantitative surface changes in a LIA lateral moraine section dating back to the second half of the 19th century, encompassing a total study period of 130 years (1890 to 2020). With the long-term analysis at the steep lateral moraines of Gepatschferner (Kauner Valley, Tyrol, Austria) we aimed to identify changes in vegetation development in context with morphodynamic processes and the changing climate.

In 1953, there was an expansion in the area covered by vegetation, notably encompassing scree communities, alpine grassland, and dwarf shrubs. However, the destabilization of the system after 1980, triggered by rising temperatures and the resulting thawing of permafrost, led to a decline in vegetation cover by 2020. Notably, our observations indicated that, in addition to morphodynamic processes, the overarching trends in temperature and precipitation exerted a substantial influence on vegetation development. Furthermore, areas with robust vegetation cover, once stabilised, were reactivated and subjected to erosion, possibly attributed to rising temperatures post-1980.

This study demonstrates the capability of historical terrestrial images to enhance the reconstruction of vegetation development in context with morphodynamics in high alpine environments within the context of climate change. However, it is important to note that long-term mapping of vegetation development through digital monoplotting has limitations, contingent on the accessibility and quality of historical terrestrial images, as well as the challenges posed by shadows in high alpine regions. Despite these limitations, this long-term approach offers fundamental data on vegetation development for future modelling efforts.

How to cite: Ramskogler, K., Altmann, M., Mikolka-Flöry, S., and Tasser, E.: Long-term vegetation development in context of morphodynamic processes since mid-19th century, EGU General Assembly 2024, Vienna, Austria, 14–19 Apr 2024, EGU24-18210, https://doi.org/10.5194/egusphere-egu24-18210, 2024.

EGU24-19601 | ECS | Posters on site | NP4.1

Discrimination of  geomagnetic quasi-periodic signals by using SSA Transform 

Palangio Paolo Giovanni and Santarelli Lucia

Discrimination of  geomagnetic quasi-periodic signals by using SSA Transform

  • Palangio1, L. Santarelli 1

1Istituto Nazionale di Geofisica e Vulcanologia L’Aquila

3Istituto Nazionale di Geofisica e Vulcanologia Roma


Correspondence to:  lucia.santarelli@ingv.it


Abstract

In this paper we present an application of  the SSA Transform to the detection and reconstruction of  very weak geomagnetic signals hidden in noise. In the SSA Transform  multiple subspaces are used for representing and reconstructing   signals and noise.  This analysis allows us to reconstruct, in the time domain, the different harmonic components contained in the original signal by using  ortogonal functions. The objective is to identificate the dominant  subspaces that can be attributed to the  signals and the subspaces that can be attributed to the noise,  assuming that all these  subspaces are orthogonal to each other, which implies that the  signals and noise  are independent of one another. The subspace of the signals is mapped simultaneously on several spaces with a lower dimension, favoring the dimensions that best discriminate the patterns. Each subspace of the signal space is used to encode different subsets of functions having common characteristics, such as  the same periodicities. The subspaces  identification was performed by using singular value decomposition (SVD) techniques,  known as  SVD-based identification methods  classified in a subspace-oriented scheme.The  quasi-periodic variations of geomagnetic field  has been investigated in the range of scale which span from 22 years to 8.9 days such as the  Sun’s polarity reversal cycle (22 years), sun-spot cycle (11 years), equinoctial effect (6 months), synodic rotation of the Sun (27 days) and its harmonics. The strength of these signals vary from fractions of a nT to tens of nT. Phase and frequency variability of these cycles has been evaluated from the range of variations in the geomagnetic field recorded at middle latitude place (covering roughly 4.5 sunspot cycles). Magnetic data recorded at L'Aquila Geomagnetic observatory (geographic coordinates: 42° 23’ N, 13° 19’E, geomagnetic coordinates: 36.3° N,87°.2 E, L-shell=1.6) are used from 1960 to 2009.


How to cite: Paolo Giovanni, P. and Lucia, S.: Discrimination of  geomagnetic quasi-periodic signals by using SSA Transform, EGU General Assembly 2024, Vienna, Austria, 14–19 Apr 2024, EGU24-19601, https://doi.org/10.5194/egusphere-egu24-19601, 2024.

EGU24-22262 | ECS | Posters on site | NP4.1

Temporal Interpolation of Sentinel-2 Multispectral Time Series in Context of Land Cover Classification with Machine Learning Algorithms 

Mate Simon, Mátyás Richter-Cserey, Vivien Pacskó, and Dániel Kristóf

Over the past decades, especially since 2014, large quantities of Earth Observation (EO) data became available in high spatial and temporal resolution, thanks to ever-developing constellations (e.g.: Sentinel, Landsat) and open data policy. However, in the case of optical images, affected by cloud coverage and the spatially changing overlap of relative satellite orbits, creating temporally generalized and dense time series by using only measured data is challenging, especially when studying larger areas.

Several papers investigate the question of spatio-temporal gap filling and show different interpolation methods to calculate missing values corresponding to the measurements. In the past years more products and technologies have been constructed and published in this field, for example Copernicus HR-VPP Seasonal Trajectories (ST) product.  These generalized data structures are essential to the comparative analysis of different time periods or areas and improve the reliability of data analyzing methods such as Fourier transform or correlation. Temporally harmonized input data is also necessary in order to improve the results of Machine Learning classification algorithms such as Random Forest or Convolutional Neural Networks (CNN). These are among the most efficient methods to separate land cover categories like arable lands, forests, grasslands and built-up areas, or crop types within the arable category.

This study analyzes the efficiency of different interpolation methods on Sentinel-2 multispectral time series in the context of land cover classification with Machine Learning. We compare several types of interpolation e.g. linear, cubic and cubic-spline and also examine and optimize more advanced methods like Inverse Distance Weighted (IDW) and Radial Basis Function (RBF). We quantify the accuracy of each method by calculating mean square error between measured and interpolated data points. The role of interpolation of the input dataset in Deep Learning (CNN) is investigated by comparing Overall, Kappa and categorical accuracies of land cover maps created from only measured and interpolated time series. First results show that interpolation has a relevant positive effect on accuracy statistics. This method is also essential in taking a step towards constructing robust pretrained Deep Learning models, transferable between different time intervals and agro-ecological regions.

The research has been implemented with the support provided by the Ministry of Culture and Innovation of Hungary from the National Research, Development and Innovation Fund, financed under the KDP-2021 funding scheme.


Keywords: time series analysis, Machine Learning, interpolation, Sentinel

How to cite: Simon, M., Richter-Cserey, M., Pacskó, V., and Kristóf, D.: Temporal Interpolation of Sentinel-2 Multispectral Time Series in Context of Land Cover Classification with Machine Learning Algorithms, EGU General Assembly 2024, Vienna, Austria, 14–19 Apr 2024, EGU24-22262, https://doi.org/10.5194/egusphere-egu24-22262, 2024.

In recent years, tremendous progress has been made in making the information gathered by sensors located on agricultural fields available almost immediately. Transferring the data directly to the cloud and rapidly presenting it to researchers, decision-makers, and farmers assist in optimally determining the timing, amount, and composition of fertigation. There have been ongoing efforts to reduce the technological and economic barriers to the efficient and reliable use of sensors that continuously monitor the root system’s heterogeneous and dynamic nature. Despite this, there are still many open questions related to determining the structure and installation locations of the sensors, the optimal algorithm with which the scheduling is determined, and how different sensing methods are combined to make optimal decisions.

Sensor development is usually done using in situ experiments. These complex and expensive experiments ultimately result in a long development time. Using numerical models may accelerate the development of sensing methods and the selection of the optimal algorithm for fertigation. Numerical models are used as a research tool for understanding, quantifying, and predicting phenomena and processes in the soil-plant-atmosphere system and for planning and managing water resources and their quality, including irrigation and drainage. Despite their complexity, numerical models are increasingly used thanks to a better understanding of water flow and solute transport processes, the development and improvement of mathematical methods for solving governing equations, and the accelerated development of computers capable of calculating different processes simultaneously in small intervals of time and space.

The presentation will review three sensing methods and present a combination of models that solve the water status and the fertilizer concentration in the root zone. The methods that will be reviewed are a) a tensiometer for measuring soil pressure heads, b) a suction cup for inferring soil solution concentrations, and c) a minirhizotron for evaluating the root system structure.

Determining optimal fertigation undoubtedly requires a multidisciplinary approach that considers the root zone’s physical, chemical, and biological characteristics. The combination of continuous measurements and numerical models may improve decision-making regarding resource application, thus optimizing the use of water and fertilizers while increasing economic profit and reducing environmental impacts.

How to cite: Lazarovitch, N. and Simunek, J.: Improving fertigation scheduling by combining continuous monitoring and numerical modeling of the root zone, EGU General Assembly 2024, Vienna, Austria, 14–19 Apr 2024, EGU24-158, https://doi.org/10.5194/egusphere-egu24-158, 2024.

EGU24-1571 | ECS | Posters on site | SSS9.17

NITRINET: A nitrification predictive model for reclaimed water distribution networks 

Ignacio Gómez Lucena, Emilio Camacho Poyato, and Juan Antonio Rodríguez Díaz

The present work consists of the development of a model (NITRINET) to simulate nitrification processes in reclaimed water distribution networks for agricultural irrigation. Due to water scarcity and climate change scenarios, irrigation with reclaimed water has gained interest worlwide, especially in arid and semi-arid regions, like the Mediterranean Basin. The Tintín Irrigation District distribution network (Montilla, southern Spain) was selected as case study. The importance of this model relies on the fact that the chemical composition of reclaimed water varies spatially along the distribution network. It has been observed that nitrate concentrations increase along the irrigation network in contrast to the reduction observed in the ammoniacal forms. It confirms that nitrification processes are occurring inside the pipes. To carry out precision fertigation strategies (fertilization and irrigation simultaneously) and optimize the amount of fertilizer applied it is necessary to determine the concentration of nutrients present in the water arriving at each farm. The nutrients that reclaimed water already carries must be considered when planning fertilization. This allows for a significant reduction in the amount of fertilizer applied to the soil, which has a positive impact both on the environment and on the farmer’s economy. Simulations performed with NITRINET have shown promising results, predicting water pH and the concentration of ammoniacal nitrogen (NH4+-N) and nitric nitrogen (NO3--N) in irrigation water arriving at farms with a mean absolute error of 0.34, 1.46 mg·L-1 and 1.23 mg·L-1, respectively. The main purpose of NITRINET is that it can be used as a Decision Support System when planning fertilization at irrigation district level. The findings of this work suggest that spatio-temporal variability of water quality must be considered when reclaimed water is used for irrigation, especially in big irrigation districts with long pipe distances. 

How to cite: Gómez Lucena, I., Camacho Poyato, E., and Rodríguez Díaz, J. A.: NITRINET: A nitrification predictive model for reclaimed water distribution networks, EGU General Assembly 2024, Vienna, Austria, 14–19 Apr 2024, EGU24-1571, https://doi.org/10.5194/egusphere-egu24-1571, 2024.

EGU24-1578 | ECS | Orals | SSS9.17

From sensors to decisions: Data flows to enhance irrigation efficiency for smallholder orchards 

Felix Thomas, Juan Gabriel Pérez Pérez, Luis Bonet Pérez de León, Amparo Martínez-Gimeno, Daniela Vanella, Simona Consoli, Juan Miguel Ramírez Cuesta, Hicham Elomari, Abousrie Farag, and Ulrike Werban

In the Mediterranean area, agriculture is subject to numerous demands caused by the interplay of climate change, population growth, changing food production patterns and the increasing need for nature conservation measures, enforcing an efficient usage of resources and the creation of resilient production systems. To ensure a more sustainable water use, water policies have been adopted in the European Union as well as in Northern Africa countries, such as Morocco and Egypt as irrigation is the largest water user in the Mediterranean region. Small farmers make up to two thirds of the agricultural areas and are therefore an important part of areas agricultural community. Estimates see up 35% possible water savings could be achieved by more efficient irrigation systems. New technologies and practices are currently adopted mostly by large farms. The challenge is therefore to increase the usage of efficient irrigation techniques by small farmers. We present a concept of data handling in a data chain, from the collection in the field towards calculated irrigation recommendations that are provided via mobile application. The idea behind it is to provide an irrigation management tool that aims to overcome barriers in adapting new technologies for smallholders. It is designed to provide irrigation recommendations for orange and olive orchards based on a bottom-up approach. The derived irrigation recommendations are dependent on the available input data based on sensor systems: the FAO-56 approach based on climate data, or a soil water balance model relying on soil moisture data. As the calculation of irrigation recommendations is based on the collected climate and soil moisture data, we are focusing on the possibilities of automated data quality control and the methods and obstacles of the data handling when providing the recommendations. The final product is derived in form of an application for mobile devices that is intuitive and easy to use. The data handling is hereby done using the python programming language and RESTful application programming interfaces, and the transfers are executed periodically using dockerized applications. The main advantage of the proposed workflow is the possibility to integrate data from a variety of sensors and platforms and the access for smallholders can be done via mobile phones. This way, the currently measured data on the agricultural fields and up-to-date irrigation needs are easily accessible. The system is currently under validation. We present the whole framework, starting at measured values by sensors and ending in the irrigation recommendation for the farmers available in the App.

How to cite: Thomas, F., Pérez Pérez, J. G., Bonet Pérez de León, L., Martínez-Gimeno, A., Vanella, D., Consoli, S., Ramírez Cuesta, J. M., Elomari, H., Farag, A., and Werban, U.: From sensors to decisions: Data flows to enhance irrigation efficiency for smallholder orchards, EGU General Assembly 2024, Vienna, Austria, 14–19 Apr 2024, EGU24-1578, https://doi.org/10.5194/egusphere-egu24-1578, 2024.

EGU24-1780 | ECS | Posters on site | SSS9.17

A computational framework for irrigation scheduling of a winter wheat – summer maize rotation system 

Xiangyu Fan and Niels Schütze

One of the solutions for the current problem of limited arable land and growing demand for food is the increase of the land use intensity, e.g., by crop rotation. However, it can lead to excessively high agricultural water demand. We evaluate a winter wheat-summer maize crop rotation system, the main cropping system in the North China Plain, and develop a computational framework for optimal irrigation of two consecutive crop growth periods within a single year. The framework considers the impact of climate variability and considers limited agricultural water allocation.  In a case study for a site in the North China Plain, the framework is implemented using Aquacrop-OS that simulates the soil water balance and the interactions between two consecutive cropping seasons. A two-stage optimization ensures the maximum global crop water productivity, considering the food risk and yield stability. The developed framework can be used for optimal irrigation scheduling and as a tool for estimating minimum irrigation water demands and crop productivity for more sustainable water resources management on a regional level.

How to cite: Fan, X. and Schütze, N.: A computational framework for irrigation scheduling of a winter wheat – summer maize rotation system, EGU General Assembly 2024, Vienna, Austria, 14–19 Apr 2024, EGU24-1780, https://doi.org/10.5194/egusphere-egu24-1780, 2024.

EGU24-4157 | ECS | Orals | SSS9.17

Establishing management zones for irrigation using soil properties and Remote Sensing 

Faten Ksantini, Ana M. Tarquis, Andrés Almeida-Ñauñay, Ernesto Sanz, and Miguel Quemada

Soil texture influences many other soil attributes, including its physical, chemical, and biological characteristics. Soil texture dictates vital factors such as aeration, nutrient, water availability, and heat retention. These aspects collectively impact various aspects of plant life, encompassing growth, development, productivity, and quality. Agricultural soils are commonly classified into several categories based on their texture to facilitate effective agricultural practices like tillage, irrigation, fertilization, and pesticide applications.

A growing call has recently been made for integrating machine learning (ML) techniques to enhance comprehension and insight into soil behaviour. However, it is essential to note that real-world datasets often exhibit inherent imbalances. In such cases, ML models tend to overemphasize the majority classes while simultaneously underestimating the minority ones. This study aimed to investigate the effects of imbalance in training data on the performance of a random forest model (RF).

The original data used in this work was from La Chimenea farm station near Aranjuez (Madrid, Spain). The variables included were Electrical conductivity (EC), EC shape, EC depth, EC ratio, slope, curve, and NDVI derived from Sentinel-2. Clay and sand percentages were obtained with the exact spatial resolution, and the USDA classification was applied based on them. A descriptive statistics analysis was conducted to analyze the data. Then, Pearson's coefficient (r) of linear correlation was calculated to verify possible relations between the different variables. Then, a synthetic resampling approach using the Synthetic Minority Oversampling TEchnique (SMOTE) was employed to make a balanced dataset from the original data.

The imbalance and balance data classification were compared to see SMOTE's benefits in better-classifying soil texture.

Keywords: digital soil mapping; machine learning; soil texture; imbalance classification; data resampling


 Acknowledgements

This work has received support from projects PID2021-124041OB-C22 and PID2021-122711NB-C21, funded by the Ministerio de Ciencia e Innovación (Ministry of Science and Innovation).


How to cite: Ksantini, F., Tarquis, A. M., Almeida-Ñauñay, A., Sanz, E., and Quemada, M.: Establishing management zones for irrigation using soil properties and Remote Sensing, EGU General Assembly 2024, Vienna, Austria, 14–19 Apr 2024, EGU24-4157, https://doi.org/10.5194/egusphere-egu24-4157, 2024.

EGU24-4555 | Posters on site | SSS9.17

Nitrogen Cycling and Root Dynamics in an Agroforestry System 

Jhonathan Ephrath, Talli Ilani, Moshe Silberbush, and Pedro Berliner

Primary productivity in arid zones is limited by the lack of water and soil nutrients. Conveying and storing flood water in plots surrounded by embankments allows agricultural activity in areas where there is generally insufficient rainfall to sustain agricultural production. The efficient exploitation of the stored water was achieved by intercropping trees with an annual crop and pruning the former before planting the intercrop. This approach minimized competition for water and solar radiation. However, in order to ensure the long-term viability of such a system nutrients have to be added to the soil in order to compensate for the uptake of the intercrop, Nitrogen being the main element. The composted leaves of a leguminous shrub-like tree incorporated into the soil could satisfy the nitrogen demand of the intercrop. We tested this approach in a simulated runoff agroforestry system with fast-growing acacia (A. saligna) trees as the woody component and maize (Zea mays L.) as intercrop for two consecutive seasons. Ten treatments were applied (radical pruning before intercrop planting, compost application and planting of the intercrop as factors) and  the below- and above-ground effects and interactions examined. Pruning the trees canopies changed the trees’ root spatial and temporal distribution, allowing the annual crop to develop between the trees. Addition of compost significantly increased intercrop yield irrespective of the presence of the woody component while the presence of the intercrop did not affect the productivity of the trees. The highest productivity was obtained for the pruned trees, intercrop and added compost treatment.  A significant increase in the presence of tree roots was observed for the deeper parts of the soil profile for the pruned trees, intercrop and added compost treatment.  The addition of composted leaves from the leguminous woody component to the intercrop resulted in a very high water use efficiency of the water stored in the soil.

How to cite: Ephrath, J., Ilani, T., Silberbush, M., and Berliner, P.: Nitrogen Cycling and Root Dynamics in an Agroforestry System, EGU General Assembly 2024, Vienna, Austria, 14–19 Apr 2024, EGU24-4555, https://doi.org/10.5194/egusphere-egu24-4555, 2024.

The analysis of a looped water distribution system, usually employed in subsurface drip irrigation (SDI), under pressure and steady-state conditions, can be successfully performed if the topology of the network, the structure pipes, and the discharges at the nodes are known (Wang et al., 2021). Solving these complex networks usually requires an iterative approach. The Hardy Cross method (HCM), which was originally developed in 1936 (Cross, 1936) for manual calculations in civil engineering, can also be applied in lopped drip irrigation systems. This approach relies on the successive addition of flow-rate adjustments in each pipe to achieve the energy balance in each network segment, although limited by the Darcy-Weisbach resistance equation where the discharge exponent is set to 2.

In this work, a reformulated HCM was applied to looped drip irrigation systems, considering both local losses due to emitters’ insertion and the Hazen-Williams resistance equation (discharge exponent = 1.852), which is better suited to describe friction losses in the commonly used polyethylene pipes. The hydraulic performance of closed circuits calculated by HCM was analysed and compared with that of open circuits designed by IRRILAB software application (Baiamonte, 2018).

In particular, the final objective is to assess the energy-saving provided by the closed circuits (cc) in drip irrigation systems with respect to open circuits (oc). The energy-saving amount is expressed as the ratio (hratio < 1), between the inlet pressure head, hin, of the closed circuit and that of the open circuit. A predictive relationship of hratio was calibrated for 3000 simulations carried out for rectangular irrigation units characterized by different geometry, pipe diameters, emitters’ spacing and flow rate, providing relative errors RE < 0.25%. The results show that hratio depends on the pressure head tolerance of the manifold, δM, associated with the open circuits, which IRRILAB requires as an input parameter. This is very reasonable since, for high δM, the discharge circulating in the manifold is also high and closing the circuits provides low hratio (hin cc << hin oc). The vice versa occurs for low δM. Contrarily, the number of drip laterals, Nrows, has only a marginal effect on hratio. Of course, the energy-saving benefit should also consider the higher investment costs of cc than oc. However, this issue is beyond the scope of this study.

Keywords: Hardy-Cross method, Drip irrigation systems, Closed and open circuits, Pressure head tolerance, Energy-saving.

Acknowledgement: This study was funded by Ministero dell’Università e della Ricerca of Italy, project PRIN 2022 "Smart Technologies and Remote Sensing methods to support the sustainable Agriculture WAter Management of Mediterranean woody Crops (SWAM4Crops)" CUP B53D23018040001

References
Baiamonte, G. (2018). Explicit relationships for optimal designing rectangular microirrigation units on uniform slopes: The IRRILAB software application. Computers and Electronics in Agriculture, 153, 151-168.
Cross, H. (1936). Analysis of flow in networks of conduits or conductors. University of Illinois. Engineering Experiment Station, Bulletin; no. 286.
Wang, J., Chen, R., Yang, T., Wei, T., Wang, X. (2021). A computationally-efficient finite element method for the hydraulic analysis and design of subsurface drip irrigation subunits. Journal of Hydrology, 595, 125990.

How to cite: Vaccaro, G., Palermo, S., and Baiamonte, G.: Applying the Hardy Cross method to assess the energy-saving associated with closed circuits in drip irrigation systems compared to open circuits, EGU General Assembly 2024, Vienna, Austria, 14–19 Apr 2024, EGU24-7916, https://doi.org/10.5194/egusphere-egu24-7916, 2024.

EGU24-7992 | ECS | Orals | SSS9.17

Spatial determination of ETo supported by weather forecasts and artificial intelligence. 

Juan Manuel Carricondo-Anton, Alberto Garcia-Prats, Hector Macian-Sorribes, Dariana Isamel Avila-Velasquez, Miguel Angel Jimenez-Bello, Esther Lopez-Perez, Juan Manzano-Juarez, and Manuel Pulido-Velazquez

The amount of open data offered by different numerical weather prediction (NWP) systems is growing due to the increase in the capacity of computing systems. This rise has enabled the development of improved and user-tailored forecasting services and products. However, one key variable in agricultural systems not usually provided by the forecasting services is the reference crop evapotranspiration (ETo), which requires ad-hoc computation and proper identification of the factors that condition it.


This work develops a spatially-distributed ETo forecast in the Jucar river basin (Eastern Spain), to support crop management in agricultural plots. ETo was determined from forecasted meteorological variables using the Penman-Monteith methodology described in FAO56. Specific ETo value maps at the AP scale were generated considering the spatial variation of the meteorological parameters that drive ETo: daily average, maximum, minimum and dewpoint temperatures, net solar radiation and wind speed at 2 meters. Calculations were downscaled using an interpolation technique based on linear regression from daily weather predictions of temperatures and wind. The procedure was tested using forecasts from the Global Forecast System (GFS) of the National Centers for Environmental Prediction (NCEP) belonging to the U.S. National Oceanic and Atmospheric Administration (NOAA), for the year 2022. Raw GFS forecasts were post-processed against the ERA5 reanalysis data, available through the Copernicus Climate Change Service (CS3), with a spatial resolution of 0.25o; and against observed data from the meteorological stations of the Agroclimatic Information System for Irrigation (SIAR) of Spain. In both cases, post-processing was done using artificial intelligence (AI), in particular Fuzzy Logic. Inputs for interpolation were the geographical characteristics at each GFS location within the Jucar river basin: longitude, latitude, distance to the Mediterranean Sea, mean solar radiation, mean solar radiation at a distance of 2.5, 5 and 25km from each GFS location, elevation, elevation at a distance of 2.5, 5 and 10km from each GFS location, slope, and orientation with respect to the north. Solar radiation is obtained using the Area Solar Radiation module of ArcGIS.


Once the forecasts and solar radiation maps were generated, the difference between the interpolated and the predicted values was calculated. This difference generated a cloud of points which, which together with a Digital Elevation Model, allowed for surface interpolation (SI) using the Splines with the Tension methodology integrated in Grass (QGIS). These SI are subtracted from the forecast’s maps obtained by interpolation, already having corrected forecasts with which the ETo is determined using the Penman-Monteith methodology described in the FAO56. The difference between the interpolated ETo and the predicted ETo is also calculated by subtracting this SI from the obtained ETo, generating a corrected ETo. Furthermore, post-processed forecasts and ETo was compared with 41 meteorological stations and evaluated using the Mean Absolute Error (MAE).


Acknowledgements:

This study has received funding from the European Union’s Horizon Europe research and innovation programme under the SOS-WATER project (GA no. 101059264); and from the subvencions del Programa per a la promoció de la investigación científica, el desenvolupament tecnològic i la innovació a la Comunitat Valenciana (PROMETEO) under the WATER4CAST project.

How to cite: Carricondo-Anton, J. M., Garcia-Prats, A., Macian-Sorribes, H., Avila-Velasquez, D. I., Jimenez-Bello, M. A., Lopez-Perez, E., Manzano-Juarez, J., and Pulido-Velazquez, M.: Spatial determination of ETo supported by weather forecasts and artificial intelligence., EGU General Assembly 2024, Vienna, Austria, 14–19 Apr 2024, EGU24-7992, https://doi.org/10.5194/egusphere-egu24-7992, 2024.

EGU24-8048 | ECS | Orals | SSS9.17

Water footprint and water productivity analysis of an alternative organic mulching technology for irrigated agriculture 

Niccolò Renzi, Tommaso Pacetti, Marco Lompi, Giulio Castelli, Enrica Caporali, Andrea Setti, and Elena Bresci

Agriculture is causing unprecedented pressure on water resources to meet a growing food demand. This determines the necessity of implementing innovative, sustainable, and measurable systems to improve water use efficiency while increasing crop yield. This study tested the use of biodegradable mulching (BM) film for irrigated lettuce and the FAO AquaCrop model was used to simulate a precision irrigation scheme. The trials were conducted in the middle Arno River Valley, Tuscany, in Farm 1 (F1) and Farm 2 (F2) during the cropping seasons 2021 and 2022. In 2021 the BM film was tested in late spring at F1 and mid-summer at F2. In 2022, BM was tested twice at F2, in July and September, and once at F1, in June. The AquaCrop model was used only for the F2 mid-summer lettuce trial. Water Productivity (WPi) and ISO 14046 Water Footprint (WF) were measured, and a correlation analysis was performed. The study's outcome reported larger lettuce plants in the F2 BM July trial (0.806 kg plant-1) and smaller ones in F1 trial (0.100 kg plant-1), where the plant density was higher. The amount of irrigation water required was reduced in all the BM trials, ranging between 8%-50%, with the best performance in the F2 BM September trial where the amount was halved. In general, WF was always reduced in the BM trials and the best performance was with the F2 BM July trial (0.13 m3kg-1). Moreover, F2 indirect WF for the BM film production has a major share of impact on water resources ranging from 0.07 m3kg-1 to 0.17 m3kg-1. The best WP was also reached by F2 BM September trial (40.8 kg m-3). The Pearson coefficient (r) reported a strong negative correlation between WF and WP (-.73, p = .01), while, the determination coefficient ( R2) was 0.545. Hence, is confirmed how the reduction of WF is followed by the rise of WP. However, the low R2 shows how the two indicators are not specular but arrays of different useful information. Finally, AquaCrop simulation measured a fall in irrigation requirement (-86%, - 95%) in both treatments, reflecting an overestimation of the farmer irrigation scheme. The results confirmed the positive effect of BM and how using the WF can help farmers track their hotspots on water resources. The production of the BM films presented has a significant impact on water resources due to limited reuse over multiple crop cycles. Longer lasting films should be tested to investigate the reduction of indirect WF.

This study was carried out within the FEASAR-PSR 2014/2020 GO PEI PSGO 40/2017 ORTI BLU fund and the Agritech National Research Center and received funding from the European Union Next-Generation EU (PIANO NAZIONALE DI RIPRESA E RESILIENZA (PNRR) – MISSIONE 4 COMPONENTE 2, INVESTIMENTO 1.4 – D.D.1032 17/06/2022, CN00000022). This manuscript reflects only the authors’ views and opinions, neither the European Union nor the European Commission can be considered responsible for them.

How to cite: Renzi, N., Pacetti, T., Lompi, M., Castelli, G., Caporali, E., Setti, A., and Bresci, E.: Water footprint and water productivity analysis of an alternative organic mulching technology for irrigated agriculture, EGU General Assembly 2024, Vienna, Austria, 14–19 Apr 2024, EGU24-8048, https://doi.org/10.5194/egusphere-egu24-8048, 2024.

EGU24-8407 | ECS | Orals | SSS9.17

Hydrological parameters modelling in catchments based on a geographical database. 

Andrés Felipe Almeida-Ñauñay, Ernesto Sanz, Ana María Tarquis, Juan José Martín-Sotoca, and Sergio Zubelzu

The water systems management plays a pivotal role in environmental conservation and disaster mitigation. As climate change intensifies, the ecological interactions of our ecosystems are modified, decreasing biodiversity and increasing extreme events. Therefore, accurate hydrological modelling tools are crucial for predicting rainfall-runoff processes. Hydrological processes, in general, are complex due to the interaction between multiple variables and spatial and time scales. Therefore, the development of hydrological models has evolved from simple models with few parameters to complex models aiming to model all notable processes within the study area. However, some researchers affirm that increasing the number of free parameters does not necessarily improve the model performance, and retaining only necessary data can ensure that the model’s components are positively represented. In this work, we show a set of geographical information system-based methodologies to set a limited optimal number of parameters to improve the hydrological modelisation.

To achieve our purpose, we collected terrain information, land use and soil properties data to model the water balance based on historical precipitation and gauging data. The same model was replicated in 47 small watersheds north of the Iberian Peninsula to ensure reliability. The rainfall and water flow data were downloaded from the automatic hydrology information system of the Ebro Water Confederation (SAIHEbro). We obtained a 15-minute rainfall and water flow time series, and each of them started at different years, continuing to current times up to a length of 27 years (more than 35,000 records per year).

As a result, we developed a database including the watershed limits, the most extended stream segment, rainfall and flow for each catchment. Furthermore, elevation, land use, soil classes, bulk density, clay, sand, and silt content (Hengl et al., 2017) at different depths were obtained. All data were transformed to a raster format to homogenise, and then their spatial resolution was harmonised to 2m for all spatial layers. The main shortcomings were found in matching the different spatial scales available in all the studied datasets. The lack of data or gaps in 2m DEM needed to be filled. Therefore, a nearest neighbour interpolation method combined with patching technique was performed by SAGA software and using 5m DEM as an input. Furthermore, differences in land use characterisation among regional and national datasets arose in some of the study catchments.

By processing these datasets, we obtained essential parameters for hydrological modelling. Altogether, the gathered information was useful to simulate the evolution of the water-related processes, paying particular attention to the relationships between precipitation, soil water content and land use.

Acknowledgements: The authors acknowledge the support of the Project “Fusión de modelos de base física y basados en datos para la modelización de fenómenos precipitación-flujo HYDER”, from Universidad Politécnica de Madrid (project number: TED2021-131520B-C21).

References

Hengl, T., De Jesus, J.M., Heuvelink, G.B.M., Gonzalez, M.R., Kilibarda, M., Blagotić, A., Shangguan, W., Wright, M.N., Geng, X., Bauer-Marschallinger, B., Guevara, M.A., Vargas, R., MacMillan, R.A., Batjes, N.H., Leenaars, J.G.B., Ribeiro, E., Wheeler, I., Mantel, S., Kempen, B., 2017. SoilGrids250m: Global gridded soil information based on machine learning, PLoS ONE. https://doi.org/10.1371/journal.pone.0169748

How to cite: Almeida-Ñauñay, A. F., Sanz, E., Tarquis, A. M., Martín-Sotoca, J. J., and Zubelzu, S.: Hydrological parameters modelling in catchments based on a geographical database., EGU General Assembly 2024, Vienna, Austria, 14–19 Apr 2024, EGU24-8407, https://doi.org/10.5194/egusphere-egu24-8407, 2024.

EGU24-8757 | Posters on site | SSS9.17

A set of indicators to guide a WEFE transition in irrigated agriculture in the Duero Basin, Spain 

Leonor Rodriguez-Sinobas, Xenia Schneider, Maite Sanchez-Revuelta, Tommaso Pacetti, Mohammad Merheb, and Daniel A. Segovia-Cardozo

The Duero basin is the largest watershed in the Iberian Peninsula, with a surface of 98.073 km2 distributed in Spain and Portugal. The 80% of the surface area is in Spain (78.891 km2), where plays an important role for the country’s energy and food production. However, in the region, droughts are frequent and have increased in the last years stressing water resources and creating competition and friction among water users. Likewise, the energy demand for irrigation has also increased as along with energy and fertilizer prices. The uncertainty on future water resources is critical and it must be managed. Within this context, this paper will show the analysis of the current situation from a Water, Energy, Food and Ecosystems (WEFE) perspective and how it has developed several WEFE indicators and their inter-relations. The results may be used to analyze the effect of future scenarios, which foresee a decrease between 8 to 10% in water availability in the basin by 2039; it is also foreseen an increment in the prices of energy, fertilizers and production inputs. These indicators and their illustrations will help the stakeholders in their decision making and a WEFE-Nexus transition actions to overcome challenges in a resilient and sustainable way.

The work has identified and quantified a set of 12 indicators for the present conditions at two different spatial scales: two Duero sub-basins (Cega-Eresma-Adaja, and Bajo Duero) and three irrigation districts (Río-Adaja, Villalar de los Comuneros and “El Carracillo), each one has different source of water (surface, subsurface and mix). Three indicators for water, two for energy, two for food production and five for ecosystems were proposed and quantified by using information obtained by modelling and literature review. The results were compared both at different scales and in different situations.

How to cite: Rodriguez-Sinobas, L., Schneider, X., Sanchez-Revuelta, M., Pacetti, T., Merheb, M., and Segovia-Cardozo, D. A.: A set of indicators to guide a WEFE transition in irrigated agriculture in the Duero Basin, Spain, EGU General Assembly 2024, Vienna, Austria, 14–19 Apr 2024, EGU24-8757, https://doi.org/10.5194/egusphere-egu24-8757, 2024.

EGU24-10461 | ECS | Posters virtual | SSS9.17

Physiological, yield and nut quality responses of walnut tree subjected to different irrigation regimes following IRRIFRAME water balance model 

Giulio Demetrio Perulli, Salvatore Luca Gentile, Domenico Solimando, Stefano Anconelli, Elena Baldi, Moreno Toselli, Alexandra Boini, and Luigi Manfrini

In the last years commercial walnut orchards plantation is increasing in Emilia-Romagna, an Italian region renowned for its excellence in fruits cultivation. Despite the expansion of walnut plantations in this region, there is scarcity of studies focusing on the water demand of this crop. This research aims to assess the response of an adult walnut orchard (cv. 'Chandler') to three distinct irrigation treatments (100% ETc, 75% ETc, and 50% ETc). Water supply was managed according to the IRRIFRAME water balance model. Plant water status (stem water potential, SWP), leaf gas exchanges (leaf photosynthesis, A; stomatal conductance, gs), yield, nut quality (e.g., nut weight, shelled yield, kernel colour) and water use efficiency (WUE) were measured for four consecutive seasons (2018-2021). Differences in plant water status were detected only in half of the performed measurements and trees irrigated at 100% ETc generally showed more positive SWP values compared to 75% and 50% ETc trees. Gs and A were less sensitive than SWP to the different water regimes, showing limited differences among treatments only in the first two years. Yield and main nut quality parameters were slightly affected by irrigation treatments mainly in 2018 and 2019, with the 50% ETc showing a reduced productivity compared to 100% and 75% ETc. No differences where registered for shelled yield and kernel colour for all the four consecutive years. On the contrary, irrigation treatments highly affected WUE in all the considered years, with 100% ETc being the less efficient treatment, followed by 75% and 50% ETc.

How to cite: Perulli, G. D., Gentile, S. L., Solimando, D., Anconelli, S., Baldi, E., Toselli, M., Boini, A., and Manfrini, L.: Physiological, yield and nut quality responses of walnut tree subjected to different irrigation regimes following IRRIFRAME water balance model, EGU General Assembly 2024, Vienna, Austria, 14–19 Apr 2024, EGU24-10461, https://doi.org/10.5194/egusphere-egu24-10461, 2024.

EGU24-10468 | ECS | Posters virtual | SSS9.17

Actinidia chinensis: physiological and productive performances under different irrigation restitutions 

Alexandra Boini, Gianmarco Bortolotti, Giulio Demetrio Perulli, Luca Corelli Grappadelli, and Luigi Manfrini

Yellow flesh kiwi fruit production normally follows protocols based on the green species, A. deliciosa, often resulting in low yields, attributable to small sized fruit, meaning A. chinensis seems more susceptible to water limitations. Understanding the species physiology and fruit vascular flows may help determine this crop’s evapotranspiration needs, to efficiently obtain satisfactory harvests. The presented work results from a 3-year trial (2019-2020-2021), where control irrigation vines were compared with deficit-irrigated and over-irrigated vines. Midday physiology, including plant water relations, leaf gas exchanges and fruit vascular flows were analysed, along with harvest parameters and dry matter content. Irrigation treatments influenced the vines’ responses only when soil water content was below certain levels, reflecting sensitivity of the crop to water changes in the soil. Although no significant differences were found in harvest parameters, dry matter content was higher for the less irrigated fruit. The less irrigated treatment performed less better, than the control and the over-irrigated, especially when water supply did not fulfil fruit transpiration. This occurred during the berry development phase (around 1 month after full bloom), a critical period during which the fruit has very high transpiration rates, which passively call photosynthates (phloem inflow) to provide energy for cell division. Fruit transpiration appears to influence phloem inflow during most of the season, even until 1 month before harvest, however the initial phases of fruit development and growth are pivotal for final yield. Vascular flows allowed to unveil a typical simplasmic behaviour in the early stages of berry development, meaning the microenvironment is intensely influencing fruit behaviour. Irrigation must respond to the needs of young fruit, taking into account soil water content and the phenological phase. The use of sensors, plant based and environmental, is an important technique for determining the necessary water volumes for yellow kiwi fruit.

How to cite: Boini, A., Bortolotti, G., Perulli, G. D., Corelli Grappadelli, L., and Manfrini, L.: Actinidia chinensis: physiological and productive performances under different irrigation restitutions, EGU General Assembly 2024, Vienna, Austria, 14–19 Apr 2024, EGU24-10468, https://doi.org/10.5194/egusphere-egu24-10468, 2024.

Due to climate change, managing irrigation systems requires adapting existing scheduling strategies based on monitoring meteorological, biophysical, and soil physical variables. For monitoring, there are many combinations of sensors, starting from low-cost IoT-based systems and ranging to scientific high-precision devices that offer a specific quality of measurements at a particular price. By explicitly modeling the value gained by more precise monitoring, the value of information (VOI) theory can determine whether additional information provided by site-specific monitoring setups is worth employing to manage the considered irrigation systems. Different levels of information about meteorological conditions are provided by (i) on-site systems (energy balance station, low-cost climate station, and a spatial grid of low-cost LoRaWAN temperature and humidity sensor), (ii) available public weather data, e.g., from a close climate station of the German weather service (DWD), and (iii) latest reanalysis data from the ERA5-Land product. To estimate the additional VOI of the different site-specific monitoring setups related to the reference defined by the DWD data, evapotranspiration, biomass, and yield data simulated by the Aquacrop model are compared. In addition, adapted scheduling strategies are derived using the Deficit Irrigation Toolbox (DIT).   This contribution presents the application of VOI theory for decision-making in the monitoring design of an irrigated apple farm in Werder (Germany) in 2023 and 2024.

How to cite: Schuetze, N., Kuhnert, L., and Lennartz, F.: Assessing the value of information: a comparative analysis of meteorological observation setups in an irrigated German apple orchard, EGU General Assembly 2024, Vienna, Austria, 14–19 Apr 2024, EGU24-11134, https://doi.org/10.5194/egusphere-egu24-11134, 2024.

EGU24-11989 | Orals | SSS9.17

Analysis of the use of actual evapotranspiration calculated with Landsat imagery and climate forecasts, assessed with an agrohydrologic model for irrigation scheduling in fruit crops 

Miguel Angel Jiménez Bello, Juan Manuel Carricondo-Antón, Alberto García-Prats, Esther López-Pérez, Juan Manzano-Juarez, Manuel Pulido-Velazquez, and Fernando Martínez-Alzamora

The evapotranspiration of vegetation (ET) is a key component of the hydrological balance. Various tools and models have been proposed to estimate evapotranspiration in fruit crops. Among them, the most widely used approach is that proposed by the Food and Agriculture Organization (FAO), which considers climatic variables included in reference evapotranspiration (ETo), as well as the type of crop and its characteristics represented by a single crop coefficient (Kc). However, there is evidence that in tall and discontinuous canopies, such as citrus orchards, with a high degree of interaction with the environment, Kc can change depending on local environmental conditions and the amount of vegetation.

Other methods, such as measurements of stem water potential, sap flow sensors, and moisture probes, allow for determining the water status of the crop, but only for a limited number of trees, and uncertainties arise when extrapolating values. Remote sensing fills this gap if spatial and temporal resolutions suit the monitored crop. A successful approach in water management is using models that calculate latent heat as a residue of the surface energy balance (SEB).

This study applied an energy balance to calculate ET in an irrigation district. The study site is located in the Valencia region (Spain; 39º22'43'' N, 0º28'20'' W) with localized irrigation, where most crops are citrus. A total of 182 images from the Landsat satellite constellation for the period 2013-2018 were used to estimate instantaneous ET by extrapolating daily actual ET (ETSEBAL) values using climatic data.

These climatic data correspond to predictions the Global Forecast System (GFS) provides. This way, climatic predictions are used for scheduling instead of the classical methodology that uses past data to estimate evapotranspiration. The study's objective is to analyze the results using a dynamic Kc obtained from the actual state of the crops and climatic predictions for each plot, compared to a generic Kc obtained for standard conditions and past climatic data.

The results suggest that, for the studied plots, the relationship between drained water and the actual volume provided by irrigators would be reduced by 20% to -30 %. A point agrohydrological model calibrated with capacitive moisture probes was used to monitor soil water balance.

In the same way, the methodology allows for determining the stress level of crops and maintaining it within recommended limits.

How to cite: Jiménez Bello, M. A., Carricondo-Antón, J. M., García-Prats, A., López-Pérez, E., Manzano-Juarez, J., Pulido-Velazquez, M., and Martínez-Alzamora, F.: Analysis of the use of actual evapotranspiration calculated with Landsat imagery and climate forecasts, assessed with an agrohydrologic model for irrigation scheduling in fruit crops, EGU General Assembly 2024, Vienna, Austria, 14–19 Apr 2024, EGU24-11989, https://doi.org/10.5194/egusphere-egu24-11989, 2024.

EGU24-12251 | Posters on site | SSS9.17

Exploratory modeling of saline irrigation of olive trees using artificially built contrasting soil barriers 

Gonzalo Martinez, José Manuel Martínez-García, Juan Vicente Giráldez, Ana M Laguna, and Tiago Ramos

Salt accumulation in soils is a major threat to the sustainability of irrigated land. However, the availability of fresh water for irrigation is decreasing sharply and alternative sources of water, e.g. saline waters, become more and more necessary to satisfy water requirements of crops, and more specifically of olive trees in southern Spain. Recent advances on the impact of precipitated salts on evaporation processes in porous media opened the venue to further research on the potential of artificially built contrasting soil barriers (CSB) to manage saline irrigation. In this work, the HYDRUS-2D model was used to evaluate different configurations and designs of soil textural barriers in terms of soil properties, distance to the tree trunk, width, and depth of the barrier. The model used weather data and saline irrigation applications as the top boundary condition and the dynamics of soil water potential and salt concentration at several depths (0.30, 0.60, 0.90 and 1.20 m) were evaluated. Global sensitivity analysis using the Morris method was conducted to evaluate the relevance of each of the different variables considered for the CSB design. The simulations showed a relevant effect of the CSB in changing the precipitation/dilution of salts in soil compared to its absence. Less concentration of salts was found in the root zone in the CSB simulations that in simulations without CSB in all the scenarios under study. However, higher accumulations of salts were found in the soil surface when including the CSB. The different configurations of native soil vs soil within the CSB provided different optimum configurations of the CSB depending on soil textural classes combinations. Based on the outcomes of this modeling exercise, a site-specific design depending on the soil texture can be performed and the optimum soil textural barrier chosen to optimize the potential of the system to keep the largest dilution of salts within the root zone and the highest accumulation of salts in the CSB.

How to cite: Martinez, G., Martínez-García, J. M., Giráldez, J. V., Laguna, A. M., and Ramos, T.: Exploratory modeling of saline irrigation of olive trees using artificially built contrasting soil barriers, EGU General Assembly 2024, Vienna, Austria, 14–19 Apr 2024, EGU24-12251, https://doi.org/10.5194/egusphere-egu24-12251, 2024.

EGU24-12450 | Posters virtual | SSS9.17

A novel insight into spatio-temporal variability of storm events for modelling hydrological processes at catchment scale based on machine learning 

Sergio Zubelzu, Blanca Cuevas, Ernesto Sanz, Andrés Almeida, and Ana Tarquis

Hydrological processes are shaped by complex and distant processes characterised by high spatio-temporal variability. Being the first hydrological process, triggering the remaining ones, precipitation, or more precisely, storm events, have paramount importance on the subsequent evolution of the hydrological system. The spatio-temporal evolution of precipitation has received profound attention from scientists. This topic is commonly addressed in practical hydrological simulation by simple (pseudo) deterministic algorithms as form example Polygons of Thiessen or Krigging methods. In this work we present a novel approach based on two pillars: first by focusing on storm events instead of in aggregated precipitation values and second by spatially analysing the relationships among the recorded values aided by machine learning algorithms. With that aim we have retrieved precipitation records from 6 weather stations in Madrid city with hourly latency from January 2019 and 587 stations with 15 minutes latency from January 2004. We have extracted the observed storm events in any case and analysed the spatio-temporal patterns underlying the storm evolution thus observing the scarce representativity of the traditional methods being machine learning approaches better suited for providing representative data. 

This work is part of the project TED2021-131520B-C21, supported by the MCIN/AEI/10.13039/501100011033 and the European U nion “NextGenerationEU”/PRTR.

How to cite: Zubelzu, S., Cuevas, B., Sanz, E., Almeida, A., and Tarquis, A.: A novel insight into spatio-temporal variability of storm events for modelling hydrological processes at catchment scale based on machine learning, EGU General Assembly 2024, Vienna, Austria, 14–19 Apr 2024, EGU24-12450, https://doi.org/10.5194/egusphere-egu24-12450, 2024.

Optimizing water use efficiency and crop yield are important objectives of irrigated agriculture. For planning near future irrigation, farmers can rely on weather forecasts, which cover a time horizon of up to two weeks. This information is then used to make decisions about agricultural activities, including irrigation. However, a gap exists between weather forecasting and climate prediction, which poses challenges for decision-making in the medium-term crop season. The sub-seasonal to seasonal (S2S) range, spanning from two weeks to one season, bridges this gap. In this study we investigate if S2S forecasts combined with an agro-hydrological model can extend the time horizon of farmers’ decision decision-making compared to a traditional week-to-week schedule.

A case study was conducted for the Northern German Hamerstorf experimental field, which is operated by the Chamber of Agriculture of Lower Saxony to provide weekly consulting and decision support services for regional farmers in the fields of fertilisation and irrigation. Irrigation is triggered at 35% and 50% of available water capacity and the annual crop yield for these irrigation scenarios is evaluated. In this research a SWAP (soil-water-atmosphere-plant) model was calibrated and validated using observed field data from the experiments. The calibrated model was then coupled with the reforecast S2S ensemble dataset. To evaluate the performance of the S2S/agro-hydrological model, we used the ECMWF (European Centre for Medium-Range Weather Forecasts) S2S ensemble and simulated the future irrigation water demand for the next two, four and six weeks. Simulated crop yield, irrigation water demand and the results of auto-scheduling irrigation over the recent five irrigation seasons (2018-2022) were evaluated and compared with a reanalysis using observed climate and with the experimental field practise.

First results confirm that uncertainty increases with the lead time of the forecast, but a major aspect for irrigation planning is the start and end of dry periods. There, uncertainty is less compared to the uncertainty of future rain, which recommends further exploration of the value of S2S forecasts in agricultural decision support.

How to cite: Fallah-Mehdipour, E. and Dietrich, J.: Evaluating irrigation demand forecasts from S2S/agro-hydrological modelling with field experiments in Northern Germany in the context of farmer decision support, EGU General Assembly 2024, Vienna, Austria, 14–19 Apr 2024, EGU24-12705, https://doi.org/10.5194/egusphere-egu24-12705, 2024.

EGU24-13375 | Posters on site | SSS9.17

Integrating remote sensing and climate data for olive grove classification and yield estimation 

Rosa Gutiérrez-Cabrera, Ana María Tarquis, and Javier Borondo

Keywords: Irrigated agriculture, NDVI, Sentinel-2, Dynamic Time Warping, Machine learning

The agricultural sector confronts escalating challenges amid uncertainties associated with water resources, underscoring the imperative for innovative solutions. Hence, a profound comprehension of the production dynamics of forthcoming productions becomes paramount for effective water management and the optimization of irrigation strategies, leveraging algorithms such as Dynamic Time Warping (DTW).

This study delves into forward-thinking methodologies encompassing delineation in both rainfed and irrigated olive groves, furnishing a comprehensive panorama of the cultivation landscape. Utilizing information derived from satellite images, particularly the Normalised Difference Vegetation Index (NDVI), enables the comparison between olive groves dedicated to either irrigated or rainfed production. This comparison helps quantify and comprehend the impact of irrigation on olive groves, correlating it with climatic factors such as rainfall and temperature. Essentially, it could aid in identifying optimal conditions for irrigation and when it may not be necessary.

Simultaneously, it facilitates accurate estimation of olive yields based on the prevailing water conditions. Harnessing vegetation indices such as NDVI from remote sensing allows us to forecast how diverse olive groves react to varying climatic conditions. This monitoring facilitates proactive irrigation to avert water stress affecting production levels deeply.

Moreover, this comparison, anchored in NDVI, lays the groundwork for subsequent analyses incorporating soil and other climate data. Therefore, it enhances the precision of irrigation decisions, contributing to preparedness for droughts and formulating well-informed policies.

In conclusion, this study pushes the boundaries of intelligent irrigation management in olive cultivation, fostering sustainability, cost-effective technology, and optimal resource utilization. The technical insights presented herein constitute a comprehensive resource for any stakeholder seeking solutions in agriculture.

How to cite: Gutiérrez-Cabrera, R., Tarquis, A. M., and Borondo, J.: Integrating remote sensing and climate data for olive grove classification and yield estimation, EGU General Assembly 2024, Vienna, Austria, 14–19 Apr 2024, EGU24-13375, https://doi.org/10.5194/egusphere-egu24-13375, 2024.

Irrigation is the most significant human water withdrawal globally, playing a pivotal role in ensuring food security. However, the lack of detail irrigation datasets across spatial and temporal dimensions limits our comprehensive understanding of how historical irrigation water supply has responded to demand fluctuations and, consequently, its effect on agricultural yields. In this study, we employed a combination of remote sensing products, meteorological data, and various statistical datasets to estimate gridded monthly irrigation water demand and supply in China at a spatial resolution of 0.1° during the period 2000-2019. The results indicate that the national annual irrigation water demand is 122.23 km3, with rice accounting for the highest share (39.25%), followed by wheat (36%) and maize (24.75%). While the annual irrigation water supply is measured at 317.42 km3, with rice (62%) dominating, trailed by maize (21.13%), and wheat (16.87%) contributing the least. The mismatch in the distribution of irrigation water supply and demand among crops underscores variations in irrigation systems and the availability of water sources for irrigation. Notably, in the downstream of the Yellow River Basin and the Huaihe River Basin, the irrigation water supply falls short of demand when not accounting for irrigation efficiency, primarily attributed to a scarcity of water during the wheat growing season in spring (Mar. to May), indicating a potential water stress on wheat yield in this region. This study enhances our understanding of the intricate relationship between irrigation water supply and demand in China, offering valuable insights to support regional water resources management and allocation strategies.

How to cite: Hou, C.: Response of irrigation water supply to demand in China and its effects on yields, EGU General Assembly 2024, Vienna, Austria, 14–19 Apr 2024, EGU24-13904, https://doi.org/10.5194/egusphere-egu24-13904, 2024.

EGU24-14767 * | Posters on site | SSS9.17 | Highlight

Current and future blue water availability for agriculture in the Mediterranean 

Sandra Paola Bianucci, Álvaro Sordo-Ward, and Luis Garrote

The current and future water availability for Mediterranean basins was assessed under different climate and policy scenarios. The high-resolution GIS-based WAPA model (Water Availability and Adaptation Policy Analysis) was used to obtain potential water availability under a set of realistic hypotheses. Diverse data sets were compiled on meteorological variables, water resources, runoff, land cover, and population density to create a geospatial database that covers river basins that drain into the Mediterranean Sea. The model was forced with the results of the global hydrological models H08 and CWatM for ISIMIP (Inter-Sectoral Impact Model Intercomparison Project) scenarios. These two hydrological models were forced with climate drivers for three historical scenarios (obsclim, picontrol, and historical), which define a baseline, and three future scenarios (ssp126, ssp370 and ssp585) provided by the sixth assessment report of IPCC (2023). A high-resolution map of the potential availability of water for irrigation was developed in Mediterranean basins. The allocation of water for irrigation is subordinated to the urban supply (drinking water) and for the conservation of river ecosystems. The results indicate that changes in hydrological regimes across the region are expected to have a significant impact on future water availability. The proposed approach provides a valuable tool for decision makers and stakeholders for the identification of areas vulnerable to changes in water availability. The information generated in this study, high-resolution spatial outputs and detailed water availability estimates, could work as a relevant input for integrated water resource management and climate change adaptation planning. This research offers a robust framework for assessing water resources under changing climate, applicable to other regions facing similar challenges. In summary, our study provides useful information to policymakers and stakeholders, helping them to make informed decisions to develop adaptive measures for sustainable water management under uncertain future climate conditions.

How to cite: Bianucci, S. P., Sordo-Ward, Á., and Garrote, L.: Current and future blue water availability for agriculture in the Mediterranean, EGU General Assembly 2024, Vienna, Austria, 14–19 Apr 2024, EGU24-14767, https://doi.org/10.5194/egusphere-egu24-14767, 2024.

EGU24-15892 | ECS | Posters on site | SSS9.17

Identifying opportunities and challenges of digitalization in agricultural water management in Austria 

Maximilian Thier, Christian Faller, Heike Brielmann, Helga Lindinger, Christine Stumpp, and Reinhard Nolz

Due to climatic changes and a predicted decline in arable land, a significant increase in water demand for irrigation is expected in Austria. To ensure water supply and food security while promoting the responsible use of available water resources, reliable data and forecasts are essential for decision-making in all areas of water management. Agricultural water management and irrigation practices require up-to-date data and reliable forecasts of water demand and availability for the planning and operation of irrigation systems. Decision-makers need the same information for water management planning, such as the assessment of the regional water availability, as a basis for the approval of irrigation projects. In Austria, a lot of data is collected regularly and is available in analogue or digital form. Digitalization offers the opportunity to collect, link, process and make this data available. As part of a study, funded by the Federal Ministry of Agriculture, Forestry, Regions and Water Management, digital data sources and digital tools relevant to irrigation in Austria were therefore collected, systematically compiled, and evaluated. The basis for the identification and selection was a comprehensive online and literature search. The systematic processing, compilation and evaluation constituted an iterative process in which representatives of the relevant stakeholder groups - water managers, farmers, and researchers - were involved through personal discussions and surveys to gain knowledge about awareness and use of digital tools. Deficits and potentials in connection with the digitalization of irrigation were also identified and discussed, and recommendations relevant to water management were derived. More than 70 digital tools and databases were identified and grouped according to their main characteristics, e.g. hydrology, climate, or soil, as well as according to subject areas based on the interests of the stakeholders. On this basis, information sheets were created to present the objectives that can be achieved with the application, such as promoting productivity or preventing the loss of irrigation water due to deep percolation. The results of this study provide information for a broad audience and identify knowledge and data gaps for future planning and research activities. However, to fully exploit the potential of digitalization in irrigation, efforts need to be made, for instance, to bridge the gap between digital technologies and the desired objectives, to promote inter-institutional cooperation and to improve both the quality and quantity of available data.

How to cite: Thier, M., Faller, C., Brielmann, H., Lindinger, H., Stumpp, C., and Nolz, R.: Identifying opportunities and challenges of digitalization in agricultural water management in Austria, EGU General Assembly 2024, Vienna, Austria, 14–19 Apr 2024, EGU24-15892, https://doi.org/10.5194/egusphere-egu24-15892, 2024.

EGU24-16358 | Orals | SSS9.17

Precision soil moisture monitoring: use of a multi-sensor profiling for optimizing yield and fruit quality of yellow fleshed kiwifruit in northern Italy 

Elena Baldi, Maurizio Quartieri, Matteo Golfarelli, Matteo Francia, Josef Giovanelli, Marco Mastroleo, Evalgelos Xilogiannis, and Moreno Toselli

The control of soil moisture is fundamental for optimizing water supply, plant performances and fruit quality. Traditional monitoring systems rely on a single sensor, or several sensors positioned along the soil profile not giving reliable information on soil water availability in the soil volume occupied by roots. In a 3-years field experiment we tested the effectiveness of PLUTO, an original approach able to define soil moisture profiles thanks to a bi- and tri-dimensional grid of sensors. The study was carried out, from 2021 to 2023, in northern Italy, on kiwifruit Zezy002 (A. chinensis var. chinensis) grafted, in 2012, onto micro-propagated Hayward (A. chinensis var. deliciosa) planted at a distance of 4.5 m x 2 m apart. During the experiment a traditional irrigation system (CONTROL) was compared to smart irrigation (PLUTO). Water management in the control treatment was carried out according to the advisory service, only based on daily evapotranspiration. On the other side, according to PLUTO water was applied taking into consideration the soil water content measured by potentiometric probes located according to the grid of sensors. Irrigation started when soil matric potential dropped below -0.1 MPa in more than 50% of the volume of soil explored by the root system and was aimed at returning the same amount of water lost the day before and estimated by evapotranspiration. During the experiment, compared to the CONTROL, PLUTO reduced the volume of water without impairing plant water status and yield. Fruit juice soluble solid concentration and fruit dry matter at harvest was increased by the smart irrigation system with a similar response also after 2 and 4 months of cold storage. PLUTO water management also induced a lower fruit firmness and yellow pulp color (defined by H angle) at harvest. In conclusion, the definition of irrigation volumes and timing according to smart irrigation system were able to reduce water consumption and increase fruit quality. Taking into consideration that the cost of sensors is progressively decreasing, PLUTO provides a cost-effective, operative, and precise solution to monitor soil water availability.

How to cite: Baldi, E., Quartieri, M., Golfarelli, M., Francia, M., Giovanelli, J., Mastroleo, M., Xilogiannis, E., and Toselli, M.: Precision soil moisture monitoring: use of a multi-sensor profiling for optimizing yield and fruit quality of yellow fleshed kiwifruit in northern Italy, EGU General Assembly 2024, Vienna, Austria, 14–19 Apr 2024, EGU24-16358, https://doi.org/10.5194/egusphere-egu24-16358, 2024.

EGU24-16726 | Orals | SSS9.17

Analyzing the resilience of complex irrigation systems: the ERASMUS approach 

Alessandro Pagano, Giacomo Ferrarese, Nicola Fontana, Ivan Portoghese, Umberto Fratino, Virginia Rosa Coletta, Nicola Lamaddalena, Stefano Mambretti, and Stefano Malavasi

Irrigated agriculture is a central socio-economic sector in many countries, particularly in the Mediterranean area, but often associated with relevant environmental issues, such as the high demand for natural resources (water, soil, energy). Irrigated agriculture is also increasingly threatened by multiple stresses, which include the rising demand for food, the lack of resources (as a consequence e.g., of climate change) and the conflicting needs and uses of those resources.

The recent scientific literature highlighted the need to support understanding and operationalizing the concept of resilience for irrigated agroecosystems, i.e. the capability of such systems to absorb stresses and adapt to changing conditions. The present work, developed within the ERASMUS project (within the PRIN 2022 call, funded by the European Union, Next Generation EU), mainly focuses on the role of water resources management in irrigated areas, yet considering a ‘Nexus’ approach that highlights the interconnections and interdependencies among resources. The aim is to identify management practices and technological measures that may support irrigated agriculture in the face of a multiplicity of environmental and anthropogenic stresses, ultimately suggesting sustainable development pathways for areas under stress. Particular attention is given to the rational use of water resources and to the role that can be played by the introduction of cutting-edge technologies and network modernization processes to increase the resilience, the long-term sustainability and the performance (in terms of distribution equality and efficiency) of pressurized irrigation systems.

Two main modelling approaches are the backbone of the ERASMUS approach. On the one hand, System Dynamics Modelling tools are used to describe the complexity of irrigated agroecosystems, the interdependencies among sectors (water, energy, land, food, climate) and to characterize their resilience. The main objective is to effectively describe (using also innovative sets of indicators) the system state and potential evolution as an effect of the different modernization strategies of networks along with different models/strategies for better managing water resources. Second, numerical modelling approaches are used to test the potential of innovative devices (mainly smart valves) and management criteria to improve the performance of irrigation networks, ultimately increasing the resilience of the system as a whole. Specific attention will be given to new technological solutions that may guarantee multiple joint benefits, ranging from a reduction of resource consumption (water, energy), while providing an increasing control and management of networks. Such an ambitious objective is being put into practice in two pilot sites located in Southern Italy (i.e., two irrigation consortia located in Puglia and Campania) where two Communities of Innovation are being developed and will support modelling activities throughout the project duration.

How to cite: Pagano, A., Ferrarese, G., Fontana, N., Portoghese, I., Fratino, U., Coletta, V. R., Lamaddalena, N., Mambretti, S., and Malavasi, S.: Analyzing the resilience of complex irrigation systems: the ERASMUS approach, EGU General Assembly 2024, Vienna, Austria, 14–19 Apr 2024, EGU24-16726, https://doi.org/10.5194/egusphere-egu24-16726, 2024.

EGU24-17294 | ECS | Orals | SSS9.17

Thermal and multispectral sensors model for determining the water status in a commercial vineyard in semiarid conditions. 

Luz Karime Atencia Payares, Juan Nowack, Ana Maria Tarquis, Mónica Garcia, and María Gómez del Campo

Spain counts roughly 941.000 hectares of vineyards, of which 41% are grown under irrigation systems. Water status is a relevant parameter in grapevines as it affects yield, fruit composition, and wine quality. Water stress reduces photosynthetic activity and vegetative growth and limits berry ripening. Mapping the crop's water status is essential for adjusting irrigation doses based on the specific water demands of different agroclimatic zones [2]. Thus, maps can be generated based on water status level ranges. Remote sensing through thermal and multispectral sensors onboard Unmanned Aerial Systems (UASs) can provide such maps with sufficient detail and rapidity. This tool allows obtaining high-resolution images that aid in assessing crop heterogeneity [3].

In a commercial vineyard located in the central region of Spain, we developed models to obtain values of stem water potential (SWP) based on canopy temperature estimated from high-resolution aerial images of a thermal sensor (Tc) [1] and multivariable linear regression models based on combinations of multispectral bands [4].

These models were developed using measurements and data from two previous irrigation seasons (2021 and 2022) on experimental vines in different plots with different management practices, irrigation, and climatic conditions. The modelled values of SWP were validated with measurements in the same vines for the 2023 season.

The application of the two developed models allows for spatial and temporal analysis of the water status of vines, aiding in the on-field characterization of water stress. This dynamic spatial mapping improves irrigation management through climatological information and high-resolution sensors.

ACKNOWLEDGEMENTS

The authors thank Bodegas y Viñas Casa del Valle for allowing us to work in their vineyards and the company UTW for supplying the drone images. Comunidad de Madrid provided financial support through calls for grants to complete Doctorado Industrial IND2020/AMB-17341, which was greatly appreciated. M.G. was supported by a "María Zambrano" contract for the Universidad Politécnica de Madrid, financed by the Spanish Ministerio de Universidades and by "European Union NextGenerationEU/PRTR".


REFERENCES

[1] Atencia, L. K., del Campo, M. V., Nowack Yruretagoyena, J. C., Tarquis Alfonso, A. M., and Hermoso Peralo, R.: Detection of plant water stress in Merlot vineyard using thermal sensors onboard UAVs , EGU General Assembly 2023, Vienna, Austria, 24–28 Apr 2023, EGU23-16111, https://doi.org/10.5194/egusphere-egu23-16111, 2023.

[2] Atencia Payares LK, Tarquis AM, Hermoso Peralo R, Cano J, Cámara J, Nowack J, Gómez del Campo M. Multispectral and Thermal Sensors Onboard UAVs for Heterogeneity in Merlot Vineyard Detection: Contribution to Zoning Maps. Remote Sensing. 2023; 15(16):4024. https://doi.org/10.3390/rs15164024.

[3] Atencia Payares LK, Tarquis AM, Hermoso Peralo R, Cano J, Cámara J, Nowack J, Gómez del Campo M. Soil vineyard variability evaluated with multispectral sensors on board of UAVs. X International Symposium on Irrigation of Horticultural Crops, Stellenbosch, South Africa, 29th January to 2nd February 2023.

[4] Nowack, J. C., Atencia, L. K., Gómez del Campo, M., and Tarquis, A. M.: Assessing plant water status in Merlot vineyards using Worldview-3 multispectral images in central Spain, EGU General Assembly 2023, Vienna, Austria, 23–28 Apr 2023, EGU23-16082, https://doi.org/10.5194/egusphere-egu23-16082, 2023.


How to cite: Atencia Payares, L. K., Nowack, J., Tarquis, A. M., Garcia, M., and Gómez del Campo, M.: Thermal and multispectral sensors model for determining the water status in a commercial vineyard in semiarid conditions., EGU General Assembly 2024, Vienna, Austria, 14–19 Apr 2024, EGU24-17294, https://doi.org/10.5194/egusphere-egu24-17294, 2024.

EGU24-17455 | Orals | SSS9.17

Monitoring Anthropogenic Irrigation Water Use by assimilating satellite land surface temperature and soil moisture 

Chiara Corbari, Nicola Paciolla, Diego Cezar Dos Santos Araujo, Kamal Labbassi, Justin Sheffield, Sven Berendsen, Ahmad Al Bitar, and Zoltan Szantoi

The agricultural sector is the biggest and least efficient water user, accounting for around 80% of total water use in Northern Africa, which is already strongly impacted by climate change with prolonged drought periods, imposing limitation to irrigation water availability. The objective of this study was to develop a procedure for the monitoring of anthropogenic irrigation water use for the irrigation districts of Doukkala in Morocco, from 2013 to 2022.

The system is based on the energy-water balance model FEST-EWB, which is an agro-hydrologic pixel wise model that computes continuously in time the main processes of the hydrological cycle where evapotranspiration and soil moisture behaviour in agricultural soil layer are modelled solving the energy and water mass balance model (EWB).

Firstly, the model has been calibrated and validated over non-irrigated areas, against satellite land surface temperature from LANDSAT and downscaled Sentinel3 data at 30m of spatial resolution, and evapotranspiration from MOD16, GLEAM and FAOWapor. The model has been run using as input the past observed meteorological forcings (ECMWF ERA5-Land) and vegetation data. From the pixel-by-pixel comparison between modelled and observed LST, a mean absolute difference of 3.5 °C is obtained over the period 2017-2022 for the whole Doukkala area.

The second step refers to the historical estimates of the actual irrigation volumes through the calibrated model implementing three different irrigation strategy, at hourly scale and at 30m of spatial resolution: the FAO approach based on soil moisture (SM) and crop stress thresholds (Allen et al., 1998), the separate and joint assimilation of satellite land surface temperature (downscaled Sentinel3 data) and of satellite soil moisture (1km SMAP-Sentinel1) to update the modeled fluxes and estimates irrigation volume. Overall, the results suggested that the yearly total irrigation volumes modeled with the FAO approach are quite in agreement with the observed water allocations; and similar outcomes are obtained when the joint assimilation of satellite LST and SM is implemented which allows to overcome the problems related to the number of available satellite images, which could lead to missing irrigation events.

How to cite: Corbari, C., Paciolla, N., Dos Santos Araujo, D. C., Labbassi, K., Sheffield, J., Berendsen, S., Al Bitar, A., and Szantoi, Z.: Monitoring Anthropogenic Irrigation Water Use by assimilating satellite land surface temperature and soil moisture, EGU General Assembly 2024, Vienna, Austria, 14–19 Apr 2024, EGU24-17455, https://doi.org/10.5194/egusphere-egu24-17455, 2024.

EGU24-18792 | ECS | Orals | SSS9.17

How can we support irrigation management in viticulture to preserve grape quality in southern Italy?: the case study of Aglianico grapevine. 

Andrea Vitale, Michela Janni, Maurizio Buonanno, Arturo Erbaggio, Rossella Albrizio, Pasquale Giorio, Veronica De Micco, Chiara Cirillo, Francesca Petracca, Matteo Giaccone, Filippo Vurro, Nadia Palermo, Manuele Bettelli, and Antonello Bonfante

The viticultural sector is one of the agricultural sectors most challenged by Climate change(CC), needing specific adaptation and mitigation actions to make local farming communities and production resilient. In this context, it is important to guarantee not only the achievement of production but also, above all, the achievement of a cultivar-specific grape quality able to support the oenological goal and, thus, the expression of terroir.

In viticulture, the plant's water stress is therefore important, representing, unlike other crops, a necessary condition for achieving the quality and typicality of the wine. This is because the vine water status represents the main regulator of the hormonal balance of grapevines, affecting berries' characteristics such as sugar, anthocyanins, flavonoid concentration, and acidity.

For this reason, under climate change, the introduction of irrigation represents a complex issue. In fact, it is not only important to guarantee water to the plants, but to maintain a specific water stress during the ripening phase of the grapes.

From this perspective, the aim of this contribution is to show the first results of a task of Spoke 3 of the National Research Center for "Agriculture Technologies - Agritech" (NextGenerationEU European program) on the identification of procedures for the optimized management of the water resource in vineyards.

The research adopts multidisciplinary approaches and methods to support irrigation optimization in the vineyard. It has been based on two main steps: (i) the identification of the functional homogeneous zones (fHZs) present in the vineyard through an environmental analysis based on the determination of the soil spatial variability, the micro-morphology of the vineyard (LIDAR) and the spatial variability of the crop response at different resolutions (UAV); (ii) use and test of field sensors to monitor plant and soil water status in the fHZs in order to define the optimal timing and volume of irrigation to achieve the desired field oenological goals while preserving the water resource.

The experiment has been realized in an Aglianico vineyard (2 ha) of Tenuta Donna Elvira winery (Montemiletto – AV), where climate, plant, and soil are monitored through the use of commercial and non-commercial sensors. In particular, two weather stations and seven monitoring nodes (soil TDR probes at three soil depths) have been distributed within the irrigated and non-irrigated long plots. The plants were monitored continuously (hourly time step) by means of a new in vivo sensor developed by IMEM CNR institute, Bioristor, (applied to 16 plants to monitor the plant status) and discontinuously (weekly or two-weekly time step) plant measurements (e.g., UAV multispectral measurements, LWP, yield production, grapes quality,..etc..).

The irrigation supply was realized through an automated irrigation system (MySOLEM) and defined according to the leaf water potential (LWP) measured in the field, maintaining its value between 1.2 and 1.4 bar during the ripening period.

At the end of the first year, the analysis of collected data to develop a vineyard water management model able to support achieving oenological goals and facing climate change has been realized.

How to cite: Vitale, A., Janni, M., Buonanno, M., Erbaggio, A., Albrizio, R., Giorio, P., De Micco, V., Cirillo, C., Petracca, F., Giaccone, M., Vurro, F., Palermo, N., Bettelli, M., and Bonfante, A.: How can we support irrigation management in viticulture to preserve grape quality in southern Italy?: the case study of Aglianico grapevine., EGU General Assembly 2024, Vienna, Austria, 14–19 Apr 2024, EGU24-18792, https://doi.org/10.5194/egusphere-egu24-18792, 2024.

EGU24-19498 | ECS | Posters virtual | SSS9.17

Development of a System Dynamics based Irrigation Demand Model 

Aurobrata Das, Bhabagrahi Sahoo, and Sudhindra Nath Panda

Water resources globally are under severe threat due to population growth, intensive socio-economic development, change in climatic condition and increasing level of conflict among multiple water users. Under this context, an accurate and efficient supply-demand management of this critical resource is highly essential to ensure the water security of a region. Agriculture being the major water user, needs to be given primary importance. However, in canal command areas, there is an inefficient management of irrigation system without considering the real-time irrigation demand while supplying the irrigation water from the reservoir. This leads to either surplus or deficit irrigation supply throughout the year affecting both the water sector and the crop yield of the command. The real-time irrigation demand of a command depends upon the type of crops grown, antecedent soil moisture content and meteorological variables along with the social attributes of the stakeholders. Hence, this current study tries to develop a dynamic irrigation demand model comprising of all the afore-mentioned variables under system thinking approach. The causal feedback among the system elements were developed initially through causal loop diagram and the model variables were subsequently transformed into stocks and flows, representing the dynamic state of the system in order to develop the conceptual model. The developed model was tested in the Hirakud canal command located in the eastern part of India simulating the real system effectively. This developed model can be used by the water managers for efficient irrigation planning in a canal command ensuring overall water and food security of the region.

How to cite: Das, A., Sahoo, B., and Panda, S. N.: Development of a System Dynamics based Irrigation Demand Model, EGU General Assembly 2024, Vienna, Austria, 14–19 Apr 2024, EGU24-19498, https://doi.org/10.5194/egusphere-egu24-19498, 2024.

EGU24-19943 | ECS | Orals | SSS9.17

Determination of soil Hydraulic Properties using infiltration models and Hydrus 1D. Application to soils in Semi-Arid Regions 

Sara E. Matendo, Raúl Sánchez, Luis Juana, and Sergio Zubelzu

Arid and semi-arid regions present significant challenges in efficient irrigation management and mitigation of soil salinity. To understand the dynamics of water and solute movement, such as salt transport in soil, software tools like HYDRUS are widely utilized. Hydrus-1D uses linear finite elements to numerically solve the Richards equation for saturated-unsaturated water flow, and has been widely applied in irrigation management to focus on solute and water movement.

This research focuses on estimating the hydraulic properties at field scale level using Kenyan soil data analyzed with soil spectroscopy and infiltration experiments. Saturated hydraulic conductivity (Ks) has been obtained by fitting data to infiltration obtained by the Green-Ampt (GA) model and Hydrus1D in three scenarios: with bounds on Ks and the product of front suction and effective porosity, assigning a uniform value to effective porosity and considering flow preferential paths. The results are compared with others pedotransfer functions (PTFs) and Hydrus-1D.

The Hydrus-1D software was used to study the water retention curve due to different Ks estimations. The findings show significant variations in the Ks estimations, highlighting the impact of salinity and preferential flows in heterogeneous soils. The comparison of the results provides valuable insights into the dynamics of water and salinity, essential for irrigation management in these regions.

This research emphasizes how crucial it is to choose and modify hydrological models for particular salinity situations and how important it is to take into account spatial variability and flow preferential paths when predicting and applying Ks through models. The results have significant implications for improving irrigation management and controlling soil salinity in semi-arid regions.


Keywords: Saturated hydraulic conductivity, Green-Ampt, HYDRUS-1D, irrigation management, soil salinity control.


"ACKNOWLEDGMENT

This article belongs to PCI2020-120694-2 Project funded by MCIN/AEI/10.13039/ 501100011033 and the European Union “NextGenerationEU”/PRTR.

We would like to thanks to One Planet Fellowship from African Women in Agricultural Research and Development (AWARD) and Agropolis Fondation for funding the analysis. “

How to cite: Matendo, S. E., Sánchez, R., Juana, L., and Zubelzu, S.: Determination of soil Hydraulic Properties using infiltration models and Hydrus 1D. Application to soils in Semi-Arid Regions, EGU General Assembly 2024, Vienna, Austria, 14–19 Apr 2024, EGU24-19943, https://doi.org/10.5194/egusphere-egu24-19943, 2024.

EGU24-22334 | ECS | Orals | SSS9.17

Improvement of irrigation water productivity through water deficit and biostimulation in pepper under greenhouse conditions 

Susana Zapata García, Abdelmalek Temnani, Pablo Berrios, Raúl D. Pérez-López, Claudia Monllor, and Alejandro Pérez-Pastor

The south-east of Spain faces a complex water scarcity scenario. Even though those regions have a high agricultural activity due to the advanced production system that has been developed. As it is important to optimize the use of water, from an economy, environmental and social point of view in these regions, it is needed to combine all available tools, including the technological and agnomical ones. Regulated deficit irrigation (RDI) techniques have been proved to be an efficient method of saving water in woody crops. Our hypothesis is that, as these RDI would cause a higher water stress in horticultural crops, that could be faced by biostimulation, as one of biostimulants claims is to improve the plant tolerance to abiotic stress, leading them to obtain a higher yield. This study aims to evaluate the effect of different strategies that combine the application of seaweed and microbials biostimulants with deficit irrigation programmes on the production parameters and soil quality in pepper (Capsicum annum sp.) under commercial greenhouse conditions.

With this aim two trials were carried out in commercial greenhouses (U & V), each one with two treatments:  i) irrigation according to Farmer criteria and ii) a combined treatment of RDI and the same biostimulation programme, that consisted of two application of Bacillus paralicheniformis after transplant via fertigation and four biweekly applications of Ascophillum nodosum extracts via fertigation and foliar spray. In each greenhouse, RDI was applied in different phenological stages,  from the onset of blooming to harvest in U trial or during the harvest in V trial.

The irrigation was reduced approximately 600 m3 ha-1, implying a 12% savings respect to the Farmer irrigation schedule. The pepper yield had not been negatively affected, increasing the water productivity when RDI is combined with biostimulation. It is worth noting that when a water stress was applied, flowering and fruit setting seems to be promoted in biostimulated treatment, leading to a higher yield that non-biostimulated. Globally, the yield improvement has been due to a higher harvest of 1st quality fruits.

This combined treatment has also improved the soil enzymatic activity in both greenhouses, suggesting that nutrients in the soil will become more available to plants when those are biostimulated.

Thus, the combined action of biostimulation under different strategies of irrigation reduction have been proved to be a useful strategy to improve agricultural sustainability, as it has increased the water productivity of the crop and the microbiological activity in the soil.

How to cite: Zapata García, S., Temnani, A., Berrios, P., Pérez-López, R. D., Monllor, C., and Pérez-Pastor, A.: Improvement of irrigation water productivity through water deficit and biostimulation in pepper under greenhouse conditions, EGU General Assembly 2024, Vienna, Austria, 14–19 Apr 2024, EGU24-22334, https://doi.org/10.5194/egusphere-egu24-22334, 2024.

EGU24-147 | Orals | GI2.3

Mechanisms of seasonal variations of dissolved 137Cs concentrations in freshwaters: Fukushima and Chernobyl 

Aleksei Konoplev, Honoka Kurosawa, Yoshifumi Wakiyama, Yasunori Igarashi, and Kenji Nanba

Analysis of available monitoring data on seasonal variations of dissolved radiocesium concentrations in the water bodies of accidentally contaminated areas has revealed two basic mechanisms responsible for regular seasonal variations of dissolved 137Cs concentrations in water bodies (increase in summer and decrease in winter), namely temperature dependence of radiocesium desorption from sediments to solution, and ion-exchange remobilization of radiocesium by cations of ammonium generated as a result of organic matter decomposition in anoxic conditions. An equation has been derived describing seasonal variations of dissolved radiocesium in water bodies considering two basic factors: water temperature and combined concentration of basic competitive cations. In Fukushima rivers, which are mostly shallow and fast-flowing, ammonium concentration is usually negligible. For them, the predominant factor of dissolved 137Cs seasonality is the temperature dependence of 137Cs desorption. For stagnated stratified waters of ponds, lakes, and dam reservoirs in anoxic conditions, the role of ammonium in 137Cs mobilization can be comparable with that of water temperature or even be prevalent. Results of a field experimental study of dissolved 137Cs seasonality in three ponds of Okuma town in the near area of the Fukushima Daiichi nuclear power plant are presented.

This research was supported by Environmental Radioactivity Research Center (ERAN) Projects I-23-11 and I-23-12.

How to cite: Konoplev, A., Kurosawa, H., Wakiyama, Y., Igarashi, Y., and Nanba, K.: Mechanisms of seasonal variations of dissolved 137Cs concentrations in freshwaters: Fukushima and Chernobyl, EGU General Assembly 2024, Vienna, Austria, 14–19 Apr 2024, EGU24-147, https://doi.org/10.5194/egusphere-egu24-147, 2024.

EGU24-1993 | ECS | Orals | GI2.3

Optimizing impoundment operation of Three Georges Reservoir for enhancing hydropower output and reducing carbon emission 

Yanlai Zhou, Zhihao Ning, Fanqi Lin, and Fi-John Chang

Reservoir impoundment operation has far-reaching effects on the synergies between hydropower output, floodwater utilization, and carbon fluxes. However, there's a notable rise in flood risks, especially when advancing impoundment timings and lifting reservoir water levels. This study proposed a novel reservoir impoundment operation framework prioritizing flood prevention, hydropower generation, floodwater management, and carbon emission control. The Three Gorges Reservoir in the Yangtze River was selected as a case study. The results demonstrated that initiating impoundment on or after September 1st could ensure flood safety. The best scheme of reservoir impoundment operation could significantly boost synergistic benefits, enhancing hydropower output by 1.39 billion kW·h (5.3%) and the water impoundment rate by 10.2% while reducing carbon emissions by 51.65 GgCO2e/yr (15.8%) and increasing organic carbon burials by 10.03 GgCO2e/yr (10.3%), respectively, compared with the standard operation policy. This study not only provides scientific and technical support for reservoir impoundment operation benefiting water-carbon nexus synergies but also presents policymakers with viable options to pre-experience the risks and benefits for sustainable hydropower through adjusted impoundment schedules and reservoir water levels. 

How to cite: Zhou, Y., Ning, Z., Lin, F., and Chang, F.-J.: Optimizing impoundment operation of Three Georges Reservoir for enhancing hydropower output and reducing carbon emission, EGU General Assembly 2024, Vienna, Austria, 14–19 Apr 2024, EGU24-1993, https://doi.org/10.5194/egusphere-egu24-1993, 2024.

EGU24-2292 | ECS | Posters on site | GI2.3

AI-Driven Hydro-Insights: Proactive Water Resource Management for Sustainable Agriculture in the Face of Climate Change 

Pu Yun Kow, Yu-Wen Chang, and Fi-John Chang

Climate change profoundly affects natural water resources by increasing extreme rainfall and persistent drought events. This impact has led to a rising likelihood of over-extraction of groundwater by Taiwanese farmers due to insufficient water resources. Quantifying groundwater pumping activities is challenging, thereby prompting this study to introduce a hybrid AI model combining a Convolutional-based Autoencoder with LSTM. The objective is to explore the spatiotemporal relationship between hydrometeorology and groundwater for providing a quantitative assessment of groundwater resources.

To construct the model, a comprehensive dataset spanning two decades (2000-2019) is utilized, incorporating information from 33 groundwater monitoring wells in the Jhuoshuei River basin of Taiwan. Two types of datasets, observation and simulation, are employed for a robust analysis. The hybrid AI model yields accurate three-month-ahead forecasts for shallow groundwater in the Jhuoshuei River basin, with R2 performance ranging from 0.70 to 0.87 for T+1 (short-term forecasts) and from 0.42 to 0.69 for T+3 (long-term forecasts).

The significance of these forecasts lies in their potential to empower farmers to increase crop cultivation efficiency. The long-term forecasts aid in formulating strategic plans for crop cultivation and fallow periods, promoting efficient agricultural management. Simultaneously, the short-term forecasts empower farmers to enhance irrigation efficiency, leading to a reduction in regional water consumption. This proactive approach aligns with Sustainable Development Goals (SDGs) 11 and 12, fostering sustainable water resource management practices. In essence, this hybrid AI model emerges as a valuable tool for proactive and adaptive water resource management, particularly crucial in the context of evolving climate conditions.

Keywords: Groundwater management, AI, Deep Learning, regional forecast, machine learning, SDGs, Taiwan

How to cite: Kow, P. Y., Chang, Y.-W., and Chang, F.-J.: AI-Driven Hydro-Insights: Proactive Water Resource Management for Sustainable Agriculture in the Face of Climate Change, EGU General Assembly 2024, Vienna, Austria, 14–19 Apr 2024, EGU24-2292, https://doi.org/10.5194/egusphere-egu24-2292, 2024.

    In the face of evolving global weather patterns attributed to climate change, precise prediction of groundwater levels is increasingly essential for effective water resource management. This significance is particularly pronounced in regions like Taiwan, where groundwater is a pivotal water source. This study focuses on the Zhuoshui River basin in central Taiwan and explores a Transformer Neural Network (TNN) based on a 20-year hydrometeorological dataset at a 10-day scale to predict groundwater levels. Our investigation reveals that the innovative TNN model outperforms conventional models, such as the Convolutional Neural Network (CNN) and the Long Short-Term Memory neural network (LSTM). The TNN model's superiority is evidenced by its enhanced predictive capabilities, as measured by metrics like R2 and MAE. Notably, the TNN model excels in providing precise forecasts (MAE < 1 m) for the majority of groundwater monitoring stations, notwithstanding challenges in areas facing overexploitation.

    This groundbreaking study marks the first attempt of the TNN model to predict groundwater levels, showcasing its robust performance and broad applicability. The TNN model emerges as a valuable tool for groundwater level prediction, contributing to sustainable groundwater management and effective resource utilization amid the backdrop of climate change. With the potential to address climate-related challenges, the TNN model stands as a pivotal asset for optimizing strategies in groundwater resource management.

How to cite: Sun, W., Liou, J.-Y., and Chang, F.-J.: Revolutionizing Groundwater Level Prediction in Taiwan: Unleashing the Power of Transformer Neural Networks, EGU General Assembly 2024, Vienna, Austria, 14–19 Apr 2024, EGU24-2293, https://doi.org/10.5194/egusphere-egu24-2293, 2024.

EGU24-2519 | Posters on site | GI2.3

Enhancing Climate-Resilient Aquaculture in Yunlin County, Taiwan: A Comparative Analysis of Aquavoltaic Systems and Conventional Methods 

Chu-Han Chen, Meng-Hsin Lee, Hang-Yeh Lin, and Fi-John Chang

The escalating frequency of climate-related disasters underscores the imperative need for robust adaptive strategies to mitigate the impacts of extreme weather events. Crafting effective adaptive solutions, however, presents a formidable challenge. This research investigates the potential of aquavoltaic systems to enhance adaptive capacity and promote low-carbon production in fishing villages grappling with climate change. Focused on clam farming in Yunlin County, Taiwan, our study builds innovative Water-Energy-Food-Land-Climate (W-E-F-L-C) Nexus models using system dynamics (SD) techniques to compare the synergistic benefits and resource utilization efficiency between aquavoltaic systems and conventional aquacultural methods. This study meticulously catalogues factors from SD models and incorporates them into a comprehensive life cycle assessment (LCA) to scrutinize the environmental impacts of both aquavoltaic and conventional systems. Carbon emission data is rigorously calculated by LCA, revealing the carbon emissions flow resulting from interactions between these factors.

Additionally, this study conducts a scenario analysis to gain insight into how aquavoltaic and conventional aquacultural systems respond to key influencing factors such as temperature and rainfall. Our findings underscore that elevated temperatures and intensified rainfall significantly impact conventional clam farming compared to the aquavoltaic system. Aquavoltaics emerges as a robust and viable mechanism for aquaculture in the face of capricious weather conditions. Particularly noteworthy is the effectiveness of solar panels in intercepting and diverting rainwater during heavy rainfall in summer, reducing the risk of diluting pond water and thereby stabilize water quality. The shading effect induced by photovoltaic installations also contributes to moderating water temperatures, especially under direct sunlight. By synergizing physical mechanisms with advanced simulation techniques, this study propels toward a more efficient and resilient paradigm in aquaculture. Aquavoltaics demonstrate promising potential for sustainable and low-carbon production as well as promoting the resilience of fishing villages. This study not only illuminates the intricate dynamics of climate-resilient aquaculture but also stands as a milestone for the development of sustainable aquaculture practices.

How to cite: Chen, C.-H., Lee, M.-H., Lin, H.-Y., and Chang, F.-J.: Enhancing Climate-Resilient Aquaculture in Yunlin County, Taiwan: A Comparative Analysis of Aquavoltaic Systems and Conventional Methods, EGU General Assembly 2024, Vienna, Austria, 14–19 Apr 2024, EGU24-2519, https://doi.org/10.5194/egusphere-egu24-2519, 2024.

EGU24-2601 | ECS | Orals | GI2.3

Regularized framework for inverse problems in continuous atmospheric emissions: An application to the Fukushima accident 

Sheng Fang, Xinwen Dong, Shuhan Zhuang, and Yuhan Xu

The inverse modeling technique has been widely adopted to estimate atmospheric emissions, which aims to complement the subjective inference and provides rare retrieval when unavailable source information. The inversion generally requires the environmental observations and the source-receptor relationship constructed by an air dispersion model. But these two kinds of input lead to an ill-posed inverse problem in continuous atmospheric emissions. For the observations, the measurement network cannot capture all information on a specific emission progress, because of the nature of spatial sparse and limited temporal collections. Besides, there are inevitable model-observation discrepancies introduced by the discretization and imperfect parameters in the physical model and the diagnostic meteorology model. In this dilemma, the estimated atmospheric emissions are featured with discontinuous elements such as temporal gaps, artificial oscillations, and negative values, which are biased from the continuous emission progress in the real world.

This paper describes a regularized inversion framework to objectively address these artifacts and promote the continuity of emissions. This framework consists of the joint estimation model and the total variation (TV) regularization to handle the model-observation discrepancies and the insufficient observations respectively. The former implements site-by-site corrections by adding a diagonal matrix to the residual term of the inversion, and thus reduces the oscillations. The latter enhances a prior with the piecewise-constant feature by the L1-norm of the gradient of the emission vector, and therefore recovers the missing emissions. An adaptive parameterization scheme is tailored for the TV regularization to correct negative values.

The proposed method has been applied to the Fukushima accident to estimate the lasting emissions of 137Cs, facing the observations with nearly half temporal incomplete of the estimation period and unavoidable deviations introduced by the atmospheric dispersion model. The results produce a discrete emission profile that accurately approximates the continuous emission progress, which better matches the recognized one by expert judgments than nine published estimates, with a Pearson’s correlation coefficient of 0.92 and an index of agreement of 0.82. The estimated profile agrees with the timing of on-site gamma dose rate peaks as well. The evaluation was also conducted with respect to atmospheric simulations, providing significantly improved air concentrations and depositions, with the ten-factor agreement (FAC10) values of 0.56 and 0.99 respectively. The uncertainty analysis with respect to the regularization parameters shows a limited variation range of the estimation error (median value below 15.04%), demonstrating the potential for operational inversions with automatic parameterization.

How to cite: Fang, S., Dong, X., Zhuang, S., and Xu, Y.: Regularized framework for inverse problems in continuous atmospheric emissions: An application to the Fukushima accident, EGU General Assembly 2024, Vienna, Austria, 14–19 Apr 2024, EGU24-2601, https://doi.org/10.5194/egusphere-egu24-2601, 2024.

EGU24-3268 | Orals | GI2.3

Impacts of wildfire on desorption of radionuclide and subsequent wash-offs in the Chornobyl Exclusion Zone 

Yasunori Igarashi, Valentyn Protsak, Gennady Laptev, Igor Maloshtan, Dmitry Samoilov, Serhii Kirieiev, Yuichi Onda, and Alexei Konoplev

The Chornobyl wildfires of 2020 raises concerns regarding radionuclides wash-off from post fire sites. The objective of this study is to determine the speciation of 137Cs and 90Sr in the ash and soil. And to reveal the impact of the wildfires on concentrations of 137Cs and 90Sr in river water in Chornobyl. To accomplish this objective, extraction tests were conducted using ash and soil samples collected immediately after the 2020 fires to determine the water-soluble and exchangeable fractions of 137Cs and 90Sr in the ash and soil. Long-term river-water radionuclide concentration records were also analyzed.

The results showed that the solid–liquid distribution coefficient (Kd) of ash was significantly lower than that of soil for 137Cs, while for 90Sr there was no significant difference in Kd between ash and soil. Analysis of river water data indicated that 90Sr concentrations higher than the Ukrainian drinking water standard (> 2 Bq/L) were observed more frequently following wildfires in the Sakhan River catchment. The fires increased 90Sr concentrations over the following two years, particularly in the spring, when snowmelt causes substantial releases, and in the summer and autumn, when surface flows occurred. High 90Sr concentrations were observed only within the Chornobyl Exclusion Zone, so additional human uptake of or dose exposure to 90Sr from river water is not expected.

The Chornobyl wildfires, which is a short period when radioactive contamination levels are elevated in the ecosystem, affected radionuclide speciation, turning the catchment into a location where radioactive contamination levels are significantly higher than in the surrounding area for the redistribution of radionuclides.

How to cite: Igarashi, Y., Protsak, V., Laptev, G., Maloshtan, I., Samoilov, D., Kirieiev, S., Onda, Y., and Konoplev, A.: Impacts of wildfire on desorption of radionuclide and subsequent wash-offs in the Chornobyl Exclusion Zone, EGU General Assembly 2024, Vienna, Austria, 14–19 Apr 2024, EGU24-3268, https://doi.org/10.5194/egusphere-egu24-3268, 2024.

EGU24-4338 | ECS | Orals | GI2.3

The Influence of Remedial Actions on Ambient Dose Rates in Fukushima Forests 

Donovan Anderson, Hiroaki Kato, and Yuichi Onda

This study evaluates the long-term impact of government-led decontamination efforts on air dose rates in Fukushima forests affected by the 2011 nuclear disaster. While decontamination successfully mitigated radiation risks, its influence on air dose rates over time remains understudied, particularly in comparison to non-remediated forests. A comprehensive assessment spanning 2013 to 2020 was conducted, utilizing governmental decontamination data and monitoring adjacent untreated forests. Despite initial increases post-decontamination, air dose rates generally stabilized, following a trend indicative of physical decay. The study found that dominate tree species in forests influenced dose rate reduction. Broadleaf forests maintained lower post-decontamination dose rates compared to untreated counterparts, while cedar forests experienced increased post-decontamination rates, reverting to pre-decontamination levels. Both forest types exhibited similar annual decrease trends due to physical and environmental decay, with red pine in non-decontaminated forests showing the slowest decline. Analysis of radioactive cesium concentrations in organic matter and soil revealed a gradual transfer from organic matter to soil. Decontamination reduced concentrations in organic material but had no discernible effect on soil concentrations, indicating an ongoing transfer of radioactive materials from organic matter to soil. This emphasizes the need for future remediation strategies to assess local natural restoration potential and this study offers crucial insights for refining forest decontamination strategies and underscores the importance of factoring in ecosystem dynamics in radiation remediation planning.

How to cite: Anderson, D., Kato, H., and Onda, Y.: The Influence of Remedial Actions on Ambient Dose Rates in Fukushima Forests, EGU General Assembly 2024, Vienna, Austria, 14–19 Apr 2024, EGU24-4338, https://doi.org/10.5194/egusphere-egu24-4338, 2024.

EGU24-7089 | Orals | GI2.3

Simulation of tritium releases into the atmosphere during the Fukushima accident and into the ocean due to planned discharge of treated water 

Alexandre Cauquoin, Maksym Gusyev, Yoshiki Komuro, Hayoung Bong, Atsushi Okazaki, and Kei Yoshimura

Following the accident at the Fukushima Daiichi Nuclear Power Plant (FDNPP) in March 2011, large quantities of radioactive materials were released into the atmosphere and ocean. Since the FDNPP nuclear accident, Tokyo Electric Power Company (TEPCO) operators have been implementing measures to reduce groundwater inflow into the FDNPP damaged reactor buildings while pumping water to cool the nuclear reactors and fuel debris. The resulting huge water volume began the discharge into the ocean from August 2023, after being treated by an Advanced Liquid Processing System (ALPS) to remove radionuclides for acceptable discharge levels except tritium. Tritium releases from the FDNPP accident and the ALPS treated water raise questions about the impact on tritium in precipitation in Japan, the removal time of anthropogenic tritium in groundwater and the oceanic transport of tritium from released ALPS treated water. 

In this two-part study, we present (1) the modeling of tritium in precipitation during the FDNPP accident using an atmosphere general circulation model (AGCM), and (2) a sensitivity simulation of tritium concentration in the ocean due to planned ALPS treated water release in the next decades by TEPCO using an ocean general circulation model (OGCM). 

For the atmospheric part, we used the isotope-enabled AGCM MIROC5-iso, in which tritium has been implemented [1], and adapted an estimated atmospheric release of iodine-131 [2] for the anthropogenic tritium source. We found good agreement with the tritium in precipitation observations in Japan for 2011 and subsequent years, despite MIROC5-iso’s rather coarse horizontal resolution (approximately 2.8°). Together with measured tritium data in Japan, our modeled results can be used to interpret mean transit times of Fukushima surface and groundwater systems and in other Asian systems (see abstract of Gusyev et al. in the same session).

For the oceanic part, we used the OGCM COCO4.9, which is the ocean component of the Model for Interdisciplinary Research on Climate, version 6 (MIROC6 [3]), and the tritium discharge scenario from TEPCO. Tritium concentration at the ocean surface reaches approximately 3 Bq/m3 near the release site and varies between 0.01 and 0.25 Bq/m3 in the North Pacific Ocean, well below the natural tritium level (approximately 50 Bq/m3 [4]). For this kind of projection simulation, the use of a fully coupled atmosphere-ocean model would make it possible to model tritium concentration in both the atmosphere and the ocean, as well as the dynamics of exchanges within and between these water cycle reservoirs.


[1] Cauquoin et al.: Modeling natural tritium in precipitation and its dependence on decadal variations of solar activity using the atmospheric general circulation model MIROC5-iso, J. Geophys. Res. Atmos., in review (minor revisions).

[2] Katata et al., Atmos. Chem. Phys., 15, 1029–1070, https://doi.org/10.5194/acp-15-1029-2015, 2015.

[3] Tatebe et al., Geosci. Model Dev., 12, 2727–2765, https://doi.org/10.5194/gmd-12-2727-2019, 2019.

[4] Jenkins et al., Earth Syst. Sci. Data, 11, 441–454, https://doi.org/10.5194/essd-11-441-2019, 2019.

How to cite: Cauquoin, A., Gusyev, M., Komuro, Y., Bong, H., Okazaki, A., and Yoshimura, K.: Simulation of tritium releases into the atmosphere during the Fukushima accident and into the ocean due to planned discharge of treated water, EGU General Assembly 2024, Vienna, Austria, 14–19 Apr 2024, EGU24-7089, https://doi.org/10.5194/egusphere-egu24-7089, 2024.

EGU24-7140 | Posters on site | GI2.3

Effect of 137Cs desorption from sediment on the formation of dissolved 137Cs concentrations in dam discharge water 

Hideki Tsuji, Hironori Funaki, and Seiji Hayashi

In the region affected by the Fukushima nuclear accident in 2011, some freshwater fish shipments continue to be suspended owing to radioactive contamination (mainly 137Cs) of the aquatic environment. In predicting the future 137Cs contamination of aquatic organisms, investigations must focus on the dynamics of 137Cs in dissolved form, which is highly bioavailable and abundant in the environment. In particular, dam lakes that deposit large amounts of sediment contaminated with 137Cs and have a long residence time of water can substantially influence the dynamics of 137Cs in rivers, as suggested by prior research. This study focuses on the effect of desorption of 137Cs from lake sediment on the formation of dissolved 137Cs concentrations in dam discharge water, using the results from monitoring surveys at two dam lakes located near the Fukushima Daiichi Nuclear Power Plant.

We collected inflow and discharge water from the Matsugabo and Yokokawa dams in Fukushima Prefecture every month from 2014 and measured the concentration of dissolved and particulate 137Cs in the water using the cartridge filter method. On the basis of these results, combined with flow data from the dam lakes, we estimated the annual budgets of 137Cs (inflow/outflow) in the dam lakes. For the particulate form, annual 137Cs inflow into the lakes decreased by more than 80% in most years, indicating that most of the inflow particles sedimented. For the dissolved form, the annual discharge of 137Cs was higher than the annual inflow of 137Cs, concurring with results from a neighboring dam lake. This increment suggests 137Cs desorption from the sediment.

According to the monthly monitoring data, the dissolved 137Cs concentration in the dam discharge water at some periods showed a higher value than the peak value from the previous year. This phenomenon was observed when the reservoir storage rate of the dam lake fell below approximately 30%. To determine the main source of dissolved 137Cs in the dam lake, we investigated the horizontal distribution of the dissolved 137Cs concentrations at several points in Yokokawa dam lake and the vertical distribution of the dissolved 137Cs concentration at the center of the lake in August 2023, when the water level was very low. The concentration of dissolved 137Cs in the lake water was found to increase in the inlet part of the lake, while the concentration remained almost the same in the downstream direction from the site. The concentration of dissolved 137Cs at the center of the lake was almost unchanged vertically. This trend was different from the increase in the concentration of dissolved 137Cs in bottom water, previously observed at the same location (Tsuji et al., 2022). These results indicate that 137Cs desorption from sediment in the inlet area mainly led to the increase in the dissolved 137Cs concentrations in the lake water, in part owing to the low volume of flowing water.

How to cite: Tsuji, H., Funaki, H., and Hayashi, S.: Effect of 137Cs desorption from sediment on the formation of dissolved 137Cs concentrations in dam discharge water, EGU General Assembly 2024, Vienna, Austria, 14–19 Apr 2024, EGU24-7140, https://doi.org/10.5194/egusphere-egu24-7140, 2024.

EGU24-7423 | Posters on site | GI2.3

Mechanisms of dissolved-form 137Cs runoff from forest source watersheds  

Yutaro Nagata, Yuichi Onda, Junko Takahashi, and Koichi Sakakibara

The concentration of dissolved-form 137Cs in forested rivers is known to increase during rainstorms, and direct leaching from litter and soil water is considered to be a factor. There have also been many studies showing that competing ions such as K+ and NH4+ promote the elution of 137Cs. However, there are no examples of detailed measurements of 137Cs concentrations and water quality characteristics of stream water and water passing through litter during actual rainstorms. In this study, stream water, throughfall,  water passing through litter, and groundwater were sampled in a small watershed in Fukushima Prefecture, Japan, which was affected by the Fukushima Daiichi Nuclear Power Plant, to measure dissolved 137Cs and dissolved organic carbon (DOC), K+and NH4+. NH4+ was not detected in stream water. The average concentrations of dissolved137Cs, DOC and K+ were 6.36 (mBq/L), 0.51 (mg/L) and 0.14 (mg/L), respectively, while the concentrations of 137Cs and DOC doubled to 13.38 (mBq/L), 1.13 (mg/L) during rainfall event and the K+concentrations remained unchanged (0.15mg/L). The concentrations of 137Cs and DOC  in the water passing through the litter were 50 and 30 times higher than in the stream water, respectively, suggesting that the high concentrations of dissolved 137Cs at the time of runoff were formed by leaching from the litter rather than by the presence of competing ions. The amount of 137Cs and K+eluted from the litter increased in the order of near-channel, saturated zone at run-off and slope, while the amount of DOC eluted from the litter was lower near the channel. These results suggest that 137Cs, K+and DOC release from near-channel litter is lower than that from litter on the slope because of the progress of leaching due to the occurrence of saturated surface flow.

How to cite: Nagata, Y., Onda, Y., Takahashi, J., and Sakakibara, K.: Mechanisms of dissolved-form 137Cs runoff from forest source watersheds , EGU General Assembly 2024, Vienna, Austria, 14–19 Apr 2024, EGU24-7423, https://doi.org/10.5194/egusphere-egu24-7423, 2024.

EGU24-7677 | Posters on site | GI2.3

Downward migration of Cs-137 in soils reduce root uptake of Japanese cedar in Fukushima 

Junko Takahashi, Satoshi Iguchi, Takuya Sasaki, and Yuichi Onda

Introduction

Radiocesium (Cs-137) deposited on forests was intercepted by the canopy, then migrated to the litter layer and eventually to the soil layer, where some of it has been absorbed by roots and circulated through the forest ecosystem for a long time. In other words, the amount of Cs-137 uptake by roots will control the long-term dynamics in the forest ecosystem in the future, temporal changes in Cs-137 in tree roots have rarely been reported. In this study, we investigated the Cs-137 concentration and inventory in the soil and very fine (VF) roots (< 0.5 mm) of Japanese cedar from 2011 to 2020.

Methods

An approximately 3 m x 3 m plot was established in a cedar forest (initial deposition 440 kBq m-2) in the Yamakiya district of Kawamata Town, Fukushima Prefecture. Litter and soil samples were collected twice a year during 2011-2012 and once a year after 2013 using a scraper plate at 0.5 cm intervals for 0-5 cm, 1 cm intervals for 5-10 cm, and 5 cm intervals for 10-20 cm. Root samples were collected by further separating only the roots with tweezers from soil samples in 2012, 2015, 2017, and 2020, and washed by ultrasonic homogenizer to remove soil particles on the root surface. The roots measured were absorptive VF roots of 0.5 mm or less of the current year's growth.

Results and discussions

The Cs-137 concentration in the litter layer was still decreasing exponentially more than 12 years after the accident, its inventory was about 0.2-0.5% of the deposited amount. The depth distribution of Cs-137 concentration in the mineral soil layers was fitted with an exponential equation until 2019, but after 2020, the peak concentration shifted slightly downward and was fitted with a hyperbolic function. The Cs-137 inventory in the soil increased over time due to the migration from the forest canopy and litter layers, whereas that in the VF roots decreased in 2020. Especially, the Cs-137 inventory in the VF roots in the 0–2 cm of soil reached 89% in 2012; however, it decreased with time to approximately 43% in 2020. This decrease in the Cs-137 concentration in the VF roots at 0–2 cm was caused by the decrease in Cs-137 concentration in the litter layers. Although the Cs-137 concentration in the VF roots below 2 cm increased with increasing Cs-137 concentration in the soil, the downward migration of Cs-137 within the soil can reduce the amount of Cs-137 absorbed by roots because the VF root biomass decreases exponentially with depth. In other words, Cs-137 can be removed from the long-term active cycles of forest ecosystems as they migrate deeper into the soil without physical decontamination. This natural downward migration process can be regarded as a “self-cleaning” of the forest ecosystem, resulting in a decrease in the air dose rate and the amount of Cs-137 absorbed by roots.

How to cite: Takahashi, J., Iguchi, S., Sasaki, T., and Onda, Y.: Downward migration of Cs-137 in soils reduce root uptake of Japanese cedar in Fukushima, EGU General Assembly 2024, Vienna, Austria, 14–19 Apr 2024, EGU24-7677, https://doi.org/10.5194/egusphere-egu24-7677, 2024.

EGU24-7685 | ECS | Posters on site | GI2.3

Comparison of cesium-bearing microparticles from marine and terrestrial sources 

Hikaru Miura, Takashi Ishimaru, Jota Kanda, Yukari Ito, and Atsushi Kubo

Radionuclides including radioactive Cs were released into the environment due to the Fukushima Daiichi Nuclear Power Plant accident in 2011. Two years after the accident, glassy water-resistant particles incorporating radioactive Cs were first reported. Such glassy particles are called cesium-bearing microparticles (CsMPs). CsMPs have been studied because (i) they have information on the condition in the reactor at the time of the accident, and (ii) there is concern about the exposure to the humans and the other organisms.

Several types of CsMPs have been reported, which is assumed to reflect the difference in the accidental progress of each unit. It is also known that CsMPs were transported in the atmospheric plume at the time of emission and therefore have different deposition regions. Type-A CsMPs, are presumed to originate from Unit 2, deposited over a wide area including the Kanto region due to their small size (~0.1–10 µm). Type-B CsMPs, are presumed to originate from Unit 1, deposited in a limited area in the north direction because of their large size (50–400 µm). Matrix of Types-A and -B CsMPs is SiO2 but Type-A CsMPs have higher concentration of volatile elements including Cs than Type-B CsMPs due to the difference in forming process. Type-A CsMPs were formed through gas condensation, whereas Type-B CsMPs were formed through melt solidification.

The presence of CsMPs emitted from Unit 3 in the ocean was confirmed by our research. The plume at the time of the emission of radionuclides from Unit 3 was in the ocean direction, which suggests that many CsMPs from Unit 3 deposited directly into the ocean. We will report the comparison of CsMPs from marine and terrestrial sources. In addition, we reported Type-A CsMPs from suspended particles in rivers and marine samples, such as plankton net and suspended particle samples. This fact suggests that Type-A CsMPs deposited on land and transported to the ocean through rivers. The presence of CsMPs may be the cause of the overestimation of solid–water distribution coefficient for marine sediments and particulate matters and apparent high concentration factor of marine biota of radioactive Cs.

How to cite: Miura, H., Ishimaru, T., Kanda, J., Ito, Y., and Kubo, A.: Comparison of cesium-bearing microparticles from marine and terrestrial sources, EGU General Assembly 2024, Vienna, Austria, 14–19 Apr 2024, EGU24-7685, https://doi.org/10.5194/egusphere-egu24-7685, 2024.

The Zaporizhzhia nuclear power plant (ZNPP) has been occupied by Russian aggressors since March 4, 2022. Its proximity to the combat zone results in a real risk of an accident with radioactivity emissions. There have been a number of blackouts at ZNPP (the most recent one was reported on December 2, 2023, lasting for approximately 5 hours), which could potentially lead to an accident with a scenario similar to that of the 2011 Fukushima Daiichi NPP disaster. The objective of this research is to assess possible contamination of the territory of Ukraine and neighboring countries by Cs-137, emitted in a hypothetical accident at ZNPP, depending on weather patterns usually observed over the domain. The assessment is based on numerical simulations of atmospheric transport, dispersion and deposition processes.

In order to obtain an input meteorology for the dispersion/deposition simulations, we chose 37 typical weather patterns out of 153 that were objectively identified in the domain during 2018-2020. Our selection aimed to keep seasonal and frequency distribution of the patterns in the sampled population. Generally, the selected patterns included 22 cyclonic, 12 anticyclonic, and 3 situations of western transport. Their mean duration was approximately 6 days. 3D meteorological data for the selected weather patterns were generated by means of the WRF v4.3 meteorological model based on ERA5 reanalysis data.

The source term parameterization was based on freely available information published in scientific papers, reports etc. Several Cs-137 emission scenarios were considered by varying an emitted fraction of the total core inventory (50% and 3.43%) and a period of time when the source was active (24, 32, and 40 hours). The dispersion/deposition calculations were performed with the CALPUFF v6 and HYSPLIT v5.2.3 atmospheric dispersion models. Using these two models, which implement different computation algorithms, allowed us to perform the verification of the computed results.

Our calculations showed that a hypothetical accident with the most conservative emission scenario (emitted 50% of the total core inventory) could lead to significant contamination of not only the territory of Ukraine but also neighboring countries. Generally, depending on the weather pattern, from 10 to 80% of the emitted Cs-137 could be deposited on the territory of Ukraine. The reduction of the total emission obviously leads to decreased absolute values of the contamination, however the fractions of deposited in Ukraine Cs-137 stay unchanged for each weather pattern.


The work is supported by the grant program University for Ukraine (U4U) and The Yale School of the Environment. Oleg Skrynyk also acknowledges the support from the MSCA4Ukraine fellowship program, which is funded by the European Union.

How to cite: Balabukh, V., Skrynyk, O., Bubin, S., and Laptev, G.: Possible contamination of Ukraine and neighboring countries by Cs-137 due to a hypothetical accident at the Zaporizhzhia NPP as a consequence of the Russian aggression, EGU General Assembly 2024, Vienna, Austria, 14–19 Apr 2024, EGU24-10247, https://doi.org/10.5194/egusphere-egu24-10247, 2024.

EGU24-12226 | ECS | Orals | GI2.3

Perspectives on dynamic water quality modeling across continental and watershed scales 

Olivia Miller, Scott Ator, Mike Hess, Daniel Jones, Patrick Longley, Morgan McDonnell, Matthew Miller, Annie Putman, Dale Robertson, David Saad, Noah Schmadel, Gregory Schwarz, Andrew Sekellick, Kenneth Skinner, Richard Smith, and Daniel Wise

Stream water-quality and its drivers vary across time and space, but we only monitor a small fraction of streams consistently over long periods of time. Such limited monitoring necessitates the development and application of spatially explicit and dynamic models to predict water quality at unmonitored locations. Historically, data and computational limitations have hindered temporally variable prediction efforts across large spatial scales. However, hybrid statistical and process models, such as Spatially Referenced Regression on Watershed attributes (SPARROW), can provide spatially explicit, accurate predictions of water quality constituents with substantially lower computational cost than process-only models while retaining process-level information that can be obscured within machine learning models. An emerging next generation of such hybrid models moves beyond temporally static predictions into dynamic predictions. Here, we present regional- and continental-scale dynamic SPARROW models developed across the United States to simulate annual salinity and seasonal nutrient loads and concentrations over decades. Dynamic SPARROW models account for temporal variability of constituent sources and processes that deliver constituents from the landscape to streams. In addition, dynamic SPARROW models quantify lagged delivery of contaminants to streams that may have accumulated in soils, groundwater, and vegetation. Results quantify that legacy sources can vary by constituent, location, and time, and provide inference into river responses and lags to management activities. For example, groundwater storage contributes between 66 and 82% of the dissolved solids load to streams in the Upper Colorado River Basin, while lagged storage contributes on average between 20% to nearly 50% of the total nutrient load to Illinois River Basin streams.  Ongoing work to expand dynamic representation of loading up to the continental United States will provide further insight into the continually evolving impacts of legacy and other sources on riverine water quality. Dynamic representation of key processes across spatial scales provides new opportunities for more informed management that can improve water quality for human and ecosystem uses.

How to cite: Miller, O., Ator, S., Hess, M., Jones, D., Longley, P., McDonnell, M., Miller, M., Putman, A., Robertson, D., Saad, D., Schmadel, N., Schwarz, G., Sekellick, A., Skinner, K., Smith, R., and Wise, D.: Perspectives on dynamic water quality modeling across continental and watershed scales, EGU General Assembly 2024, Vienna, Austria, 14–19 Apr 2024, EGU24-12226, https://doi.org/10.5194/egusphere-egu24-12226, 2024.

EGU24-13386 | Posters on site | GI2.3 | Highlight

Multi-model simulation of the radionuclide transfer in the Yellow Sea as a result of hypothetical atmospheric deposition 

Kyeong Ok Kim, Roman Bezhenar, Ivan Kovalets, Igor Brovchenko, Vladimir Maderich, and Kyonghwan Kwon

After accidents at the Chornobyl NPP in 1986 and Fukushima Daiichi NPP in 2011, it became clear that there are many causes that can lead to a nuclear accident, including techno-genic and natural disasters. There is a danger of damage to the Zaporizhzhia NPP, with the subsequent release of radioactivity into the environment, as a result of the Russian invasion of Ukraine. The coastline of the Yellow Sea and East China Sea(YSECS) is a place where 9 NPPs are in operation in China and Korea. Since they are semi-enclosed seas with a very high density of population, any potential nuclear accident in the region can significantly contaminate the marine environment and affect the health of many people.

In the current study, a set of numerical models for the first time was applied to simulate the spreading of radionuclides in the environment as a result of the hypothetical accident at the Haiyang Nuclear Power Plant in China. The scenario of accidental release with containment-bypass was considered in this work. The atmospheric transport and deposition of radionuclides on the sea surface were simulated by the FLEXPART model. The set of 1450 dispersion scenarios following hypothetical accidental releases with different start dates were calculated for the next 120 h after release start, thus covering meteorological conditions from 1 Mar 2020 to 28 Feb 2021. Scenario with the heaviest deposition densities on the Yellow Sea was selected. These results were used as a source term for three different marine dispersion model simulating the transfer and fate of Cs-137 in YSECS: the grid-based Eulerian model THREETOX, Lagrangian radionuclide transport model and compartment model POSEIDON-R. Such approach emulates the application of various models with their own settings in the event of an unexpected accidental release, similar to the Fukushima accident. For THREETOX model setup, 3D current velocities with 30 vertical layers were extracted from the KIOST-MOM model, results of which are monthly averaged and cover North Pacific. The Lagrangian radionuclide transport model used regional currents and suspended sediments concentrations from circulation model adopted for the YSECS taking into account tides and multi-fractional sediments. These two models were applied for emergency and post-emergency phases for the period from half a year to one year after deposition. The POSEIDON-R model already had a system of boxes for the North-Western Pacific covering the YSECS, East/Japan Sea and Eastern coastal area of Japan. It was applied for a long-term assessment of several decades. Obtained concentrations of Cs-137 in water, bottom sediments and partly in marine organisms were compared and the differences were analysed. Application of three marine dispersion models provides the possible ranges of radionuclide concentrations on the one hand and increases the reliability of results on the other.

How to cite: Kim, K. O., Bezhenar, R., Kovalets, I., Brovchenko, I., Maderich, V., and Kwon, K.: Multi-model simulation of the radionuclide transfer in the Yellow Sea as a result of hypothetical atmospheric deposition, EGU General Assembly 2024, Vienna, Austria, 14–19 Apr 2024, EGU24-13386, https://doi.org/10.5194/egusphere-egu24-13386, 2024.

EGU24-13781 | Orals | GI2.3

Tritium Leakage Traces the Path of Cesium from Fukushima Daiichi Nuclear Power Plant into the Ocean 

Yuichi Onda, Hikaru Sato, and Daisuke Tsumune

Reducing the release of radionuclides into the environment is crucial for decommissioning nuclear facilities and post-accident remediation. After the Fukushima Daiichi Nuclear Power Plant (FDNPP) accident, a seawall was constructed to minimize the direct discharge of Cs-137-contaminated groundwater into the ocean. Despite this measure, unexplained seasonal variations in Cs-137 emissions continued. Notably, between 2013 and 2014, groundwater leaks from treated water storage tanks at the site led to detectable levels of tritium (H-3) in the groundwater moving downslope from the plant. Our study, conducted over 2015-2021, utilizes a watershed hydrologic tracer approach to identify the marine sources of Cs-137 and explore the underlying causes of its seasonal fluctuation.

We analyzed H-3 in FDNPP groundwater and drainage channel K, known for high Cs-137 concentrations. By correlating this data with Cs-137 levels and runoff in the channel, we deduced the proportion of surface to total flow, identifying the main sources of Cs-137 and its seasonal variability. The surface flow, indicated by H-3 presence and further subdivided by effective rainfall analysis, revealed that the flow through the plant buildings was heavily contaminated with Cs-137, constituting the primary runoff source. We found that Cs-137 concentrations in basal flow are influenced by temperature, while those in surface flow respond to rainfall.

These insights are crucial for effective cleanup strategies at FDNPP and demonstrate the broader applicability of using leakage H-3 as a tracer to identify sources of radioactive and chemical pollutants from terrestrial to marine environments in similar scenarios.

How to cite: Onda, Y., Sato, H., and Tsumune, D.: Tritium Leakage Traces the Path of Cesium from Fukushima Daiichi Nuclear Power Plant into the Ocean, EGU General Assembly 2024, Vienna, Austria, 14–19 Apr 2024, EGU24-13781, https://doi.org/10.5194/egusphere-egu24-13781, 2024.

EGU24-13825 | Posters on site | GI2.3

Lagrangian radionuclide transport modeling with fast and slow adsorption-desorption processes: application to the Yellow Sea with a hypothetical atmospheric deposition  

Seongbong Seo, Igor Brovchenko, Vladimir Maderich, Ivan Kovalets, Kateryna Kovalets, and Kyung Tae Jung

To cope with the increasing threat of radioactivity release accidents in the Yellow Sea a Lagrangian radionuclide transport model in the region was recently developed coupled in off-line manner with current-wave-suspended sediment modeling system (Brovchenko et al, 2022).  The radionuclide model included as an essential feature the fast adsortion-desorption processes of dissolved and particulate radionuclides in the presence of multi-ftactional sediments. Upgrade is made in this work by including fast and slow adsorption-desorption processes of radionuclides and a novel approach for lagrangian simulation of the radionuclide exchange between near-bottom water-layer and bed sediments. Lagrangian particles in the model can possess several states: dissolved in the water column, adsorbed on suspended sediment of particular size, dissolved in the pore water, adsorbed on the bed sediments of particular size. Note that, If particles are adsorbed on the sediments then it can be in two different states, namely fast and slow reversible forms; if there are Nsed sediment size classes then we have Ntot =2+4Nsed  total states of the radionuclide. Throughout the numerical integration the model calculates the probabilities to transfer into each possible state (that depends on the current state and time step) during the next time step and then chooses the new particular state by comparing with the generated uniformly distributed random number. Hypothetical accident at the Haiyang NPP in China, which is located at the coast of Yellow Sea close to Korea is considered as a scenario of accident. The atmospheric transport and deposition of radionuclides on the sea surface was simulated by the FLEXPART model. The obtained deposition fluxes were used as a source term in the Lagrangian radionuclide transport model. 3D fields of currents, suspended sediment concentration and turbulent diffusion coefficient as well as bed sediment fractional composition are identical to the previous results of the Yellow Sea (Brovchenko et. al. 2022).  Computational domain of the FLEXPART model includes bigger outer area, which covers Yellow and East China Sea, with spatial resolution of 0.15 deg, and inner area, which covers only Yellow Sea with better spatial resolution of 0.05 deg. The source term of 137Cs released due to hypothetical accident at the Haiyang NPP was obtained from the 6-day simulations of the FLEXPART model. The total amount of radioactivity that deposited on the calculation area is approximately 55 PBq. The radioactivity budget analysis reveals that almost near 50% of the 137Cs was deposited to the bottom sediments and approximately half remained in the dissolved form. About 4% of the total amount remains on the suspended sediments in one-step modelling and about 9% with the use of two-step model. The total bed contamination changed only 1% because for this period bottom contamination fluxes dominated over the bed cleaning process. More differences are expected for simulation with duration of several years when dissolved 137Cs concentration in water will decrease and bed cleaning process become more significant.

How to cite: Seo, S., Brovchenko, I., Maderich, V., Kovalets, I., Kovalets, K., and Jung, K. T.: Lagrangian radionuclide transport modeling with fast and slow adsorption-desorption processes: application to the Yellow Sea with a hypothetical atmospheric deposition , EGU General Assembly 2024, Vienna, Austria, 14–19 Apr 2024, EGU24-13825, https://doi.org/10.5194/egusphere-egu24-13825, 2024.

EGU24-13896 | Orals | GI2.3

Linkage of 137Cs dynamics in river and coastal seawater during high-flow events 

Yoshifumi Wakiyama, Shun Satoh, Hyoe Takata, Pierre-Alexis Chaboche, and Honoka Kurosawa

Previous studies indicated that high-flow events can result in substantial 137Cs exportation via river to the ocean and increase 137Cs concentrations in coastal seawater. Assessing response of marine 137Cs behavior to terrestrial 137Cs inflow will lead to a better understanding of 137Cs transfer processes in terrestrial and marine environments. This study presents results of sample collections under various flow conditions on a river system and its coastal seawater to discuss the transfer processes in detail. The study was conducted in the Ukedo river system and its coastal sea during 3rd-19 th September 2023. Water samples were collected for 13 times at two downstream points of the river system, on the mainstream (Ukedo river) and a tributary (Takase river), and 8 times at seashore locating at 500 m north from the river mouth. In the sampling period, the catchment mean rainfall was totaled 300 mm with intensive rainfalls on 4, 6 and 8 September. Collected water samples were filtrated to measure 137Cs concentration in suspended solids (Bq/kg) and dissolved 137Cs concentrations (Bq/L). 137Cs concentrations in suspended solids in Ukedo and Takase river ranged from 7.0 to 67 kBq/kg and from 2.4 to 15 kBq/kg, respectively. The concentrations at peak water discharge phases in Takase river tended to be high when ratio of rainfall amount on downstream parts to that on whole catchments were high, but vice versa in the Ukedo river. This discrepancy can be attributed to the difference in spatial distribution of 137Cs inventory between the two catchments. Dissolved 137Cs concentrations in Ukedo and Takase rivers ranged from 52 to 70 mBq/L (5 samples measured out of 13) and from 8.4 to 37 mBq/L, respectively. At the seashore, 137Cs concentrations in suspended solids and dissolved 137Cs concentration ranged from 2.0 to 95 kBq/kg and from 6.7 to 410 mBq/L, respectively. Both concentrations appeared maximum in the sample collected 5 hours after the peak river water discharge which occurred with intensive rain on 8th September. Higher dissolved 137Cs concentration in seawater than in corresponding river water for the high-flow event indicates considerable desorption of 137Cs from terrestrial suspended solids into coastal seawater. Both 137Cs concentrations in seawater decreased with time to reach the background levels in 10 days after the event despite of quite stable concentrations in rivers. These results provide important implications for quantifying 137Cs transfer processes in terrestrial-marine environments.

How to cite: Wakiyama, Y., Satoh, S., Takata, H., Chaboche, P.-A., and Kurosawa, H.: Linkage of 137Cs dynamics in river and coastal seawater during high-flow events, EGU General Assembly 2024, Vienna, Austria, 14–19 Apr 2024, EGU24-13896, https://doi.org/10.5194/egusphere-egu24-13896, 2024.

EGU24-14216 | ECS | Posters on site | GI2.3

Spatiotemporal Variation of DOM Concentration and Composition along the Subtropical Small River Continuum in Taiwan 

Li-Chin Lee, Jr-Chuan Huang, Gabriele Weigelhofer, Thomas Hein, Yu-Lin Yu, and Pei-Hao Chen

The fate and reactivity of dissolved organic matter (DOM) in river networks is critical to understanding carbon cycling in inland water systems, and is highly regulated by physio-geographic factors and water residence time (WRT). In this study, we investigate the spatiotemporal variation of DOM concentration and composition in two SMRs in Taiwan with different landscapes and anthropogenic impacts. The WRT for these two rivers, the Keelung and Lanyang River, are around 34 and 23 hours, respectively. Dissolved organic carbon (DOC) concentration measurements and optical analyses (absorbance and fluorescence) were used to examine DOM quantity and quality along the river continuum. The comparative results showed that, along the SMR continuum, the DOC concentrations and optical indexes exhibited slight changes, with significant increases observed only at downstream sites influenced by human activities. Meanwhile, the higher biological index (BIX) and lower humification index (HIX) indicated an increase in autochthonous sources and a decrease in the degree of humic characters. In addition, we observed a positive correlation between WRT and DOC concentration variability, yet not significant for DOM compositions. When comparing the two rivers, the one with steeper topography and less human influence shows lower levels of DOC concentration and degree of humification. Overall, the SMRs seem to have lower DOC concentrations (0.26 - 1.65 mg-C L-1), lower HIX (0.28 - 0.76), and slightly higher BIX (0.8 - 1.9) on a global scale, which might be attributed to Taiwan's steep landscape and shorter water residence time, limiting soil organic carbon (SOC) production and in-stream processes rates. Through our investigation, DOC concentration and DOM composition across river networks will be better understood and potentially improve the assessment of the global carbon cycle.

How to cite: Lee, L.-C., Huang, J.-C., Weigelhofer, G., Hein, T., Yu, Y.-L., and Chen, P.-H.: Spatiotemporal Variation of DOM Concentration and Composition along the Subtropical Small River Continuum in Taiwan, EGU General Assembly 2024, Vienna, Austria, 14–19 Apr 2024, EGU24-14216, https://doi.org/10.5194/egusphere-egu24-14216, 2024.

The March 11, 2011, Great East Japan Earthquake triggered accidents at the Fukushima Daiichi Nuclear Power Plant (1F NPP), releasing radioactive substances into the ocean. Sparse observational data on 137Cs in the ocean led to interpolation and simulation for a comprehensive understanding. The primary focus was on direct release, emphasizing the need for a suitable source.

The direct release rate (Bq/day) was calculated by multiplying the seawater exchange flow rate (m3/day) and observed 137Cs concentration (Bq/m3). Using a mesh size of 735 m x 929 m x 8 m on the model, the seawater exchange flow rate at the release point was simulated. The 137Cs concentration relied on average observed radioactivity at 5, 6, and the south discharge canals near the 1F NPP. Direct release was estimated at 2.2x10¹⁴ Bq/day from March 26 to April 6, 2011, aligning with rates derived from other methods.

The seawater exchange flow rate's dependency on the model's mesh size was acknowledged. For this estimation, a 735 m x 929 m mesh size encompassing key points was considered reasonable for the seawater exchange flow rate, given the complex transport process from the release source (Unit 2 intake) to observation points (5, 6, and the south discharge point) due to port structures.

A higher resolution model with a 147 m x 186 m mesh (1/5) was used for a detailed analysis of direct release rates. The size of the sea area for determining the volume of seawater exchange flow rate can now be changed. Despite challenges in setting due to damaged ports, using the seawater exchange flow rate in a similar area as the previous resolution was deemed appropriate. The results of the validation of the release rate and the observed results by the relationship equation confirmed the consistency with the amount of seawater exchange obtained by the results of the dye tracer release experiments in the 1970s.

The release of 137Cs from the 1F NPP site persists. Estimating direct release rates up to 2016, a long-term simulation with a higher resolution model was conducted for validation. Results showed the oceanic 137Cs concentration distribution influenced by coastal currents, eddies, and the Kuroshio Current, leading to spatio-temporal variability. Validation with observed annual mean concentrations revealed good agreement. The higher resolution improved coastal transport reproducibility, addressing 137Cs radioactivity underestimation at the Fukushima 2 NPP, 10 km south of the 1F NPP.

How to cite: Tsumune, D., Tsubono, T., and Misumi, K.: Verification of direct release rate of oceanic 137Cs from Fukushima Daiichi Nuclear Power Plant Accident by higher resolution ocean dispersion model, EGU General Assembly 2024, Vienna, Austria, 14–19 Apr 2024, EGU24-14451, https://doi.org/10.5194/egusphere-egu24-14451, 2024.

EGU24-14837 | Posters on site | GI2.3

Spatiotemporal variations of 137Cs and 90Sr in the global ocean based on the historical data 

Yayoi Inomata and Daisuke Tsumune

The anthropogenic radionuclides such as caesium-137 (137Cs), strontium-90 (90Sr), 3H, 14C, and plutonium (Pu) were released into the global ocean as results with large scale weapon tests in the late 1950s and early 1960s. Because these anthropogenic radionuclides have been still existed in the ocean, it is necessary to investigate the behavior of these anthropogenic radionuclides due to investigate the effects of human health. In this study, the spatiotemporal variations in the 137Cs and 90Sr activity concentrations in global ocean surface seawater from 1956 to 2021 using the HAMGlobal2021: Historical Artificial radioactivity database in Marine environment, Global integrated version 2021. The global ocean was divided into 37 boxes. The 0.5-yr average value of 90Sr in the northern North Atlantic Ocean and its marginal sea, decreased exponentially in 1970–2010, just before the F1NPS accident. Estimated apparent half residence time of 137Cs and 90Sr ranged from 4.1-34.1 years and 3.6-25.2 years, respectively. Considering that longer Tap occurs larger inflow and shorter Tap occurs larger outflows/smaller inflow of radionuclide from the upstream region, 137Cs and 90Sr were inflowed into the Eastern China Sea from the subtropical western North Pacific Ocean. Inflow of 90Sr into the Sea of Japan from the Eastern China Sea were relatively smaller than those of 137Cs. Although 90Sr were decreased exponentially, these trends tended to be larger than those of 137Cs, which was investigated by our previous study (Inomata and Aoyama, 2023). This might be caused by the different behavior of 90Sr and 137Cs such as particulate form for 90Sr in the seawater.


Keywords: 90Sr, 137Cs, Database, surface seawater, global ocean

Reference: Inomata and Aoyama, Evaluating the transport of surface seawater from 1956 to 2021 using 137Cs deposited in the global ocean as a chemical tracer. Earth Syst. Sci. Data, 15, 1969–2007, 2023.

How to cite: Inomata, Y. and Tsumune, D.: Spatiotemporal variations of 137Cs and 90Sr in the global ocean based on the historical data, EGU General Assembly 2024, Vienna, Austria, 14–19 Apr 2024, EGU24-14837, https://doi.org/10.5194/egusphere-egu24-14837, 2024.

EGU24-17332 | Orals | GI2.3

Anthropogenic and natural tritium radioisotope in terrestrial water cycle of Fukushima, Japan 

Maksym Gusyev, Alexandre Cauquoin, Yasunori Igarashi, Hyoe Takata, Shigekazu Hirao, and Naofumi Akata

Environmental tritium (3H) radioisotope with a half-life of 12.32 years is naturally generated in the upper atmosphere by cosmic rays and enters the water cycle in the troposphere as the water molecule (HTO) to become a useful tracer in Japan and other countries. In 2011, anthropogenic 3H entered the terrestrial water cycle due to the Fukushima Daiichi Nuclear Power Plant (FDNPP) atmospheric release and discharged in Advanced Liquid Processing System (ALPS) treated water from the FDNPP site to the Pacific Ocean in 2023 raising concerns internationally. In Japan, 3H measurements in monthly precipitation have been conducted by the Government and Universities while many surface water sites were sampled twice per year across Fukushima Prefecture accumulating a decade-long record of 3H measurements. However, there are no 3H measurements in precipitation during the FDNPP accident requiring atmospheric numerical modeling to quantify anthropogenic 3H in Fukushima. To utilize 3H as a tracer in Fukushima, we combine simulated anthropogenic 3H released by the FDNPP in 2011 with the long-term time-series of 3H in precipitation from 1950 to present in the Tokyo area, which was scaled to Fukushima area. Using annual 3H in precipitation is 2.86 TU-3.70 TU with an average of 3.37 TU from 2016 to 2021 lead to the scaling factor from Tokyo area to Fukushima city between 1.30 and 1.61. For Fukushima surface water sites, measured 3H concentrations are at low levels of natural 3H concentrations and lead to insignificant doses due to drinking water exposure. In addition, we sampled several headwater catchments near Fukushima city in October 2023 for measuring 3H and estimated tritium-tracer mean transit time and subsurface water storage volume after the ALPS-treated water discharge. As a result, we demonstrate that environmental 3H radioisotope is a useful tracer with developed 3H time-series in precipitation and surface water measurements to evaluate terrestrial water cycle in Fukushima. 

How to cite: Gusyev, M., Cauquoin, A., Igarashi, Y., Takata, H., Hirao, S., and Akata, N.: Anthropogenic and natural tritium radioisotope in terrestrial water cycle of Fukushima, Japan, EGU General Assembly 2024, Vienna, Austria, 14–19 Apr 2024, EGU24-17332, https://doi.org/10.5194/egusphere-egu24-17332, 2024.

EGU24-17762 | Posters on site | GI2.3

Assessment of nutrient export in agroforestry catchments dominated by tea farms in subtropical small mountainous rivers, Taiwan 

Pei-Hao Chen, Hasan Raja Naqvi, Guan-Zhou Lin, Tsung-Yu Lee, Li-Chin Lee, and Jr-Chuan Huang

Human-induced land-use change has profound effects on both societies and ecosystem services. For example, transitioning from forests to conventional farms using fertilizers can escalate soil nitrogen, degrade groundwater, and impair downstream ecosystems. This study explores the intricate dynamics of human-induced land-use change, focusing on the shift from forests to tea farm-dominated catchments in Taiwan, where conventional farming practices with fertilizers impact soil quality, groundwater, and downstream ecosystems. Utilizing the Soil and Water Assessment Tool (SWAT) for nutrient export analysis, our research reveals that when agricultural land use exceeds 2%, exports of nitrate, phosphate, and potassium spike significantly, ranging from 25% to 150%. Notably, agricultural land use induces a higher impact on nitrate, with concentrations surpassing those by 120% and 233% during the dry season and wet season, respectively. Tea farms, constituting a substantial portion, exhibit a nearly tenfold increase in NO3-N yield compared to forests. Implementing a modified fertilization strategy, involving application during small rainfall events, enhances nitrogen uptake and tea tree harvest yield while reducing nitrogen input by 10%. This research offers actionable recommendations for sustainable agroforestry practices by integrating river and rainwater data with SWAT modeling. By doing so, it advances our understanding of hydrological and biogeochemical processes in subtropical tea farm-dominated catchments, providing valuable insights into hydrology and biogeochemistry.

How to cite: Chen, P.-H., Naqvi, H. R., Lin, G.-Z., Lee, T.-Y., Lee, L.-C., and Huang, J.-C.: Assessment of nutrient export in agroforestry catchments dominated by tea farms in subtropical small mountainous rivers, Taiwan, EGU General Assembly 2024, Vienna, Austria, 14–19 Apr 2024, EGU24-17762, https://doi.org/10.5194/egusphere-egu24-17762, 2024.

EGU24-20396 | Orals | GI2.3

Evidence of radioactive contamination of the Abai Region, Kazakhstan, from the Chinese nuclear testing program at Lop Nor 

Richard Harbron, Aleksandra Lipikhina, Kazbek Apsalikov, and Evgenia Ostroumova

Between 1949 and 1990, tests of nuclear weapons and other explosive devices were performed by the Soviet Union at the Semipalatinsk Nuclear Test Site (SNTS) in Kazakhstan, resulting in radioactive contamination of surrounding settlements. This contamination and the associated impact on the health of the local population are a subject of ongoing radioecological, radiobiological, dosimetric, and epidemiological research. Less in known about potential additional radioactive contamination of settlements SE of SNTS, close to the border with China. This region may have been contaminated by fallout from weapons tests performed by China at Lop Nor between 1964 and 1981, during which time all tests at SNTS were underground. Here, we review available evidence of this contamination, including the results of sampling campaigns performed both at the time of the Chinese tests and in recent years, and electron paramagnetic resonance (EPR) of tooth enamel.

Soil, vegetation, and milk sampling performed in the weeks following the Lop Nor tests revealed the presence of short-lived fission products, including I-131, I-133, Sr-89, Zr-95 and Ba-140 well in excess of background levels. Contamination was greatest following the thermonuclear tests on 17/06/1967 and 27/06/1973. Contemporary soil sampling in Kazakhstan and NW China suggests radioactivity levels have returned to background levels, though with ratios of Pu-240 / Pu-239, and Pu-240+239 / Cs-137 that differ from global fallout levels. Efforts to reconstruct exposure levels are ongoing, including collection of fortuitous dosimeters (e.g. bricks from settlement buildings) and teeth of exposed residents.

How to cite: Harbron, R., Lipikhina, A., Apsalikov, K., and Ostroumova, E.: Evidence of radioactive contamination of the Abai Region, Kazakhstan, from the Chinese nuclear testing program at Lop Nor, EGU General Assembly 2024, Vienna, Austria, 14–19 Apr 2024, EGU24-20396, https://doi.org/10.5194/egusphere-egu24-20396, 2024.

CC BY 4.0